Indoor Positioning System: A New Approach Based on LSTM and Two Stage Activity Classification


College of Information and Communication Engineering, Sungkyunkwan University, Suwon 16419, Korea
*
Author to whom correspondence should be addressed.
Electronics 2019, 8(4), 375; https://doi.org/10.3390/electronics8040375
Submission received: 20 February 2019
/
Revised: 18 March 2019
/
Accepted: 21 March 2019
/
Published: 28 March 2019
(This article belongs to the Special Issue Electronic Solutions for Artificial Intelligence Healthcare)
Abstract
:The number of studies on the development of indoor positioning systems has increased recently due to the growing demands of the various location-based services. Inertial sensors available in commercial smartphones play an important role in indoor localization and navigation owing to their highly accurate localization performance. In this study, the inertial sensors of a smartphone, which generate distinct patterns for physical activities and action units (AUs), are employed to localize a target in an indoor environment. These AUs, (such as a left turn, right turn, normal step, short step, or long step), help to accurately estimate the indoor location of a target. By taking advantage of sophisticated deep learning algorithms, we propose a novel approach for indoor navigation based on long short-term memory (LSTM). The LSTM accurately recognizes physical activities and related AUs by automatically extracting the efficient features from the distinct patterns of the input data. Experiment results show that LSTM provides a significant improvement in the indoor positioning performance through the recognition task. The proposed system achieves a better localization performance than the trivial fingerprinting method, with an average error of 0.782 m in an indoor area of 128.6 m2. Additionally, the proposed system exhibited robust performance by excluding the abnormal activity from the pedestrian activities.
1. Introduction
A global positioning system (GPS) is commonly used for navigation, but fails to reach certain locations such as tunnels or the inside of buildings. Hence, different alternative methods have been invented. Such methods employ various sources of information including the received signal strengths (RSS) of the WiFi or Bluetooth signals and inertial sensor measurements. However, approaches based on the RSS have limitations, such as unreliability, high complexity, low precision and expensive hardware. Moreover, wireless signal fades rapidly in indoor environment due to fading caused by reflection, diffraction and absorption. Furthermore, the trajectory paths obtained using RSS values have high navigation error [1].
The inertial sensors are a preferred option to determine the exact position in an indoor area. Indoor localization is a challenging task that has been researched for decades and has shown progress owing to the availability of low-cost inertial sensors applied in smartphones. As an emerging technology, the smartphone has been explored in the context of indoor positioning. The number of smartphone users in 2018 was approximately 2.08 billion, which is expected to increase to 2.66 billion in 2019 [2]. This trend motivated us to employ the motion sensors used in a smartphone.
The contemporary indoor positioning systems use the fingerprinting technique. Fingerprinting is an indoor positioning technique, which saves RSS of WiFi or bluetooth of each pre-determined location in database, and then estimates the particular location through pattern matching between RSS of the particular location and RSS of the locations in database [1]. Compared to the fingerprinting-based methods, the inertial sensor-based positioning system does not require expensive infrastructure and avoids regular time-consuming updates to the data. Indoor location-based services include significantly large applications such as network management and security [3], personal navigation [4], healthcare monitoring [5], and context awareness [6].
Different research groups have developed indoor positioning systems based on different techniques such as ultra-wideband [7,8], Bluetooth [9], sound [10], visible light [11], geomagnetic field [12], and inertial [13] systems. Among these, inertial-sensor-based systems are gaining wide popularity due to the widespread deployment of micro-electro-mechanical system (MEMS) sensors in smartphones. Pedestrian dead reckoning (PDR) has therefore become a feasible option for indoor localization. When using the the PDR approach, signals generated by a accelerometer and a gyroscope are employed to estimate the trajectory of a pedestrian. These sensors assist in detecting the steps, estimating the step length and measuring the heading direction of the target. The PDR approach estimates the change in the target position with respect to its past location, and the updated position of the target can hence be determined at regular intervals. Although existing methods based on a PDR technique have the advantages of a high availability and immunity to dynamic changes in the environment, they also suffer from drift errors that degrade their accuracy over time. It has been reported [14] that walking 1 km accumulates an error of 10 m. Therefore, it is expected that navigational errors may accumulate as the walking distance increases [15].
PDR is the most widely used technique in indoor positioning systems, although it still faces certain challenges regarding drift error. To solve a drift error, most researchers have added complex WiFi fingerprinting information with PDR, which instead of improving the localization accuracy increases the complexity of the positioning system [16,17]. Furthermore, WiFi signals fluctuate significantly in complex indoor areas, and can easily be blocked by the human body. Moreover, prior studies have applied trivial threshold-based approaches for steps detection [18,19,20,21]. There are diverse interfering or abnormal activities, calling or texting, that can be counted falsely as steps because an arm movement is involved in them. Hence, there is a need for a robust step detection approach for reliably detecting the steps and carefully excluding the interfering activities.
In contrast, long short-term memory (LSTM), a deep neural network architecture, has recently emerged as the most widely applied methodology in the analysis of sequential data. LSTM networks are well suited for classification, processing, and predictions based on time-series data. The deep learning approach has shown a significant degree of success in various areas such as face identification [22], number and character recognition [23], and object classification [24]. We therefore designed a novel and robust indoor positioning system based on the deep learning technique that can accurately estimate the trajectory of a target under a dynamic indoor scenario.
In this study, we used an LSTM network, which is a type of artificial neural network, to develop a novel indoor positioning approach. The proposed system based on LSTM processes the sequential data containing the trajectories information of the pedestrians. We employ the inertial sensors of a smartphone, which record the movement or trajectory information of the subjects in an indoor setting. Our LSTM-based approach automatically extracts the most efficient features from the data and conducts a two-stage classification. During the first stage, the recorded signal is classified into different motion states including walking, running, and stopping (i.e., standing/sitting). Walking and running activities are henceforth collectively termed as “pedestrian activities” in this study. During the second stage, these motion states are classified further into action units (AUs) such as turning left, turning right, stepping normally, taking short steps or taking long steps. Finally, the proposed system accurately predicts the trajectory of the target in an indoor environment by selecting a suitable length according to the recognized step type. The main contributions of this study are described as below:
- We analyze three physical activities and seven action units (AUs), as they are essential components of the pedestrian trajectory.
- We present a robust solution based on an LSTM network that recognizes the activities and their AUs by automatically extracting the efficient features from the signal patterns (input data). The network classifies the physical activities and the AUs with a high accuracy of 97.9% and 95.5%, respectively. Moreover, the classification at AUs level enables our approach to identify the steps of different types (short, normal, long) and thus eliminates the possibility of over-/under-counting the steps by excluding the interfering or abnormal activities.
- After the recognition task by LSTM, we use the moving distance estimator to determine the length of three-step types that are recognized by LSTM. To the best of the authors’ knowledge, it is the first time that the length of short and long steps in addition to the length estimation of a normal step are estimated. The distance estimator, unlike previous drift-prone PDR and noisy fingerprint approaches, computes the length of each recognized step type by assigning it a mode, most frequent value of step lengths from the prior saved length distributions. The prior step length distributions are saved in the memory bank of moving distance estimator, which are the collection of step length values of step types (short, normal, long).
The remainder of this paper is organized as follows. Important related studies in the literature are discussed in Section 2. In Section 3, we provide the preliminary details of different recurrent neural network (RNN) architectures and present a robust indoor positioning system based on LSTM neural network. The proposed indoor navigation approach is then described in Section 4. The experimental results are evaluated and discussed in Section 5. Finally, some concluding remarks along with potential areas of future study are given in Section 6.
2. Related Work
There have been a number of studies carried out in the field of indoor navigation and localization. Fingerprinting and PDR are two widely employed methods by the researchers. Among the different fingerprinting approaches, WiFi-based indoor positioning is more reliable and commonly used [27]. This approach includes two stages: offline data collection and online pattern matching. During the offline stage, the received signal strengths (RSS) of several WiFi access points (APs) are gathered at different pre-decided calibration points to prepare a fingerprint database, called a radio map. During the online stage, new RSS data is collected in real-time and matched with RSS data already stored in a radio map to estimate the location of the subject. Owing to fluctuations in the RSS values, the performance of the system might degrade. Interestingly, some researchers have opted to increase the complexity of the system by fusing the PDR with the fingerprinting approach. The fusion approach, although, improves the overall localization performance of the system, but, it also increases the complexity of the system due to employing complex fusion algorithms such as kalman filter, particle filter, etc.
A prior study [18] used a particle filter to fuse the inertial signals and WiFi positioning. New particles for determining the location of the target are generated according to the model after the current step is detected, and the step length and target heading are estimated. A gaussian kernel function is employed to update the weight of the particles. Finally, the target position is determined based on the average of all weighted particles. Wang, H. et al. [28] also applied a similar approach by combining signals of the inertial sensors with WiFi RSS signals. The weight-update scheme of the particles differs from that in [18], which is computed using the inverse Euclidean distance between a real-time RSS signal and the mean RSS signal of a particle. They used the particle filter for integrating WiFi positioning, the inertial sensors measurements, and landmarks information by employing a large number of particles [28]. However, this increases the power consumed and the computational cost because the location-estimation for each walking step requires a certain number of operations on each particle, whose quantity can be several hundreds depending on the number of walking steps. Therefore, a particle fusion approach is complex and unsuitable for fusing the signals of the inertial sensors with the WiFi signals.
A recent study [19] employed a Kalman filter to combine PDR, WiFi positioning, and landmarks. This approach considers the PDR as a linear function of a known pedestrian direction and the step length. Based on the nonlinear nature of PDR versus the required factors, namely, the pedestrian direction and step length, the inaccurate error covariance of the state vector is estimated, thus degrading the accuracy of the Kalman filter. The direction of the pedestrian is estimated based on the average of the weighted coordinates of the APs using WiFi positioning. The weights are inversely related to the smartphone and APs, which are computed by exploiting the propagation model of the RSS signals. The radio map is not required by the WiFi positioning because the complexity and uncertainty of the indoor wireless propagation environment [27] is high. Consequently, the indoor signal propagation model is inaccurate, and positioning results with large errors will likely degrade the performance of the Kalman filter. In addition, the variance of the measurement noise is set theoretically, which cannot demonstrate the uncertainty of the WiFi positioning results. Similarly, Xin Li et al. [29] proposed an extended Kalman filter (EKF) to embed the WiFi fingerprinting positioning with the PDR. Similar to the approach in [19], the variance in the measurement noise is also set theoretically to a constant value, which ultimately lowers the positioning accuracy of the EKF.
Traditional PDR approaches are accurate over a short distance but suffer from a drift error that increases with time. Similarly, WiFi-based approaches are not robust owing to the variations present in the WiFi signal. Therefore, the authors explored different hybrid solutions to minimize the inertial drift effects and variations in the WiFi signals. Unsurprisingly, hybrid systems perform better than single-stand-alone approaches but at the expenses of high computational complexities when applying a fusion algorithm such as a particle filter [18,30], Kalman filter [19,31], hidden Markov model [20,32], extended Kalman filter [21,29,33,34], and sequential Monte Carlo Kalman filter [35].
Recently, a time-of-flight (ToF) sensing methodology has been introduced in domains of logistics, robotics, healthcare, and autonomous vehicles [36]. Although ToF camera was firstly designed almost four decades ago at a Stanford research institute [37], it was not widely adopted by the research community owing to limitations in its detector technology. A ToF sensing methodology measures the distance of the target by using the delay in reflected light from a target in the scene. The researchers tried to explore the modality of 3D range imaging in the field of indoor positioning using single ToF camera [38] or combination with ultrasonic module [39]. Although, an optical-acoustic positioning system [39] performed well at three discrete positions but could not beat the localization performances of inertial sensor-based systems during continuous navigation [18,19,20,21,28,29,30,33,34,35]. Furthermore, the camera-based indoor system is not cost effective in the scenario of multiple rooms because it requires multiple 3D cameras to be installed on the wall of each room. As reported in the well-known survey study about ToF cameras [40], systems based on ToF camera are always subjected to encounter certain types of errors, such as systematic and non-systematic errors. Therefore, such systems always need complex error correction or calibration algorithms to fix these errors [41].
The high complexities, complex calibrations, and low localization accuracy of the existing aforementioned indoor positioning systems inspired us to design a robust indoor positioning system. Therefore, we propose an indoor localization system based on LSTM that recognizes the activities in a hierarchy, exclude the interfering activities and reliably navigates the indoor pedestrian trajectories based on the recognized activities and their AUs.
3. Proposed Indoor Positioning System
In this section, we describe the preliminary work regarding an evaluation of different RNN architectures in addition to the LSTM network. Then, we present the architecture of the proposed indoor positioning system, and explain basic operation of its components. Lastly, we process the acquired signals of the inertial sensors collected during the experiment for the indoor trajectories.
3.1. Preliminary
Deep learning has emerged as a powerful tool, and in recent years has reshaped the future of artificial intelligence. An enhanced computational power, large data storage, and parallelization have improved the predictive power and ability of the technology to automatically extract optimized high-level features from the input data. RNN, a deep learning method, offers end-to-end learning in which automated features extraction and recognition are conducted together instead of the traditional approach of classification based on the handcrafted features.
RNNs have recently been the preferred architectures for sequential data. An RNN has a distinct structure, unlike a traditional neural network, in which all inputs and outputs are interconnected. The main distinctness between an RNN and a conventional feed forward network is in the output, which is recursively applied as an input to the RNN, in addition to the main input. For the first recurrent structure [42], dynamic memory was developed using repeated connections. Similar to the work in [42], a network for processing natural language was developed [43]. These models, developed by Jordan and Elman, respectively, are shown in Figure 1a. An RNN contains hidden layers capable of analyzing the streams of sequential data [44]. The data fed into the RNN carry strong inter-dependent samples, in which the present samples relate with the past information. The output of the network at time () affects the output at time (t), as illustrated in Figure 1b. Hence, an RNN exploits the present and most recent past as a two sources of input to generate a new output.
Although an RNN is a powerful and simple model, it suffers from the exploding and vanishing gradient problems, as explained by Bengio et al. [46]. Moreover, an RNN has limited capacity of contextual information and the inability to back propagate in time. The vanishing and exploding gradient problems are encountered because of the iterative nature of an RNN. LSTM was proposed to solve these problems [47]. Furthermore, the new LSTM architecture is better at capturing long-term dependencies than traditional RNNs. LSTM is equipped with a memory cell that, unlike traditional nodes in an RNN, assists in overcoming the difficulties of a conventional RNN during the learning process. LSTM networks have also achieved great success in different language modeling tasks such as speech recognition, image description, bioinformatics, sentiment analysis, and machine translation. For these reasons, in this study we employ LSTM [47], to recognize the physical activities and their related AUs with the aim at accurately localizing the trajectories of pedestrians in an indoor area.
LSTM architecture consists of four gates, namely, input (i), forget (f), output (o), and input modulating () gates; a memory cell (c); and a hidden state (h), as illustrated in Figure 2. The gates control the sources of information so that it be can be read from, written to, or stored in the memory during each time step. To minimize the recognition errors, the network learns when to write/read and what to store in the memory during training. The input gate regulates the writing operation, the input modulating gate determines how much to write in, the forget gate conducts an erase/remember operation, and the output gate determines what output to generate from the cell memory [45,48,49]. To summarize the working mechanism of the gates, the input gate controls the flow of input data to the memory cell, and the output stream of information from the memory cell to other LSTM blocks is regulated by the output gate. The forget gate manipulates the amount of information in the cell memory, and determines what part of the stored information to be forgotten. The input, output, and forget gates are activated through a sigmoid function, as given in Equation (1–6), which means the computed values of the gates are within the range of zero to one. Thus, the forget gate determines the extent to which the information from the previous memory block will be effective on the current LSTM block. If the forget gate values are close to zero, then the information from the previous block will be forgotten; otherwise, it will not. The LSTM, unlike other types of deep neural networks, shares the same weight across all time steps, which greatly reduces the overall number of parameters to be learned by the network. The working principle of the LSTM is based on the equations given below for the forward and back propagation processes through time. The forward pass is a process that uses a set of mathematical operations to transform the network input to output. It also defined as a flow of information from the input layer to the output layer of the network for evaluating the performance of the network. Backpropagation is a process of recursively tuning the weights, learning, using an optimization algorithm, such as gradient descent, for minimizing the loss function at the output layer.
3.1.1. Forward Pass
Let us assume that be the input sequence at time t, N is the number of LSTM blocks, and M is the number of the inputs. We then obtain the following weight matrices for the LSTM layer. Although, we employ only one LSTM block (N = 1) in our study, we denote it with the same symbol N for generalization. The following symbols are also denoted:
- , , , and ∈ are input weights.
- , , , and ∈ are recurrent weights.
- , , and ∈ are peephole weights.
- , , , and ∈ are bias weights.
The functional form of the LSTM layer during a forward pass can then be written as follows:
3.1.2. Backpropagation
The vector of is passed down from the preceding layer to the next immediate layer. The following layer requires for the inputs during training, which can be derived as follows:
Finally, the gradients of all weights are computed as below, where ∈, and represents the outer product of two vectors.
3.2. Proposed System Architecture
Smartphones have recently gained wide popularity partly because they are equipped with multiple inertial sensors. The sensors used in a smartphone can accurately sense the environmental data. Therefore, we were also interested in designing our proposed indoor positioning system based on smartphone sensors. The proposed indoor positioning system consists of inertial sensors that measure the bodily acceleration and angular velocity of the subjects during indoor movements. An overview of the proposed approach is shown in Figure 3. The proposed approach includes two LSTMs and a moving distance estimator. The first LSTM is used for activity or motion classification, and the other is dedicated for recognizing the AUs of each classified pedestrian activity. In addition, the moving distance estimator predicts the final position of the target based on the output of these two LSTMs.
An accelerometer and a gyroscope of the smartphone record the movements of the subjects in indoor areas. The accelerometer and gyroscope provide the bodily acceleration () and angular movements () of the subjects in the () axes, respectively, as shown in Figure 4. By using Equation (20), we filter the acceleration and angular velocity values using a moving average filter in order to remove fluctuations from the raw signal.
where indicates the input acceleration and gyroscope signals along the three axes (x, y, z), is the averaged output signal, N is the number of signal samples to be averaged, n is the index of the signal samples being averaged, and k is the offset index relative to n.
As shown in Figure 5, a smoothed signal pattern of the sensors is obtained using the moving average filtering. The filter model has the ability to remove unwanted or noise signal while preserving important details of the signal. To obtain smooth and reliable patterns of data, the filtering method is employed to remove noise from raw signals of the sensors by averaging out the fluctuating or noisy patterns, and thus we obtained a desirable noise-free signal of inertial sensors. Furthermore, an operation of filtering is necessary before training recognition model for activity and their related AUs. The filter denoises the data prior to training of the recognition model. The noisy data would otherwise mislead the recognition model to incorrect classification and cause it to attain a high recognition error. In simple words, noisy signal patterns can corrupt the recognition performance if they are fed into the recognition model unfiltered. Therefore, we removed the noisy patterns from desired signals by applying the average filter.
After filtering the high-frequency noises, the three axes filtered acceleration and the three axial filtered gyroscope signals, shown in Figure 5, are grouped together into dynamic segments. The dynamic segments with varying lengths form the training data (D) are given by Equation (21).
The inertial sensors data processed in the form of dynamic segments is robust to the fluctuations present in the bodily acceleration and angular velocity, and represent the signal variations generated from the movements of subjects in the best possible form. The z-axis values of the accelerometer clearly demonstrate distinct patterns during different activities and for different AUs, as illustrated in Figure 6. During the experiment, it was observed that the subjects walked along the same trajectory with the same number of steps. It was established that each subject walked along the same trajectory using almost the same step length, and thus our experimental procedure successfully followed a common intuition, namely, that subjects with the same height walk with the same step lengths. Furthermore, it is possible for pedestrians to adjust their speed of motion or their lengths of their steps depending on the path because there is a chance that obstacles may be found along the path in an indoor area (i.e., obstacles in the direction of motion). Thus, we tried to solve this complexity by categorizing the steps of the participants into three classes: short steps (SS), normal steps (NS), and long steps (LS). Therefore, we employ a dynamic window (i.e., a segment) length, contrary to a conventional static window, to efficiently represent the patterns of the different step types. Typically, a 400 ms segment was sufficient to represent the pattern of step, which also agrees with prior research [25] based on the normal human walking speed (i.e., 2 steps/s). However, the aforementioned segment size was not suitable to properly represent the pattern of the other step types, namely, short or long steps. Therefore, all experimental data are formatted into dynamic segments to effectively represent the patterns of all three-step types. These segments are fed into the two LSTMs to obtain two stage-classification.
A classification is generally a process of several steps using a conventional machine learning method, such as an SVM, random forests, or kNN because the features are first manually extracted from the input data for the training of the classifiers. The trained algorithms then perform the classification. The extracted features are handcrafted, and thus they do not represent the input data well and are not utilized efficiently or their performance is degraded. Hence, it is a difficult task to obtain the best representative handcrafted features of the input data for classification. On the contrary, deep learning methods offer a structure in which end-to-end learning, automated feature extraction and classification, is performed instead of using handcrafted features [50]. Therefore, we also exploit LSTM, a deep learning network, to automatically extract the efficient features and obtain the accurate classification results for indoor positioning. As Figure 3 shows, LSTMs are employed for end-to-end learning on dynamic segments carrying six signals, (three accelerometer and three gyroscope values), of the inertial sensors. These dynamic segments carry the trajectory information of the subjects in an indoor environment.
These dynamic segments are fed into the LSTMs sequentially, which classify them into different activity states such as running, walking, stopping (i.e., standing/sitting), and different AUs such as left or right turns and the different step types (SS, NS, and LS). The short, normal, and long steps are denoted by SS, NS, and LS, respectively. The waveforms of the different recognized activity states and their sub-classes (i.e., different AUs) are shown in Figure 6. The automated feature extraction and classification at the AU levels, which are activity sub-classes, enable our approach to achieve an accurate indoor positioning performance. After recognition of the activities and their AUs by the LSTMs, the classification result or output is processed further using a moving distance estimator. The moving distance estimator, shown in Figure 7, sums the different AUs and forms the accurate trajectory of the subjects in an indoor area. The moving distance estimator updates the previous indoor positioning of the participant by adding the recent recognized AUs to the participant’s previous position. The moving distance estimator is given by Equation (22).
where shows the current time index of the position (P) and the recognized action unit ().
The working principle of the moving distance estimator is similar to PDR, although here the proposed approach correctly updates the position based on each recognized activity and its related AU. The AUs play a key role in determining the trajectory of the subject in an indoor environment because they can influence the trajectory if incorrectly recognized. An accelerometer signal is usually employed to detect pedestrian activities such as walking and running. The pedestrian activities are represented through the distinct peak patterns, as shown in Figure 6. The series of peaks indicate the number of steps.
The signal patterns of turning type AUs are different from the signal patterns of steps owing to different body movement. For the recognized AU of the turning type, the moving distance estimator adds 90 to the pedestrian trajectory according to the recognized turn (e.g., left or right) because each turn made by the pedestrians was of 90. The task of the distance estimator is increased if the recognized AU is a step type (i.e., SS, NS, or LS), as it has to compute the length of this type. The ground truth values, namely, the length of each step type, are already stored as the true length distributions in the memory bank, as shown in Figure 7. Later, the length distributions are employed by the distance estimator, which picks the most frequent value (i.e., mode) from the particular distribution as the length value of the step according to the step type sent by the LSTM. The distributions assist in selecting an appropriate length, close to the actual step length, of each recognized step type. To find the updated current position of the target, the estimated length of a step is then added with the previous position of the pedestrian trajectory. The distance estimator maintains the record of the previous position or location information of the trajectory in the location buffer, as illustrated in Figure 7.
3.3. Experiment
To analyze the proposed indoor positioning system, a total of 19 subjects (14 male and 5 female) participated in the experiment. All participants were healthy and had no history of disabilities. All subjects were provided a consent form to sign prior to the experiment. The participants were briefed about the experimentation protocol, in which they were given information regarding the trajectory paths, number of trials, and number of walking modes, and were requested to hold the smartphone at chest level. A Samsung galaxy was employed to record the indoor movement of the participants at a sampling frequency of 50 Hz. Each subject followed the one trajectory of his/her choice. The experimental layout engineered to evaluate the performance of the proposed indoor localization system is illustrated in Figure 8. There were two trajectories (T1 and T2) used in our experiment. The T1 trajectory path, denoted in the experimental layout with a red (dashed) line, was 28 steps long, whereas the T2 trajectory, indicated by a blue (dotted) line, was 24 steps in length. T1 and T2 are also known as trajectory-right and trajectory-left, respectively, as the T1 trajectory, which started from a corridor, contained its first turn in right direction, whereas the first turn of the T2 trajectory was to the left. All subjects participated in the experiment three times, which enabled our approach to be trained on the data from the first two trials and tested on the data from the third trial. The experimental data collected in the smartphone was transferred to the back-end server in real time using a smartphone application for further processing and developing recognition model based on LSTM for activity and their action units. We preferred the inertial sensors present in a smartphone because the smartphone is a commonly available device to almost every person. Hence, the smartphone equipped with highly accurate inertial sensors assisted in recording the indoor trajectories of the participants in the real environment, whose layout is shown in Figure 8.
The ground truth was measured in order to validate our proposed approach of indoor navigation. Ground truth is true or actual information measured by direct observation (i.e., empirical evidence). In other words, ground truth refers to actual measurements. The term ground truth used in our study means to collect data by direct observation (e.g., data recorded without inertial sensors) for validating the data obtained through inertial sensors. For ground truth of steps, participants’ lower limbs movement was recorded using a video camera. The measuring tape was used to compute the step length of each subject. Ground truth for a number of steps was recorded with the aim to confirm either the proposed system accurately detected step or missed the step.
4. Step Mode Identification
The proposed system was able to monitor the three types of pedestrians’ steps because the subjects moved with different step types depending on the activity state and dynamic nature of the indoor route. The activity type affected the step length. For example, the step length of the pedestrian when running was observed to be longer than that while walking. The path or route of a trajectory can change dynamically because there may be a situation in which the subject shortens or elongates his/her step length depending on the traffic, or other pedestrian coming from the opposite direction, along the same route. Thus, three types of steps were monitored in this study. The inertial sensors generated a signal with distinct patterns for the different step types. Unlike in prior approaches [16,17,26], we employed the LSTM and complete distinct signal pattern generated by the sensors during the different steps.
4.1. Step Detection
The steps used have a direct influence on the performance of an indoor localization system. A movement caused by the lifting and then grounding of one foot is defined as a step. Researchers have previously tried to develop different step detection techniques, but unfortunately, they have yet to be successful in designing a robust step detection methodology. Most researchers have associated the peaks of the high vertical acceleration values as steps. However, the sensors generate multiple peaks for a single step, and amplitude varies even for steps of the same size. A prior method [25] also used the fact that the sensor signals carry multiple peaks for a single step. In addition, the peaks caused by an abnormal activity such as calling or texting can also easily mislead conventional step detection algorithms if they are based on peaks. The two major peaks caused by an abnormal activity are shown in Figure 9. Hence, prior traditional algorithms used in step detection have attained higher error rates owing to the high number of undetected peaks or a false recognition of peaks indicating abnormal activities as steps. Prior step detection algorithms leave many steps undetected owing to the lower peak amplitude than the threshold or over-count the steps owing to multiple peaks for a single step. Therefore, we attempted to minimize the high error rate of the step detection by employing the complete pattern exhibited by the inertial sensors during the occurrence of a step.
A prior study [26] termed these oscillations, shown in Figure 4a, as bimodal. We demonstrated experimentally that these oscillations are not bimodal even after filtering, as shown in Figure 5a; however, there is a distinct pattern repeated for each step. In [26], an adaptive threshold-based technique was employed to identify the number of steps. People carried the smartphone in different ways, and it is therefore practically impossible for the accelerometer to generate a signal with the same peak amplitude for every step when a pedestrian carries the smartphone in a different way. For example, some people carry their smartphone in their hand, whereas others prefer to keep it in their pocket. If all pedestrians carry their smartphone in their hand, the amplitudes generated for peaks will differ because every subject has a different arm swing. Thus, the threshold-based scheme for detecting a step is not feasible. Furthermore, it is a difficult task to develop a generalized model of step detection using conventional threshold-based approaches, which may not perform well over the trajectory patterns of different individuals. We employed the sophisticated LSTM deep learning technique to detect the steps. The employed technique is effective at recognizing the steps because the pattern generated during a step remains almost the same in different contexts. Furthermore, although a static window has generally been applied to cover the trajectory patterns [26], we employed a segment with dynamic lengths to best represent steps of varying lengths. Moreover, LSTM was also trained over a signal of abnormal activity, and therefore avoids a false recognition of an abnormal activity or unintended movement of the smartphone as a step.
4.2. Step Length Estimation
A step length estimation is used to predict the complete trajectory of the subjects inside a building because it is essential to compute the step length before predicting the next position along the trajectory. Different factors such as the walking style, speed, and height of the person are related with the step length, and thus there are various solutions used to estimate the step length. One approach is to assume the average length of the step according to the gender of the participants [25,51]. Another approach for estimating the step length is to calculate it individually depending on the height of the participant. In this case, the height of the person needs to be determined before the indoor localization can be applied.
Researchers in [52] have employed Weiberg model to estimate the step length. The Weiberg model estimates the step length based on the difference between the maximum and minimum vertical acceleration of the human hip during each step. The aforementioned model may not work well, however, because it is based on an assumption of the vertical movement of the hip. Because the model is inference-based, we think it is an inappropriate choice for computing the step length in a real environment. The step length does not remain uniform for different activities, and depends on the walking style and speed. The authors of [53] calculated the step length using the walking frequency, acceleration and speed. They computed the walking speed by integrating the acceleration. However, computing the speed from the acceleration is error-prone, and compared to the average step length methods, this method is not reliable [53]. Moreover, it is not user friendly as participants have to enter the height manually. The first approach sets the step length to the average value [25,51], which also accumulates a large error if the trajectory is long. In contrast, we set the step length of the participants using the mode length value of step type recognized by LSTM (e.g., SS, NS, or LS), as given in Equation (23).
where is the assumed step length, and is the function mapping each subject () with the mode of step length () of the particular step length type () according to type of activity () performed in the current time index ().
The proposed approach given in Equation (23) predicts the step length depending on the subject, step type and type of activity because each subject moves differently with a different step length based on the difference in height. The same subject may even adjust the step length (e.g., widen or shorten the step length) depending on the situation, such as during an emergency or based on the available space along the trajectory path. Therefore, we monitored the three types of step lengths of each participant.
The ground truth values of the three step length types (i.e., SS, NS and LS) are saved as three prior distributions in the memory bank of the distance estimator, as shown in Figure 7. The recorded signal patterns for three step types (i.e., AUs) along with the signal patterns of other AUs like left turn or right turn, abnormal activity and stop is fed into the LSTM. The LSTM assisted in recognizing these seven AUs as SS, NS, LS, left turn, right turn, abnormal activity, and stop. The output of the LSTM, recognized AU, was fed into the distance estimator that estimates the length of each step by choosing the mode (i.e., most frequent) value from the prior step length distributions. The prior step length distributions stored in the memory bank of moving distance estimator were the collection of step length values. Thus, the distance estimator successfully determined the length according to the step type (short, normal, and long) recognized by the LSTM. The length of the step types was selected based on common intuition that a subject maintains the same step length mostly during the same style of walking. We chose the mode value of step lengths (i.e., Mo(k)) from the distributions saved in the memory bank as illustrated in Figure 7. In our approach based on the mode of the step lengths (), the size of an error increased more slowly than the average step length-based methods [25,51].
4.3. Heading Determination
The heading determined from an inertial sensor measurement was error-prone. Because a magnetometer was vulnerable and easily influenced by the external magnetic field interference present in an open environment [54]. The authors compensated for a magnetic decrease prior to calculating the heading angle. The absolute heading angle measured from a magnetometer was unreliable because building structures and metallic iron in indoor areas might frequently disturb the magnetic field. On the contrary, the gyroscope correctly measures the angular velocity of the user, which is independent of surrounding interference [17]. For these reasons, we used gyroscope signal to determine the direction of the pedestrian. The architecture of our trajectory path in an indoor areas allows two types of turns, namely, left and right turns. Thus, we employed the signal patterns of such turns for the heading determination. These turns are also included as AUs in the present study.
As shown in Figure 10, the gyroscope generated distinct signal patterns that characterized the turns well. Although, our approach did not measure the absolute angle, it successfully recognized those turns that were applied to accurately navigate along the trajectories of the subjects in the indoor environment. The sensors generated different signal patterns for the left or right turns. The gyroscope signals for left and right turns are shown in Figure 10a,b, respectively. The gyroscope formed a downward peak for a right turn and an upward peak for a left turn. Hence, these signal patterns again made it easy for LSTM to associate them as either a right turn or left turn. The LSTM was trained on the patterns of these turn types, and correctly recognizes them according to the turns made by pedestrian while walking along the trajectory path inside the building. The correctly recognized turns improved the localization performance of the proposed positioning approach.
4.4. Robustness of the Proposed Indoor Positioning System
A smartphone is a multi purpose device, and thus it was highly possible that the subjects would start an abnormal activity or unintended movement (texting or calling) during the experiment. To enable the system to be robust against these noises/disturbances, we included abnormal activities, shown in Figure 9, during experiment to better depict the real behavior of the subjects, and thus train the system for recognizing these false actions. Our proposed system therefore avoided recognizing false actions (i.e., unintended actions) as steps after it was trained on abnormal activities as well. Furthermore, the proposed indoor positioning system applied a robust approach employing a complete signal pattern for step detection rather than a high peak (e.g., a thresholding approach). Traditional thresholding approaches for step detection are unreliable and inaccurate because sensor measurements result in multiple peaks, and the amplitude can vary for each step.
To summarize the working of the proposed indoor positioning system, inertial sensors present in smartphone generated distinct patterns for three activities (i.e., walking, running, stop) and seven AUs (i.e., three-step types, two-turn types, abnormal activity, stop). Firstly, signal patterns of a complete trajectory were fed into LSTM that determined type of activity and the number of related AUs for a particular trajectory. Thus, we found the number of steps and turns along with their types in a particular trajectory. Then, the length of each step was estimated by moving distance estimator that assigns recognized step with a mode value of step lengths from prior step length distributions. The mode value was the most frequent step length value selected from the prior step length distributions. The prior step length distributions were saved in the memory bank of moving distance estimator as shown in Figure 7. The distributions were the collection of step length values of step types (short, normal, long). After estimating the length of each step type involved in trajectory, the final position of pedestrian’s indoor trajectory is obtained by adding the current step length with the previous position . The difference between actual step length and estimated step length was computed as an error. The cumulative error was calculated by summing over error occurred for each steps constituting the indoor trajectory. Lastly, an average error was computed for both trajectories, which is found as 0.782 m.
5. Results and Discussion
Our approach based on end-to-end learning, namely deep learning, successfully overcame the those problems of previous PDR approaches. End-to-end learning models automatically extract the efficient features from the data and then perform the classification task based on the extracted efficient features, which result in improvement in the performance of the learning model. The proposed indoor positioning system consisted of two LSTMs and a moving distance estimator as illustrated in Figure 3. The inertial sensors recorded the pedestrian indoor movements during the experiment. The smartphone app assisted in the collection of the experimental data. Furthermore, the app transferred the collected data to the back-end server in real-time for further processing and developing the recognition model for the physical activities and their AUs. The sensors generated distinct patterns for three physical activities and seven AUs. To remove the noise, we pre-processed the experimental data, the patterns of the activities and the AUs, by filtering it. Then, we dynamically segmented the processed or filtered data into the segments of varying lengths with the aim to represent all AUs, especially 3 steps (SS, NS, and LS), effectively. The data in the form of the segments was divided into two portions in order to train and evaluate the performance of LSTM: training (75%) and test (25%). The number of training and test instances for the activities were 1566 and 522, respectively. Whereas, the training and test instances of the AUs were 2781 and 927, respectively. The first LSTM recognized the activity type, and the second LSTM identified the AUs associated with this recognized type of activity. The moving distance estimator updated the previous location of the pedestrian based on the outputs of the aforementioned LSTMs. Knowledge of the activity was necessary before detecting and estimating the step and its length. Because, the sensors generated the signal pattern according to the activity type performed by the subject. If the participant was running, the sensors generated a high amplitude signal, whereas the sensors generate a comparatively low amplitude for walking.
Prior to the training of the recognition model, the optimal hyperparameters of the LSTM were selected after evaluating the performance of the model with different combinations of parameters. The hyperparameters, namely, computational components, of the model, which we initialize, can have a significant impact on the solution achieved by the learning algorithm [45]. Therefore, the optimal set of hyperparameters illustrated in Table 1 were chosen. A stochastic gradient descent with momentum was selected as an optimization algorithm because it is consistently faster than all other gradient descent methods. Because the added momentum to it improves the convergence rate. The optimization algorithm helped the model minimize the loss function by iteratively optimizing the parameters. The initial learning rate was set to 0.01, and started decreasing after every 30 iterations, which was the period of decrease in the learning rate, using piece-wise learning rate scheduling. A minimum batch size of 90 was set for each training iteration, and a maximum number of 40 epochs was applied for the training. Batch normalization is conducted prior to the training of the model to avoid an internal covariate shift problem. An internal covariate shift is defined as a change in the network parameters transforming the distribution of the network.
The LSTMs were trained over the experimental data after initialization of the aforementioned hyperparameters. The recognition models recognized the three different activities and seven AUs with accuracies of 97.9% and 95.5%, respectively. The LSTM efficiently recognized the activities and AUs because the signal patterns of the steps, taken during different activities, were distinct. For example, the signal pattern of the steps while running was different from the signal pattern while walking activity. Similarly, the signal patterns of the different AUs were distinct because the different pedestrian body movements caused the inertial sensors to generate distinct signals. The LSTM, which is a powerful network, employed the distinct signal patterns in distinguishing the seven different AUs. Therefore, the activities and AUs were accurately classified by the LSTMs, as illustrated in Figure 11 and Figure 12. The LSTM attained an accuracy of 97.9% for three activity types, namely, walking, running and stopping (standing/sitting). For seven AUs (left turn, right turn, SS, NS, LS, abnormal activity, stop), LSTM achieved an accuracy of 95.5%. The LSTM, a recognition model, was trained offline in the server owing to being sophisticated, but it was tested in real time using the smartphone app. The training and detection time of our proposed recognition model is 131,000 ms and 26 ms, respectively. We used a batch learning technique that does not require any strategy to update the data because batch learning technique, contrary to progressive learning, allows recognition model to be trained on pre-collected data.
The signal patterns of the three step types for each pedestrian were recorded during the experiment. As mentioned earlier, the three step types are a short step (SS), normal step (NS), and long step (LS). The signal patterns of all AUs were different from each other because of the different body movements. For example, a subject’s movement during a turning AU (left or right) was different from the body movement based on the type of step length (short, normal, and long) AUs. Similarly, the body movements when stopping or conducting an abnormal activity differ from each other, but also differ from the body movements during the aforementioned AUs. Hence, the different body movements during the different AUs caused the sensors to generate the distinct signal patterns. The distinctness present in their signal patterns alleviates the task of LSTM to differentiate the AUs from each other. For these reasons, LSTM has correctly recognized the the seven AUs with an accuracy of 95.5%, as shown in Figure 12.
However, three different signal patterns or levels of steps included in the experiment can be a problem of clustering or unsupervised learning. But, we have not solved the step recognition problem using the clustering technique because clustering algorithms encounter severe problems, such as inertia, high dimensional spaces, memory complexity, complex searches, and computationally expensive [55]. Owing to the aforementioned limitations present in the clustering algorithms, we solved the steps recognition problem using a supervised learning technique based on LSTM. Contrary to conventional machine learning methods, end-to-end learning technique present in deep learning architecture, LSTM, performs automated efficient feature extraction and classification together.
If the AU recognized by LSTM is of any step type (i.e., SS, NS, or LS), the output result of both LSTMs is fed into the moving distance estimator, which determines the length of the step in the first stage, and the final estimated position in the indoor area is then updated. Although the task of the recognition is conducted outside the moving distance estimator, the main task of navigating the final position of a pedestrian is determined using this estimator. The task of the distance estimator is to choose the most frequent value, or mode, of the step length from a pool of prior saved distributions of steps length values according to the recognized step type, namely, an SS, NS, or LS. The values of the step length types for all participants were saved as a prior distribution during the experiment. The modes or most frequent values, of the step length types (SS, NS, and LS) of the participants were observed to be 54.2, 70, and 107.75 cm, respectively. We examined the three step length types because the subjects may adopt their step lengths according to the situation in an indoor area. The cumulative average localization error of our designed indoor positioning system is low, as illustrated in Figure 13. The positioning error of our proposed system accumulates slowly than the prior state-of-the-art methods [25,51], because the prior methods assumed average of step lengths that caused their approaches to quickly gain a large error. Our proposed indoor positioning methodology attained an average cumulative error of 78.2 cm (0.782 m) for both trajectories and estimated the indoor trajectories that follows actual paths closely, as shown in Figure 13 and Figure 14. The proposed indoor positioning system outperforms all previous state-of-the-art indoor positioning systems detailed in Table 2. Our proposed system correctly navigated the indoor trajectories of the participants with an average error of 0.782 m, which is lower than the error exhibited by the previous methods.
The design of the proposed system is quite suitable because smartphones are commonly used. We thus employed a smartphone to measure the subject’s trajectories inside a building. However, previous studies have attached an IMU to the foot of the pedestrians [62,63], which may disturb the walking pattern of the subjects. We were worried that the subjects would be reluctant to wear an inertial measurement unit (IMU) on their foot or other body part out of fear that the sensing technology would continuously monitor them. However, the subjects were observed to be more comfortable when carrying IMU sensors embedded in their smartphone or smartwatch because carrying such devices was not new to them and has become a part of their daily routine. We adopted a different approach to navigate the trajectories in the indoor areas by developing a novel indoor positioning strategy for indoor positioning based on deep learning. Our proposal does not require manual or handcrafted feature extraction but efficiently extract the automated features. The extracted automated features assisted LSTMs to recognize the activities and related AUs with higher accuracies of 97.9% and 95.5%, respectively.
We detected each step of a pedestrian using a complete signal pattern, generated by inertial sensors, instead of using just peak threshold. We used the LSTM method that enabled our proposed approach to obtain step count in addition to the identification of each step type, which constituted an indoor trajectory of the pedestrian. This way, we determined step count and identified the type of each step involved in the trajectory. In addition to step count, knowledge of step type is necessary prior to determine the length of that step because the length of the step depends on the type of step occurred. Step types occurred during different activities differ from each other, for example, the step of running activity differs from the step of walking activity. Moreover, there is also a possibility that subjects adopt different step types (short, normal, long) in the same trajectory. For example, the subject has taken mixed steps (e.g., short, normal, long) during a particular indoor trajectory owing to traffic, (e.g., another subject), coming from the opposite direction. The traffic coming from the opposite direction causes the subject either take short steps or long steps. Therefore, it becomes essential to recognize the step type prior to estimating the step length. Prior studies [25,59] counted a number of steps and calculated their length under an assumption of pedestrian maintained same step type for the whole trajectory, but, there is always a possibility subject can alter their type of step depending on activity and traffic on the route. Hence, the length of the step will change depending on the step type. Keeping this problem in view, we not only detected step but also recognized a type of step so that we could accurately estimate the length of each step. An accurate length estimation of each step according to its type leads our approach to closely localize the subjects to their actual indoor position. Thus, we successfully obtained low indoor positioning error of 0.782 m, and that is why our indoor positioning system has attained higher positioning accuracy than prior studies [25,59], which were based on step counts and did not recognize step type prior to estimating step length. To summarize our indoor positioning approach, we detected a step, recognized its type, estimated its length, and lastly updated the position of the subject by adding the estimated step length value to his/her previous position.
The proposed method achieved the navigation of two indoor trajectories with an error of 0.782 m, which is quite better than the performances of the previous methods that although based on the computational algorithms like particle filter and Kalman filter. Furthermore, our system despite based on the single signal sources, the inertial sensors, has achieved the robust and accurate performance for indoor localization.
6. Conclusions and Future Work
Indoor positioning systems have gained wide popularity owing to the surge in location-based services and the availability of highly accurate inertial sensors in smartphones. In this work, we proposed deep learning-based indoor positioning system that recognized various physical activities and the AUs essential to localize a target. The proposed system employs inertial sensors of a smartphone to monitor the activities and related AUs. Compared to the existing approaches, the proposed model does not require additional hardware or regular updates to the data. Moreover, the inertial sensors of the smartphone used in this study are more stable than WiFi and Bluetooth signals. We employed LSTM to recognize the physical activities (walking, running, stop) and related AUs (short step, normal step, long step, left turn, right turn, stop, abnormal activity). The proposed LSTM-based methodology attained the remarkable recognition performances of 97.9% and 95.5% for the activities and related AUs, respectively. On the contrary to the previous researchers, the LSTMs automatically extract the efficient features from the experimental data, and henceforth attained high recognition performance.
After the recognition of the task by the LSTMs, the moving distance estimator was utilized to robustly compute the length of three-step types (short, normal, and long). Length of each step is estimated by moving distance estimator that assigns recognized step with a mode value of step lengths from prior step length distributions. After the estimation of step lengths, the final position of a pedestrian’s indoor trajectory is obtained by adding the current step length with the previous position. The proposed approach achieved a high indoor positioning accuracy with an error of 0.782 m in an indoor area of 128.6 m2. The complexity of the proposed approach is lower than other well-known approaches. Moreover, our proposed methodology exhibited significant improvements in accurately localizing the indoor pedestrian trajectories.
As a future study, we plan to include more phone carrying contexts and will extend the present experimental single floor layout to multiple floors by enhancing the number of physical activities such as walking up or downstairs. We will also explore the impact of free angle movement on localization error in our future work.
Author Contributions
G.H. and S.B. conceived the idea and conducted the main researches and analysis on the topic. M.S.J. and S.B. set outlines of paper and J.-D.C. edited the final manuscript. All authors have proofread and approved the manuscript.
Funding
This research was supported by Humanity Converging Research Program of National Research Foundation of Korea (2018M3C1B6061353). This research was also supported by Basic Research Program through the National Research Foundation of Korea (NRF) funded by the Ministry of Education (2017R1D1A1B03031323).
Acknowledgments
We thank all the participants who took part actively in experimentation.
Conflicts of Interest
The authors declare no conflict of interest.
References
- Mazuelas, S.; Bahillo, A.; Lorenzo, R.M.; Fernandez, P.; Lago, F.A.; Garcia, E.; Blas, J.; Abril, E.J. Robust indoor positioning provided by real-time RSSI values in unmodified WLAN networks. IEEE J. Sel. Top. Signal Process. 2009, 3, 821–831. [Google Scholar] [CrossRef]
- Statasia. Number of Smartphone Users Worldwide from 2012 to 2019. Available online: http://de.statista.com/statistik/daten/studie/309656/umfrage/prognose-zur-anzahl-der-smartphone-nutzer-weltweit/ (accessed on 10 January 2019).
- Wi-Fi Based Real-Time Location Tracking: Solutions and Technology; CISCO Systems, Tech. Rep; White Paper: San Jose, CA, USA, 2006.
- Bandyopadhyay, A.; Hakim, D.; Funk, B.E.; Kohn, E.A.; Teolis, C.A.; Blankenship, G. System and Method for Locating, Tracking, and/or Monitoring the Status of Personnel and/or Assets Both Indoors and Outdoors. U.S. Patent 9448072, 20 September 2016. [Google Scholar]
- Rodriguez, M.; Favela, J.; Martinez, E.; Munoz, M. Location-aware access to hospital information and services. IEEE Trans. Inf. Technol. Biomed. 2004, 8, 448–455. [Google Scholar] [CrossRef] [PubMed]
- Muntz, R.; Pancake, C. Challenges in location-aware computing. IEEE Pervasive Comput. 2003, 2, 80–89. [Google Scholar] [Green Version]
- Alsindi, N.A.; Alavi, B.; Pahlavan, K. Measurement and modeling of ultra-wideband TOA-based ranging in indoor multipath environments. IEEE Trans. Veh. Technol. 2009, 58, 1046–1058. [Google Scholar] [CrossRef]
- Alsindi, N.; Pahlavan, K. Cooperative localization bounds for indoor Ultra-wideband wireless sensor networks. EURASIP J. Adv. Signal Process. 2008, 2008, 1–13. [Google Scholar] [CrossRef]
- Zhao, X.; Xiao, Z.; Markham, A.; Trigoni, N.; Ren, Y. Does BTLE measure up against WiFi? A comparison of indoor location performance. In Proceedings of the 20th European Wireless Conference, Barcelona, Spain, 14–16 May 2014; pp. 1–6. [Google Scholar]
- Want, R.; Hopper, A.; Falcao, V.; Gibbons, J. The active badge location system. ACM Trans. Inf. Syst. 1992, 10, 91–102. [Google Scholar] [CrossRef] [Green Version]
- Yang, Z.; Wang, Z.; Zhang, J.; Huang, C.; Zhang, Q. Wearables can afford: Light-weight indoor positioning with visible light. In Proceedings of the 13th Annual International Conference on Mobile Systems, Applications, and Services, Florence, Italy, 18–22 May 2015; pp. 317–330. [Google Scholar]
- Chung, J.; Donahoe, M.; Schmandt, C.; Kim, I.-J.; Razavai, P.; Wiseman, M. Indoor location sensing using Geo-magnetism. In Proceedings of the 9th International Conference on Mobile Systems, Applications, and Services, Bethesda, MD, USA, 28 June–1 July 2011; pp. 141–154. [Google Scholar]
- Marcus, E.; Köppe, E. An advanced method for pedestrian dead reckoning using BLSTM-RNNs. In Proceedings of the 2015 International Conference on Indoor Positioning and Indoor Navigation (IPIN), Banff, AB, Canada, 13–16 October 2015; pp. 1–6. [Google Scholar]
- Stephane, B.; Haas, H. Pedestrian dead reckoning: A basis for personal positioning. In Proceedings of the 3rd Workshop on Positioning, Navigation and Communication, Hannover, Germany, 16 March 2006; pp. 27–35. [Google Scholar]
- Renaudin, V.; Combettes, C. Magnetic, Acceleration Fields and Gyroscope Quaternion (MAGYQ)-Based Attitude Estimation with Smartphone Sensors for Indoor Pedestrian Navigation. Sensors 2014, 14, 22864–22890. [Google Scholar] [CrossRef] [Green Version]
- Deng, Z.-A.; Wang, G.; Qin, D.; Na, Z.; Cui, Y.; Chen, J. Continuous indoor positioning fusing WiFi, smartphone sensors and landmarks. Sensors 2016, 16, 1427. [Google Scholar] [CrossRef]
- Wang, X.; Jiang, M.; Guo, Z.; Hu, N.; Sun, Z.; Liu, J. An indoor positioning method for smartphones using landmarks and PDR. Sensors 2016, 16, 2135. [Google Scholar] [CrossRef]
- Evennou, F.; Marx, F. Advanced Integration of WiFi and Inertial Navigation Systems for Indoor Mobile Positioning. EURASIP J. Appl. Signal Proc. 2006, 2006, 86706. [Google Scholar] [CrossRef]
- Chen, Z.; Zou, H.; Jiang, H.; Zhu, Q.; Soh, Y.C.; Xie, L. Fusion of WiFi, Smartphone Sensors and Landmarks Using the Kalman Filter for Indoor Localization. Sensors 2015, 15, 715–732. [Google Scholar] [CrossRef] [PubMed] [Green Version]
- Liu, J.; Chen, R.; Pei, L.; Guinness, R.; Kuusniemi, H. A hybrid smartphone indoor positioning solution for mobile LBS. Sensors 2012, 12, 17208–17233. [Google Scholar] [CrossRef] [PubMed]
- Correa, A.; Morell, A.; Barcelo, M.; Vicario, J.L. Navigation system for elderly care applications based on wireless sensor networks. In Proceedings of the 20th European Signal Processing Conference (EUSIPCO), Bucharest, Romania, 27–31 August 2012; pp. 210–214. [Google Scholar]
- Coşkun, M.; Ucar, A.; Yıldırım, O.; Demir, Y. Face recognition based on convolutional neural network. In Proceedings of the 2017 International Conference on Modern Electrical and Energy Systems (MEES), Kremenchuk, Ukraine, 15–17 November 2017. [Google Scholar]
- LeCun, Y.; Bottou, L.; Bengio, Y.; Haffner, P. Gradient-based learning applied to document recognition. Proc. IEEE 1998, 86, 2278–2324. [Google Scholar] [CrossRef] [Green Version]
- Ren, S.; He, K.; Girshick, R.; Zhang, X.; Sun, J. Object detection networks on convolutional feature maps. IEEE Trans. Pattern Anal. Mach. Intell. 2017, 39, 1476–1481. [Google Scholar] [CrossRef]
- Röbesaat, J.; Zhang, P.; Abdelaal, M.; Theel, O. An improved BLE indoor localization with Kalman-Based fusion: An experimental study. Sensors 2017, 17, 951. [Google Scholar] [CrossRef]
- Qian, J.; Pei, L.; Ma, J.; Ying, R.; Liu, P. Vector graph assisted pedestrian dead reckoning using an unconstrained smartphone. Sensors 2015, 15, 5032–5057. [Google Scholar] [CrossRef] [PubMed]
- Zhou, M.; Qiu, F.; Tian, Z.; Wu, H.; Zhang, Q.; He, W. An Information-Based Approach to Precision Analysis of Indoor WLAN Localization Using Location Fingerprint. Entropy 2015, 17, 8031–8055. [Google Scholar] [CrossRef] [Green Version]
- Wang, H.; Lenz, H.; Szabo, A.; Bamberger, J.; Hanebeck, U.D. WLAN-Based Pedestrian Tracking Using Particle Filters and Low-Cost MEMS Sensors. In Proceedings of the 4th Workshop on Positioning, Navigation and Communication (WPNC’07), Hannover, Germany, 22 March 2007; pp. 1–7. [Google Scholar]
- Li, X.; Wang, J.; Liu, C.; Zhang, L.; Li, Z. Integrated WiFi/PDR/Smartphone Using an Adaptive System Noise Extended Kalman Filter Algorithm for Indoor Localization. ISPRS Int. J. Geo-Inf. 2016, 5, 8. [Google Scholar] [CrossRef]
- Frank, K.; Krach, B.; Catterall, N.; Robertson, P. Development and evaluation of a combined WLAN & inertial indoor pedestrian positioning system. In Proceedings of the 4th International Symposium on Location and Context Awareness, ION GNSS, Savannah, GA, USA, 22–25 September 2009. [Google Scholar]
- Welch, G.; Bishop, G. An Introduction to the Kalman Filter; University of North Carolina: Chapel Hill, NC, USA, 1995. [Google Scholar]
- Elliott, R.J.; Aggoun, L.; Moore, J.B. Hidden Markov Models; Springer: New York, NY, USA, 1994. [Google Scholar]
- Correa, A.; Barcelo, M.; Morell, A.; Lopez Vicario, J. Enhanced inertial-aided indoor tracking system for wireless sensor networks: A review. IEEE Sens. J. 2014, 14, 2921–2929. [Google Scholar] [CrossRef]
- Correa, A.; Diaz, E.M.; Ahmed, D.B.; Morell, A.; Vicario, J.L. Advanced pedestrian positioning system to smartphones and smartwatches. Sensors 2016, 16, 1903. [Google Scholar] [CrossRef]
- Li, W.W.L.; Iltis, R.A.; Win, M.Z. A smartphone localization algorithm using RSSI and inertial sensor measurement fusion. In Proceedings of the IEEE Global Communications Conference (GLOBECOM), Atlanta, GA, USA, 11 December 2013; pp. 3335–3340. [Google Scholar]
- Li, L. Time-of-Flight Camera—An Introduction; Technical White Paper SLOA190B; Texas Instruments: Dallas, Texas, USA, 2014. [Google Scholar]
- Nitzan, D.; Brain, A.E.; Duda, R.O. Measurement and use of registered reflectance and range data in scene analysis. Proc. IEEE 1977, 65, 206–220. [Google Scholar] [CrossRef]
- Plank, H.; Egger, T.; Steffan, C.; Steger, C.; Holweg, G.; Druml, N. High-performance indoor positioning and pose estimation with time-of-flight 3D imaging. In Proceedings of the International Conference on Indoor Positioning and Indoor Navigation (IPIN), Sapporo, Japan, 18–21 September 2017. [Google Scholar]
- Paredes, J.A.; Alvarez, F.N.; Aguilera, T.; Villadangos, J.M. 3D indoor positioning of UAVs with spread spectrum ultrasound and time-of-flight cameras. Sensors 2018, 18, 89. [Google Scholar] [CrossRef]
- Foix, S.; Alenya, G.; Torras, C. Lock-in time-of-flight (ToF) cameras: A survey. IEEE Sens. J. 2011, 11, 1917–1926. [Google Scholar] [CrossRef]
- He, Y.; Liang, B.; Zou, Y.; He, J.; Yang, J. Depth errors analysis and correction for Time-of-Flight (ToF) cameras. Sensors 2017, 17, 92. [Google Scholar] [CrossRef] [PubMed]
- Jordan, M.I. Serial Order: A Parallel Distributed Processing Approach; (Tech. Rep. No. 8604); University of California, Institute for Cognitive Science: San Diego, CA, USA, 1986. [Google Scholar]
- Elman, J.L. Finding structure in time. Cognit. Sci. 1990, 14, 179–211. [Google Scholar] [CrossRef]
- Williams, R.J.; Zipser, D. A learning algorithm for continually running fully recurrent neural networks. Neural Comput. 1989, 1, 270–280. [Google Scholar] [CrossRef]
- Greff, K.; Srivastava, R.K.; Koutnik, J.; Steunebrink, B.R.; Schmidhuber, J. LSTM: A search space odyssey. IEEE Trans. Neural Netw. Learn. Syst. 2017, 28, 2222–2232. [Google Scholar] [CrossRef]
- Bengio, Y.; Simard, P.; Frasconi, P. Learning long-term dependencies with gradient descent is difficult. IEEE Trans. Neural Netw. 1994, 5, 157–166. [Google Scholar] [CrossRef] [PubMed]
- Hochreiter, S.; Schmidhuber, J. Long short-term memory. Neural Comput. 1997, 9, 1735–1780. [Google Scholar] [CrossRef]
- Yildirim, O. A novel wavelet sequence based on deep bidirectional LSTM network model for ECG signal classification. Comput. Biol. Med. 2018, 96, 189–202. [Google Scholar] [CrossRef]
- Chen, G. A gentle tutorial of recurrent neural network with error backpropagation. arXiv, 2016; arXiv:1610.02583. [Google Scholar]
- Bengio, Y. Learning deep architectures for AI. Found. Trends Mach. Learn. 2009, 2, 1–127. [Google Scholar] [CrossRef]
- Haggarty, L.; Pepin, B. An Investigation of Mathematics Textbooks and their use in English, French and German Classrooms. Proc. Br. Soc. Res. Learn. Math. 2001, 21, 117–125. [Google Scholar]
- Kuang, J.; Niu, X.; Chen, X. Robust Pedestrian Dead Reckoning Based on MEMS-IMU for Smartphones. Sensors 2018, 18, 1391. [Google Scholar] [CrossRef] [PubMed]
- Kim, J.W.; Jang, H.J.; Hwang, D.H.; Park, C. A Step, Stride and Heading Determination for the Pedestrian Navigation System. J. Glob. Position. Syst. 2004, 1, 273–279. [Google Scholar] [CrossRef]
- Li, Y.; Niu, X.; Zhang, Q.; Zhang, H.; Shi, C. An in situ hand calibration method using a pseudo-observation scheme for low-end inertial measurement units. Meas. Sci. Technol. 2012, 23, 105104–105113. [Google Scholar] [CrossRef]
- Clustering. Available online: https://scikit-learn.org/stable/modules/clustering.html (accessed on 17 March 2019).
- Luo, J.; Liang, F. A Smartphone Indoor Localization Algorithm Based on WLAN Location Fingerprinting with Feature Extraction and Clustering. Sensors 2017, 17, 1339. [Google Scholar] [Green Version]
- Xie, Y.; Wang, Y.; Nallanathan, A.; Wang, L. An Improved K-Nearest-Neighbor Indoor Localization Method Based on Spearman Distance. IEEE Signal Process. Lett. 2016, 23, 351–355. [Google Scholar] [CrossRef] [Green Version]
- Sanchez-Rodriguez, D.; Alonso-Gonzalez, I.; Ley-Bosch, C.; Quintana-Suarez, M.A. A Simple Indoor Localization Methodology for Fast Building Classification Models Based on Fingerprints. Electronics 2019, 8, 103. [Google Scholar] [CrossRef]
- Chang, Q.; De Velde, S.V.; Wang, W.; Li, Q.; Hou, H.; Heidi, S. Wi-Fi fingerprint positioning updated by pedestrian dead reckoning for mobile phone indoor localization. In Proceedings of the China Satellite Navigation Conference (CSNC), Xi’an, China, 13–15 May 2015; Springer: Berlin/Heidelberg, Germany, 2015; pp. 729–739. [Google Scholar]
- Tian, Z.; Jin, Y.; Zhou, M.; Wu, Z.; Li, Z. Wi-Fi/MARG integration for indoor pedestrian localization. Sensors 2016, 16, 2100. [Google Scholar] [CrossRef]
- Chen, J.; Zhang, Y.; Xue, W. Unsupervised Indoor Localization Based on Smartphone Sensors, iBeacon and Wi-Fi. Sensors 2018, 18, 1378. [Google Scholar] [CrossRef]
- Ruiz, A.R.J.; Granja, F.S.; Honorato, J.C.P.; Rosas, J.I.G. Accurate pedestrian indoor navigation by tightly coupling foot-mounted IMU and RFID measurements. IEEE Trans. Instrum. Meas. 2012, 61, 178–189. [Google Scholar] [CrossRef]
- Jiménez, A.R.; Seco, F.; Prieto, J.C.; Guevara, J. Indoor pedestrian navigation using an INS/EKF framework for yaw drift reduction and a foot-mounted IMU. In Proceedings of the 7th Workshop on Positioning Navigation and Communication (WPNC), Dresden, Germany, 11–12 March 2010; pp. 135–143. [Google Scholar]
Figure 1.
Basic early recurrent neural network (RNN) architectures and present RNN architecture: (a) early RNN models of Jordan (Left) [42] and Elman (Right) [43] and (b) present RNN structure and its interconnected blocks [45].

Figure 2.
Long short-term memory (LSTM) block architecture [45].
Figure 2.
Long short-term memory (LSTM) block architecture [45].

Figure 3.
Architecture of the proposed indoor positioning system.

Figure 4.
Signals of accelerometer and gyroscope sensors: signal patterns of (a) bodily acceleration and (b) angular velocity while walking.
Figure 4.
Signals of accelerometer and gyroscope sensors: signal patterns of (a) bodily acceleration and (b) angular velocity while walking.

Figure 5.
Filtered signals of accelerometers and gyroscope sensors: filtered signal patterns of (a) bodily acceleration and (b) angular velocity while walking.
Figure 5.
Filtered signals of accelerometers and gyroscope sensors: filtered signal patterns of (a) bodily acceleration and (b) angular velocity while walking.

Figure 6.
Different activity states and distinct action units (AUs).

Figure 7.
Operation of moving distance estimator.

Figure 8.
Indoor layout of the experiment.

Figure 9.
Signals of accelerometers and gyroscope sensors during abnormal activity: (a) filtered bodily acceleration and (b) filtered angular velocity during abnormal activity.
Figure 9.
Signals of accelerometers and gyroscope sensors during abnormal activity: (a) filtered bodily acceleration and (b) filtered angular velocity during abnormal activity.

Figure 10.
Gyroscope signal patterns for (a) left and (b) right turns.

Figure 11.
Confusion matrix representing the performance of LSTM for activity recognition (test accuracy).
Figure 11.
Confusion matrix representing the performance of LSTM for activity recognition (test accuracy).

Figure 12.
Confusion matrix representing the LSTM performance for AU recognition (test accuracy).

Figure 13.
Average cumulative error of step length of the participants during (a) trajectory 1 and (b) trajectory 2.
Figure 13.
Average cumulative error of step length of the participants during (a) trajectory 1 and (b) trajectory 2.

Figure 14.
Estimated and actual paths of (a) trajectory 1 and (b) trajectory 2.


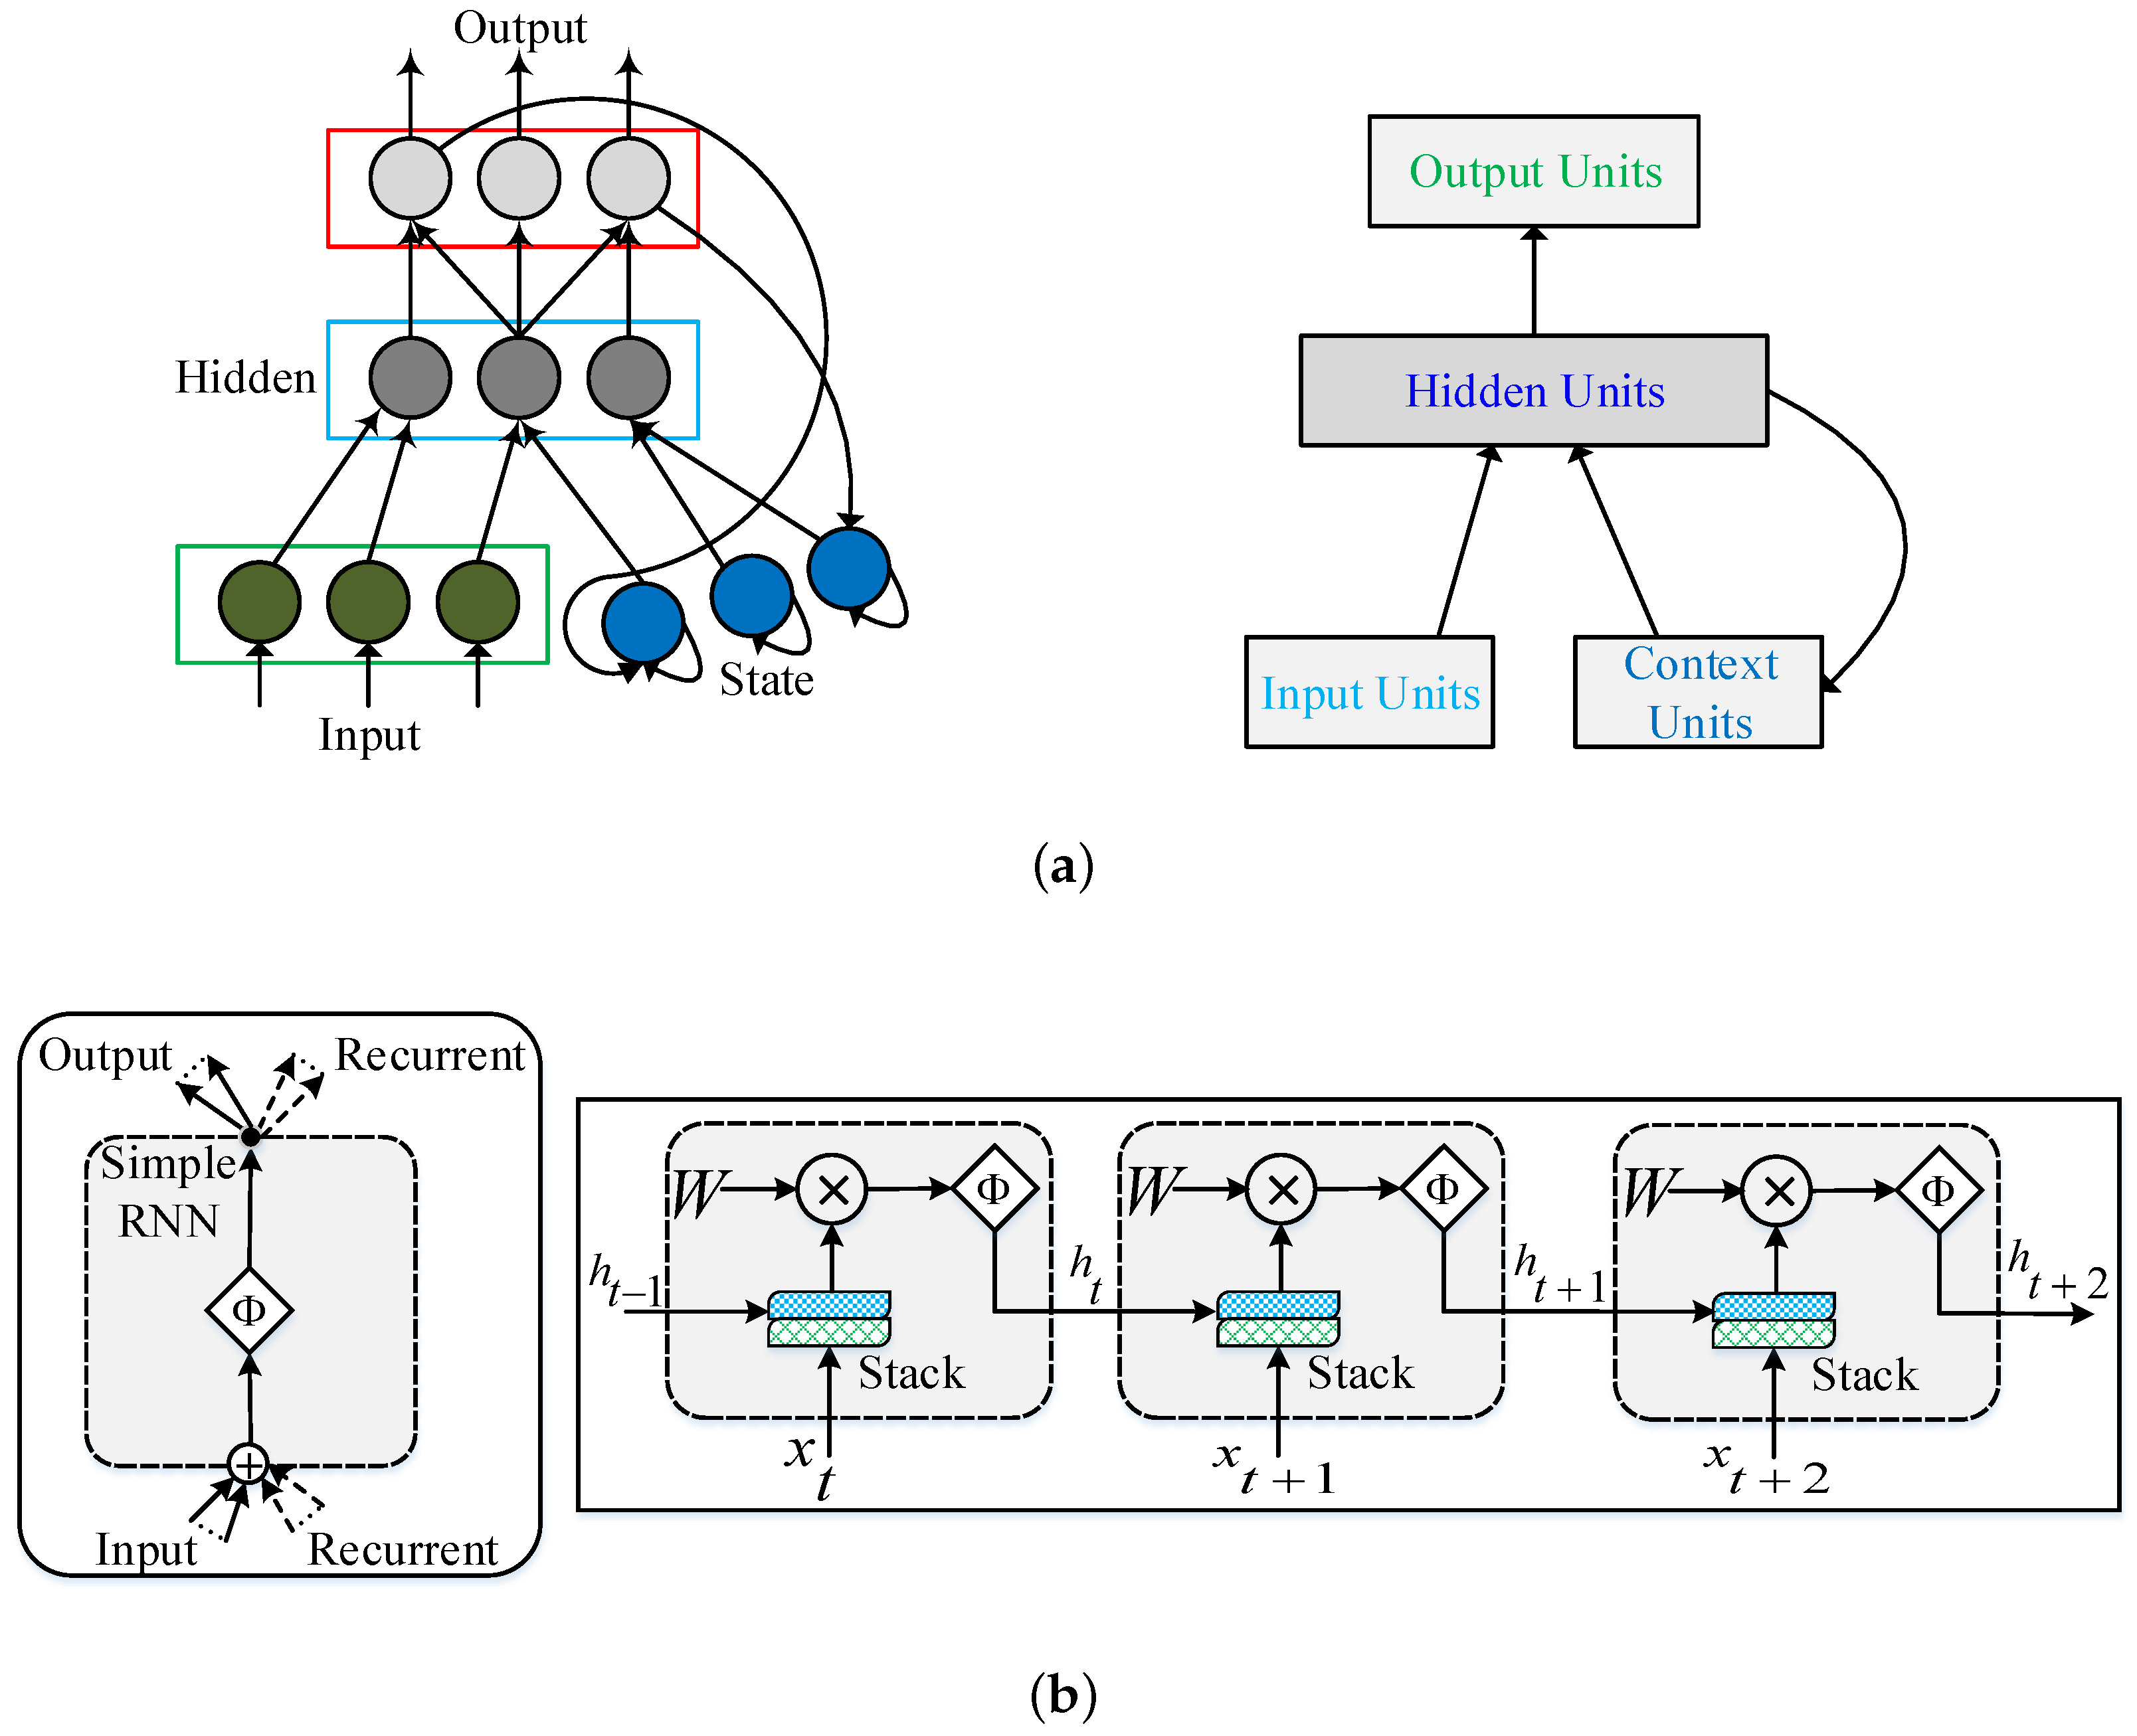
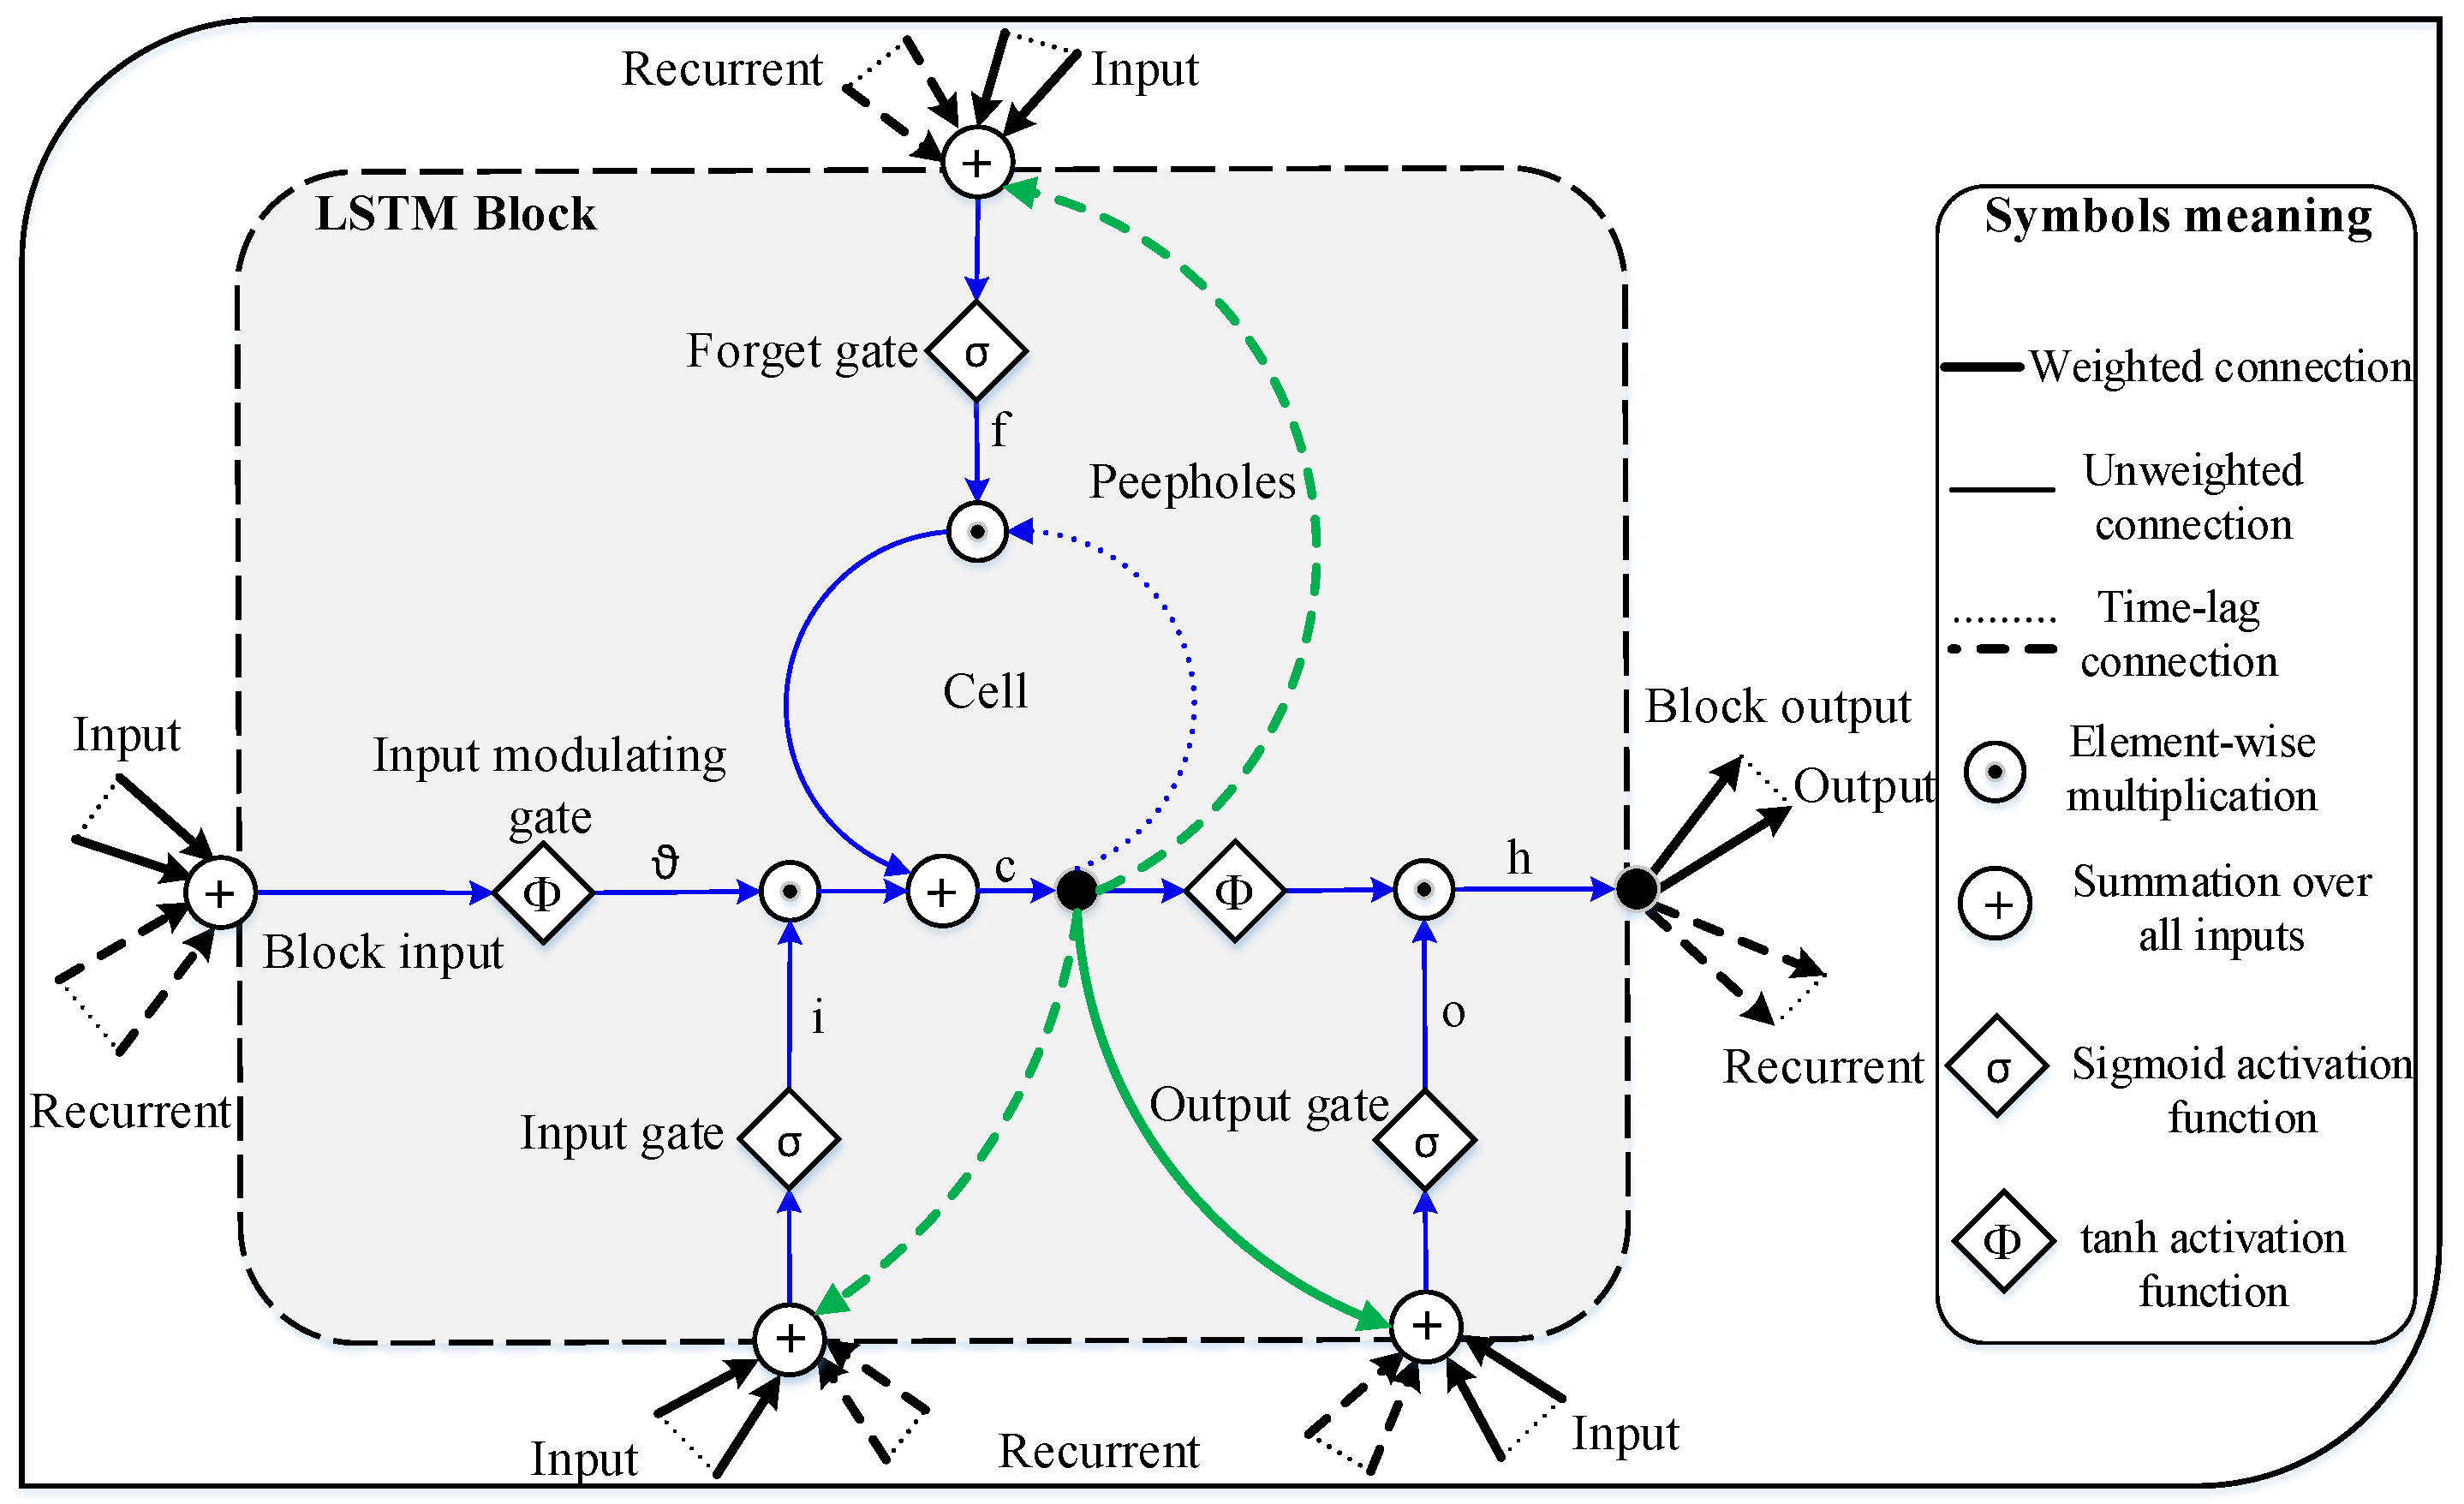
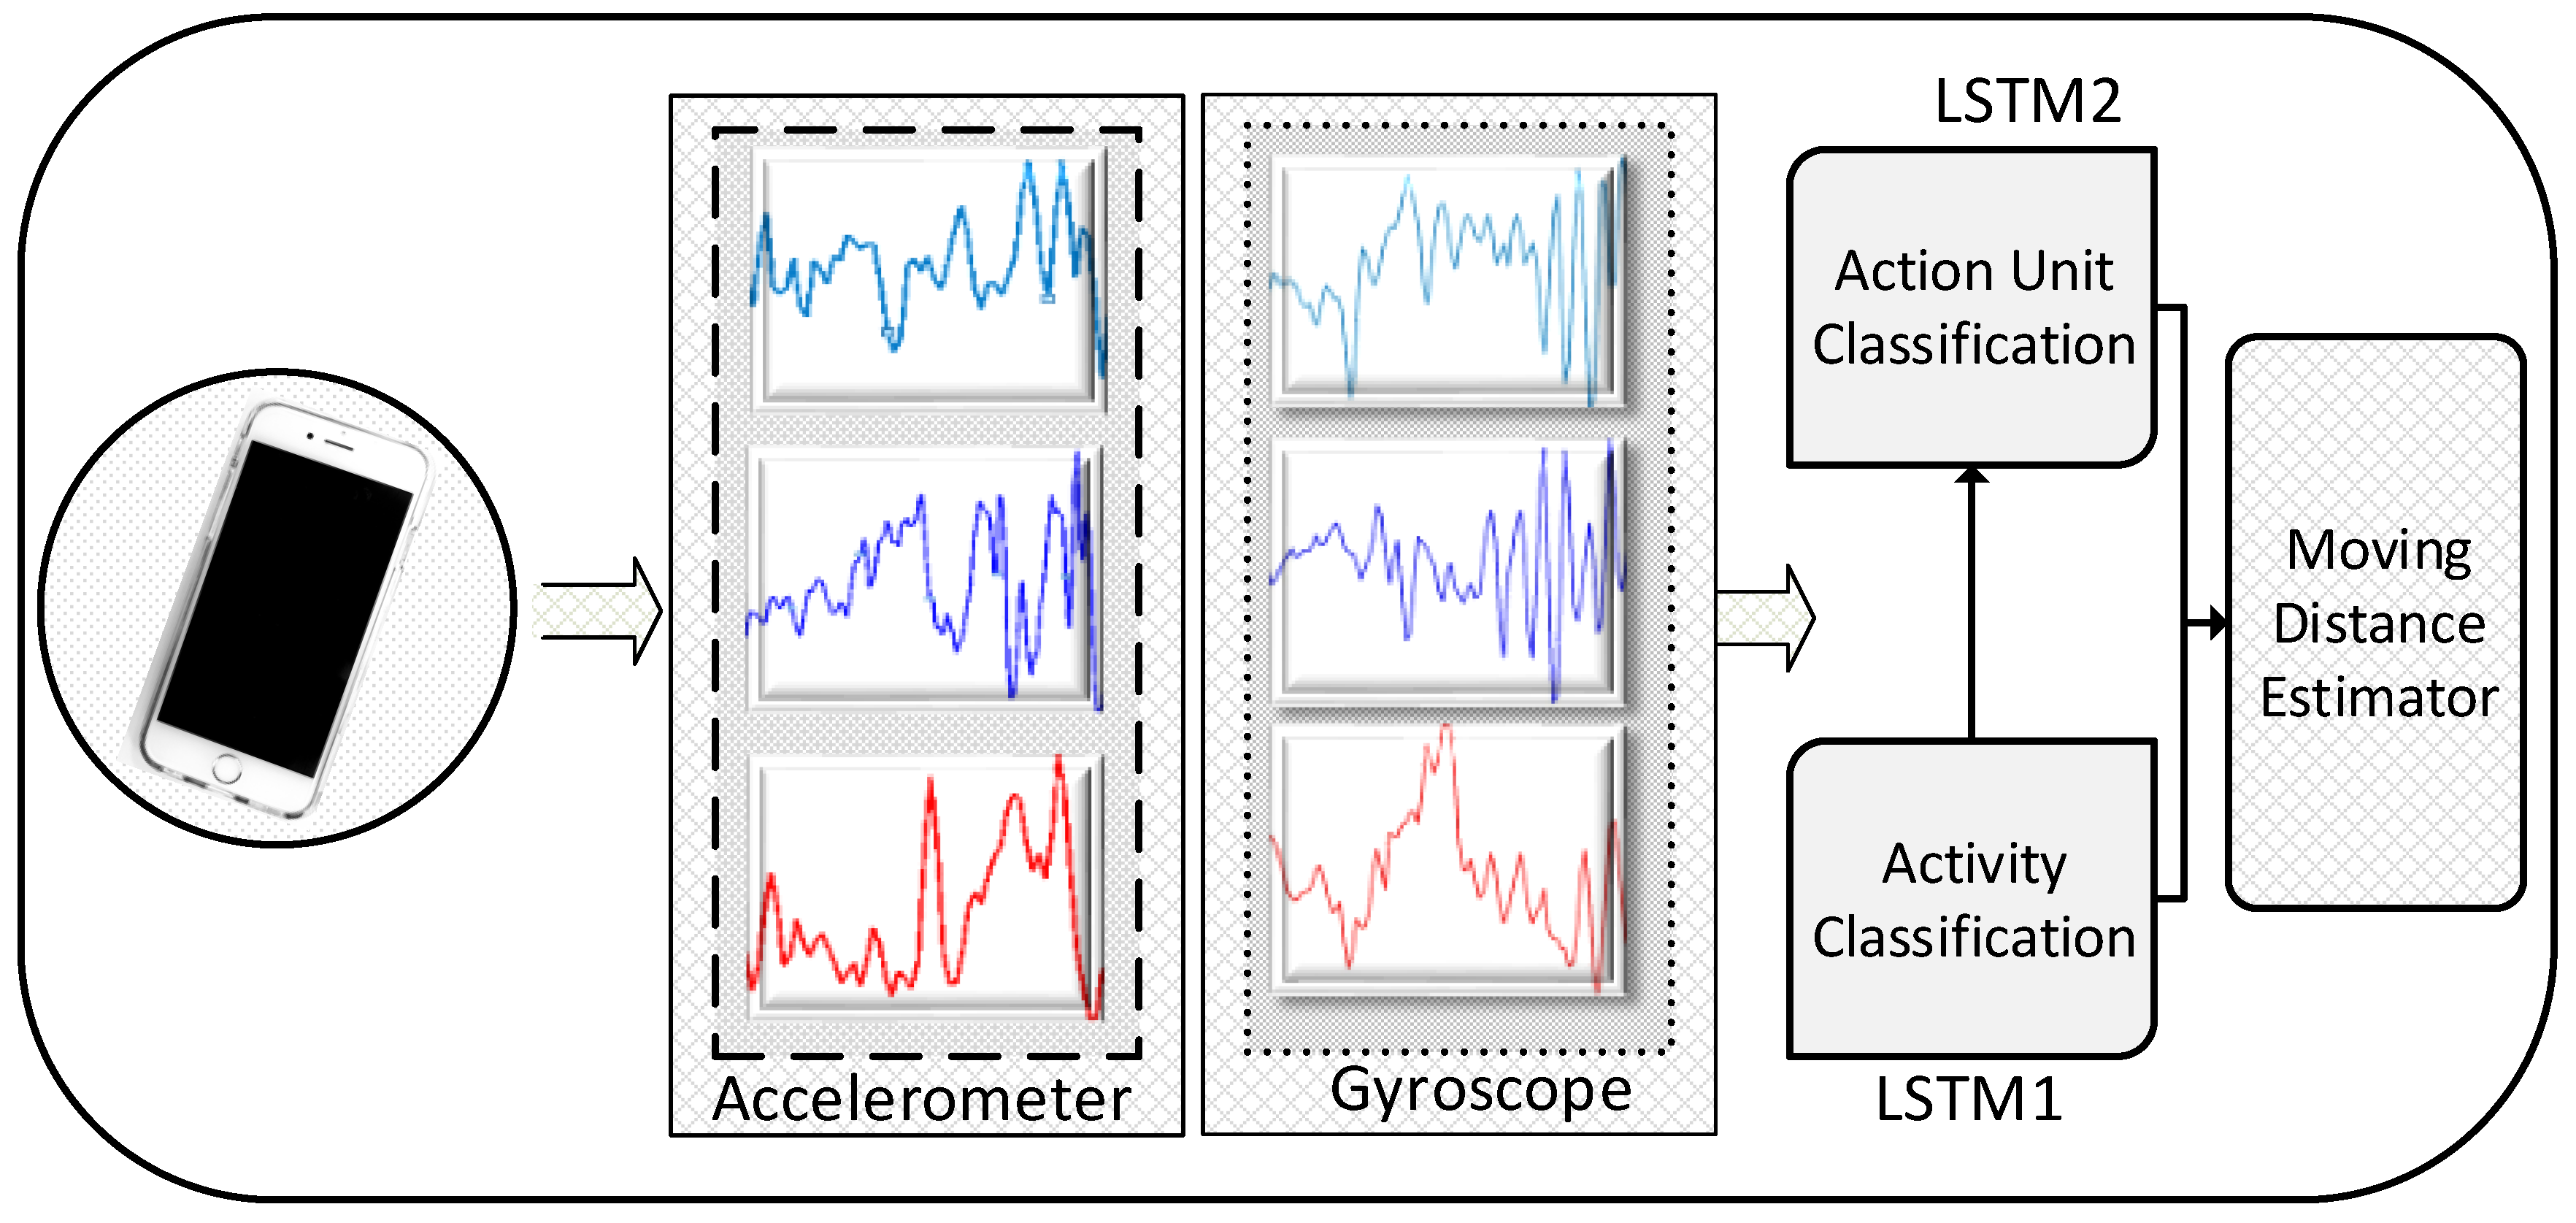
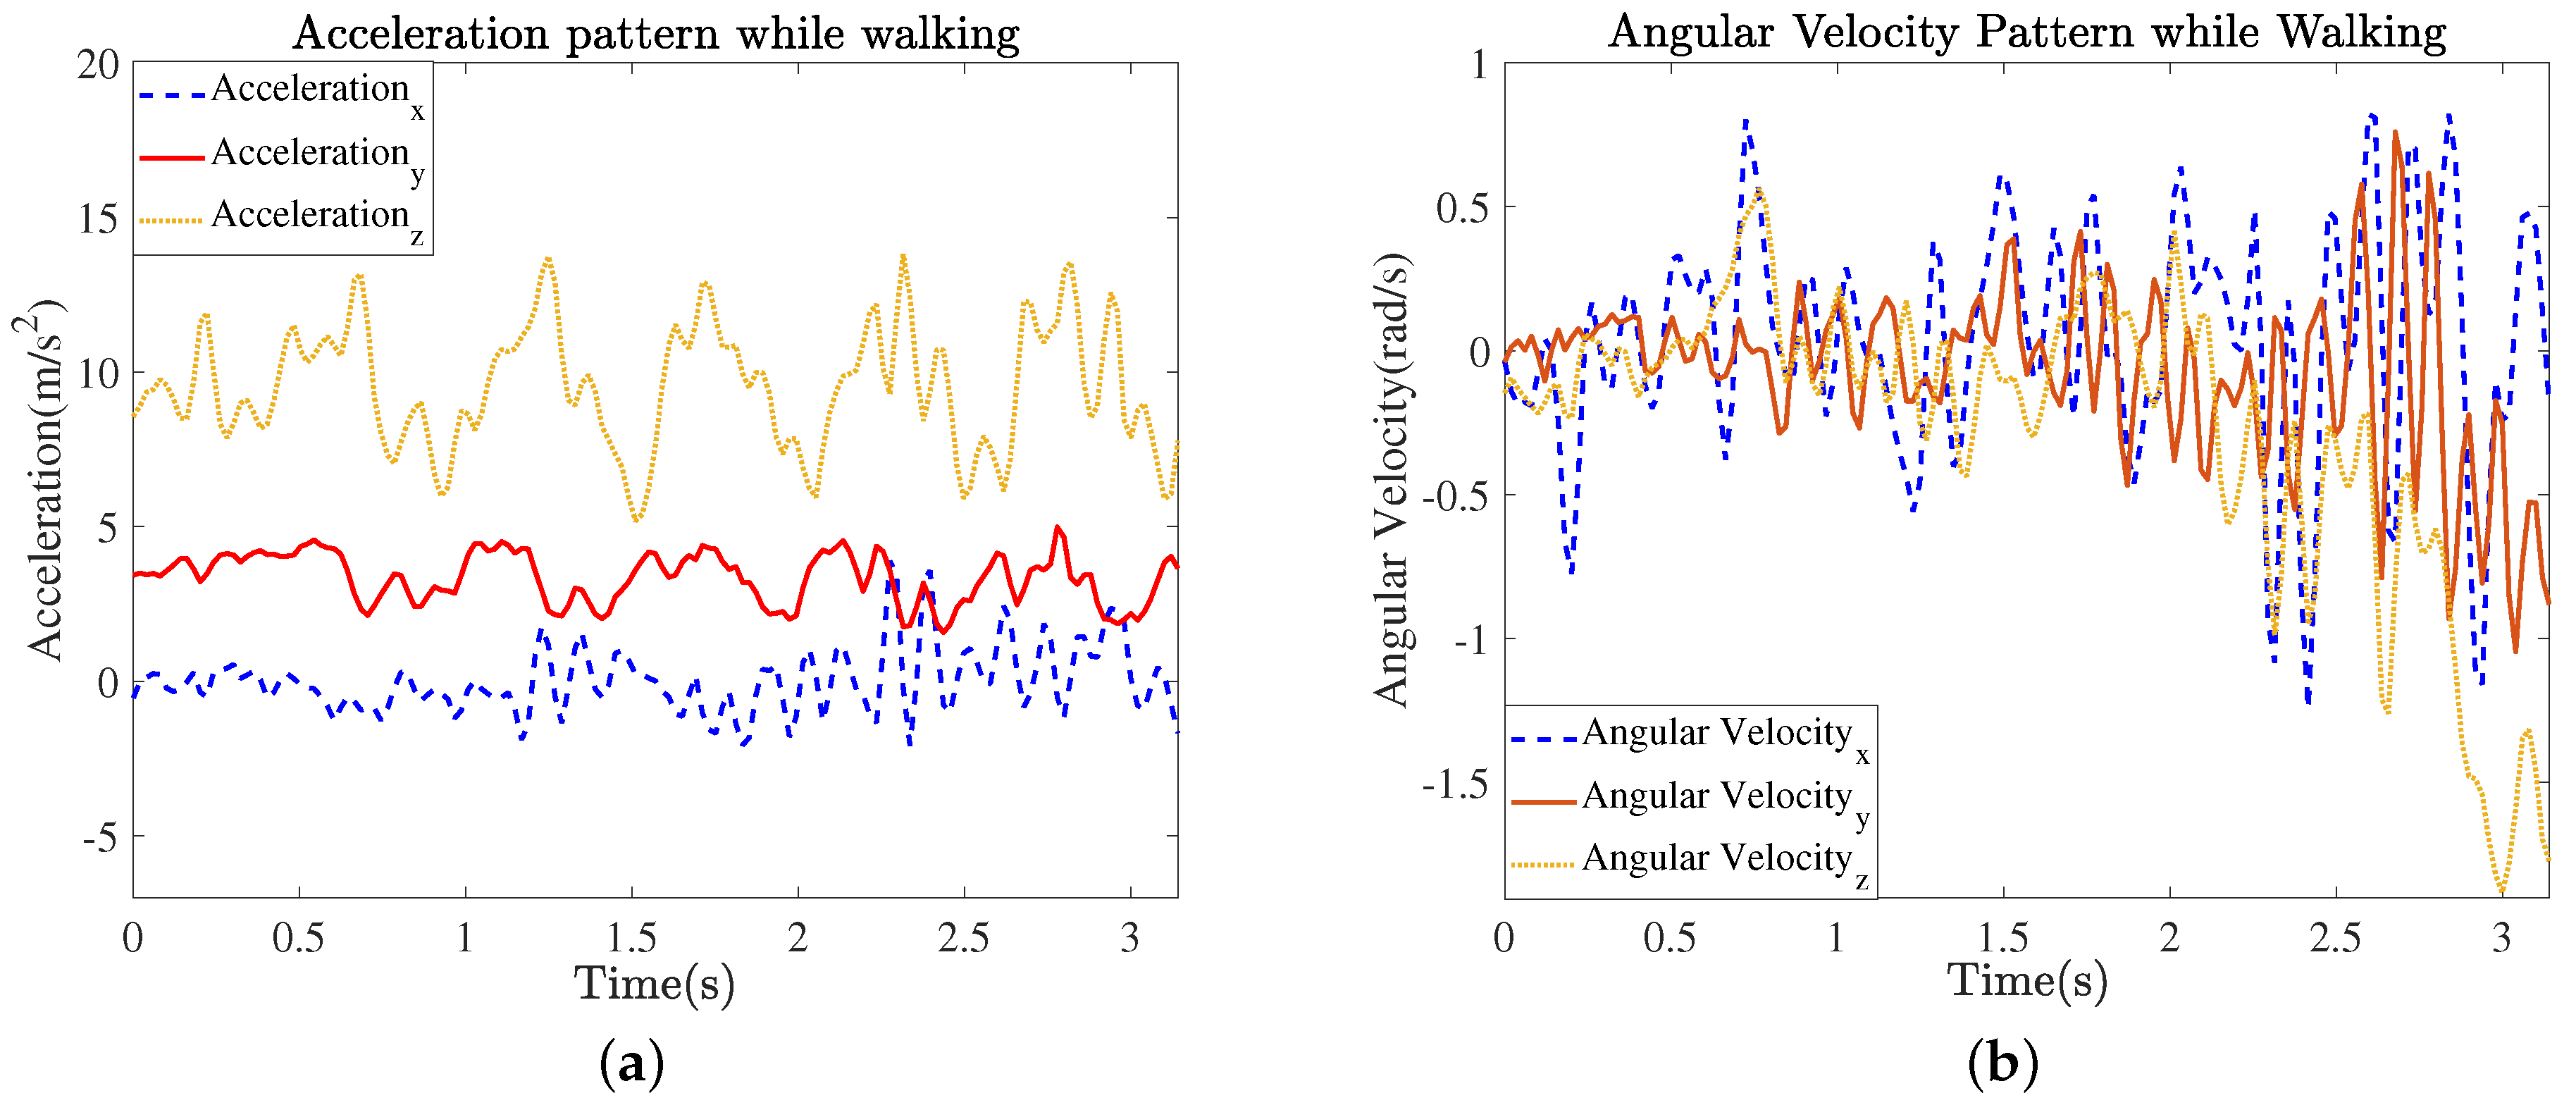
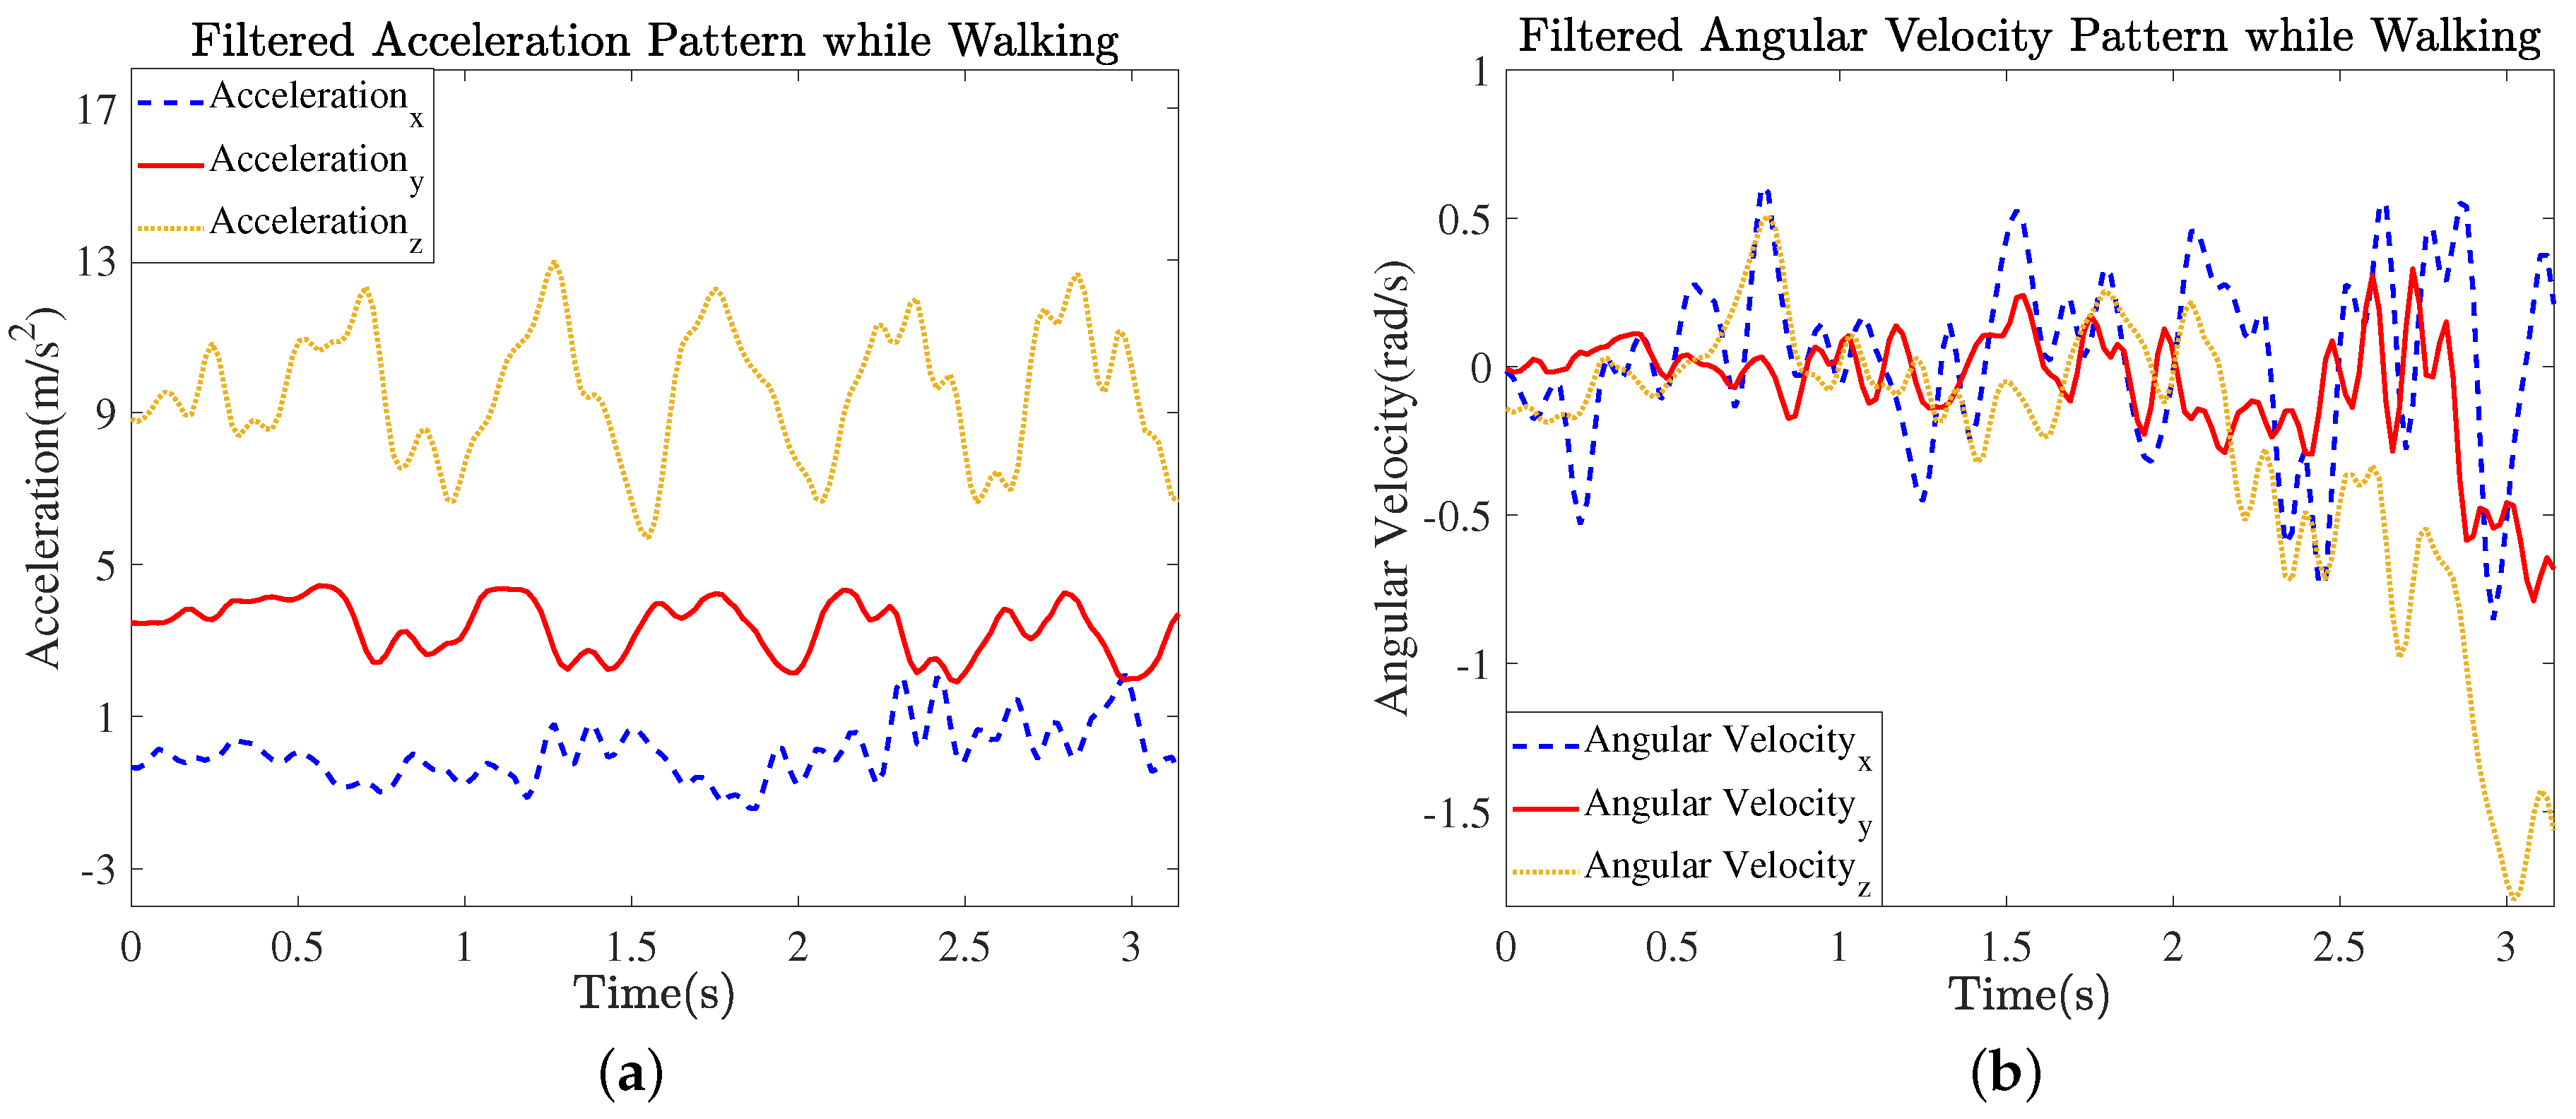
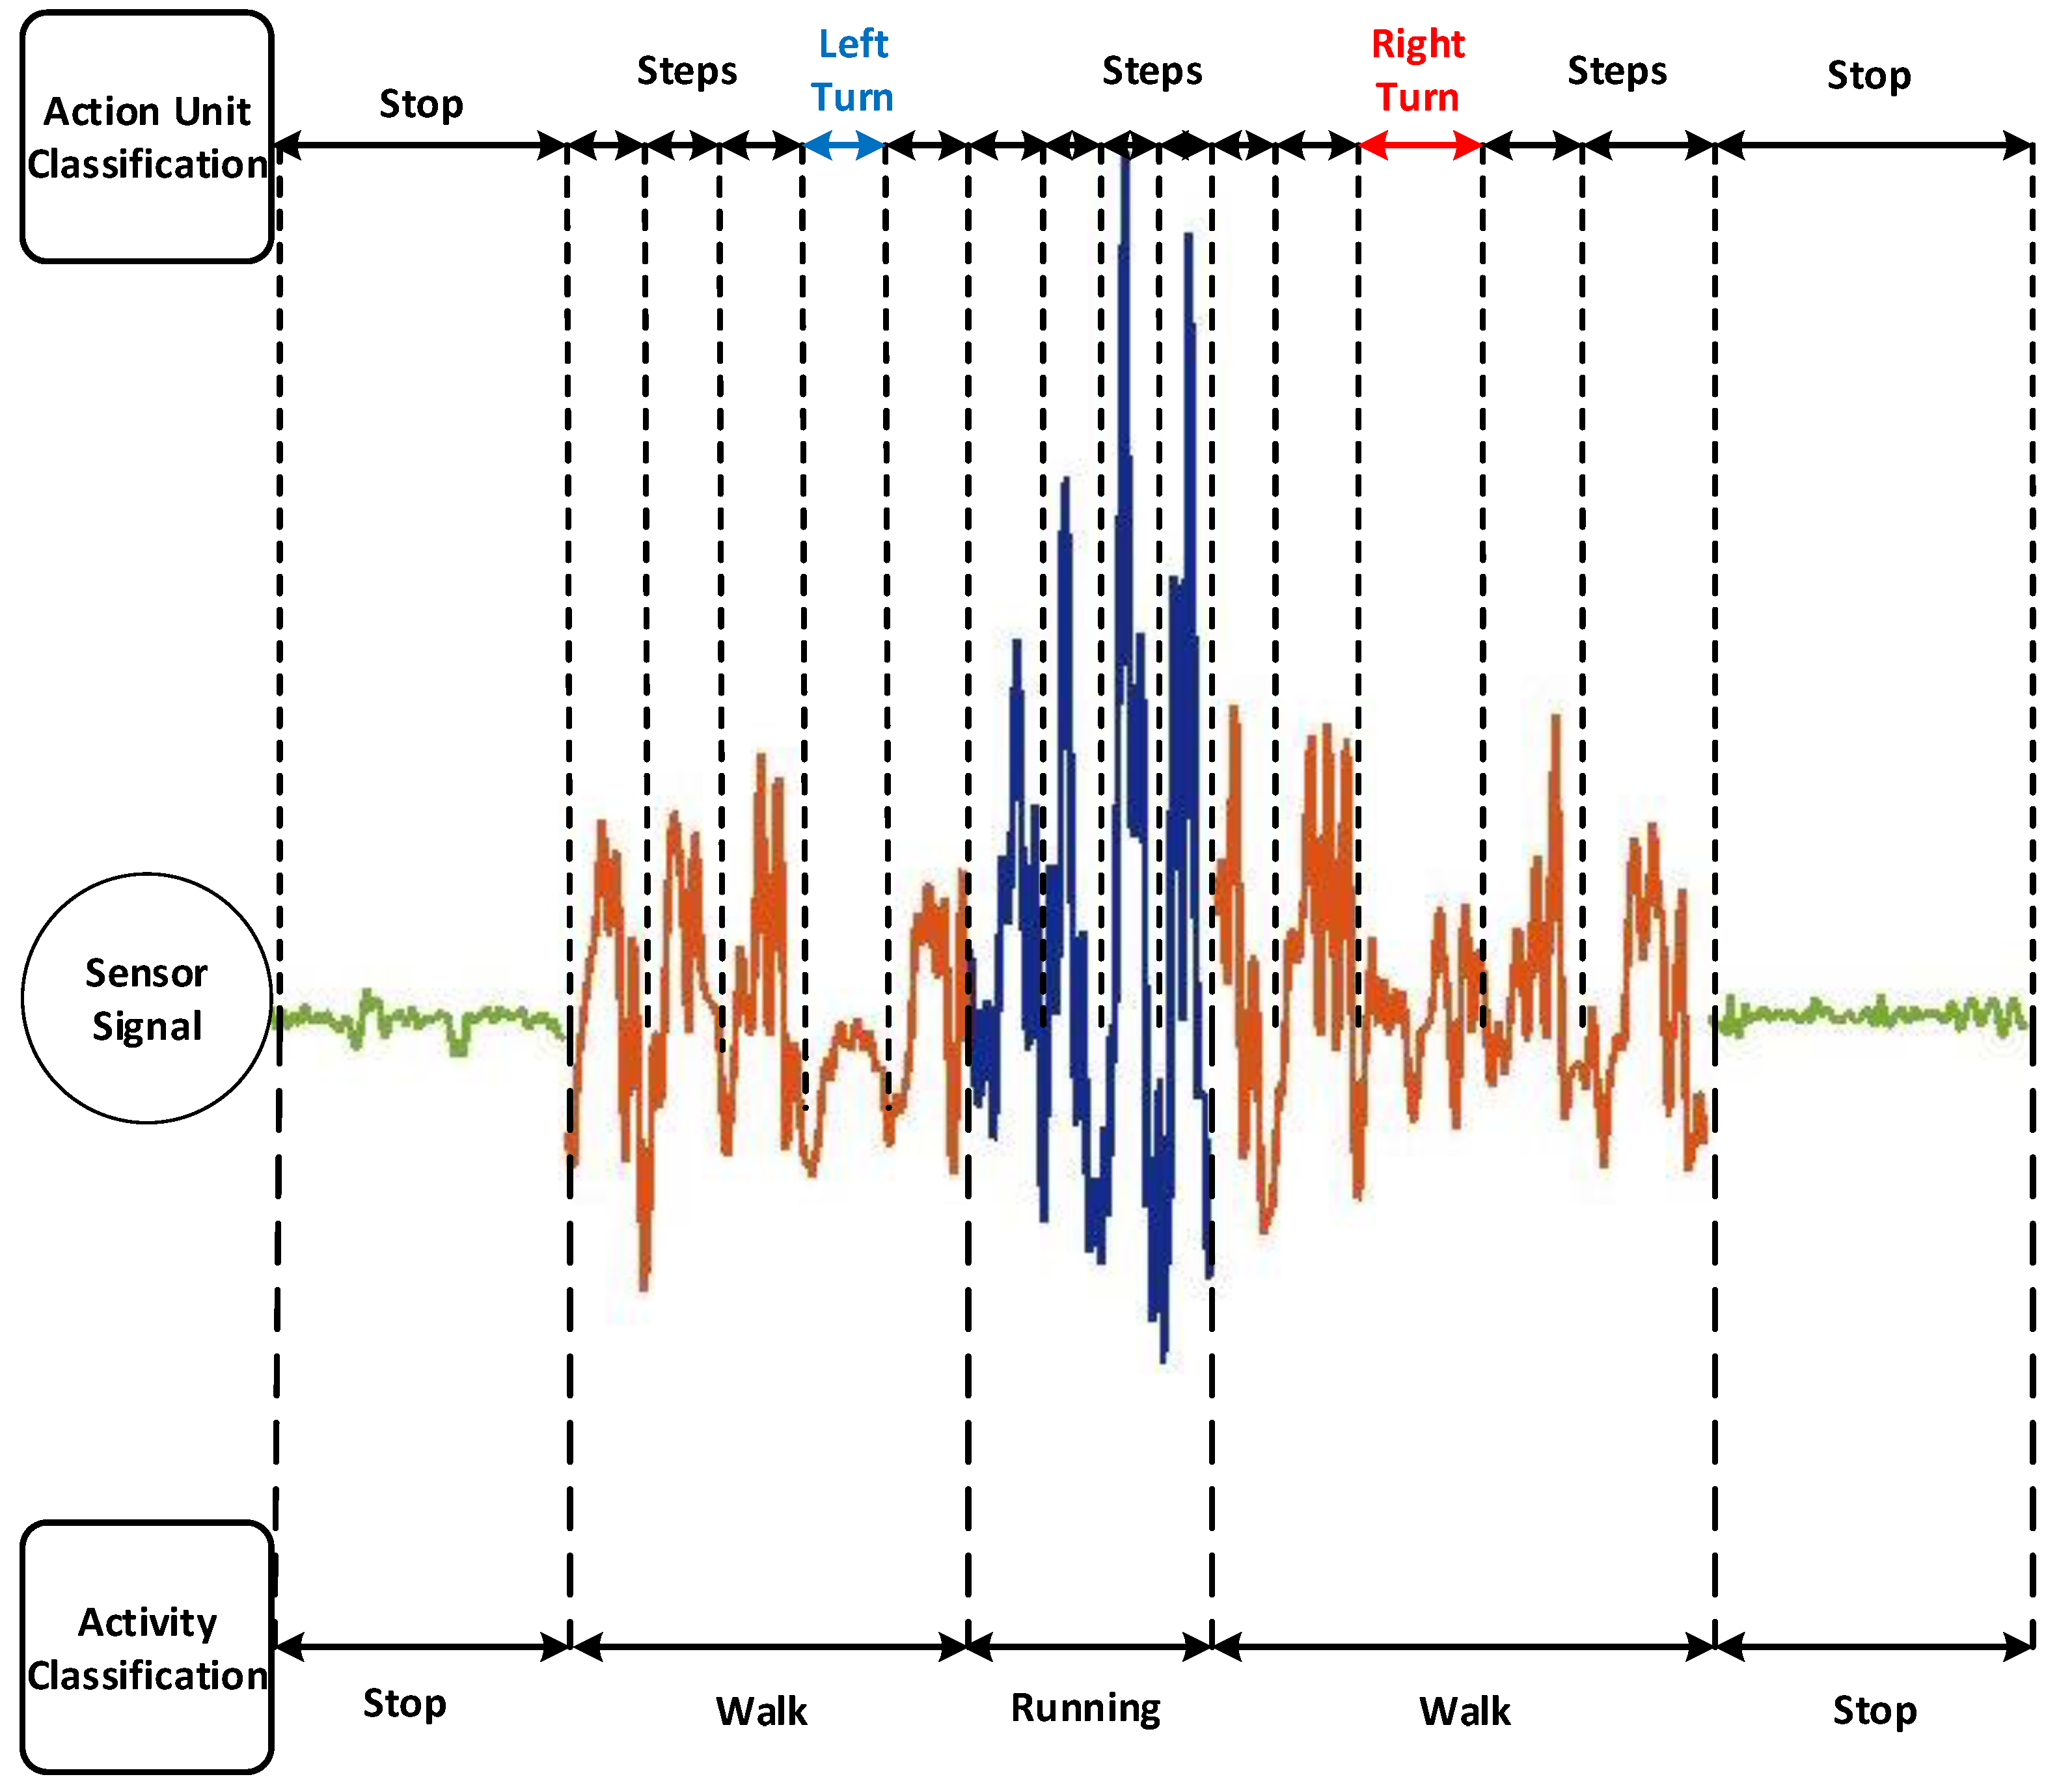
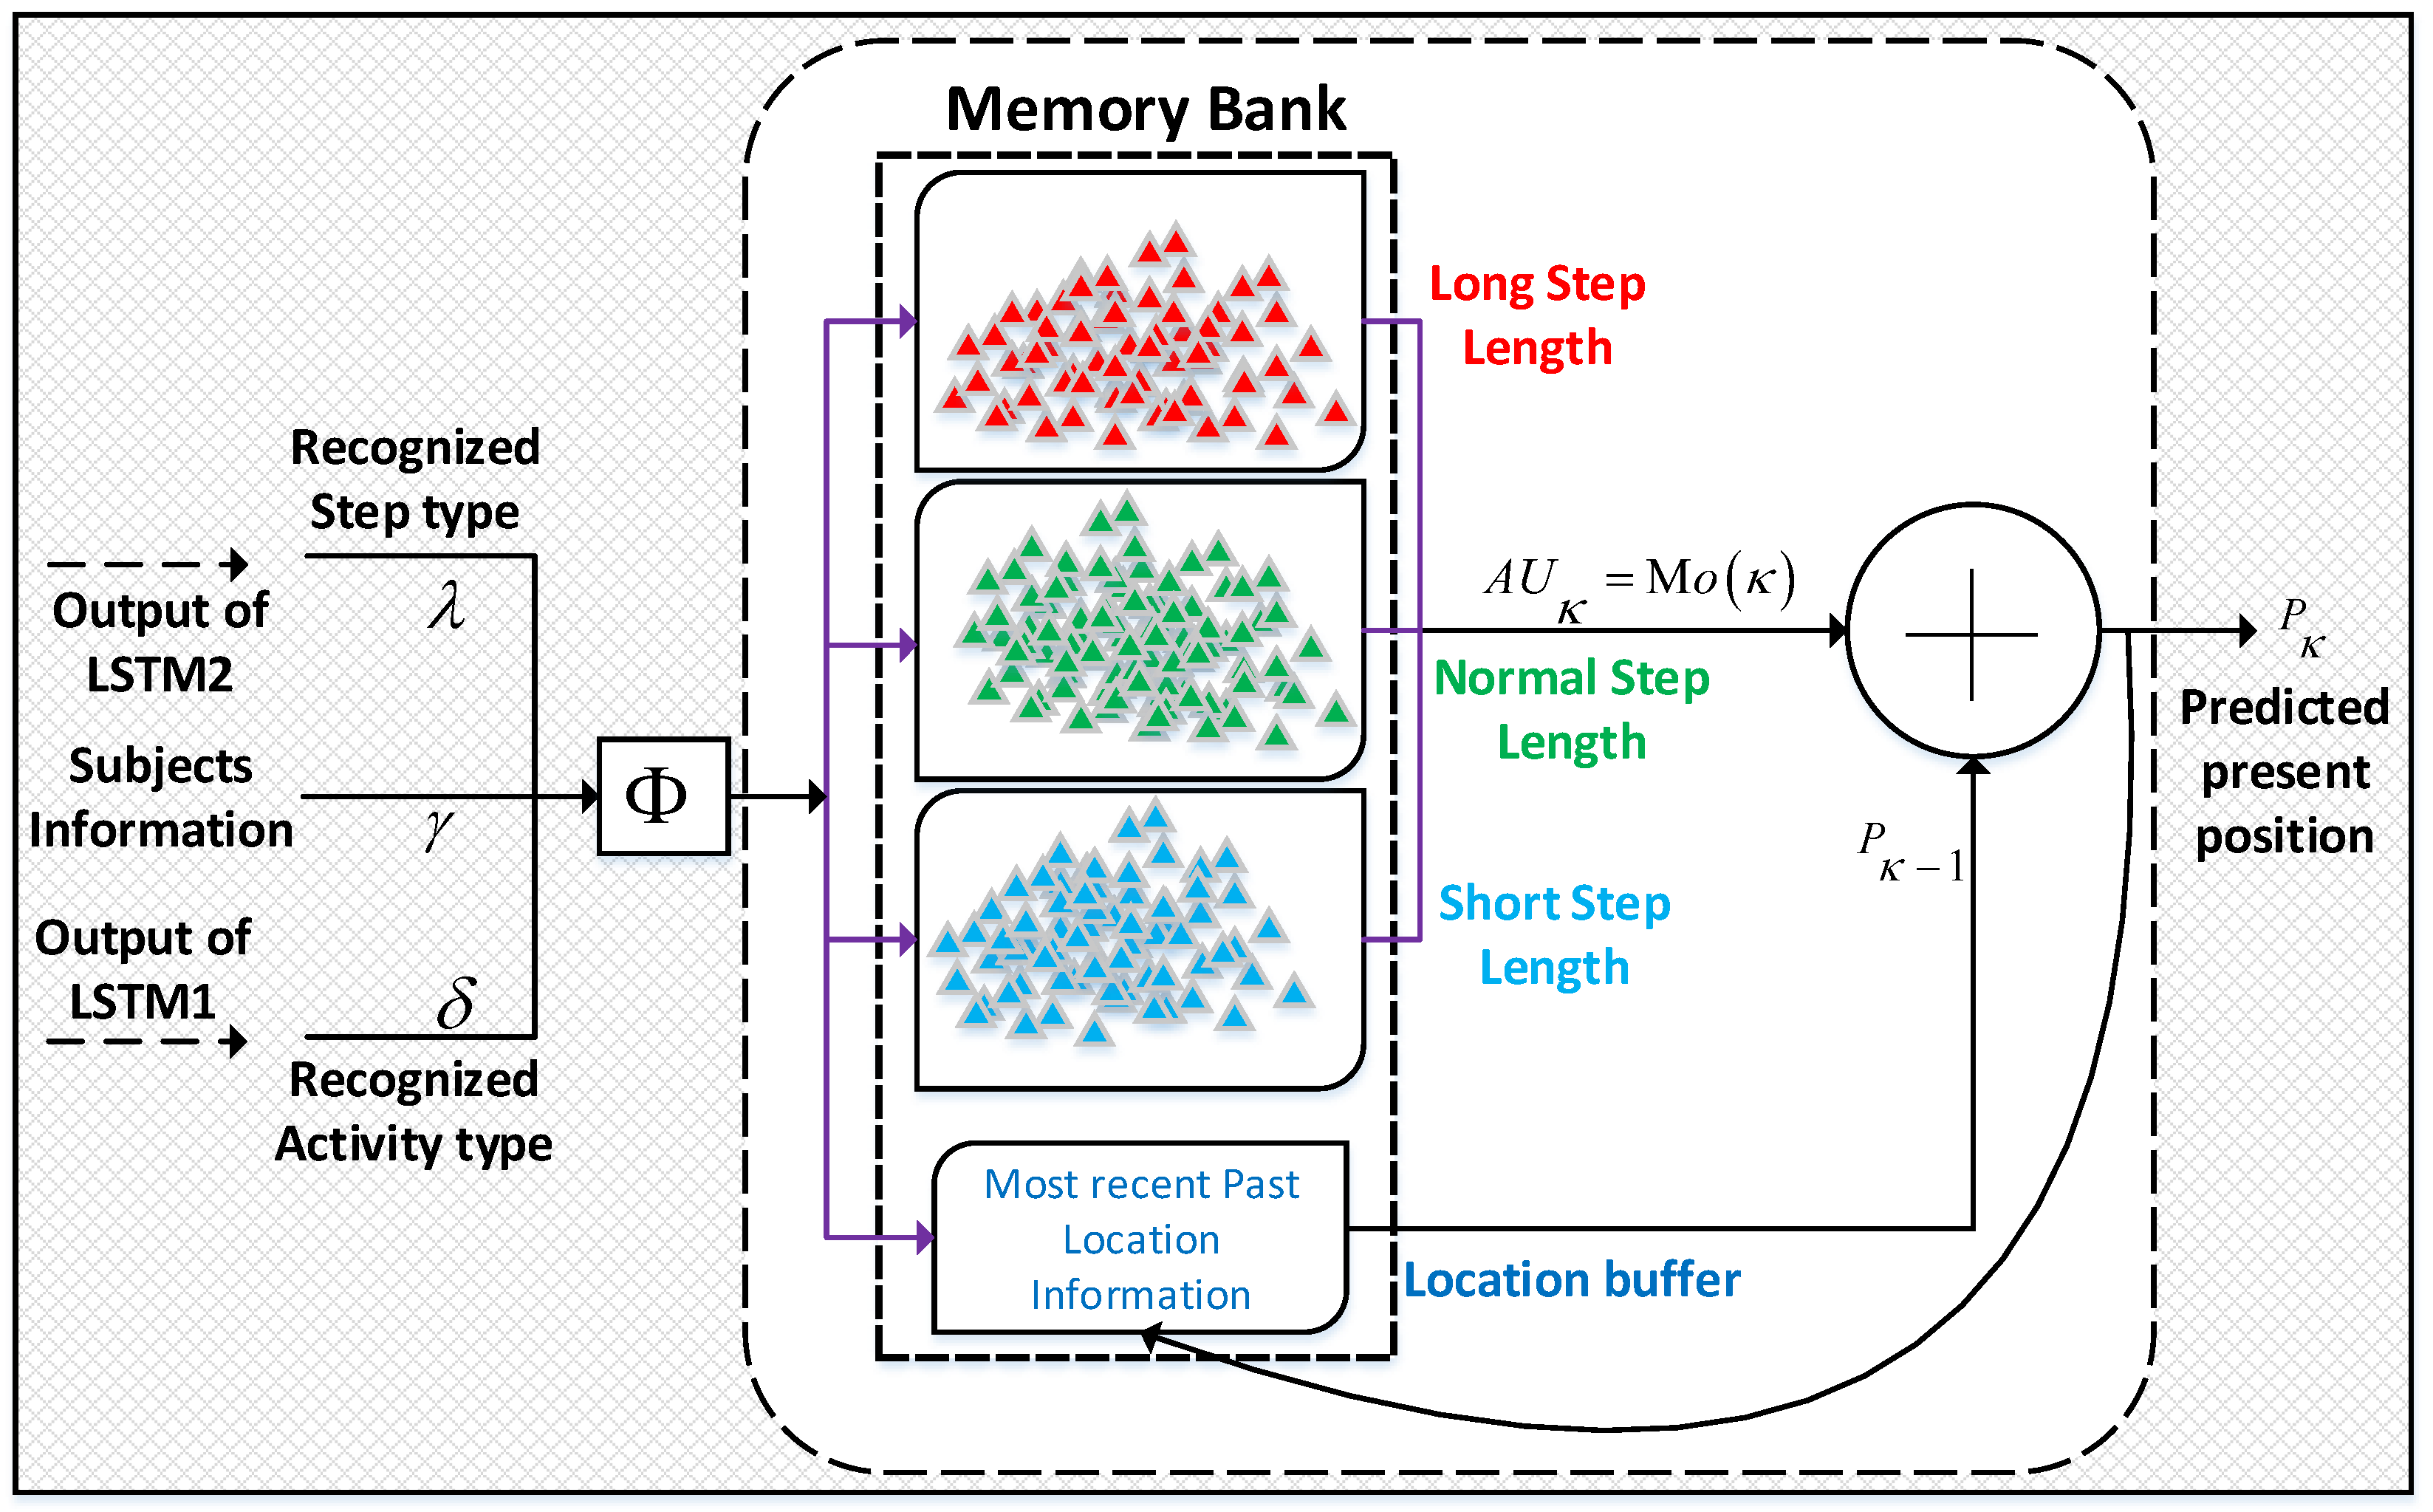
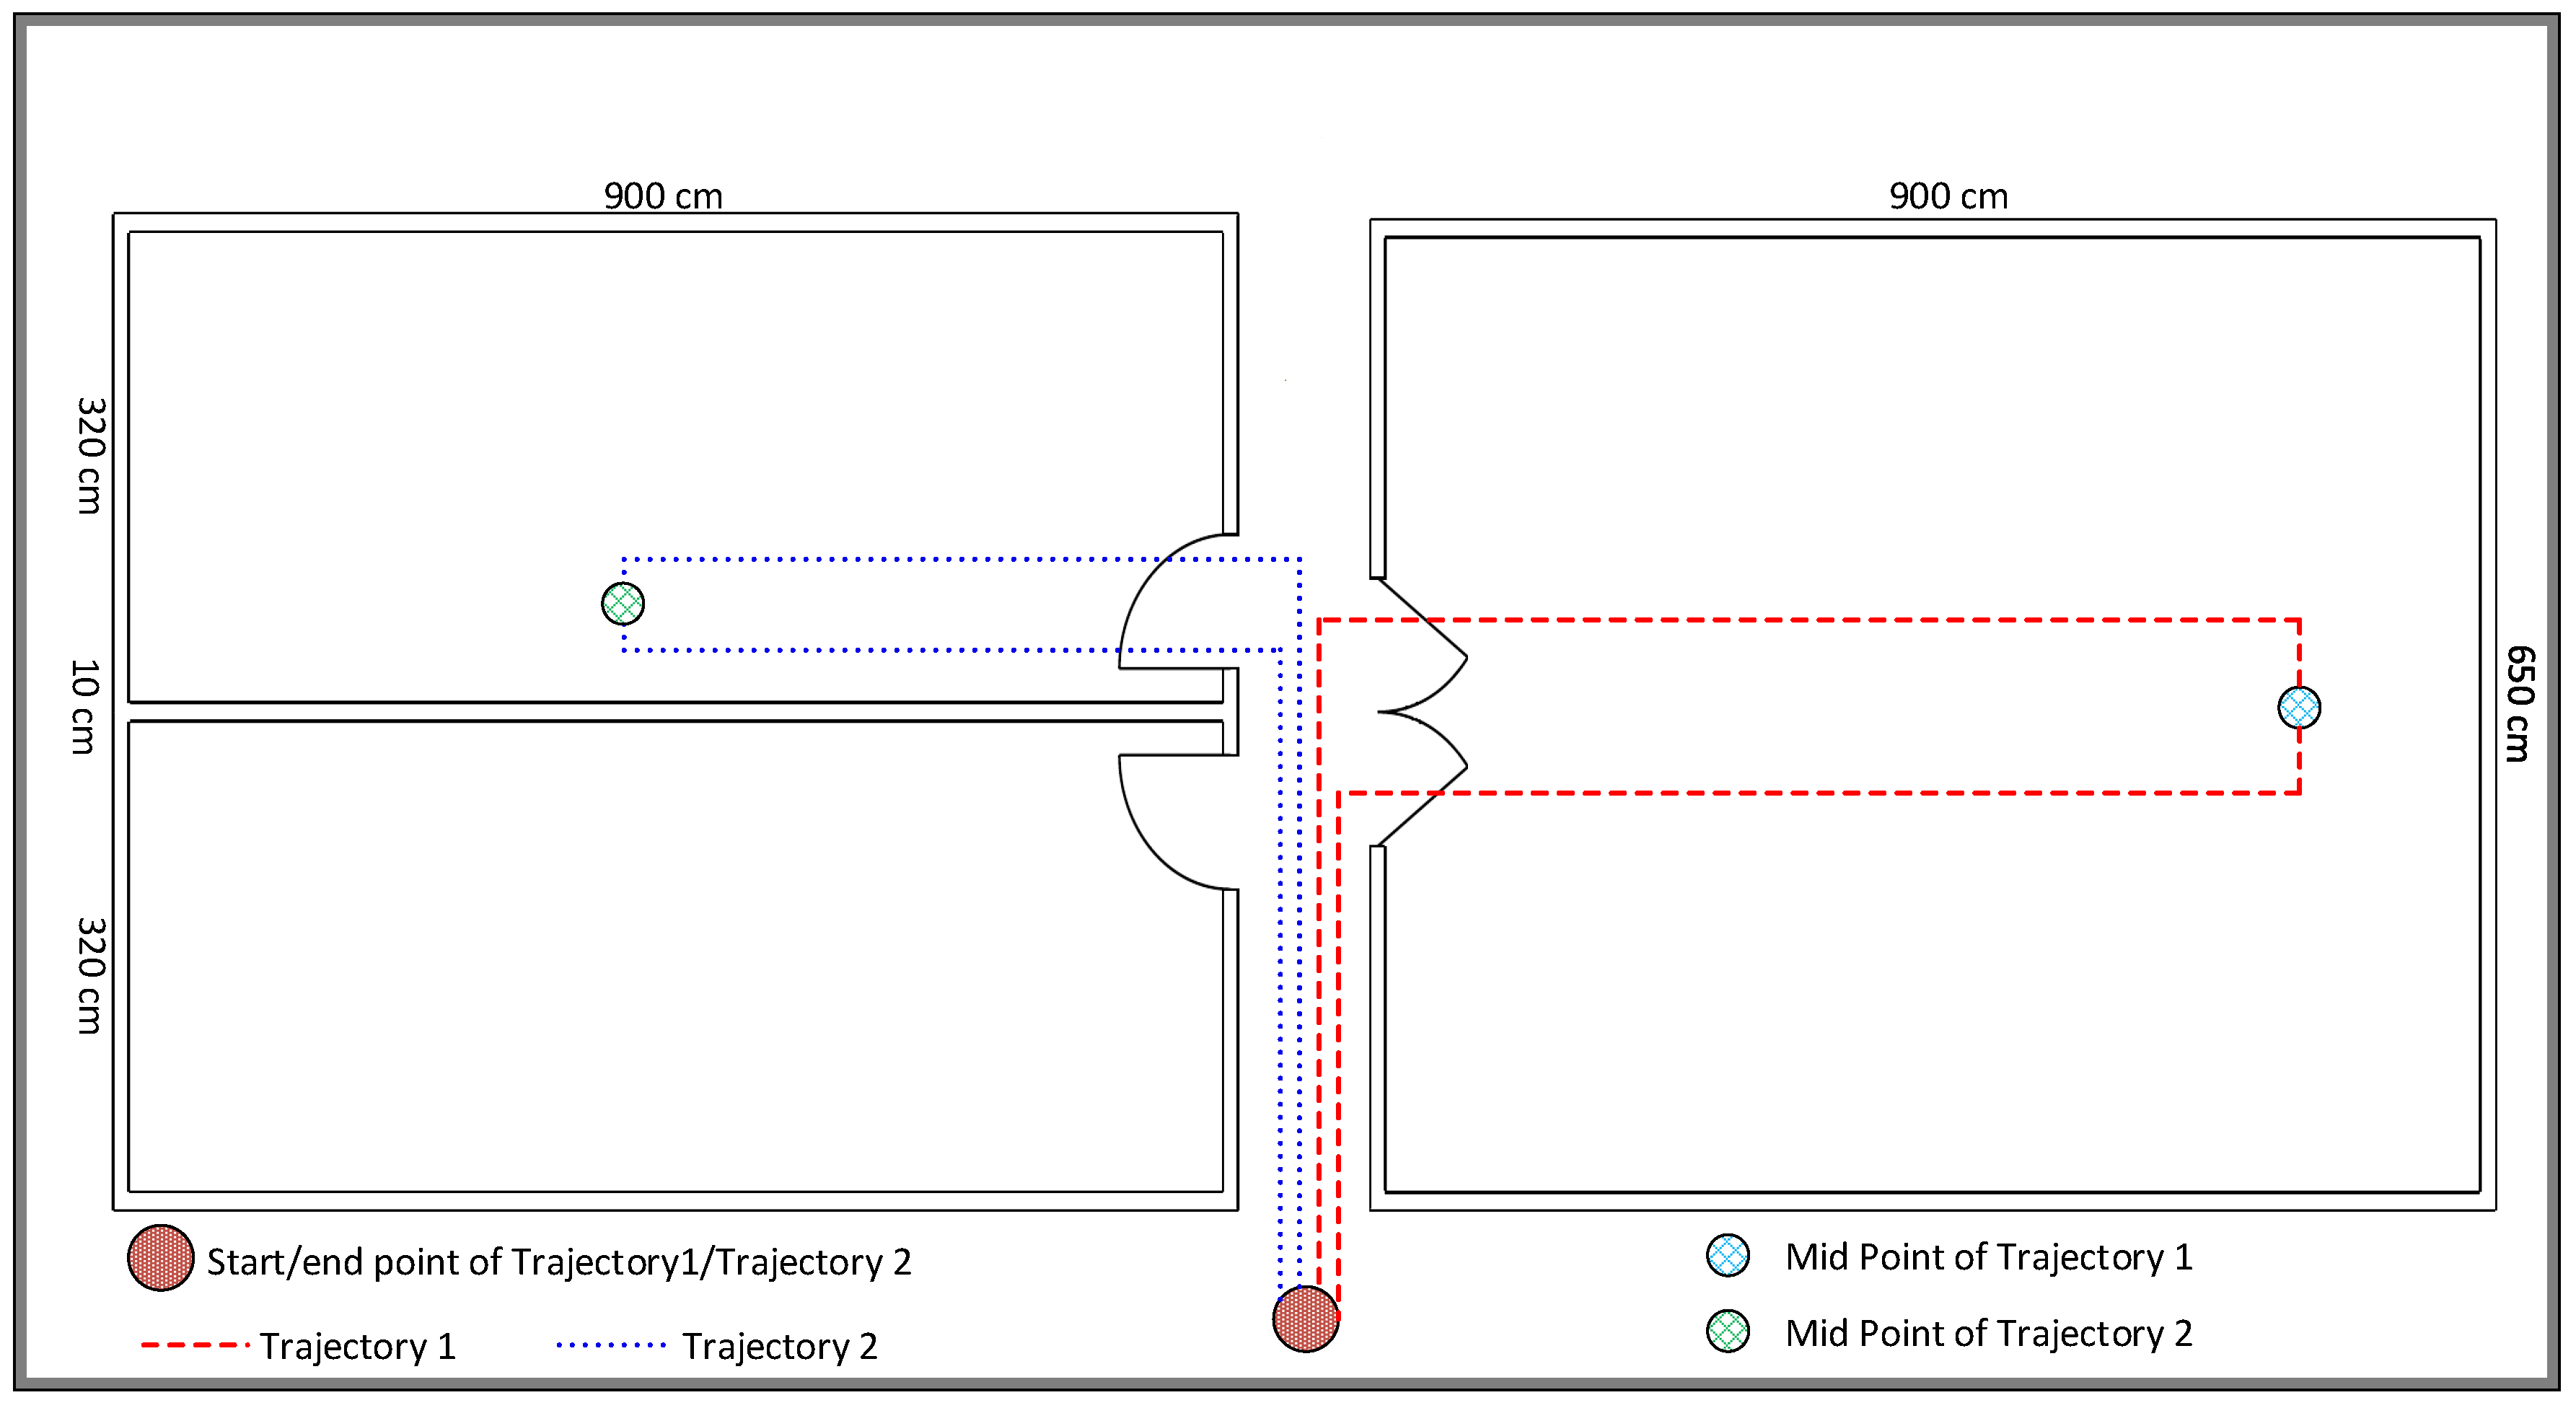
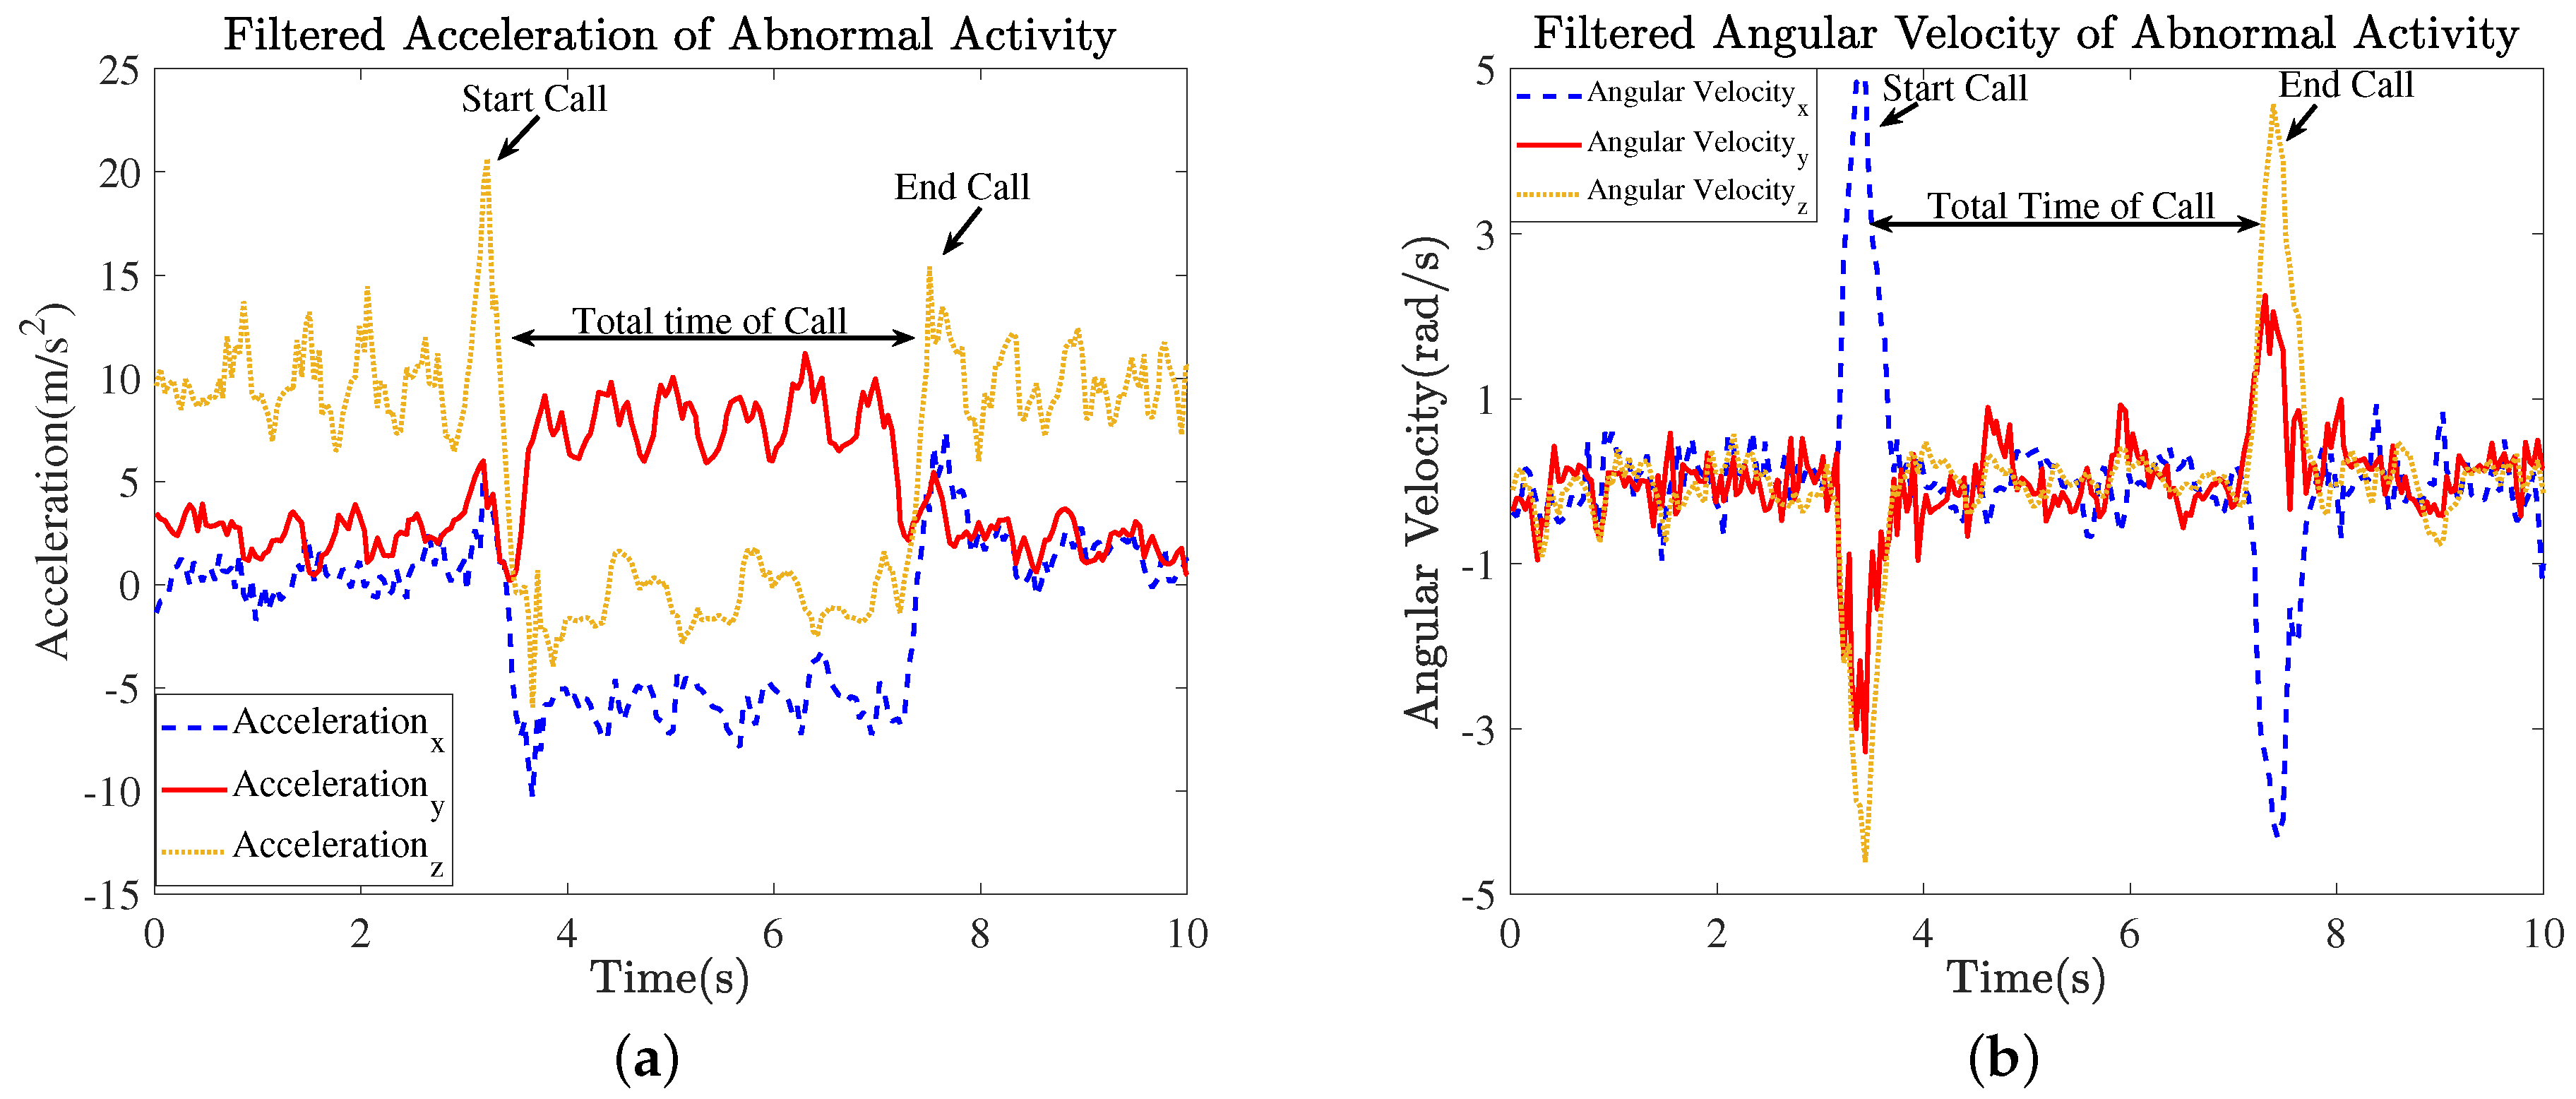
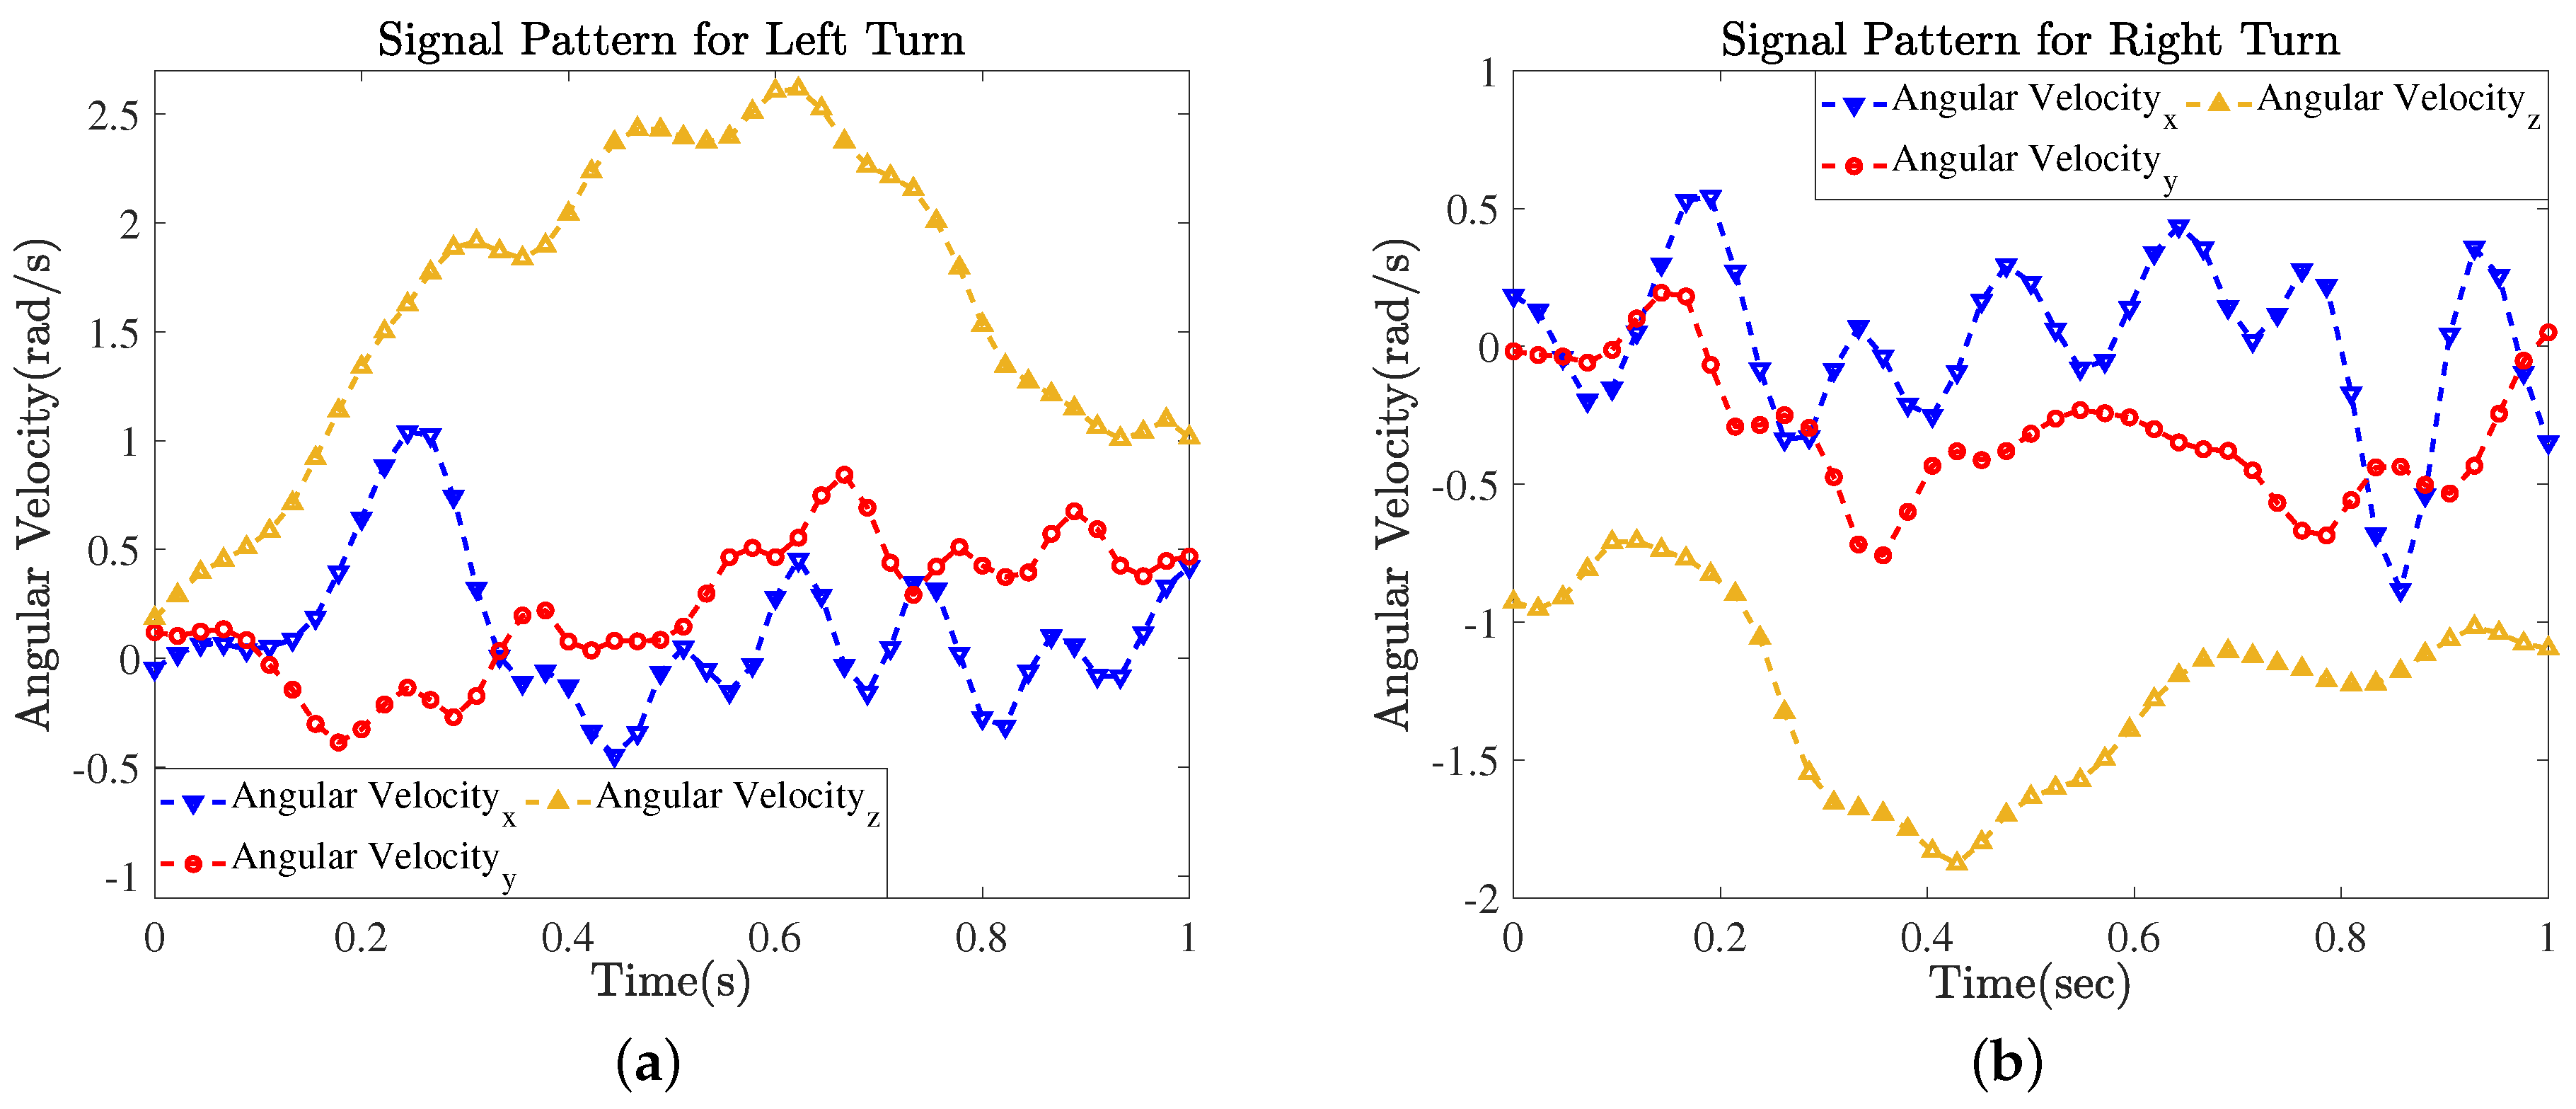
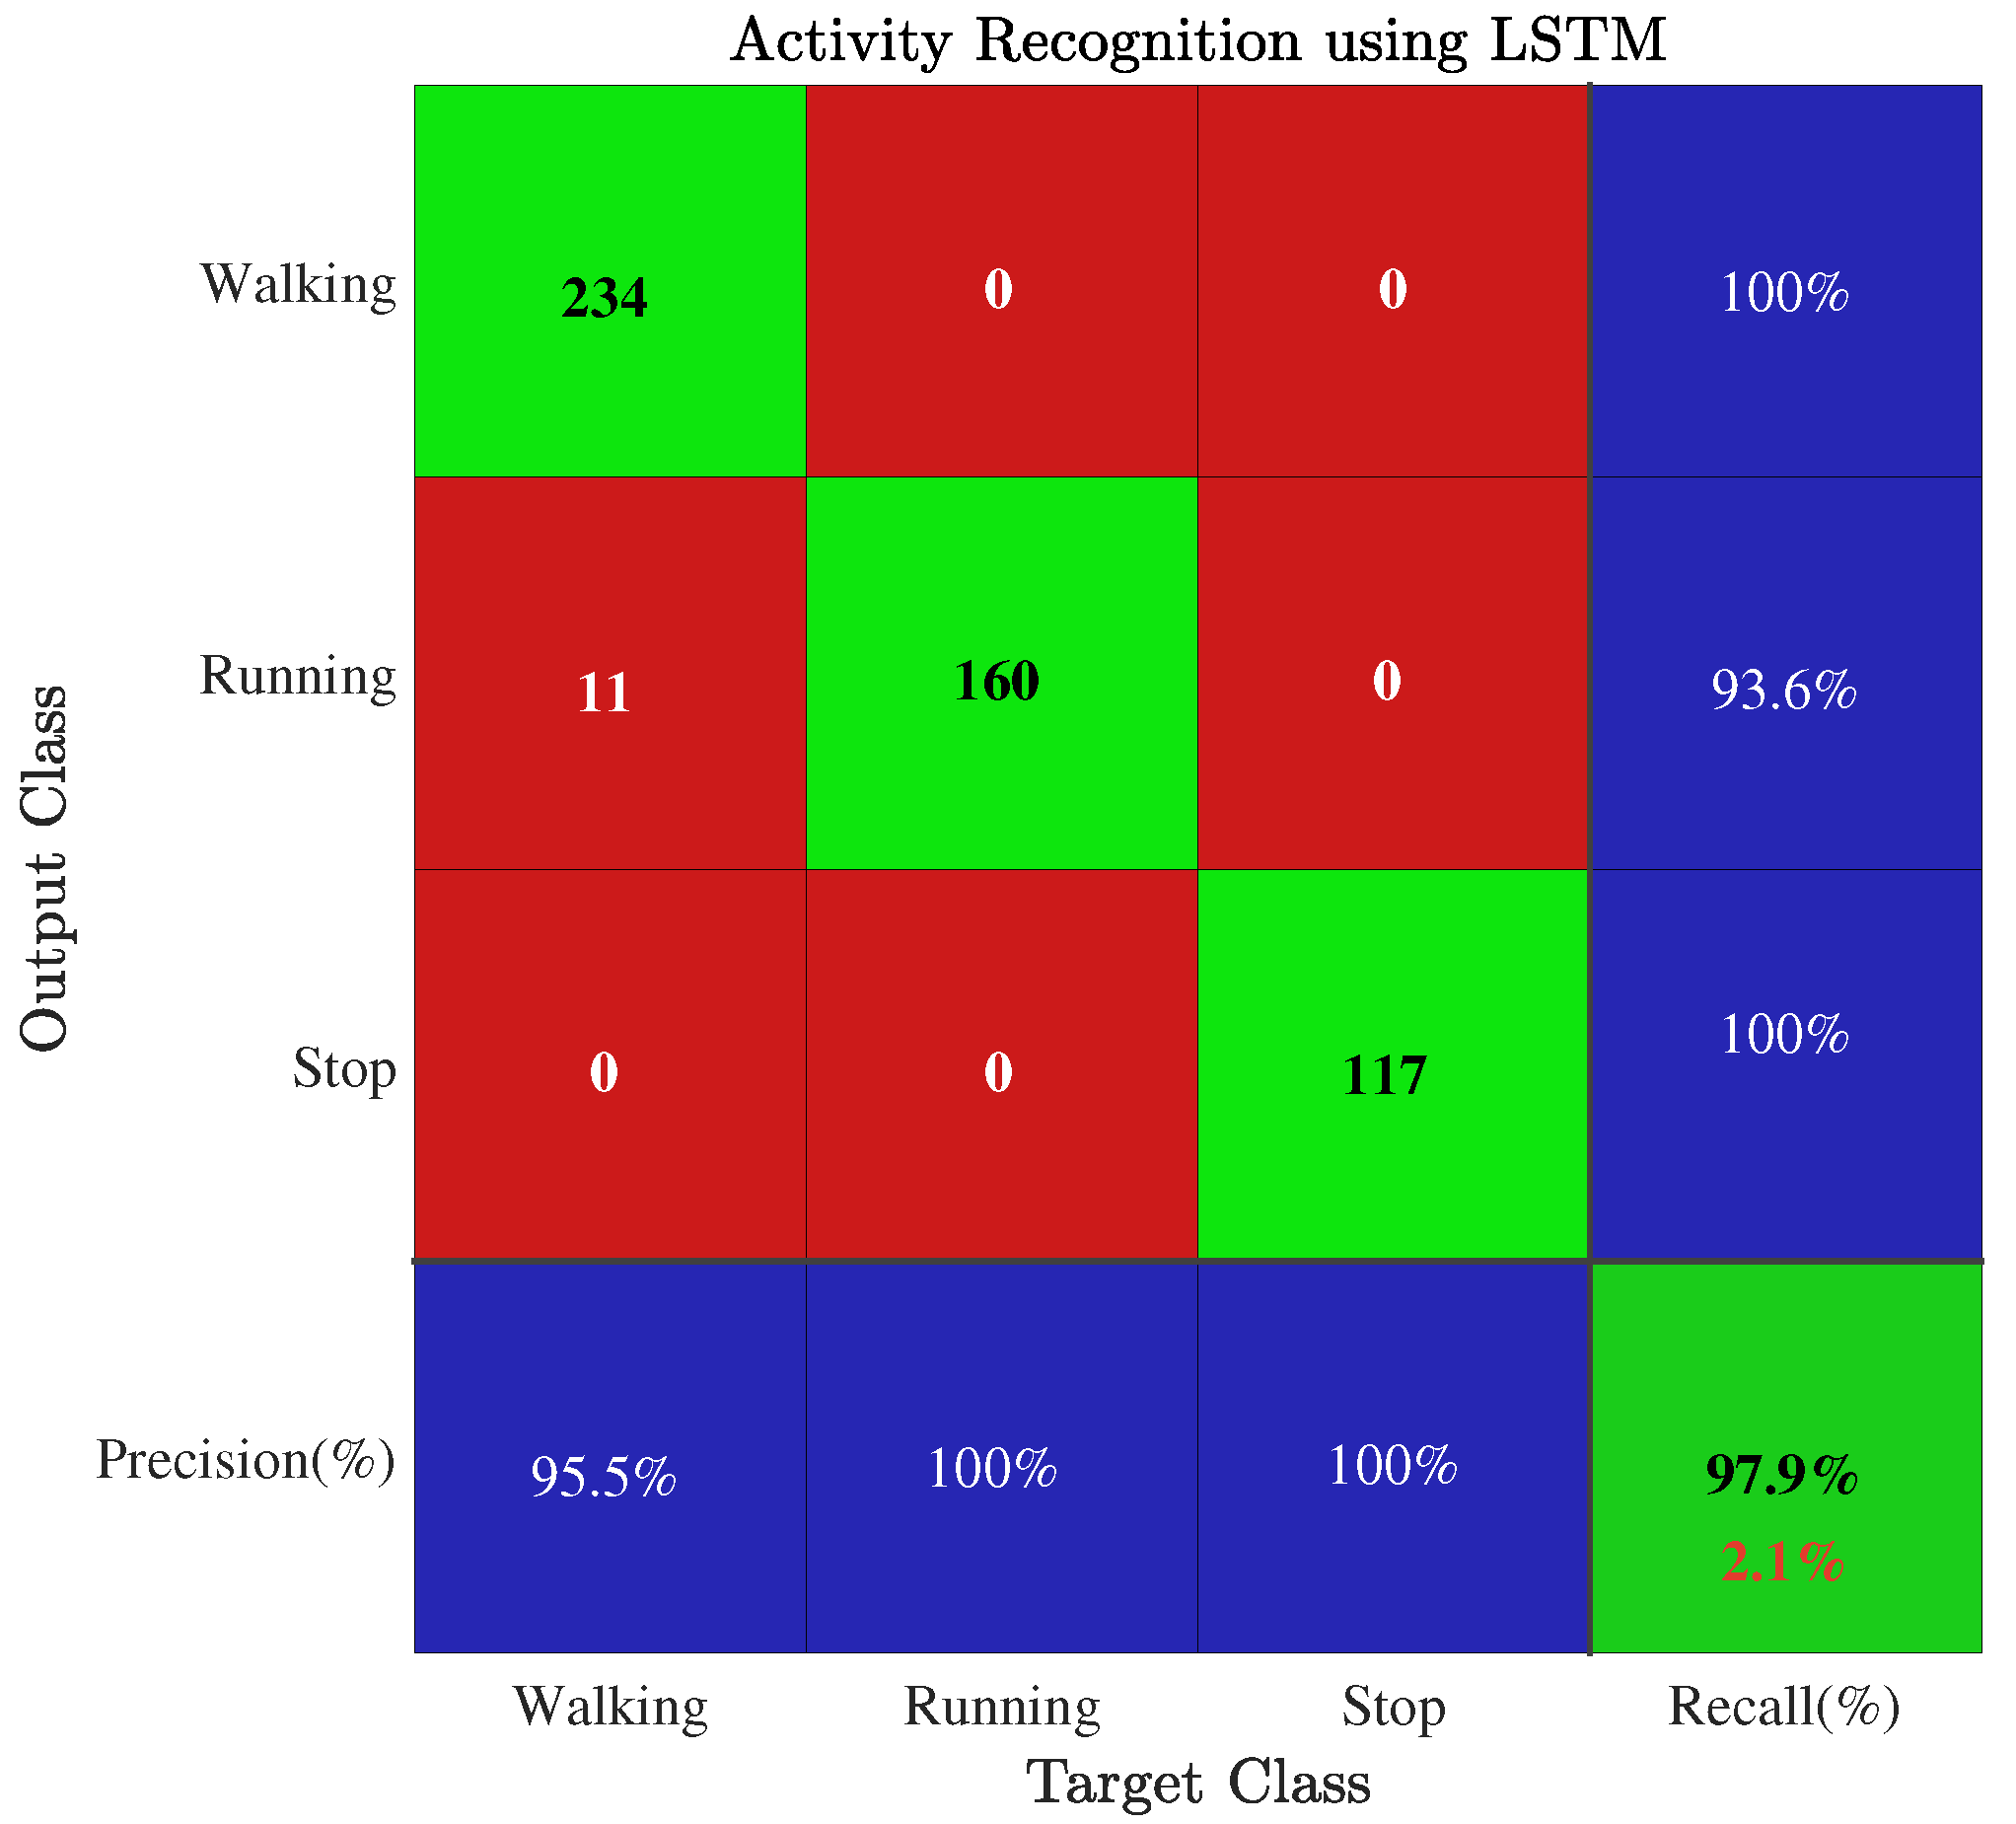
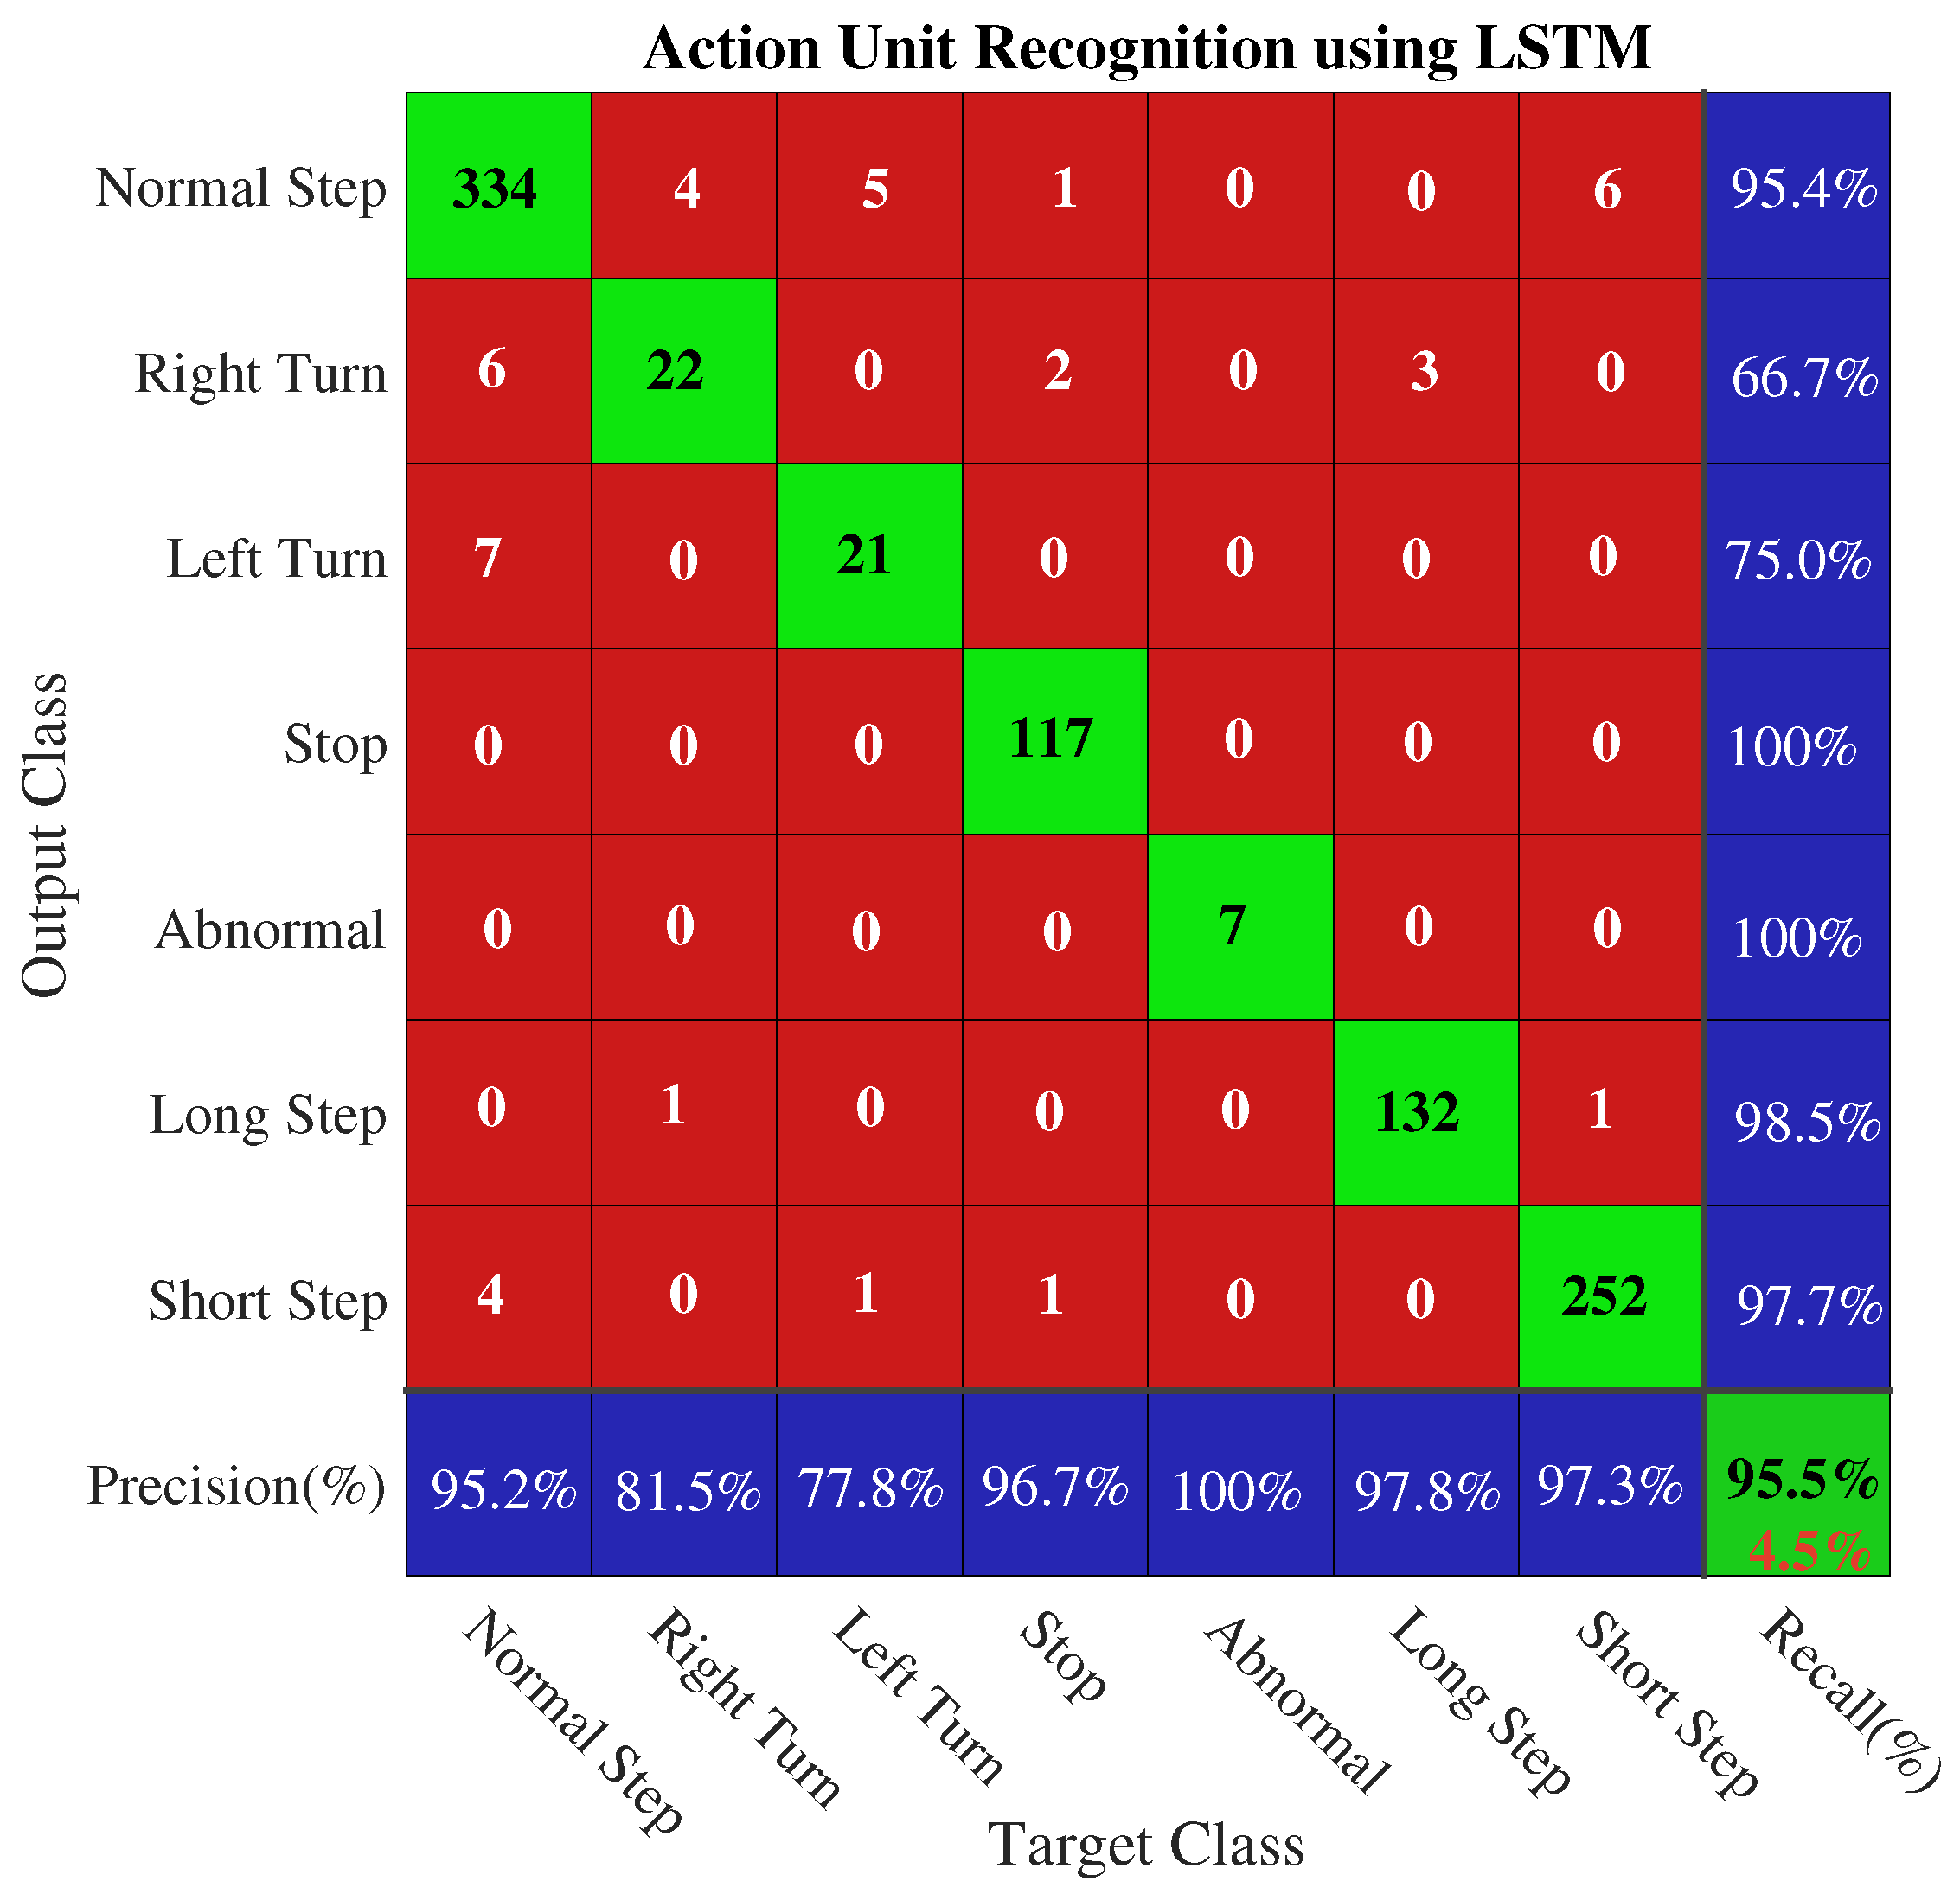
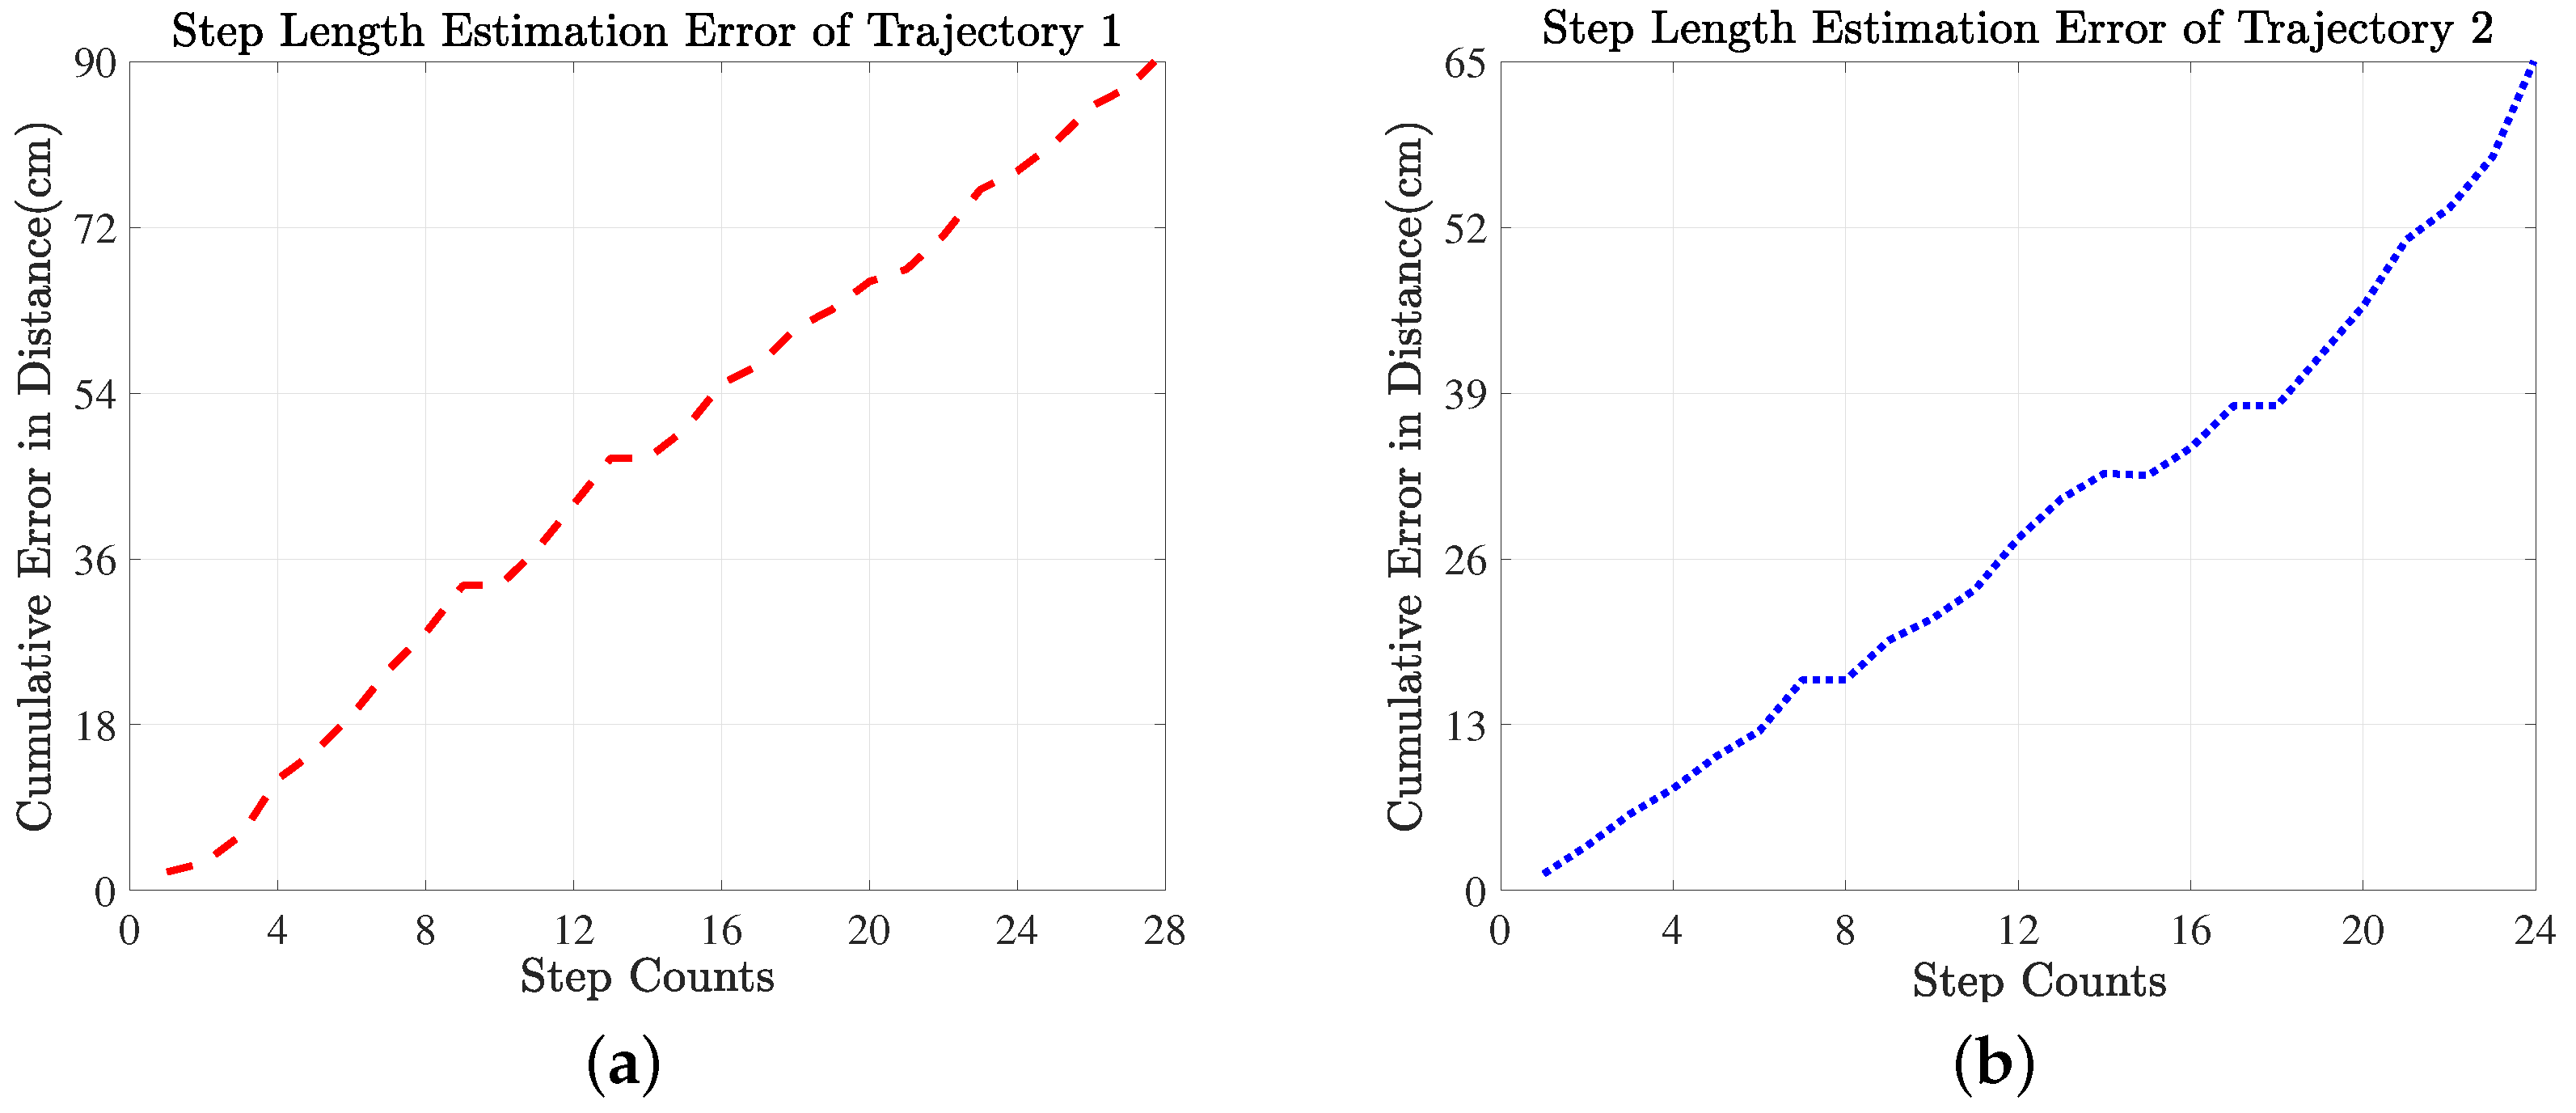
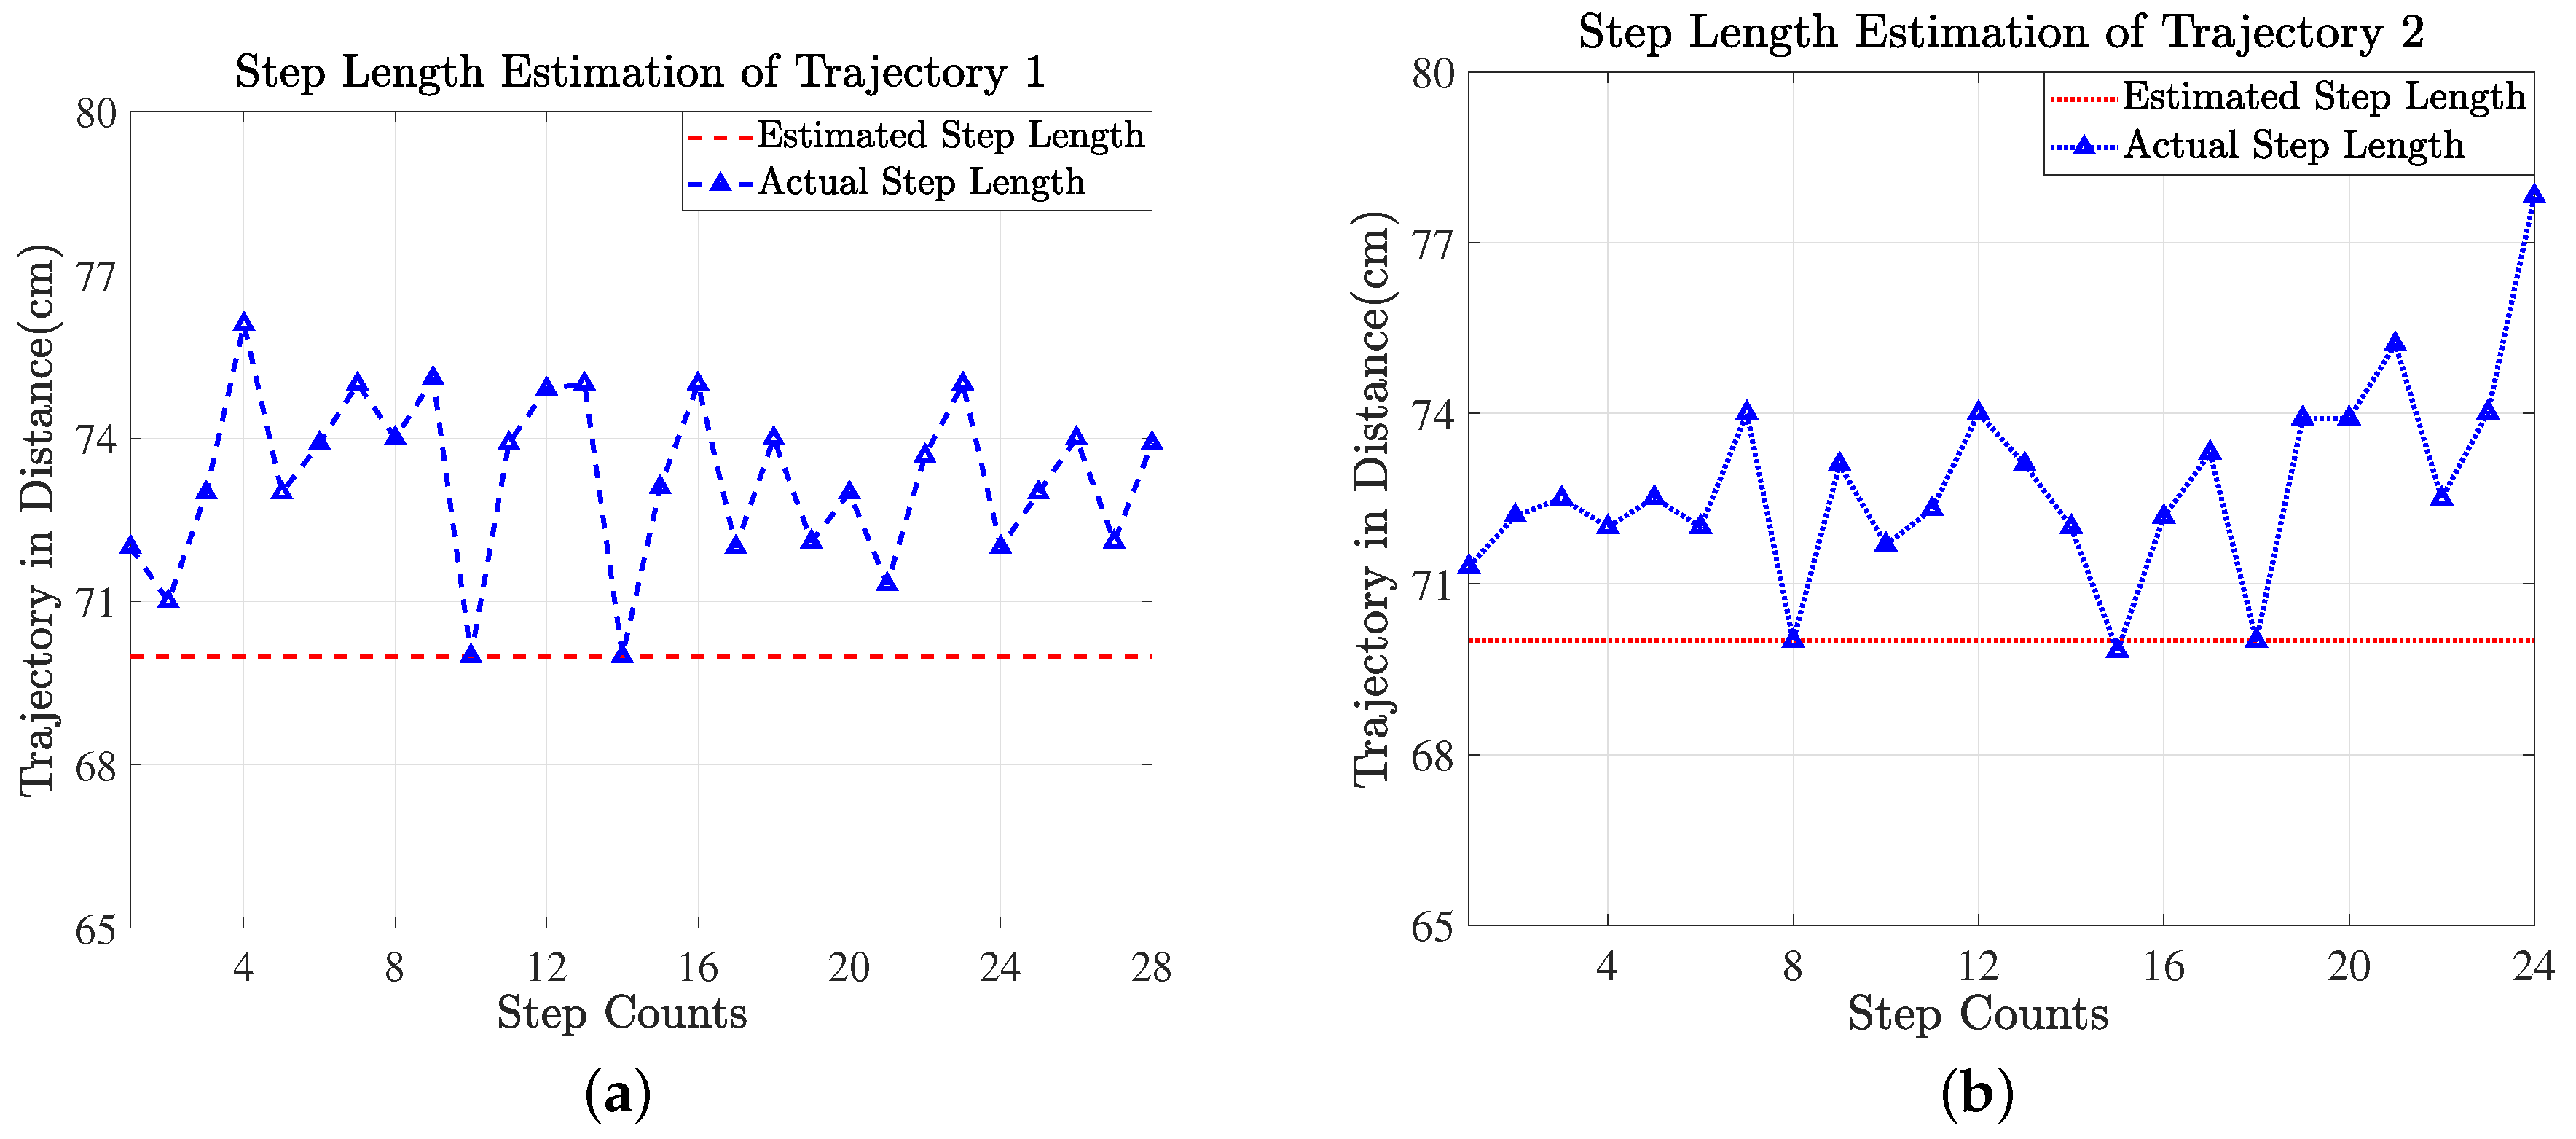
Table 1.
Optimal hyperparameters for LSTMs.
| Optimization Algorithm | Executive Environment | Learning Rate Drop period | Mini-Batch Size |
| Stochastic gradient descent | Graphical processing | 30 | 90 |
| with momentum | unit | ||
| Gradient Threshold | Initial Learning Rate | Learning Rate Schedule | Epochs Count |
| 1 | 0.01 | piece-wise | 40 |
Table 2.
The comparison of the previous related studies and the proposed study in terms of indoor navigational performance.
Table 2.
The comparison of the previous related studies and the proposed study in terms of indoor navigational performance.
| Proposed Algorithm | Signal Source | Error in Distance |
|---|---|---|
| In [56], Kernel Principal Component Analysis (KPCA) is employed to remove the data redundancy extract the meaningful non-linear features that assist the affinity propagation clustering algorithm to classify the location related RSS data. The test data is matched to the classified data to identify the position area. | RSS of WiFi | 1.76 m |
| Spearman-distance-based-k-Nearest Neighbor scheme was developed, which performed well in the indoor environment with multi-path fading and temporal dynamics [57]. | RSS of WiFi | 3.25 m |
| Recently, the authors combined PCA and kNN to reduce the data dimensionality that allows the system to be deployed fast in temporary environments such as emergency situations [58]. | RSS of WiFi and orientation | 1.46 m |
| The authors employed WiFi fingerprinting integrated with PDR for the indoor navigation and localization. K-weighted nearest node algorithm was also used in combination with PDR for improving the positioning accuracy [59]. | RSS of WiFi and the inertial sensors | 1.58 m |
| A new method based on combination of RSS measurements of two receivers using Gaussian mixture model was developed. The system was actually a hybrid positioning system that combined measurements from inertial sensors and WiFi using extended Kalman filter [34]. | RSS of WiFi and the inertial sensors | 1.4 m |
| The authors defined several indoor landmarks through variations of RSS, which were exploited to correct the accumulated errors derived from the PDR. The designed fusion algorithm achieved minor improvement in localization performance [17]. | RSS of WiFi, landmarks and the inertial sensors | 2.17 m |
| A fusion approach based on extended Kalman filter was developed. Extended Kalman filter, a fusion algorithm, integrated WiFi, PDR, and landmarks to form a hybrid positioning system [16]. | RSS of WiFi, landmarks and the inertial sensors | 1.35 m |
| An indoor localization system was designed using smartphone built in magnetic, angular rate, gravity (MARG) sensors and a WiFi module. The study employed extended Kalman filter for the fusion of the data from two different signal sources [60]. | RSS of WiFi and the MARG sensors | 0.85 m |
| An indoor positioning method based on fusing trilateration and dead reckoning was proposed. Kalman filter, a complex algorithm, was used to fuse the both the approaches (Bluetooth fingerprint and dead reckoning) and obtained localization performance with an error less than one meter [25]. | RSS of Bluetooth and the inertial sensors | <1 m |
| A PDR algorithm based on the strap-down inertial navigation system was designed. The system used gyroscope, accelerometer and magnetometer of the smartphone. The study attained the positioning accuracy with an error more than 2 m for four different phone carrying contexts [52]. | The inertial sensors | >2 m |
| An unsupervised indoor positioning scheme that used a combination of iBeacons, smartphone sensors and WiFi fingerprint. An initial localization module, a fusion algorithm combined with a kNN and least square algorithms provided the initial localization. However, the study provided the basic location estimation through PDR [61]. | RSS of WiFi and iBeacons; and the inertial sensors | 1.1 m and 2.77 m |
| A study consisted of the inertial navigation system and RFID technology was designed. A foot mounted inertial measuring system was aided with RSSs obtained from the RFID tags. The integration of two different signal sources was done with tight Kalman filter [62]. | RSS of RFID and the inertial sensors | >1 m |
| The authors designed a hybrid indoor positioning system that was based on the inertial sensors and vector graph. The particle filter was used with vector graph to correct the deviation in step length and heading estimation [26]. | The inertial sensors and vector graph | Sub-meter mean error |
| We proposed an indoor positioning system that consisted of inertial sensors employs LSTM, deep learning-based end-to-end learning network, for recognizing the three activities and related seven AUs like short step, normal step, long step, left turn, right turn, abnormal and stop activities. The proposed network accurately recognized the activities and the AUs with accuracy of 97.9% and 95.5%, respectively. Then, the length of the step is estimated according to the recognized step type (short step, normal step, long step), which results in the improved indoor navigational performance of the system (Proposed System) | The inertial sensors | 0.782 m |
© 2019 by the authors. Licensee MDPI, Basel, Switzerland. This article is an open access article distributed under the terms and conditions of the Creative Commons Attribution (CC BY) license (http://creativecommons.org/licenses/by/4.0/).
Share and Cite
MDPI and ACS Style
Hussain, G.; Jabbar, M.S.; Cho, J.-D.; Bae, S. Indoor Positioning System: A New Approach Based on LSTM and Two Stage Activity Classification. Electronics 2019, 8, 375. https://doi.org/10.3390/electronics8040375
AMA Style
Hussain G, Jabbar MS, Cho J-D, Bae S. Indoor Positioning System: A New Approach Based on LSTM and Two Stage Activity Classification. Electronics. 2019; 8(4):375. https://doi.org/10.3390/electronics8040375
Chicago/Turabian StyleHussain, Ghulam, Muhammad Shahid Jabbar, Jun-Dong Cho, and Sangmin Bae. 2019. "Indoor Positioning System: A New Approach Based on LSTM and Two Stage Activity Classification" Electronics 8, no. 4: 375. https://doi.org/10.3390/electronics8040375
Note that from the first issue of 2016, this journal uses article numbers instead of page numbers. See further details here.