A Multispectral Backscattered Light Recorder of Insects’ Wingbeats
by
 , ,
, ,
Iraklis Rigakis
1, 
Ilyas Potamitis
2,*,
Nicolaos-Alexandros Tatlas
1,
Ioannis Livadaras
3 and
Stavros Ntalampiras
4 1
Department of Electrical and Electronics Engineering, University of West Attica, 12241 Athens, Greece
2
Technological Educational Institute of Crete, 71410 Heraklion, Greece
3
Institute of Molecular Biology and Biotechnology of the Foundation for Research and Technology Hellas (IMBB-FORTH), 71110 Heraklion, Greece
4
Department of Computer Science, University of Milan, 20133 Milan, Italy
*
Author to whom correspondence should be addressed.
Electronics 2019, 8(3), 277; https://doi.org/10.3390/electronics8030277
Submission received: 10 January 2019
/
Revised: 17 February 2019
/
Accepted: 23 February 2019
/
Published: 2 March 2019
(This article belongs to the Special Issue Signal Processing and Analysis of Electrical Circuit)
Abstract
:Most reported optical recorders of the wingbeat of insects are based on the so-called extinction light, which is the variation of light in the receiver due to the cast shadow of the insect’s wings and main body. In this type of recording devices, the emitter uses light and is placed opposite to the receiver, which is usually a single (or multiple) photodiode. In this work, we present a different kind of wingbeat sensor and its associated recorder that aims to extract a deeper representational signal of the wingbeat event and color characterization of the main body of the insect, namely: a) we record the backscattered light that is richer in harmonics than the extinction light, b) we use three different spectral bands, i.e., a multispectral approach that aims to grasp the melanization and microstructural and color features of the wing and body of the insects, and c) we average at the receiver’s level the backscattered signal from many LEDs that illuminate the wingbeating insect from multiple orientations and thus offer a smoother and more complete signal than one based on a single snapshot. We present all the necessary details to reproduce the device and we analyze many insects of interest like the bee Apis mellifera, the wasp Polistes gallicus, and some insects whose wingbeating characteristics are pending in the current literature, like Drosophila suzukii and Zaprionus, another member of the drosophilidae family.
1. Introduction
This work belongs to a broader context of applications that relate to automated insect surveillance of insects of economic and hygienic importance. In order to monitor the presence and density of insects, as well as design policies and apply measures, entomologists deploy a high number of traps that are currently checked manually [1]. Our goal is to automate the reporting procedure of sampled insect fauna without involving a human in the loop. To this end, we embed optoelectronic sensors in typical traps that, depending on the situation, count insects, discern sex and species of captured insects, report daily results, wirelessly, to remote servers, and update infestation maps, decision support systems and predictive analytics. To give some lucid examples of how things are already evolving in several application areas we are involved, we report the completed tasks as well as their technological readiness level (TRL) (EC-H2020 definition):
- (a)
- In the context of the IoBee project (https://cordis.europa.eu/project/rcn/210011_en.html), e-gates applied in the entrance of beehives measure the bee traffic and discern the presence of a drone from a worker and inform for the case of an outgoing queen (TRL-9).
- (b)
- In the context of the REMOSIS project (https://cordis.europa.eu/result/rcn/230808_en.html), optical counters of mosquitoes being sucked into commercial traps have been upgraded to sensors that discriminate sex and species (TRL-8).
- (c)
- In the case of insect traps that are based on pheromones to attract targeted insects, such as the grain pitfall for stored-products insects, Picusan traps for the red palm weevil, Lindgren and funnel traps [2], an optical counter is incorporated, and the accuracy in insect counts relies on the effectiveness and specificity of the pheromone attractants (TRL-9).
Cases (a) and (c) are simple in the sense that they count insects that pass through specific constrictions and quantify their size based on the measured optical intensity variation between an emitter and a receiver. For these applications, we recommend a simple optical counter based on the extinction light. There are other cases, however, where there are no widely accepted pheromones that attract both sexes (entomologists are especially interested in female counts); therefore, a general food bait is used (i.e., in the case of some fruit flies or sent in the cases of mosquitoes). In such cases, we rely on the wingbeat of the incoming insect and the analysis of its frequency content to classify sex and/or species identity [3,4]. In Reference [5], we have demonstrated that a backscattered light signal originating from an insect is better that the extinction light provided by the same wingbeat event in terms of signal to noise ratio (SNR) and number of harmonics standing out of the noise floor. In this work, we elaborate on this finding and the new accomplishments are that we expand to a multispectral sensor configuration that integrates recordings from multiple orientations. The sensor aims to extract complementary information from the microstructural and melanization features of the wing and coloration of the main body of the species. The information contained in the samples of these recordings will provide complementary information and precise quantification of size on the difficult task of discerning morphologically similar insects whose wingbeat spectrum may overlap significantly in the frequency domain. Note that, although we present a stand-alone device as in References [6,7,8], it is designed in a way that is detachable from its base and its size is reconfigurable so that it can take different forms depending on the e-trap in which we are interested in embedding it.
There are currently two approaches based on optical technology (excluding camera-based vision): a) the e-traps [2,3,4,5], and b) the light detection and ranging (LIDAR) based approaches [9,10,11,12].
E-traps sample the insect fauna based on baits and usually aim at capturing target-specific insects. They try to locate the onset of an infestation, the correct timing to apply treatment, or to assess the after-treatment impact. LIDAR technology aims to characterize insects over larger distances and enable the mapping of densities and fluxes on very short time scales due to the large number of insect counts. E-traps can be made of low-cost elements such as LEDs, photodiodes, and acrylic lenses, and therefore, it is possible to deploy a large number of traps and still have a cost-effective monitoring plan. LIDAR technology is orders of magnitude more expensive and requires an external power supply. The techniques are suited for different kinds of studies.
The paper is organized as follows. First, the methodology to retrieve the optical signals and their frequency content is described in the “Materials and Methods” section. Then, we present experimental results based on recordings of different species of insects some of them never reported in the literature (i.e., Zaprionus, Pollistes galicus). Finally, we discuss, based on our experimental results, the possibilities of different spectral bands for gender and species identification.
2. Materials and Methods
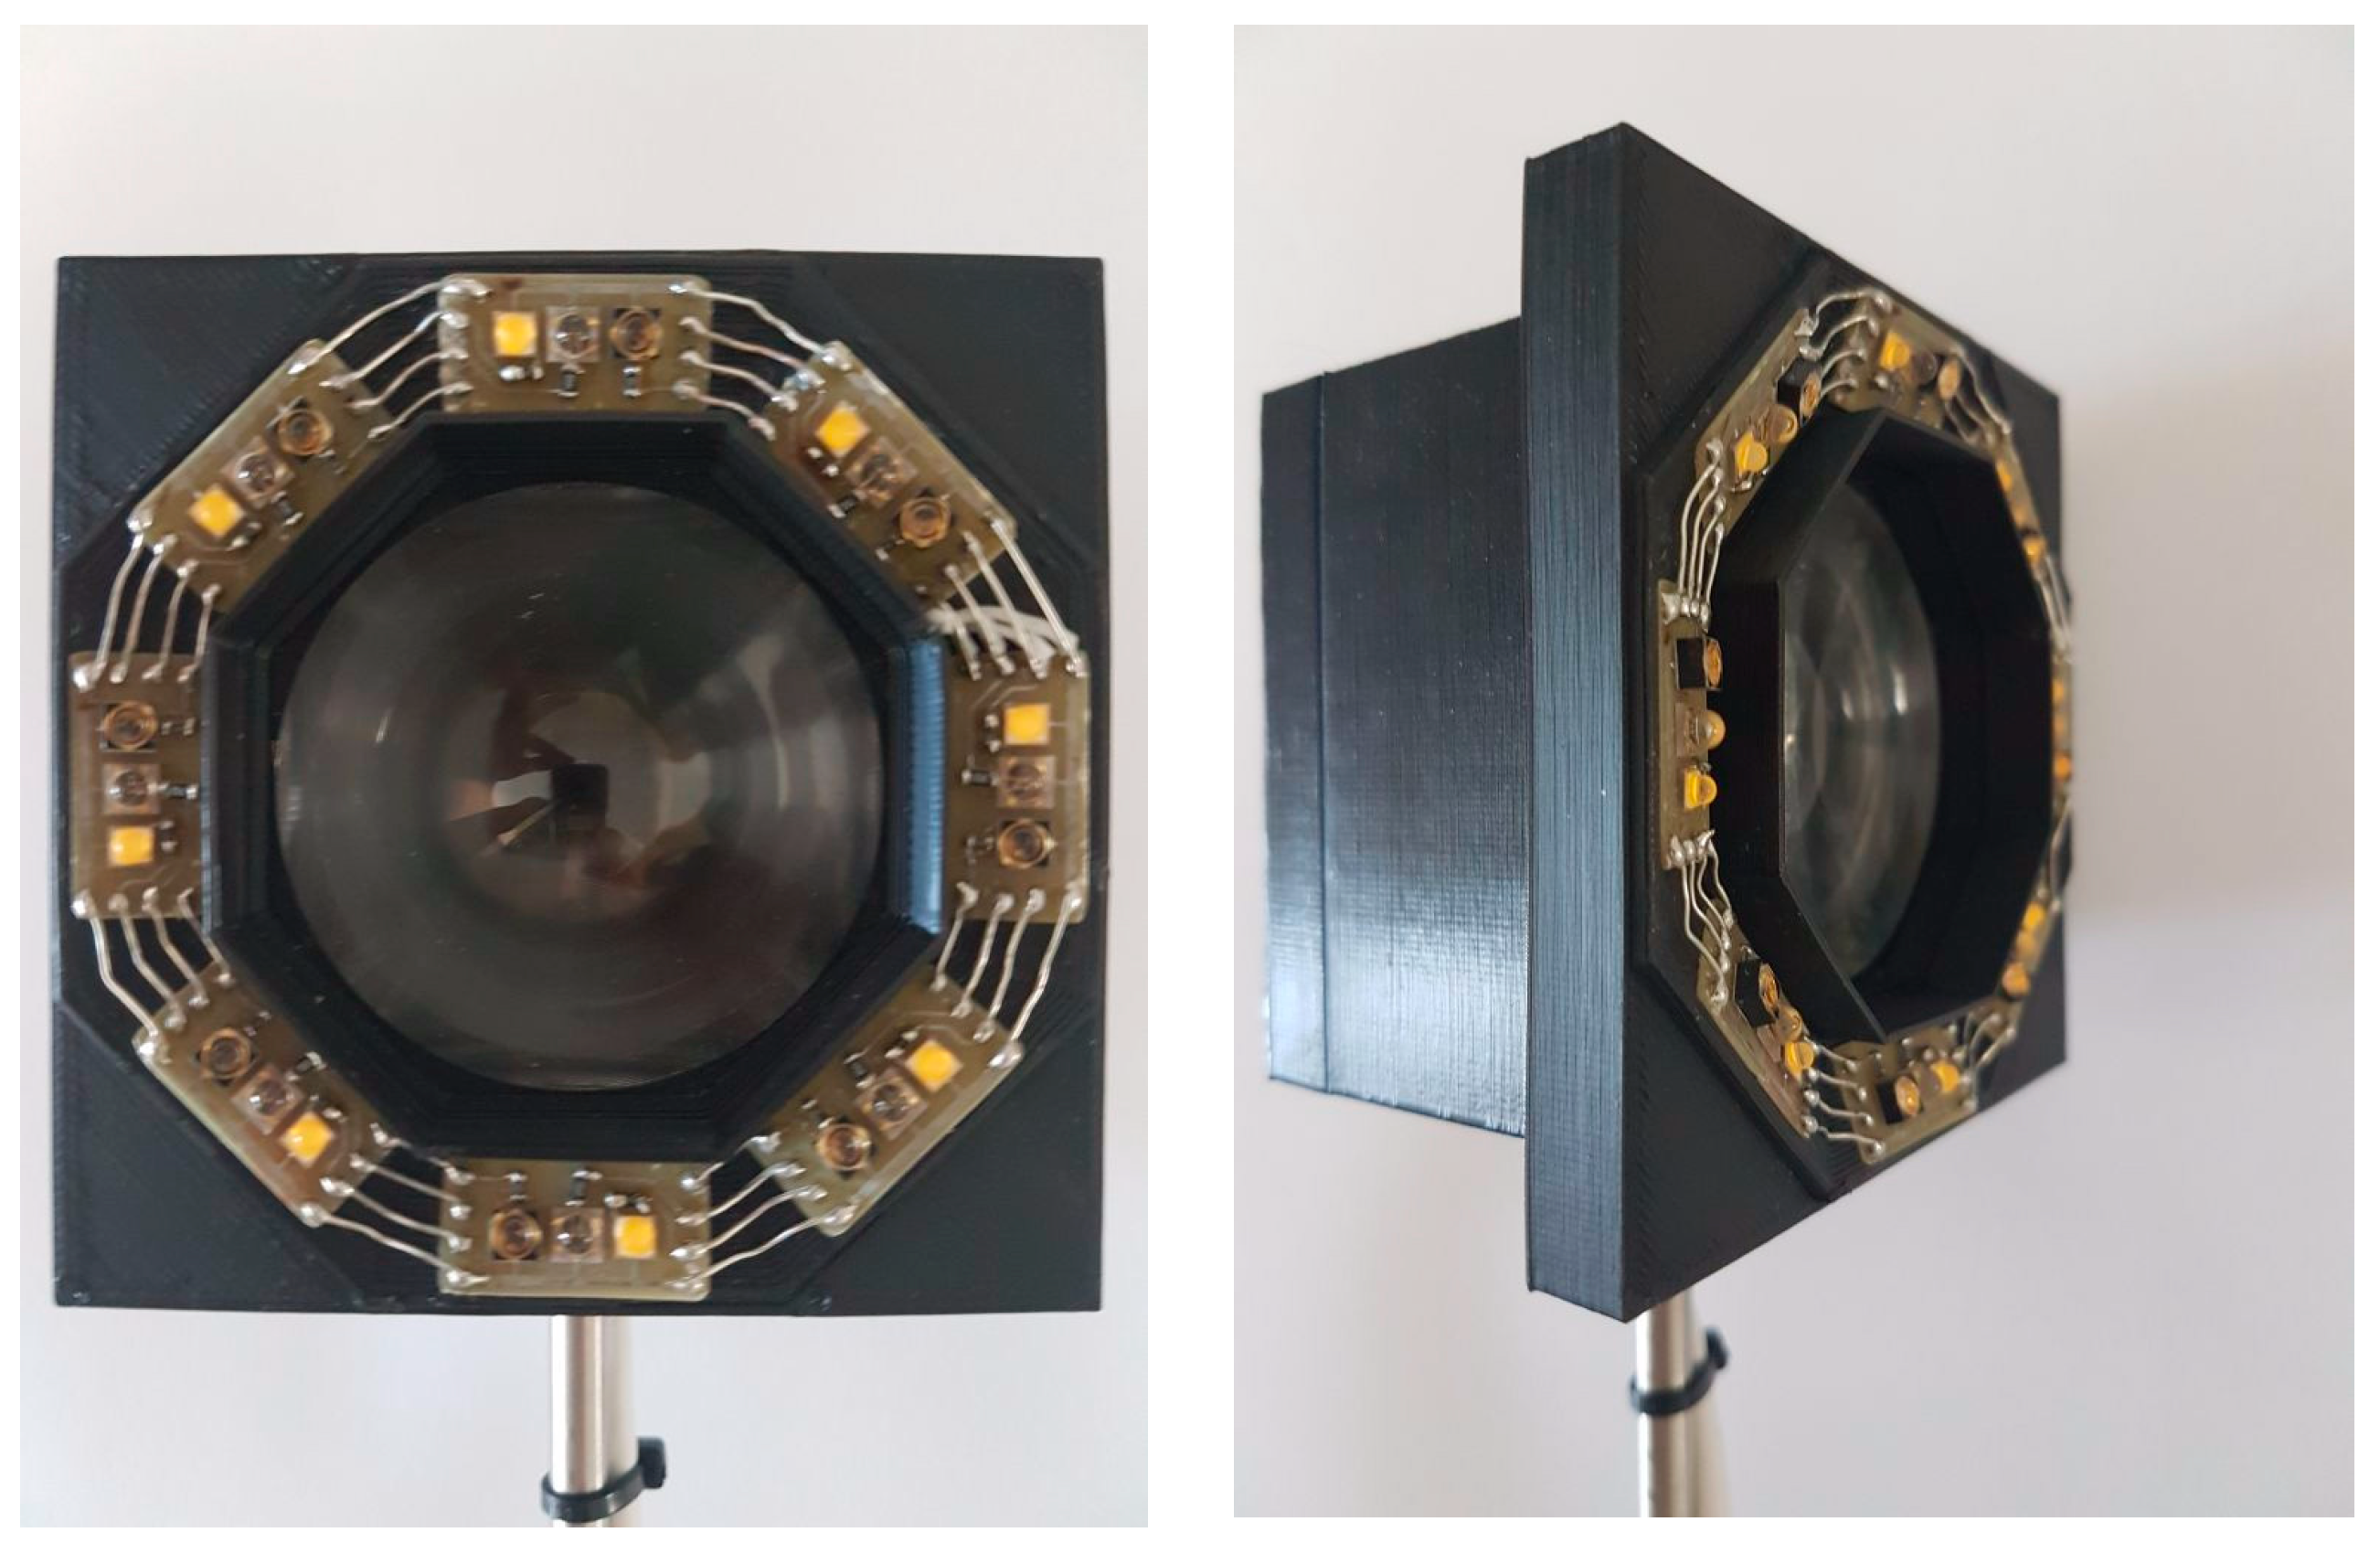
It has been reported in LIDAR applications that near-infrared wavelengths (NIR), e.g., 808 nm, are affected by melanization, and that different spectral bands carry complementary information on the insect’s main body and wings coloration [10,11,12]. We pursue this direction by developing a device (see Figure 1) that examines the possibility of extracting more information about the cast shadow based on backscattered light recordings of wingbeat events under different spectral bands. In this task, we use three different LEDs (one in the visible frequency range (450–700 nm), one at 810 nm, and one at 940 nm).
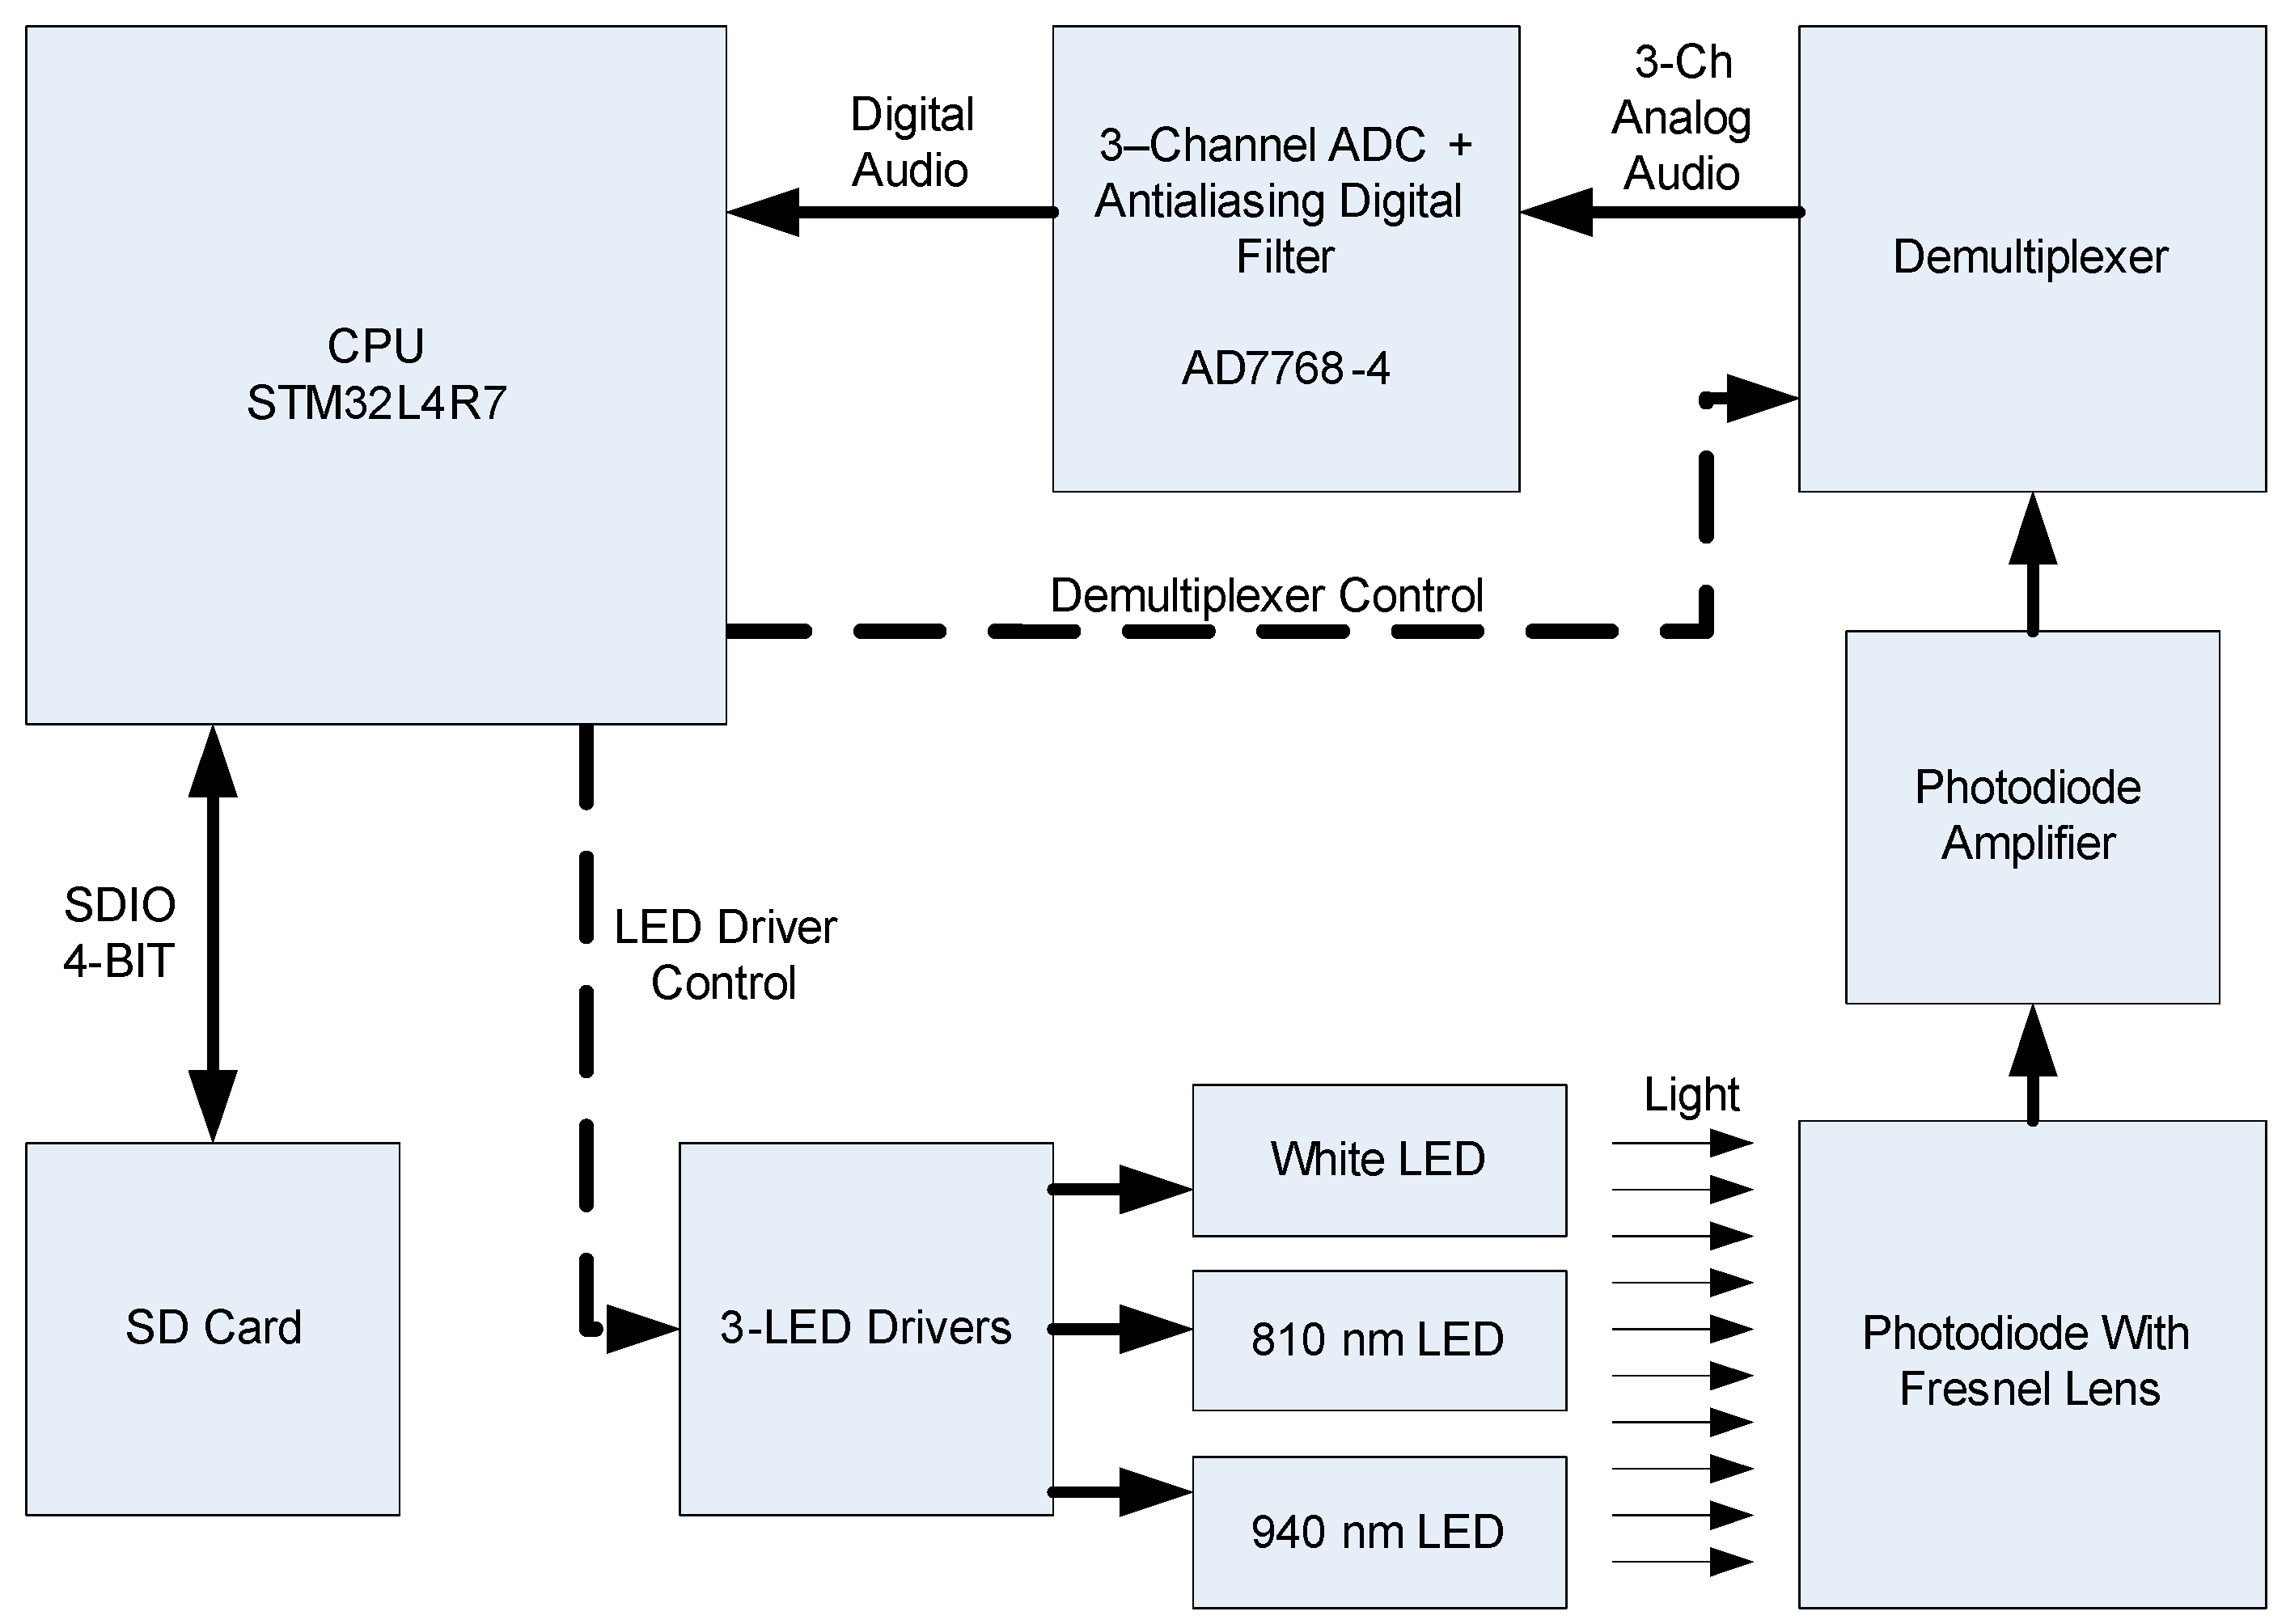
Note that this configuration is naturally expandable to more wavelengths that are distinct, but in this work, we are constrained by the cost of the LEDs, their operational wavelength, and their capability to operate at high frequencies. We illuminate the wingbeating insect from different orientations and we average on a per wavelength basis to achieve a smoother signal. In brief, the main concept of the sensor is as follows: the central processing unit (CPU) turns on the three circular arrays of eight LED’s successively, each having the same wavelength. The Fresnel lens focuses the backscattered light stemming from the wingbeating insect onto the photodiode. The photodiode directs its output to the demultiplexer that has three sample-and-hold circuits. The demultiplexer sends its output to a multichannel analog to digital converter (ADC) and the latter back to the CPU, and finally a wav-type recording to the secure digital (SD) card (see also Figure 2). In detail, the CPU (ST STM32L4R7 Microelectronics. 39, Chemin du Champ des Filles, Geneva, CH 1228, Switzerland) (Figure A1) produces the synchronization signals for all system units, receives the digital words from the analog to a multichannel analog to digital converter (ADC), and stores the signals to a three-channel 16 KHz 24-bit wav in the SD card of the recorder. We place the photodiode (TEMD5080X01, Vishay Intertechnology, Malvern, Pennsylvania, USA) at the focal point of the Fresnel lens (Fresnel Technologies Inc., 101 W. Morningside Drive Fort Worth, TX 76110, Part number: 3*). The three LED types are white: GW CS8PM1.PM and 810 nm, SFH4780S (both from Osram, Munich, Germany) and the 940 nm L1I0 (LUMILEDS, San Jose, CA 95131, USA) and emit for 20.8 μs. The ADC (Figure A2) is based on the AD7768-4 IC (Analog Devices, One Technology Way Norwood, MA, USA). The ADC receives the three analog outputs of the demultiplexer (Figure A3) and converts them to digital words. The output signal from the photodiode is amplified (Texas Instruments, Dallas, Texas 75266-0199, OPA380 transimpedance amplifier (Figure A4)) and then driven to the demultiplexer. It is worth mentioning that the feedback loop in Figure A4 ensures the possibility of operating the device in the presence of the sun and allows for considerable power saving in field operation. The demultiplexer (Texas Instruments analog switch TS12A44514 and OPAMP OPA4376 as a Sample & Hold amplifier) separates the photodiode’s output to three different signals, one for each band, and drives it to the three-channel ADC. The LED drivers (Figure A5) produce consecutive pulses to three LED arrays (Figure A6) with constant current controlled by the CPU (see Figure 3 for the timing of operations). The CPU also controls the current level of each wavelength. It is based on Infineon (Am Campeon 1-15, 85579 Neubiberg, Germany) metal-oxide-semiconductor field-effect transistor IRF7341, on OPAMPs ADA4805 of Analog Devices (Norwood, MA 02062) and Texas Instruments TS12A44514 analog switches. The multichannel sigma-delta ADC converter AD7768-4 receives the three analog audio signals and sends the digital words to the CPU using the time division multiplexing (TDM) output.
Powering of the LEDs is carried out through the TPS54302 IC of Texas Instruments (Figure A7 left) and the device state (trigger, SD card, power status) is indicated in the front LEDs of the device (Figure A7 right).
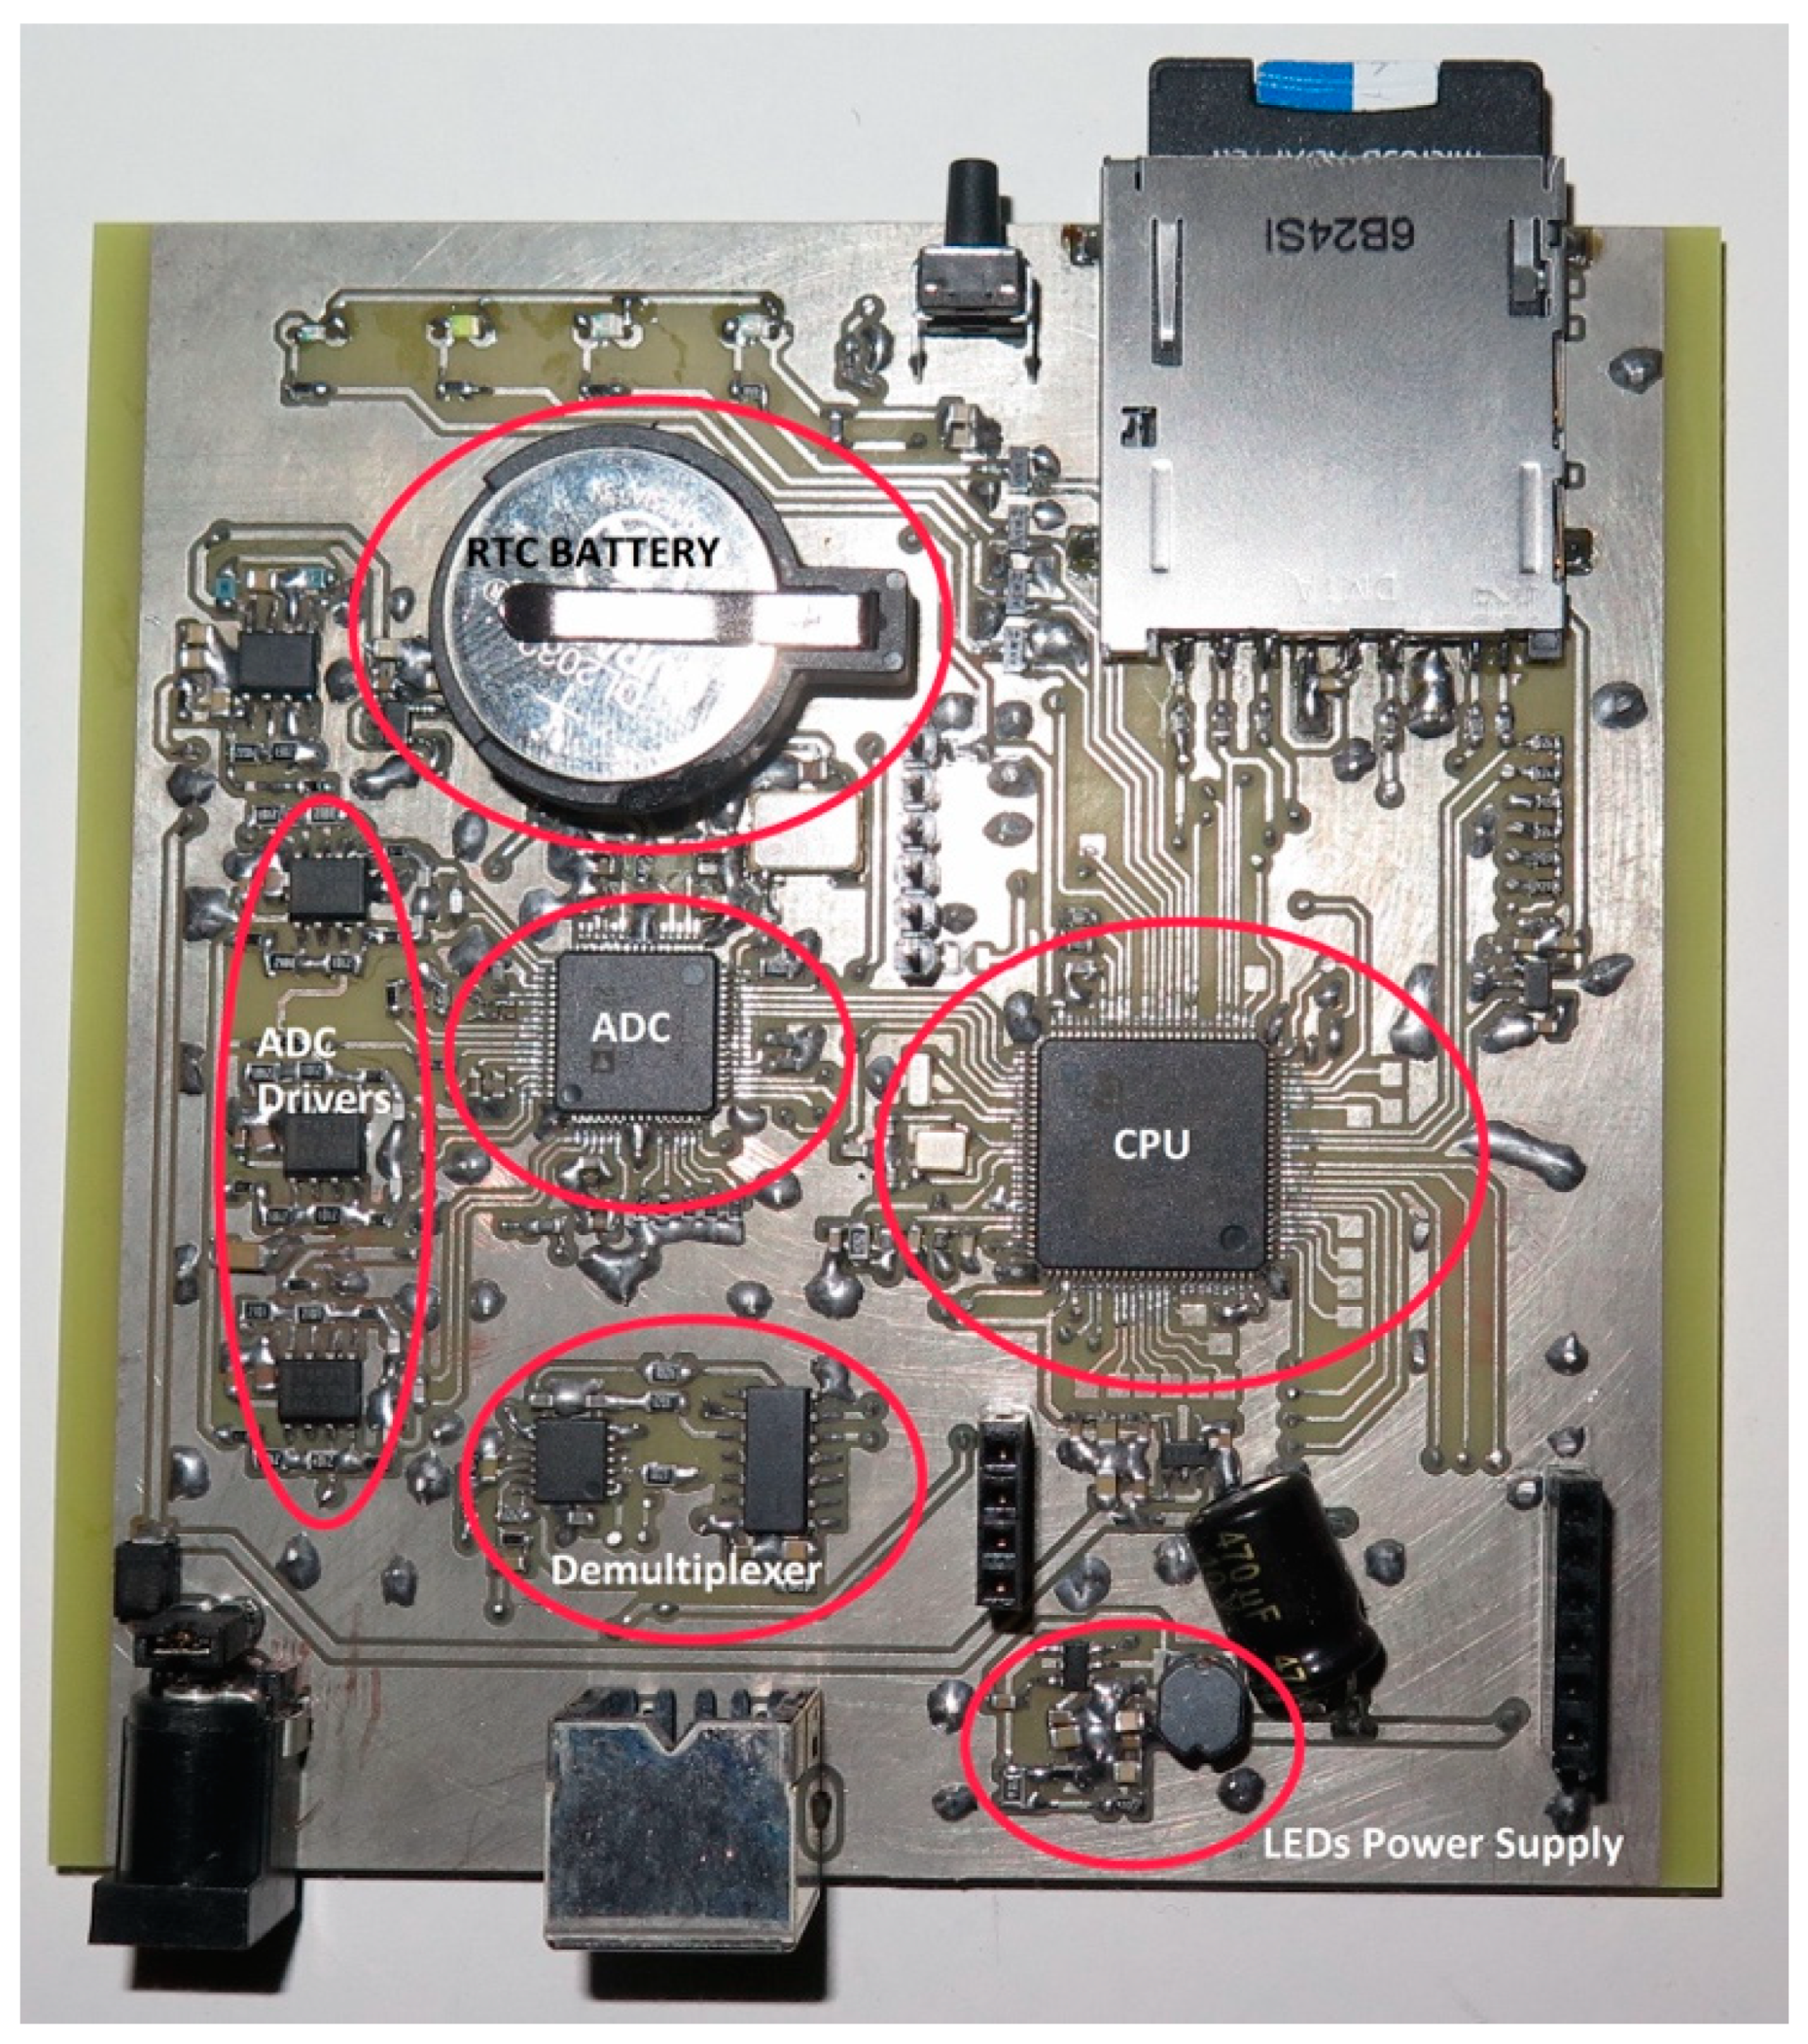
We show an internal picture of the completed device in Figure 4 and a cost analysis in Table A1 in Appendix A.
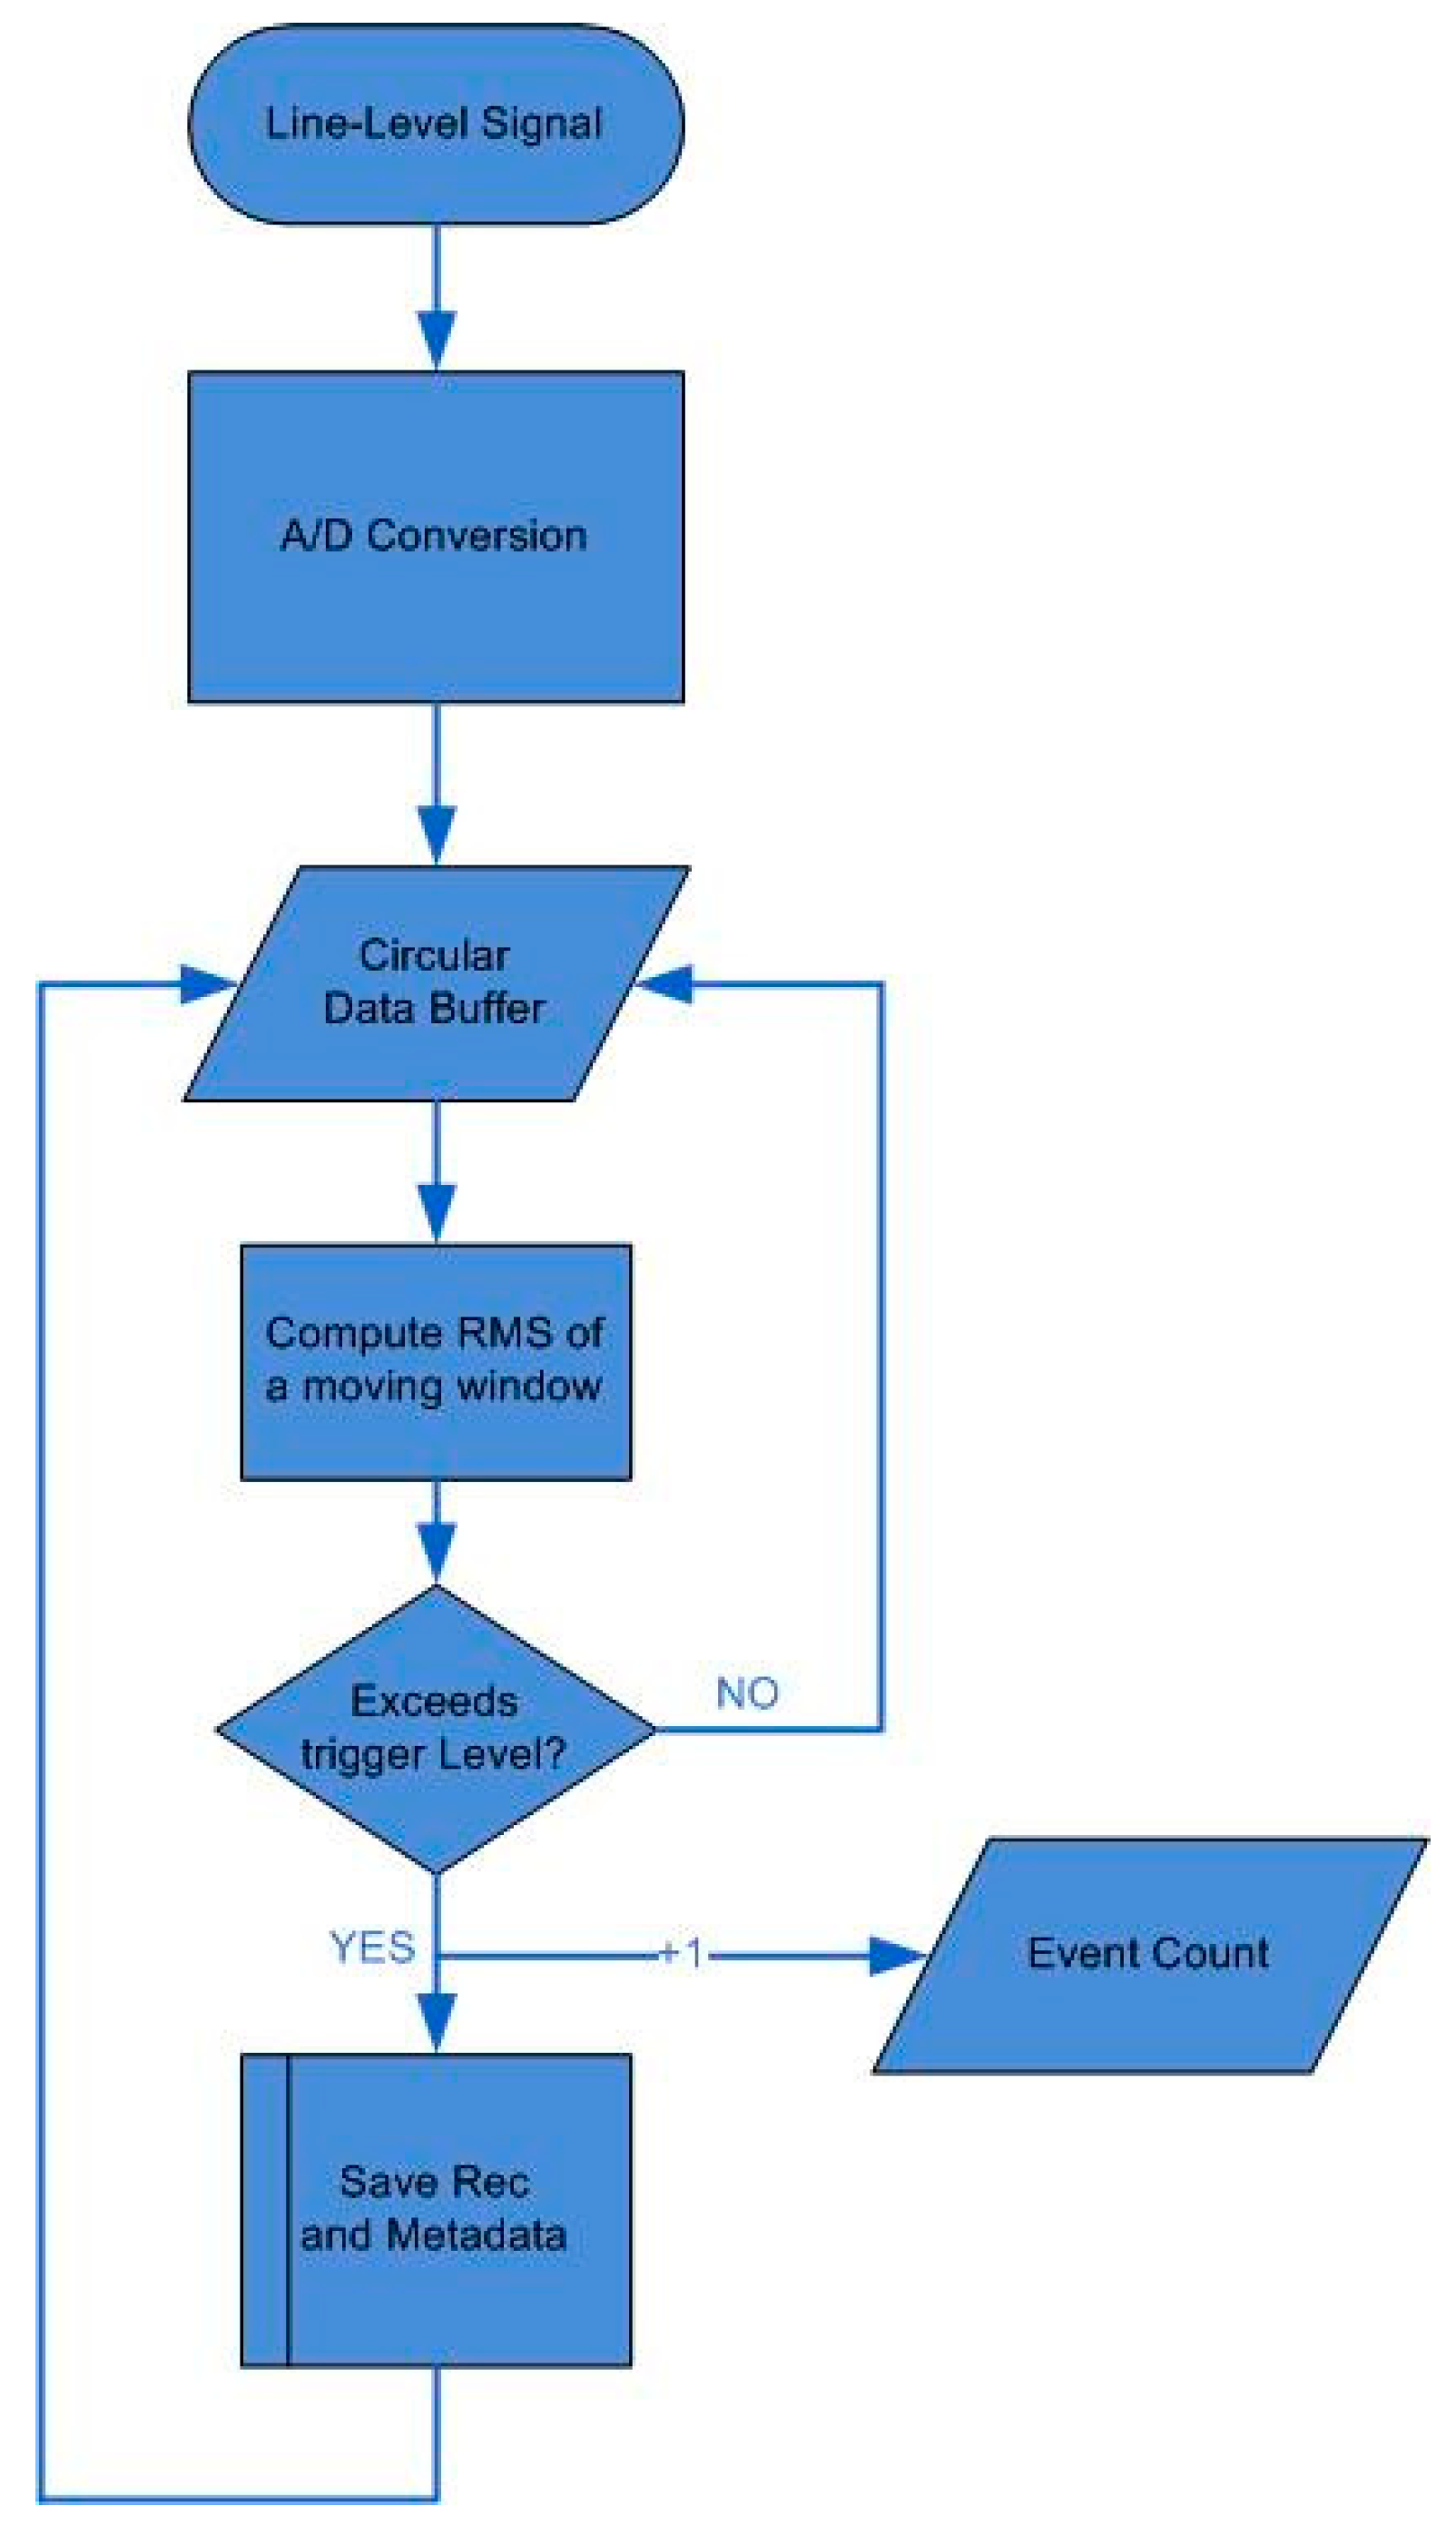
Regarding the software, the embedded microprocessor runs a constantly looping program that processes data captured by the sensors. The board is programmed in C/C++. The digital audio output from the optoelectronic sensor is copied to six circular buffers. The first three buffers are used to monitor the backscattered signal’s root-mean-square (RMS) using a window of 128 samples (16 ms in 8 kHz sampling rate). The other three circular buffers of 32 kwords (a word equals 32 bit in this processor) each store the recoding of each band. If any of these bands exceeds a common threshold, it triggers the recording process for all bands (see Figure 5). The recordings of the signal are coded in 24-bit resolution, at an 8 kHz sampling rate. The first 20% of the samples are drawn before and up to the triggering point and 80% after that point in order to ensure that the onset of a wingbeat event is not lost. Wingbeat events are short in time for fast flying insects and one cannot afford discarding any useful part of the signal such as the onset. The sampling frequency, window length, and triggering threshold are pre-stored in the SD-card of the system and the settings (i.e., sampling frequency, triggering level, and record length in samples) are read once from the SD card during powering-on. The software is written in C language using the IAR Embedded workbench. The programming of the flash memory was carried out using the ST-Link V2 programmer. The code initialization was done using the STM32CubeMX of ST. For programming the peripheral sub-components, such as the SD and ADC, we made use of the STM32 HAL drivers. The control signals and data transfers were done using the direct memory access (DMA) controller of STM32L4R7.
Regarding the insect specimens, we collected the insect species Zaprionus (Diptera: Drosophilidae), Drosophila suzukii (Diptera: Drosophilidae), and Drosophila melanogaster (Diptera: Drosophilidae) from the area Gouves, Chersonisoss Crete, March–April 2017. The insects have been transported to an entomological laboratory to breed and reproduce. Their diet contained sugar, yeast, agar, cornflower, and nipogen. Their breeding conditions had been kept constant at 25 °C, 60% relative humidity following a cycle of 14 h of light and 10 h of darkness. After breeding, the adult insects have been transferred to different cages 50 × 60 cm and the device has been inserted in turn into the cages.
3. Results
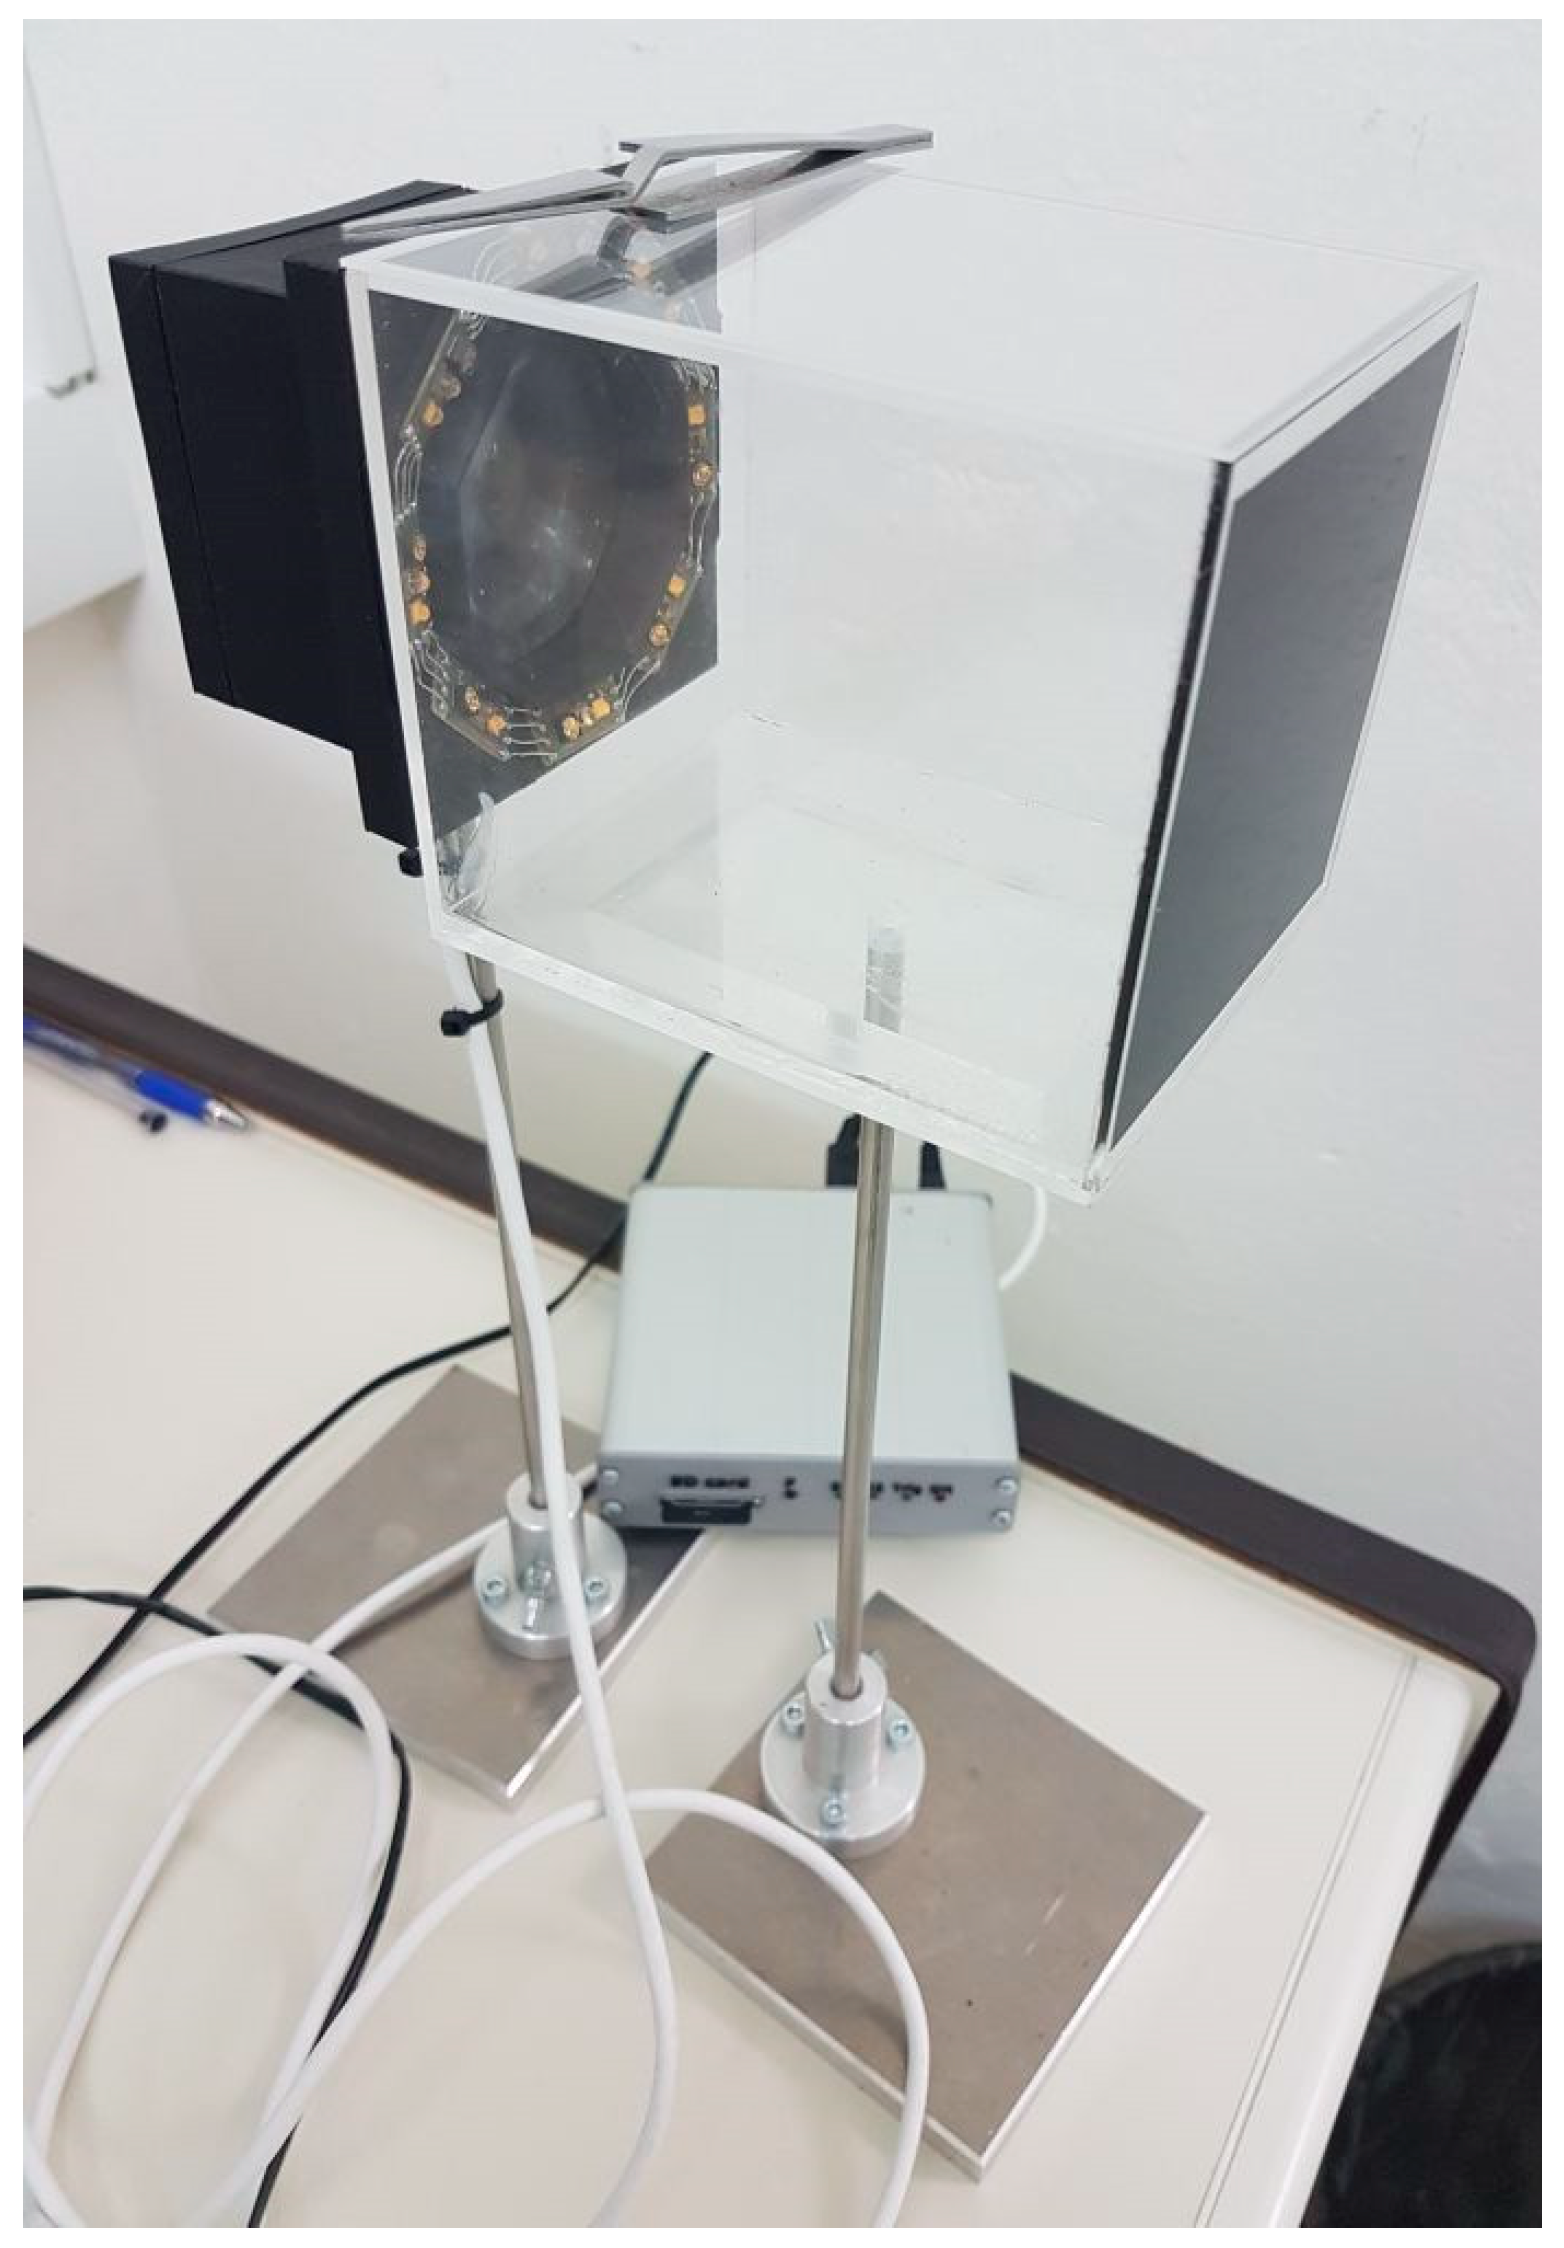
Figure 6 demonstrates the various ways we can use the device. One can tether an insect with an inverted tweezer inside the sensor’s probe volume, or confine the insect in a Plexiglas box, or insert the sensor in an insectary cage that contains the insects of interest without the Plexiglas box.
In this work, we present multispectral recordings from various flying insects using the confinement into a transparent box. The reflected light relates to the refractive index of the wing membrane and the glittering of the insect [10,11,12]. Therefore, the intensity of light in the absence of an insect is theoretically zero and practically equal to the minimum light reflection stemming from the black termination plane. We performed many recording sessions for various insects and the main results of this experiment show that:
- (a)
- Walking insects are efficiently detected due to the backscattered light from their body.
- (b)
- We visually confirmed that all wingbeat events observed in the confinement box were registered, and the frequency content of the recording was clearly resolved.
- (c)
- The wingbeat “signature” of insects in the spectral domain is consistent and repeatable with small interspecies variation.
- (d)
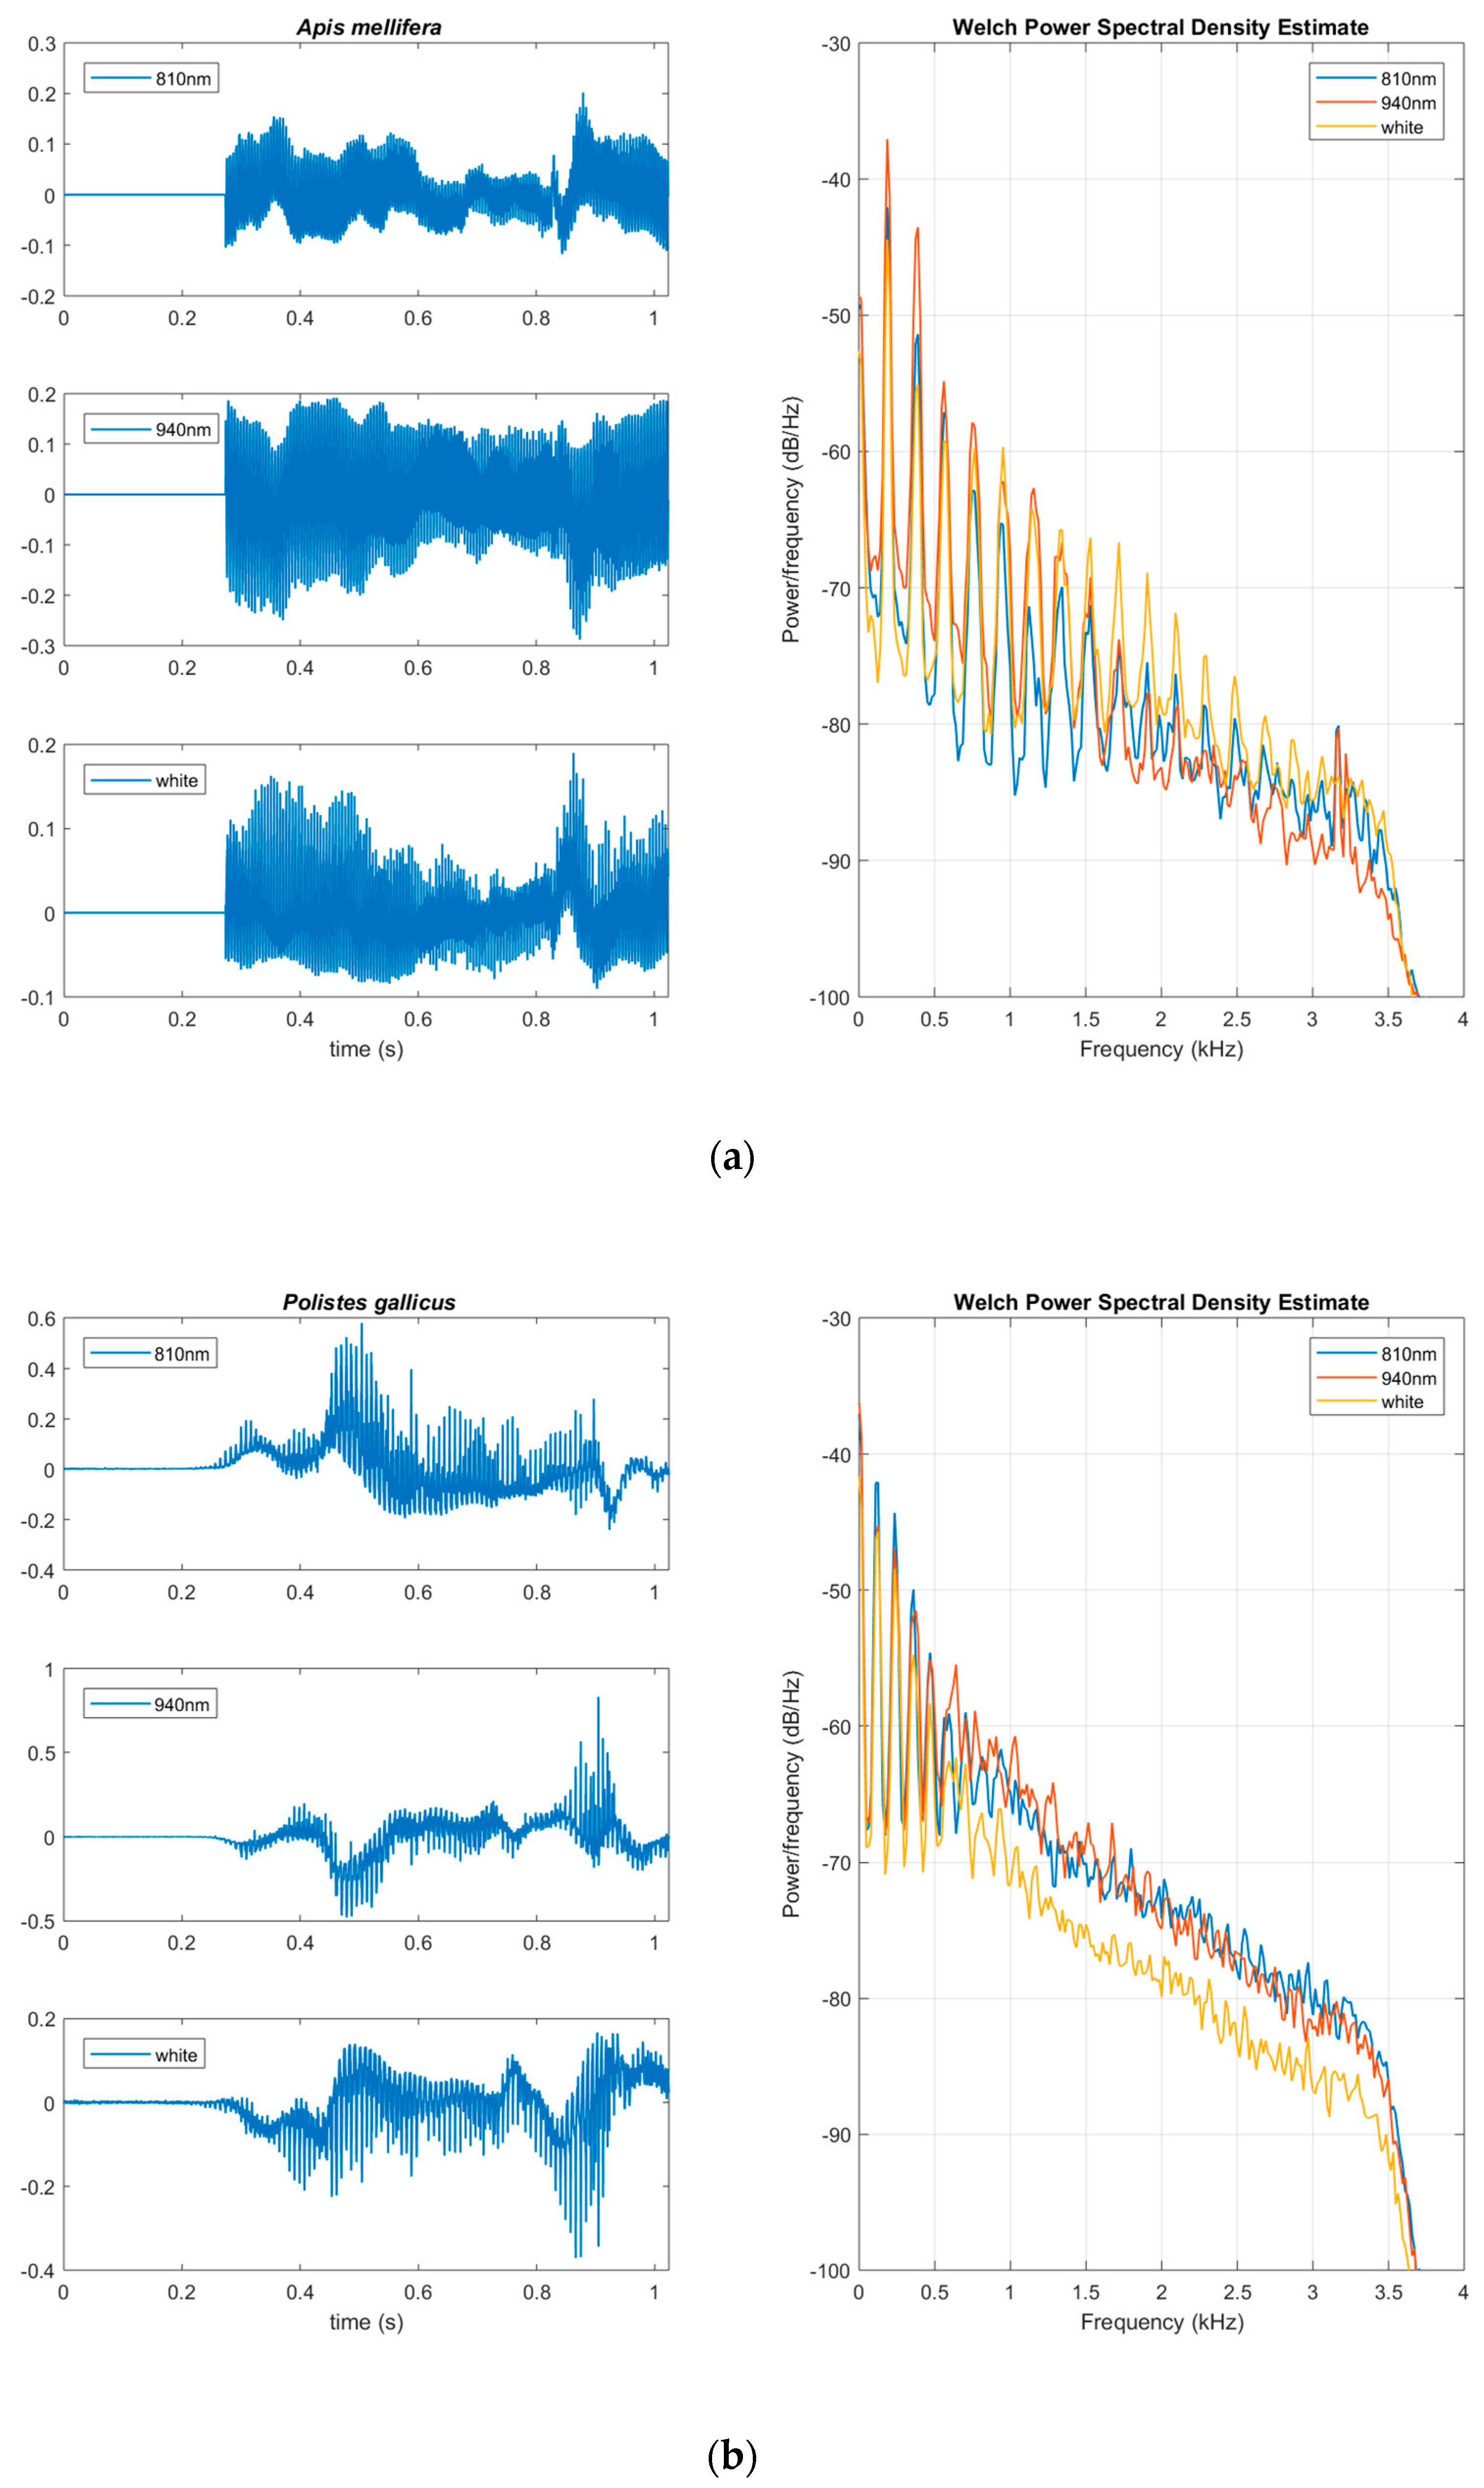
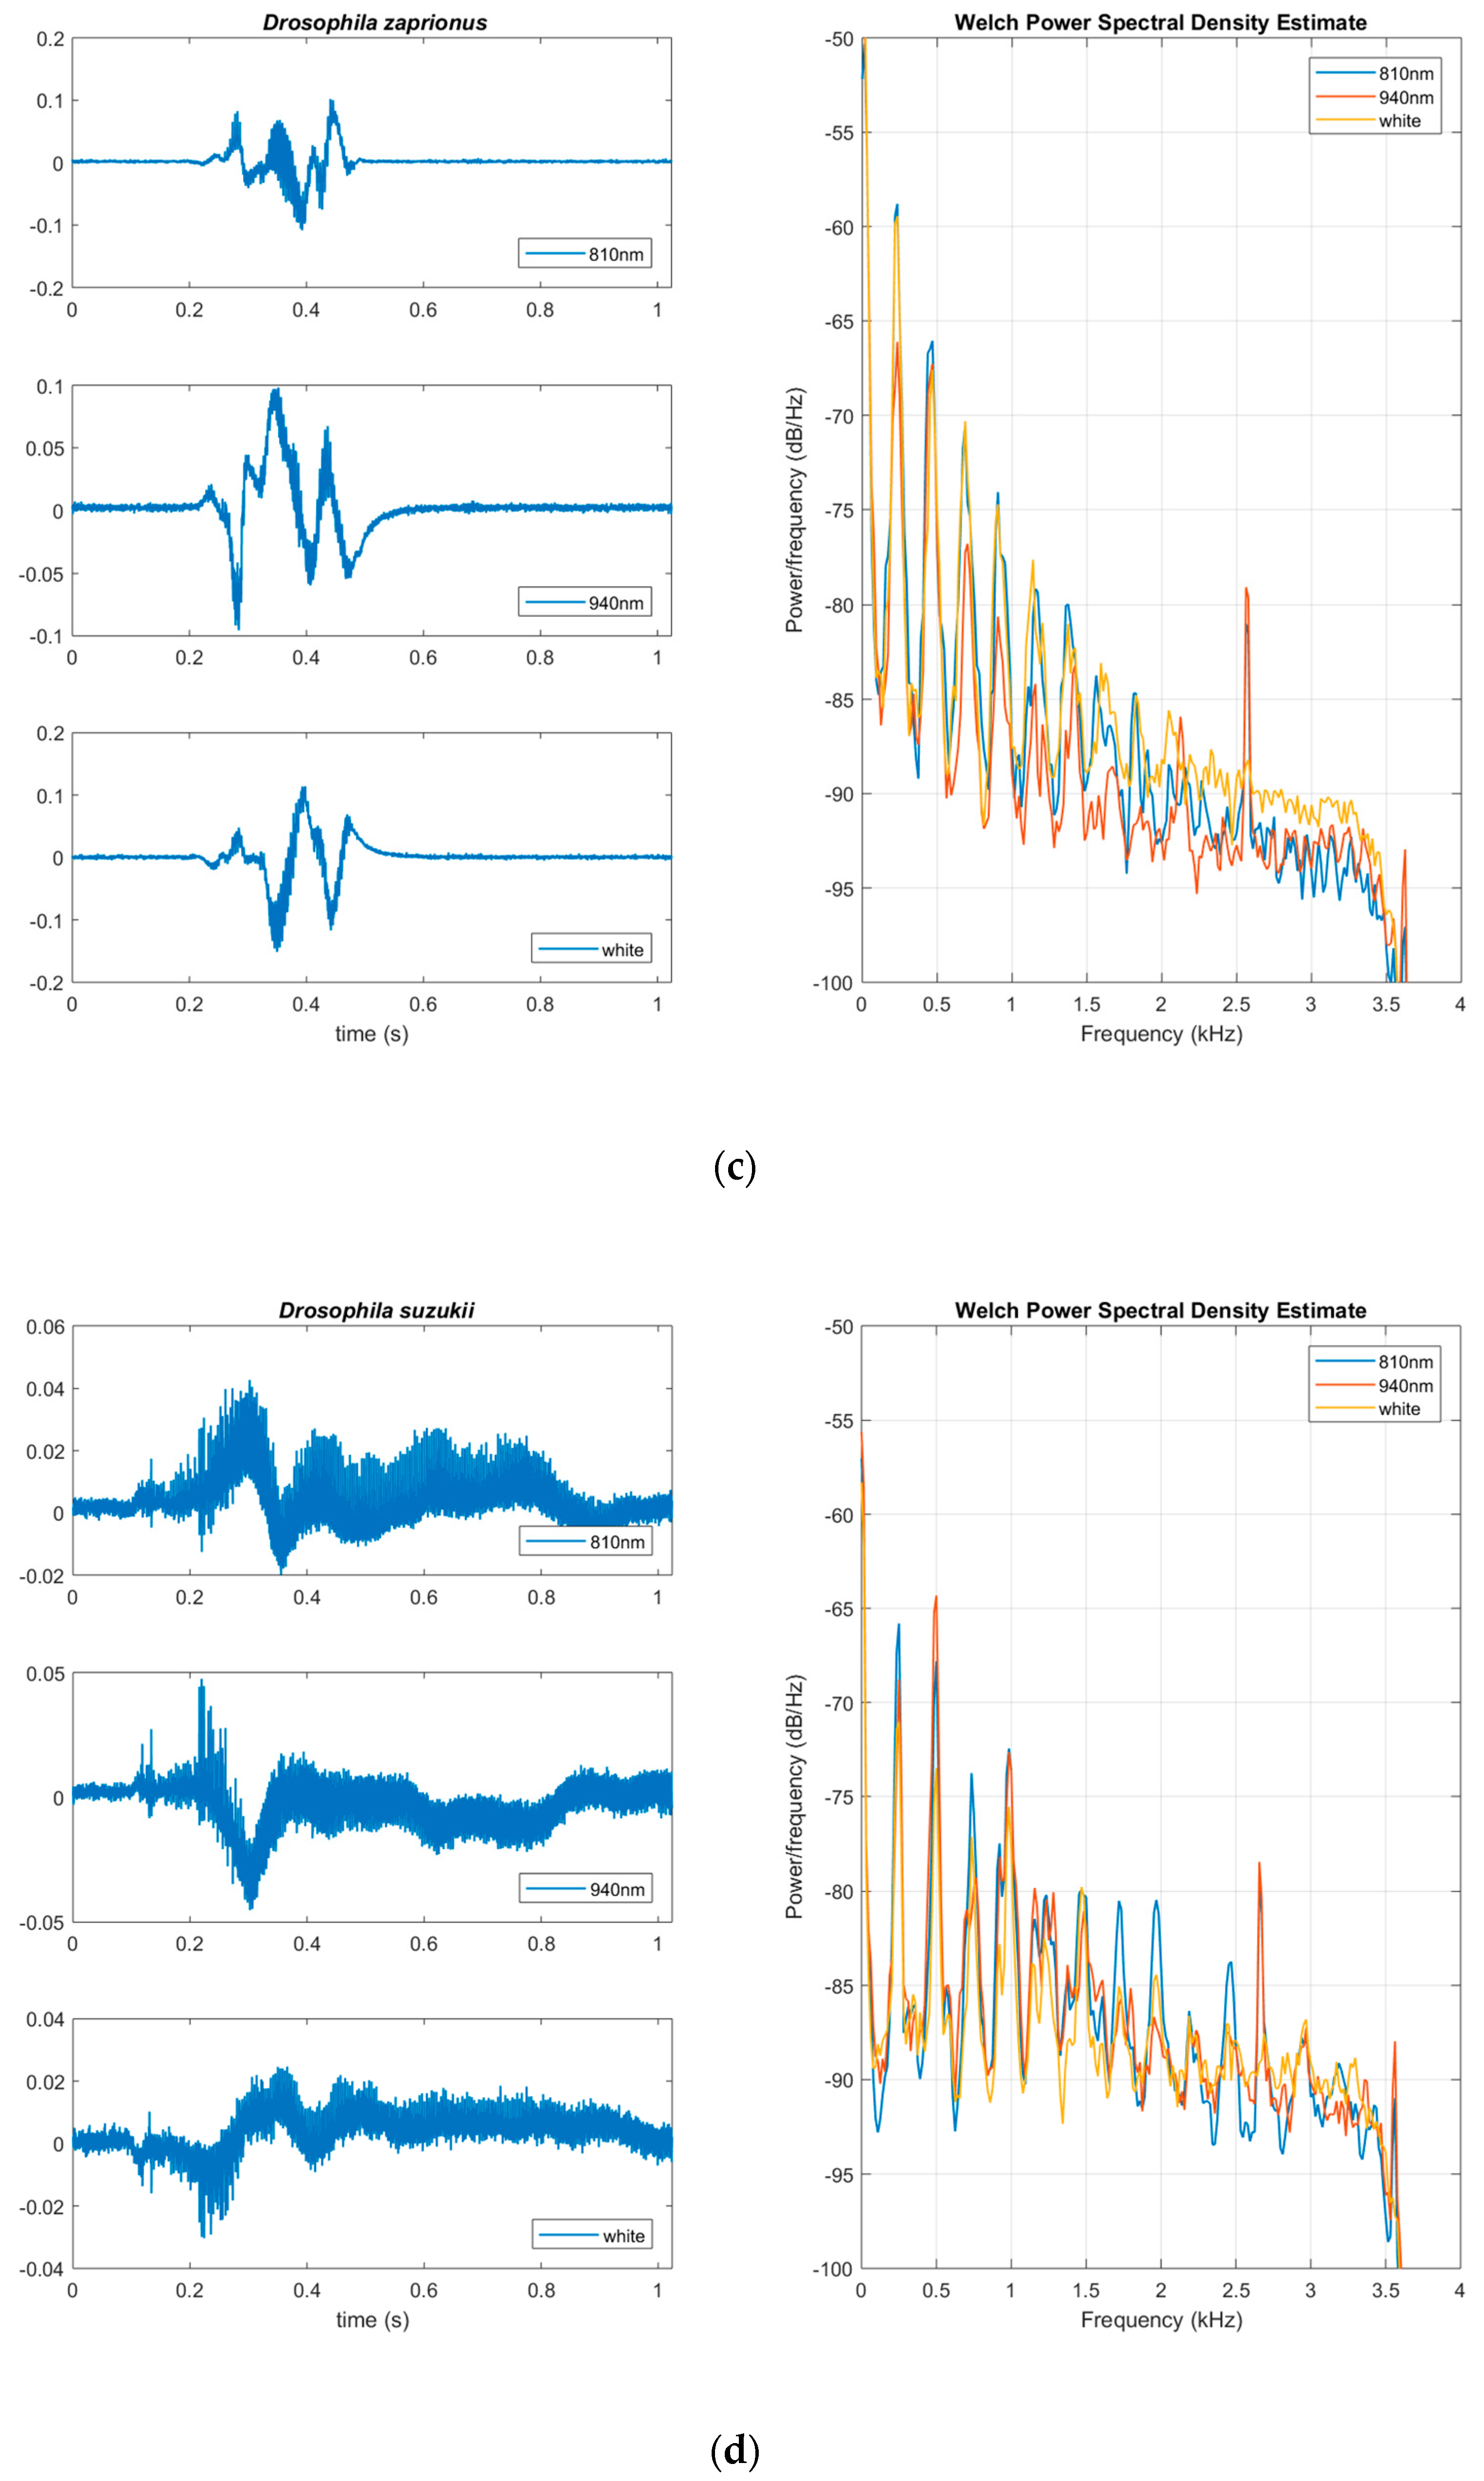
- The signal to noise ratio is very high (30–35 dB) and the number of harmonics often exceeds 20 (see Figure 7a–d).
- (e)
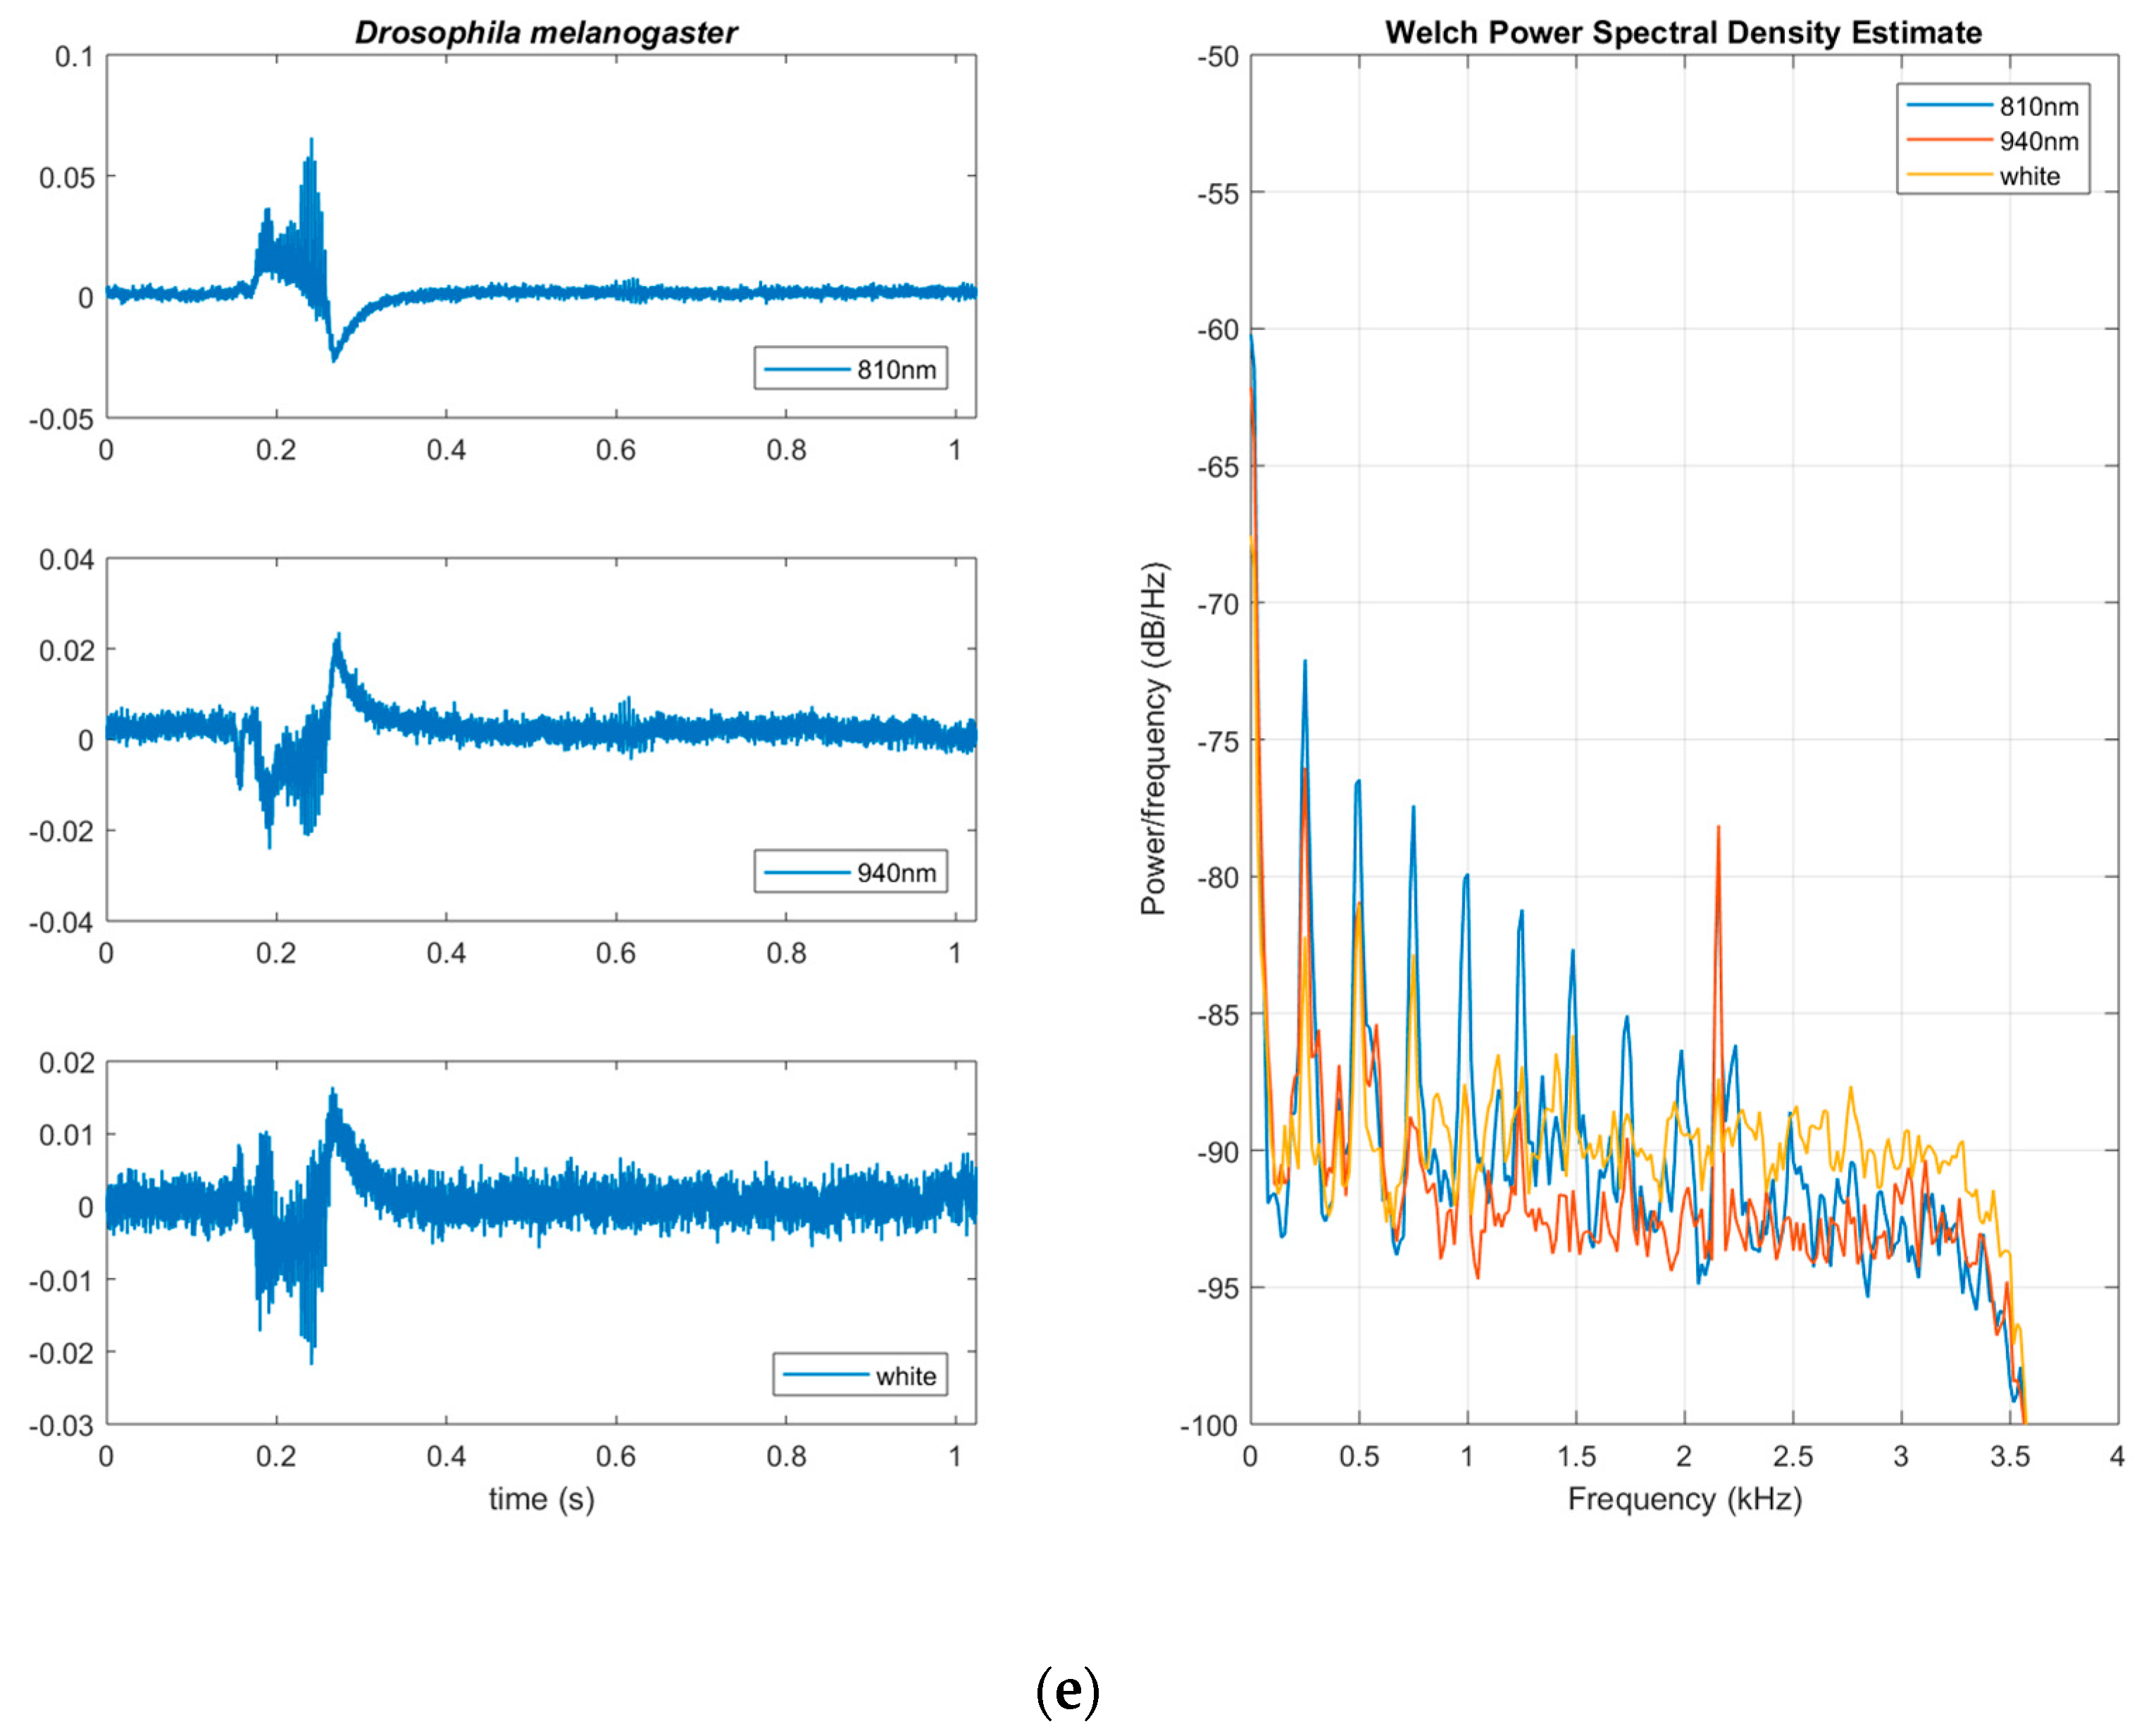
- One can see that the power spectral density (PSD) of the different spectral bands are not identical (see Figure 7a–d), and this is an encouraging observation as we aim at extracting complementary information. We derive the PSD estimate of the discrete-time signals using Welch’s averaged, modified periodogram method using a Hanning window of 512 samples, 50% overlap, and 512 samples Fast Fourier Transform (FFT) at 8 kHz sampling frequency. The spectral peaks, corresponding to the fundamental frequency and their harmonics reside on the same frequencies as expected since they relate to the same insect and wingbeat event. However, the details of the spectral signature, especially at high frequencies, are different for each spectral band.
- (f)
- We can discern morphologically different insects, such as the bee, the wasp, and the fruit flies, as they have very different wingbeating frequencies (Apis mellifera: 190 Hz, Polistes gallicus: 124 Hz, Zaprionus: 220 Hz, D. suzukii: 250 Hz, D. melanogaster: 250 Hz) and distribution of power over harmonics. We took all measurements at the same temperature.
- (g)
- The light intensity close to the DC frequencies can quantify the size of the insect. In terms of physical size and in descending order the insects are ranked as follows: bee–>wasp–>Zaprionus–>D. suzukii–>D. melanogaster. The PSD plots in Figure 7 follow the same ranking. Note that size classification is correct not only for the gross cases of a bee versus fruit flies, but also among fruit flies, paving the way for automatic discrimination of similar fruit flies.
- (h)
- The spectral tilt in the PSD of large insects has a slope, whereas in small insects, it is more flat and we attribute this to their main body contribution.
- (i)
- The current implementation is sensitive to the AC frequency of artificial light and further development is needed to make it noise immune.
4. Discussion
Undoubtedly, any sensor type related to the context of our application, such as microphones and vision cameras, have advantages and disadvantages [13,14]. Multispectral imaging has been suggested in a different context to our work in agriculture and entomology [15,16,17]. From our point of view, optical sensors are the suitable choice for use in electronic insect gates and automatized insect traps working in the field because they record intermittently, i.e., on per event basis, and only if their probe volume (that can be shaped with proper lenses) is interrupted in contrast to the continuous recording of microphones. Microphones receive continuous input from an uncontrolled and unknown number of audio sources in the field and are not generally suitable for field applications. The proposed multispectral sensors do not require the bandwidth of a vision camera and do not face the difficulty of a photograph of a pile of insects that are not easily discernable in detail. Fresnel lenses provide an affordable way to collimate light, and therefore, it is possible to effectively avoid interferences from the sun or diffuse light sources. Using the sensor presented in this work, walking insects (e.g., bees and wasps) were efficiently detected and their presence was registered in the power of low frequencies around the DC level. The power level of the received light was suitable to rank insects according to their size. The wingbeat event could be easily discerned from a walking event due to the harmonic structure of the power spectral density of the former and the flat spectrum of the latter. The wingbeat “signature” of all insects in the spectral domain was consistent and repeatable [18]. The signal to noise ratio of the backscattered light sensor was at 30–40 dB and often reached 20–30 harmonics. Multispectral signatures look richer than the ones provided by simple one-band sensors but their advantage on classification improvement needs to be clarified and quantified with large-scale experiments (see References [19,20,21] for related work).
Future work will focus on different wavelengths with an aim to discern mosquitoes that have had a blood meal, or are dyed with fluorescent dust or carry a marker gene in the context of the sterile insect technique. The work in Reference [22] demonstrated that is possible to discern with high accuracy whether a mosquito carries a virus load based on NIR spectroscopy. While our current application constraints do not allow us to reach this level of analysis, our ultimate goal is to finally embed this kind of sensor in commercial mosquito traps. With the advance of high rate RGB wavelength demultiplexers [23] and all-optical neural networks [24], we envision that the size of the sensors will become smaller and artificial intelligence tools will be embedded in smart traps that will provide a detailed analysis of incoming insects based on their back-scattered multi-spectral signature. A dispersed network of “e-flowers” like the one depicted in Figure 1, when deployed in the field, could unobtrusively sample the insect’s fauna and report on insect densities that can be correlated to pollination studies (e.g., estimate insect counts and distribution of bees) or assess agricultural risks, e.g., due to aphids.
Author Contributions
Conceptualization, I.P.; methodology, I.P. and I.R.; software N.-A.T.; data curation, S.N.; writing—original draft preparation, I.P.; writing—review and editing, I.P. and N.-A.T.; visualization, S.N., I.L. bred the fruit flies recorded in this work. All authors have contributed have contributed equally to the work reported.
Funding
This research was funded by the European Commission H2020-EU.2. - PRIORITY ‘Industrial leadership, H2020-EU.3. - PRIORITY’ societal challenges, project IoBee: Beehive health IoT application to fight Honey Bee Colony Mortality, grant number 760342.
Acknowledgments
We thank Michael Weber [5] for fruitful discussions on the backscattered signal from insects.
Conflicts of Interest
The authors declare no conflict of interest. The funders had no role in the design of the study; in the collection, analyses, or interpretation of data; in the writing of the manuscript, or in the decision to publish the results.
Appendix A
Hereinafter, we present details schematics of the electronic device described in the text. Data supplemental to the main text is included in the directory of recordings.

Table A1.
Cost break-down of the multispectral sensor and recorder (Euros).
| Item | Manufacturer | Price | |
|---|---|---|---|
| Photodiode 1X TEMD5080X01 | Vishay Intertechnology, Malvern, USA | 1.56Ε | |
| LED GW CS8PM1.PM (8 pieces) | Osram, Munich, DE | 10.48E | |
| LED 810nm, SFH4780S (8 pieces) | Osram, Munich, DE | 39.02E | |
| LED 940nm, L1I0-094006000 (8 pieces) | LUMILEDS, San Jose, USA | 23.68E | |
| Fresnel lens, Part number: 3* | Fresnel Technologies Inc., USA | 25E | |
| CPU 1X STM32L4R7 | Microelectronics. Geneva, Switzerland | 12.67Ε | |
| Four-channel ADC AD7768-4 | Analog Devices | 16.89Ε | |
| ADC Drivers 3X THS4531 | Texas Instruments | 7.86E | |
| Demultiplexer | 1X OPA4376 | Texas Instruments | 3.27E |
| 1X TS12A44514 | Texas Instruments | 1.35E | |
| LED Drivers | 3X ADA4805 | Analog Devices | 11.52E |
| 1X TS12A44514 | Texas Instruments | 1.35E | |
| 2X IRF7341 | Infineon | 3.12E | |
| Power Supplies | 3X LP2985-33 | Texas Instruments | 1.48E |
| 1X ADP7104 | Analog Devices | 3.58E | |
| 1X TPS76901 | Texas Instruments | 0.74E | |
| 1X TPS54302 | Texas Instruments | 1.65E | |
| Passives | Resistors, Capacitors | 10E | |
Figure A1.
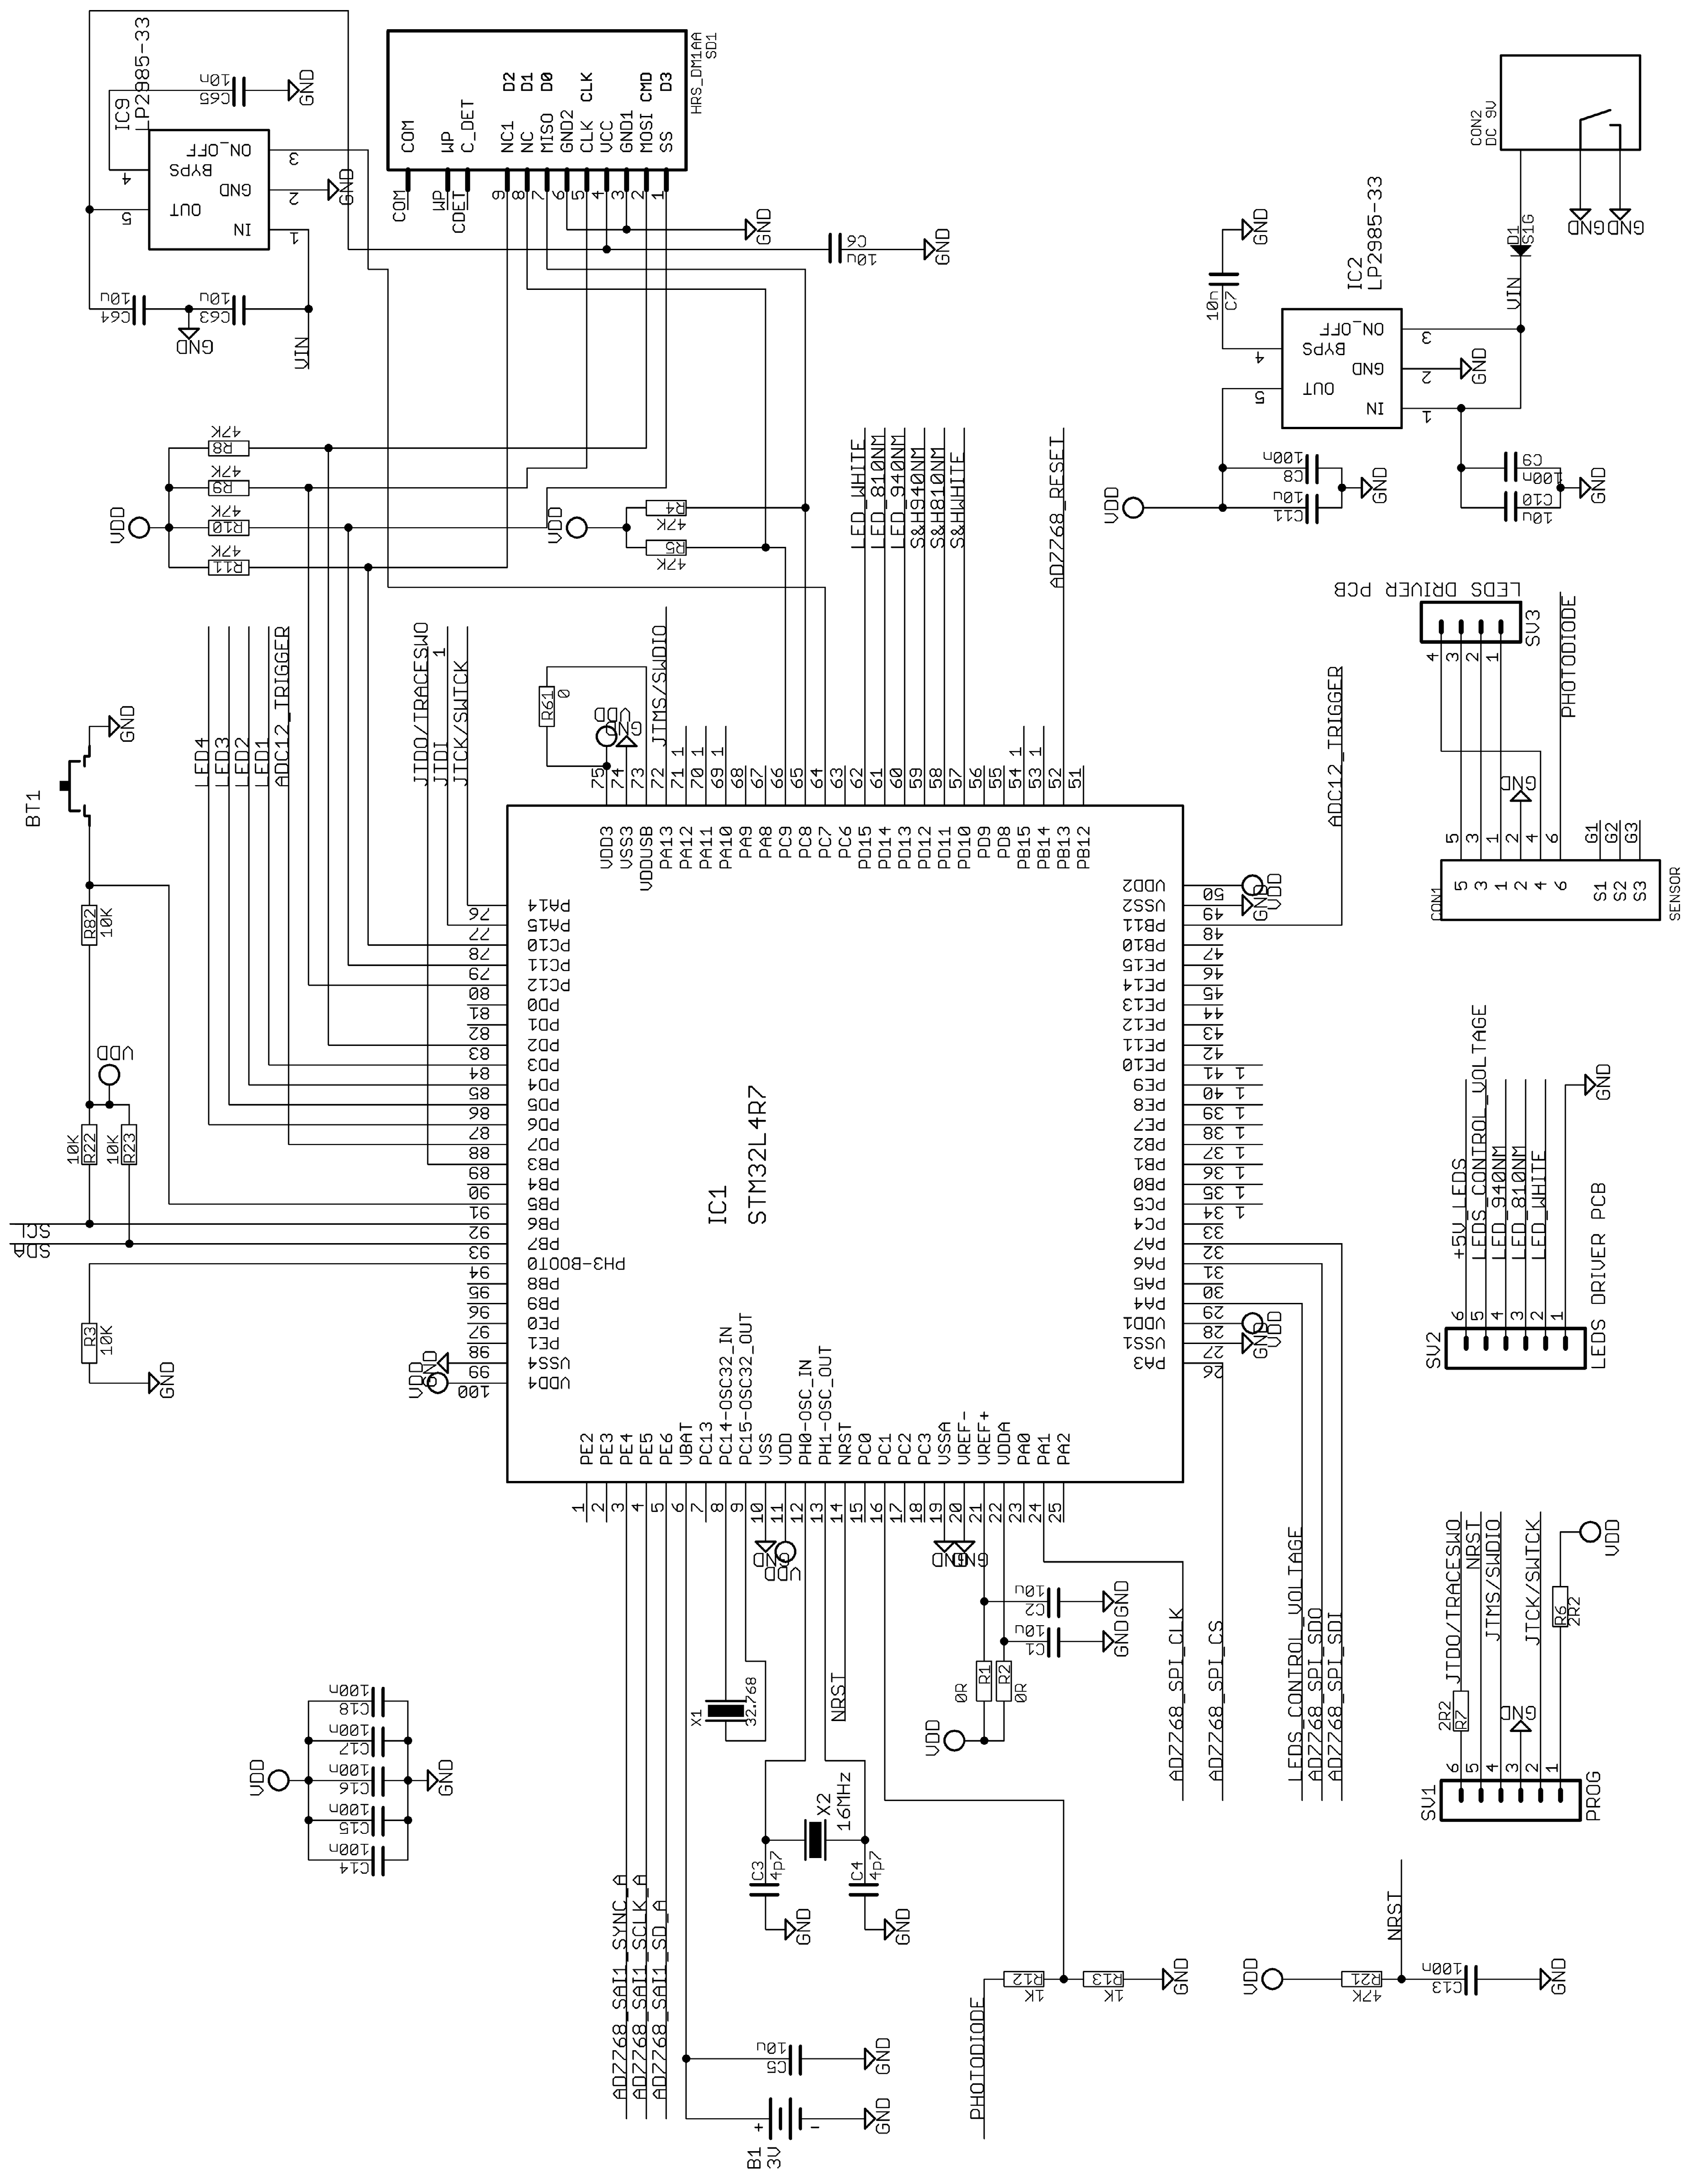
Microprocessor unit. The microprocessor STM32L4R7 operates at 3.3 V and is synchronized by the 16 MHz clock provided by the oscillator X2. It controls all functions of the recorder: storing at the SD card, controlling the ADC, and production of the synchronization signals. The internal real time clock is powered from battery B1 and is clocked by X1 (32.768 kHz crystal) that time-stamps detection events. The CPU also drives the LEDs and the user interface through the function button and the status LEDs, named LED1 to LED4. The connector SV1 is used for programming the CPU, and the SV2 and SV3 is used for the connection of LEDs driver PCB to main PCB. The connector CON1 is used for the connection of the sensor with the device.
Figure A1.
Microprocessor unit. The microprocessor STM32L4R7 operates at 3.3 V and is synchronized by the 16 MHz clock provided by the oscillator X2. It controls all functions of the recorder: storing at the SD card, controlling the ADC, and production of the synchronization signals. The internal real time clock is powered from battery B1 and is clocked by X1 (32.768 kHz crystal) that time-stamps detection events. The CPU also drives the LEDs and the user interface through the function button and the status LEDs, named LED1 to LED4. The connector SV1 is used for programming the CPU, and the SV2 and SV3 is used for the connection of LEDs driver PCB to main PCB. The connector CON1 is used for the connection of the sensor with the device.

Figure A2.
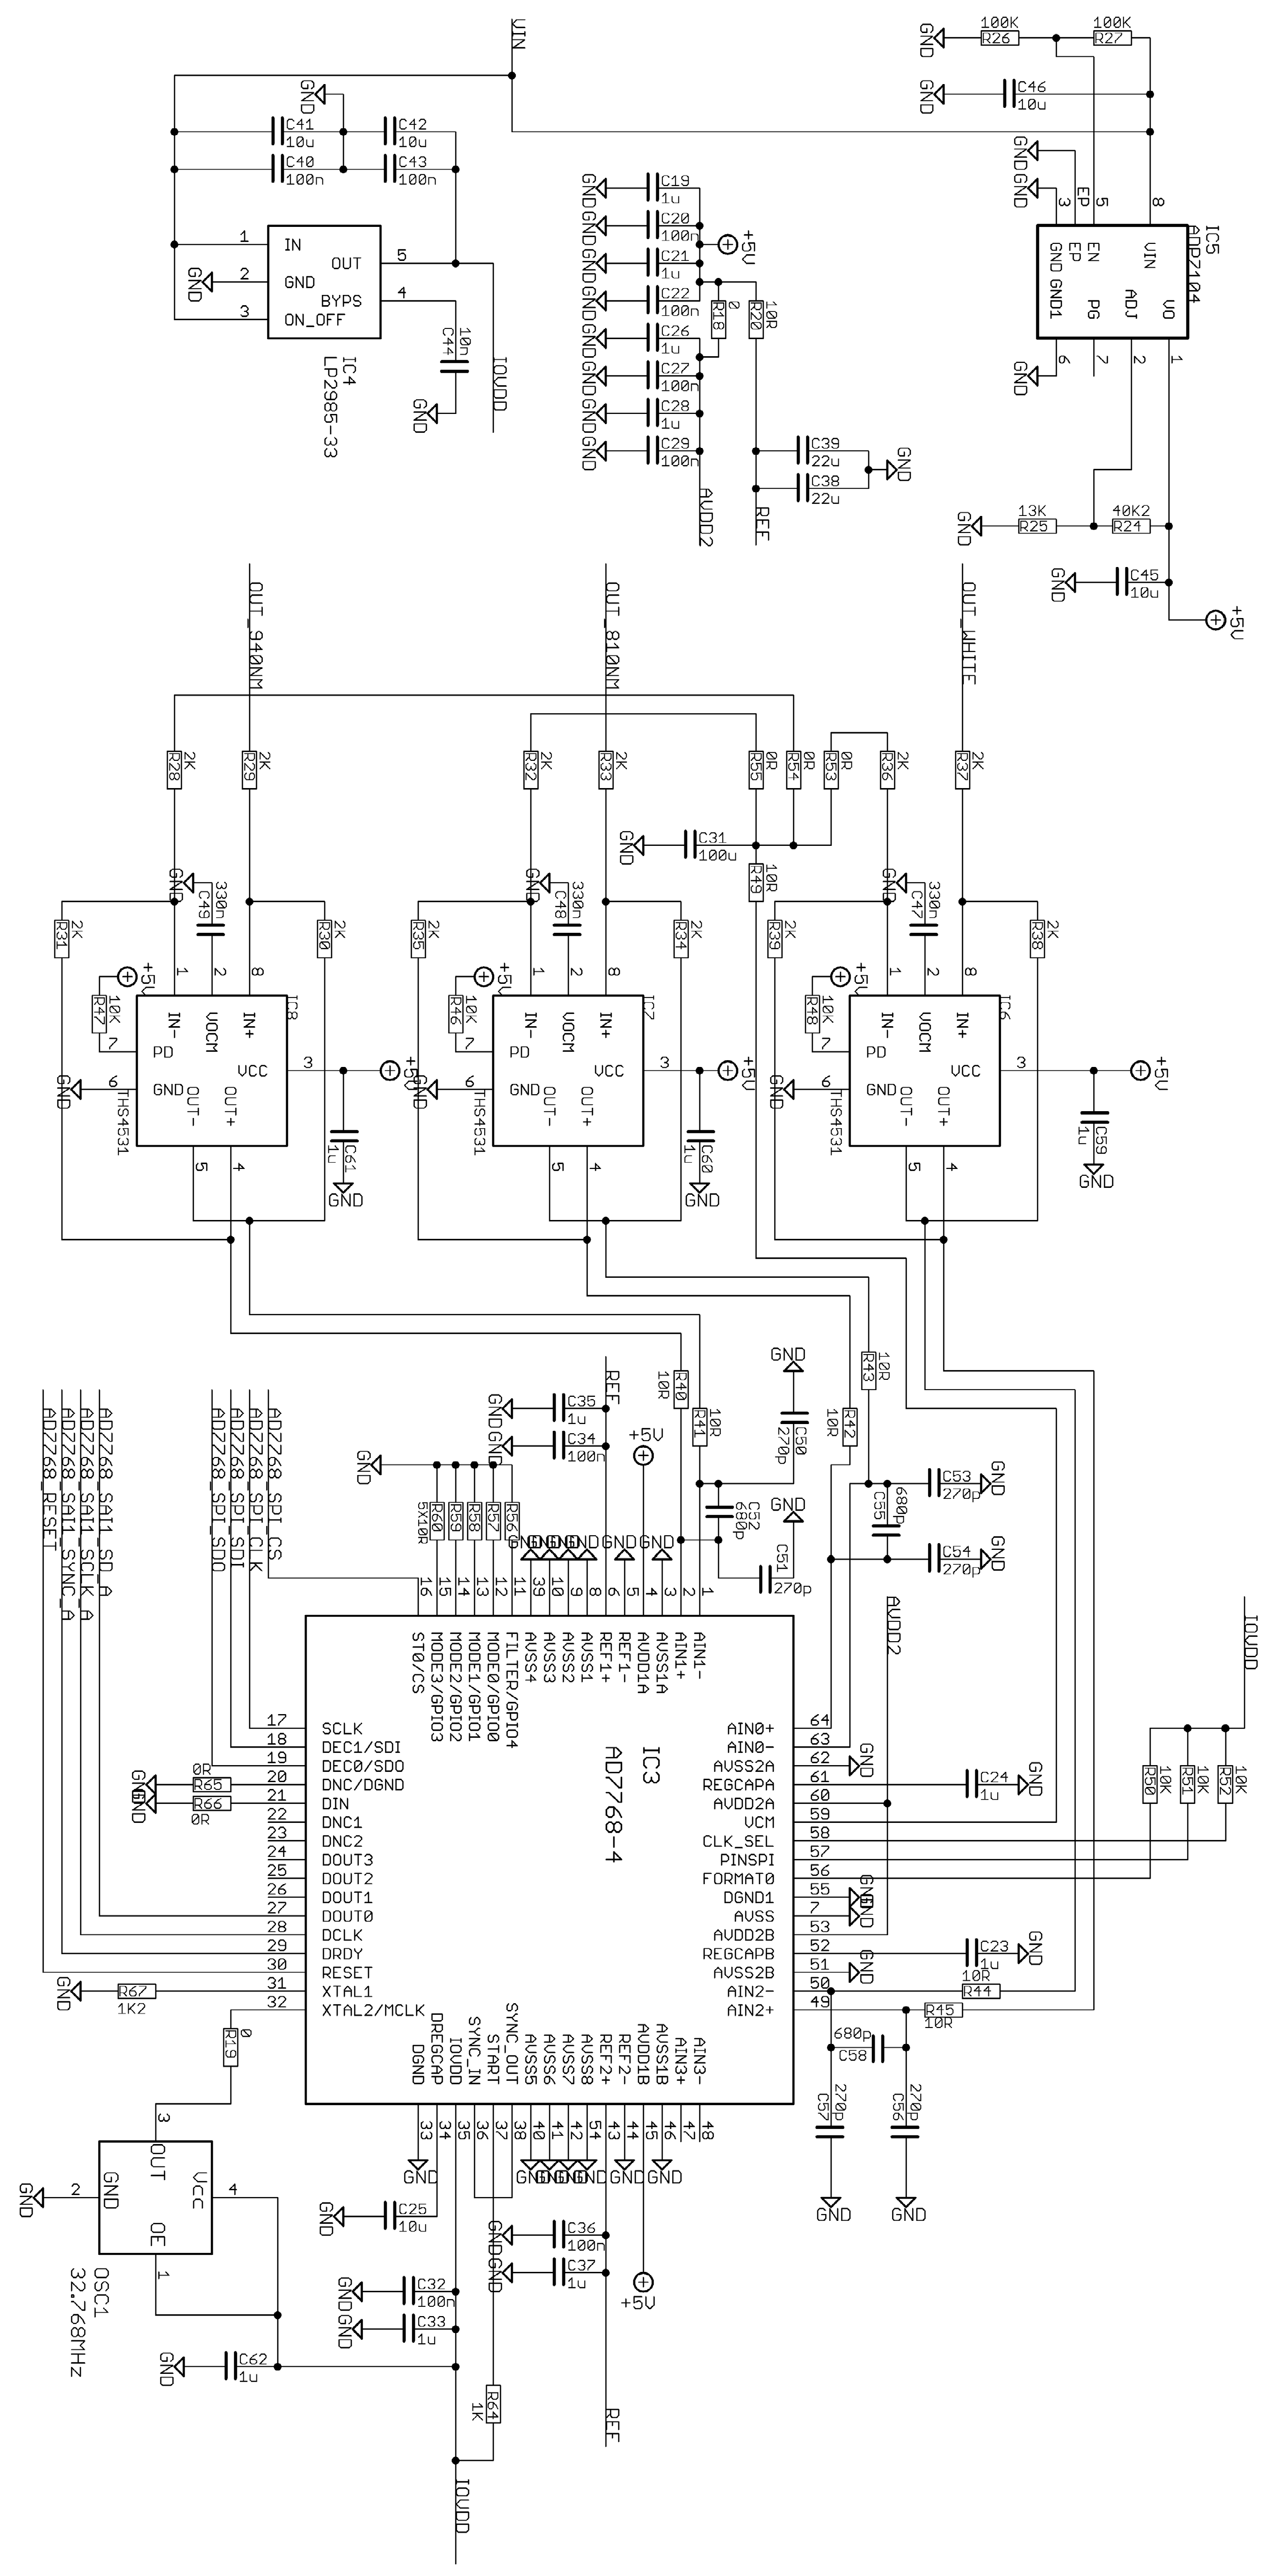
Three-channel ADC. The ADC is based on AD7768-4 (IC3) and converts the analogue audio signals to digital words. It is a four-channel 24-bit sigma delta ADC and we use the three of them. The three analog inputs of ADC are driven by three THS4531 differential amplifiers (ADC drivers). All functions of ADC (sampling rate, digital filtering, etc.) are controlled by the main CPU. The control interface is SPI and the digital audio data is transferred using the TDM protocol.
Figure A2.
Three-channel ADC. The ADC is based on AD7768-4 (IC3) and converts the analogue audio signals to digital words. It is a four-channel 24-bit sigma delta ADC and we use the three of them. The three analog inputs of ADC are driven by three THS4531 differential amplifiers (ADC drivers). All functions of ADC (sampling rate, digital filtering, etc.) are controlled by the main CPU. The control interface is SPI and the digital audio data is transferred using the TDM protocol.

Figure A3.
Demultiplexer. The demultiplexer receives the photodiode amplifier output and sends three dedicated analogue audio signals to the ADC.
Figure A3.
Demultiplexer. The demultiplexer receives the photodiode amplifier output and sends three dedicated analogue audio signals to the ADC.

Figure A4.
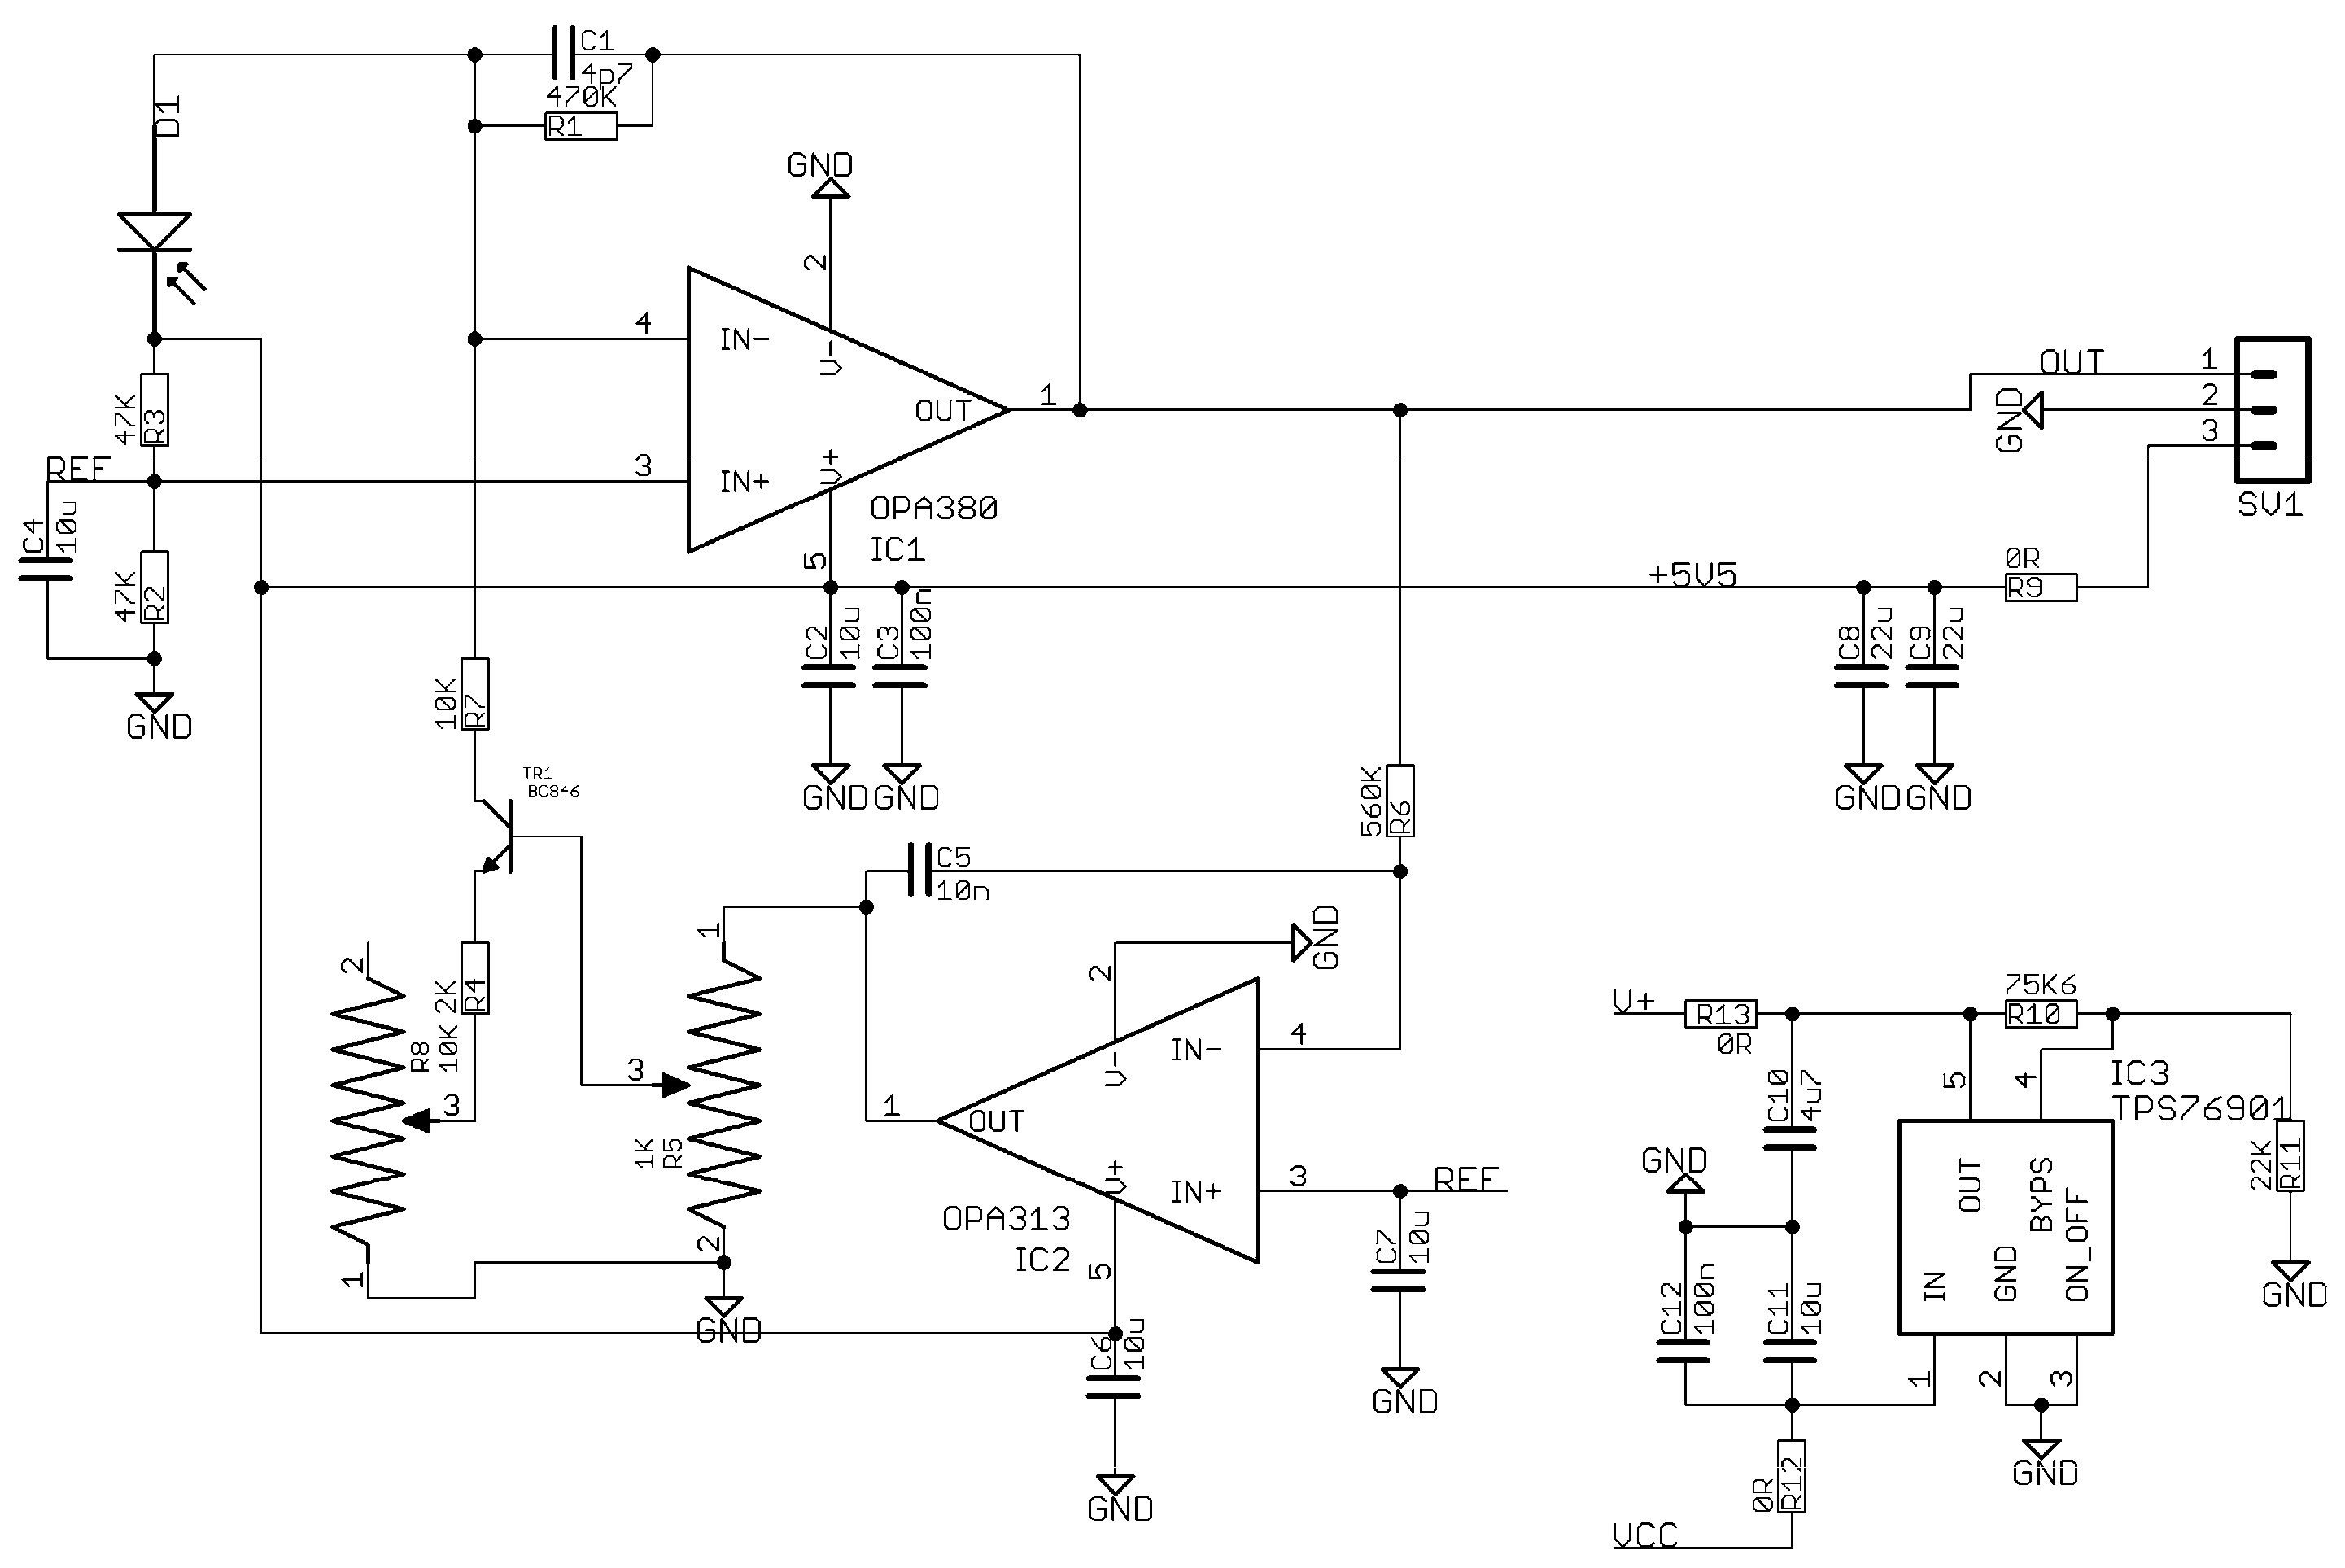
Photodiode receiver. It is based on the OPA380 transimpedance amplifier. The IC9 with the TR1 transistor functions as a feedback amplifier. Only the DC component of the IC8 output passes through IC9. The output of IC9 controls the conductivity of TR1, which in turn, subtracts the photodiode’s DC current. Therefore, the input of IC8 is contains only the AC component of the current. This way, the sensor can function in the presence of sunlight. Without the feedback loop, it would not be possible to function properly due to the high amplification of the OPA380 (470K feedback resistor).
Figure A4.
Photodiode receiver. It is based on the OPA380 transimpedance amplifier. The IC9 with the TR1 transistor functions as a feedback amplifier. Only the DC component of the IC8 output passes through IC9. The output of IC9 controls the conductivity of TR1, which in turn, subtracts the photodiode’s DC current. Therefore, the input of IC8 is contains only the AC component of the current. This way, the sensor can function in the presence of sunlight. Without the feedback loop, it would not be possible to function properly due to the high amplification of the OPA380 (470K feedback resistor).

Figure A5.
Three-channel LED driver. The led driver is based on IC1, IC3, IC5, IC6, and IC7. The voltage in the input of each ADA4805 controls the current of each LED array. This circuit is controlled by the CPU that is connected to SV1. The control voltage of the drivers is different for each spectral band to account for the different sensitivity of the photodiode responding to different spectral bands and is produced by the DAC of the main processor. Therefore, with the help of the analogue switch IC2 and the timing signals for the 940nm, 810nm, and white LEDs, the different voltages, in turn, give input to the ADA4805.

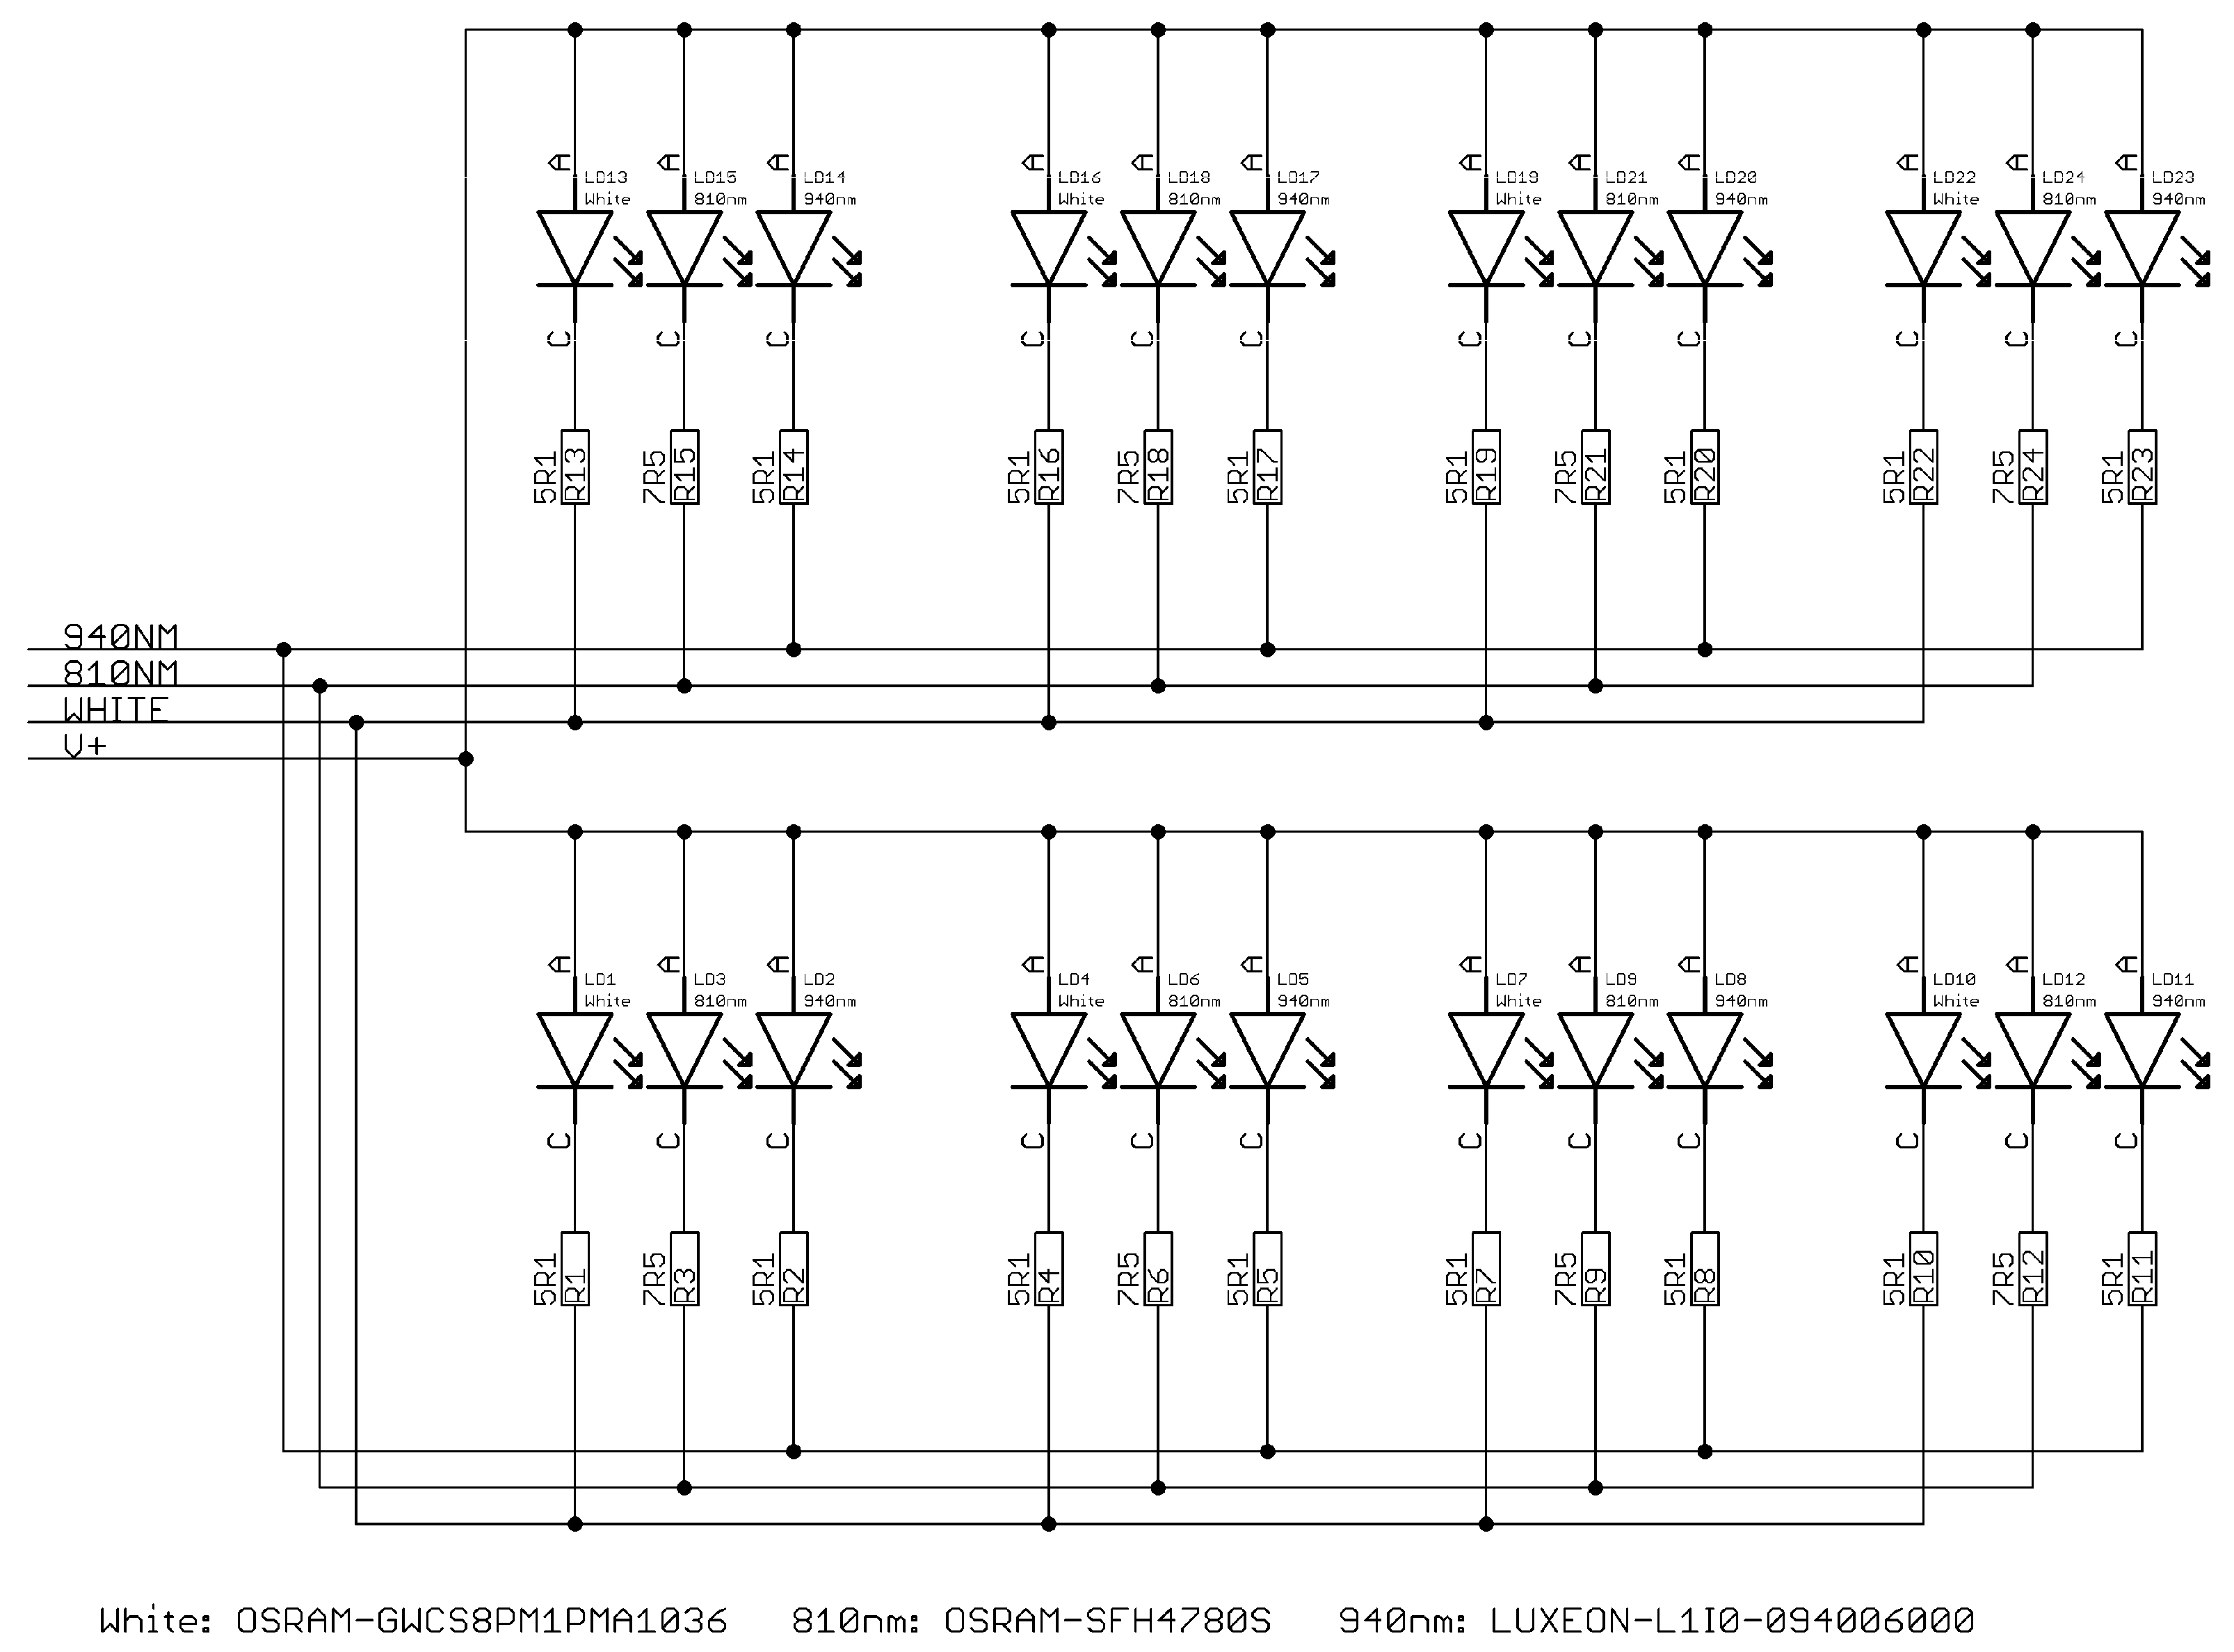
Figure A6.
LEDs array. One LED per spectral band.

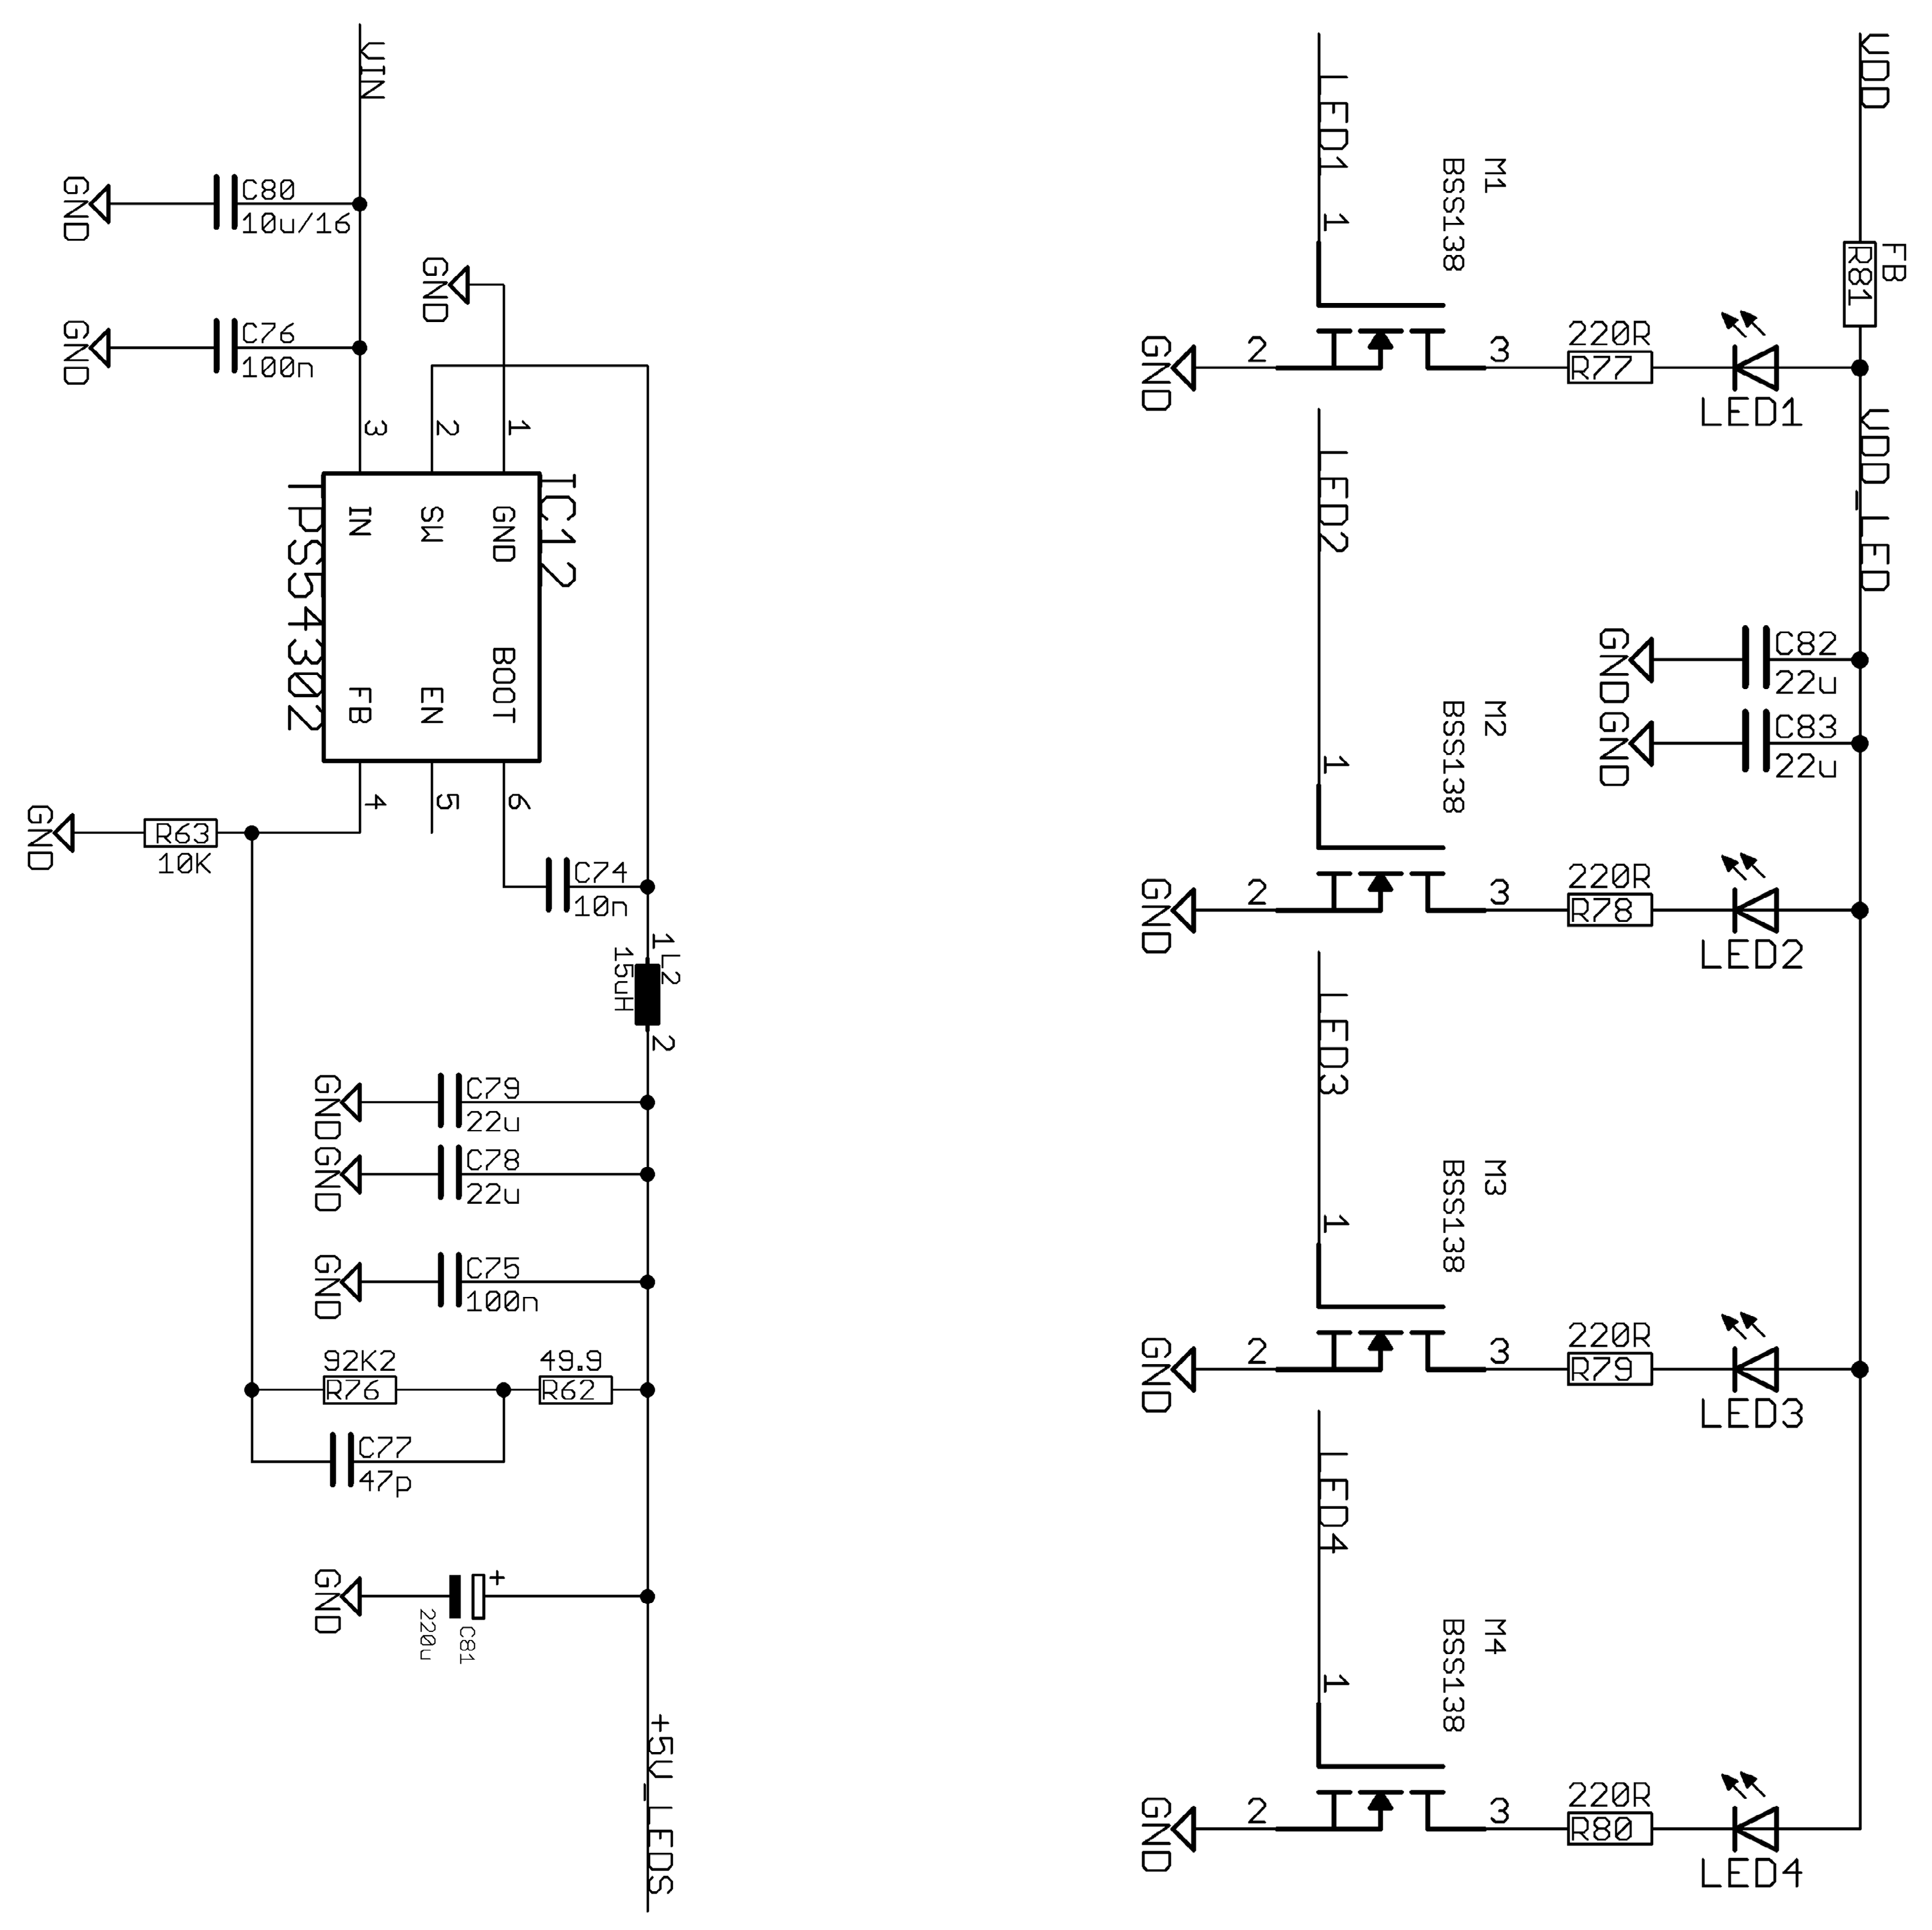
Figure A7.
(left) Sensor LEDs’ power supply. (right) Indicator LEDs. The LED arrays are powered with 5 V. The SMPS TPS54302 (IC12) produces this voltage. The indicator LEDs are controlled by the CPU through the MOSFETs M1, M2, M3, and M4.
Figure A7.
(left) Sensor LEDs’ power supply. (right) Indicator LEDs. The LED arrays are powered with 5 V. The SMPS TPS54302 (IC12) produces this voltage. The indicator LEDs are controlled by the CPU through the MOSFETs M1, M2, M3, and M4.

References
- Goldshtein, E.; Cohen, Y.; Hetzroni, A.; Gazit, Y.; Timar, D.; Rosenfeld, L.; Grinshpon, Y.; Hoffman, A.; Mizrach, A. Development of an automatic monitoring trap for the Mediterranean fruit fly (Ceratitis capitata) to optimize control applications frequency. Comput. Electron. Agric. 2017, 139, 115–125. [Google Scholar] [CrossRef]
- Potamitis, I.; Eliopoulos, P.; Rigakis, I. Automated Remote Insect Surveillance at a Global Scale and the Internet of Things. Robotics 2017, 6, 19. [Google Scholar] [CrossRef]
- Chen, Y.; Why, A.; Batista, G.; Mafra-Neto, A.; Keogh, E. Flying insect detection and classification with inexpensive sensors. J. Vis. Exp. 2014, 92, e52111. [Google Scholar] [CrossRef] [PubMed]
- Mukundarajan, H.; Hol, F.J.H.; Castillo, E.A.; Newby, C.; Prakash, M. Using mobile phones as acoustic sensors for high-throughput mosquito surveillance. Elife 2017, 6, e27854. [Google Scholar] [CrossRef] [PubMed]
- Potamitis, I.; Rigakis, I.; Vidakis, N.; Petousis, M.; Weber, M. Affordable Bimodal Optical Sensors to Spread the Use of Automated Insect Monitoring. J. Sens. 2018, 2018, 3949415. [Google Scholar] [CrossRef]
- Potamitis, I.; Rigakis, I. Novel Noise-Robust Optoacoustic Sensors to Identify Insects Through Wingbeats. IEEE Sens. J. 2015, 15, 4621–4631. [Google Scholar] [CrossRef]
- Raman, D.R.; Gerhardt, R.R.; Wilkerson, J.B. Detecting Insect Flight Sounds in the Field: Implications for Acoustical Counting of Mosquitoes. Agric. Biosyst. Eng. Pub. 2007, 57, 1481–1485. [Google Scholar]
- Santos, D.A.A.; Teixeira, L.E.; Alberti, A.M.; Furtado, V.; Rodrigues, J.J.P.C. Sensitivity and Noise Evaluation of an Optoelectronic Sensor for Mosquitoes Monitoring. In Proceedings of the 2018 3rd International Conference on Smart and Sustainable Technologies (SpliTech), Split, Croatia, 26–29 June 2018; pp. 1–5. [Google Scholar]
- Genoud, A.P.; Basistyy, R.; Williams, G.M.; Thomas, B.P. Optical remote sensing for monitoring flying mosquitoes, gender identification and discussion on species identification. Appl. Phys. B 2018, 124, 46. [Google Scholar] [CrossRef] [PubMed]
- Gebru, A.; Jansson, S.; Ignell, R.; Kirkeby, C.; Prangsma, J.C.; Brydegaard, M. Multiband modulation spectroscopy for the determination of sex and species of mosquitoes in flight. J. Biophotonics 2018, 11, e201800014. [Google Scholar] [CrossRef] [PubMed]
- Gebru, A.K.; Rohwer, E.G.; Neethling, P.; Brydegaard, M.S. Investigation of atmospheric insect wing-beat frequencies and iridescence features using a multispectral kHz remote detection system. J. Appl. Remote Sens. 2014, 8. [Google Scholar] [CrossRef]
- Gebru, A.; Jansson, S.; Ignell, R.; Kirkeby, C.; Brydegaard, M. Multispectral polarimetric modulation spectroscopy for species and sex determination of malaria disease vectors. In Proceedings of the 2017 Conference on Lasers and Electro-Optics (CLEO), San Jose, CA, USA, 14–19 May 2017; pp. 1–2. [Google Scholar]
- Chen, C.-P.; Chuang, C.-L.; Jiang, J.-A. Ecological Monitoring Using Wireless Sensor Networks—Overview, Challenges, and Opportunities. In Smart Sensors, Measurement and Instrumentation; Book Section in Advancement in Sensing Technology; Mukhopadhyay, S.C., Jayasundera, K.P., Eds.; Springer: Berlin/Heidelberg, Germany, 2013; pp. 1–21. [Google Scholar]
- Prince, P.; Hill, A.; Piña Covarrubias, E.; Doncaster, P.; Snaddon, J.L.; Rogers, A. Deploying Acoustic Detection Algorithms on Low-Cost, Open-Source Acoustic Sensors for Environmental Monitoring. Sensors 2019, 19, 553. [Google Scholar] [CrossRef] [PubMed]
- Fennell, J.; Veys, C.; Dingle, J.; Nwezeobi, J.; van Brunschot, S.; Colvin, J.; Grieve, B. A method for real-time classification of insect vectors of mosaic and brown streak disease in cassava plants for future implementation within a low-cost, handheld, in-field multispectral imaging sensor. Plant Methods 2018, 14, 82. [Google Scholar] [CrossRef] [PubMed]
- Ma, T.; Kobori, H.; Katayama, N.; Tsuchikawa, S. Non-Destructive Inspection of Insects in Chocolate Using near Infrared Multispectral Imaging. J. Near Infrared Spectrosc. 2016, 24, 391–397. [Google Scholar] [CrossRef]
- Vasas, V.; Hanley, D.; Kevan, P.G.; Chittka, L. Multispectral images of flowers reveal the adaptive significance of using long-wavelength-sensitive receptors for edge detection in bees. J. Compar. Physiol. 2017, 203, 301–311. [Google Scholar] [CrossRef] [PubMed]
- Ellington, C. The novel aerodynamics of insect flight: Applications to micro-air vehicles. J. Exp. Biol. 1999, 202, 3439–3448. [Google Scholar] [PubMed]
- Santos, D.A.; Rodrigues, J.J.; Furtado, V.; Saleem, K.; Korotaev, V. Automated electronic approaches for detecting disease vectors mosquitoes through the wing-beat frequency. J. Clean. Prod. 2009, 217, 767–775. [Google Scholar] [CrossRef]
- Ouyang, T.H.; Yang, E.C.; Jiang, J.A.; Lin, T.T. Mosquito vector monitoring system based on optical wingbeat classification. Comput. Electron. Agric. 2015, 118, 47–55. [Google Scholar] [CrossRef]
- Van Roy, J.; De Baerdemaeker, J.; Saeys, W.; De Ketelaere, B. Optical identification of bumblebee species: Effect of morphology on wingbeat frequency. Comput. Electron. Agric. 2014, 109, 94–100. [Google Scholar] [CrossRef]
- Fernandes, J.N.; Dos Santos, L.M.; Chouin-Carneiro, T.; Pavan, M.G.; Garcia, G.A.; David, M.R.; Beier, J.C.; Dowell, F.E.; Maciel-de-Freitas, R.; Sikulu-Lord, M.T. Rapid, noninvasive detection of Zika virus in Aedes aegypti mosquitoes by near-infrared spectroscopy. Sci. Adv. 2018, 4, eaat0496. [Google Scholar] [CrossRef] [PubMed]
- Dadabayev, R.; Shabairou, N.; Zalevsky, Z.; Malka, D. A visible light RGB wavelength demultiplexer based on silicon-nitride multicore PCF. Opt. Laser Technol. 2019, 111, 411–416. [Google Scholar] [CrossRef]
- Shabairou, N.; Cohen, E.; Wagner, O.; Malka, D.; Zalevsky, Z. Color image identification and reconstruction using artificial neural networks on multimode fiber images: Towards an all-optical design. Opt. Lett. 2018, 43, 5603–5606. [Google Scholar] [CrossRef] [PubMed]
Figure 1.
The multispectral sensor: (left) The disk in the middle is the Fresnel lens. The three LED’s in each plate emit, in turn, visible light 450–700nm, and infrared at 810 nm and 940 nm. All eight LEDs of each spectral band are lit simultaneously for 20.8 microseconds (i.e., three circular arrays of eight LEDs each). All LEDs’ supporting plates have a 68.5° orientation with respect to the Fresnel plane (right). The photodiode is placed at the focal point of the Fresnel lens.

Figure 2.
Block diagram of the multispectral device. The system is controlled from an STM32L4R7 ARM CPU of ST. The LED drivers produces the sequentially current pulses of each LED.
Figure 2.
Block diagram of the multispectral device. The system is controlled from an STM32L4R7 ARM CPU of ST. The LED drivers produces the sequentially current pulses of each LED.

Figure 3.
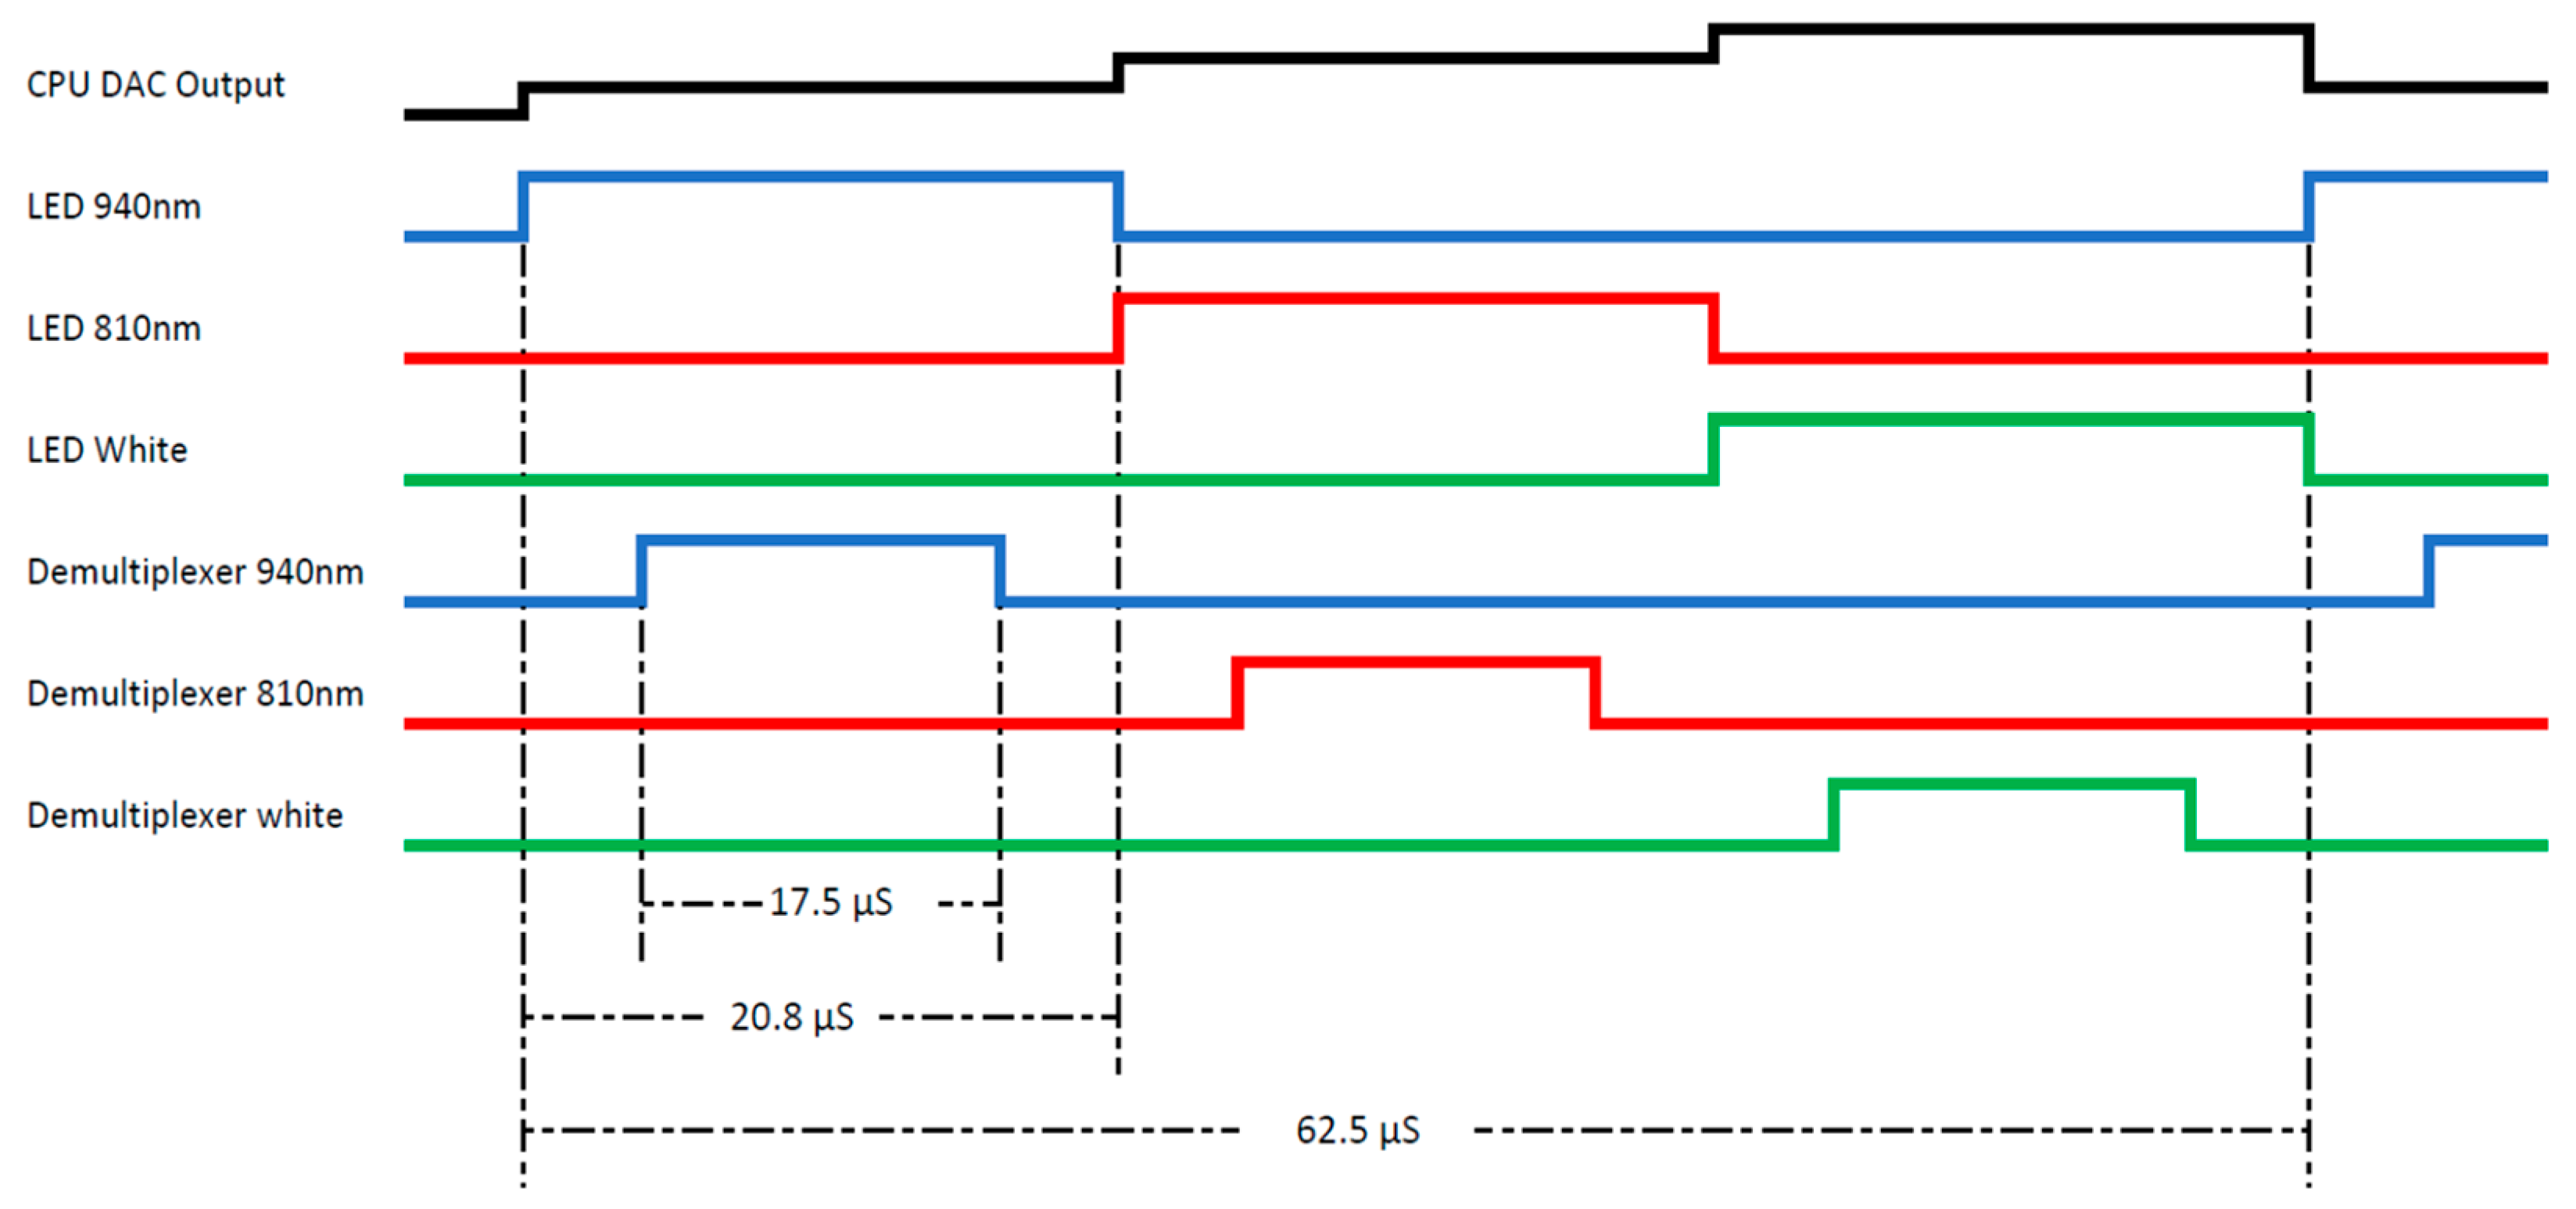
The CPU digital to analog converter (DAC) output defines the current level for each light pulse per spectral band. The signals LED 940 nm, LED 810 nm, and LED White initiate the output of the LED drivers for each spectral band. The signals: demultiplexer 940 nm, demultiplexer 810 nm, and demultiplexer-white initiate the corresponding sample and hold amplifier so that the photodiode is demultiplexed.
Figure 3.
The CPU digital to analog converter (DAC) output defines the current level for each light pulse per spectral band. The signals LED 940 nm, LED 810 nm, and LED White initiate the output of the LED drivers for each spectral band. The signals: demultiplexer 940 nm, demultiplexer 810 nm, and demultiplexer-white initiate the corresponding sample and hold amplifier so that the photodiode is demultiplexed.

Figure 4.
The multispectral recorder prototype. We circle and annotate the main components of the recorder.
Figure 4.
The multispectral recorder prototype. We circle and annotate the main components of the recorder.

Figure 5.
A diagram explaining the recording procedure. The signal is continuously stored in a cyclic buffer and the RMS value of a window of 128 samples is monitored. Once the RMS value exceeds a threshold, it triggers a recording session. A total of 20% of the samples are taken prior to the triggering point from the buffer and 80% after this event to ensure that the wingbeat onset is not missed. Metadata is composed of a timestamp, humidity, and temperature stamps that are passed to the filename.

Figure 6.
The three ways to use the suggested sensor and its associated recorder: by tethering an insect inside the probe volume of the sensor (e.g., by holding its legs with an inverted tweezer), by confining the insect in a transparent cage that is large enough to allow the insect to fly, or by inserting the sensor in an insectary cage containing a free-flying insect. Notice the black termination plane on the right of the Plexiglas (MAXiBLACK, Advanced Coating Products, Acktar Store LTD, Kiryat-Gat, Israel).

Figure 7.
Optical wingbeat recording of backscattered light wings and main body using three different spectral bands (810 nm, 940 nm, white). Time domain signal at 8 kHz sampling rate for each band on the left column of each sub-figure and the Welch power spectral density on the right column. Recordings are treated as audio and the amplitude in y-axis is normalized between [−1, 1]. (a) The bee Apis mellifera, (b) the wasp Polistes gallicus, (c) the fruit fly Zaprionus, (d) the fruit fly Drosophila suzukii, and (e) the fruit fly Drosophila melanogaster.


© 2019 by the authors. Licensee MDPI, Basel, Switzerland. This article is an open access article distributed under the terms and conditions of the Creative Commons Attribution (CC BY) license (http://creativecommons.org/licenses/by/4.0/).
Share and Cite
MDPI and ACS Style
Rigakis, I.; Potamitis, I.; Tatlas, N.-A.; Livadaras, I.; Ntalampiras, S. A Multispectral Backscattered Light Recorder of Insects’ Wingbeats. Electronics 2019, 8, 277. https://doi.org/10.3390/electronics8030277
AMA Style
Rigakis I, Potamitis I, Tatlas N-A, Livadaras I, Ntalampiras S. A Multispectral Backscattered Light Recorder of Insects’ Wingbeats. Electronics. 2019; 8(3):277. https://doi.org/10.3390/electronics8030277
Chicago/Turabian StyleRigakis, Iraklis, Ilyas Potamitis, Nicolaos-Alexandros Tatlas, Ioannis Livadaras, and Stavros Ntalampiras. 2019. "A Multispectral Backscattered Light Recorder of Insects’ Wingbeats" Electronics 8, no. 3: 277. https://doi.org/10.3390/electronics8030277
Note that from the first issue of 2016, this journal uses article numbers instead of page numbers. See further details here.