
3D Porous Plasmonic Nanoarchitectures for SERS-Based Chemical Sensing †


Department of Optoelectronics, V.E. Lashkarev Institute of Semiconductor Physics, National Academy of Sciences of Ukraine, 41 Pr. Nauki, 03028 Kyiv, Ukraine
*
Author to whom correspondence should be addressed.
†
Presented at the 9th International Electronic Conference on Sensors and Applications, 1–15 November 2022; Available online: https://ecsa-9.sciforum.net .
Eng. Proc. 2022, 27(1), 41; https://doi.org/10.3390/ecsa-9-13200
Published: 1 November 2022
(This article belongs to the Proceedings of The 9th International Electronic Conference on Sensors and Applications)
Abstract
:Bio- and chemical SERS-sensing using plasmonic nanostructures can be dramatically improved by creating hot spots—i.e., sub-10 nm gaps between nanoparticles—which confine large electromagnetic fields on nanometric volume. Here we report a 3D porous wedge-shaped gold nanostructure that contains high-density Raman-active nanogaps produced by pulsed laser deposition. The resulting structures consist of arrays of densely packed gold nanoparticles and nanopores that exhibit a number of functionalities, including size selectivity, spectral tunability and strong electromagnetic field amplification. The possibility of effective enhancement of the Raman intensity of Rhodamine 6G molecules upon resonant excitation that is outside the region of surface plasmon resonance excitation in 3D Au nanostructures is demonstrated.
1. Introduction
Surface-enhanced Raman scattering (SERS)-based sensing is a widely used technique for identifying molecules of interest and monitoring processes associated with them in analytical chemistry and medical diagnostics. Plasmonic metal nanostructures are a prerequisite for observing classical SERS, so most research is aimed at developing efficient configurations of SERS substrates with a maximum amplification [1,2,3,4,5,6,7,8,9,10]. The intensity of Raman scattering of analyte can be significantly enhanced in hot spots, i.e., regions with intense electromagnetic fields that appear near narrow nanogaps between metal nanoparticles (NPs) [5,11,12,13,14,15]. According to the classical theory of electrodynamics, as the distance between nanoparticles decreases, the concentration of the electric field in nanogaps increases, which leads to a monotonic increase in the intensity of Raman scattering [16,17]. In this way, a significant increase in SERS was achieved at distances between nanoparticles of less than 10 nm [18]. To date, most hot-spot based nanosystems have been designed in one-dimensional (1D, linear) or two-dimensional (2D, planar) geometries; extension to three-dimensional (3D) SERS architectures can provide a higher density of hot spots per unit volume and further increase the area for immobilization of desired molecules. Technological methods based on layer-by-layer deposition of nanoparticles are among the most promising approaches. In contrast to NP dimers, which have only one hot spot, for multilayer close-packed arrays of NPs the number of hot spots depends on the total number of NPs, the distance between them, and the fill factor of NPs. Thus, the design of highly efficient three-dimensional plasmonic nanostructures represents the highest level of complexity and functionality and is modern trend in plasmonic materials science.
In this study, single-stage pulsed laser deposition of porous three-dimensional wedge-shaped multilayers of Au nanoparticles was used to form a SERS-active substrate with high-density hot spots. Giant Raman scattering of Rhodamine 6G molecules upon excitation at wavelengths of 488 nm and 514.5 nm, which lie outside the plasmon resonance region, was observed on the developed 3D SERS substrates. The effect of structure parameters of nanoporous Au NP arrays on Raman enhancement was investigated.
2. Materials and Methods
A nanoporous structure with Au nanoparticle arrays hasbeen produced by pulsed laser deposition (PLD) from the backward flow of low-energy plasma plume particles in an argon atmosphere on a glass plate (dimensions of 25 × 25 × 1.5 mm3) located on the target plane. YAG:Nd3+ laser beam (wavelength 1.06 µm, energy 0.2 J, pulse time 10 ns, frequency 25 Hz) scanned an Au (99.9%) target in a vacuum chamber with argon pressure of 100 Pa. The energy density was 5 J/cm2, the laser pulse number 30,000. Ablation was performed with a laser beam focused at an angle of 45°. Before the deposition of an Au NP array on the substrate, the glass was preliminarily cleaned with a chromium mixture (10 g of K2Cr2O7 per 350 mL of H2SO4), isopropanol, followed by washing in a large amount of distilled water in an ultrasonic bath.
Determination of the film thickness and analysis of the surface topography was performed by atomic force microscopy (AFM) using a Nanoscope IIIa microscope (Digital Instruments) in a periodic contact mode. Si probes with nominal tip radii of 10 nm were used. The images of the surface and the film thickness d were determined at different distances L from the axis of the plasma plume. Vertical and horizontal sizes of Au NPs and pores were evaluated. The film thickness d was obtained from the direct measurement of the heights of the substrate-film steps, which were created by disruptive lithography. With the help of the original software package developed by us, layer-by-layer sections of AFM images were built and analyzed. Visual 2D slices of the image were made in grayscale (0–255) from 0 to 100% depth with a step of x%. As a result, a series of vertical slices of the surface profile is obtained, the analysis of which makes it possible to obtain the following statistical parameters: N is the number of isolated grains on the cut; l is the length of the boundaries of isolated grains; S is the total area of isolated grains; D is the average minimal distance between isolated grains.
Rhodamine 6G (Rh6G) was used as a molecular marker to compare the characteristics of the porous Au nanostructure along the substrate with different structure and thickness. A 10−5–10−10 M solution of Rh6G was prepared in deionized water. The SERS substrate was immersed in the aqueous Rh6G solution and was left for 60 min to enable the adsorption of the Rh6G on the Au arrays surface. After that the samples were dried in air. The SERS spectra were measured using the triple spectrometer Horiba Jobin Yvon T64000 equipped with a confocal optical microscope. As an optical excitation source, the Ar-Kr laser discrete line with λex = 488.0, 514.5 nm was used. After reflection from the sharp-edge Raman filter, the laser beam was focused vertically on the sample surface by a microscope equipped with a ×100 objective to a region with a diameter of 0.7 µm. Backscattered light was collected through a lens and recorded with a certain integration time. The laser power was 100 mW. The spatial mapping of the optical spectra of the studied structures was carried out using the automatic moving of the table with the step of 0.1 µm. The accuracy of the determination of the frequency of phonon bands was equal to 0.15 cm−1.
3. Results and Discussion
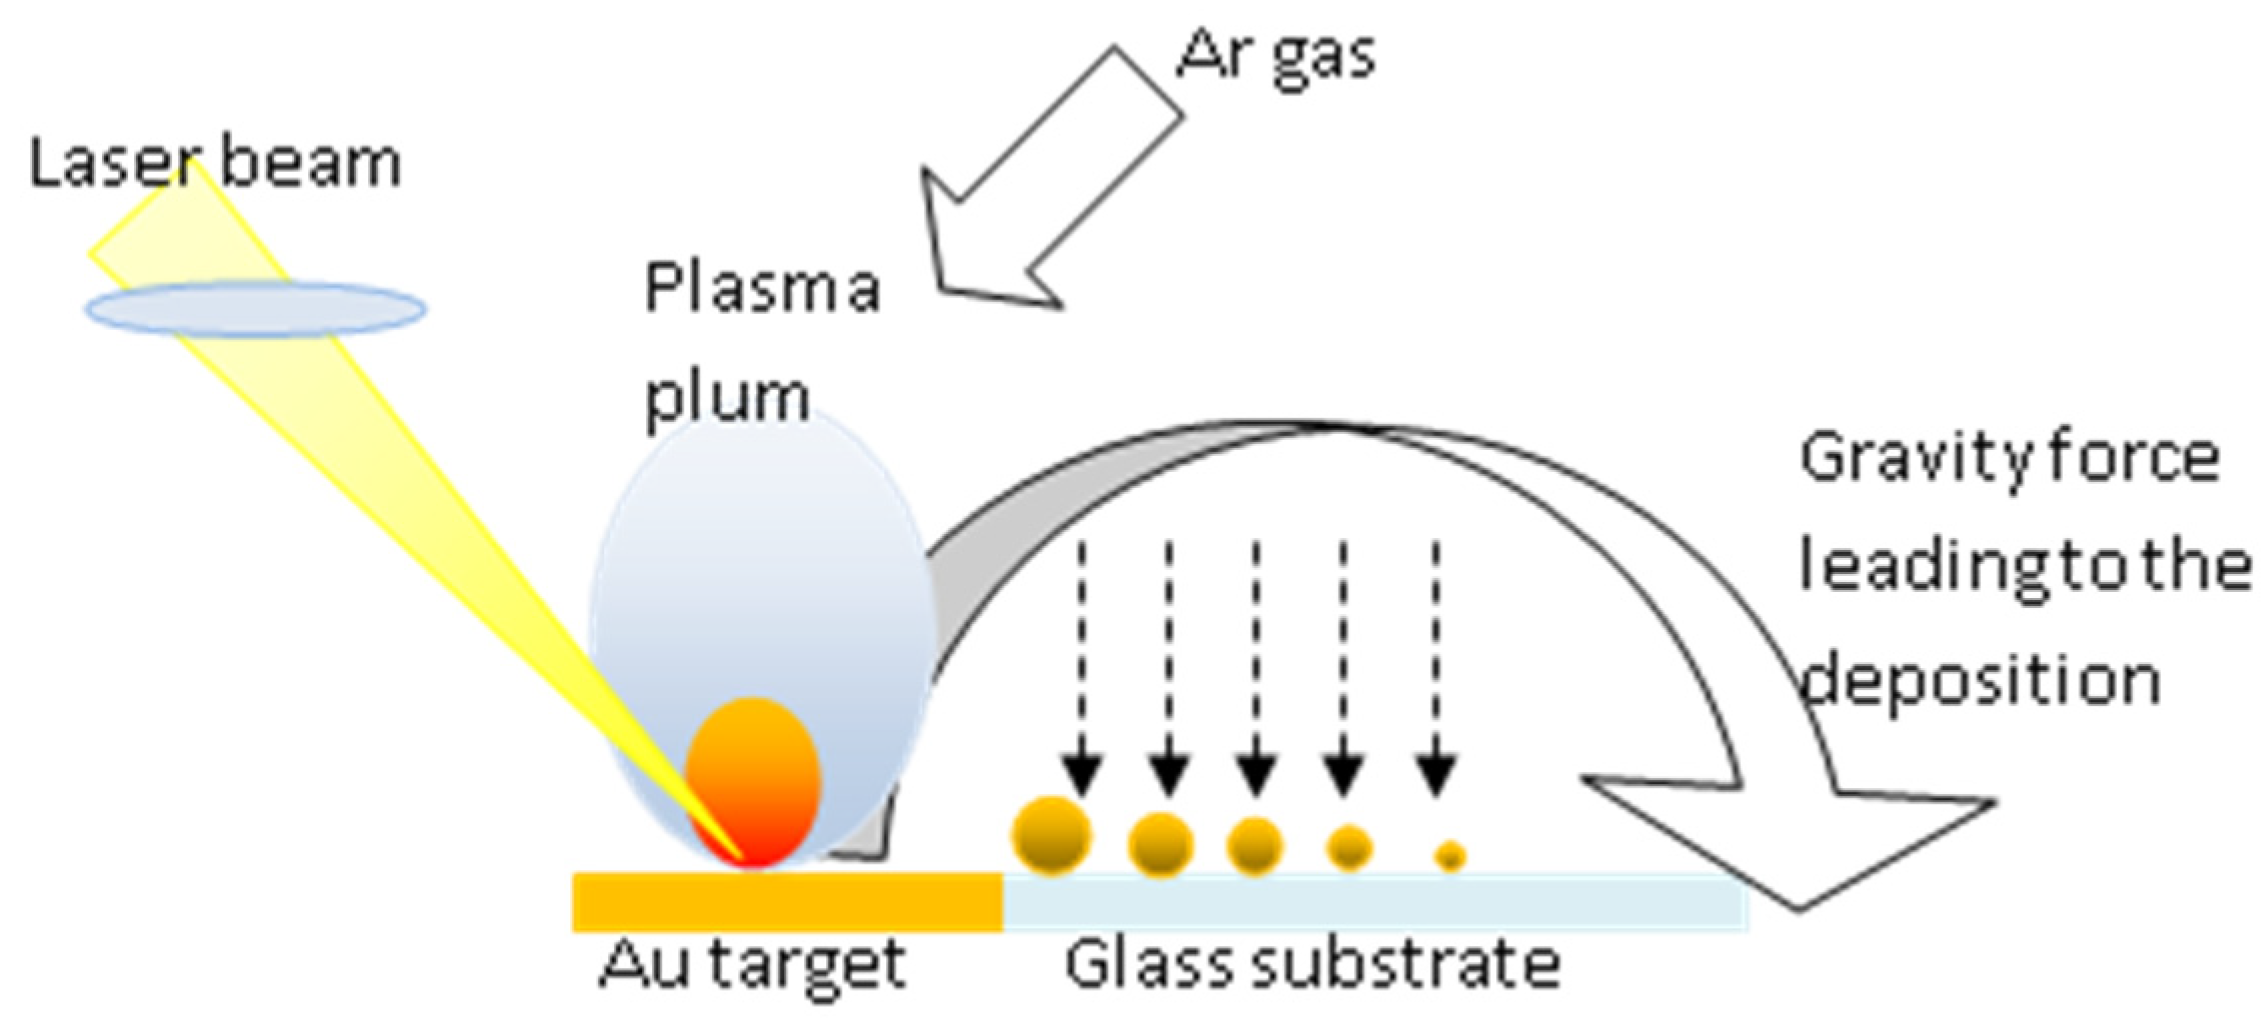
Using the PLD concept, a method has been developed for the formation of Au NP arrays from the backward flow of plasma plume particles onto a substrate located in the target plane in an inert gas atmosphere (Figure 1). The deposition occurs from the low-energy flow of the particles due to collision of the ablated particles with the argon atoms and their cooling. The main idea is the possibility of forming in a single technological cycle porous Au NP arrays with different geometric characteristics that vary along the substrate. Under such a deposition configuration, the separation of Au NPs on the substrate according to their sizes is observed (Figure 1). In this case, the sizes of nanoparticles and pores, their number, and the film thickness decrease along the substrate. The number of laser pulses determines the density, quantity, and level of NP aggregation on the substrate. The argon pressure mainly affects the cluster size and film porosity. At high argon pressure (100 Pa), an array of nanoparticles with a high porosity value is formed on the surface; the porosity of the coating varied along the long side of the substrate (total length 25 mm) from 64.5% at the beginning, 71% in the middle, and 36.3% at the end of the specimen. (The methodology and details of porosity measurements can be found in Ref. [19]).
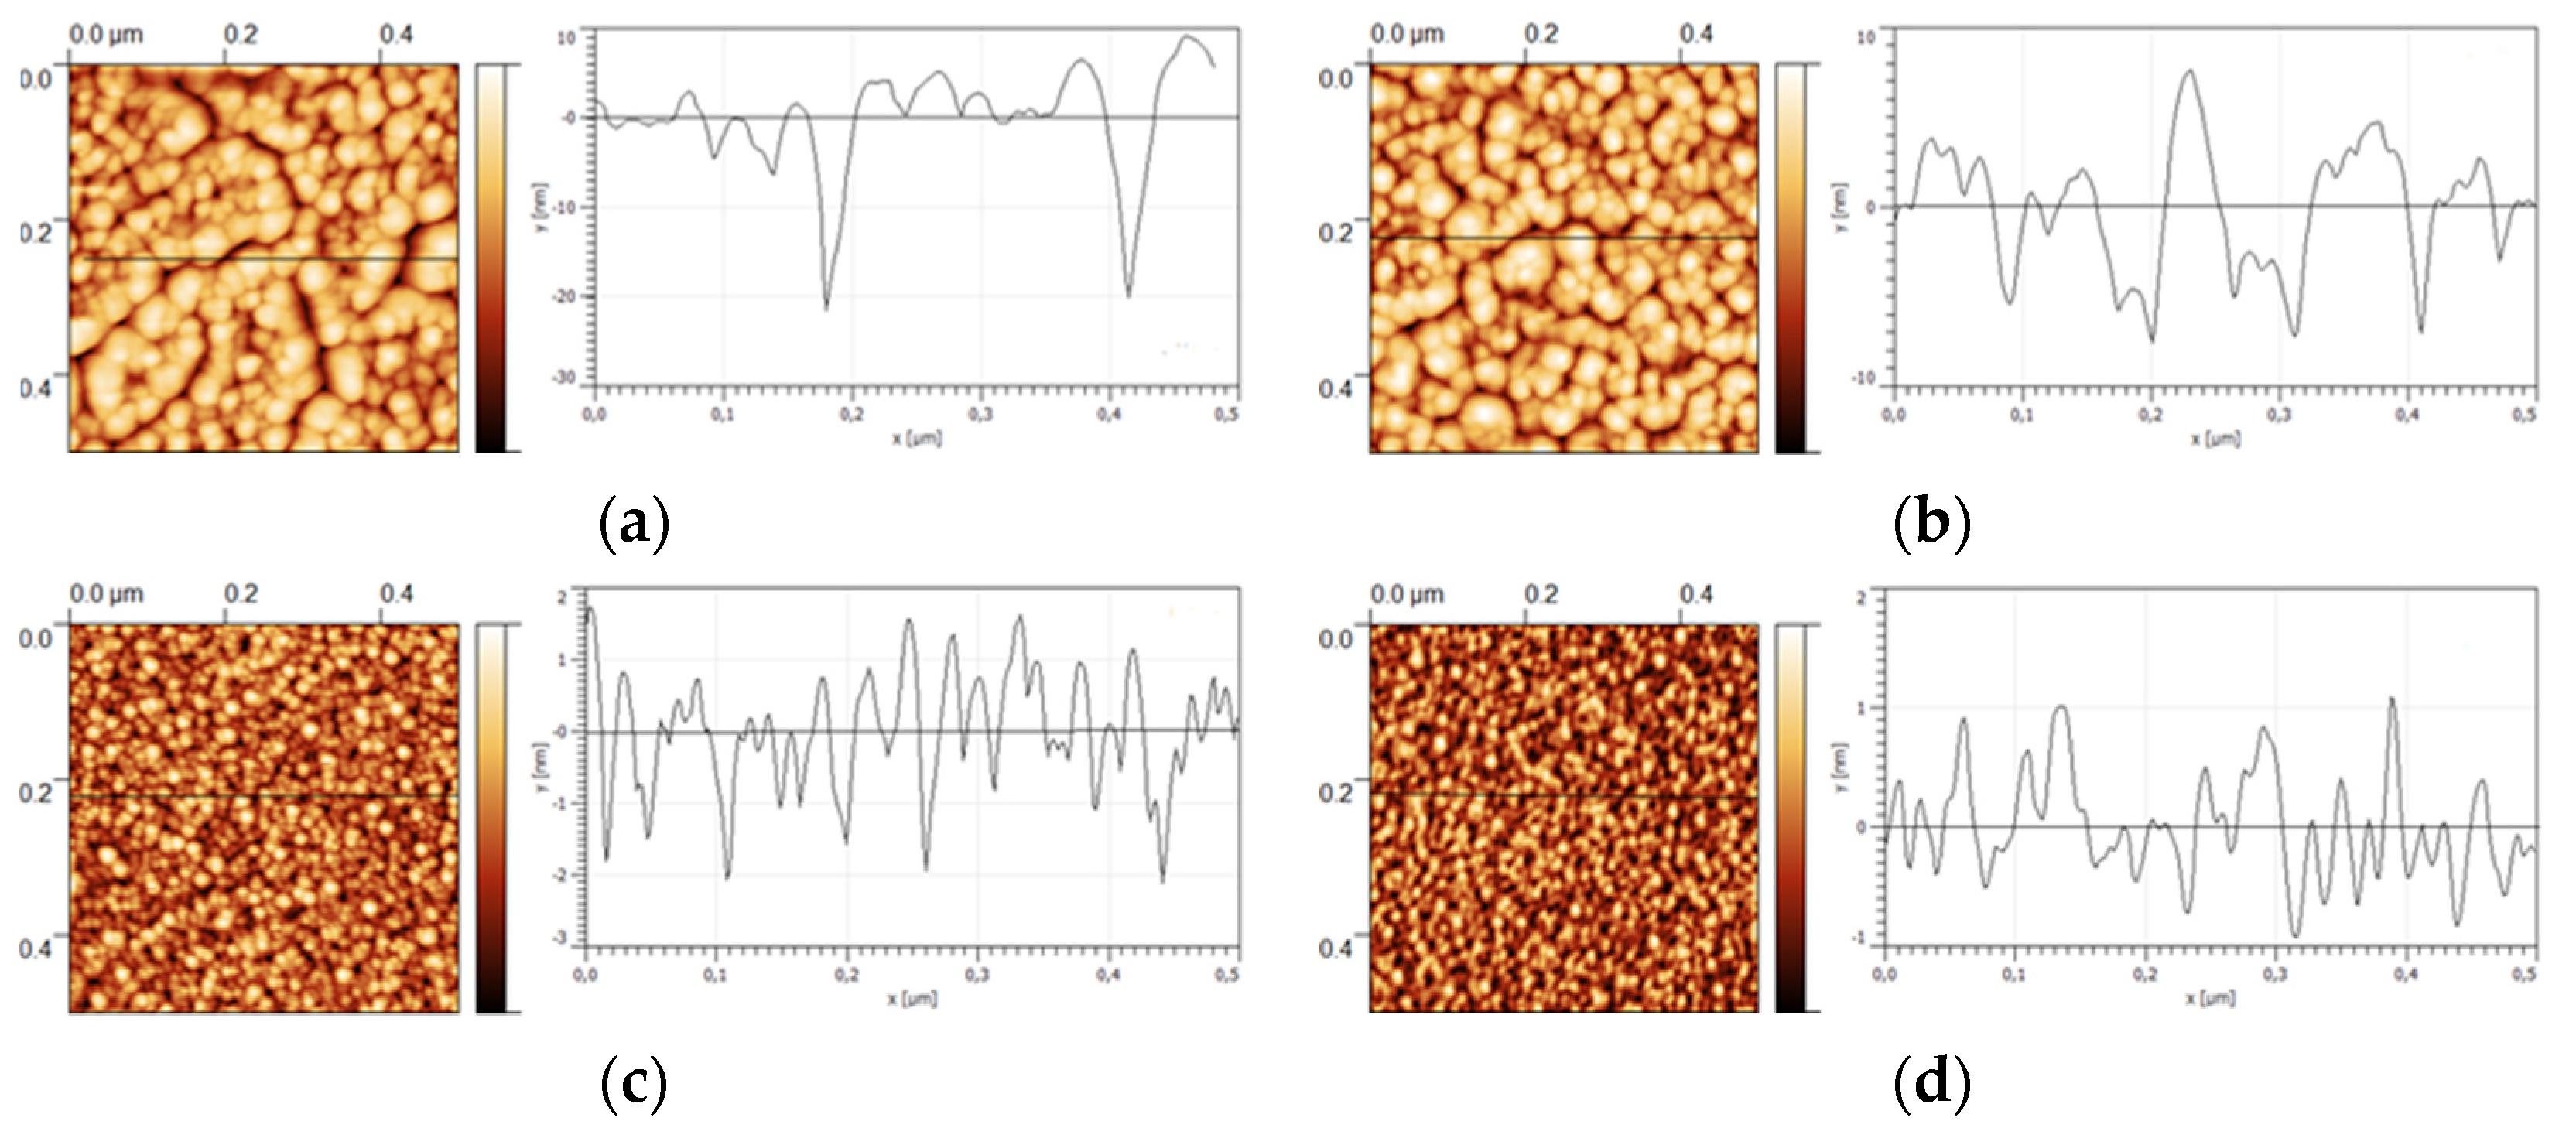
As a result of AFM studies, it was found that wedge-shaped close-packed Au NP arrays which consist of several NPs layers having a labyrinth structure with different properties along substrate length are formed. An analysis of the AFM images (Figure 2) shows that with increasing distance from the axis of the torch in the deposited NP arrays, the film thickness decreases from 85 nm to 4 nm, the surface roughness is 7.5–0.74 nm, the average nanoparticle diameter from 25 to 7 nm, and the transverse pore size ranges from (30–2) nm to (14–2) nm. The AFM microstructure profiles of NP arrays at different thicknesses used in this study is illustrated in Figure 2a–d.
The three-dimensional structure of the array of nanoparticles provides a significant increase in the surface area and, accordingly, the amount of analyte capable of being adsorbed on it; moreover, analyte molecules are able to diffuse deep into the material within the available thickness, maximizing the analytical sensitivity of the system and lowering the limit of least detection. In addition, by choosing a certain area on the substrate surface for measurement, it is possible to provide the desired average distance between nanoparticles (pore size), which corresponds to the size of the analyte molecule. This provides an additional option to control selectivity through size, which is important for many problems in molecular diagnostics.
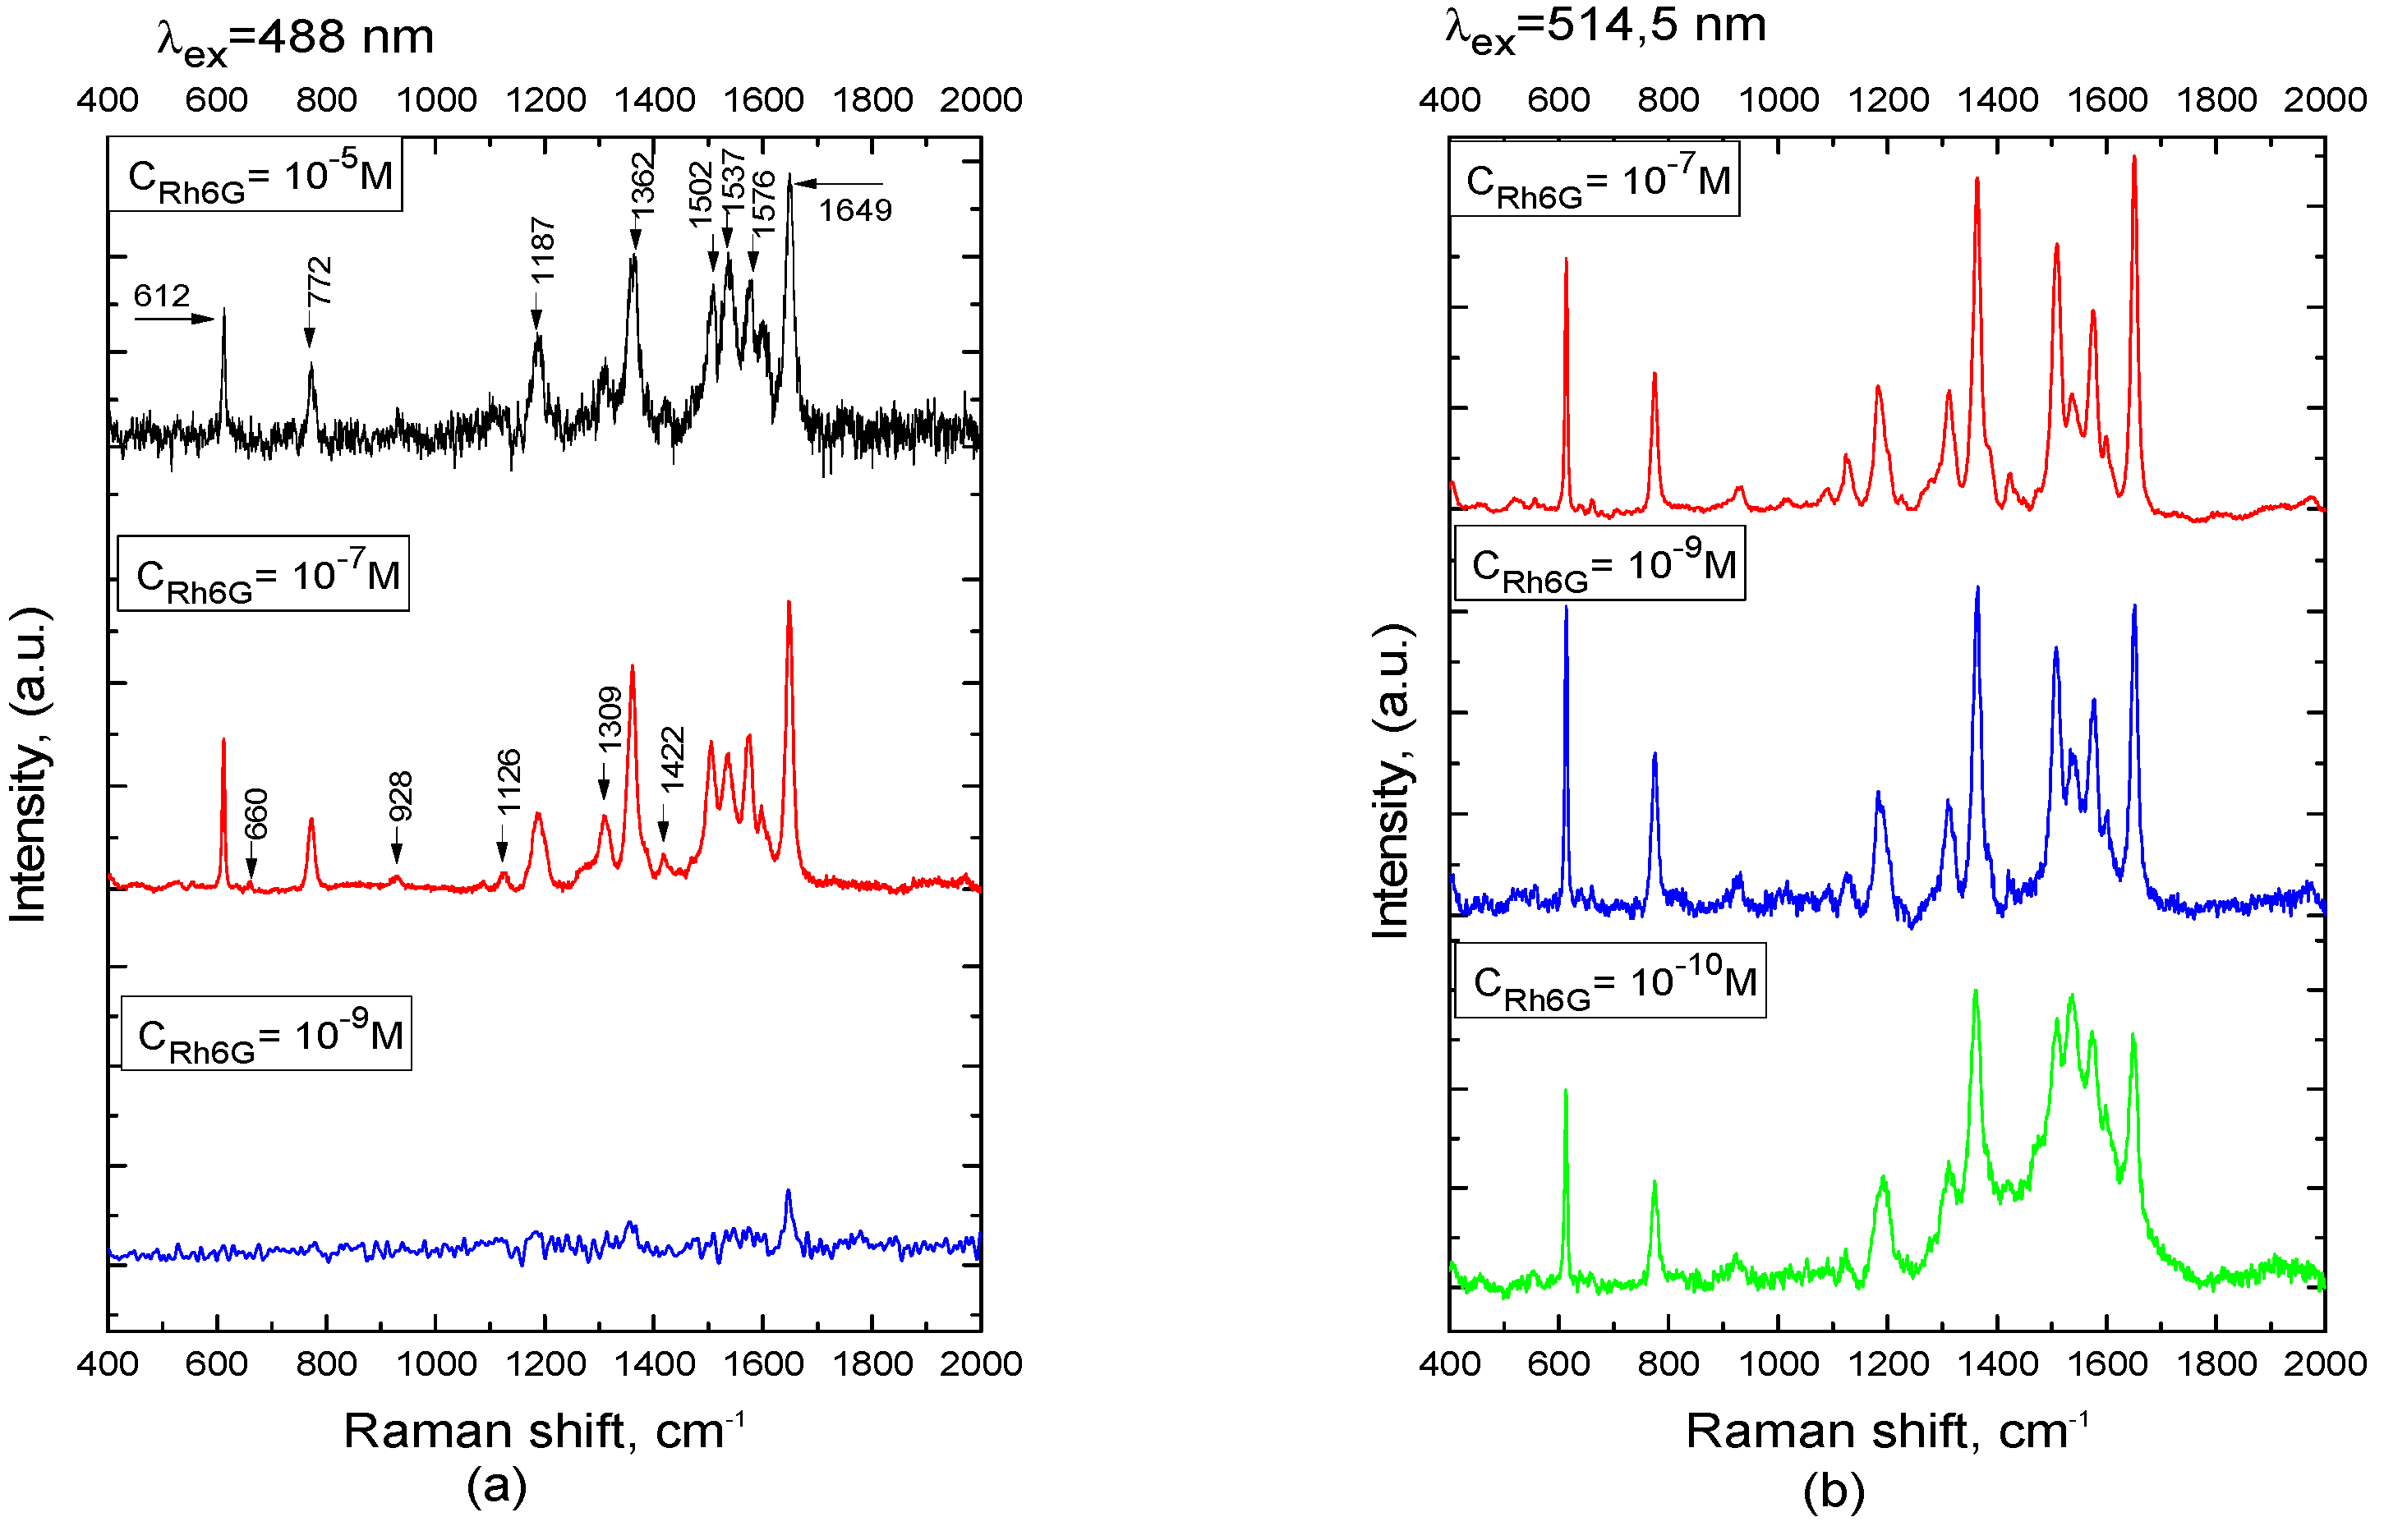
The Raman spectra of Rh6G molecules were measured at excitation wavelength λex = 514.5 nm, which corresponds to the energy of the intramolecular transition from the ground to the excited state, and λex = 488.0 nm close to the shoulder at 490 nm, due to vibronic interaction [20]. For all Raman bands presented in Figure 3a,b of the spectra, the characteristic Raman lines can be assigned to the corresponding oscillations in a similar way: the bands between 1300 cm−1 and 1650 cm−1 are due to vibrational C-C modes of xanthene ring stretching, and the bands at 612 and 775 cm−1 are vibrations associated with bending modes, respectively, C-C-C in the plane of the xanthene ring and C-H out of plane [21,22]. Compared to the Raman scattering of Rh6G molecules on glass with a concentration of 10–3 M, porous Au nanostructures show a significant enhancement of the bands at 612, 772, 1362, and 1649 cm–1; bands are also identified at 660, 928, 1087, 1126, and 1422 cm−1.
Comparison of the Raman spectra obtained at different excitation wavelengths unambiguously indicates an increase in the intensity of the bands at λex = 514.5 nm by a factor of 2 at a Rh6G concentration of CRh6G = 10−7 M and by a factor of 15 for CRh6G = 10−9 M. It should be noted that the low detection limit for Rh6G upon excitation at 488 nm is only ca. 10−9 M, which is due to the features of the Raman amplification mechanism beyond the plasmonic band. The differences in the Raman spectra also indicate that the amplification mechanisms are somewhat different in these spectral ranges.
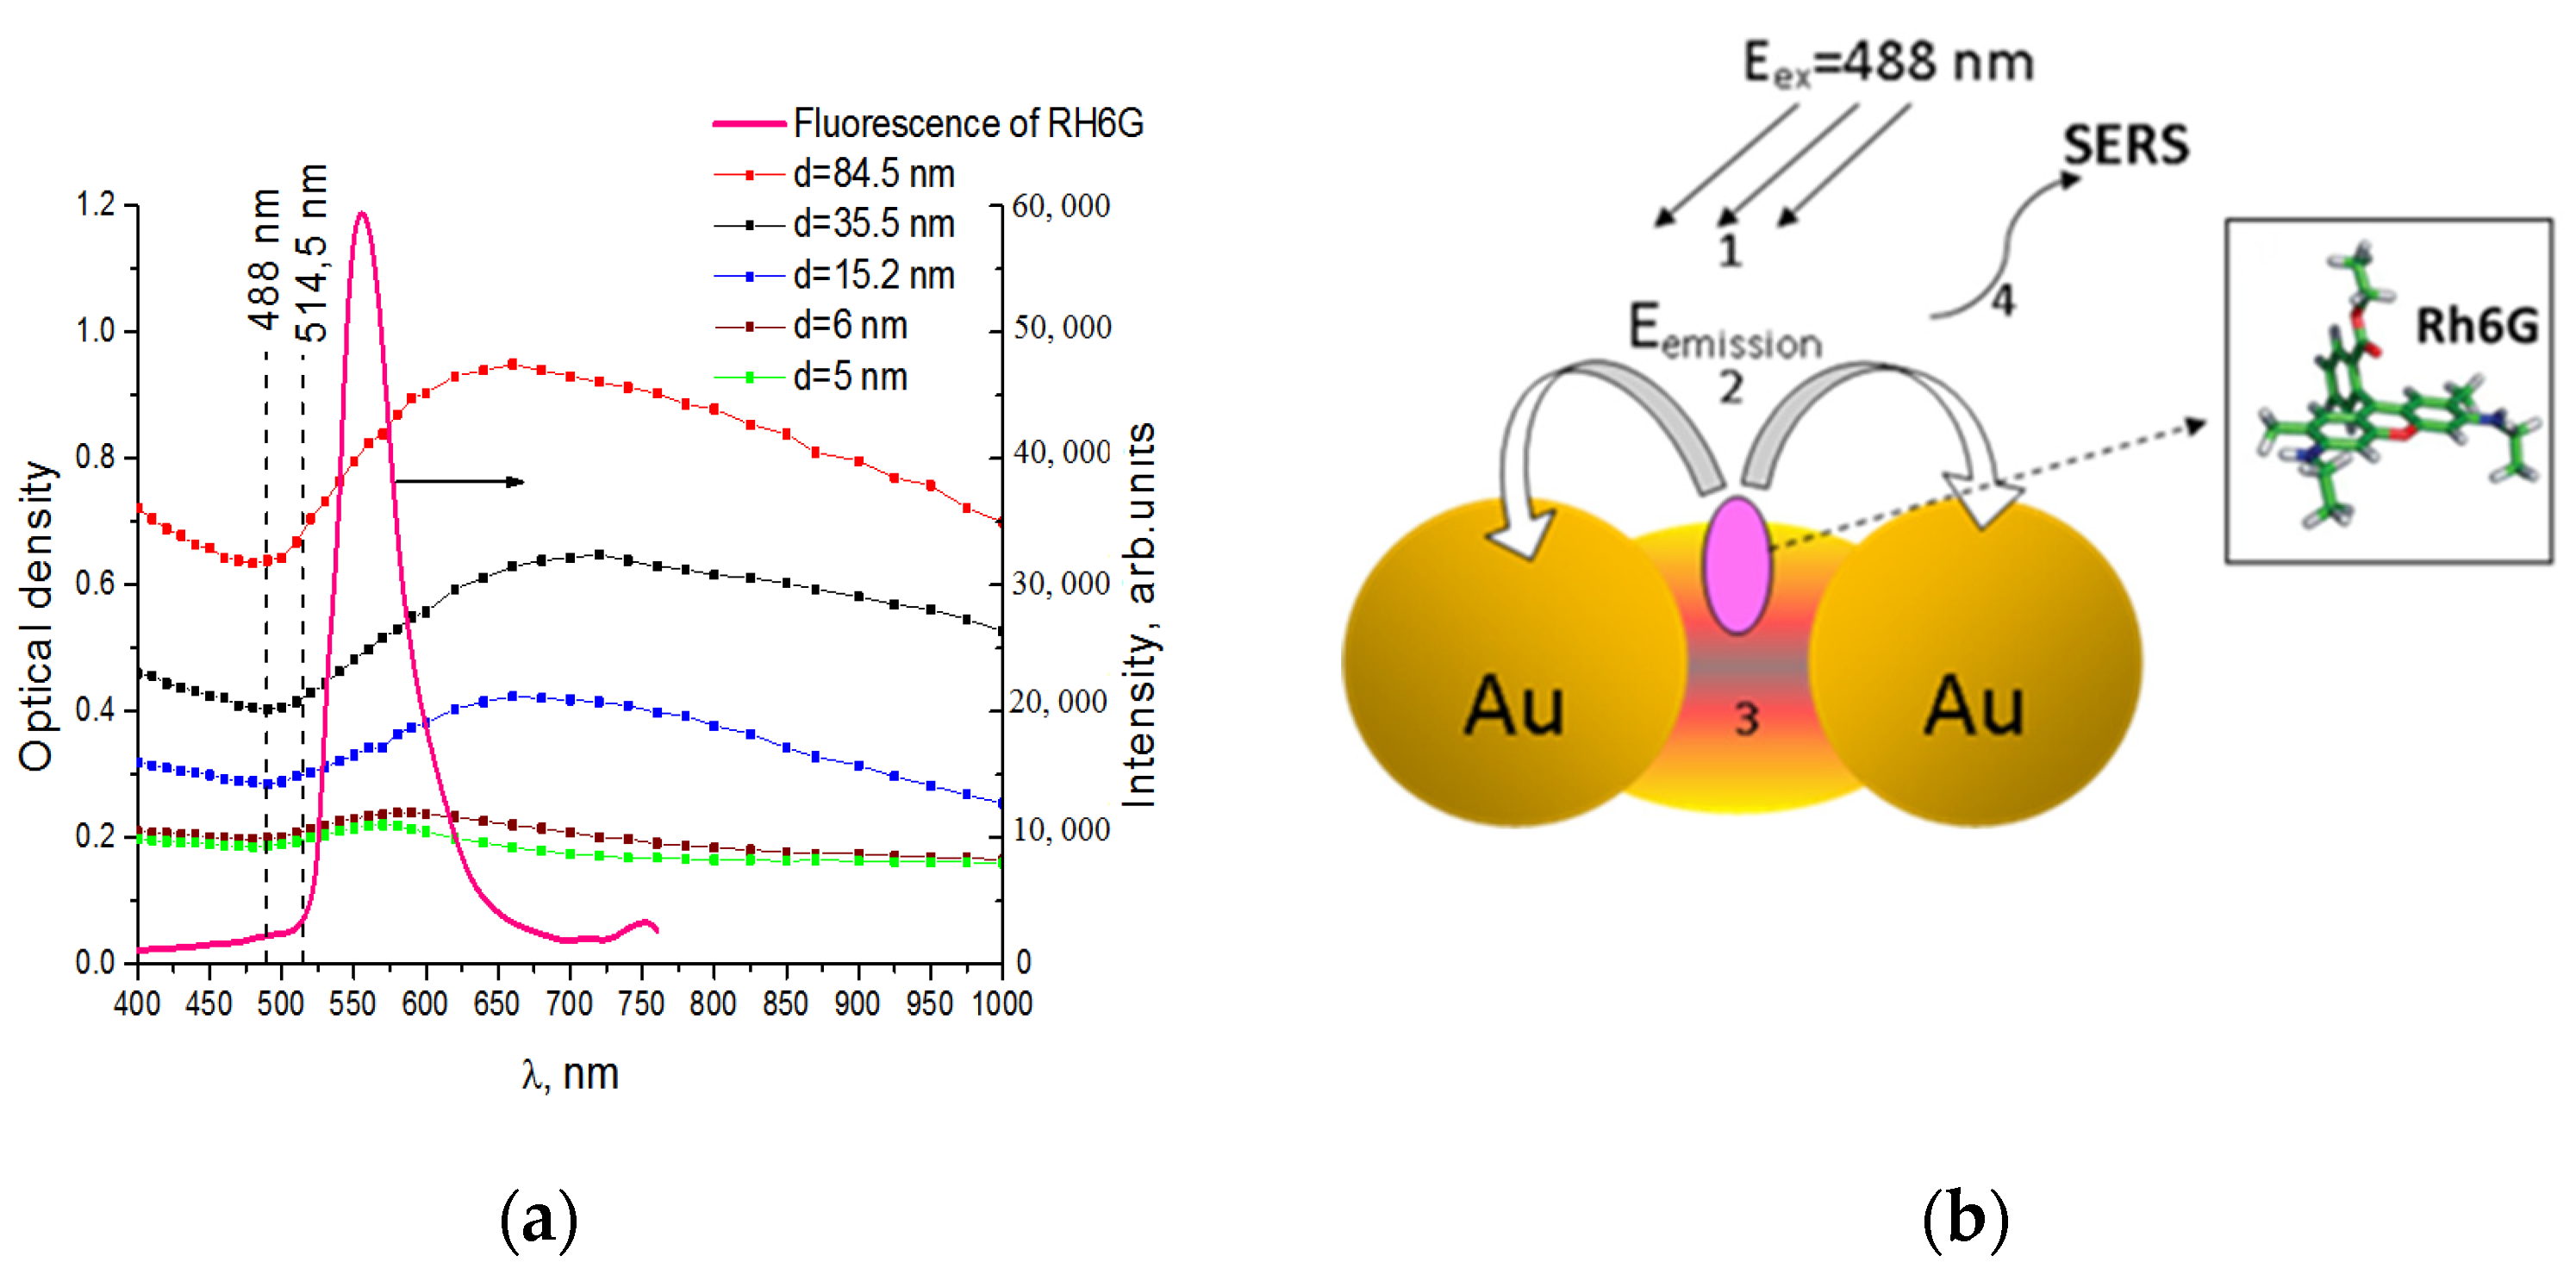
The significant enhancement of the Raman signal indicates not only the contribution of Rhodamine molecule resonant excitation (the position λex coincides either with the absorption maximum (ca. 528 nm) or with the first vibronic state (c.a. 490 nm)), typically weak and non-resonant chemical amplification, but also the electromagnetic amplification in the areas of hot spots, located mainly within the internal pores of the material. In contrast to Raman excitation at 514.5 nm, where resonant excitation of LSP in Au NPs and field enhancement in pores are possible, the excitation wavelength 488 nm is outside the region of LSPR, as can be seen from Figure 4a. Despite the fact that the scattering intensity is lower when excited at 488 nm than at 514 nm, its efficiency is still high enough to be explained only by resonant scattering in the region of the first vibronic transition. This contradiction can be overcome if we assume that the enhancement of Raman scattering is due to the combined action of the mentioned above processes with the following mechanism—excitation of LSPR of gold nanoparticles forming a nanogap occurs as a result of re-emission (luminescence) of laser excitation by Rhodamine 6G molecules as a result of the process of optical frequency down-conversion (see Figure 4b).
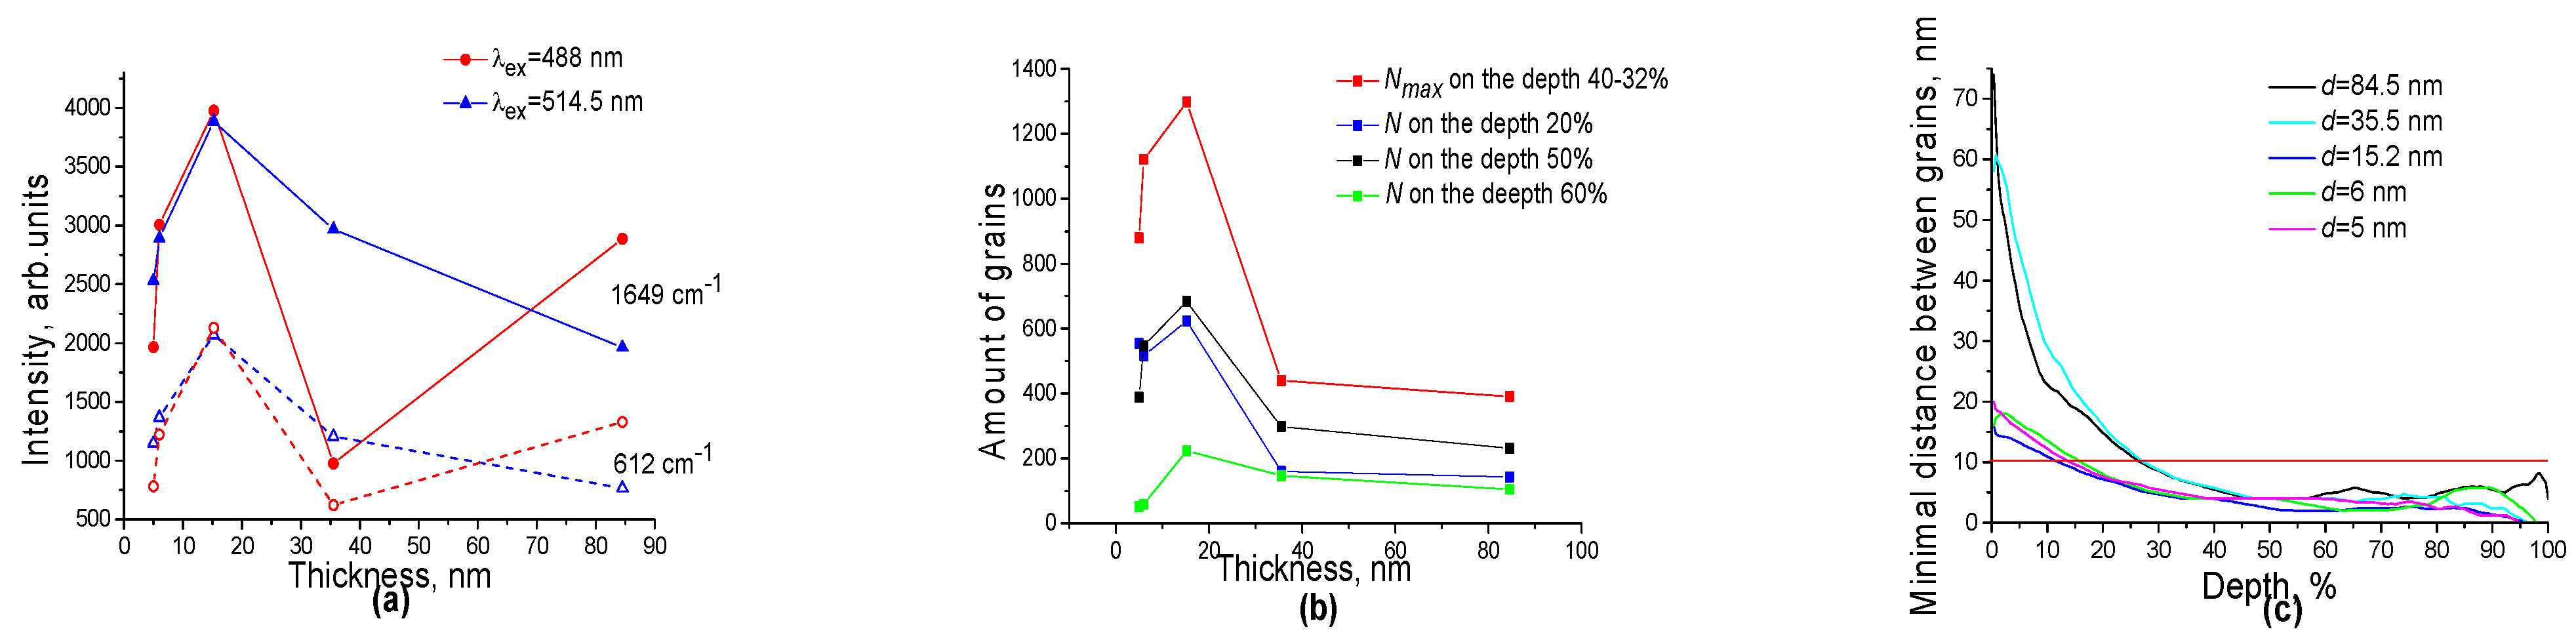
Figure 5a shows the dependencies of the Rh6G SERS intensity for the high intensity bands at 612 cm–1 and 1649 cm–1 on the film thickness d, which, in turn, is characterized by certain pore and NP size distributions. As can be seen from the figure, the highest Raman intensity has a structure with a film thickness of about 15.2 nm, with the smallest average pore size of 5 nm and an average NP diameter of 9 nm. These data correlate well with the results of the analysis of AFM images, namely, the number of crystallites and the smallest distance between them (nanogap size) presented in Figure 5b,c.
As is known for the electromagnetic amplification mechanism, the enhancement of the SERS intensity depends on the number of hot spots, i.e., on the number of nanoparticles with distances between them of less than 10 nm. The data of AFM image processing in the layer-by-layer mode show that for 3D nanostructures of different thicknesses, the number of isolated particles N increases with increasing depth and reaches the maximum value Nmax at a depth of 40–32% (Figure 5b); in this case, the distance between grains is in the range of 4–6 nm (Figure 5c). As the depth increases to 100%, the number of isolated grains sharply decreases, and the fill factor tends to 94.7–99%. The maximum value of the number of grains with a minimum distance between them of 4 nm is observed precisely for a region with a thickness of 15.2 nm; this area is characterized by the highest density of hot spots. It should be specially emphasized that it is for this region that the absorption spectrum of the local SPR overlaps best with the emission spectrum of Rh6G molecules, which indicates that the reemission mechanism can indeed take place in the case under consideration (Figure 4a). Moreover, regardless of the distance (depth) into the nanostructure, it is for this film thickness that the largest value of N is observed at the smallest distances between grains (Figure 5c). As the depth increases, the average minimum distance between isolated grains decreases, but due to the sharp decrease in the number of isolated grains, the density of active centers with high electric fields decreases. From the analysis of the dependencies of the isolated grains number and the average minimal distance between them in depth for each region of the nanostructure, it was found that the efficiency of the formed porous 3D SERS substrates is determined by the inner layers, where the density of hot spots is the maximum, i.e., the largest number of grains with distances of less than 10 nm. It should be noted that since the minimal distances between grains at the maximum depth of the nanostructure approximately correspond to the Rh6G molecule size of 1.4 nm [23], then the dye can diffuse deep into the material, which ensures the collection of more molecules.
4. Conclusions
In summary, for advanced SERS-sensing we developed porous 3D wedge-shaped nanoarchitectures based on close-packed multilayers of Au NPs with a porosity of 38–70%, nanoparticle sizes of 25–7 nm and 3D spatially distributed high-density pores with a size of 30–2 nm. The SERS substrate demonstrated strong Raman enhancement ofRh6G molecules under resonant excitation by radiation λex = 488.0, 514.5 nm, where the dominant contributor to the detected SERS signals is the hot spots, located mainly within the internal pores of the material. A distinctive feature in the enhancement of SERS at different excitation lengths is the mechanism of excitation of hot spots: at 514 nm they are excited both directly and through reemission of laser radiation, and at 488 nm most likely by emission of a fluorescent Rhodamine molecule excited by incident radiation.
Studies of the effect of structural parameters of 3D arrays on Raman intensity amplification confirm that the high SERS enhancements result from smaller pore sizes of ~5 nm correlating with Rhodamine molecule dimension of 1.4 nm and the highest amount of pores, which promote electromagnetic field enhancements and provide more active sites for molecules.
Thus, the porous wedge-shaped 3D Au NP arrays demonstrate significant potential for use in highly sensitive SERS owing to (1) high density 3D hot-spots; (2) selectivity through size; (3) an increase in the surface area and, accordingly, the amount of the analyte diffusing into the depth of the material and (4) the realization of the plasmon resonance condition for a wide range of excitation wavelengths.
Author Contributions
Conceptualization, B.S. and I.K. (Iryna Krishchenko); methodology, B.S., I.K. (Iryna Krishchenko) and I.K. (Ivanna Kruglenko); software, E.M.; validation, sample preparation I.K. (Iryna Krishchenko), S.K. and E.M.; investigation, I.K. (Iryna Krishchenko), I.K. (Ivanna Kruglenko) and S.K.; writing—original draft preparation, I.K. (Iryna Krishchenko) and B.S.; writing—review and editing, I.K. (Iryna Krishchenko), S.K., I.K. (Ivanna Kruglenko), E.M. and B.S. All authors have read and agreed to the published version of the manuscript.
Funding
This research received no external funding.
Institutional Review Board Statement
Not applicable.
Informed Consent Statement
Not applicable.
Data Availability Statement
Data are available on request.
Conflicts of Interest
The authors declare no conflict of interest.
References
- Fan, M.; Andrade, G.; Broloet, A. A review on the fabrication of substrates for surface enhanced Raman spectroscopy and their applications in analytical chemistry. Anal. Chim. Acta 2011, 693, 7–25. [Google Scholar] [CrossRef] [PubMed]
- Naya, M.; Tani, T.; Tomaru, Y.; Li, J.; Murakami, N. Nanophotonics bio-sensor using gold nanostructure. Proc. SPIE 2008, 7032, 70321Q/1–70321Q/9. [Google Scholar] [CrossRef]
- Fang, J.; Siyun, L.; Li, Z. Polyhedral silver mesocages for single particle surface-enhanced Raman scattering-based biosensor. Biomaterials 2011, 32, 4877–4884. [Google Scholar] [CrossRef]
- Jackson, J.B.; Halas, N.J. Surface-enhanced Raman scattering on tunable plasmonic nanoparticle substrates. Proc. Natl. Acad. Sci. USA 2004, 101, 17930–17935. [Google Scholar] [CrossRef] [PubMed] [Green Version]
- Wustholz, K.L.; Henry, A.-I.; McMahon, J.M.; Freeman, R.G.; Valley, N.; Piotti, M.E.; Natan, M.J.; Schatz, G.C.; Van Duyne, R.P. Structure-Activity Relationships in Gold Nanoparticle Dimers and Trimers for Surface-Enhanced Raman Spectroscopy. J. Am. Chem. Soc. 2010, 132, 10903–10910. [Google Scholar] [CrossRef] [PubMed]
- Tanabe, K. Field Enhancement around Metal Nanoparticles and Nanoshells: A Systematic Investigation. J. Phys. Chem. C. 2008, 112, 15721–15728. [Google Scholar] [CrossRef]
- Krishchenko, I.; Manoilov, E.; Snopok, B.; Verdini, A.; Goldoni, A. Advanced Nanotechnologies for Multivariate Sensor Fabrication. In Advanced Technologies for Security Applications (NATO Science for Peace and Security Series B: Physics and Biophysics), 1st ed.; Palestini, C., Ed.; Springer: Leuven, Belgium, 2020; pp. 97–108. [Google Scholar]
- Domenicia, F.; Fasolatoa, C.; Mazzia, E.; De Angelisa, L.; Brasilia, F.; Muraf, F.; Postorinoa, P.; Bordia, F. Engineering microscale two-dimensional gold nanoparticle cluster arrays for advanced Raman sensing: An AFM study. Colloids Surf. A Physicochem. Eng. Asp. 2016, 498, 168–175. [Google Scholar] [CrossRef]
- Okeil, S.; Schneider, J.J. Controlling surface morphology and sensitivity of granular and porous silver films for surface-enhanced Raman scattering, SERS. Beilstein J. Nanotechnol. 2018, 9, 2813–2831. [Google Scholar] [CrossRef] [Green Version]
- Kaganovich, E.B.; Krischenko, I.M.; Kravchenko, S.A.; Manoilov, E.G.; Golichenko, B.O.; Kolomys, A.F.; Strel’chuk, V.V. SERS spectroscopy of nanocomposite porous films containing silver nanoparticles. Opt. Spectrosc. 2015, 118, 294–299. [Google Scholar] [CrossRef]
- Jiang, J.; Bosnick, K.; Maillard, M.; Brus, L. Single Molecule Raman Spectroscopy at the Junctions of Large Ag Nanocrystals. J. Phys. Chem. B 2003, 107, 9964–9972. [Google Scholar] [CrossRef]
- Ding, S.-Y.; You, E.-M.; Tianab, Z.-Q.; Moskovits, M. Electromagnetic theories of surface-enhanced Raman spectroscopy. Chem. Soc. Rev. 2017, 46, 4042–4076. [Google Scholar] [CrossRef] [PubMed]
- Kleinman, S.L.; Frontiera, R.R.; Henry, A.-I.; Dieringer, J.A.; Van Duyne, R.P. Creating, characterizing, and controlling chemistry with SERS hot spots. Phys. Chem. Chem. Phys. 2013, 15, 21–36. [Google Scholar] [CrossRef] [PubMed]
- Miccichè, C.; Arrabito, G.; Amato, F.; Buscarino, G.; Agnello, S.; Pignataro, B. Inkjet printing Ag nanoparticles for SERS hot spots. Anal. Methods 2018, 10, 3215–3223. [Google Scholar] [CrossRef]
- Krishchenko, I.M.; Manoilov, É.G.; Kravchenko, S.A.; Snopok, B.A. Resonant Optical Phenomena in Heterogeneous Plasmon Nanostructures of Noble Metals: A Review. Theor. Exp. Chem. 2020, 56, 67–110. [Google Scholar] [CrossRef]
- Alexander, K.D.; Hampton, M.J.; Zhang, S.; Dhawan, A.; Xuc, H.; Lopeza, R. A high-throughput method for controlled hot-spot fabrication in SERS-active gold nanoparticle dimer arrays. J. Raman Spectrosc. 2009, 40, 2171–2175. [Google Scholar] [CrossRef]
- Huang, Y.; Zhou, Q.; Hou, M.; Ma, L.; Zhang, Z. Nanogap Effects on Near- and Far-Field Plasmonic Behaviors of Metallic Nanoparticle Dimers. Phys. Chem. Chem. Phys. 2015, 17, 29293–29298. [Google Scholar] [CrossRef]
- Radzuik, D.; Moehwald, H. Prospects for plasmonic hot spots in single molecule SERS towards the chemical imaging of live cells. Phys. Chem. Chem. Phys. 2015, 17, 21072–21093. [Google Scholar] [CrossRef] [Green Version]
- Kladko, V.P.; Gudymenko, O.Y.; Kriviy, S.B.; Litvin, P.M.; Kaganovich, E.B.; Krishchenko, I.M.; Manoilov, E.G. Reflectometry study of nanoporous films with arrays of gold nanoparticles. Ukr. J. Phys. 2014, 59, 915–921. [Google Scholar] [CrossRef]
- Guthmuller, J.; Champagne, B. Resonance Raman Scattering of Rhodamine 6G as Calculated by Time-Dependent Density Functional Theory: Vibronic and Solvent Effects. J. Phys. Chem. A 2008, 112, 3215–3223. [Google Scholar] [CrossRef]
- Watanabe, H.; Hayazawa, N.; Inouye, Y.; Kawata, S. DFT Vibrational Calculations of Rhodamine 6G Adsorbed on Silver: Analysis of Tip-Enhanced Raman Spectroscopy. J. Phys. Chem. B 2005, 109, 5012–5020. [Google Scholar] [CrossRef]
- Majoube, M.; Henry, M. Fourier transform Raman and infrared and surface-enhanced Raman spectra for rhodamine6G. Spectrochim. Acta 1991, 47, 1459–1466. [Google Scholar] [CrossRef]
- Chapman, M.; Euler, W.B. Rhodamine 6G Structural Changes in Water/Ethanol Mixed Solvent. J. Fluoresc. 2018, 28, 1431–1437. [Google Scholar] [CrossRef] [PubMed]
Figure 1.
Schematic illustration of pulsed laser deposition Au nanoparticle arrays with a wedge-shaped profile. The film grows on the substrate located in the target plane from the backward flow of low-energy erosion torch particles. In the “back flow” mode, the separation of Au NP by their sizes occurs: large particles are deposited closer to the plasma plum axis, while smaller ones are wide apart. The structure of the films depends on the gas (e.g., argon) pressure, energy density of laser pulses, and their number and substrate position in relation to the plasma plum axis.

Figure 2.
AFM images for Au NP arrays with different average thickness d, Au NP diameters D, pore sizes range r: (a) d = 84.5 nm, D = 25 nm, r = (30 ÷ 2) nm; (b) d = 35.5 nm, D = 25 nm, r = (40 ÷ 2) nm; (c) d = 15.2 nm, D = 9 nm, r = (14 ÷ 2) nm; (d) d = 5 nm, D = 7 nm, r = (18 ÷ 2) nm. The line profiles in each AFM image represent the height information along the line.

Figure 3.
SERS spectra of different Rh6G concentration CRh6G on the porous Au NP arrays measured on a region with d =15.2 nm at excitation wavelength λex = 488 nm-(a), λex = 514.5 nm-(b).
Figure 3.
SERS spectra of different Rh6G concentration CRh6G on the porous Au NP arrays measured on a region with d =15.2 nm at excitation wavelength λex = 488 nm-(a), λex = 514.5 nm-(b).

Figure 4.
(a) Optical spectra of nanoporous Au arrays measured ondifferent thicknesses d along substrate and fluorescence spectrum of Rh6G. (b) Schematic representation of the SERS mechanism in the nanogap between gold nanoparticles at the excitation wavelength of 488 nm. As a result of excitation of Rh6G molecules (1), fluorescence (2) arises in the region of 560 nm, which overlaps with the region of excitation of LSPR in Au NPs (Figure 4a); therefore, the emission of dye molecules can generate plasmon resonance. As a result, an intense electric field is localized in the nanogap between nanoparticles (3), which significantly enhances the radiation scattered by the Rh6G molecule (4).

Figure 5.
Comparison of the Raman efficiency and features of the SERS substrate structure. (a) Dependencies of the SERS intensity at a Rh6G concentration of 10−7 M for the 612 cm−1 and 1649 cm−1 bands on the nanostructure thickness. (b) Dependencies of amount of grains N on the nanostructure thickness at the different depth. (c) Dependencies of average minimal distance between grains on the depth for each area of the specified thickness.

Publisher’s Note: MDPI stays neutral with regard to jurisdictional claims in published maps and institutional affiliations. |
© 2022 by the authors. Licensee MDPI, Basel, Switzerland. This article is an open access article distributed under the terms and conditions of the Creative Commons Attribution (CC BY) license (https://creativecommons.org/licenses/by/4.0/).
Share and Cite
MDPI and ACS Style
Krishchenko, I.; Kravchenko, S.; Kruglenko, I.; Manoilov, E.; Snopok, B. 3D Porous Plasmonic Nanoarchitectures for SERS-Based Chemical Sensing. Eng. Proc. 2022, 27, 41. https://doi.org/10.3390/ecsa-9-13200
AMA Style
Krishchenko I, Kravchenko S, Kruglenko I, Manoilov E, Snopok B. 3D Porous Plasmonic Nanoarchitectures for SERS-Based Chemical Sensing. Engineering Proceedings. 2022; 27(1):41. https://doi.org/10.3390/ecsa-9-13200
Chicago/Turabian StyleKrishchenko, Iryna, Sergii Kravchenko, Ivanna Kruglenko, Eduard Manoilov, and Boris Snopok. 2022. "3D Porous Plasmonic Nanoarchitectures for SERS-Based Chemical Sensing" Engineering Proceedings 27, no. 1: 41. https://doi.org/10.3390/ecsa-9-13200