
Regional Integration in the West African Economic and Monetary Union (WAEMU): Complementarity or Competition?

Laboratory of Public Economics, Faculty of Economics and Management, University of Abomey-Calavi, Abomey-Calavi 02BP 2163, Gbégamey-Cotonou, Benin
Economies 2022, 10(1), 22; https://doi.org/10.3390/economies10010022
Submission received: 24 October 2021
/
Revised: 1 January 2022
/
Accepted: 5 January 2022
/
Published: 11 January 2022
(This article belongs to the Section Economic Development)
Abstract
:This paper analyzes and characterizes the nature of the interactions between countries of the West African Economic and Monetary Union (WAEMU) over the period 1995–2015. The analysis uses sigma-convergence on the one hand and the Dendrinos-Sonis spatial competition model estimated by the SUR method on the other hand. The results show a lack of convergence of living standards and support the idea of income polarization in space; these results also support the idea of a very poorly integrated region with relatively competitive interrelationships. The paper suggests the acceleration of regional integration in the WAEMU region combined with the implementation of inclusive integration policies that promote each member’s comparative advantage.
1. Introduction
According to its founding act, the West African Economic and Monetary Union (WAEMU) aims to create a harmonized and integrated economic space favourable to economic and social development with fulfilled citizens. It places particular emphasis on the balanced development of the Community area. It proposes to achieve this the optimization of the assets and potentialities of each Member State in a complementary perspective. Numerous additional protocols, additional acts and directives form the framework of WAEMU initiatives to establish an integrated zone with the key to the adoption of a Convergence, Stability, Growth and Solidarity Pact. This dynamic is supported by numerous theoretical and empirical developments in the economic literature. Indeed, cooperation and economic integration are seen as levers for promoting1 productivity, economic growth and job creation and are likely to increase the well-being of the countries participating in them (Viner 1950). They allow member countries to better sharpen their weapons in a regional framework to develop the capacity and confidence necessary to attack international and more demanding markets (Rouis and Tabor 2012). Better regional integration and the development of trade that it fosters make it possible to promote peace and build peaceful regions (Schiff and Winters 1998; Palachek 1999). Integration is, therefore, a tool for development and progress.
However, economic integration has not always been a catalyst for development. It sometimes has and according to specific trends, reinforced the vulnerability and fragility of certain member countries or, in some cases, provoked conflicts. Reinert and Kattel (2013) showed that regional integration could lead to asymmetric results. For instance, regional integration combined with integration into the world economy may devastate the industrial structures in some members’ states, indicating that regional integration can lead to a lose-win/zero-sum game type of integration, rather than a win-win flying geese type. Hugon (2014) believes that in a situation of asymmetry in size and economic potential, the dominant country is the main beneficiary of openness and regionalization. It considers that this is the case for Brazil in Mercosur, South Africa in SADC, Côte d’Ivoire in WAEMU or Kenya at the ECA level. Regionalization can therefore promote polarization of income or development in favour of one country to the detriment of another.
As far as WAEMU is concerned, this polarization is clearly perceptible in the economic literature. Decaluwé et al. (2000) questioned the factors of convergence or divergence in development, resulting from the reallocation of resources and trade generated by the creation of the Union between the member countries. They showed that Côte d’Ivoire, which has the ratio of factors of production the least distant from the world mean average, is the country that benefits the most from the regional integration process. Conversely, Burkina Faso sees its situation deteriorates. The mobility of labour and industrial capital accentuates the phenomenon of divergence between the WAEMU member states. Thus, Senegal, and to a lesser extent Togo, would see their situation deteriorate in the long term compared to the baseline scenario due to the flight of industrial capital and consequently the widening of their development gap with Côte d’Ivoire. Ndiaye (2006), based on the per capita GNP levels of the African economies of the Franc Zone, shows that the WAEMU regional convergence process is relatively slow. Its results reveal two subsets or convergence clubs in the WAEMU; one club of countries would converge above the average and the another would converge below the average of per capita income levels. This conclusion, close to the work of Venables (1999), reinforces the idea of sometimes asymmetrical benefits that could result from cooperation, a customs union or integration.
Indeed, The WAEMU is the West African economic and monetary union created in 1994. This union includes eight countries: Benin, Burkina Faso, Côte d’Ivoire, Guinea-Bissau, Mali, Niger, Senegal, and Togo. These countries share the same money, West African francs (CFA francs), monetary policies, and French as an official language. The union’s objective is to promote regional economic integration and create a common market. Benin, Cote d’Ivoire, Guinea Bissau, Senegal and Togo are on the coast of West Africa, whereas Burkina Faso, Mali and Niger are landlocked countries. Besides, all the eight countries form a closed geographic area, indicating that each country shares the same border with at least one of the eight members.
Stylized facts from the WAEMU region, support the argument that some countries, namely leaders of the integration union, can monopolize the entire benefit of the cooperation. In particular, we can note that in the WAEMU region the share of exports of Cote d’Ivoire and Senegal within the union represents more than 60% of the overall exports (BCEAO 2020). Equally, according to the last decade’s statistics, the best economic performance is about 6.72% which Cote d’Ivoire records while Guinea Bissau records the least performance at 3.85% (BCEAO 2020). These statistics indicate a high level of disparity in economic growth among the WAEMU countries. Moreover, there is a substantial income inequality indicating that Cote d’Ivoire has the highest GDP per capita (1950 $USD) and Niger and Togo back with the lowest GDP per capita (484 $USD and 567 $USD respectively). Yet, a comparative analysis of pre-WAEMU and post-WAEMU may lead to the inefficiency of the regional integration. For instance, the mean dispersion in the economic growth within the region was 1.26 before the WAEMU union, against 0.73 after the WAEMU, indicating some improvements in the convergence process. However, the mean income per capita dispersion was about 338 before the integration and 378 after the integration, indicating a slight divergence.
From these stylized facts, this research underlines the problem of the distributional effects of regional integration externalities within the WAEMU region. Consequently, the main question that arises from this research is to know whether regional integration leads to creation or diversion effects complementarity or competition within the cooperating countries. In particular, does regional integration promote income convergence within the WAEMU countries? If so, to what magnitude regional integration moves toward income convergence?
The rationale of this research is based on the lack of empirical studies within the region that investigated the convergence effects of regional integration. Indeed, many studies confirmed the growth effects of regional integration in Africa and other developing regions like Asia (Ejones et al. 2021; Liu 2016; Jalles 2012; Vamvakidis 1998). However, to the best of our knowledge, less attention has been devoted to on how the overall benefit of the regional integration is distributed among the country WAEMU. Yet, the WAEMU regional integration is one of the oldest integration union in Africa. Thus, the motivations for investigating regional integration’s effect in terms of income convergence are at least twofold. First, as the integration is costly (for example, loss of sovereignty), it is prominent to know the net return (in terms of growth and welfare benefits) of this choice. Second, the 10th sustainable development goal posits that reducing inequalities among countries is one requirement to achieve sustainable development.
Our investigation is based on two analysis tools; on the one hand, we calculate the sigma convergence to assess the degree of convergence or divergence of the trajectories of the different economies in the regional economy, and on the other hand, we use the analytical framework of Dendrinos and Sonis (1988, 1990) in order to assess the complementarity-competition relations between the countries of the WAEMU region. Our analysis covers the period 1995–2015 for the sake of data availability. The paper is organized around five sections. The second section presents the methodological framework, while the third session presents the results of the estimations and their analysis. The conclusions and policy implications complete the document.
2. Methodology
The methodological approach to analyzing the complementarity or competition relations between the WAEMU countries is organized into two points. First, we will evaluate the actual convergence of the economies of this region (using the sigma-convergence), and secondly, we’ll assess the possible effects of spatial interaction existing between the countries of space with Dendrinos and Sonis (1988, 1990) framework. The advantage of using two different methodological approaches is that the sigma-convergence analysis only considers the single overview of income dispersion among countries, with the Dendrinos and Sonis (1988, 1990) frameworks’ helps to capture the various interactions between countries.
2.1. Convergence Analysis: σ Convergence
The concept of convergence is frequently used in economic analysis. Integration in both WAEMU and ECOWAS, for example, refers to the convergence of a set of macroeconomic indicators. The WAEMU Convergence, Stability, Growth and Solidarity Pact imposes precise conditions for the convergence of a number of macro-budgetary variables. Many growth models have attempted to analyze the convergence of different economies (Baumol 1986; Barro 1991; Mankiw et al. 1992; Knight et al. 1993; Islam 1995; Berthélémy et al. 1997; Barro and Sala-i-Martin 1992). Convergence occurs when the difference between series or their dispersion is reduced over time. However, there are different convergence schemes and convergence measures. Fuss (1999) proposes an in-depth review of the literature. The economic literature essentially distinguishes between two notions of convergence: β-convergence, which focuses on the existence of a convergence mechanism, and σ-convergence, based on the evolution of the dispersion of GDP per capita of different economies over time. The β-convergence consists of testing a negative relationship between the growth rate and the initial value of GDP per capita. Widely used in the literature, this test has however, been the subject of many critics who disqualify on use (Quah 1993a, 1993b, 1994, 1996; Bernard and Durlauf 1991). These criticisms include the fact that it does not consider the non-stationarity of the variables, in particular the income variable. Moreover, it is blamed for its lack of clarity in the interpretation of the convergence result, the extent to which it is a victim of Galton, where a result that statistically reflects β-convergence can be associated with a constant or even increasing dispersion distribution. In the face of these criticisms, the σ-convergence is preferred (Fuss 1999). The use of the σ-convergence in the context of this study will make it possible to assess the trends of income polarization or not in the union, the periods most affected and whether, in total, the union is an area of integration of solidarity or individuality.
For all seven WAEMU countries considered in the analysis2, convergence will be assessed based on GDP per capita or from the sum of the square of national differences to the average value. Thus, consider the achievements of a convergence criterion C, for year i in the WAEMU countries j, and , the achievements’ average. The sigma-convergence associated with this criterion is measured by as described in Equation (1):
Between two years or periods, i and I + h, there is convergence if is greater than . The preference given to a simple average rather than a weighted average stems from the WAEMU Treaty, which confers the same importance on all member States, regardless of their economic size. Considering GDP per capita (GDPtt) as a convergence criterion, Equation (1) measured by becomes Equation (2):
To assess the significance of sigma-convergence hypothesis, the test of Carree and Klomp (1997) is applied. A statistic T is derived as a function of the evolution of the dispersion between two periods ( and ). This statistic is corrected by a catch-up factor of the estimator (with = 1+) associated with the beta-convergence equation estimated in instantaneous section:
The T statistically follows a reduced centered normal distribution under the null assumption that intra-community dispersions are constant over time against the alternative hypothesis of convergence as mentioned in (4):
In the application to the countries in our concern, the power of the test suffers from a limited number of observations, not compatible with the normal law underlying inference. With good statistics, Carree and Klomp (1997) applied this test to samples of our compatible size. However, out of caution, this analysis will be supplemented with a nonparametric Wilcoxon test that has the quality of being non-restrictive on assumptions of error normality. All estimations, statistical tests, and figures was done on the STATA version 15 software.
2.2. Variables and Data Sources
This study uses a sample of seven WAEMU countries (Benin, Burkina Faso, Côte d’Ivoire, Mali, Niger, Senegal, and Togo) over the period 1995–2015. The main interest variable is the gross domestic product per capita. GDP is the sum of gross value added by all resident producers in the economy plus any product taxes and minus any subsidies not included in the value of the products. It is calculated without deductions for depreciation of fabricated assets or depletion and degradation of natural resources. Thus, GDP per capita is gross domestic product divided by midyear population. Data on GDP per capita used are in constant 2015 U.S. dollars and come from the world development indicators database of the World Bank group. It should be noted that some countries in the zone have carried out rebasing and thus changed the base year for estimating their aggregate. The period 1995–2015 is still the period over which most countries concerned still keep the same basis for estimating their aggregate. We then made a choice to keep this study period to avoid scale bias.
2.3. Analysis of Spatial Interaction Effects
To assess the possible effects of spatial interaction, this paper uses the basic model of Dendrinos and Sonis (1988, 1990). This model has been used in several analyses of interaction between countries or regions belonging to the same central corpus (Hewings et al. 1996; Kamarianakis and Kaslis 2005; Nazara et al. 2001; Bonet 2003). This model is able to generate results for the structure of the spatial correlation between the regions of a given country. It is also possible to examine the effects of a region, country or locality on these neighbours. It has also been used to analyze vertical or hierarchical relationships between regions or localities (Nazara et al. 2006). Regional growth theories explain the growth of a region as the result of a zero-sum or non-zero-sum game (Magalhaes et al. 2001). In the idea of the zero-sum game, the growth of a country is necessarily to the detriment of another country, which gives an important place to the interrelationship or strategic relations between countries or regions. In the second idea of a non-zero-sum game, the growth of a region can also depend on endogenous processes of self-maintenance or self-generation of it. Dendrinos-Sonis built their model based on the zero-sum game hypothesis. However, it is important to note that the outcome of the zero-sum game is related to relative growth between countries or regions and not to absolute growth. In other words, it accepts that a country or locality in a region can record growth in absolute terms (increase in its GDP) while its relative share between product terms (GDP) at the regional level decreases.
This paper is inspired by the application of the Dendrinos-Sonis model by Nazara et al. (2001) and Bonet (2003). The basic model is as follows. Let be the relative income (relative to that of the region) of country i at time t. In this paper, we use the national shares of regional GDP (per capita). If we consider n countries in the economic union, we can define the vector as follows:
The relative discrete socio-spatial dynamics can be described as follows in Equation (5):
where, the function can take any arbitrary form provided that it satisfies the property of positivity. If the first country is chosen as the currency, or reference country, then:
Using Equation (6), the process described in Equation (5) can also take the form of the following system of Equation (7):
As the numerary guaranteed that the sum of the national shares gives one, it plays an important role in the model. This implies that the growth of one country is not independent of that of another country. Thus, the Dendrinos-Sonis model perhaps perceived as a framework for analyzing a competition model in terms of share (Nazara et al. 2001). In this model, each country competes for the largest share of regional GDP, and as mentioned earlier, absolute growth is not synonymous with relative growth.
Following Dendrinos and Sonis (1988), we adopt a log-linear specification of :
where in Equation (8) represents the position or location advantage of each country and the coefficient as described in Equation (9) can take the form
Equation (9) can be interpreted as national growth elasticities with . In other words, is the percentage of growth of the country relative to country 1, the numerary, following a change of 1% in the growth in the country .
By linearizing, Equation (8) becomes:
This model makes it possible to capture the state interactions in which each country tries to compete in order to increase its share in regional GDP. Each country’s performance depends on two factors: (i) its comparative advantage and (ii) the behaviour of other countries in the region. This second factor is captured through the sign and amplitude of the coefficient . A negative sign of this coefficient implies a competitive relationship between countries and ; in other words, when the share of the country’s regional GDP increases that of the country decreases relative to the numerary country and vice versa. Otherwise, a positive coefficient would indicate a relationship of complementarity between the countries and . In this case, when the country increases its share in the regional GDP, the country also increases its share always relative to the numerary country.
We estimate Equation (10) by the seemingly unrelated regression (SUR) method. Since we are dealing with a system of equations having the same explanatory variables, Equation (10) is estimated using a seemingly unrelated estimator (SUR). The SUR technique employed also makes sure that the solution achieves the maximum log of the likelihood function.
3. Results
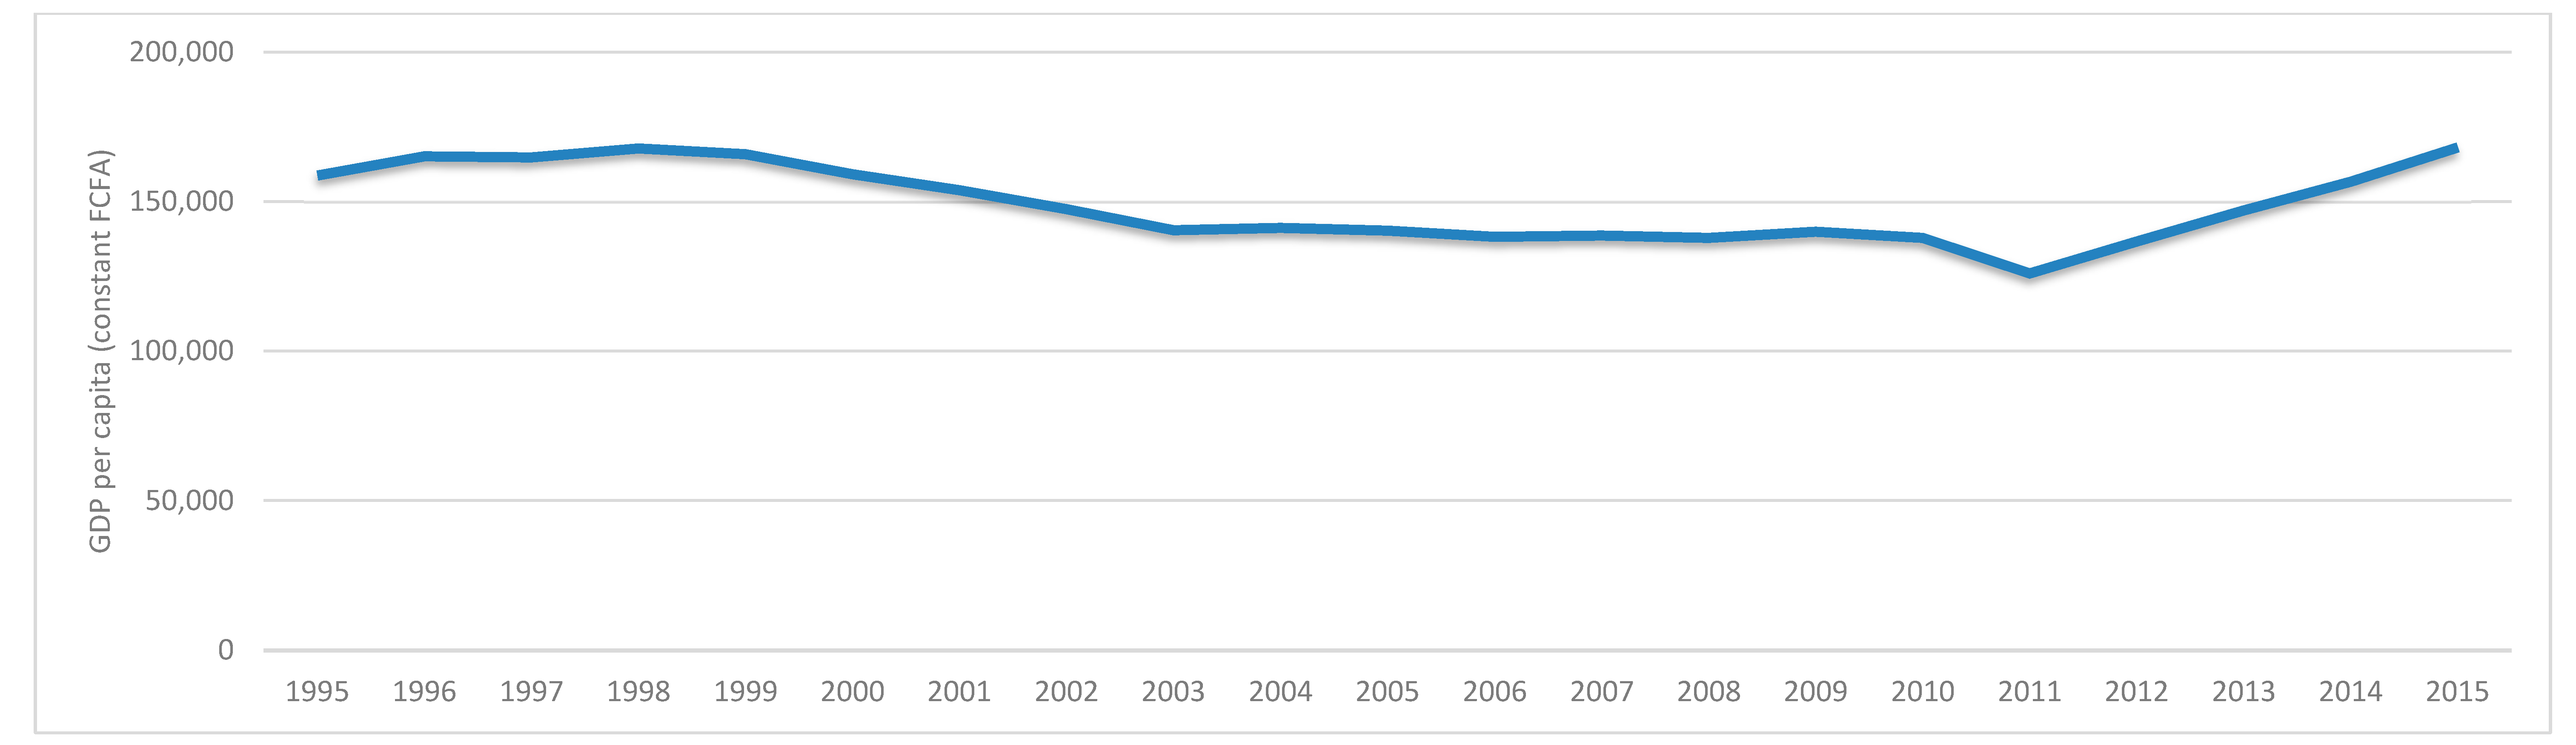
Table 1 presents results of sigma-convergence within the WAEMU region. Figure 1 shows the evolution of the sigma-convergence of GDP per capita over the period 1995–2015, it appears that the dispersion decreased from 1995 to 2011 before gradually worsening until 2015. Overall, the Tests of Carree and Klomp (1997) and Wilcoxon do not statistically reject the significance of sigma-convergence over the period 1995–2005 even if we observe a rejection of this significance by the first test for the period 1995–2000.
From Table 1 and Figure 1, we can conclude that the convergence of GDP per capita in the WAEMU records three phases. The first phase of convergence lasted seven years and which goes from 1995 to 2003 (start of the implementation of the treaty), then the second phase of stagnation or parallel evolution of the GDP per capita, which also lasted about seven years (2003–2010), and finally the current phase of substantial divergence which has lasted since 2010. These results, suggest a slowdown in the Spirit of Solidarity of the Union and a gradual seizure of power by unilateral or individualist tendencies.
A cross-reading of these results with community activities makes it possible to understand these dynamics. The region has common sectoral policies in several areas (agriculture, energy, environment, industry, culture, mining, transport, etc.) and directives for harmonizing several frameworks, including that of public finance, trade policy and justice. Since the adoption of these policies in the early 2000s (for their majority), their implementation remains essentially at the stage of regulatory and institutional arrangements. While this situation could be explained by the need to ensure that a good coordination framework is in place, it creates a vacuum that each country is trying to fill by multiplying national or bilateral initiatives. These could prove effective for some countries and less so for others. There is also a risk that lacking its own resources, the WAEMU, as a regional coordinating body, has aligned itself with the agenda of donors, producing and multiplying common policies without a geniune spirit of follow-up; for example, the common industrial policy adopted in 2000 did not begin to be implemented until 2011, eleven years later. Aware of this inertia, the Member States are freeing themselves from the hope created by the initiative of these common policies and are redoubling individual initiatives in the absence of a framework to encourage cooperation. There are nationally fragmented policies, the lack of an organized and structured regional value chain, the weakening of bidirectional dependencies (except in the case of hinterland countries for transport). It can also be argued that since 2013, with the project for the common policy for peace and security in the WAEMU, the Union has made the search for political coordination in favour of security a major objective. Prioritizing avoids recurring conflicts to the detriment of industrial promotion and economic development questions.
The results of the SUR estimate of the Dendrinos-Sonis model for WAEMU are presented in Table 2. Our results show that only six (06) out of the thirty-five (35) coefficients are statistically significant, indicating a low level of integration within the WEAMU region. We found a complementary effect between Benin and Senegal and the Burkina-Faso and Mali couple. At the same time, there is evidence of competition between Togo and the coupe Benin and Côte d’Ivoire.
Niger, in terms of effect or consequences, shows no significant signs, even if these are all negative. These results reflect a shallow integration of this country with the rest of the region, weak integration against the backdrop of competitive interactions with other countries in the region. This may explain the level of backwardness of this country in the region.
Côte d’Ivoire and Senegal, the two driving countries of the region, have no ripple effect on the other countries. In other words, an increase in the shares of the region’s most dynamic economies has no ripple effect on the other economies in the region. However, it should be noted that Côte d’Ivoire and Togo on the one hand and Benin and Togo on the other side have competitive relations. The most integrated country in the zone is Burkina Faso, with positive ripple effects on Benin and Senegal. In other words, a positive GDP shock in Burkina Faso at time t has a positive ripple effect on Benin and Senegal at time t + 1.
Any GDP shock in Burkina Faso and Mali positively affects on Senegal, which testifies to the good integration relations between Senegal and these two countries. The results, however, do not suggest any transitivity; Although well integrated in Senegal, Burkina Faso and Mali have no significant integration relationship. This indicates that the windows of cooperation between countries where they exist are very bilateral and are not multifunctional. The countries of the region must develop and promote more regional commons. The results also do not show a reciprocal relationship or a bidirectional effect. No country has either positive or negative two-way interaction. While an income shock on Burkina Faso and Mali has a positive ripple effect on Senegal, the reciprocal is not verified. Symmetry in economic relations is not established, and physical or institutional infrastructures that promote reciprocity are absent.
All in all, the results confirm the low integration between the countries of the WAEMU region. Empirical evidence does not support widespread competition, even if pockets of competition are reported. However, our results reveal very limited or virtually absent complementarity links. Only the cases of interaction of Mali and Burkina Faso on Senegal constitute an oasis in a desert of lack of coherence of national policies for harmonious development in space.
4. Conclusions
The application of the Dendrinos-Sonis model to WAEMU provides an overview of the form of competition and complementarity between the different countries of the union. This first attempt shows a low degree of regional integration, which corresponds to the increase in income disparities observed since the creation of the Union and confirmed by the sigma-convergence analysis. These results reflect the weak interaction between the economies of the Union.
Policymakers need to consider the existence of competitive relationships between countries and propose appropriate community development strategies that cultivate cooperation with fair and transparent rules for sharing gains in relation to cooperation.
If the current trend towards a lack of synergy continues, there is a high probability that countries with a rich natural heritage or historical-comparative advantage will further widen the gap vis-à-vis other countries, which would exacerbate the imbalances observed. Our findings suggest the acceleration of regional integration in the WAEMU region combined with the implementation of inclusive integration policies that promotes each member’s comparative advantages. One of the limitations of this paper is that it is based on a horizontal interrelation between the countries of the Union (aggregate level). For reasons of data availability, we are not able to deepen the analysis industry by industry. Policy recommendations should include adopting of regional redistribution strategies or other interventions (such as infrastructure construction) that can improve regional relations and promote complementary relationships. The development of agricultural or industrial value chains can be an interesting avenue.
Funding
This research received no external funding.
Institutional Review Board Statement
Not applicable.
Informed Consent Statement
Not applicable.
Data Availability Statement
Not applicable.
Acknowledgments
I am grateful to the anonymous reviewers for their helpful comments. All remaining errors are my own.
Conflicts of Interest
The author declares no conflict of interest.
| 1 | WAEMU Treaty (approved on 10 January 1994, amends the WAMU Treaty) and WAEMU Treaty as amended (ratified on 29 January 2003). |
| 2 | Guinee-Bisau is excluded from analysis for lack of data. |
References
- Barro, Robert. 1991. Economic Growth in a cross-section of countries. Quaterly Journal of Economics 106: 407–43. [Google Scholar] [CrossRef] [Green Version]
- Barro, Robert, and Xavier Sala-i-Martin. 1992. Convergence. Journal of Political Economy 100: 223–51. [Google Scholar] [CrossRef]
- Baumol, William. 1986. Productivity Growth, Convergence and Welfare: What the Long Run Data Slow. American Economic Review 76: 1076–85. [Google Scholar]
- BCEAO. 2020. Rapport sur le Commerce Extérieur de l’UEMOA en 2020, Direction Générale de l’Economie et de la Monnaie, BCEAO, October 2021. Available online: https://www.bceao.int/fr/publications/rapport-sur-le-commerce-exterieur-de-luemoa-en-2020 (accessed on 6 January 2022).
- Bernard, Andrew, and Steven Durlauf. 1991. Convergence of International Output Movement. NBER Working Paper n°3717. Cambridge: NBER. [Google Scholar]
- Berthélémy, Jena-Claude, Sébastien Dessus, and Aristomène Varoudakis. 1997. Capital humain et croissance: Le rôle du régime commercial. Revue économique 48: 419–28. [Google Scholar]
- Bonet, Jaime. 2003. Colombian regions: Competitive or complementary? Revista de Economia Del Rosario, Universidad Del Rosario 6: 53–70. [Google Scholar]
- Carree, Martin, and Luuk Klomp. 1997. Testing the convergence hypothesis: A comment. The Review of Economics and Statistics 79: 683–686. [Google Scholar] [CrossRef]
- Decaluwé, Bernard, Jean-Christophe Dumont, Sandrine Mesplé-Somps, and Véronique Robichaud. 2000. Union économique et mobilité des facteurs; le cas de l’Union Économique et Monétaire Ouest Africain (UEMOA). In Cahiers de Recherche 0009. Laval: Université Laval—Département d’économique. [Google Scholar]
- Dendrinos, Dimitrios S., and Michael Sonis. 1988. Nonlinear Discrete Relative Population Dynamics of the U.S. Regions. Journal of Applied Mathematics and Computation 22: 25–44. [Google Scholar] [CrossRef]
- Dendrinos, Dimitrios, and Michael Sonis. 1990. Chaos and Socio-Spatial Dynamics. In Applied Mathematical Sciences. Berlin/Heidelberg: Springer, vol. 86. [Google Scholar]
- Ejones, Francis, Frank Agbola, and Amir Mahmood. 2021. Regional Integration and Economic Growth: New Empirical Evidence from the East African Community. The International Trade Journal 35: 311–35. [Google Scholar] [CrossRef]
- Fuss, Catherine. 1999. Mesures et tests de convergence: Une revue de la littérature. Revue de l’OFCE 69: 221–49. [Google Scholar] [CrossRef]
- Hewings, Geoffrey, Michael Sonis, Federico Cuello, and Fayçal Mansouri. 1996. The role of regional interaction in regional growth: Competition and complementarity in the U.S. regional system. Australasian Journal of Regional Studies 2: 133–49. [Google Scholar]
- Hugon, Philippe. 2014. L’intégration Régionale peut-elle Réduire la Vulnérabilité? Clermont Ferrand: Fondation pour les Etudes et Recherches sur le Développement International Note brève B87. [Google Scholar]
- Islam, Nazrul. 1995. Growth Empirics: A Panel Approach. Quaterly Journal of Economics 110: 1127–70. [Google Scholar] [CrossRef]
- Jalles, João Tovar. 2012. Openness, Regional Trade Agreements and Growth: Evidence from Asia. Asian Economic Journal 26: 63–85. [Google Scholar] [CrossRef]
- Kamarianakis, Yiannis, and Vagelis Kaslis. 2005. Geographical competition-complementarity relationships between Greek regional economies. Paper presented at the 45th Congress of the European Regional Science Association: “Land Use and Water Management in a Sustainable Network Society”, Amsterdam, The Netherlands, August 23–27. Louvain-la-Neuve: European Regional Science Association (ERSA). [Google Scholar]
- Knight, Malcolm, Norman Loayza, and Delano Villuena. 1993. Testing the Neoclassical Growth Model. IMF Staff Paper 40: 512–41. [Google Scholar] [CrossRef]
- Liu, Xuepeng. 2016. Trade Agreements and Economic Growth. Southern Economic Journal 82: 1374–401. [Google Scholar] [CrossRef] [Green Version]
- Magalhaes, André, Michael Sonis, and Geoffrey Hewings. 2001. Regional Competition and Complementarity Reflected in Relative Regional Dynamics and Growth of GSP: A Comparative Analysis of the Northeast of Brazil and the Midwest States of the US. In Structure and Structural Change in the Brazilian Economy. Edited by J. J. M. Guilhoto and G. Hewings. London: Routledge. [Google Scholar] [CrossRef]
- Mankiw, Gregory, David Romer, and David Weil. 1992. A Contribution to the Empirics of Economic Growth. Quaterly Journal of Economics 107: 407–38. [Google Scholar] [CrossRef]
- Nazara, Suahasil, Geoffrey Hewings, and Michael Sonis. 2006. An exploratory analysis of hierarchical spatial interaction:the case of regional income shares in Indonesia. Journal of Geographical Systems 8: 253–68. [Google Scholar] [CrossRef]
- Nazara, Suahasil, Michael Sonis, and Geoffrey Hewings. 2001. Interregional Competition and Complementarity in Indonesia. REAL Discussion Paper 01-T-2. Urbana: University of Illinois. [Google Scholar]
- Ndiaye, Mohamed Ben Omar. 2006. UEMOA: Une Integration à Deux Vitesses A Travers Des Clubs De Convergence. Paper presented at 7ème Journée Scientifique du Réseau «Analyse Economique Et Développement de l’AUF», Paris, France, September 7–8. [Google Scholar]
- Polachek, Solomon W. 1999. Conflict and Trade: An Economics Approach to Political International Interactions. In Peace Economics, Peace Science, and Public Policy. Berlin and Boston: De Gruyter GmbH & Co. KG, vol. 5, pp. 1–32. [Google Scholar] [CrossRef]
- Quah, Danny. 1993a. Galton’s Fallacy and Tests of the Convergence Hypothesis. Scandinavian Journal of Economics 95: 427–43. [Google Scholar] [CrossRef]
- Quah, Danny. 1993b. Empirical cross section dynamics in economic growth. European Economic Review 37: 426–34. [Google Scholar] [CrossRef] [Green Version]
- Quah, Danny. 1994. One business cycle and one trend from (many,), many dissagregates. European Economic Review 38: 605–13. [Google Scholar] [CrossRef] [Green Version]
- Quah, Danny. 1996. Empirics for economic growth and convergence. European Economic Review 40: 1353–76. [Google Scholar] [CrossRef] [Green Version]
- Reinert, Erik, and Rainer Kattel. 2013. Failed and Asymmetrical Integration: Eastern Europe and the Non-financial Origins of the European Crisis. Working Papers in Technology Governance and Economic Dynamics, No. 49. Norway: Tallinn. [Google Scholar]
- Rouis, Mustapha, and Steven Tabor. 2012. Why Economic Integration Matters: Potential Gains and Challenges? In Regional Economic Integration in the Middle East and North Africa. Washington, DC: World Bank, pp. 1–10. [Google Scholar] [CrossRef]
- Schiff, Maurice, and Alan Winters. 1998. Dynamic and Politics in Regional Integration Arrangements: An Introduction. The World Bank Economic Review 12: 177–95. [Google Scholar] [CrossRef] [Green Version]
- Vamvakidis, Athanasios. 1998. Regional Integration and Economic Growth. World Bank Economic Review 12: 251–70. [Google Scholar] [CrossRef]
- Venables, Anthony. 1999. Regional Integration Agreements: A Force for Convergence or Divergence? Policy Research Working Paper 2260. Washington, DC: The World Bank, Development Research Group Trade, Available online: https://documents1.worldbank.org/curated/en/397421468766807036/pdf/multi-page.pdf (accessed on 6 January 2022).
- Viner, Jacob. 1950. The Customs Union Issue. New York: Carnegie Endowment for International Peace, pp. viii, 221. [Google Scholar]
Figure 1.
Evolution of the Sigma-convergence of GDP per capita in the WAEMU. Source: Results of estimates.
Figure 1.
Evolution of the Sigma-convergence of GDP per capita in the WAEMU. Source: Results of estimates.


Table 1.
Sigma-convergence of GDP per capita within WAEMU (1995–2015).
| Sigma-Convergence (FCFA) | Test de Carree&Klomp a | Test de Wilcoxon a,b | ||||||||||||||||
|---|---|---|---|---|---|---|---|---|---|---|---|---|---|---|---|---|---|---|
| 1995 | 2000 | 2001 | 2005 | 2006 | 2010 | 2011 | 2015 | 1995–2000 | 2001–2005 | 2006–2010 | 2011–2015 | 1995–2005 | 2006–2015 | 1995–2015 | 1995–2000 versus 2001–2005 | 2006–2010 versus 2011–2015 | 1995–2005 versus 2006–2015 | |
| GDP per capita | 158,739.9 | 159,143.1 | 153,803.9 | 140,309.6 | 138,240.6 | 137,833.3 | 125,968.6 | 168,205.4 | Dvg | Cvg ** | Dvg | # | Cvg * | Dvg | Dvg | 15 * | 30 | 74 |
Notes: a: * (resp. **): significance at 5% (resp. 10%); b: This is a one-sided rank test on the ranks of dispersions over the period 1995–2015. The hypotheses of the first test are: H0: dispersion 1995–2000 = dispersion 2001–2005 versus H1: dispersion 2001–2005 < dispersion 1995–2000; Cvg (resp. Dvg and #): convergence i.e., (resp. Divergence and the test cannot be performed
Table 2.
Application of the model for the share of country i’s GDP in total GDP with Côte d’Ivoire as numerary.
Table 2.
Application of the model for the share of country i’s GDP in total GDP with Côte d’Ivoire as numerary.
| Model with Côte d’Ivoire as Numerary | |||||||||||||||
|---|---|---|---|---|---|---|---|---|---|---|---|---|---|---|---|
| GDP per Capita | |||||||||||||||
| Benin | Burkina Faso | Ivory Coast | Mali | Niger | Senegal | Togo | Benin | Burkina Faso | Ivory Coast | Mali | Niger | Senegal | Togo | ||
| Benin | 0.4347538 (0.97) | 1.018114 (2.08 **) | 2.148949 (1.10) | 1.079413 (2.09 **) | −0.006975 (−0.01) | 1.007957 (1.02) | −0.0244734 (−0.05) | Benin | ++ | ++ | |||||
| Burkina Faso | −0.1828886 (−0.36) | 1.09639 (1.97 *) | 0.0705882 (0.03) | 0.6394457 (1.08) | −0.2315769 (−0.34) | 0.3472677 (0.31) | −0.2097001 (−0.39) | Burkina Faso | + | ||||||
| Mali | 0.6643526 (1.03) | 0.6617406 (0.94) | 0.551135 (0.20) | 1.000778 (1.34) | −0.7212866 (−0.84) | 0.1607968 (0.11) | −0.4633499 (−0.68) | Mali | |||||||
| Niger | −0.0104313 (−0.02) | −0.1698755 (−0.32) | −3.273723 (−1.56) | −0.4829736 (−0.87) | −0.5986213 (−0.94) | −1.347382 (−1.27) | −0.3823641 (−0.75) | Niger | |||||||
| Senegal | 0.1207456 (0.29) | 0.7680854 (1.98 **) | 1.679062 (0.91) | 1.128594 (2.32 **) | −0.0965178 (−0.17) | 1.211544 (1.31) | 0.0904353 (0.20) | Senegal | ++ | ++ | |||||
| Togo | −1.352749 (−2.85 ***) | −0.6887012 (−1.32) | −3.687883 (−2.07 **) | −0.1464943 (−0.27) | −1.003414 (−1.59) | −1.565561 (−1.49) | −0.7369064 (−1.45) | Togo | −−− | −− | |||||
On the left: the coefficients of the SUR model and on the right: the symbolic representation of the dynamics between countries (++ significant complementarity at the 5% threshold, + significant complementarity at the 10% threshold, −−− significant competition at the 1% threshold, −− significant competition at the 5% threshold). Source: Estimate results. ***, **, * significance at 1%, 5% and 10%.
Publisher’s Note: MDPI stays neutral with regard to jurisdictional claims in published maps and institutional affiliations. |
© 2022 by the author. Licensee MDPI, Basel, Switzerland. This article is an open access article distributed under the terms and conditions of the Creative Commons Attribution (CC BY) license (https://creativecommons.org/licenses/by/4.0/).
Share and Cite
MDPI and ACS Style
Alinsato, A.S. Regional Integration in the West African Economic and Monetary Union (WAEMU): Complementarity or Competition? Economies 2022, 10, 22. https://doi.org/10.3390/economies10010022
AMA Style
Alinsato AS. Regional Integration in the West African Economic and Monetary Union (WAEMU): Complementarity or Competition? Economies. 2022; 10(1):22. https://doi.org/10.3390/economies10010022
Chicago/Turabian StyleAlinsato, Alastaire Sèna. 2022. "Regional Integration in the West African Economic and Monetary Union (WAEMU): Complementarity or Competition?" Economies 10, no. 1: 22. https://doi.org/10.3390/economies10010022
Note that from the first issue of 2016, this journal uses article numbers instead of page numbers. See further details here.