
Social Influence Maximization in Hypergraphs †


1
Dipartimento di Informatica, Università degli Studi di Salerno, 84084 Fisciano, Italy
2
Dipartimento di Psicologia, Università degli Studi della Campania “Luigi Vanvitelli”, 81100 Caserta, Italy
3
Decision Analysis and Support Unit, SGH Warsaw School of Economics, 02-554 Warsaw, Poland
*
Authors to whom correspondence should be addressed.
†
This paper is an extended version of our paper Information Diffusion in Complex Networks: A Model Based on Hypergraphs and Its Analysis, published in 17th International Workshop on Algorithms and Models for the Web Graph, (WAW 2020).
Entropy 2021, 23(7), 796; https://doi.org/10.3390/e23070796
Submission received: 9 April 2021
/
Revised: 10 June 2021
/
Accepted: 15 June 2021
/
Published: 23 June 2021
(This article belongs to the Special Issue Advances in Complex Systems Modelling via Hypergraphs)
Abstract
:This work deals with a generalization of the minimum Target Set Selection (TSS) problem, a key algorithmic question in information diffusion research due to its potential commercial value. Firstly proposed by Kempe et al., the TSS problem is based on a linear threshold diffusion model defined on an input graph with node thresholds, quantifying the hardness to influence each node. The goal is to find the smaller set of items that can influence the whole network according to the diffusion model defined. This study generalizes the TSS problem on networks characterized by many-to-many relationships modeled via hypergraphs. Specifically, we introduce a linear threshold diffusion process on such structures, which evolves as follows. Let be a hypergraph. At the beginning of the process, the nodes in a given set are influenced. Then, at each iteration, (i) the influenced hyperedges set is augmented by all edges having a sufficiently large number of influenced nodes; (ii) consequently, the set of influenced nodes is enlarged by all the nodes having a sufficiently large number of already influenced hyperedges. The process ends when no new nodes can be influenced. Exploiting this diffusion model, we define the minimum Target Set Selection problem on hypergraphs (TSSH). Being the problem NP-hard (as it generalizes the TSS problem), we introduce four heuristics and provide an extensive evaluation on real-world networks.
1. Introduction
Social influence involves intentional and unintentional efforts to change another person’s beliefs, attitudes, or behavior [1]. With the advent of online social networks, such a phenomenon assumed even more importance given the exponential number of people a user can reach through them. In both online and offline contexts, a person may influence other individuals for different reasons. As a domino cascade, such influence impacts not only those people but also propagates through the social network, with varying degrees of effectiveness. This word-of-mouth propagation has been shown to be a powerful tool in different applications, such as viral marketing [2,3], recommendation [4,5,6], influential bloggers identification [7,8,9] and expert finding [10,11].
Social influence occurs due to the diffusion of information in the network [12]. A key algorithmic question in information diffusion research is social influence maximization (SIM), a well-studied problem due to its potential commercial value [13]. SIM aims to select a seed set of k users in an online social network, abstracted as a graph, such that the expected number of influenced users through the seed set is maximized. Spreading phenomena are usually modeled as diffusion processes within graphs. As a trivial consequence, problems like SIM and its variants are analyzed via such structures. However, graphs assume the existence of only binary relationships between nodes, even though more articulated interactions characterize real-world networks as interactions between the elements may not be dyadic but may involve more than two entities. Examples of such scenarios include membership in groups on social platforms, co-authorships of scientific publications, or several parties participating in a crypto-currency transaction [14]. In such cases, nodes may be linked together based either on explicit information (e.g., inclusion in groups) or implicit information (e.g., whether online social network users share the same hashtag in a media post or review the same restaurant). A natural way to represent such many-to-many relations among entities without loss of information are hypergraphs [15]. Being a generalization of graphs, where a (hyper)edge is a relationship among an arbitrary number of nodes, such mathematical structures can naturally define higher-order relations between groups of objects. Hence, hypergraphs enable us to account for complex dynamics happening in real life, like the influence exerted by a group of friends [16].
Based on the above considerations and motivated by the lack of comprehensive studies towards this direction, we analyze the SIM problem on social networks abstracted as hypergraphs. In our previous work [17], we formally defined a social influence diffusion process on hypergraphs, and we presented a variant of the minimum target set selection problem, first proposed by Kempe et al. [18], suitable for networks involving many-to-many relationships. We developed three greedy-based heuristics to address such a problem, whose aim is to select the smallest set of initially influenced users such that, at the end of the influence diffusion process, all the users are influenced. We evaluated and compared the proposed algorithms on a set of synthetic hypergraphs, varying the networks’ properties, and on a real use-case, based on the network induced by the co-occurrences of characters in the Game-of-Thrones TV Series.
This paper is an extension of the previous work just described [17], and its major contributions can be summarized as follows:
- We revise the three greedy approaches proposed in [17], adding an optimization phase that removes all the unnecessary nodes untimely added by the greedy procedure.
- We design a new greedy algorithm based on a subtractive approach, inspired by Cordasco et al. [19], which iteratively prunes non-influential nodes or edges from the hypergraph until some nodes become essential to the diffusion process.
- We extensively evaluate all the proposed heuristics on real-world networks.
The remainder of the paper is organized as follows. Section 2 reviews some relevant literature about the social influence problem, specifically focusing on higher-order networks. In Section 3, we define a diffusion process on hypergraphs and the problem of finding a minimum target set for those structures. Section 4 describes the proposed greedy-based heuristics to solve the target set selection problem on hypergraphs. In Section 5, we present the experiments on real-world networks and discuss their outcomes. Finally, Section 6 details the conclusion and future work.
2. Related Work
2.1. The Social Influence Maximization Problem in Graphs
Initially introduced by Domingos and Richardson in the context of viral marketing [20], the Social Influence Maximization (SIM) problem has been studied since early two thousand. Three recent surveys give a thorough description of the problem and its variants, solution methodologies of the problem, and real-life applications [12,13,21].
Kempe et al. [18] first modeled influence maximization as an algorithmic problem in 2003. The problem studies a social network abstracted as a graph , where V is the set of nodes (i.e., users) and E is the set of (directed/undirected) edges (i.e., social links between users). The goal is to find a k-sized set of users with the maximum influence in G. In its basic version, the Target Set Selection (TSS) problem [22] adds another parameter to the SIM problem, asking to find out a subset of at most k nodes, such that after the diffusion process over at least nodes are influenced. In this work, we consider a variant of the TSS problem where we aim to find a minimum target set that will eventually influence the whole network under a linear threshold (LT) influence propagation model. According to the LT model, introduced by Granovetter [23] and Schelling [24] in 1978, a user v becomes active when the sum of influences of its neighbors in the networks reaches a specific threshold .
Kempe et al. [18] were also the first to investigate the computational complexity of the SIM problem, proving it to be NP-hard to approximate within a factor of for all . While Kempe et al. [18] analyzed the problem in networks with randomly chosen thresholds, Chen [25] studied the minimization problem of finding the smallest target set able to influence the whole network built with fixed arbitrary thresholds. Furthermore, Chen proved a strong inapproximability result that makes unlikely the existence of an algorithm for the TSS problem on graphs (2-uniform hypergraphs) with an approximation factor better than . Cordasco et al. [19] presented an algorithm for the TSS problems on graphs, which provides an optimal solution (i.e., a minimum size subset of nodes that influence the whole network) in case the network is either a tree, a cycle, or a complete graph.
Another line of inquiry in the context of social influence diffusion is understanding how diffusion mechanics differ across social media as well as modeling different types of influence within a network. Kim et al. [26] moved towards the first direction, exploring news diffusion instances across different social media platforms and finding that influence between different media types is varied by the context of information. Li et al. [27] followed the second direction, formally defining a multiple influences diffusion model by considering the influential relationships and individual’s personalized traits, such as interests and trusts. Recently, Chathurani et al. [28] put together these two aspects, investigating several influence patterns exercised by different users within and across online social media platforms.
2.2. The Social Influence Maximization Problem in Higher-Order Networks
Little or no literature exists on the SIM problem on hypergraphs as these structures rose to prominence only recently in the academic and industry landscape.
In 2019, Zhu et al. [16] first dealt with the study of information diffusion in social networks abstracted as a directed hypergraph. They model the crowd influence as a hyperedge with weight , where is the head node-set and v is the tail node, meaning that v will be influenced by with probability only after each node in is influenced. Their proposed algorithm selects k initially-influenced seed users in a directed hypergraph , maximizing the expected number of eventually-influenced users. Zhu et al. prove the problem to be NP-hard under an Independent Cascade (IC) model [29] and propose an algorithm preserving a -approximation. In another work, the same authors revise the SIM problem under a group influence perspective [30]. Resembling real-life dynamics, they define the Group IM (GIM) problem. The problem aims to select k seed users such that the number of eventually influenced groups is maximized, where a group is influenced if at least a fixed percentage of users in it are influenced. After analyzing the complexity and approximability of the GIM problem, showing that they are NP-hard, Zhu et al. propose an approximation framework for the problem. Differently from those two works, in our study, we specifically address the TSS problem under an LT diffusion model on networks characterized by many-to-many relationships and abstracted as undirected hypergraphs.
Influence diffusion models are usually treated as specific cases of epidemic models [21]. Ma and Guo [31] constructed and analyzed four kinds of information transmission patterns within the members of an enterprise under the epidemic transmission framework. In their model, a hyperedge represents an informal organization (e.g., spontaneous groups), and, according to the SIR model, nodes belong to the three standard classes corresponding to ignorant (S), spreader (I), and stifler nodes (R). In the probabilistic transmission model, all nodes are ignorant at the start. At the first iteration, the information begins to spread from a randomly chosen initial node to other randomly selected spreader nodes within the same hyperedge with a given probability. Immune nodes no longer spread the information and stop transmitting. The authors also analyzed variations of the model where information passes (i) from one person to another in a chain-like fashion (one-way transmission), (ii) to the entire hyperedge or group (gossip transmission), or (iii) to a constant number of nodes within the same hyperedge (group transmission).
A thorough description of epidemic spreading processes in higher-order networks, considering both simplicial complexes and hypergraphs, is given in a survey by Battiston et al. [14], in which the authors also discuss opinion and cultural dynamics beyond pairwise interactions, focusing on the Voter and Majority Models.
3. Social Influence Diffusion on Hypergraphs
In this section, after introducing hypergraphs and their graph representations briefly, we define an influence diffusion process on hypergraphs as a generalization of the LT model proposed by Kempe et al. in their seminal work on influence maximization [18]. We further describe the minimum target set selection problem on hypergraphs that we will discuss in Section 4.
3.1. Hypergraphs
A hypergraph is a generalization of a graph in which a hyperedge can join any number of nodes instead of only two entities, as happens for regular graphs. Formally, a hypergraph is an ordered pair , where V is a set of nodes, and E is the set of (hyper)edges (). We denote with the order of the hypergraph (i.e., the number of nodes) and with the number of hyperedges. For each , we denote with the set of edges containing v and with the degree of v. Similarly, for each , we denote with the set of nodes in and with the cardinality of .
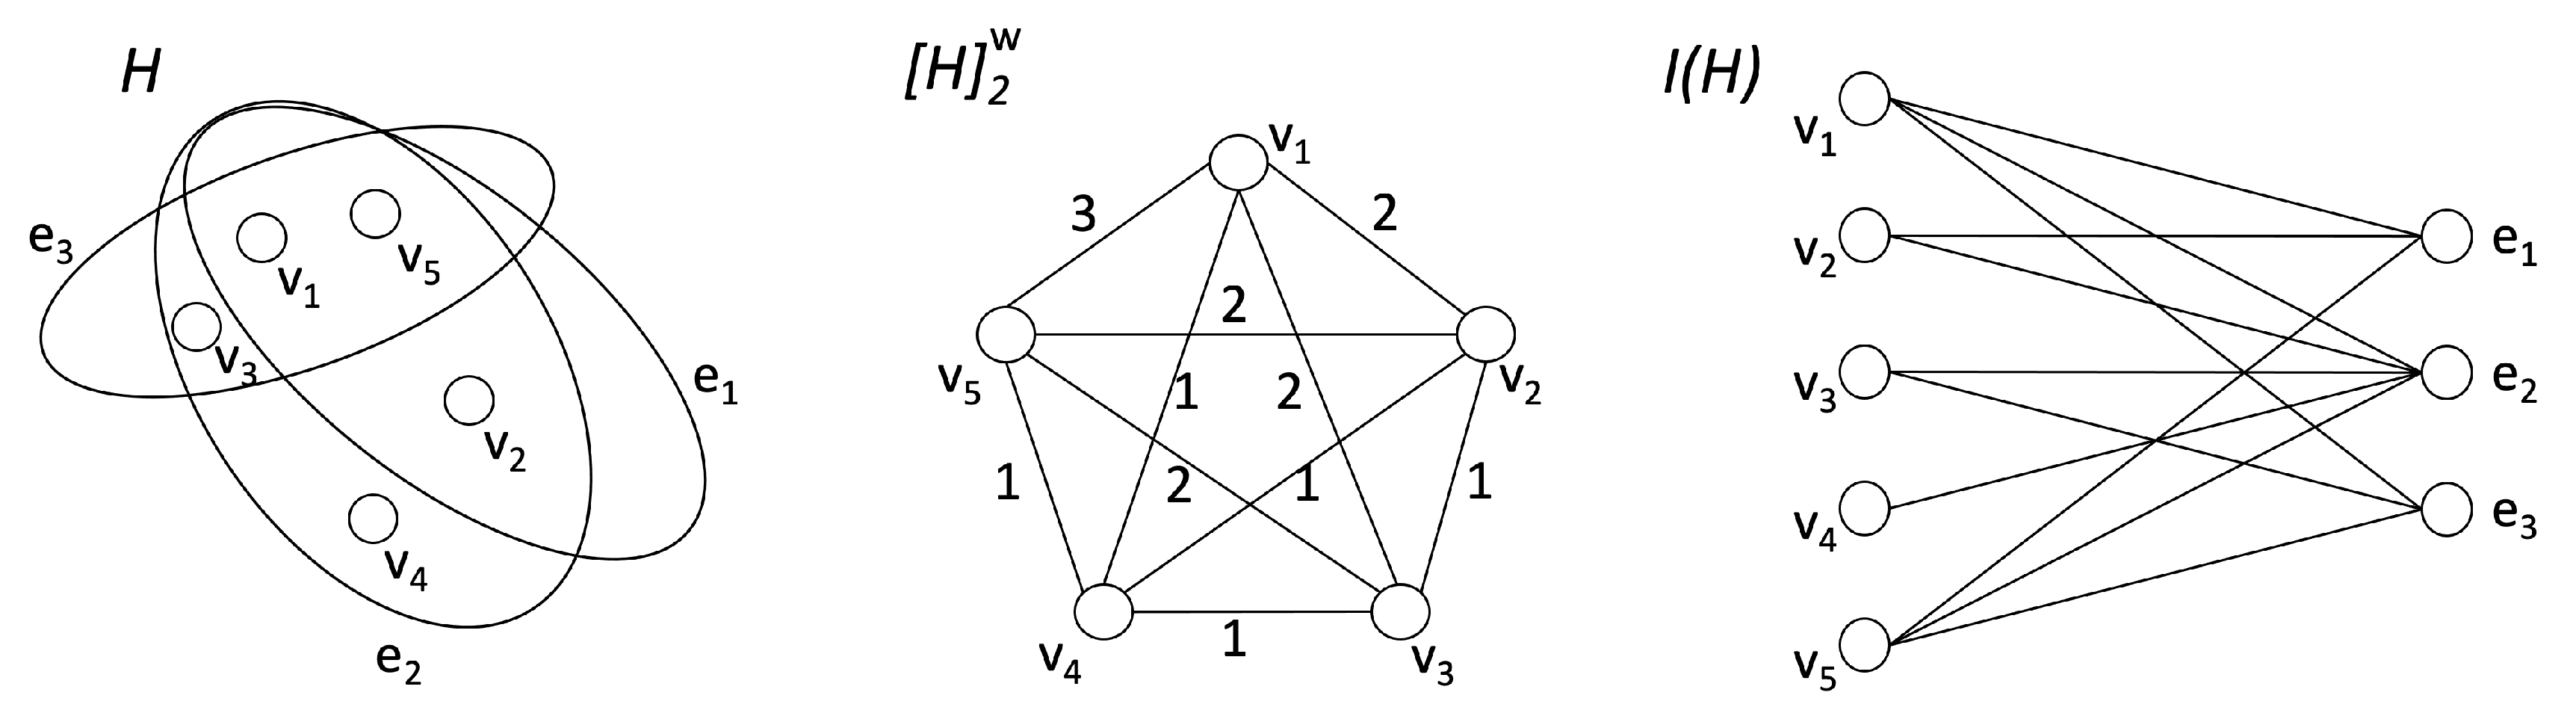
Several algorithms on hypergraphs are based on a graph representation of those structures. For instance, a two-section representation (or clique-expansion) of , denoted with and where , can be obtained by connecting two nodes in the graph if and only if they belong to the same hyperedge [32]. As a result, each hyperedge from H occurs as a complete subgraph in . In this work, we consider the weighted clique-expansion of H, where the weight of an edge in corresponds to the number of hyperedges containing both u and v. A hypergraph can also be considered as a bipartite incidence graph , where . In other words, represents the bipartite network obtained from H by considering the nodes on one side and the hyperedges on the other side and where a node v is connected with a hyperedge if and only if the node v is contained in the hyperedge . Figure 1 shows an example of a hypergraph and its corresponding weighted clique-expansion and incidence graph representations.
3.2. A Dynamic Social Influence Diffusion Process
Given a network represented with a hypergraph , we consider a dynamic diffusion process on H influencing both nodes and hyperedges. The idea behind the process is to model the diffusion iteratively from nodes to hyperedges and from hyperedges to nodes so that it is possible to manage non-binary relations (as hyperedges can have any size). Each neighbor of a node v can have a different impact on influencing v itself, depending on the number and the size of the hyperedges shared with the node. Modifying the thresholds associated with the hyperedges allows us to model different scenarios. The diffusion process evolves in discrete steps as described in [17].
In the following, we provide an easier description of the same process, noting that the incidence graph associated with a hypergraph H is an ordinary graph.
Let be a hypergraph and the associated incidence graph. Let and be two functions assigning thresholds to the nodes and to the hyperedges, respectively. For each node (), the value () quantifies how hard it is to influence the node v (edge ), in the sense that easy-to-influence elements of the network have low threshold values, and hard-to-influence elements have high threshold values. Let be a threshold function which assigns to each node of the same threshold value they have on H, defined as
Definition 1.
Let be a incidence graph associated with a hypergraph with threshold function . An information diffusion process in , starting with a seed S, is a sequence of nodes subsets
with , and such that for all
where denotes the neighborhood of v. The process ends at the first iteration ℓ such that . We denote the final influenced sets as and .
A target set for is a seed set that will eventually influence the whole set of nodes, i.e., . It is worth noticing that a target set does not necessarily influence all hyperedges. We indicate the above information diffusion process on , associated with H, as
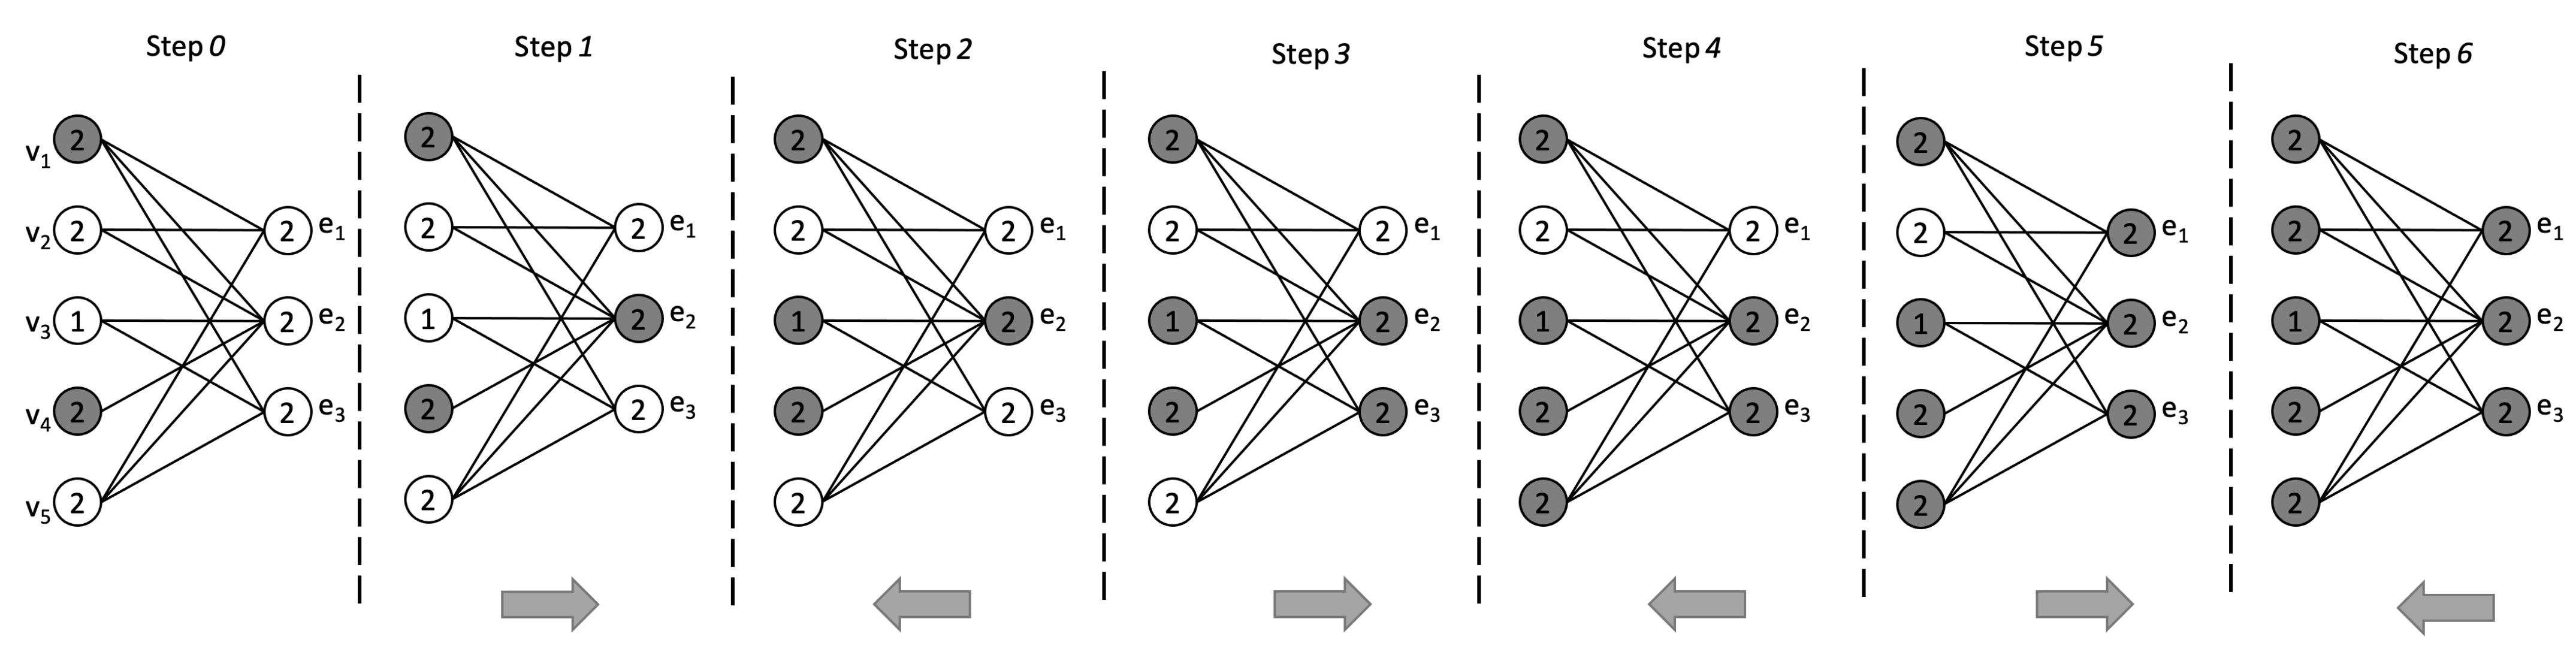
where is the set of influenced nodes and is the set of influenced hyperedges. The diffusion process is irreversible; once a node or hyperedge is influenced, it remains in that state until the end of the process. Further, we can note that, being a bipartite graph, the process proceeds by adding nodes corresponding to the hyperedges of H during odd iterations and nodes corresponding to nodes of H during even iterations (see Figure 2).
Example 1.
Consider the bipartite incidence graph associated with the hypergraph in Figure 1, with node and hyperedge thresholds given in Figure 2. Starting with the initial seed set , the information diffusion process evolves as follows (see Figure 2).
As , S is a target set for H.
In this work, we address the problem of finding the minimum target set that will eventually influence the whole network. Formally, given a hypergraph with threshold functions and , we aim to find a seed set of minimum size such that .
Definition 2.
TSS problem on hypergraphs (TSSH).
Instance:, thresholds and .
Problem:Find a seed set of minimum size such that .
The TSSH problem generalizes the TSS problem on graphs, studied by Chen [33], which is defined as follows:
Given a graph and fixed arbitrary thresholds , for each , find a set of minimum size that eventually influences all nodes of G.
Recalling that any graph is a hypergraph, TSSH solves TSS by setting for each and for each Chen proved a strong inapproximability result on TSS showing that, even a non-trivial approximation of the problem, is unlikely tractable. Being TSSH a generalization of TSS, Chen’s result also applies to TSSH.
It is worth mentioning that having on the TSSH problem does not imply that spreading influence is more difficult in hypergraphs than in graphs as the diffusion process is ruled by both the thresholds and the size of the hyperedges. For instance, let us assume that all nodes have a threshold 2 and the existence of two hyperedges with a threshold 2, whose intersection contains 100 nodes. In this case, two influenced nodes in the intersection of the two given hyperedges can influence the other 98 nodes.
4. Finding the Minimum Target Set on Hypergraphs
In this section, we present four greedy-based heuristics for the TSSH problem defined above; i.e., given a hypergraph having threshold values described by the functions and , find the minimum target (seed) set able to influence the whole network. We indicate the diffusion process on H as , denoting with and the final sets of influenced nodes and influenced hyperedges, respectively.
The first three heuristics described below have been defined and preliminarily evaluated in [17]. In this paper, we further provide (i) a different approach for the TSSH problem, defining a pruning heuristic () and (ii) an opt` as a refinement of all four proposed heuristics, able to provide significant improvements on the size of the desired target set.
StaticGreedy. A trivial greedy strategy consists of selecting the nodes with the highest degree as a seed set. After sorting the nodes in descending order by their degree, the heuristic applies a binary search procedure to compute the target set S. This heuristic is referred to as static since the node degree is never updated (see Algorithm in [17] for a detailed description).
DynamicGreedy. In this heuristic, all nodes are initially added to the candidate set U. At each iteration, the node having the highest degree is added to the target set S and removed from U. At this point, the strategy simulates the diffusion process and prunes all influenced nodes and hyperedges from the hypergraph. Then, the residual degree of each node v is updated accordingly, and the process is iterated until all nodes are influenced or pruned (see Algorithm in [17] for a detailed description).
. This third heuristic is equivalent to , but it is computed on the weighted clique-expansion of the input hypergraph H. As a consequence, each node degree is evaluated on (see Algorithm in [17] for a detailed description).
SubTSSH. This heuristic, which extends the TSS Algorithm in [19], works greedily by iteratively pruning nodes or edges from the input hypergraph H unless a specific condition occurs, making a node being added to the seed set S; it stops when all nodes have either been discarded or selected as seeds. The pruning is done according to a designed rule that tries to balance between the capability of a node (resp. edge) to influence other edges (resp. nodes) and its “easiness” (or hardness) to be influenced by other edges (resp. nodes). In contrast to the previous three heuristics, which exploit an additive approach, this technique adopts a subtractive procedure.
Algorithm 1, , proceeds as follows. As long as the hypergraph is not empty and no special conditions occur (e.g., cases 1 or 2), a node u (case 3.a) or an edge e (case 3.b) is selected according to a given function (see Case 3) and it is pruned from the hypergraph. When a node (resp. edge) is removed, its incident edges (resp. nodes) update their size (resp. degree) as they cannot count on u (resp. e) anymore to become influenced. Due to this update, some nodes in the residual hypergraph may remain with less “usable” edges (if a node has ). In such a case (see Case 2), these nodes are added to the seed set S and removed from H. Then, the size and the thresholds of their incident edges are updated (i.e., decreased by 1) since they have one more influenced neighbor. In the last case (see Case 1), the residual hypergraph contains a node u (resp. edge e) whose threshold decreased down to 0. This situation means that the nodes which have been already added to the seed set S are enough to make u (resp. e) influenced. At this point, u (resp. e) is removed from H, and both the size and the thresholds of its incident edges (resp. nodes) are updated (i.e., decreased by 1) since they have one more influenced neighbor.
Optimization phase. Being greedy-based approaches, all the described algorithms ensure that , but they do not guarantee that the cardinality of S is (an approximation of) the optimal solution. Moreover, we experimentally observed that their solutions often contained unnecessary seed nodes. Given a seed set S such that , a node is unnecessary if . Since we are looking for a minimum cardinality solution, it is important to remove all superfluous nodes. For this reason, we developed a skim procedure, named and listed in Algorithm 2, which, starting from a solution obtained by the above algorithms, iteratively removes all redundant nodes.
| Algorithm 1 |
|
| Algorithm 2 |
|
5. Experiments
To evaluate the effectiveness of the greedy-based heuristics discussed in Section 4, we performed a bunch of experimental scenarios varying the activation threshold for both nodes and hyperedges. Specifically, we assessed their performance on several real-world networks considering both the cardinality of the solution provided (the smaller, the better) and their execution times.
5.1. Data Sets
As benchmark hypergraphs, we used 11 networks generated by real-world data sets, downloaded from the ARB [34], Mendeley [35] and GitHub [36] repositories. A more detailed description of each data set follows. Table 1 and Table 2 summarize the dimension of each hypergraph, along with the number of edges in the corresponding clique-expansion. The size shown refers to the final dimension of the hypergraphs after having removed any 0-degree node and empty hyperedges.
- Algebra. Nodes are users of mathoverflow.net, and hyperedges correspond to users who answered a particular type of question about algebra within a month.
- Amazon. Sets of products reviewed by users on Amazon. Each node corresponds to a product, and a hyperedge links together groups of similar items. We used a subset of reviews.
- DBLP. Co-authorship on DBLP papers. Each node is an author, while each hyperedge is a publication. We considered all documents published between January and May 2017.
- Email-Enron. Sets of email addresses involving Enron employees. In this data set, nodes are email addresses at Enron, and a hyperedge comprises the sender and all recipients of the email. We considered a subset of emails.
- Email-W3C. Sets of email addresses on W3C mailing lists. Each hyperedge consists of a set of email addresses, which have all appeared on the same email. We considered a subset of emails.
- Geometry. Hypergraph where nodes are users of mathoverflow.net, and hyperedges are sets of users who answered a certain question category about geometry.
- Game of Thrones (GoT). Hypergraph where nodes are GoT characters, and hyperedges are GoT scenes. In other words, a hyperedge consists of all characters appearing in the same scene together. More details about this data set are given in [37].
- Blues Music Reviews. Hypergraph where nodes are Amazon users and hyperedges link users who reviewed a certain product category (different types of blues music) within a month timeframe.
- NBA. NBA games in the period 1985–2013. Nodes are players, and a hyperedge connects together all players involved in a match up to 2012.
- Restaurant Reviews. Hypergraph where nodes are Yelp users, and hyperedges link users who reviewed an establishment of a particular category (different types of restaurants in Madison, WI) within a month timeframe.
- Bars Reviews. Hypergraph where nodes are Yelp users, and hyperedges connect users who reviewed an establishment of a particular category (different types of bars in Las Vegas, NV) within a month timeframe.
5.2. Experiment Formulation
We performed four experimental scenarios. In the first and second scenarios, we fixed each node threshold to a random value between 1 and its degree. In the other two scenarios, each node threshold varies proportionally—from to —to the degree of the node. Concerning the hyperedge thresholds, we fixed each edge threshold to a random value between 1 and its degree in the first and third scenarios. We set each hyperedge activation threshold proportional to its degree scaled of factor (majority policy) in the remaining settings. Table 3 summarizes the threshold settings in the four experimental scenarios. We simulated the execution of each heuristic followed by the optimization procedure 50 times per experiment. Then, we repeated the experiment simulating the execution of each heuristic without applying the optimization step to compare the new results with our previous work [17]. All experiments as well as the heuristics are implemented in Julia, exploiting the library SimpleHypergraphs.jl [40]. The Julia code used in the paper is available on a GitHub public repository [38] and on Zenodo [41].
5.2.1. Scenario 1 — Random thresholds
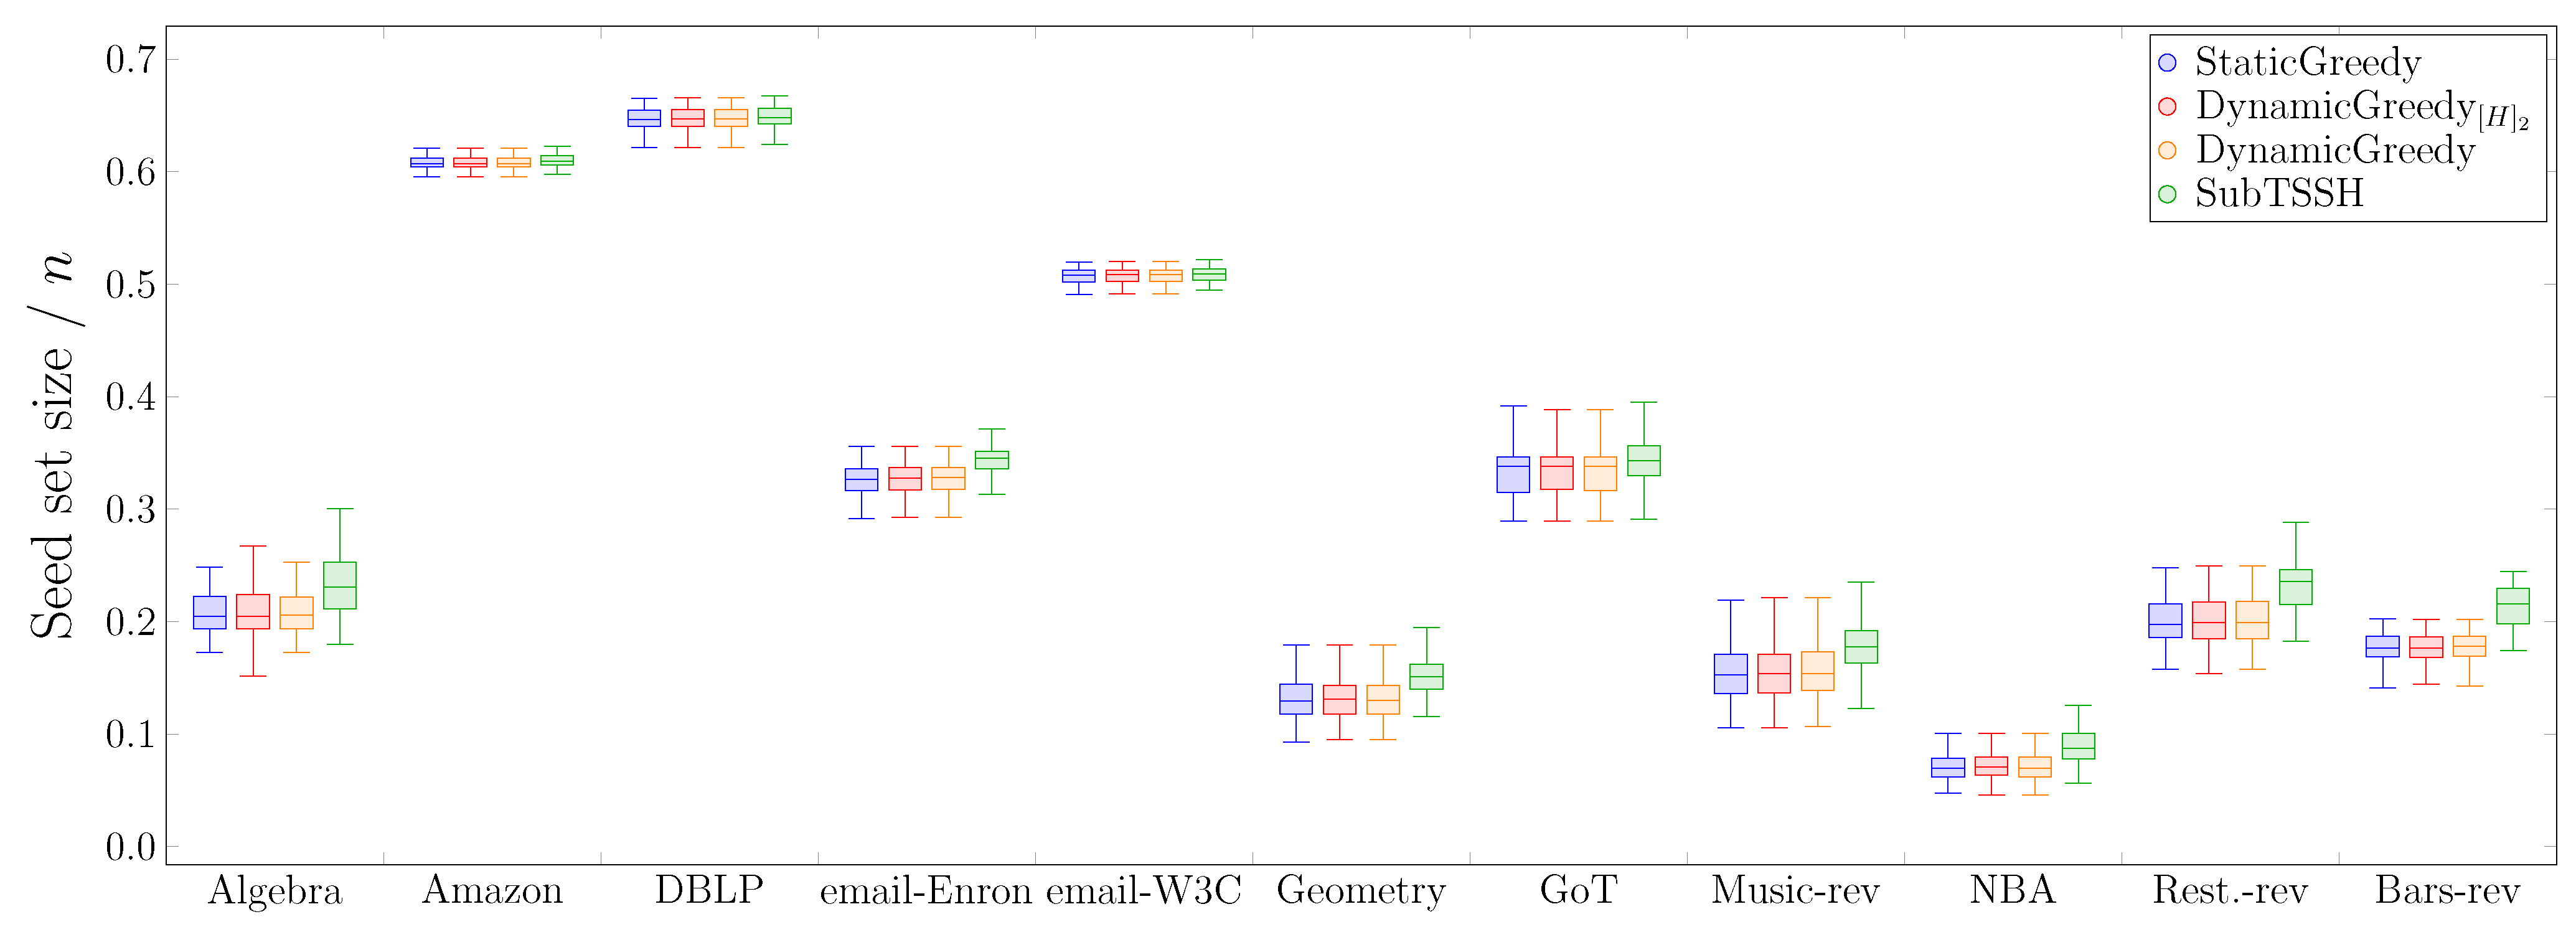
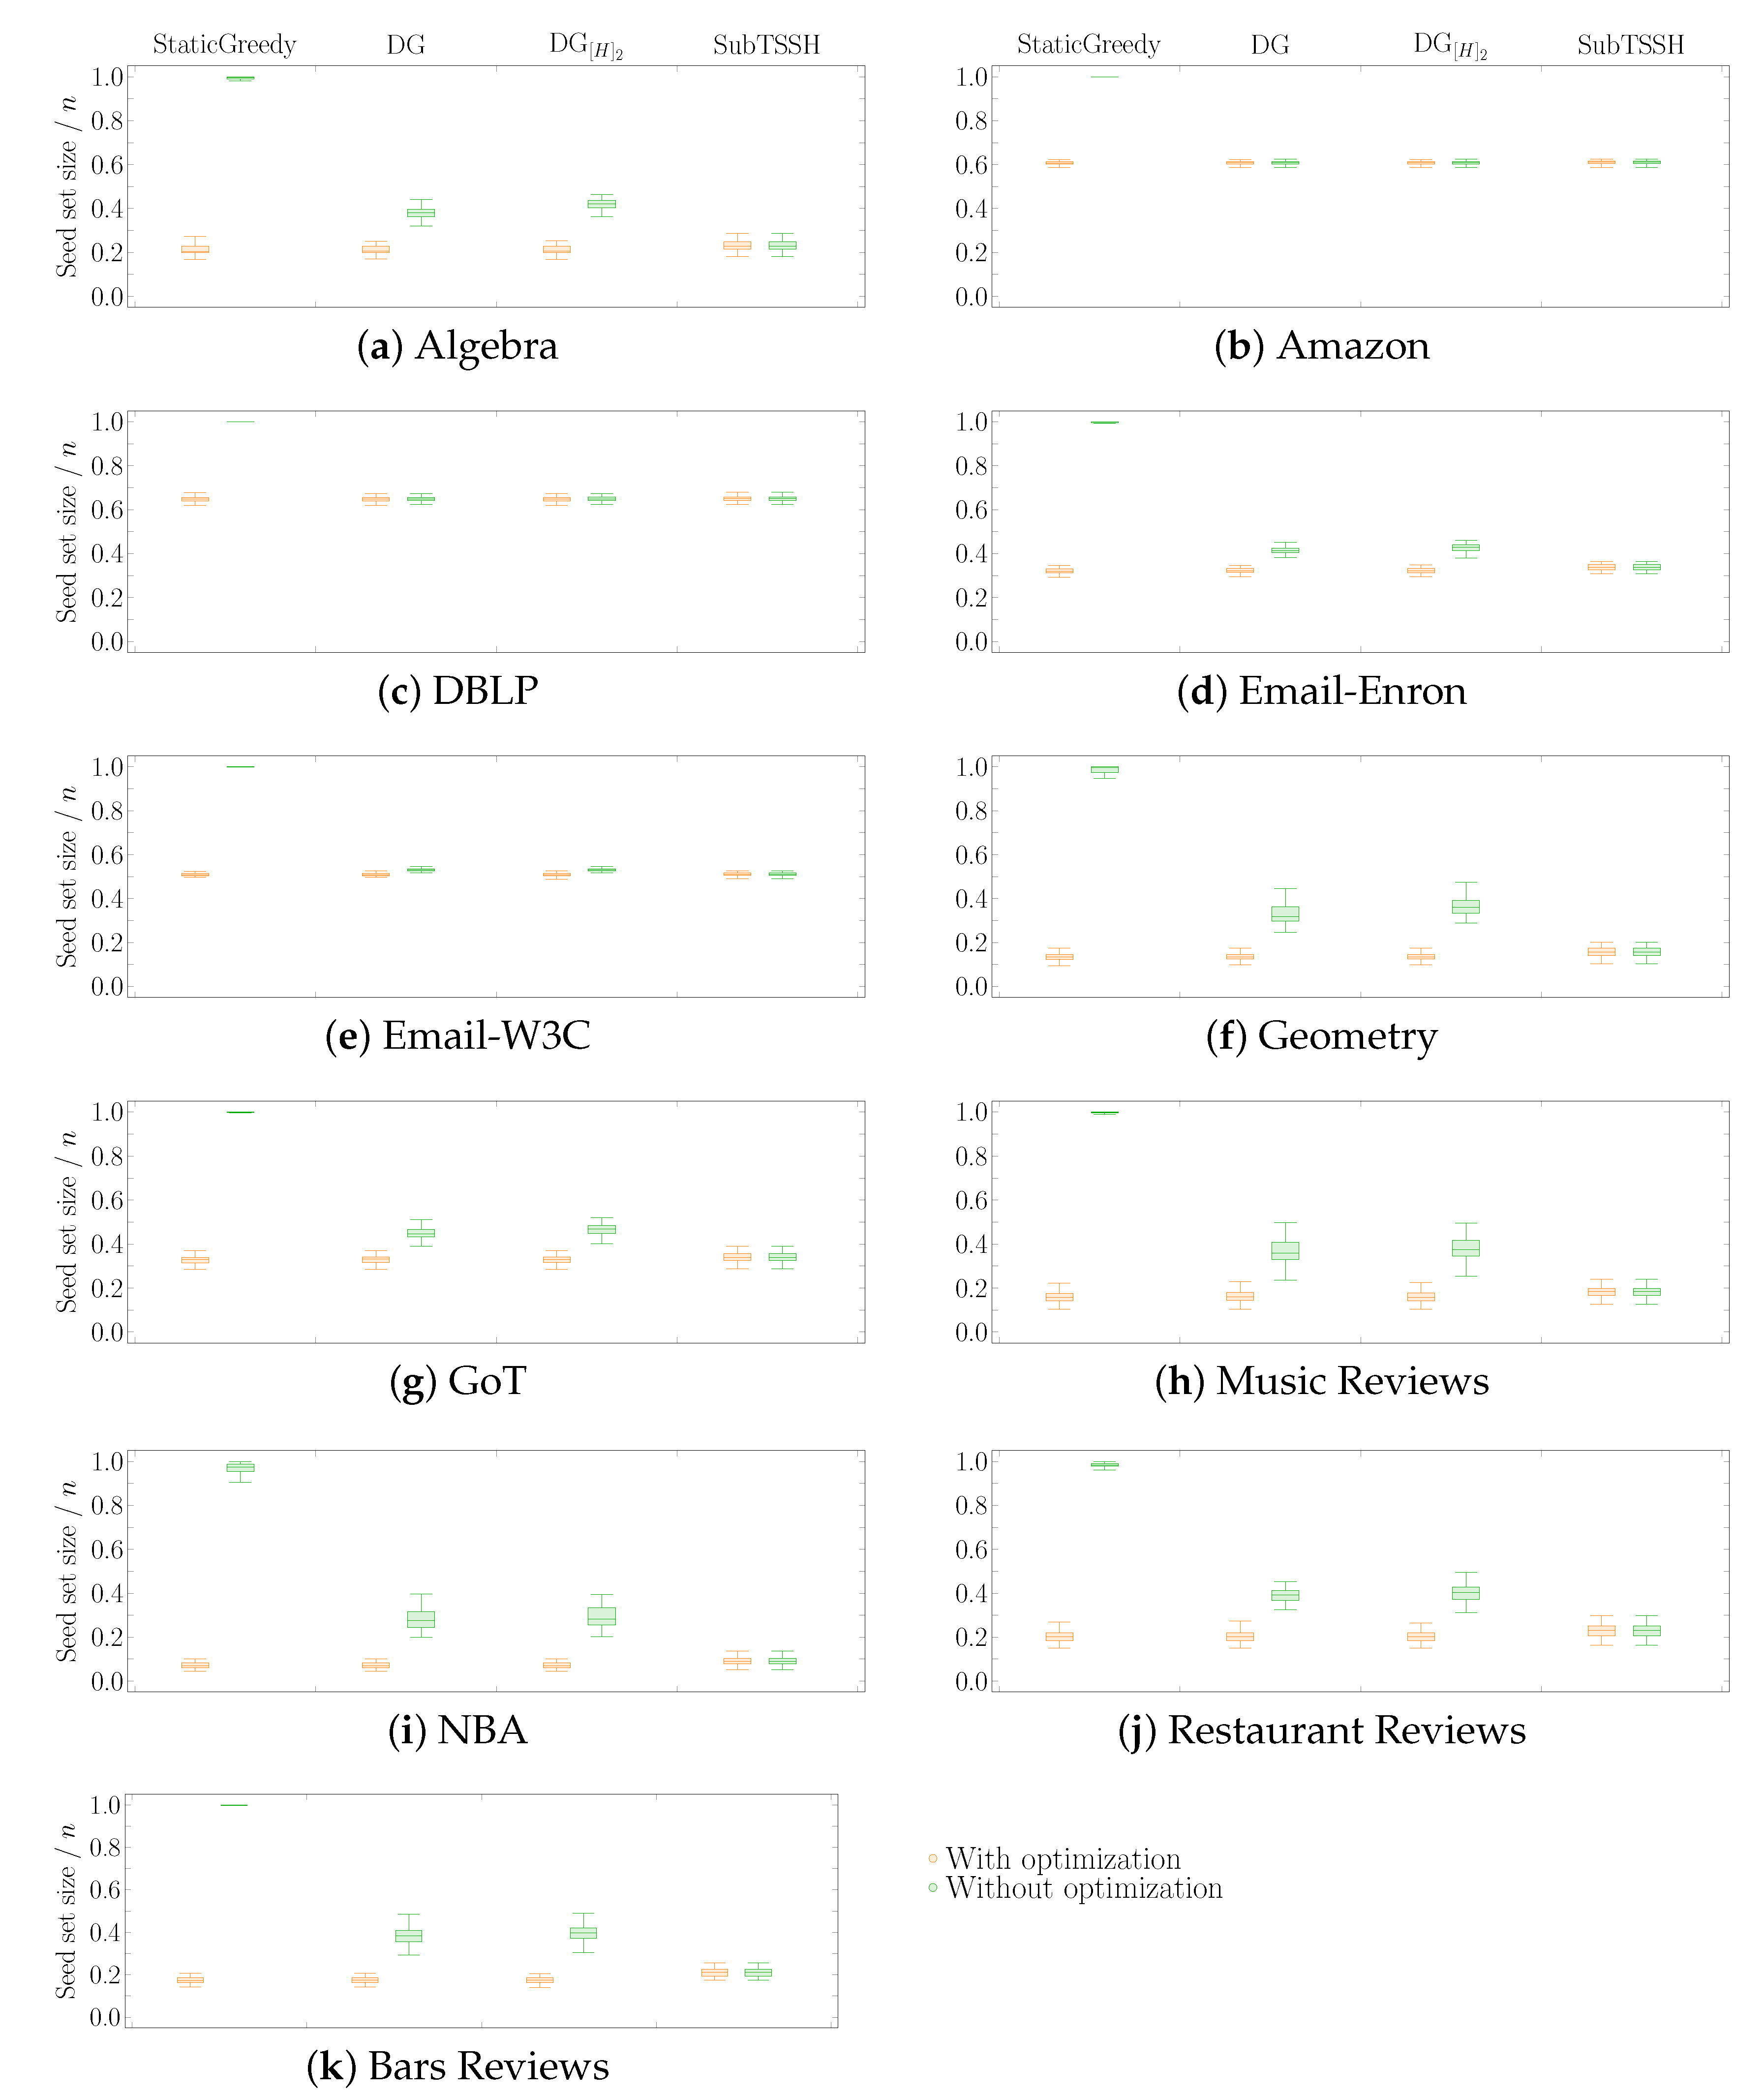
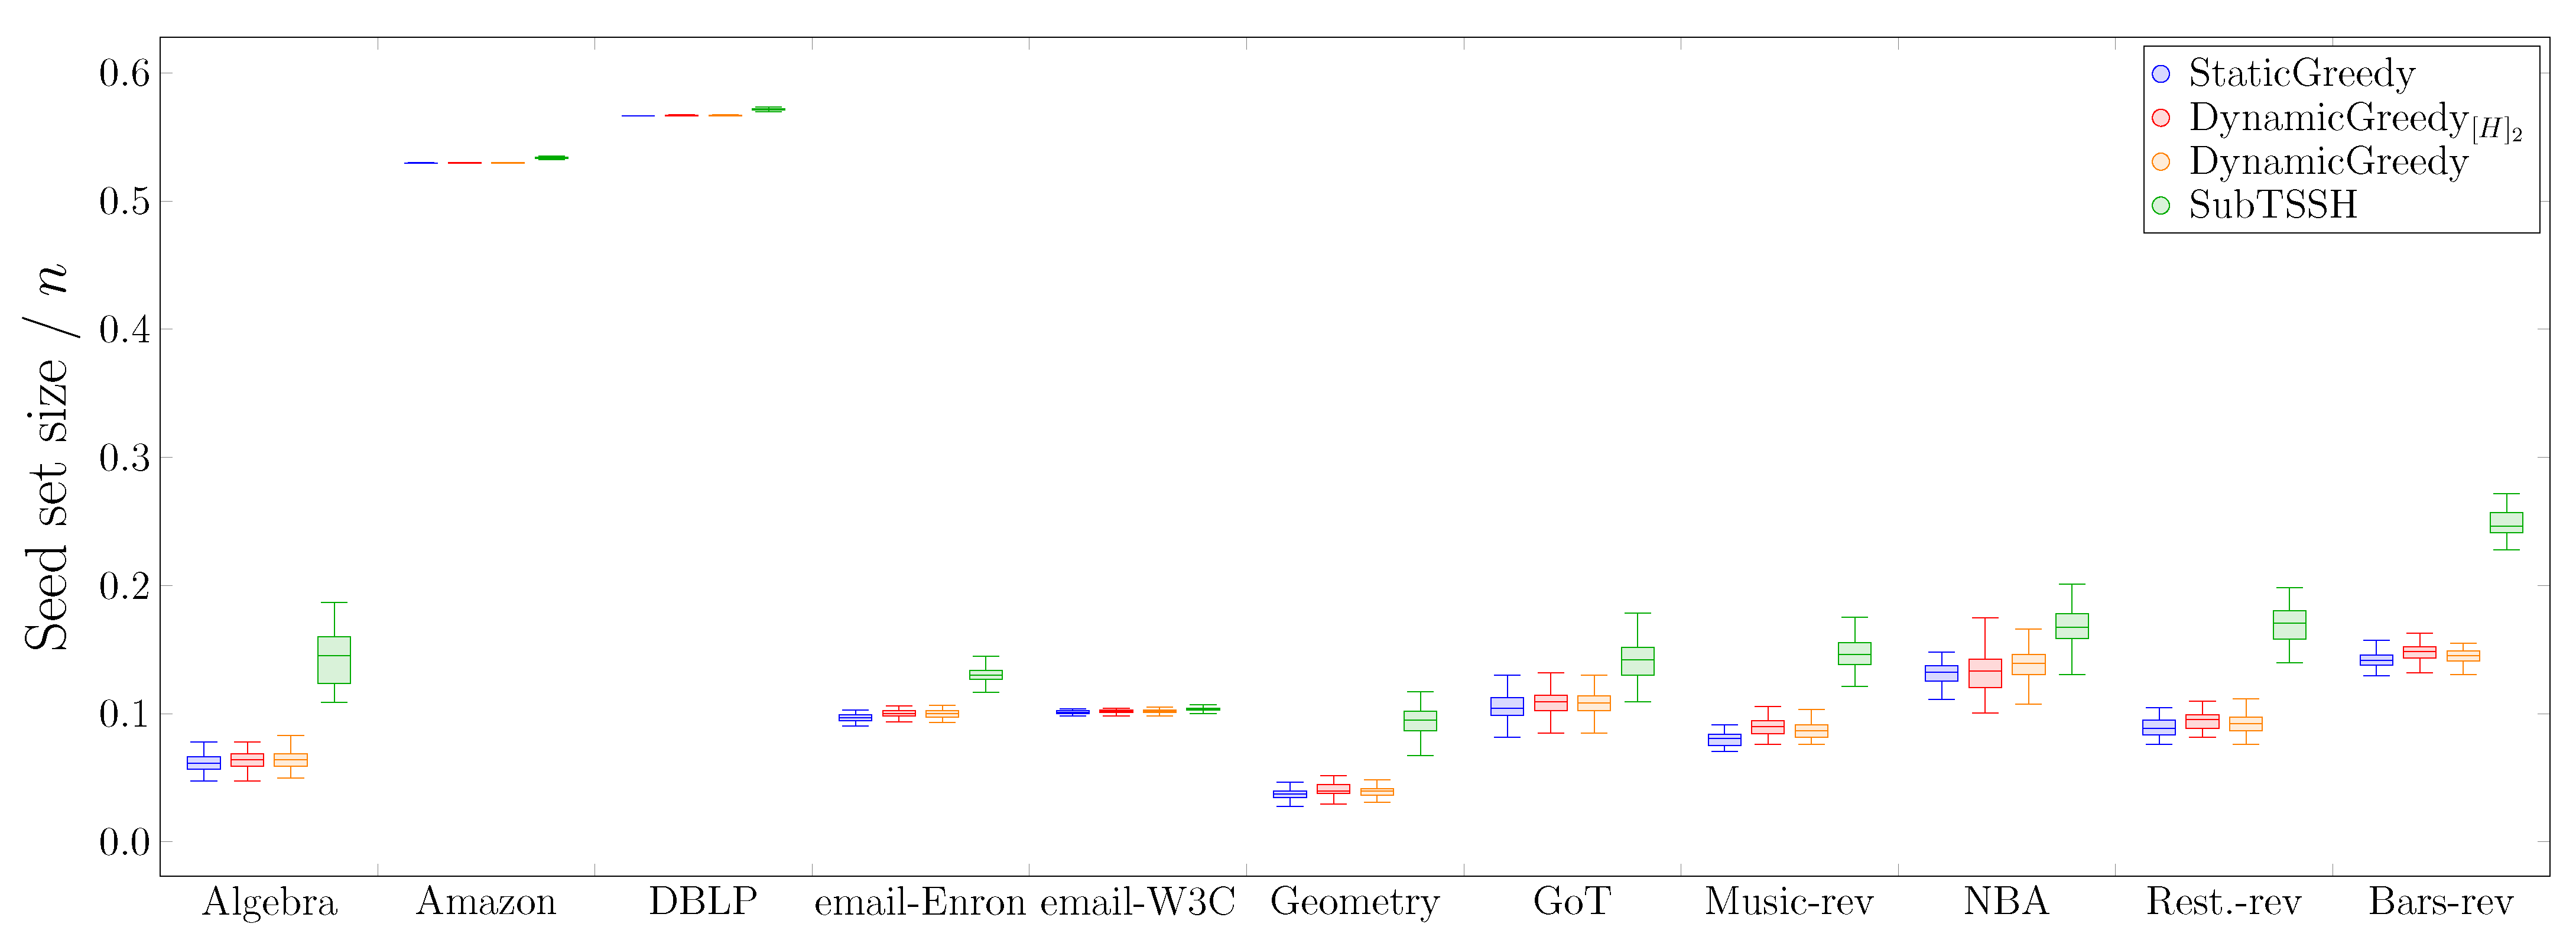
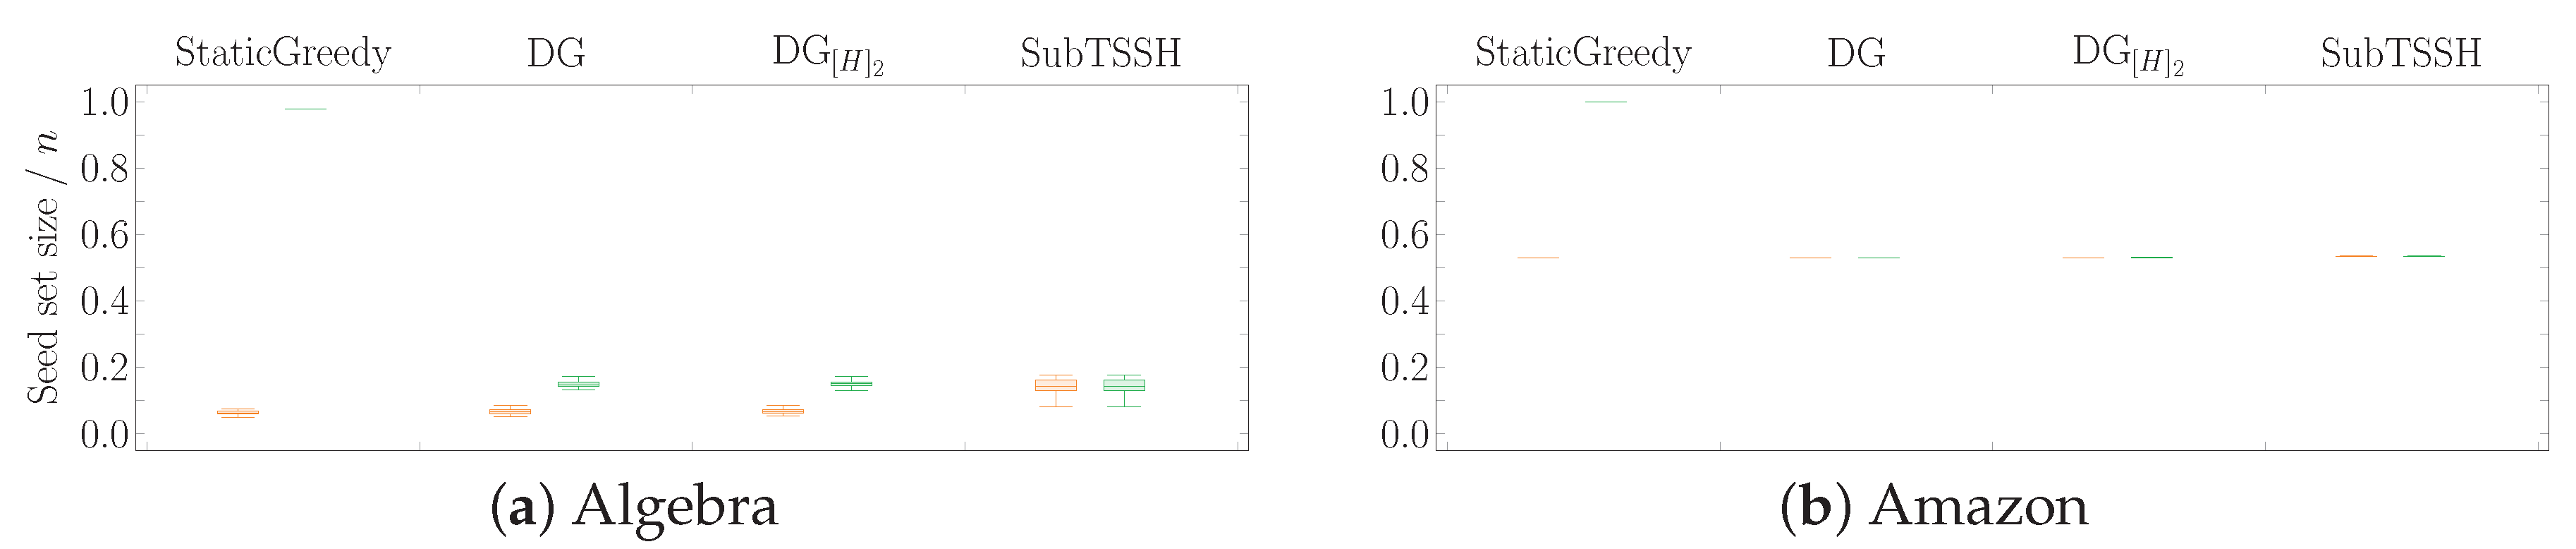
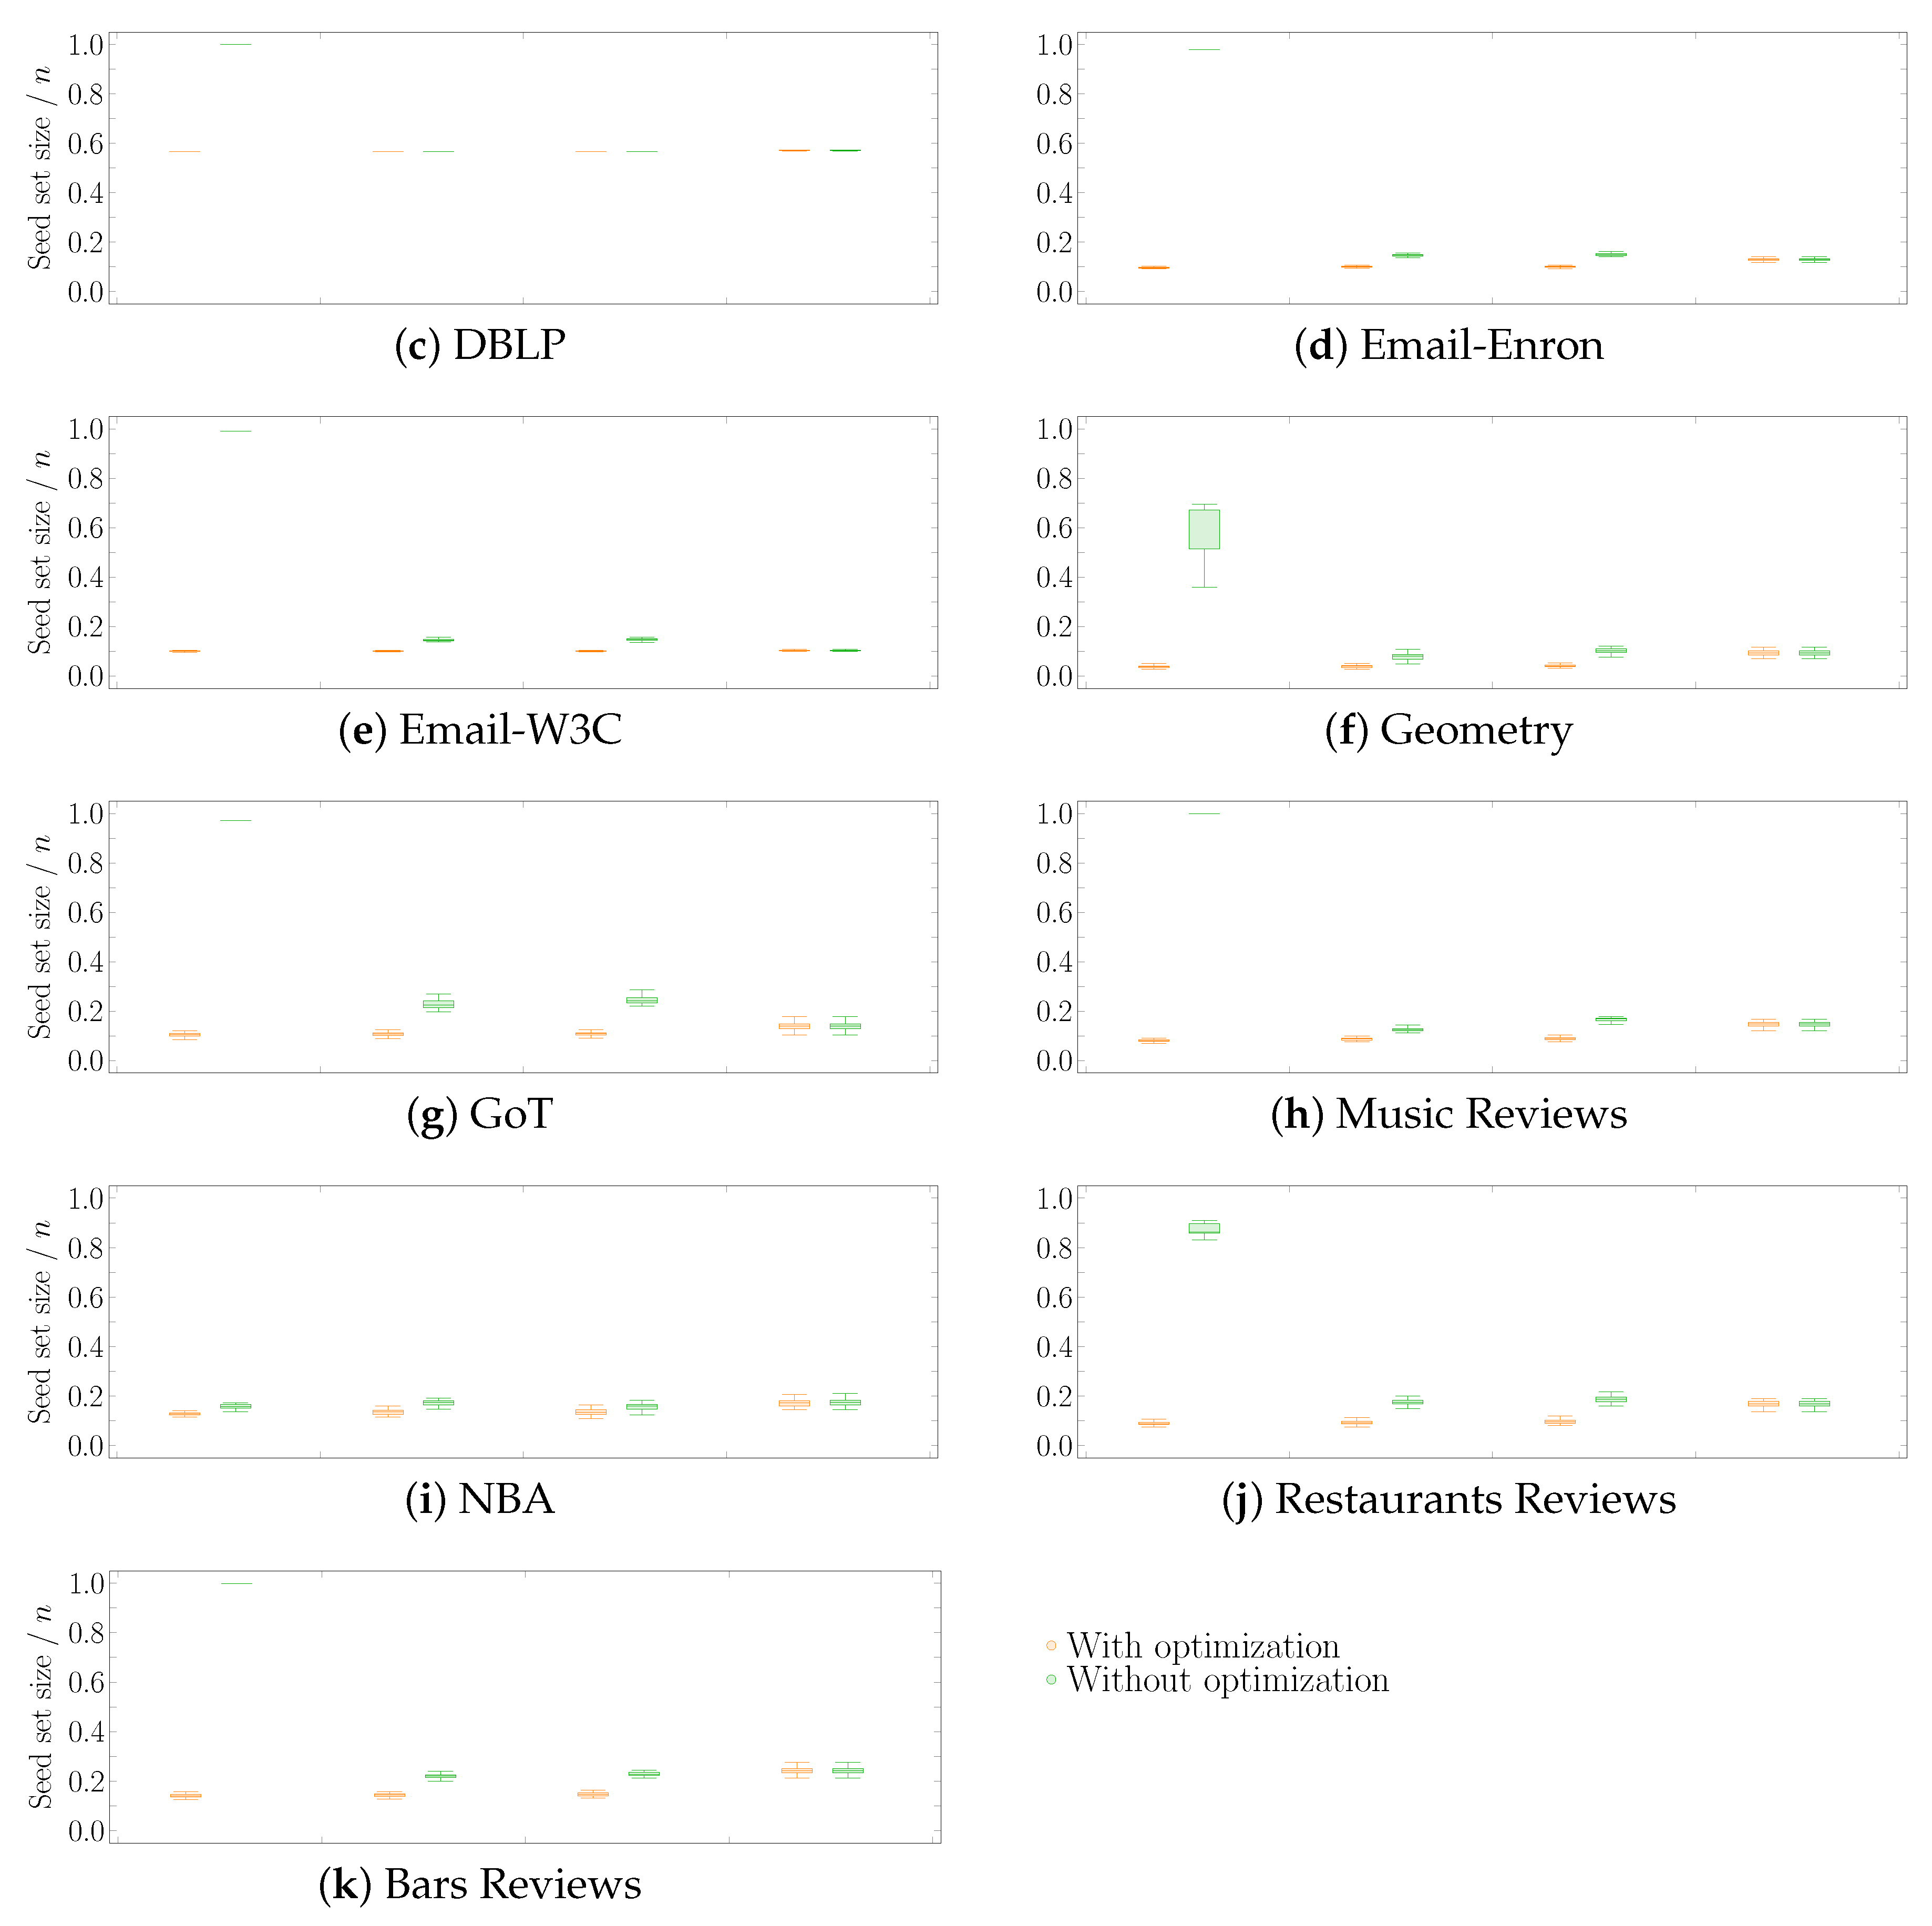
In this first experimental scenario, we fixed each node (hyperedge) threshold to a random value between 1 and its degree (size), varying it at each run of the experiment. Figure 3 shows the distribution of the seed set size per hypergraph using the four heuristics described in Section 4, followed by the optimization procedure. Figure 4 reports the same information zooming into each data set comparing the four heuristics with (left—orange) and without (right—green) the optimization procedure. The size of the seed set is reported as the ratio over the total number of nodes to enable comparison across all data sets.
The first interesting aspect to note is that the optimization phase has a meaningful impact on all three additive heuristics—, , and . This behavior is highly emphasized when looking at the procedure, where the algorithm selects almost the totality of the nodes when run without optimization. Second, the cleaning procedure carried out after selecting the initial seed set leads to achieving very similar results when using the additive heuristics. This outcome may happen because the three heuristics choose a very similar set of core nodes (i.e., the nodes remaining after the optimization phase), even though they initially select different seed sets. On the other hand, the optimization phase has a very low, if not zero, impact on reducing the initial seed set found by the subtractive heuristic . Thus, running the algorithm with and without optimization brings consistent results, always comparable with the outcomes of the additive heuristics. As a result, when using the algorithm, the optimization phase may also be skipped by paying a minimal price on the dimension of the final seed set.
5.2.2. Scenario 2—Random Node Thresholds, Majority Policy on Hyperedges
In a second experiment, we fixed each node threshold to a random value between 1 and its degree, varying it at each run of the experiment. We used a majority policy for the hyperedge thresholds instead. Figure 5 shows the distribution of the ratio of the seed set size over the total number of nodes n per hypergraph obtained by running the four heuristics with the optimization step. Figure 6 reports the same information zooming into each data set comparing the four heuristics with (left—orange) and without (right—green) the optimization procedure. The results of this experiment resemble the outcomes of Scenario 1. As in the previous case, additive heuristics (plus the optimization procedure) perform slightly better than in obtaining the smallest seed set.
Among all data sets, when it comes to select the seed set for the hypergraphs associated with Amazon and DBLP, all heuristics (with and without optimization procedure) pick at least half of the total number of nodes. This result is emphasized by the smaller number of nodes (in percentage) required to fully influence the other networks. A similar pattern also happens in Scenario 1 (see Figure 3). The reason for this behavior has to be sought in the topology of the networks. What differentiates the Amazon and DBLP hypergraphs from the others is that their number of nodes is at least higher than their number of hyperedges. In addition, the majority of the nodes of the two networks has degree equal to 1 ( for Amazon, for DBLP). Being involved in only one relation, these nodes are difficult to influence and, at the same time, cannot help in influencing other nodes; thus, confirming how the topology of the network strongly determines the minimum target set needed to influence the whole hypergraph. As expected, performs the worst when not followed by the cleaning step, selecting in all hypergraphs but NBA the highest number of nodes (if not almost all nodes). In line with our previous work [17], this outcome suggests that using a dynamic approach is critical to select a reasonable seed set.
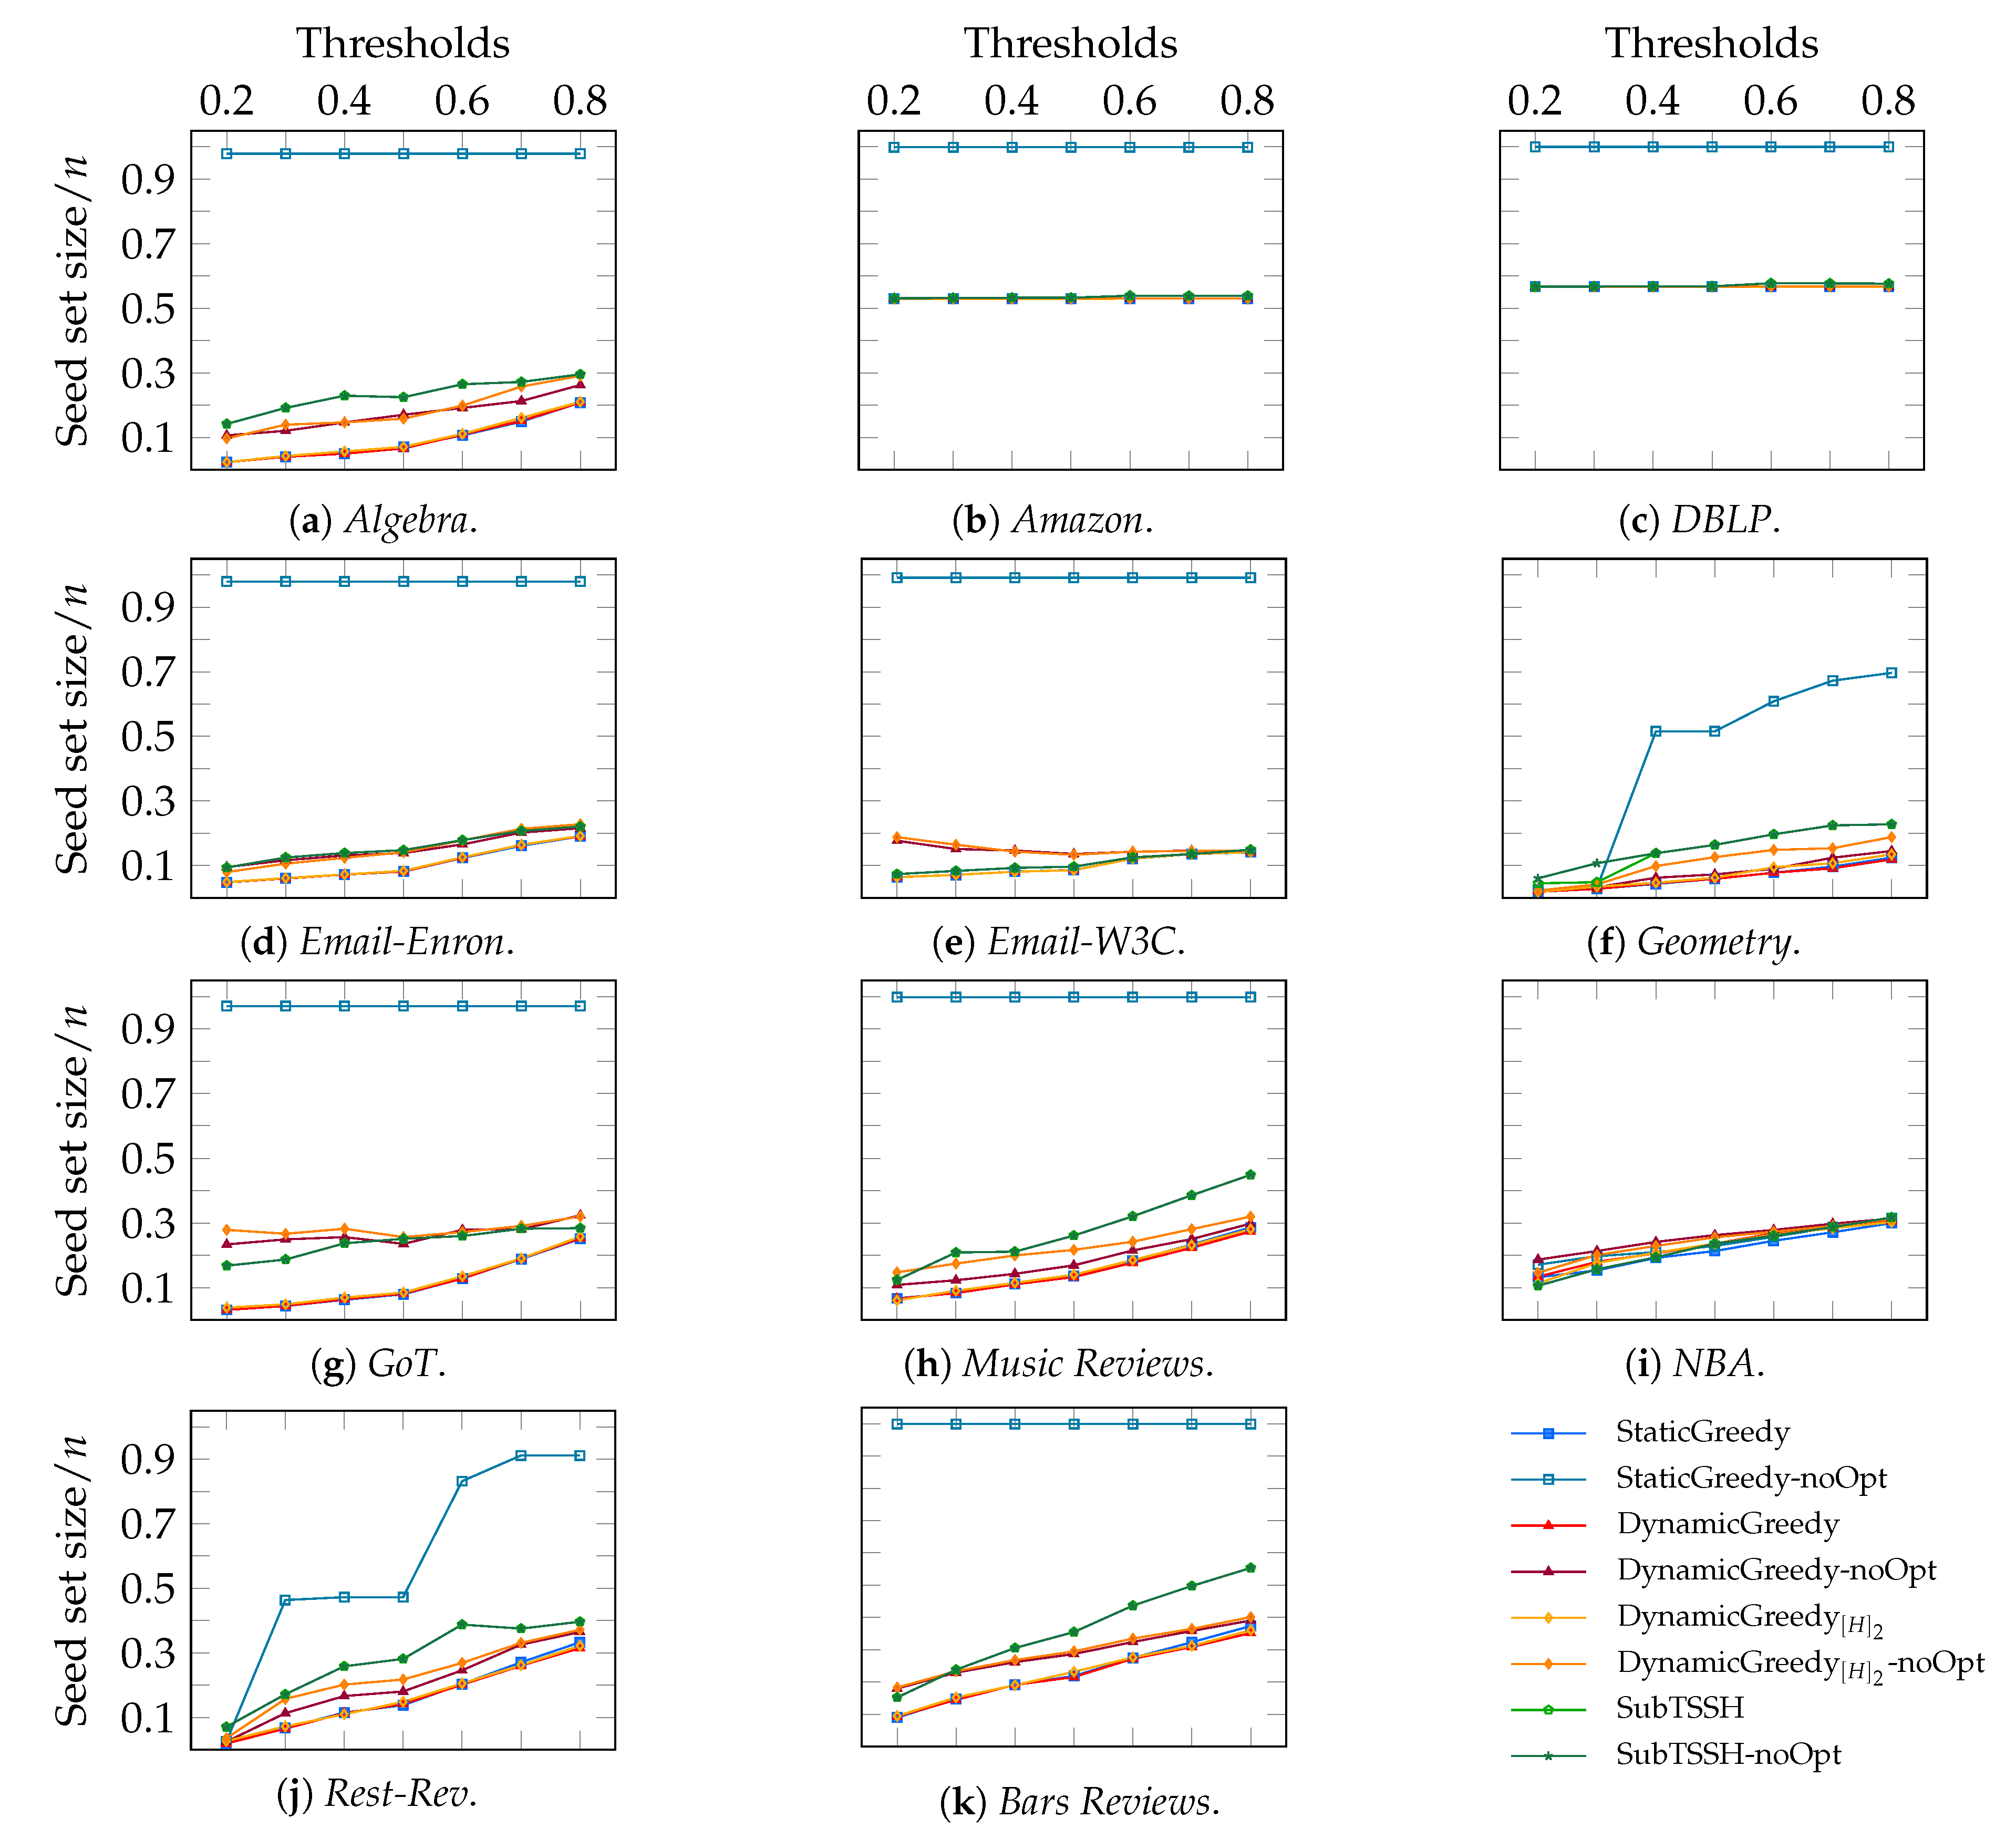
5.2.3. Scenario 3—Proportional Node Thresholds, Random Hyperedge Thresholds
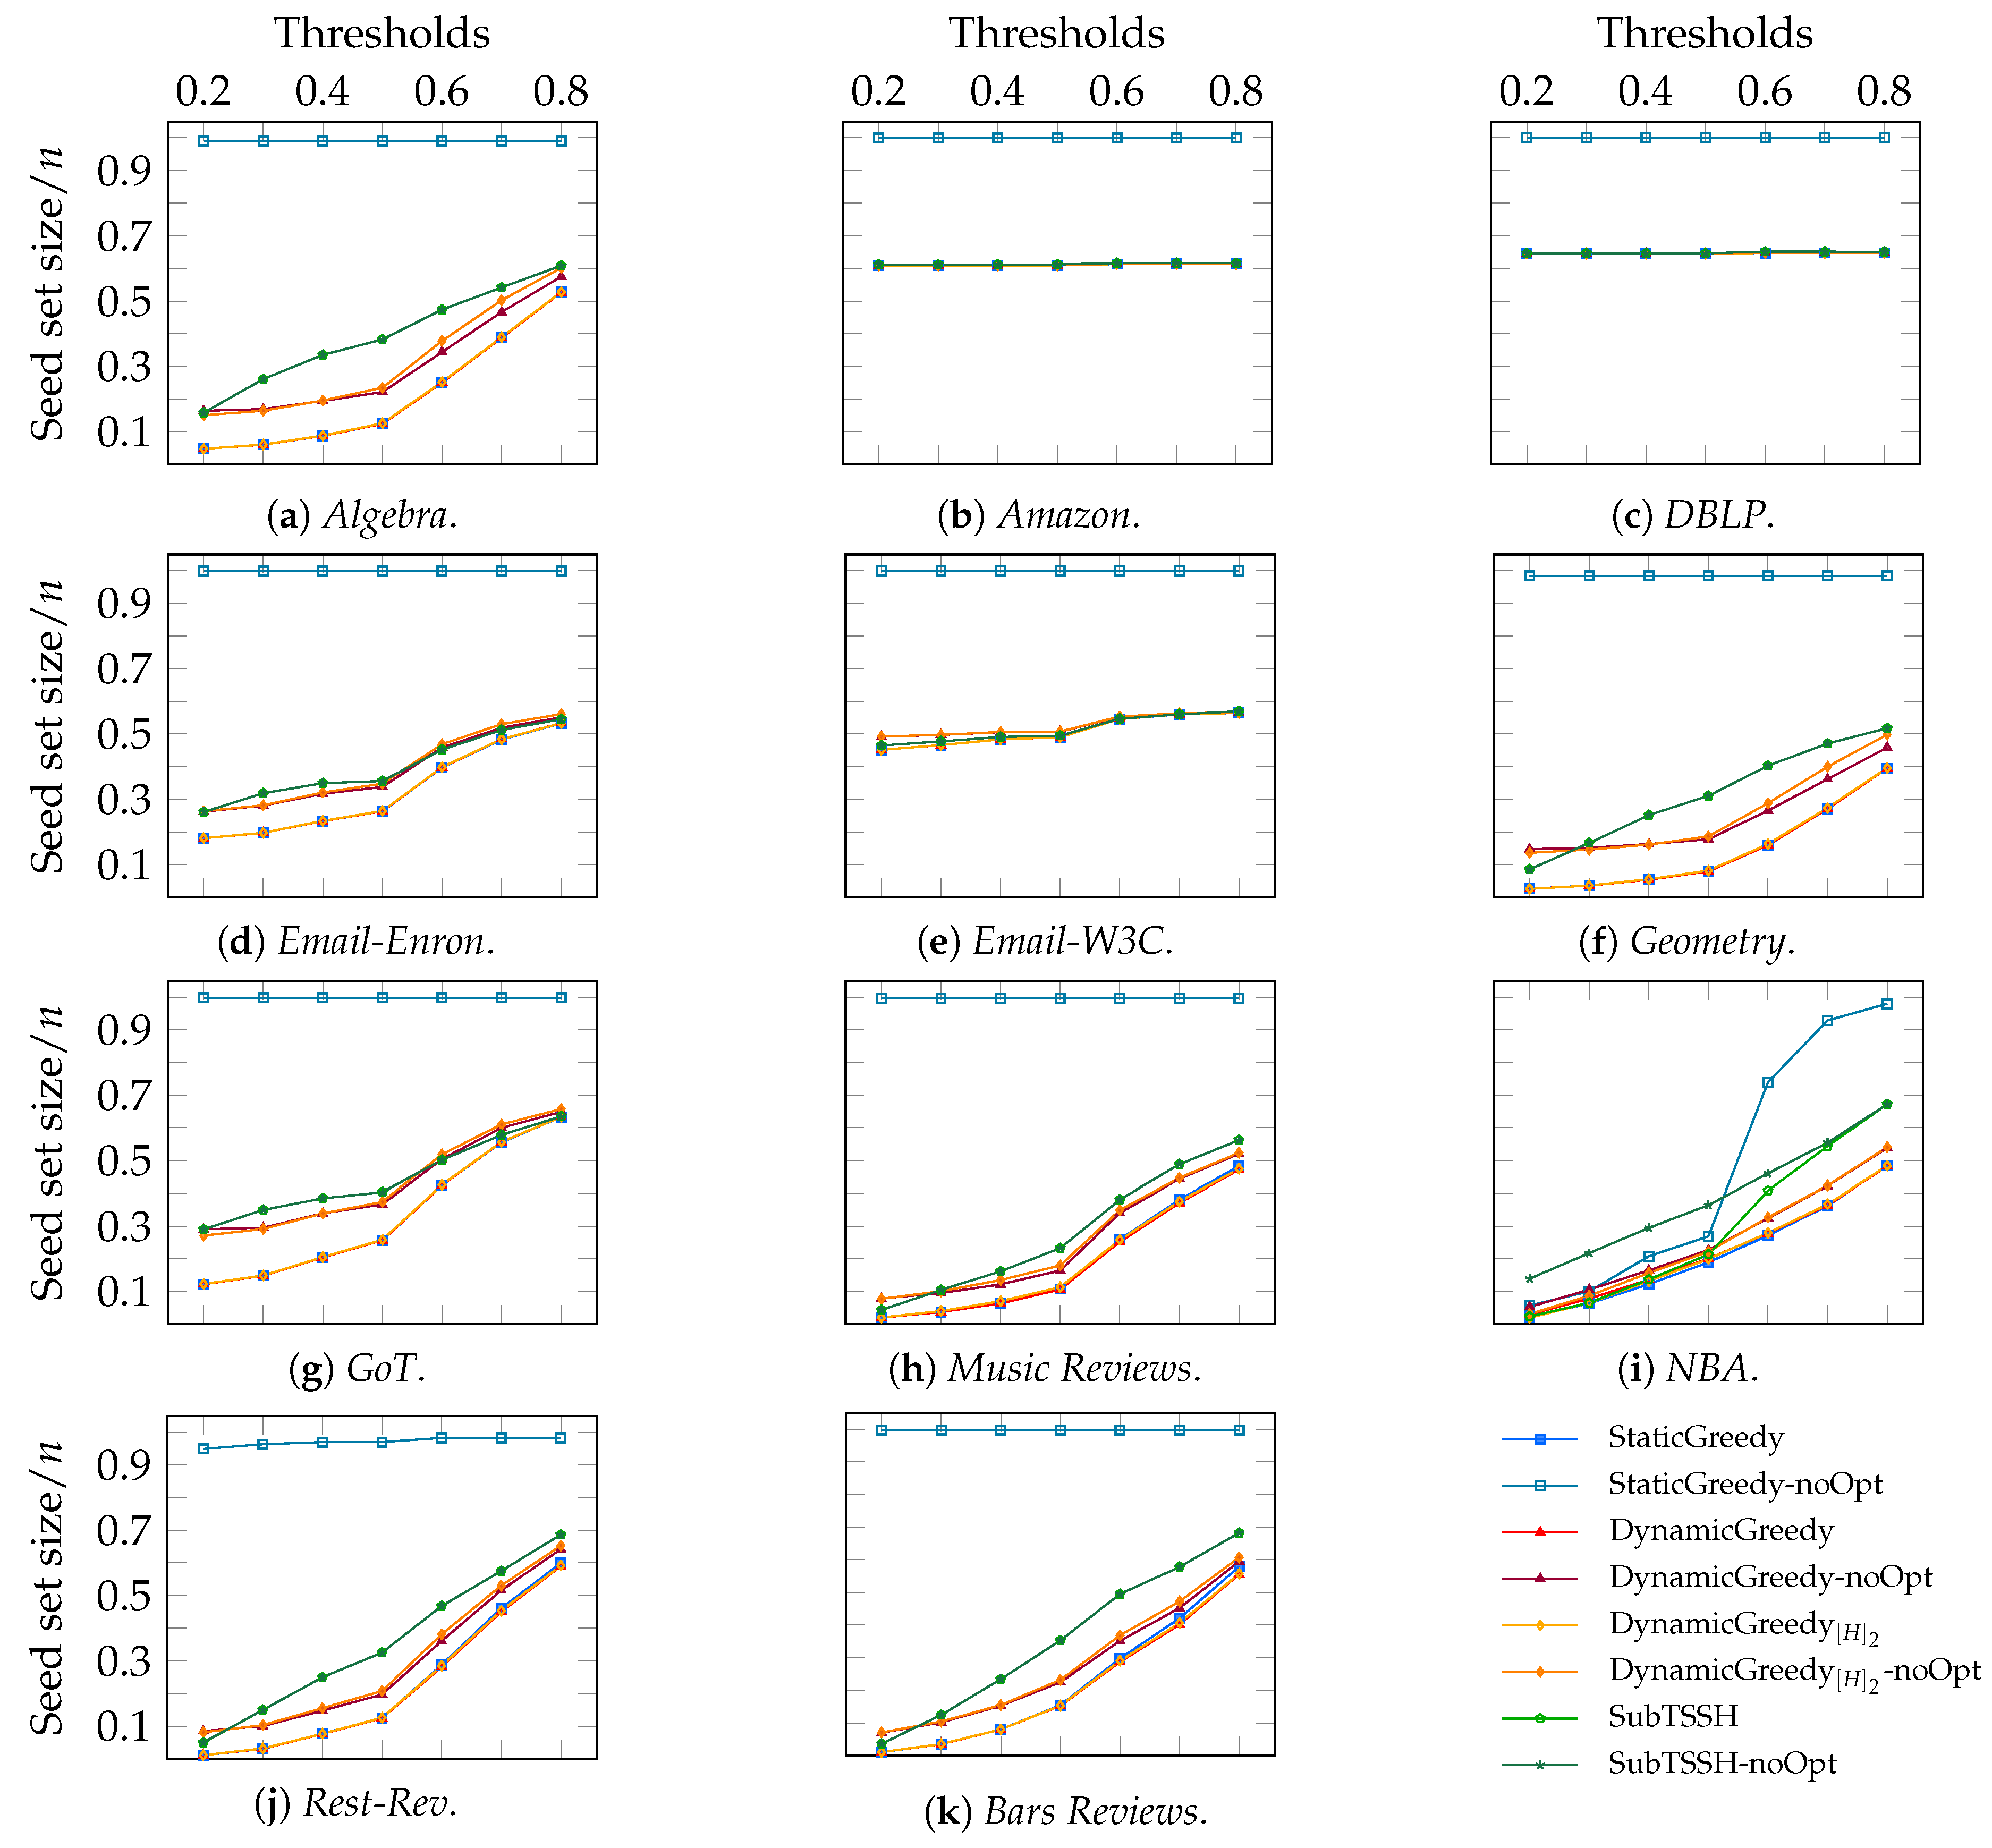
In this third experimental scenario, we varied each node threshold proportionally—from to —to the degree of the node and fixed each hyperedge threshold to a random value between 1 and its size. It is worth stressing that the higher the threshold, the harder it is to influence the given node or hyperedge.
Figure 7 shows the ratio of the seed set size over the total number of nodes n separately for each hypergraph. These outcomes look like the ones previously discussed in Scenario 1 and Scenario 2. Overall, the additive heuristics followed by the optimization procedure performed better in all data sets, consistently achieving a smaller seed set than , regardless of the node threshold value. Generally, using proportional node thresholds, and without the cleaning procedure tend to perform equal or better than (with and without optimization). A plausible explanation for this behavior must be sought in how each algorithm selects the next node to add to the seed set. Specifically, and choose the nodes to put in the seed set only based on their degree. In this specific setting, selecting the nodes with a higher degree increases the probability of influencing a higher number of nodes (being each node’s threshold proportional to its degree). On the other hand, prunes from the hypergraph nodes that are easy to influence, even though they may have many neighbors; hence, removing possible good candidates. As already discussed in the previous two scenarios, the algorithm without the cleaning step always produces a seed containing almost all nodes. Further, as before, optimizing the result of the procedure brings little or no improvements to the seed set size.
Again, this experiment draws attention to the Amazon and DBLP hypergraphs, as it clearly stands out that all heuristics have the same performance (as also happens in the first two experiments, see Figure 3 and Figure 5). We can further observe the same behavior for the Email-W3C hypergraph. As already discussed, the reason for that lies in the number of nodes being part of only one relation ( of the nodes have degree 1).
5.2.4. Scenario 4—Proportional Node Thresholds, Majority Policy on Hyperedges
In the fourth and last experimental scenario, we varied each node threshold proportionally—from to —to the degree of the node, while we used a majority policy for hyperedges.
Figure 8 shows the ratio of the seed set size over the total number of nodes n separately for each hypergraph. We can observe a familiar picture, where the three additive heuristics—followed by the optimization step—retrieve the smallest seed sets and the three particular cases of the Amazon, DBLP, and Email-W3C hyper-networks where all heuristics (but without optimization) achieve very similar results. Generally, as also observable in Figure 5, fewer nodes are required to influence the whole network when a majority policy on hyperedges is used. This outcome means that, on average, hyperedges with a higher threshold make the problem harder.
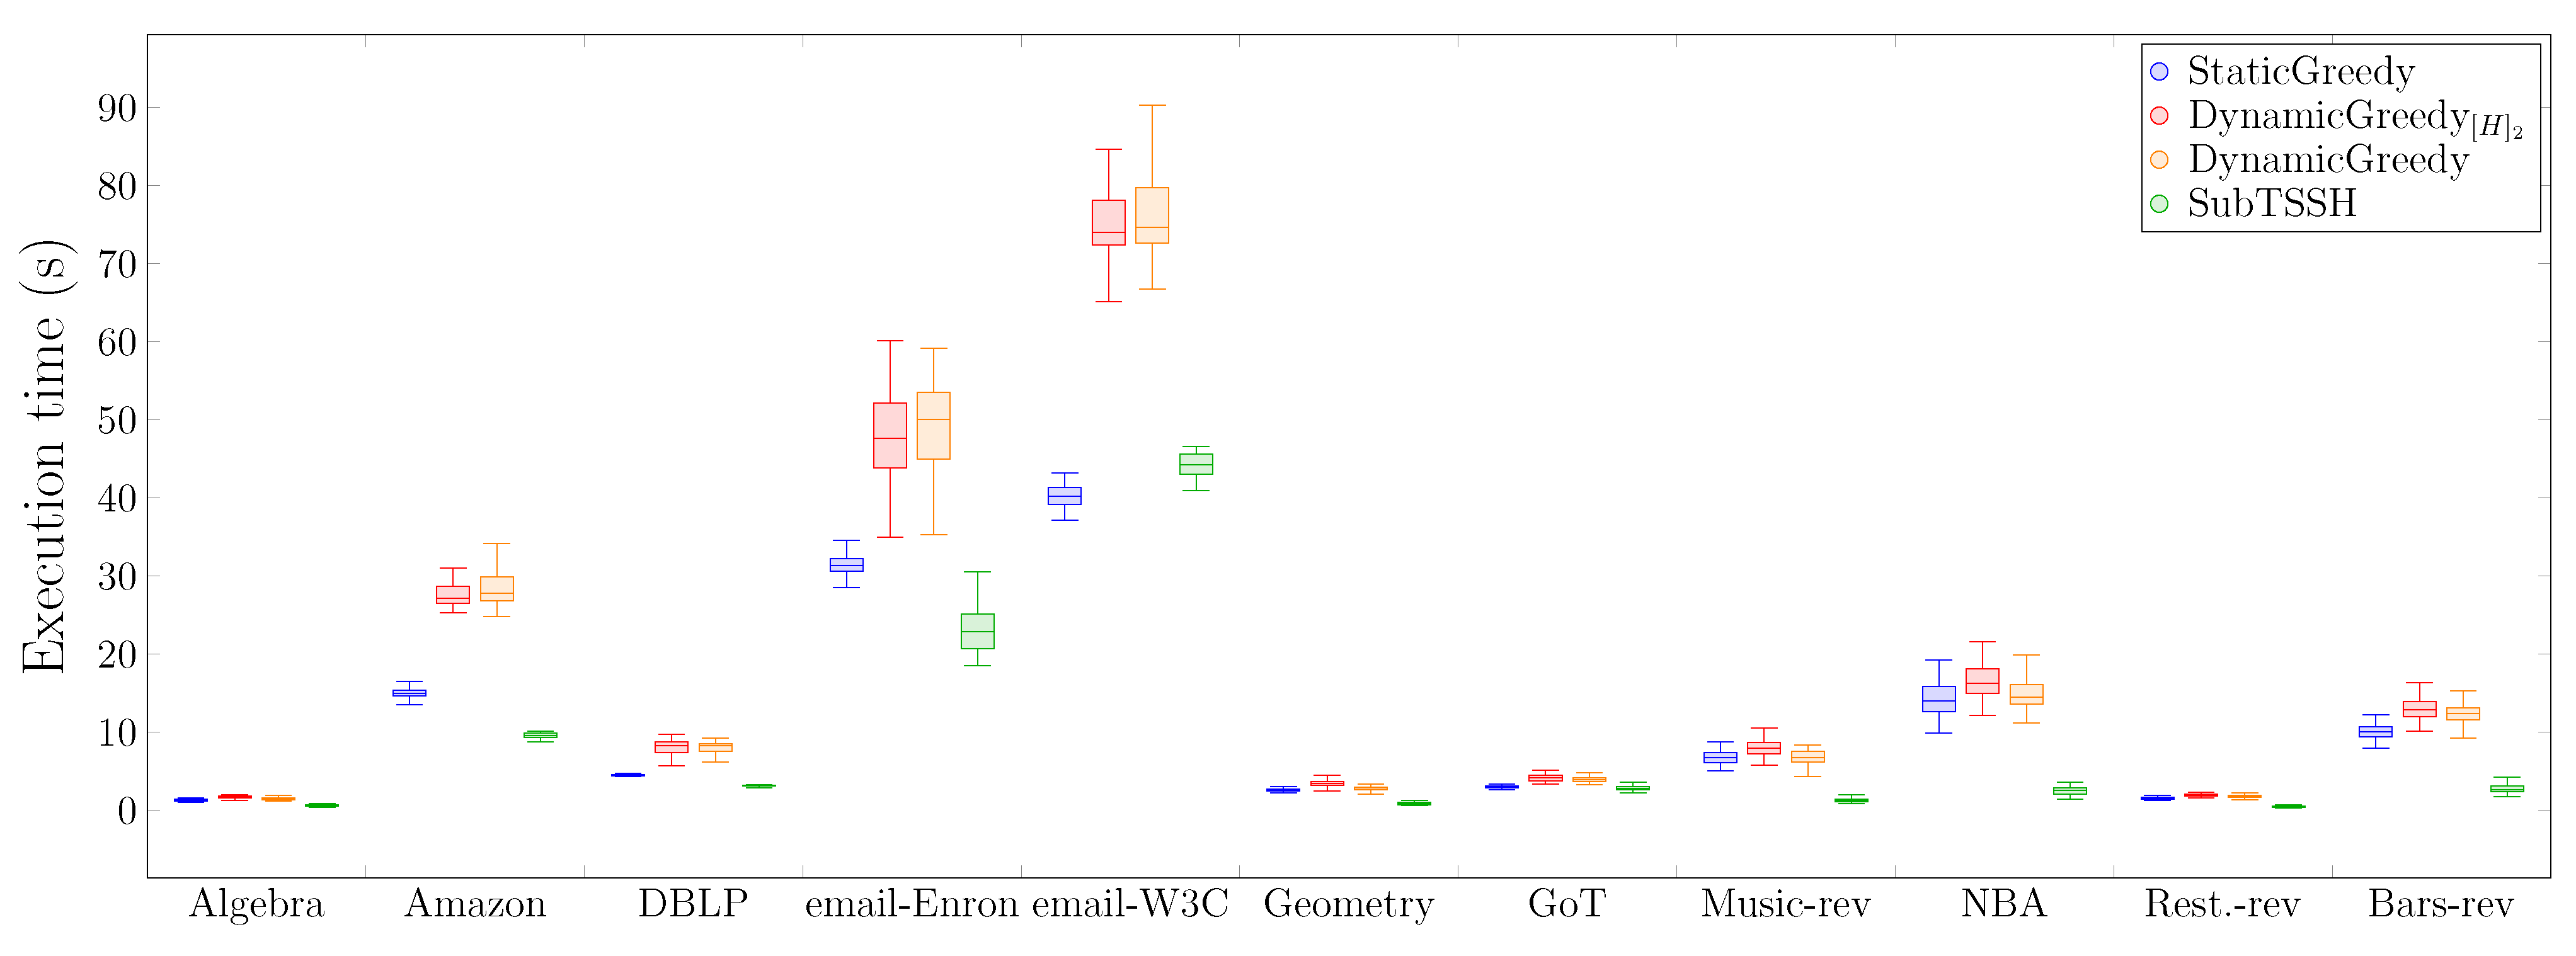
5.3. Execution Time Comparison
Having investigated the effectiveness of each heuristic in finding the smallest target set able to influence the whole network, we then analyzed their performance in terms of execution time. Specifically, we used the same setting of Scenario 1, fixing random thresholds for both nodes and hyperedges. We simulated the execution of each heuristic 50 times, using the Julia package BenchmarkTools.jl. We run each experiment on an Ubuntu 18.04.2 LTS machine, equipped with Intel(R) Xeon(R) CPU E5-2660 0 @ 2.20 GHz and 32 GB RAM.
Figure 9 presents the distribution of the time (in seconds) required for each heuristic to complete the task. The first interesting outcome here, although not surprising, is that additive heuristics consistently need more time than the subtractive technique to accomplish the task. As already discussed in Scenario 1, this behavior is due to the fact that additive techniques select many unnecessary nodes demanding a significant workload for the optimization phase, thus increasing the overall time needed to compute the final seed set. As expected, the additive dynamic heuristics— and —require the highest computational time, as their algorithms, at each iteration, compute the residual network, updating the nodes candidate set. Generally, the subtractive heuristic requires at least half of the time of the dynamic additive heuristics to complete, thus representing a practical alternative when dealing with bigger hyper-networks.
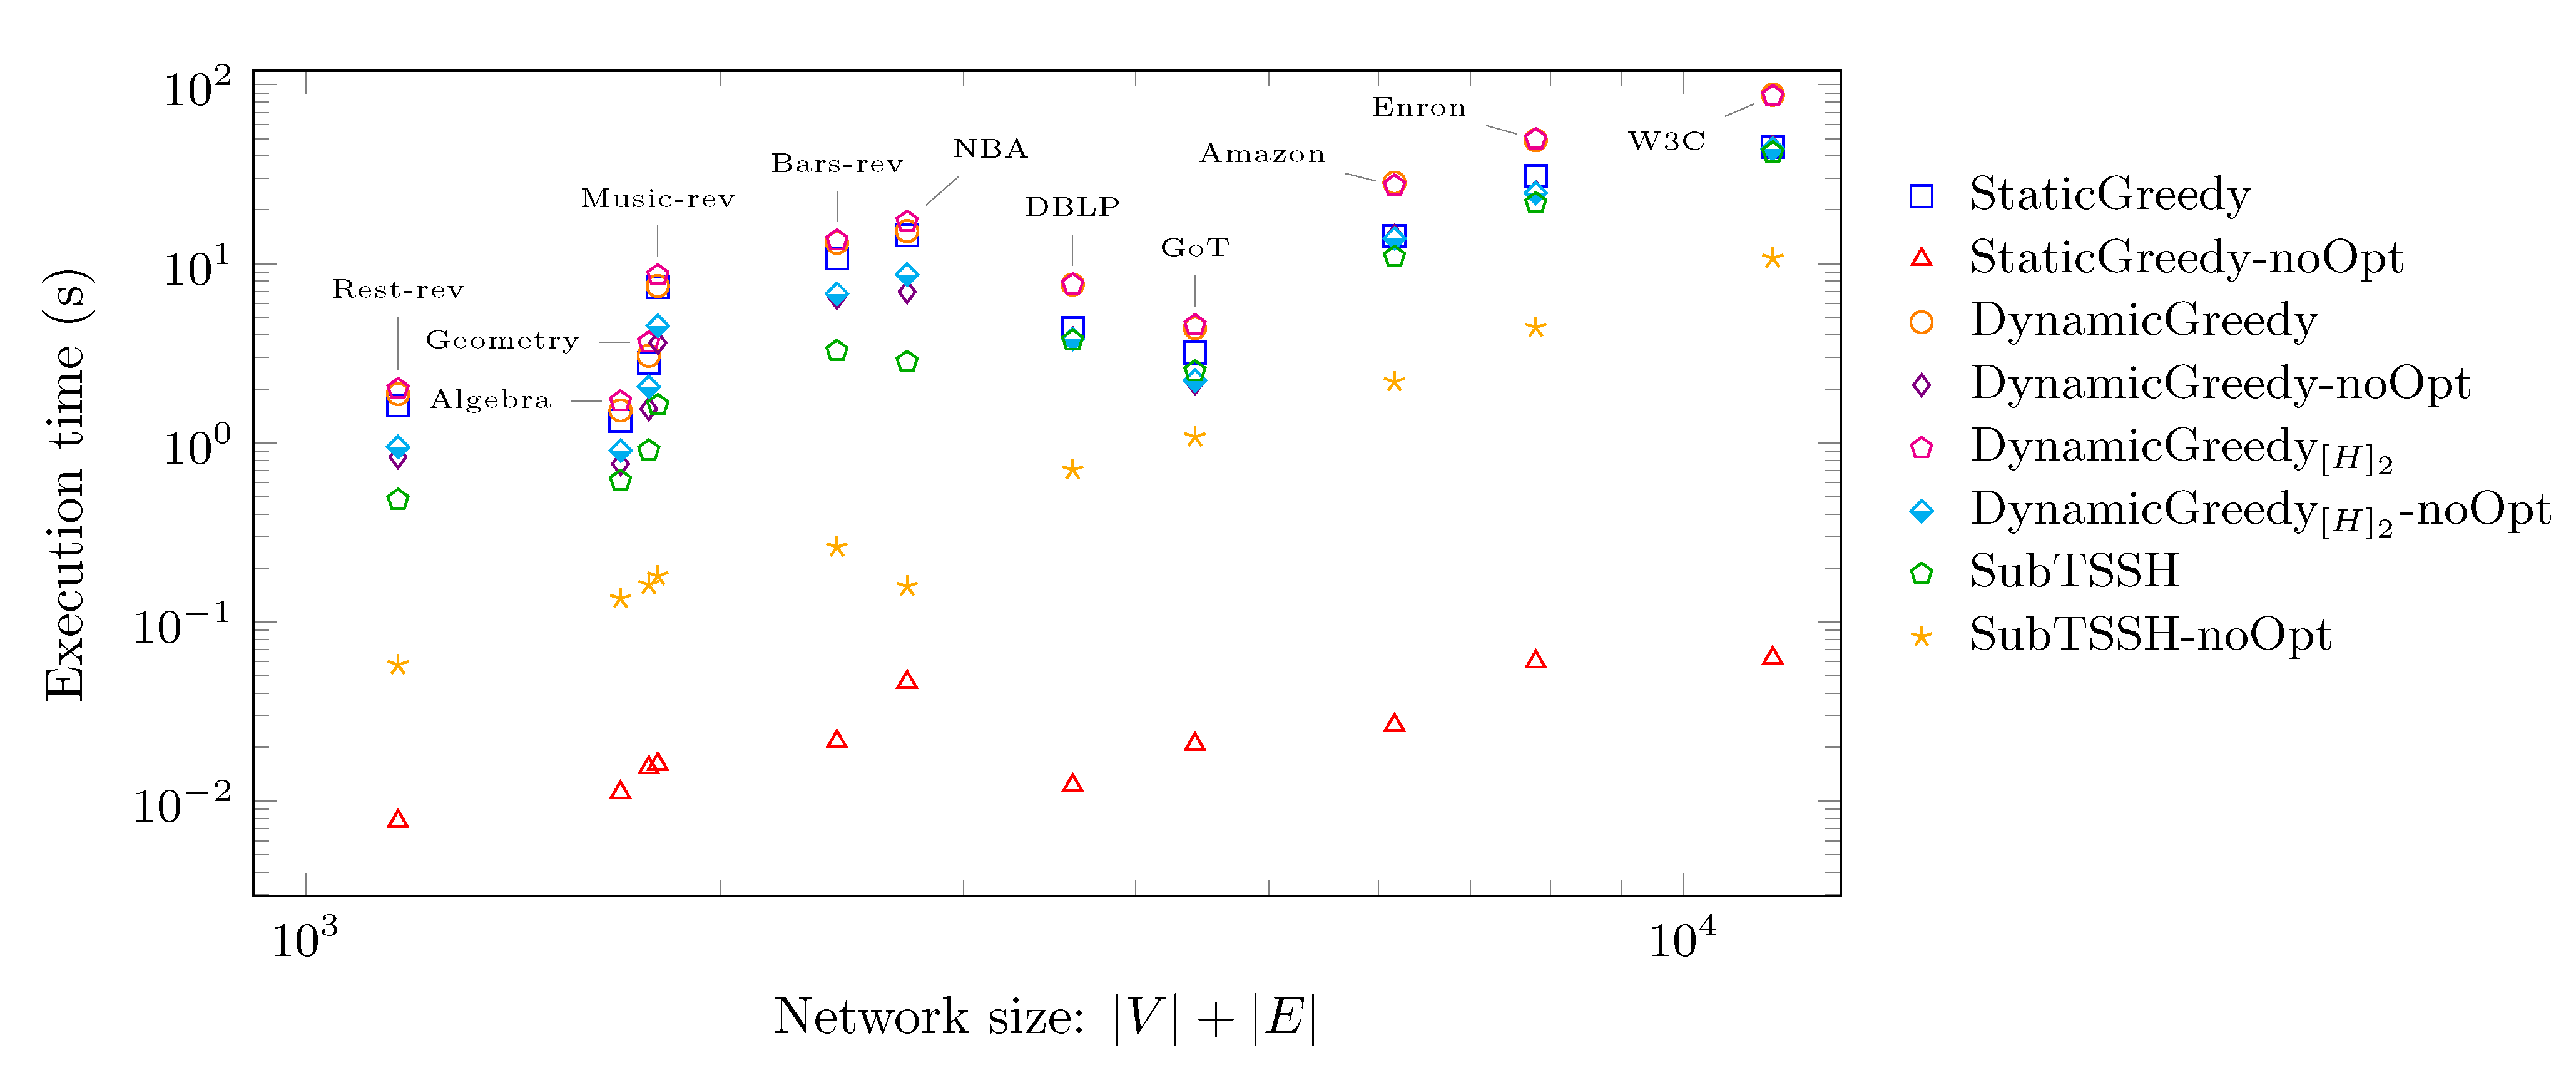
Figure 10 shows the same results under a different perspective: in this case, the time needed for each heuristic to complete the task is plotted against the network size, evaluated as . Thus, it allows us to analyze how each algorithm scales with increasing hyper-network size. This time, we also show the results associated with the four greedy strategies—, , , and —run without the optimization phase. On the y-axis, the average running time of each heuristic is reported. Both axes have a logarithmic scale. Consistently with the data shown in Figure 9, followed by the optimization procedure achieves a very similar or even better performance of all the three additive heuristics run with the optimization phase. The procedure run without optimization obtains the best time in absolute. However, as shown in Figure 11, it selects the majority of the nodes as seed set; thus, retrieving a useless solution in practice. That leaves executed without the optimization phase as the winner. As already discussed in the experiment of Scenario 1 (see Section 5.2), the optimization phase has a very low, if not zero, impact on reducing the initial seed set evaluated by the heuristic. Hence, the optimization phase may also be skipped when using this algorithm by paying a minimal price on the final seed set’s dimension but still gaining execution time.
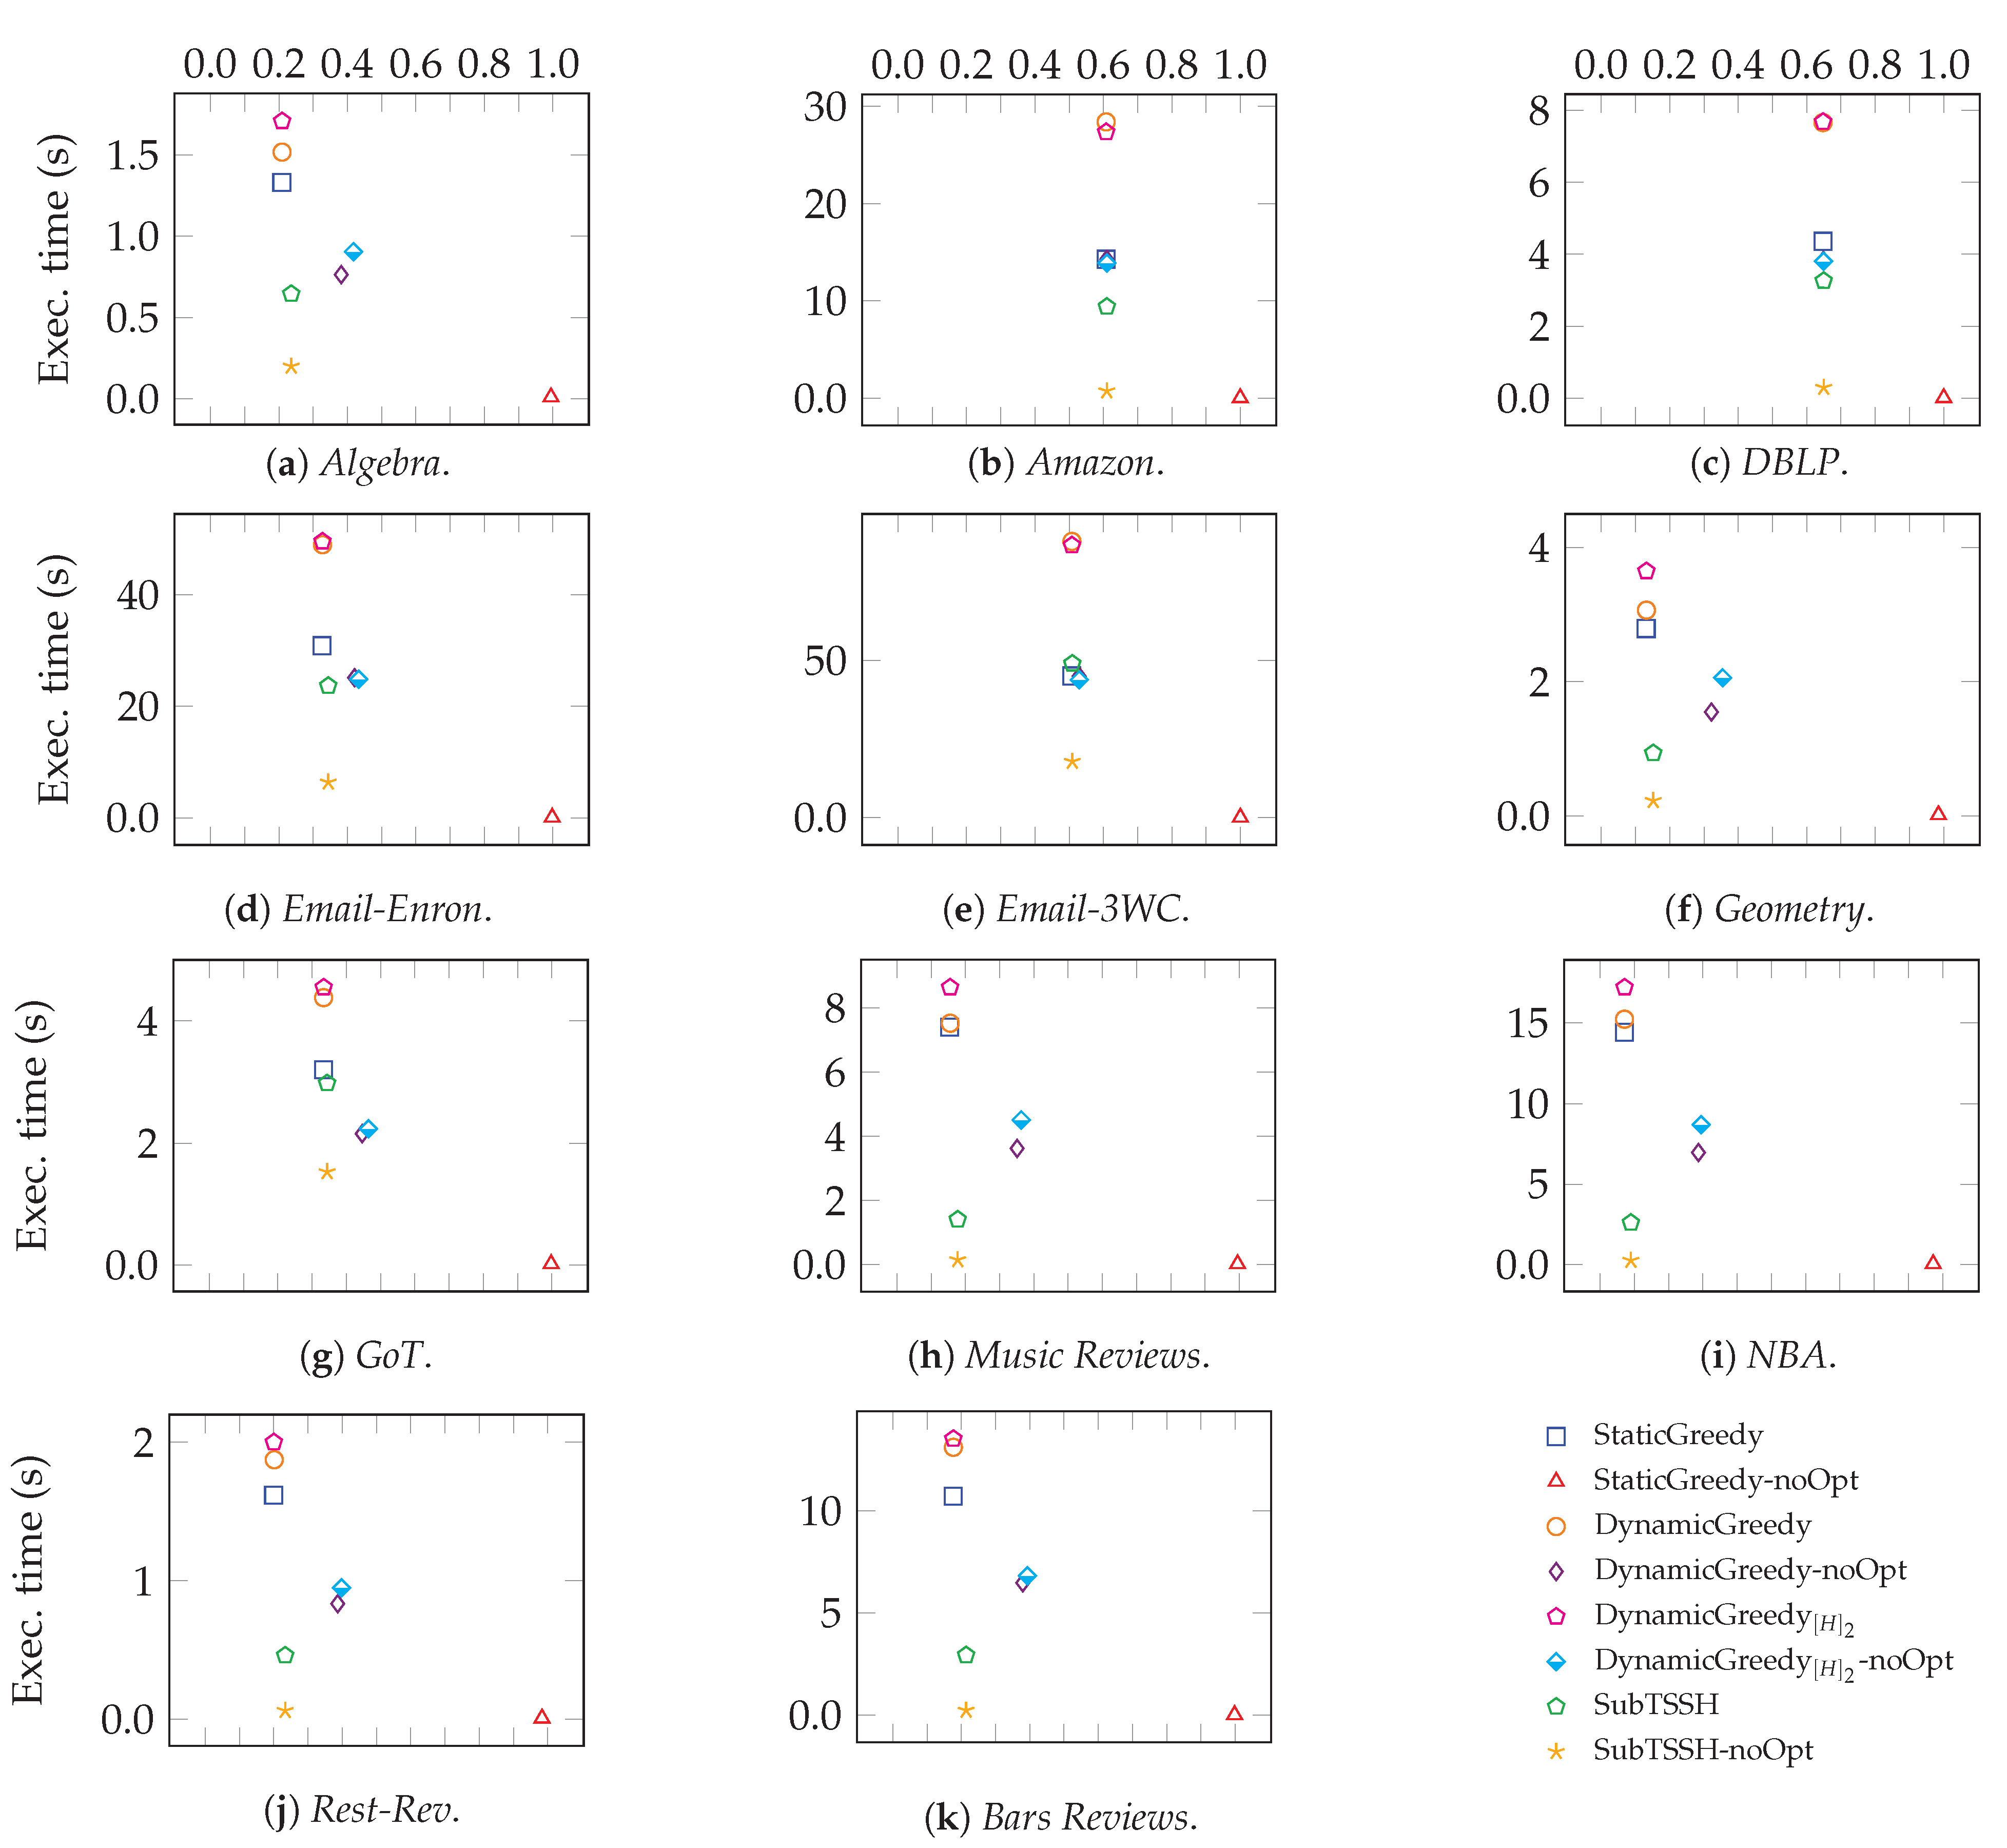
Figure 11 zooms into each data set analyzed, comparing the average completion time of each heuristic against the size of the seed set evaluated. As expected, and executed without the optimization phase need up to half of the time to complete than their corresponding optimized version. Obviously, the target set evaluated is larger. As previously discussed, the non-optimized version of confirms the outcomes in [17]: in all networks, this trivial heuristic basically selects all nodes. This result suggests that TSSH heuristics designed for real-world networks should consider both the dynamicity of the influence process and the role that hyperedges play in the whole diffusion mechanism. Further, this experiment clarifies that reaches the best trade-off between the quality of the solution and the time needed to compute it.
6. Conclusions
In this paper, we presented a generalization of the linear threshold diffusion model on hypergraphs. The proposed model notably differs from the corresponding model on graphs as it also involves the hyperedges in the diffusion process; thus, enabling the direct modeling of complex group dynamics happening in high-order networks. A challenging problem arising in this domain—known as Target Set Selection (TSS) problem—is to determine the size of the smallest subset of nodes (a seed-set) able to spread their influence in the whole network. Based on the previously defined linear threshold diffusion model on hypergraphs, we generalized the TSS problem on such structures (TSSH problem).
To address the TSSH problem, we discussed three greedy-based additive heuristics, improved with respect to the approach proposed in [17] thanks to the inclusion of an additional optimization strategy. We further proposed a subtractive procedure to provide good solutions without the need for an expensive optimization strategy. We evaluated the effectiveness of the proposed heuristics in terms of the cardinality of the solution obtained and their execution time by running extensive experiments on several real networks, varying the activation thresholds for both nodes and hyperedges. Results have shown that, although additive procedures generally provide worse results initially, they particularly benefit from the use of the optimization procedure, whose objective is to remove unnecessary nodes from the solution. This process translates into better results than the subtractive procedure (for which the optimization procedure is practically irrelevant). Results on execution times depicted a completely reversed picture. Although efficient, the optimization procedure has a negative impact on the additive approaches’ running time, thus making those heuristics more time-consuming.
Comparing the seed set size obtained on the different networks, it is possible to observe how generally the results are pretty heterogeneous and strictly depend on the networks’ characteristics, such as the density of the network or the distribution of both node degrees and hyperedge size. In general, it is not easy to foresee what will be the results of a diffusion process on such complex networks.
There are several interesting directions for future work. First, the same procedures discussed in this paper may be exploited to measure influence diffusion over groups (hyperedges) rather than over single individuals (nodes). In real-world or online social networks, groups play an essential role in understanding people’s personal behaviors. Therefore, it is critical to systematically study how the many influences the single person when final decisions depend upon groups of people. Second, motivated by the lack of extensive studies on information diffusion processes on high-order structures, another research path could be developing other diffusion models (e.g., Independent Cascade model) suitable for hypergraphs. Having several approaches to analyze influence diffusion patterns will allow using the most suitable model according to the interactions happening in the real world. Finally, another interesting line of inquiry would be studying diffusion phenomena in heterogeneous hypergraphs, where both nodes and relations may be of more than one type, thus giving birth to different diffusion processes that may influence each other.
The following abbreviations are used in this manuscript:
Author Contributions
All authors equally contributed to this work. All authors have read and agreed to the published version of the manuscript.
Funding
The research was funded by NAWA—The Polish National Agency for Academic Exchange.
Institutional Review Board Statement
Not applicable.
Informed Consent Statement
Not applicable.
Data Availability Statement
Acknowledgments
The authors thanks the anonymous reviewers for their insightful comments.
Conflicts of Interest
The authors declare no conflict of interest.
References
- Gass, R.H. Sociology of Social Influence. In International Encyclopedia of the Social & Behavioral Sciences, 2nd ed.; Wright, J.D., Ed.; Elsevier: Oxford, UK, 2015; pp. 348–354. [Google Scholar] [CrossRef]
- Chen, W.; Wang, C.; Wang, Y. Scalable Influence Maximization for Prevalent Viral Marketing in Large-Scale Social Networks. In Proceedings of the 16th ACM SIGKDD International Conference on Knowledge Discovery and Data Mining, Washington, DC, USA, 24–28 July 2010; Association for Computing Machinery: New York, NY, USA, 2010; pp. 1029–1038. [Google Scholar] [CrossRef]
- Leskovec, J.; Adamic, L.A.; Huberman, B.A. The Dynamics of Viral Marketing. ACM Trans. Web 2007, 1, 5-es. [Google Scholar] [CrossRef] [Green Version]
- Song, X.; Tseng, B.L.; Lin, C.Y.; Sun, M.T. Personalized Recommendation Driven by Information Flow. In Proceedings of the 29th Annual International ACM SIGIR Conference on Research and Development in Information Retrieval, Seattle, WA, USA, 6–11 August 2006; Association for Computing Machinery: New York, NY, USA, 2006; pp. 509–516. [Google Scholar] [CrossRef]
- Li, Y.; Zhang, D.; Tan, K.L. Real-Time Targeted Influence Maximization for Online Advertisements. VLDB Endow. 2015, 8, 1070–1081. [Google Scholar] [CrossRef] [Green Version]
- Ye, M.; Liu, X.; Lee, W.C. Exploring Social Influence for Recommendation: A Generative Model Approach. In Proceedings of the 35th International ACM SIGIR Conference on Research and Development in Information Retrieval, Portland, OR, USA, 12–16 August 2012; Association for Computing Machinery: New York, NY, USA, 2012; pp. 671–680. [Google Scholar] [CrossRef]
- Agarwal, N.; Liu, H.; Tang, L.; Yu, P.S. Identifying the Influential Bloggers in a Community. In Proceedings of the 2008 International Conference on Web Search and Data Mining, Phoenix, AZ, USA, 28 February–4 March 2020; Association for Computing Machinery: New York, NY, USA, 2008; pp. 207–218. [Google Scholar] [CrossRef] [Green Version]
- Bakshy, E.; Hofman, J.M.; Mason, W.A.; Watts, D.J. Everyone’s an Influencer: Quantifying Influence on Twitter. In Proceedings of the Fourth ACM International Conference on Web Search and Data Mining, Hong Kong, 9–12 February 2011; Association for Computing Machinery: New York, NY, USA, 2011; pp. 65–74. [Google Scholar] [CrossRef]
- Huang, X.; Chen, D.; Wang, D.; Ren, T. Identifying Influencers in Social Networks. Entropy 2020, 22, 450. [Google Scholar] [CrossRef] [PubMed]
- Wang, G.; Jiang, W.; Wu, J.; Xiong, Z. Fine-Grained Feature-Based Social Influence Evaluation in Online Social Networks. IEEE Trans. Parallel Distrib. Syst. 2014, 25, 2286–2296. [Google Scholar] [CrossRef] [Green Version]
- Sun, J.; Xu, W.; Ma, J.; Sun, J. Leverage RAF to find domain experts on research social network services: A big data analytics methodology with MapReduce framework. Int. J. Prod. Econ. 2015, 165, 185–193. [Google Scholar] [CrossRef]
- Banerjee, S.; Jenamani, M.; Pratihar, D.K. A survey on influence maximization in a social network. Knowl. Inf. Syst. 2020, 62, 3417–3455. [Google Scholar] [CrossRef] [Green Version]
- Li, Y.; Fan, J.; Wang, Y.; Tan, K. Influence Maximization on Social Graphs: A Survey. IEEE Trans. Knowl. Data Eng. 2018, 30, 1852–1872. [Google Scholar] [CrossRef]
- Battiston, F.; Cencetti, G.; Iacopini, I.; Latora, V.; Lucas, M.; Patania, A.; Young, J.G.; Petri, G. Networks beyond pairwise interactions: Structure and dynamics. Phys. Rep. 2020, 874, 1–92. [Google Scholar] [CrossRef]
- Yoon, S.; Song, H.; Shin, K.; Yi, Y. How Much and When Do We Need Higher-Order Information in Hypergraphs? A Case Study on Hyperedge Prediction. In Proceedings of the Web Conference 2020, Taipei, Taiwan, 20–24 April 2020; Association for Computing Machinery: New York, NY, USA, 2020; pp. 2627–2633. [Google Scholar] [CrossRef]
- Zhu, J.; Zhu, J.; Ghosh, J.; Wu, W.; Yuan, J. Social Influence Maximization in Hypergraph in Social Networks. IEEE Trans. Netw. Sci. Eng. 2019, 6, 801–811. [Google Scholar] [CrossRef]
- Antelmi, A.; Cordasco, G.; Spagnuolo, C.; Szufel, P. Information Diffusion in Complex Networks: A Model Based on Hypergraphs and Its Analysis. In Algorithms and Models for the Web Graph; Springer International Publishing: Cham, Switzerland, 2020; pp. 36–51. [Google Scholar] [CrossRef]
- Kempe, D.; Kleinberg, J.; Tardos, E. Maximizing the Spread of Influence through a Social Network. In Proceedings of the Ninth ACM SIGKDD International Conference on Knowledge Discovery and Data Mining, Washington, DC, USA, 24–27 August 2003; Association for Computing Machinery: New York, NY, USA, 2003; pp. 137–146. [Google Scholar] [CrossRef] [Green Version]
- Cordasco, G.; Gargano, L.; Mecchia, M.; Rescigno, A.A.; Vaccaro, U. Discovering Small Target Sets in Social Networks: A Fast and Effective Algorithm. Algorithmica 2018, 80, 1804–1833. [Google Scholar] [CrossRef] [Green Version]
- Domingos, P.; Richardson, M. Mining the Network Value of Customers. In Proceedings of the Seventh ACM SIGKDD International Conference on Knowledge Discovery and Data Mining, San Francisco, CA, USA, 26–29 August 2001; Association for Computing Machinery: New York, NY, USA, 2001; pp. 57–66. [Google Scholar] [CrossRef]
- Peng, S.; Zhou, Y.; Cao, L.; Yu, S.; Niu, J.; Jia, W. Influence analysis in social networks: A survey. J. Netw. Comput. Appl. 2018, 106, 17–32. [Google Scholar] [CrossRef]
- Ackerman, E.; Ben-Zwi, O.; Wolfovitz, G. Combinatorial model and bounds for target set selection. Theor. Comput. Sci. 2010, 411, 4017–4022. [Google Scholar] [CrossRef] [Green Version]
- Granovetter, L. Threshold models of collective behavior. Am. J. Sociol. 1978, 83, 1420–1443. [Google Scholar] [CrossRef] [Green Version]
- Schelling, T.C. Micromotives and Macrobehavior. J. Politics 1980, 42. [Google Scholar] [CrossRef]
- Chen, N. On the Approximability of Influence in Social Networks. SIAM J. Discret. Math. 2009, 23, 1400–1415. [Google Scholar] [CrossRef]
- Kim, M.; Newth, D.; Christen, P. Modeling Dynamics of Diffusion Across Heterogeneous Social Networks: News Diffusion in Social Media. Entropy 2013, 15, 4215–4242. [Google Scholar] [CrossRef] [Green Version]
- Li, W.; Bai, Q.; Zhang, M.; Nguyen, T.D. Modelling Multiple Influences Diffusion in On-Line Social Networks. In Proceedings of the 17th International Conference on Autonomous Agents and MultiAgent Systems, Stockholm, Sweden, 10–15 July 2018; International Foundation for Autonomous Agents and Multiagent Systems: Richland, SC, USA, 2018; pp. 1053–1061. [Google Scholar] [CrossRef]
- Senevirathna, C.; Gunaratne, C.; Rand, W.; Jayalath, C.; Garibay, I. Influence Cascades: Entropy-Based Characterization of Behavioral Influence Patterns in Social Media. Entropy 2021, 23, 160. [Google Scholar] [CrossRef] [PubMed]
- Goldenberg, J.; Libai, B.; Muller, E. Talk of the Network: A Complex Systems Look at the Underlying Process of Word-of-Mouth. Mark. Lett. 2001, 12, 211–223. [Google Scholar] [CrossRef]
- Zhu, J.; Ghosh, S.; Wu, W. Group Influence Maximization Problem in Social Networks. IEEE Trans. Comput. Soc. Syst. 2019, 6, 1156–1164. [Google Scholar] [CrossRef]
- Ma, T.; Guo, J. Study on information transmission model of enterprise informal organizations based on the hypernetwork. Chin. J. Phys. 2018, 56, 2424–2438. [Google Scholar] [CrossRef]
- Bretto, A. Hypergraph Theory: An Introduction; Springer International Publishing: Berlin/Heidelberg, Germany, 2013. [Google Scholar] [CrossRef]
- Chen, W.; Lakshmanan, L.V.S.; Castillo, C. Information and Influence Propagation in Social Networks; Morgan & Claypool Publishers: San Rafael, CA, USA, 2013. [Google Scholar] [CrossRef]
- Austin, R. Benson Research Data Sets. Available online: https://www.cs.cornell.edu/~arb/data/ (accessed on 18 June 2021).
- Chouder, M.L.; Rizzi, S.; Chalal, R. JSON Datasets for Exploratory OLAP; Mendeley Data; Elsevier: Amsterdam, Netherlands, 2017; Volume V1. [Google Scholar] [CrossRef]
- Jeffrey, L. Game of Thrones Datasets and Visualizations. 2019. Available online: https://github.com/jeffreylancaster/game-of-thrones (accessed on 18 June 2021).
- Spagnuolo, C.; Cordasco, G.; Szufel, P.; Pralat, P.; Scarano, V.; Kaminski, B.; Antelmi, A. Analyzing, Exploring, and Visualizing Complex Networks via Hypergraphs using SimpleHypergraphs.jl. Internet Math. 2020. [Google Scholar] [CrossRef]
- Antelmi, A.; Cordasco, G.; Spagnuolo, C.; Szufel, P. Social Influence Maximization in Hypergraphs—Julia Package (GitHub). 2021. Available online: https://github.com/pszufe/LTMSim.jl (accessed on 18 June 2021).
- Antelmi, A.; Cordasco, G.; Spagnuolo, C.; Szufel, P. Social Influence Maximization in Hypergraphs—Data Set; CERN: Meyrin, Canton of Geneva, Switzerland, 2021. [Google Scholar] [CrossRef]
- Antelmi, A.; Cordasco, G.; Kamiński, B.; Prałat, P.; Scarano, V.; Spagnuolo, C.; Szufel, P. SimpleHypergraphs.jl—Novel Software Framework for Modelling and Analysis of Hypergraphs. In Algorithms and Models for theWeb Graph; Springer: Cham, Switzerland, 2019; pp. 115–129. [Google Scholar] [CrossRef]
- Antelmi, A.; Cordasco, G.; Spagnuolo, C.; Szufel, P. Social Influence Maximization in Hypergraphs—Julia Package; CERN: Meyrin, Canton of Geneva, Switzerland, 2021. [Google Scholar] [CrossRef]
Figure 1.
(left) A hypergraph with five nodes and three hyperedges; (center) The weighted clique expansion associated with H (the edge weight, depicted on each edge, corresponds to the number of hyperedges containing both endpoints); (right) The bipartite incidence graph associated with H (the five nodes appear on the left and the three hyperedges appear on the right).

Figure 2.
An example of influence diffusion process on associated with , where and . Influenced nodes appear in gray. The arrow at the bottom of each step indicates the direction of the diffusion process: (left-to-right) nodes influence hyperedges; (right-to-left) hyperedges influence nodes.
Figure 2.
An example of influence diffusion process on associated with , where and . Influenced nodes appear in gray. The arrow at the bottom of each step indicates the direction of the diffusion process: (left-to-right) nodes influence hyperedges; (right-to-left) hyperedges influence nodes.

Figure 3.
Scenario 1—Ratio of the seed set size over the total number of nodes n per hypergraph, fixing each node (hyperedge) threshold to a random value between 1 and its degree (size).
Figure 3.
Scenario 1—Ratio of the seed set size over the total number of nodes n per hypergraph, fixing each node (hyperedge) threshold to a random value between 1 and its degree (size).

Figure 4.
Scenario 1—Ratio of the seed set size over the total number of nodes n per hypergraph, fixing each node (hyperedge) threshold to a random value between 1 and its degree (size). The acronyms DG and stand for DynamicGreedy and , respectively. Each plot compares the seed set size obtained by running each heuristic with (left—orange) and without (right—green) optimization procedure.

Figure 5.
Scenario 2 — Ratio of the seed set size over the total number of nodes n per hypergraph, fixing each node threshold to a random value between 1 and its degree and using a majority policy for hyperedge thresholds.
Figure 5.
Scenario 2 — Ratio of the seed set size over the total number of nodes n per hypergraph, fixing each node threshold to a random value between 1 and its degree and using a majority policy for hyperedge thresholds.

Figure 6.
Scenario 2 — Ratio of the seed set size over the total number of nodes n per hypergraph, fixing each node threshold to a random value between 1 and its degree and using a majority policy for hyperedge thresholds. The acronyms DG and stand for DynamicGreedy and , respectively. Each plot compares the seed set size obtained by running each heuristic with (left—orange) and without (right—green) optimization procedure.


Figure 7.
Scenario 3 — Ratio of the seed set size over the total number of nodes n per hypergraph, varying each node threshold proportionally - from to - to its degree, and fixing each hyperedge threshold to a random value between 1 and its size.
Figure 7.
Scenario 3 — Ratio of the seed set size over the total number of nodes n per hypergraph, varying each node threshold proportionally - from to - to its degree, and fixing each hyperedge threshold to a random value between 1 and its size.

Figure 8.
Scenario 4—Ratio of the seed set size over the total number of nodes n per hypergraph, varying each node threshold proportionally—from to —to its degree, and using a majority policy for hyperedge thresholds.
Figure 8.
Scenario 4—Ratio of the seed set size over the total number of nodes n per hypergraph, varying each node threshold proportionally—from to —to its degree, and using a majority policy for hyperedge thresholds.

Figure 9.
Distribution of the time (in seconds) required for each heuristic to complete.

Figure 10.
Distribution of the time (in seconds) required for each heuristic to complete the task against the size of the network ().
Figure 10.
Distribution of the time (in seconds) required for each heuristic to complete the task against the size of the network ().

Figure 11.
Average execution time vs seed set size.


Table 1.
Benchmark hypergraphs details (1).
| Algebra | Amazon | DBLP | Email-Enron | Email-W3C | Geometry | |
|---|---|---|---|---|---|---|
| 423 | 4989 | 2727 | 2807 | 5601 | 580 | |
| 1268 | 1176 | 874 | 5000 | 6000 | 1193 | |
| 50,209 | 11,590 | 4298 | 88,926 | 11,130 | 205,127 | |
| Source | [34] | [34] | [35] | [34] | [34] | [34] |
Table 2.
Benchmark hypergraphs details (2).
| GoT | Music-Rev | NBA | Restaurants-Rev | Bars-Rev | |
|---|---|---|---|---|---|
| 577 | 1106 | 567 | 565 | 1234 | |
| 3840 | 694 | 2163 | 601 | 1194 | |
| 23,083 | 149,288 | 456,251 | 31,241 | 167,000 | |
| Source | [36] | [34] | [35] | [34] | [34] |
Table 3.
Threshold settings in the four experimental scenarios.
| Node Thresholds | Hyperedge Thresholds | |||
|---|---|---|---|---|
| Random | Proportional | Random | Majority Policy | |
| Scenario 1 | * | * | ||
| Scenario 2 | * | * | ||
| Scenario 3 | * | * | ||
| Scenario 4 | * | * | ||
Publisher’s Note: MDPI stays neutral with regard to jurisdictional claims in published maps and institutional affiliations. |
© 2021 by the authors. Licensee MDPI, Basel, Switzerland. This article is an open access article distributed under the terms and conditions of the Creative Commons Attribution (CC BY) license (https://creativecommons.org/licenses/by/4.0/).
Share and Cite
MDPI and ACS Style
Antelmi, A.; Cordasco, G.; Spagnuolo, C.; Szufel, P. Social Influence Maximization in Hypergraphs. Entropy 2021, 23, 796. https://doi.org/10.3390/e23070796
AMA Style
Antelmi A, Cordasco G, Spagnuolo C, Szufel P. Social Influence Maximization in Hypergraphs. Entropy. 2021; 23(7):796. https://doi.org/10.3390/e23070796
Chicago/Turabian StyleAntelmi, Alessia, Gennaro Cordasco, Carmine Spagnuolo, and Przemysław Szufel. 2021. "Social Influence Maximization in Hypergraphs" Entropy 23, no. 7: 796. https://doi.org/10.3390/e23070796
Note that from the first issue of 2016, this journal uses article numbers instead of page numbers. See further details here.