Information Dynamics of the Brain, Cardiovascular and Respiratory Network during Different Levels of Mental Stress

 ,
,  ,
, 
 , , and
Abstract
:1. Introduction
2. Information Decomposition
3. Materials and Methods
3.1. Hardware Configuration
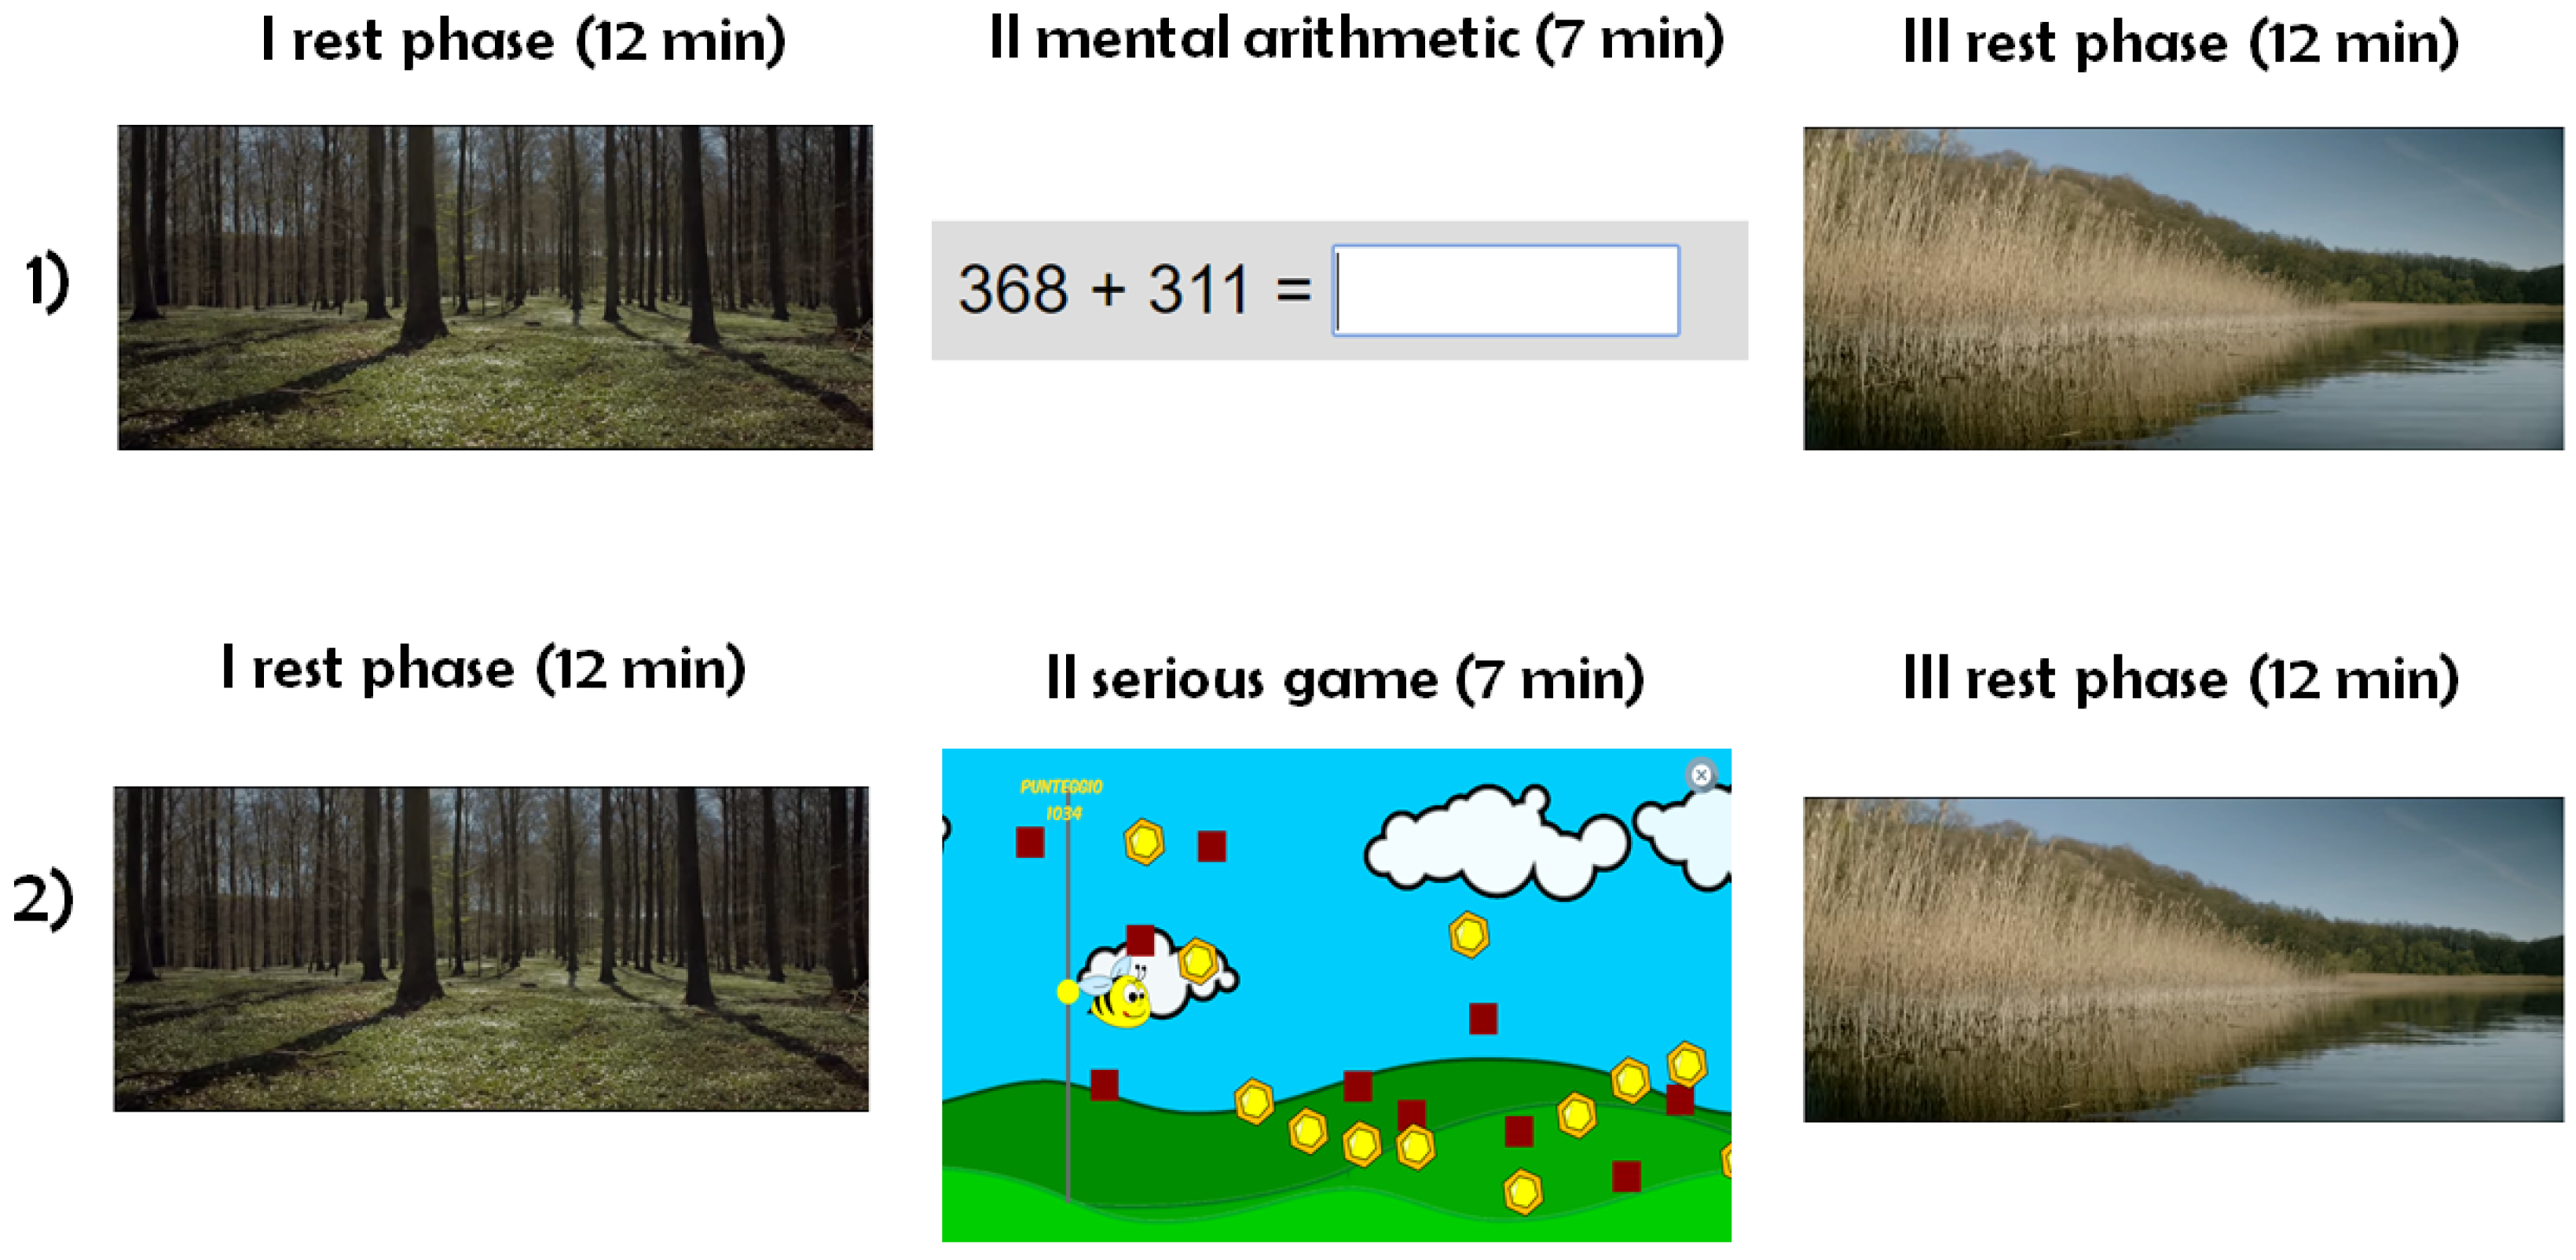
3.2. Data Acquisition
- rest (12 );
- mental arithmetic/serious game (7 );
- recovery (12 ).
3.3. Data Pre-Processing and Analysis
3.4. Statistical Analysis
4. Results
5. Discussion
5.1. Information Produced and Stored in the Nodes of the Human Physiological Network
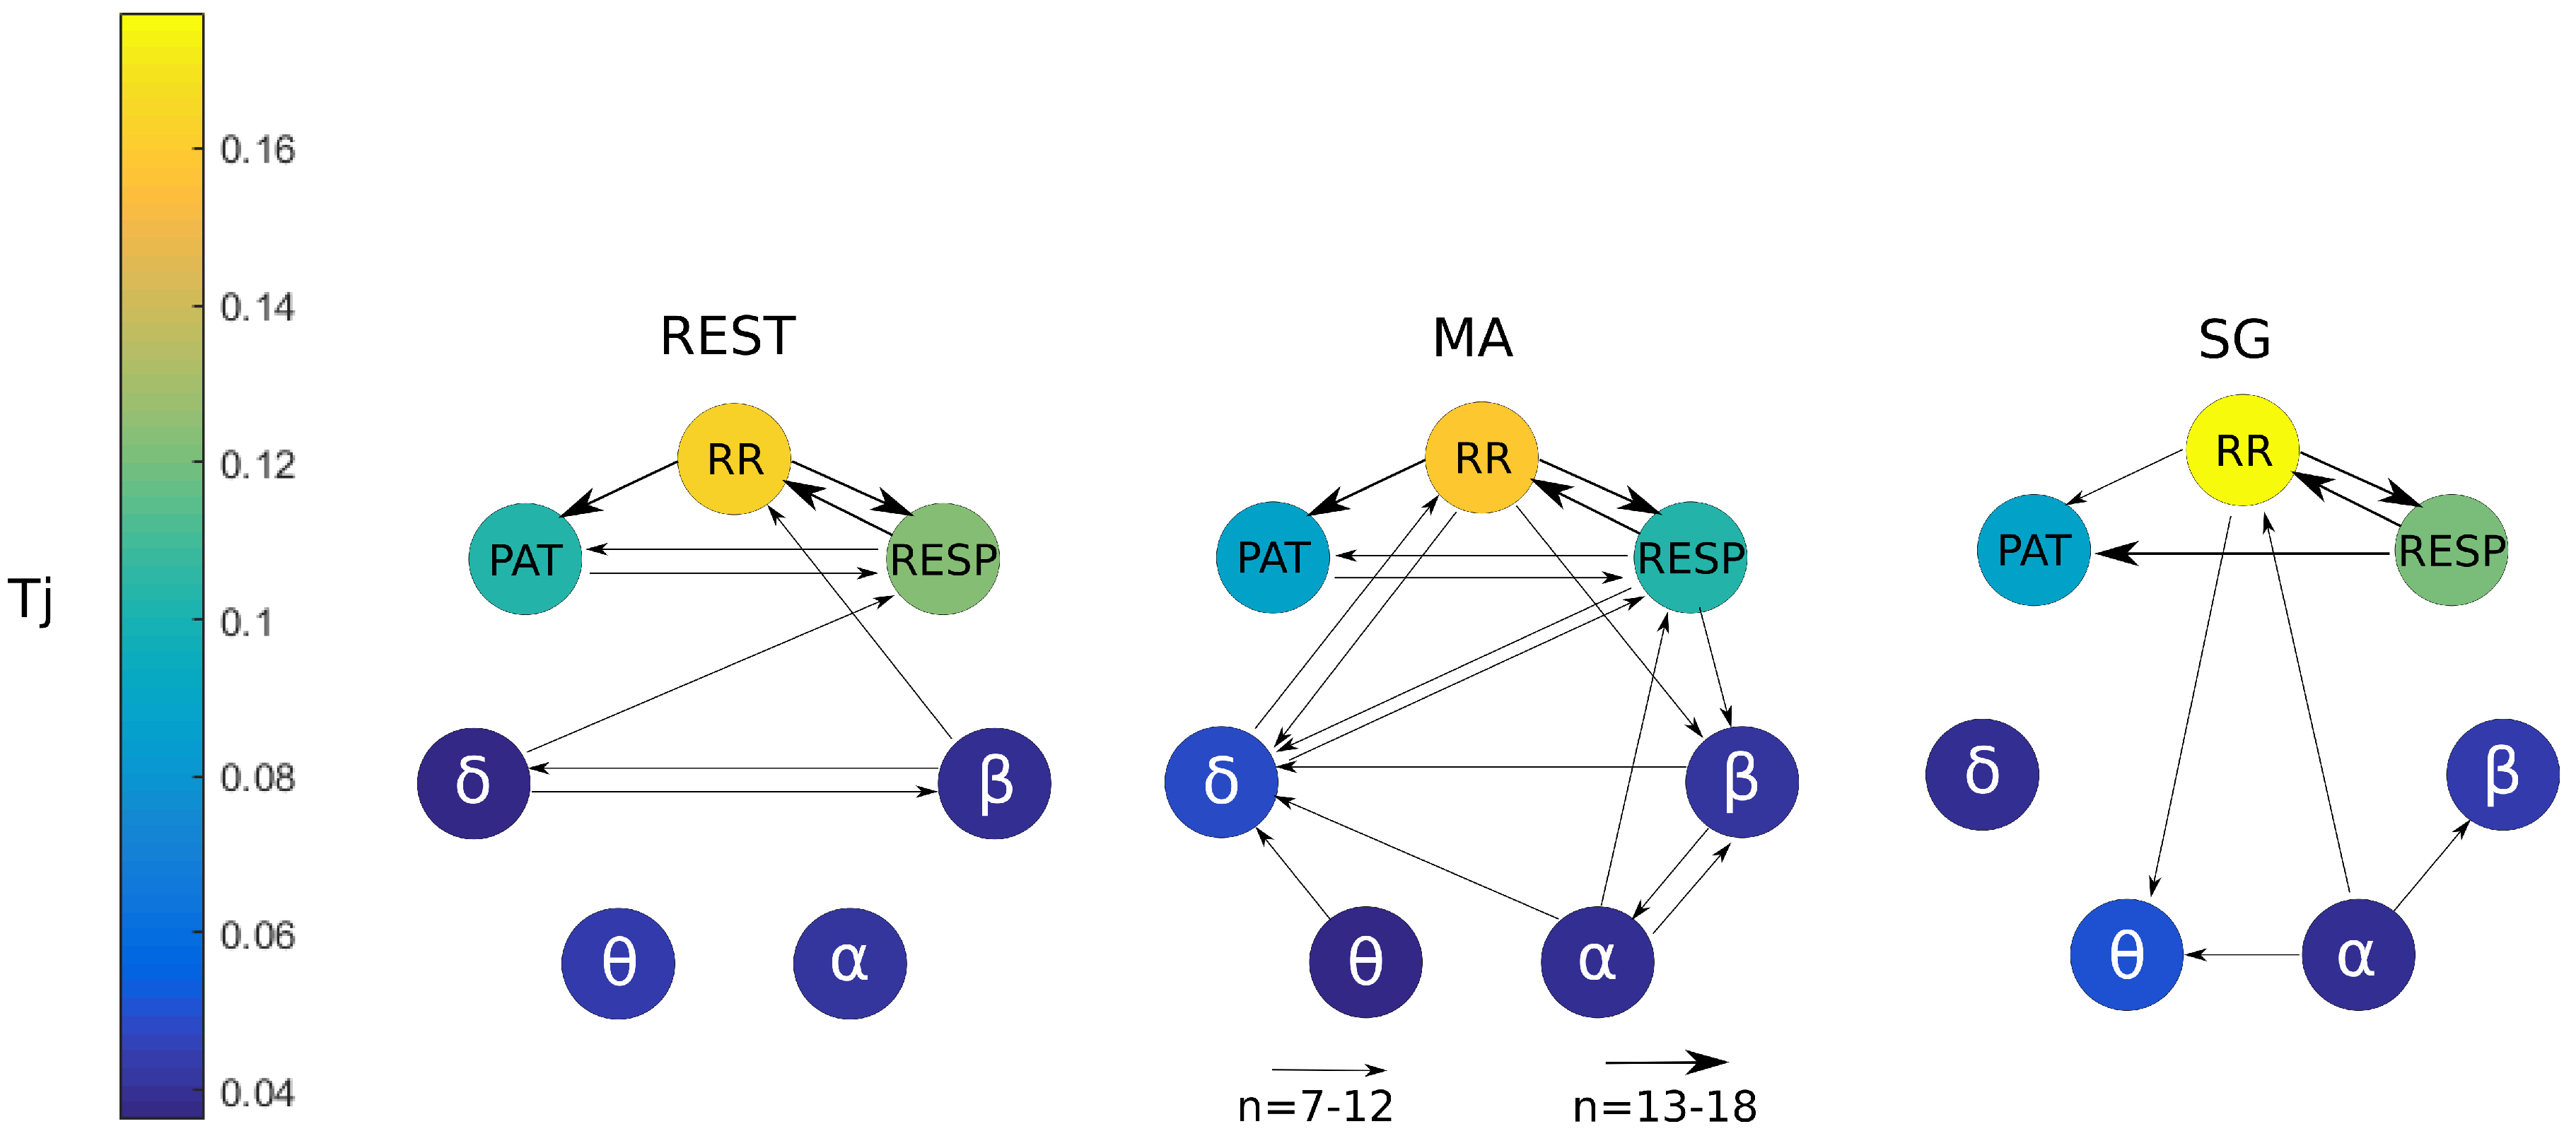
5.2. Information Transfer across the Nodes of the Human Physiological Network
6. Conclusions
Author Contributions
Funding
Conflicts of Interest
References
- Chrousos, G.P. Stress and disorders of the stress system. Nat. Rev. Endocrinol. 2009, 5, 374. [Google Scholar] [CrossRef] [PubMed]
- Kleiger, R.E.; Stein, P.K.; Bigger, J.T., Jr. Heart rate variability: Measurement and clinical utility. Ann. Noninvasive Electrocardiol. 2005, 10, 88–101. [Google Scholar] [CrossRef] [PubMed]
- Vlemincx, E.; Van Diest, I.; Van den Bergh, O. A sigh following sustained attention and mental stress: Effects on respiratory variability. Physiol. Behav. 2012, 107, 1–6. [Google Scholar] [CrossRef]
- Dressler, O.; Schneider, G.; Stockmanns, G.; Kochs, E. Awareness and the EEG power spectrum: Analysis of frequencies. Br. J. Anaesthesia 2004, 93, 806–809. [Google Scholar] [CrossRef] [PubMed]
- Erla, S.; Faes, L.; Tranquillini, E.; Orrico, D.; Nollo, G. k-Nearest neighbour local linear prediction of scalp EEG activity during intermittent photic stimulation. Med. Eng. Phys. 2011, 33, 504–512. [Google Scholar] [CrossRef] [PubMed]
- Wijsman, J.; Grundlehner, B.; Penders, J.; Hermens, H. Trapezius muscle EMG as predictor of mental stress. In Wireless Health 2010; ACM: New York, NY, USA, 2010; pp. 155–163. [Google Scholar]
- Horwitz, B. The elusive concept of brain connectivity. Neuroimage 2003, 19, 466–470. [Google Scholar] [CrossRef] [Green Version]
- Pandit, S.V.; Jalife, J. Rotors and the dynamics of cardiac fibrillation. Circul. Res. 2013, 112, 849–862. [Google Scholar] [CrossRef]
- Schulz, S.; Adochiei, F.C.; Edu, I.R.; Schroeder, R.; Costin, H.; Bär, K.J.; Voss, A. Cardiovascular and cardiorespiratory coupling analyses: A review. Philos. Trans. R. Soc. A 2013, 371, 20120191. [Google Scholar] [CrossRef] [PubMed]
- Marín-Morales, J.; Higuera-Trujillo, J.L.; Greco, A.; Guixeres, J.; Llinares, C.; Scilingo, E.P.; Alcañiz, M.; Valenza, G. Affective computing in virtual reality: Emotion recognition from brain and heartbeat dynamics using wearable sensors. Sci. Rep. 2018, 8, 13657. [Google Scholar] [CrossRef] [PubMed]
- Valenza, G.; Lanata, A.; Scilingo, E.P. The role of nonlinear dynamics in affective valence and arousal recognition. IEEE Trans. Affect. Comput. 2012, 3, 237–249. [Google Scholar] [CrossRef]
- Huysmans, D.; Smets, E.; De Raedt, W.; Van Hoof, C.; Bogaerts, K.; Van Diest, I.; Helic, D. Unsupervised Learning for Mental Stress Detection-Exploration of Self-Organizing Maps; SciTePress: Setúbal, Portugal, 2018. [Google Scholar]
- Smets, E.; Casale, P.; Großekathöfer, U.; Lamichhane, B.; De Raedt, W.; Bogaerts, K.; Van Diest, I.; Van Hoof, C. Comparison of machine learning techniques for psychophysiological stress detection. In Proceedings of the International Symposium on Pervasive Computing Paradigms for Mental Health; Springer: Cham, Switzerland, 2015; pp. 13–22. [Google Scholar]
- Sandulescu, V.; Andrews, S.; Ellis, D.; Bellotto, N.; Mozos, O.M. Stress detection using wearable physiological sensors. In Proceedings of the International Work-Conference on the Interplay between Natural and Artificial Computation; Springer: Cham, Switzerland, 2015; pp. 526–532. [Google Scholar]
- Bashan, A.; Bartsch, R.P.; Kantelhardt, J.W.; Havlin, S.; Ivanov, P.C. Network physiology reveals relations between network topology and physiological function. Nat. Commun. 2012, 3, 702. [Google Scholar] [CrossRef] [PubMed] [Green Version]
- Bartsch, R.P.; Liu, K.K.; Bashan, A.; Ivanov, P.C. Network physiology: How organ systems dynamically interact. PLoS ONE 2015, 10, e0142143. [Google Scholar] [CrossRef] [PubMed]
- Faes, L.; Nollo, G.; Porta, A. Information decomposition: A tool to dissect cardiovascular and cardiorespiratory complexity. In Complexity and Nonlinearity in Cardiovascular Signals; Springer: Cham, Switzerland, 2017; pp. 87–113. [Google Scholar]
- Faes, L.; Porta, A.; Nollo, G.; Javorka, M. Information decomposition in multivariate systems: Definitions, implementation and application to cardiovascular networks. Entropy 2016, 19, 5. [Google Scholar] [CrossRef]
- Faes, L.; Nollo, G.; Jurysta, F.; Marinazzo, D. Information dynamics of brain–heart physiological networks during sleep. New J. Phys. 2014, 16, 105005. [Google Scholar] [CrossRef] [Green Version]
- Faes, L.; Marinazzo, D.; Jurysta, F.; Nollo, G. Linear and non-linear brain–heart and brain–brain interactions during sleep. Physiol. Meas. 2015, 36, 683. [Google Scholar] [CrossRef] [PubMed]
- Valenza, G.; Toschi, N.; Barbieri, R. Uncovering brain–heart information through advanced signal and image processing. Philos. Trans. Ser. A Math. Phys. Eng. Sci. 2016, 374. [Google Scholar] [CrossRef]
- Valente, M.; Javorka, M.; Turianikova, Z.; Czippelova, B.; Krohova, J.; Nollo, G.; Faes, L. Cardiovascular and respiratory variability during orthostatic and mental stress: A comparison of entropy estimators. In Proceedings of the 2017 39th Annual International Conference of the IEEE Engineering in Medicine and Biology Society (EMBC), Seogwipo, Korea, 11–15 July 2017; pp. 3481–3484. [Google Scholar]
- Pisoni, T.; Conci, N.; De Natale, F.G.; De Cecco, M.; Nollo, G.; Frattari, A.; Guandalini, G.M. AUSILIA: Assisted unit for simulating independent living activities. In Proceedings of the 2016 IEEE International Smart Cities Conference (ISC2), Trento, Italy, 12–15 September 2016; pp. 1–4. [Google Scholar]
- Reibel, D.K.; Greeson, J.M.; Brainard, G.C.; Rosenzweig, S. Mindfulness-based stress reduction and health-related quality of life in a heterogeneous patient population. Gen. Hosp. Psychiatry 2001, 23, 183–192. [Google Scholar] [CrossRef] [Green Version]
- Widjaja, D.; Montalto, A.; Vlemincx, E.; Marinazzo, D.; Van Huffel, S.; Faes, L. Cardiorespiratory information dynamics during mental arithmetic and sustained attention. PLoS ONE 2015, 10, e0129112. [Google Scholar] [CrossRef] [PubMed]
- Valente, M.; Javorka, M.; Porta, A.; Bari, V.; Krohova, J.; Czippelova, B.; Turianikova, Z.; Nollo, G.; Faes, L. Univariate and multivariate conditional entropy measures for the characterization of short-term cardiovascular complexity under physiological stress. Physiol. Meas. 2018, 39, 014002. [Google Scholar] [CrossRef] [Green Version]
- Faes, L.; Porta, A.; Nollo, G. Information decomposition in bivariate systems: Theory and application to cardiorespiratory dynamics. Entropy 2015, 17, 277–303. [Google Scholar] [CrossRef]
- Cover, T.M.; Thomas, J.A. Elements of Information Theory; John Wiley & Sons: Hoboken, NJ, USA, 2012. [Google Scholar]
- Barnett, L.; Barrett, A.B.; Seth, A.K. Granger causality and transfer entropy are equivalent for Gaussian variables. Phys. Rev. Lett. 2009, 103, 238701. [Google Scholar] [CrossRef] [PubMed]
- Barnett, L.; Seth, A.K. Granger causality for state-space models. Phys. Rev. E 2015, 91, 040101. [Google Scholar] [CrossRef] [PubMed]
- Faes, L.; Marinazzo, D.; Stramaglia, S. Multiscale information decomposition: Exact computation for multivariate Gaussian processes. Entropy 2017, 19, 408. [Google Scholar] [CrossRef]
- Smartex System Description. Available online: http://www.smartex.it/en/our-products/232-wearable-wellness-system-wws (accessed on 30 January 2019).
- Vlemincx, E.; Taelman, J.; De Peuter, S.; Van Diest, I.; Van Den Bergh, O. Sigh rate and respiratory variability during mental load and sustained attention. Psychophysiology 2011, 48, 117–120. [Google Scholar] [CrossRef] [PubMed]
- Zanetti, M.; Faes, L.; De Cecco, M.; Fornaser, A.; Valente, M.; Guandalini, G.; Nollo, G. Assessment of Mental Stress Through the Analysis of Physiological Signals Acquired From Wearable Devices. In Italian Forum of Ambient Assisted Living; Springer: Cham, Switzerland, 2018; pp. 243–256. [Google Scholar]
- Speranza, G.; Nollo, G.; Ravelli, F.; Antolini, R. Beat-to-beat measurement and analysis of the RT interval in 24 h ECG Holter recordings. Med. Biol. Eng. Comput. 1993, 31, 487–494. [Google Scholar] [CrossRef]
- Oweis, R.J.; Al-Tabbaa, B.O. QRS detection and heart rate variability analysis: A survey. Biomed. Sci. Eng. 2014, 2, 13–34. [Google Scholar]
- Dobbs, S.E.; Schmitt, N.M.; Ozemek, H.S. QRS detection by template matching using real-time correlation on a microcomputer. J. Clin. Eng. 1984, 9, 197–212. [Google Scholar] [CrossRef]
- Ye, S.y.; Kim, G.R.; Jung, D.K.; Baik, S.; Jeon, G. Estimation of systolic and diastolic pressure using the pulse transit time. World Acad. Sci. Eng. Technol. 2010, 67, 726–731. [Google Scholar]
- Masè, M.; Mattei, W.; Cucino, R.; Faes, L.; Nollo, G. Feasibility of cuff-free measurement of systolic and diastolic arterial blood pressure. J. Electrocardiol. 2011, 44, 201–207. [Google Scholar] [CrossRef] [PubMed]
- Orini, M.; Citi, L.; Barbieri, R. Bivariate point process modeling and joint non-stationary analysis of pulse transit time and heart period. In Proceedings of the 2012 Annual International Conference of the IEEE Engineering in Medicine and Biology Society (EMBC), San Diego, CA, USA, 28 August–1 September 2012; pp. 2831–2834. [Google Scholar]
- Giannakakis, G.; Grigoriadis, D.; Tsiknakis, M. Detection of stress/anxiety state from EEG features during video watching. In Proceedings of the 2015 37th Annual International Conference of the IEEE Engineering in Medicine and Biology Society (EMBC), Milano, Italy, 25–29 August 2015; pp. 6034–6037. [Google Scholar]
- Merino Monge, M.; Gómez González, I.M.; Molina Cantero, A.J. EEG feature variations under stress situations. In Proceedings of the EMBC 2015 37th Annual International Conference of the IEEE Engineering in Medicine and Biology Society, Milano, Italy, 25–29 August 2015; pp. 6700–6703. [Google Scholar]
- Saeed, S.M.U.; Anwar, S.M.; Majid, M.; Bhatti, A.M. Psychological stress measurement using low cost single channel EEG headset. In Proceedings of the 2015 IEEE International Symposium on Signal Processing and Information Technology (ISSPIT), Abu Dhabi, UAE, 7–10 December 2015; pp. 581–585. [Google Scholar]
- Porta, A.; D’Addio, G.; Guzzetti, S.; Lucini, D.; Pagani, M. Testing the presence of non stationarities in short heart rate variability series. In Proceedings of the Computers in Cardiology, Chicago, IL, USA, 19–22 September 2004; pp. 645–648. [Google Scholar]
- Ljung, L. System Identification: Theory for the User; Prentice-Hall: Upper Saddle River, NJ, USA, 1987. [Google Scholar]
- Visnovcova, Z.; Mestanik, M.; Javorka, M.; Mokra, D.; Gala, M.; Jurko, A.; Calkovska, A.; Tonhajzerova, I. Complexity and time asymmetry of heart rate variability are altered in acute mental stress. Physiol. Meas. 2014, 35, 1319. [Google Scholar] [CrossRef]
- Castaldo, R.; Melillo, P.; Bracale, U.; Caserta, M.; Triassi, M.; Pecchia, L. Acute mental stress assessment via short term HRV analysis in healthy adults: A systematic review with meta-analysis. Biomed. Signal Process. Control 2015, 18, 370–377. [Google Scholar] [CrossRef] [Green Version]
- De Morree, H.; Szabó, B.; Rutten, G.J.; Kop, W. Central nervous system involvement in the autonomic responses to psychological distress. Netherlands Heart J. 2013, 21, 64–69. [Google Scholar] [CrossRef]
- Berntson, G.G.; Cacioppo, J.T.; Quigley, K.S. Respiratory sinus arrhythmia: Autonomic origins, physiological mechanisms, and psychophysiological implications. Psychophysiology 1993, 30, 183–196. [Google Scholar] [CrossRef] [PubMed]
- Schäfer, C.; Rosenblum, M.G.; Kurths, J.; Abel, H.H. Heartbeat synchronized with ventilation. Nature 1998, 392, 239. [Google Scholar] [CrossRef] [PubMed]
- Sarnoff, S.J. Myocardial contractility as described by ventricular function curves; observations on Starling’s law of the heart. Physiol. Rev. 1955, 35, 107–122. [Google Scholar] [CrossRef] [PubMed]
- Drinnan, M.J.; Allen, J.; Murray, A. Relation between heart rate and pulse transit time during paced respiration. Physiol. Meas. 2001, 22, 425. [Google Scholar] [CrossRef] [PubMed]
- Seo, S.H.; Lee, J.T. Stress and EEG. In Convergence and Hybrid Information Technologies; InTech: London, UK, 2010. [Google Scholar]
- Subhani, A.R.; Malik, A.S.; Kamil, N.; Saad, M.N.M. Difference in brain dynamics during arithmetic task performed in stress and control conditions. In Proceedings of the 2016 IEEE EMBS Conference on Biomedical Engineering and Sciences (IECBES), Kuala Lumpur, Malaysia, 4–8 December 2016; pp. 695–698. [Google Scholar]
- Singh, M.; Narang, M. Changes in Brain wave rhythms during tasks involving Attention and Working memory. Int. J. Inf. Technol. Knowl. Manag. 2014, 7, 71–97. [Google Scholar]
- Nunez, P.L.; Srinivasan, R. Electric Fields of the Brain: The Neurophysics of EEG; Oxford University Press: New York, NY, USA, 2006. [Google Scholar]
- Fernández, T.; Harmony, T.; Rodríguez, M.; Bernal, J.; Silva, J.; Reyes, A.; Marosi, E. EEG activation patterns during the performance of tasks involving different components of mental calculation. Electroencephalogr. Clin. Neurophys. 1995, 94, 175–182. [Google Scholar] [CrossRef]
- Ako, M.; Kawara, T.; Uchida, S.; Miyazaki, S.; Nishihara, K.; Mukai, J.; Hirao, K.; Ako, J.; Okubo, Y. Correlation between electroencephalography and heart rate variability during sleep. Psychiatry Clin. Neurosci. 2003, 57, 59–65. [Google Scholar] [CrossRef] [PubMed] [Green Version]
- Brandenberger, G.; Ehrhart, J.; Piquard, F.; Simon, C. Inverse coupling between ultradian oscillations in delta wave activity and heart rate variability during sleep. Clin. Neurophysiol. 2001, 112, 992–996. [Google Scholar] [CrossRef]
- Kuo, T.B.; Chen, C.Y.; Hsu, Y.C.; Yang, C.C. EEG beta power and heart rate variability describe the association between cortical and autonomic arousals across sleep. Autonom. Neurosci. 2016, 194, 32–37. [Google Scholar] [CrossRef] [PubMed]
- Behzadnia, A.; Ghoshuni, M.; Chermahini, S. EEG Activities and the Sustained Attention Performance. Neurophysiology 2017, 49, 226–233. [Google Scholar] [CrossRef]
- Kubota, Y.; Sato, W.; Toichi, M.; Murai, T.; Okada, T.; Hayashi, A.; Sengoku, A. Frontal midline theta rhythm is correlated with cardiac autonomic activities during the performance of an attention demanding meditation procedure. Cogn. Brain Res. 2001, 11, 281–287. [Google Scholar] [CrossRef]
- Faes, L.; Nollo, G. Extended causal modeling to assess Partial Directed Coherence in multiple time series with significant instantaneous interactions. Biol. Cybern. 2010, 103, 387–400. [Google Scholar] [CrossRef] [PubMed]
- Faes, L.; Erla, S.; Porta, A.; Nollo, G. A framework for assessing frequency domain causality in physiological time series with instantaneous effects. Philos. Trans. R. Soc. A Math. Phys. Eng. Sci. 2013, 371, 20110618. [Google Scholar] [CrossRef]
- Schiatti, L.; Nollo, G.; Rossato, G.; Faes, L. Extended Granger causality: A new tool to identify the structure of physiological networks. Physiol. Meas. 2015, 36, 827. [Google Scholar] [CrossRef]


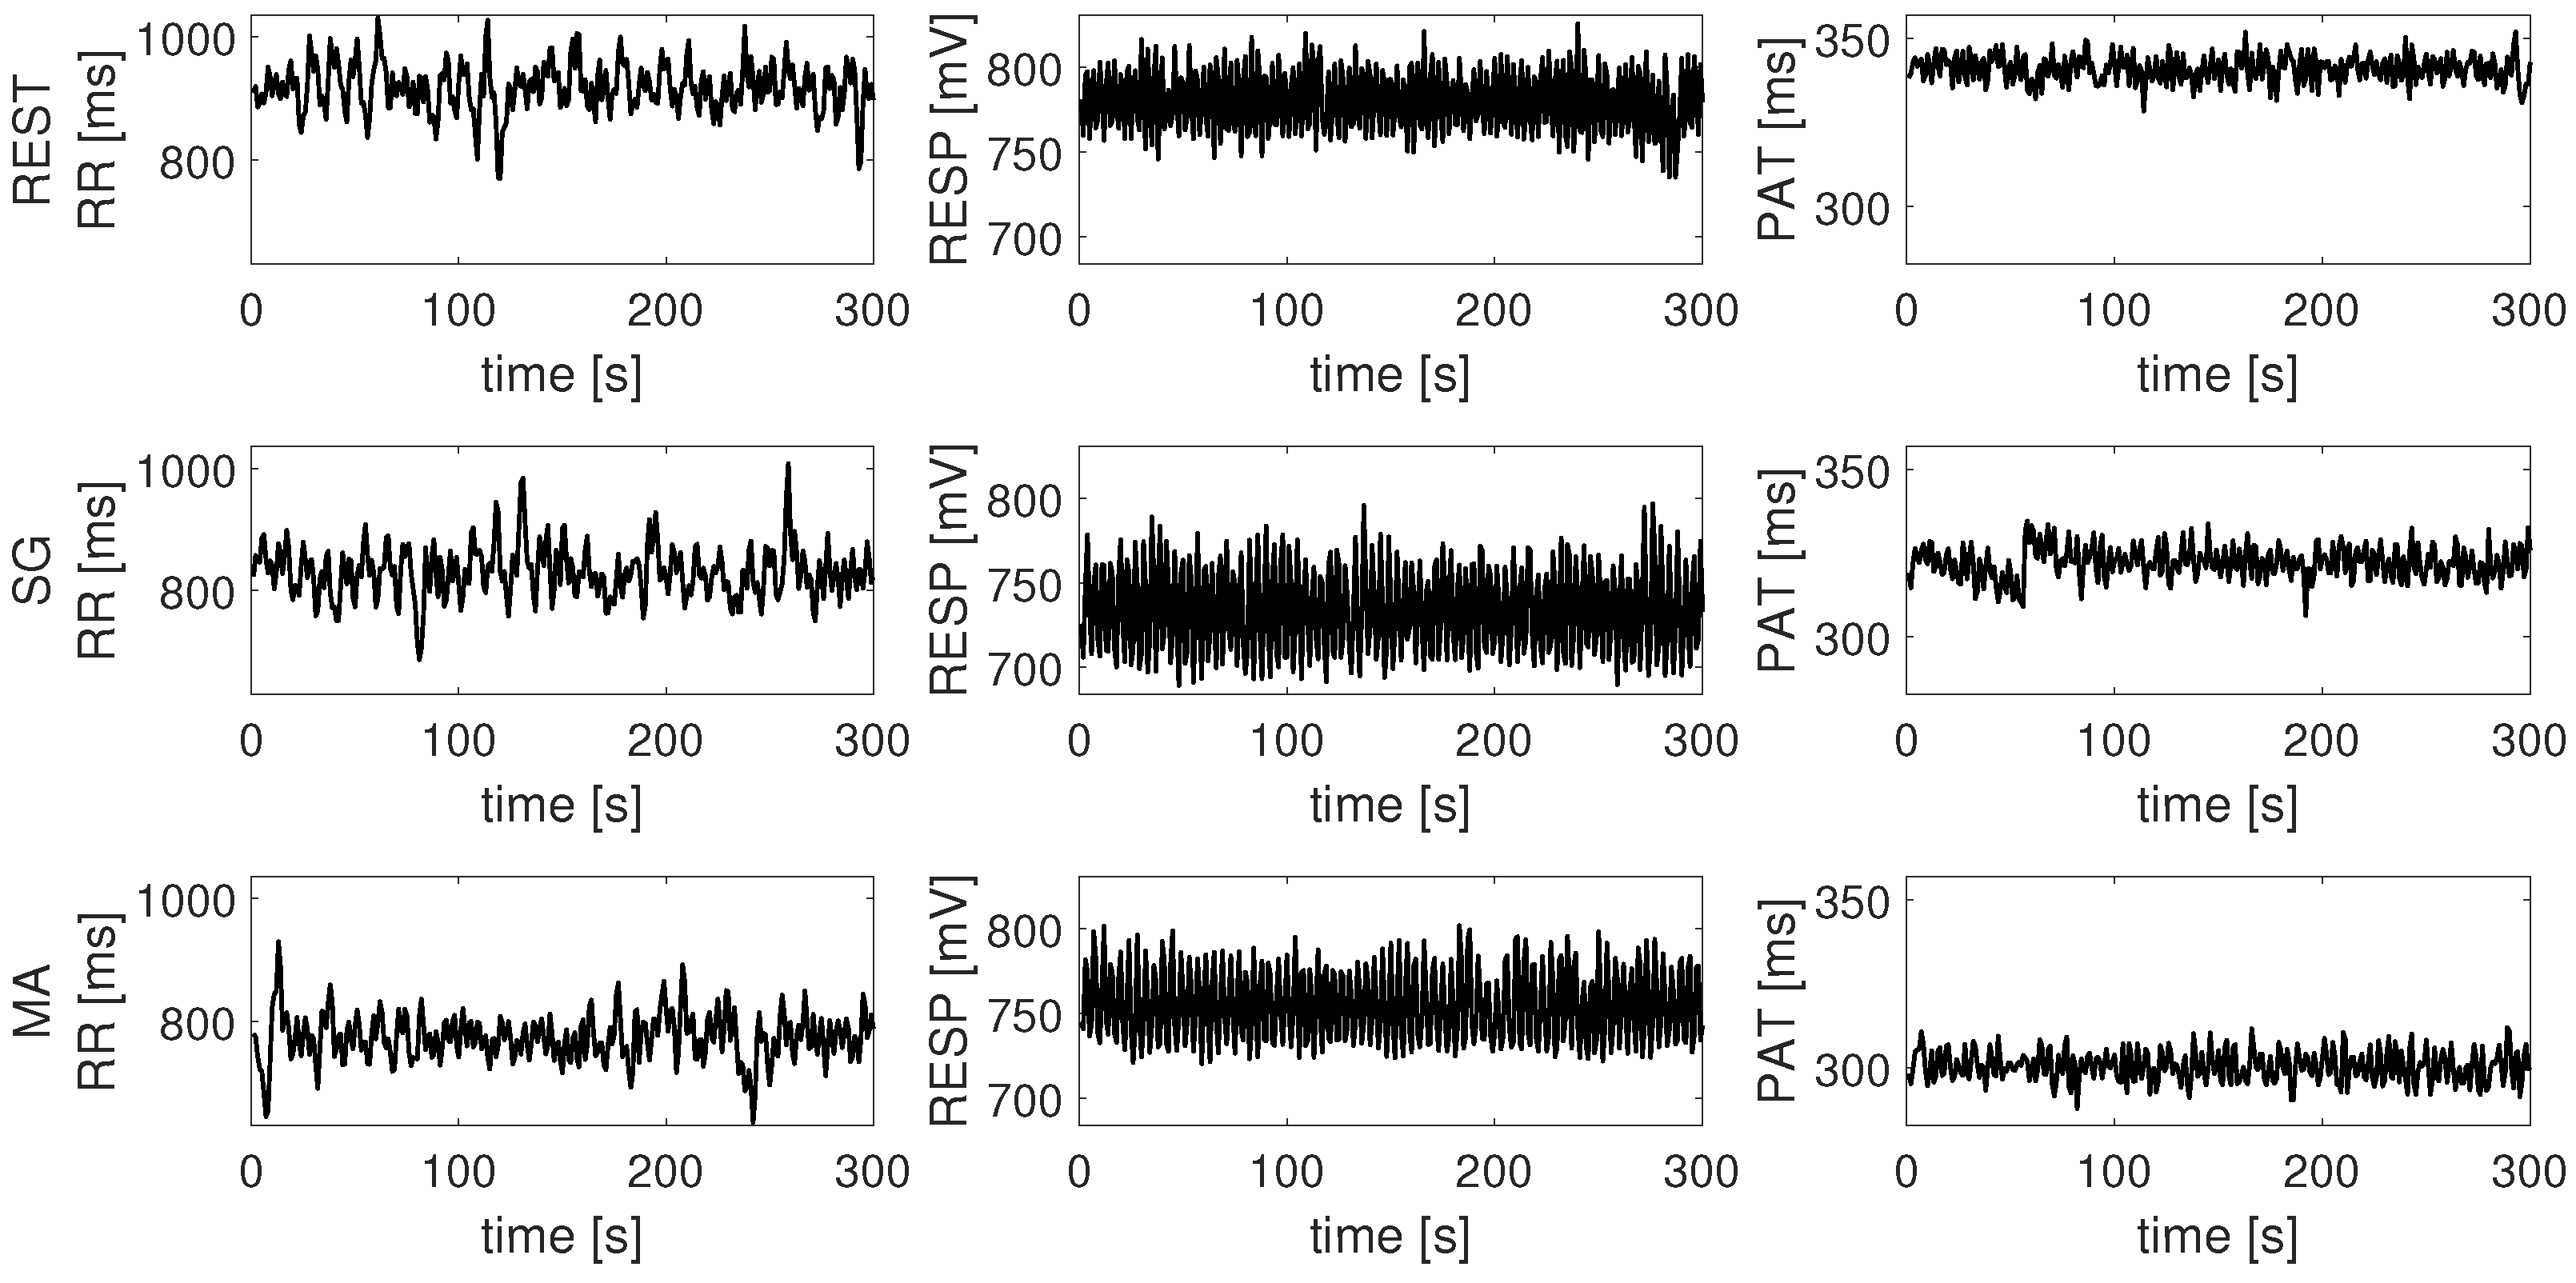
| Time Series | Information Dynamic Indices |
|---|---|
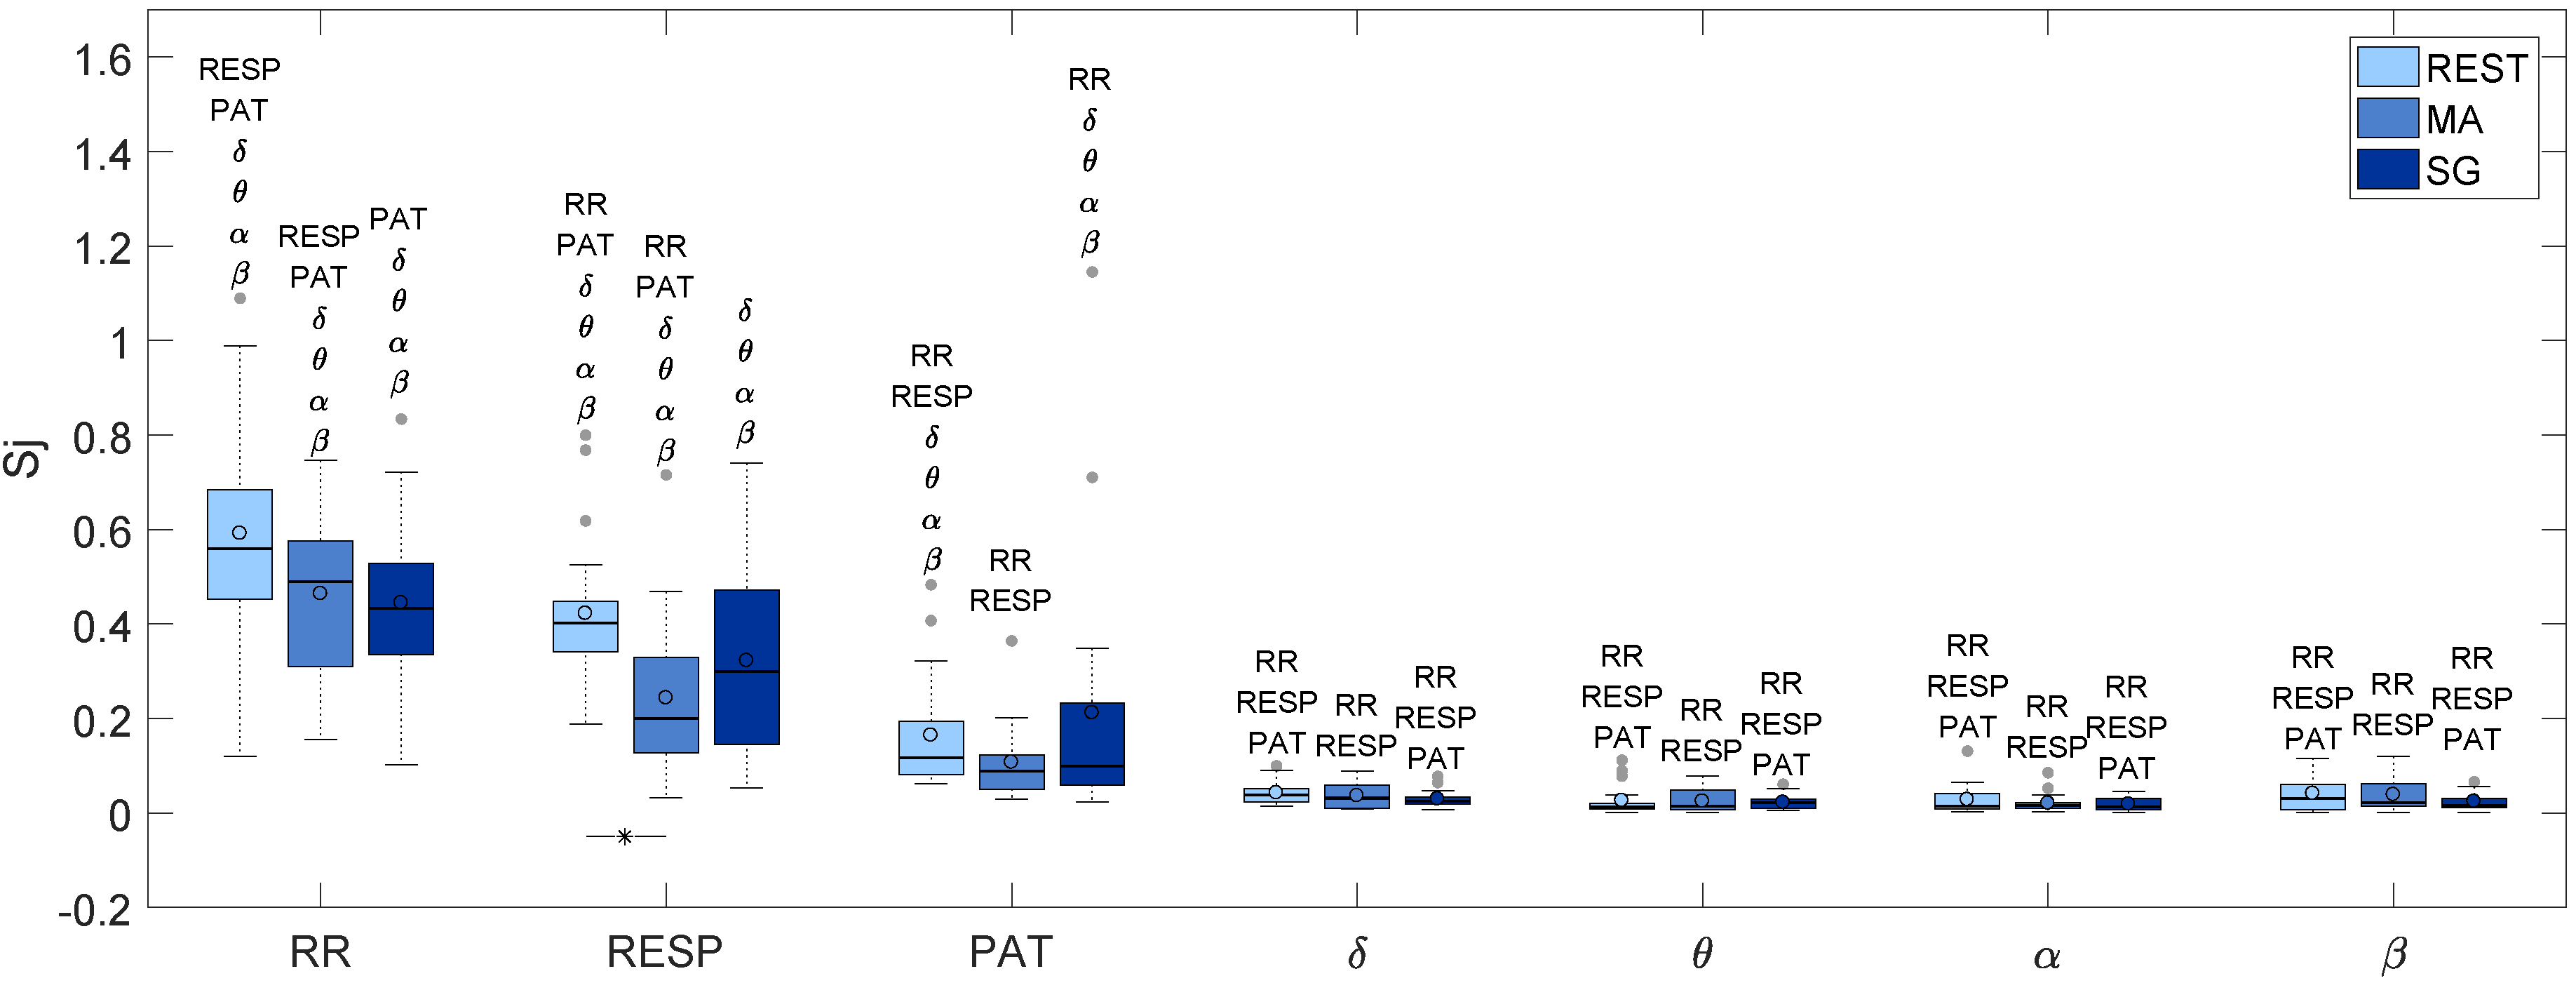
| cardiac period (RR interval) | Information Storage () |
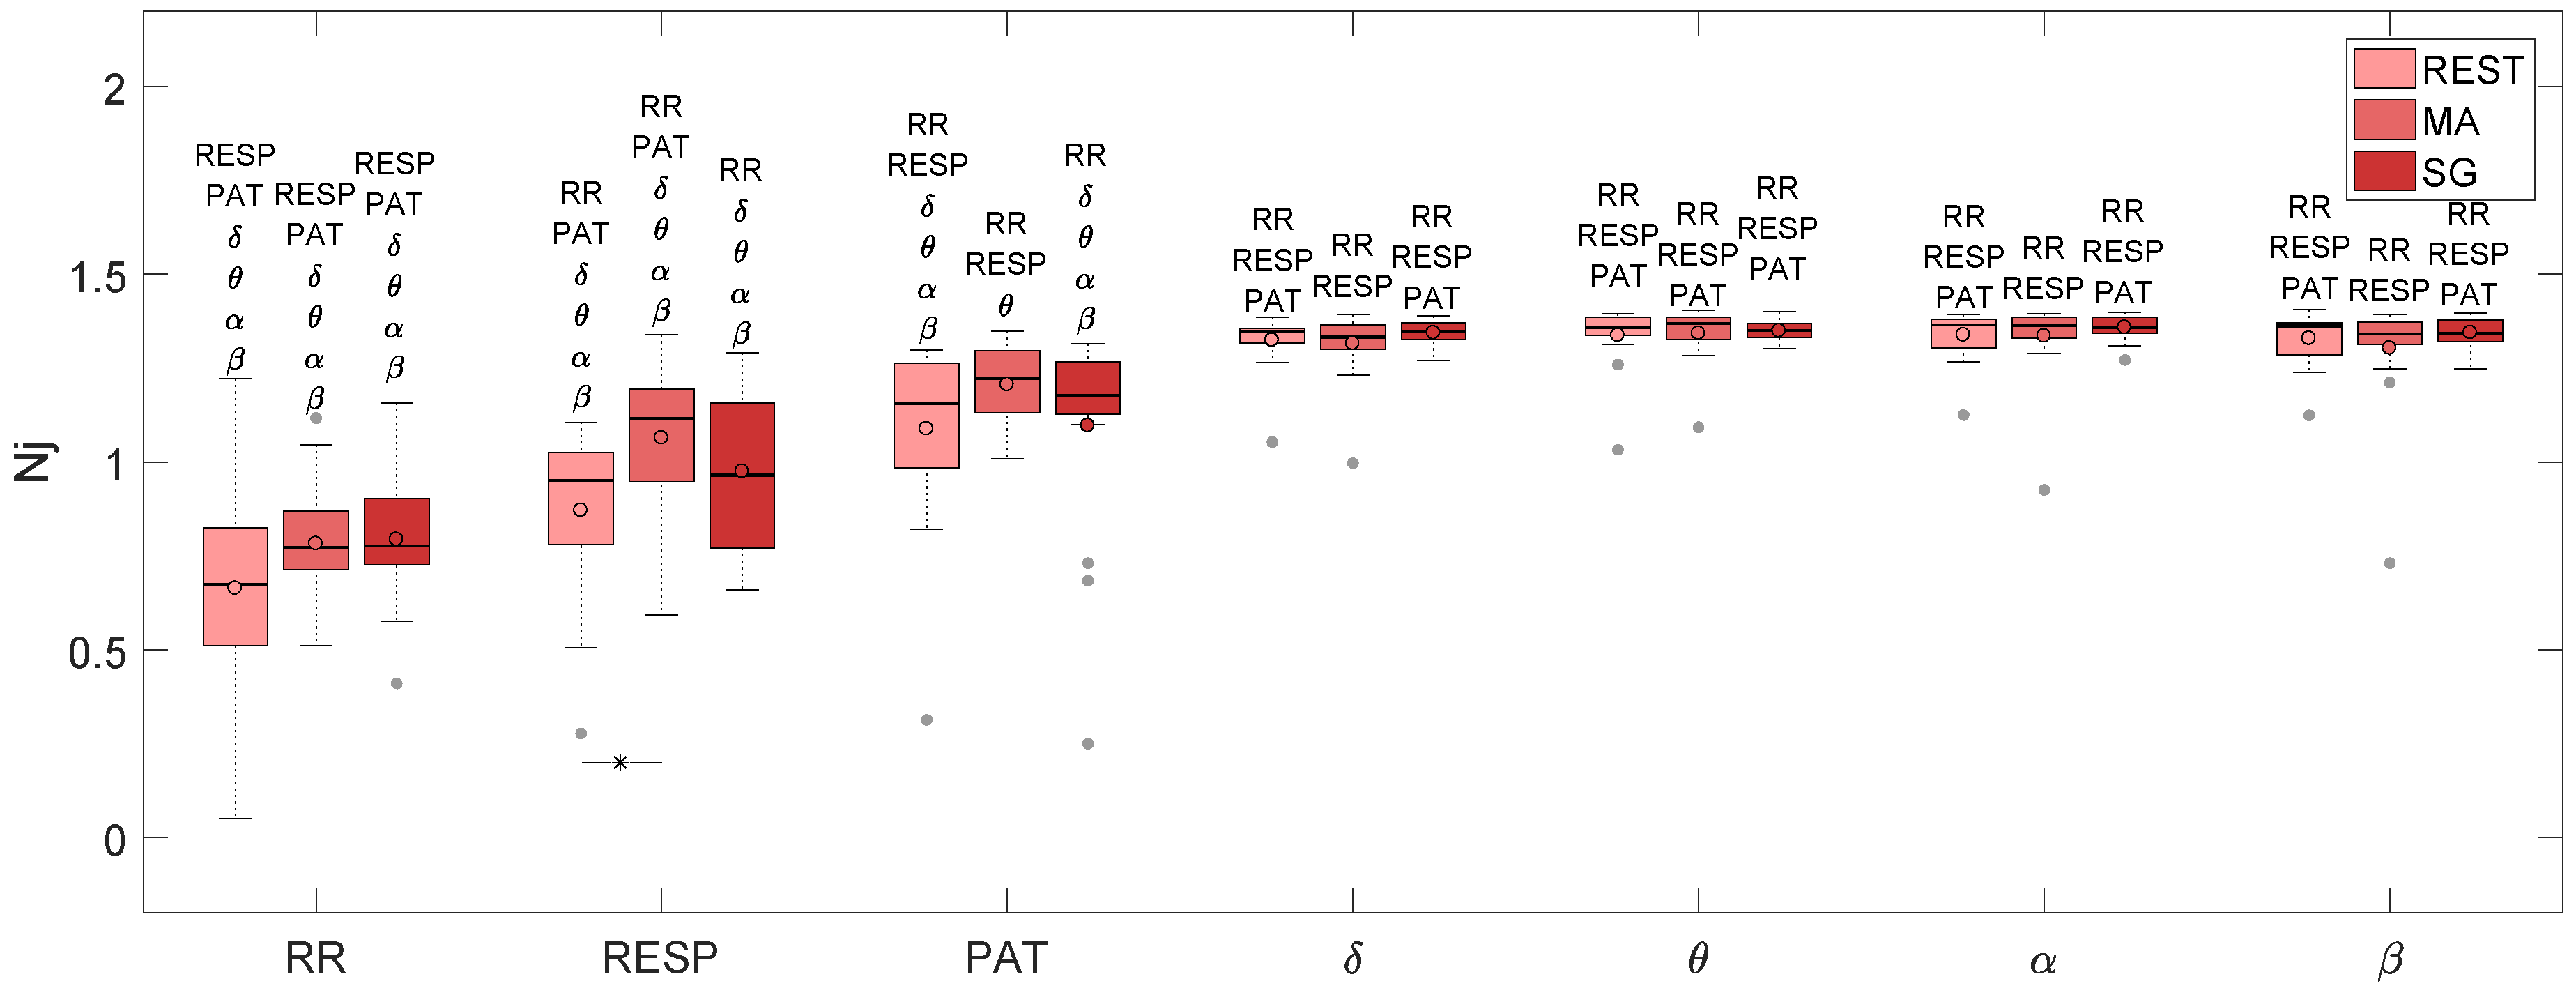
| respiration (RESP) | New Information () |
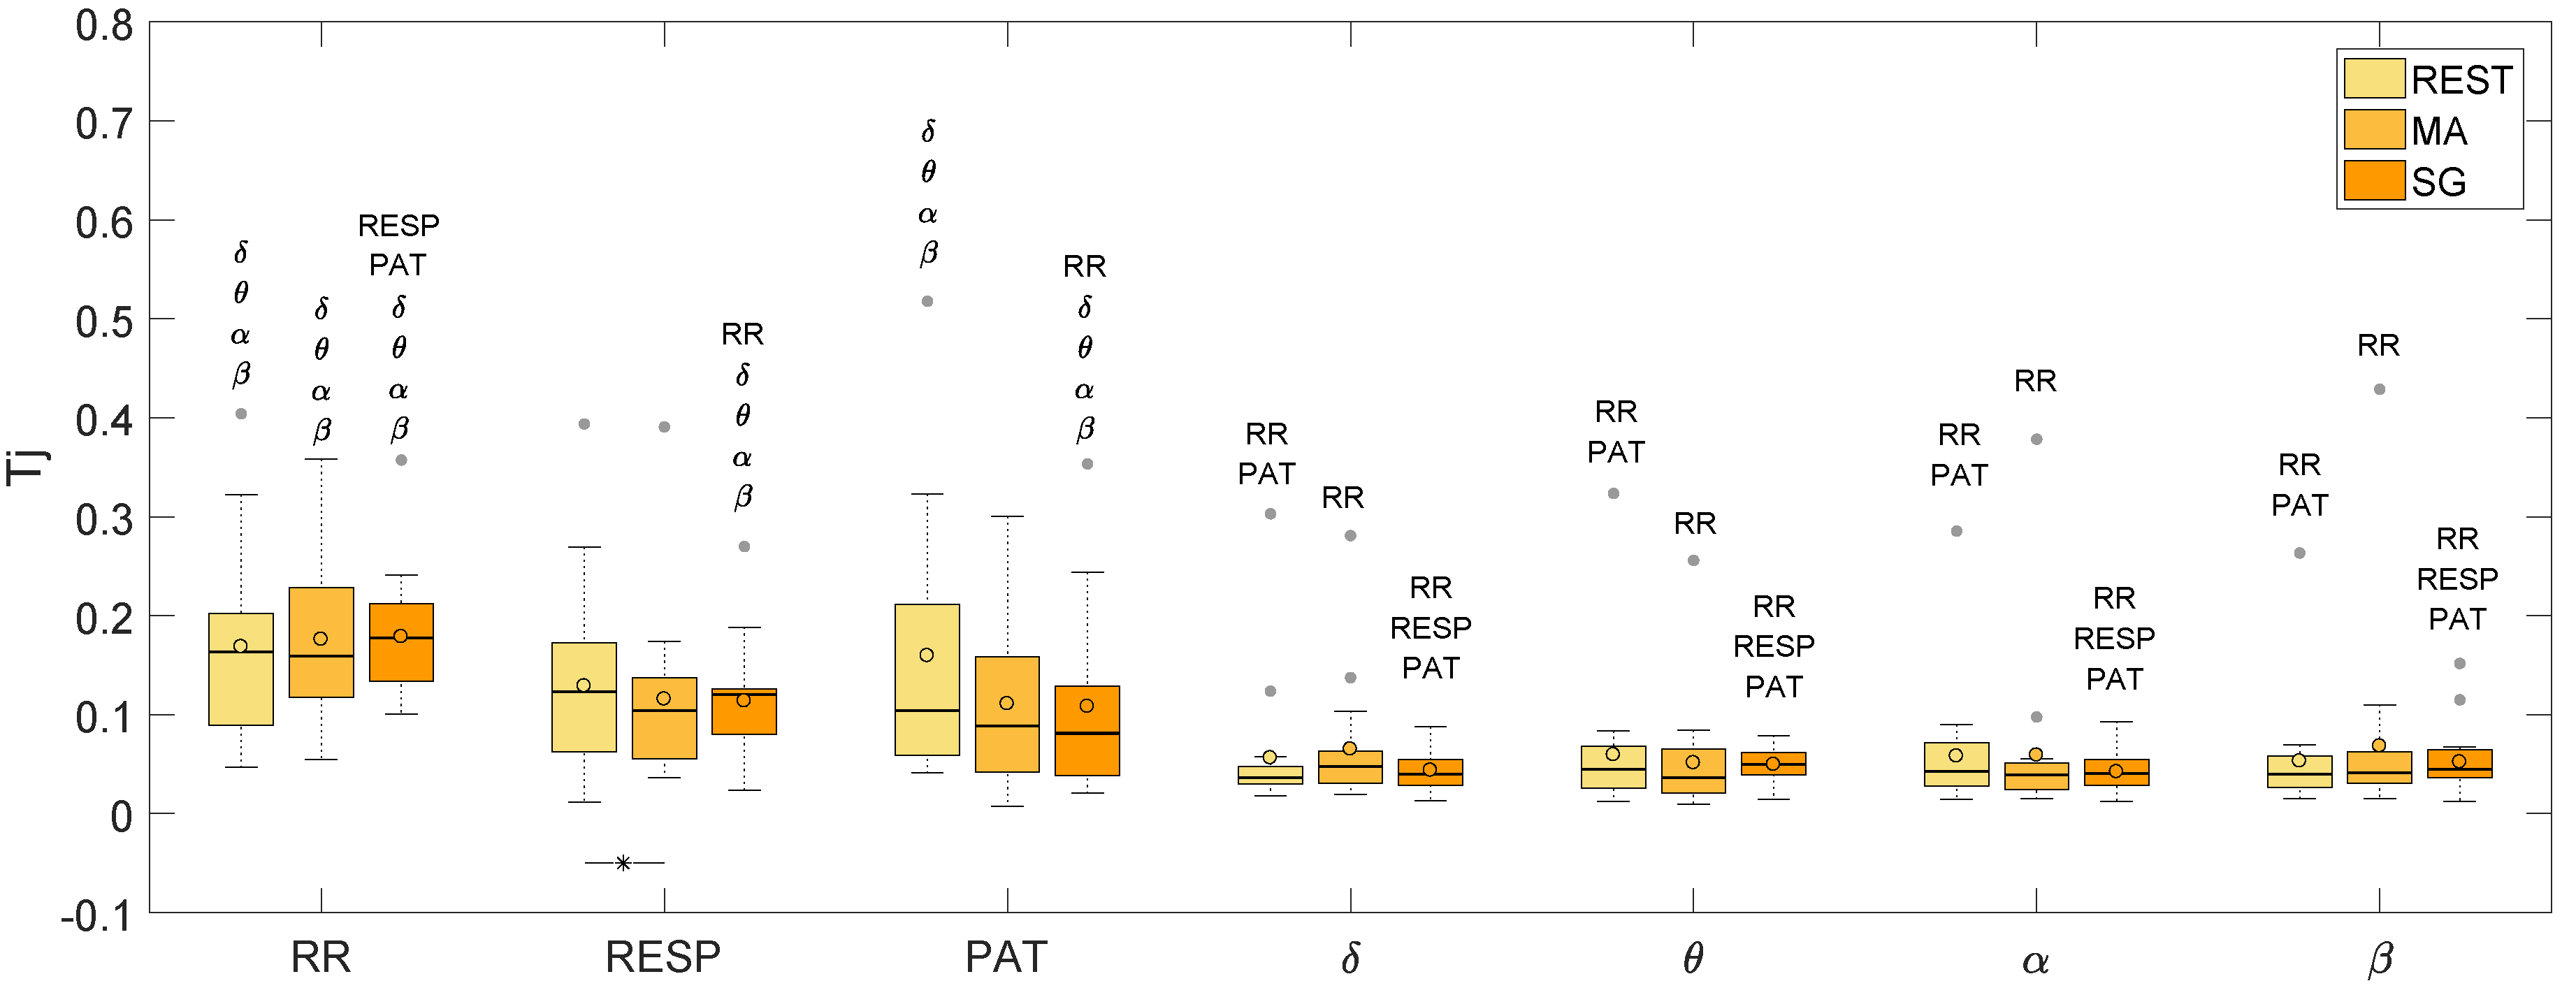
| pulse arrival time (PAT) | Information Transfer () |
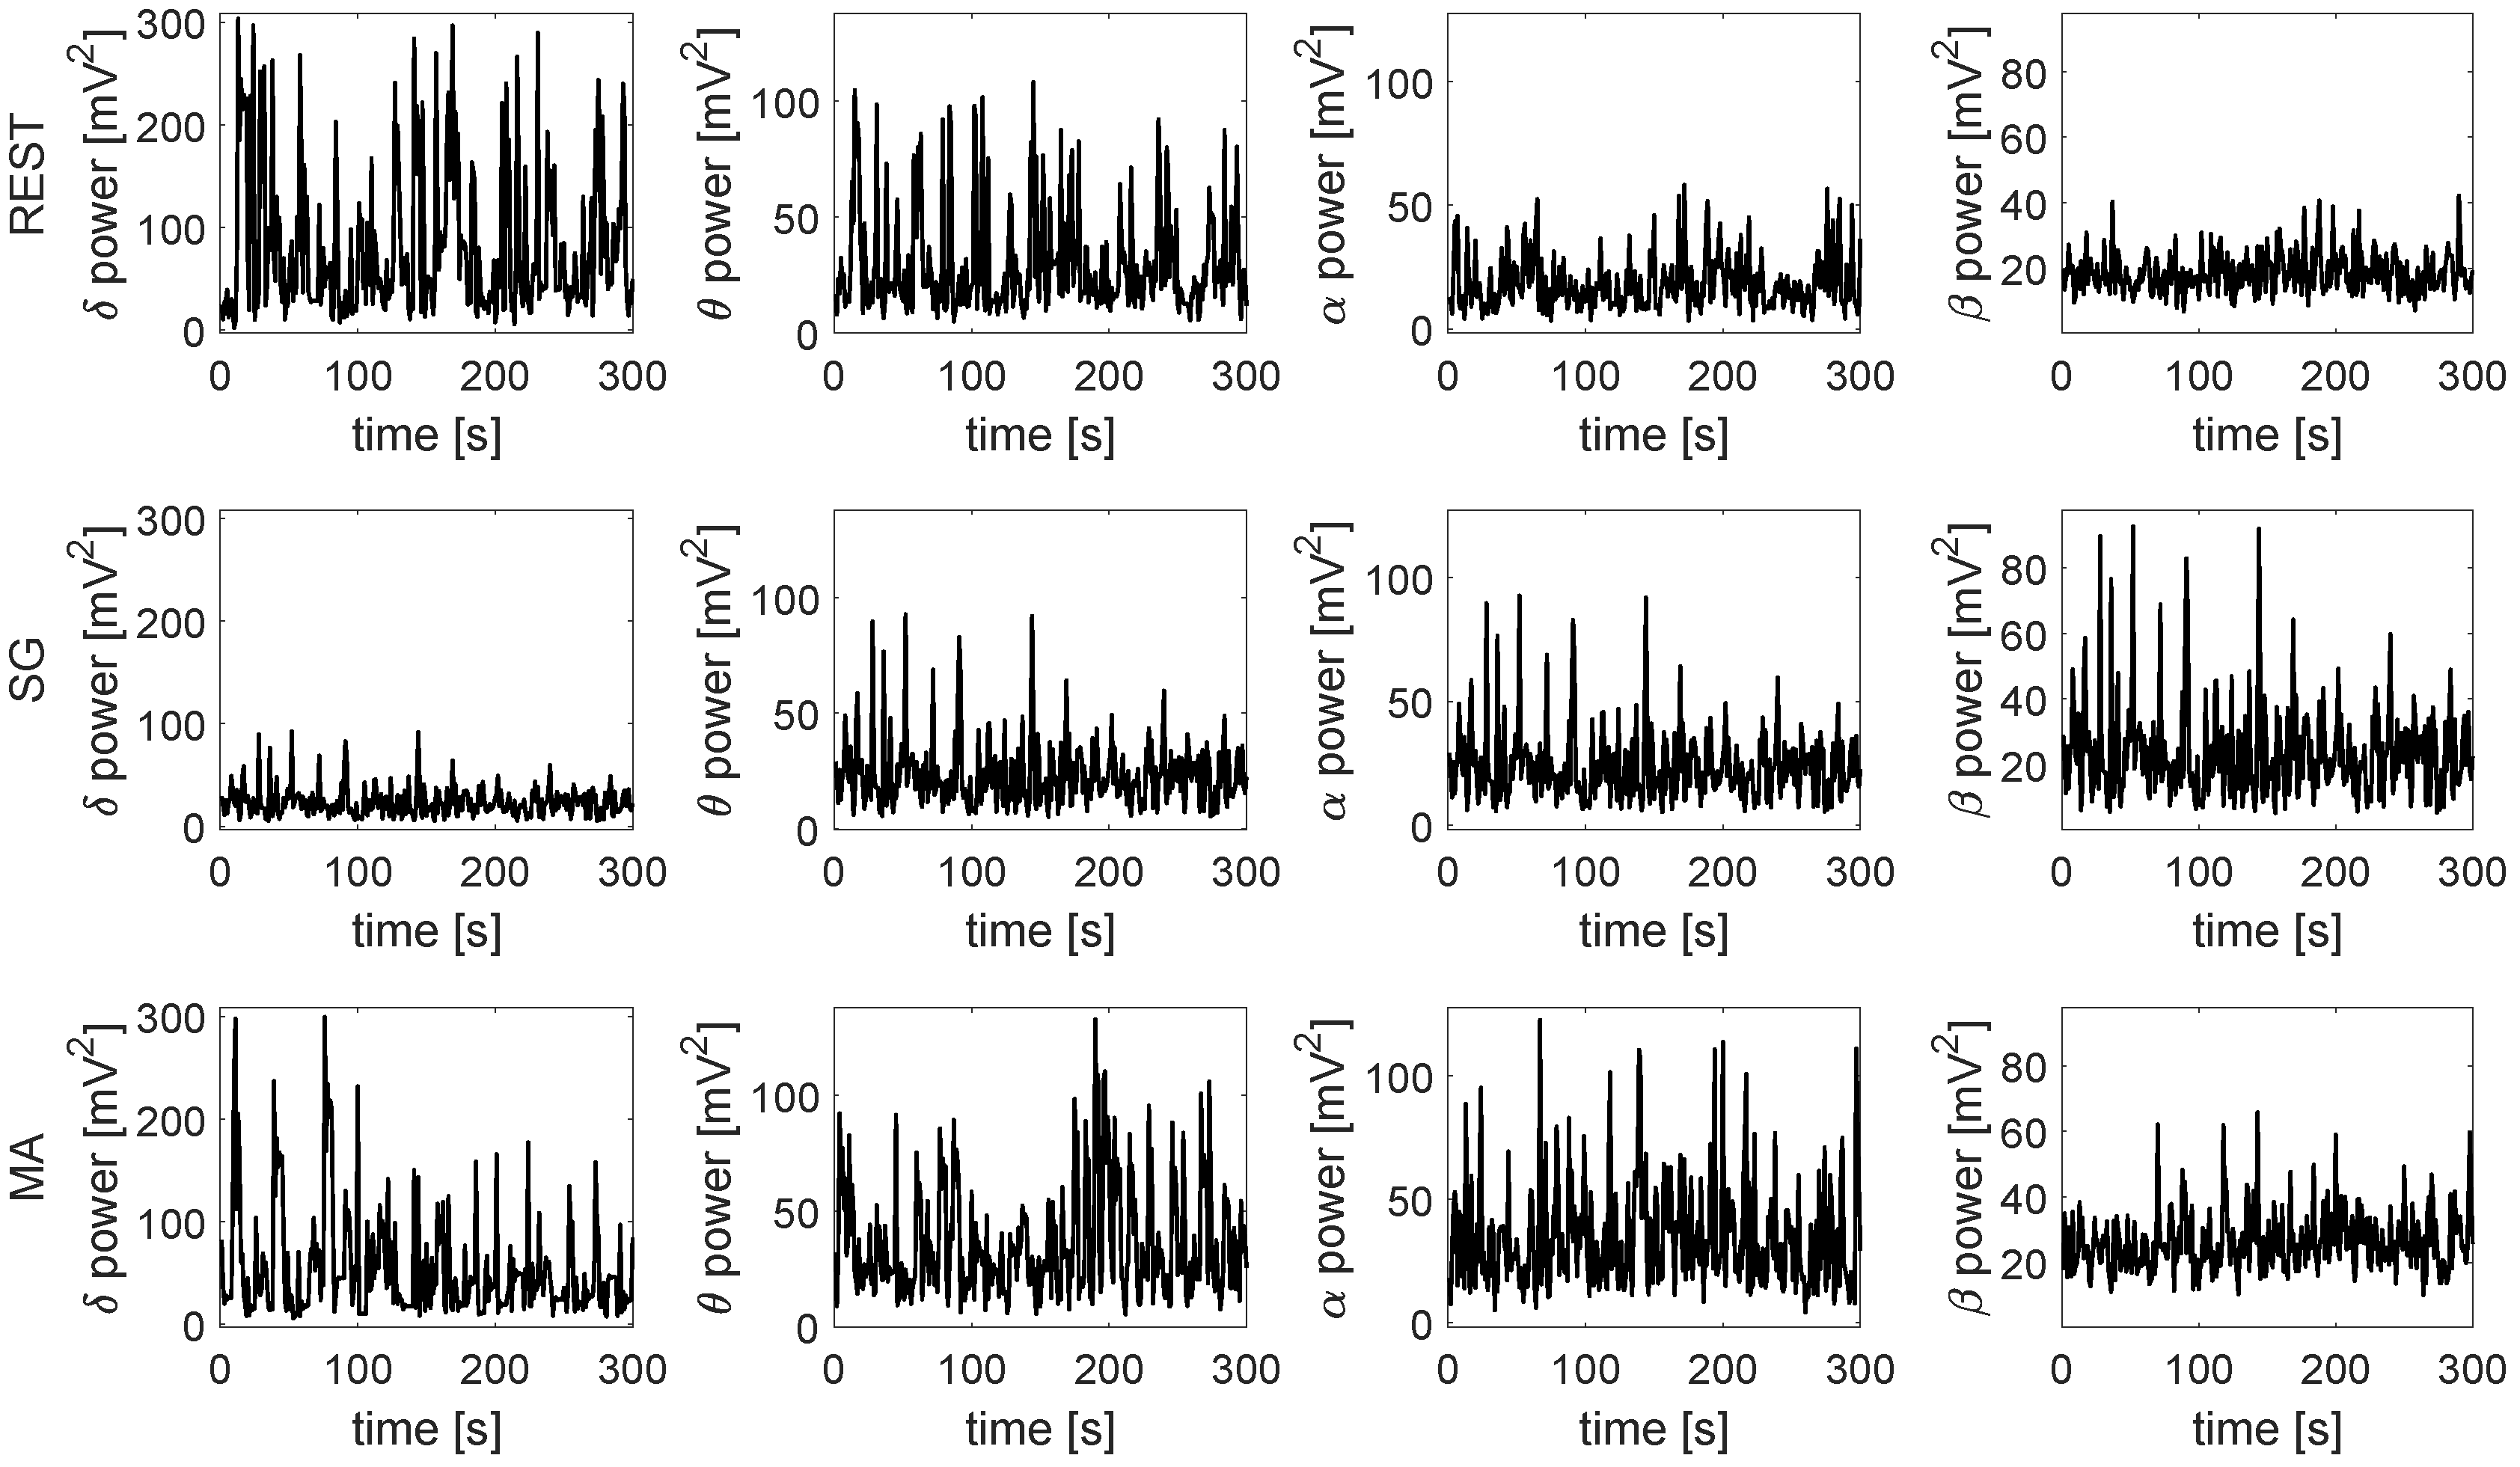
| EEG power | Conditional Information Transfer () |
| EEG power | |
| EEG power | |
| EEG power |
| RR | RESP | PAT | δ | θ | α | β | |
|---|---|---|---|---|---|---|---|
| REST | 0.560 | 0.401 | 0.117 | 0.039 | 0.013 | 0.015 | 0.031 |
| MA | 0.490 | 0.200 | 0.088 | 0.032 | 0.014 | 0.016 | 0.022 |
| SG | 0.434 | 0.300 | 0.099 | 0.024 | 0.022 | 0.013 | 0.017 |
| RR | RESP | PAT | δ | θ | α | β | |
|---|---|---|---|---|---|---|---|
| REST | 0.674 | 0.951 | 1.155 | 1.347 | 1.357 | 1.365 | 1.362 |
| MA | 0.772 | 1.117 | 1.222 | 1.333 | 1.369 | 1.364 | 1.342 |
| SG | 0.777 | 0.965 | 1.178 | 1.349 | 1.351 | 1.357 | 1.343 |
| RR | RESP | PAT | δ | θ | α | β | |
|---|---|---|---|---|---|---|---|
| REST | 0.163 | 0.123 | 0.104 | 0.036 | 0.045 | 0.043 | 0.040 |
| MA | 0.159 | 0.104 | 0.088 | 0.047 | 0.037 | 0.039 | 0.041 |
| SG | 0.177 | 0.120 | 0.081 | 0.040 | 0.050 | 0.040 | 0.045 |
© 2019 by the authors. Licensee MDPI, Basel, Switzerland. This article is an open access article distributed under the terms and conditions of the Creative Commons Attribution (CC BY) license (http://creativecommons.org/licenses/by/4.0/).
Share and Cite
Zanetti, M.; Faes, L.; Nollo, G.; De Cecco, M.; Pernice, R.; Maule, L.; Pertile, M.; Fornaser, A. Information Dynamics of the Brain, Cardiovascular and Respiratory Network during Different Levels of Mental Stress. Entropy 2019, 21, 275. https://doi.org/10.3390/e21030275
Zanetti M, Faes L, Nollo G, De Cecco M, Pernice R, Maule L, Pertile M, Fornaser A. Information Dynamics of the Brain, Cardiovascular and Respiratory Network during Different Levels of Mental Stress. Entropy. 2019; 21(3):275. https://doi.org/10.3390/e21030275
Chicago/Turabian StyleZanetti, Matteo, Luca Faes, Giandomenico Nollo, Mariolino De Cecco, Riccardo Pernice, Luca Maule, Marco Pertile, and Alberto Fornaser. 2019. "Information Dynamics of the Brain, Cardiovascular and Respiratory Network during Different Levels of Mental Stress" Entropy 21, no. 3: 275. https://doi.org/10.3390/e21030275