
Radiomics Nomogram Based on Radiomics Score from Multiregional Diffusion-Weighted MRI and Clinical Factors for Evaluating HER-2 2+ Status of Breast Cancer


Abstract
:1. Introduction
2. Materials and Methods
2.1. Patient Cohort
2.2. MRI Acquisition
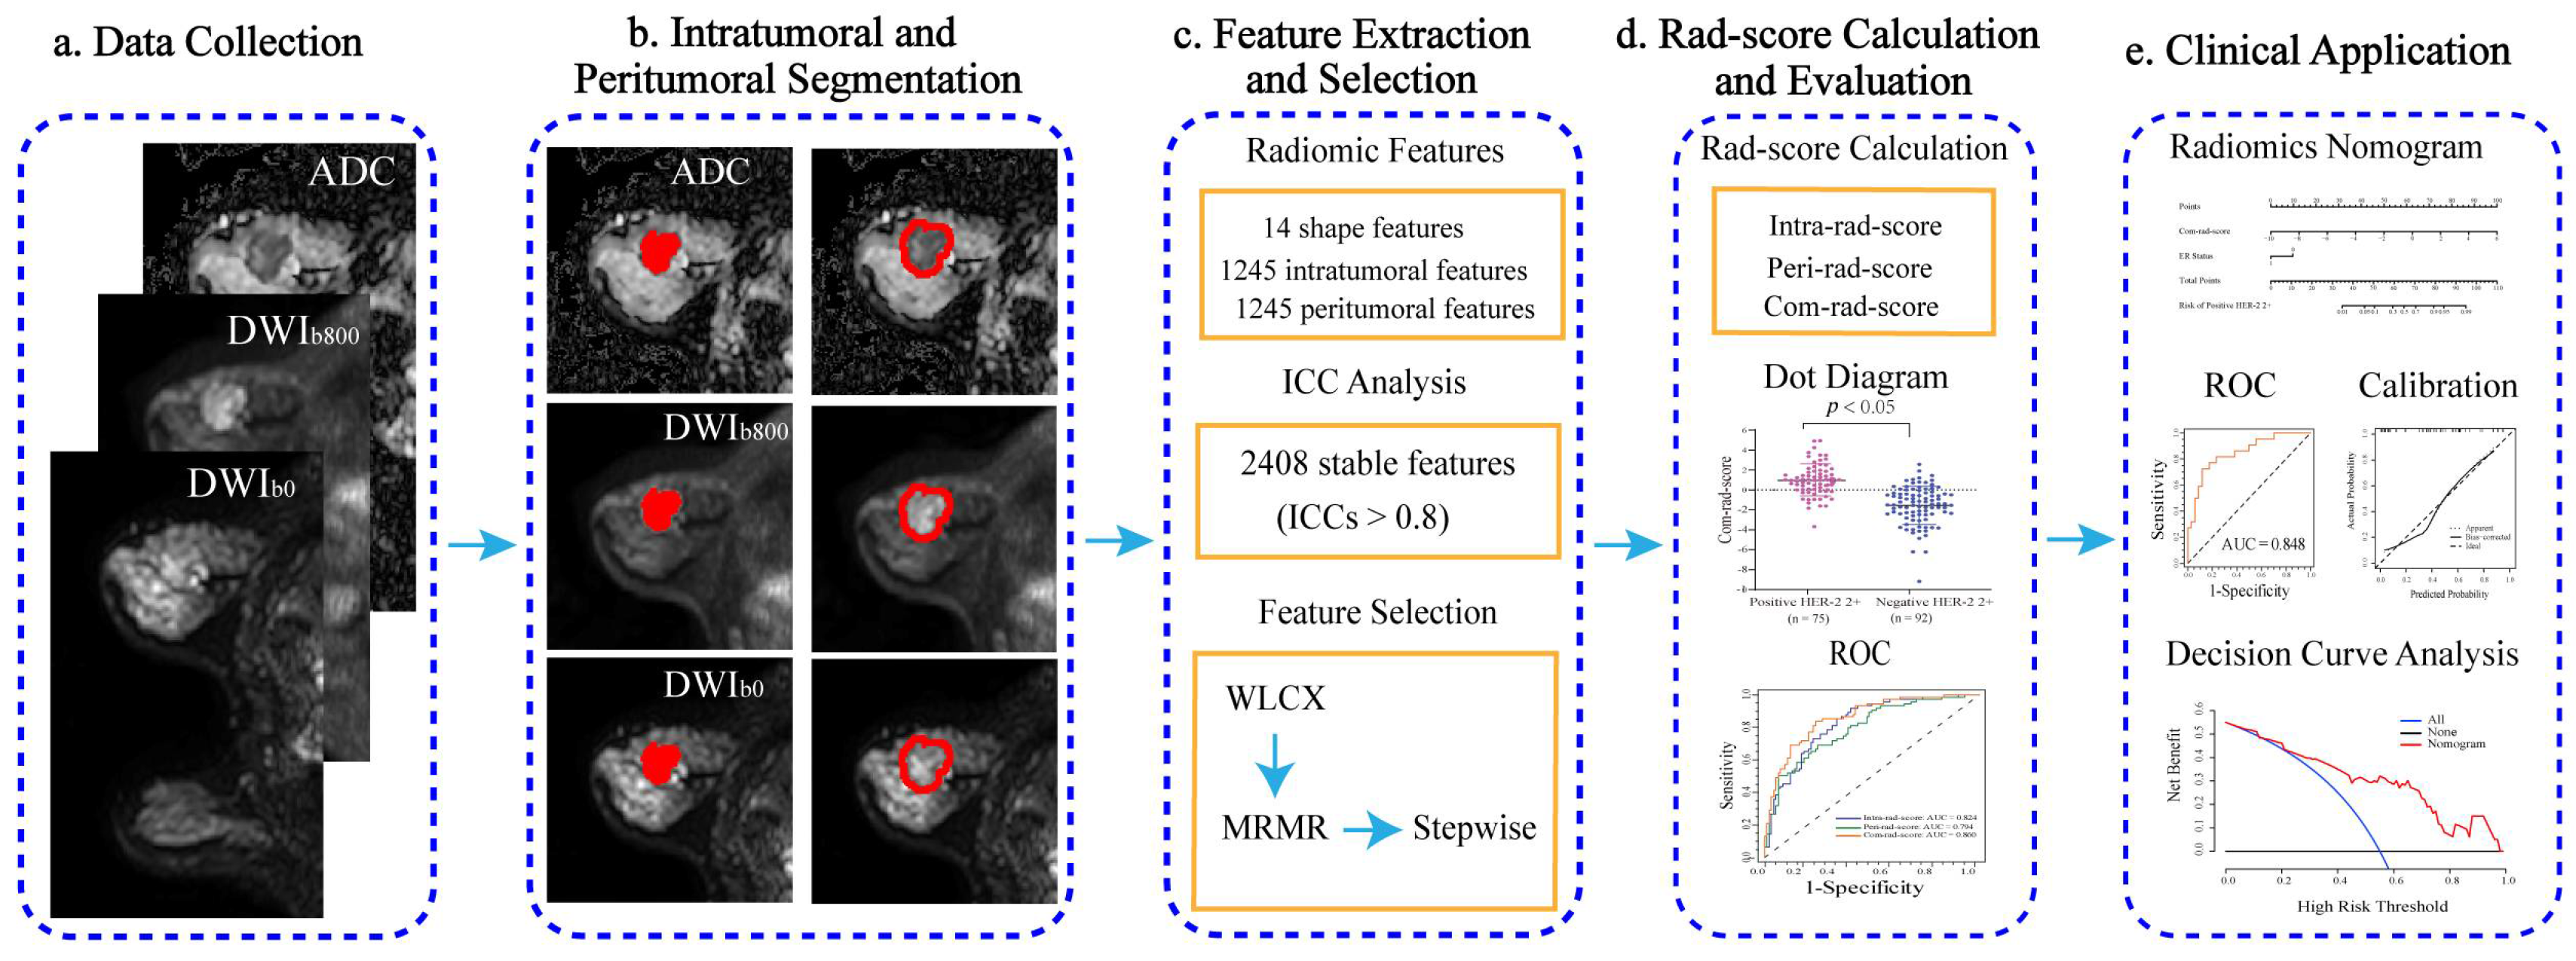
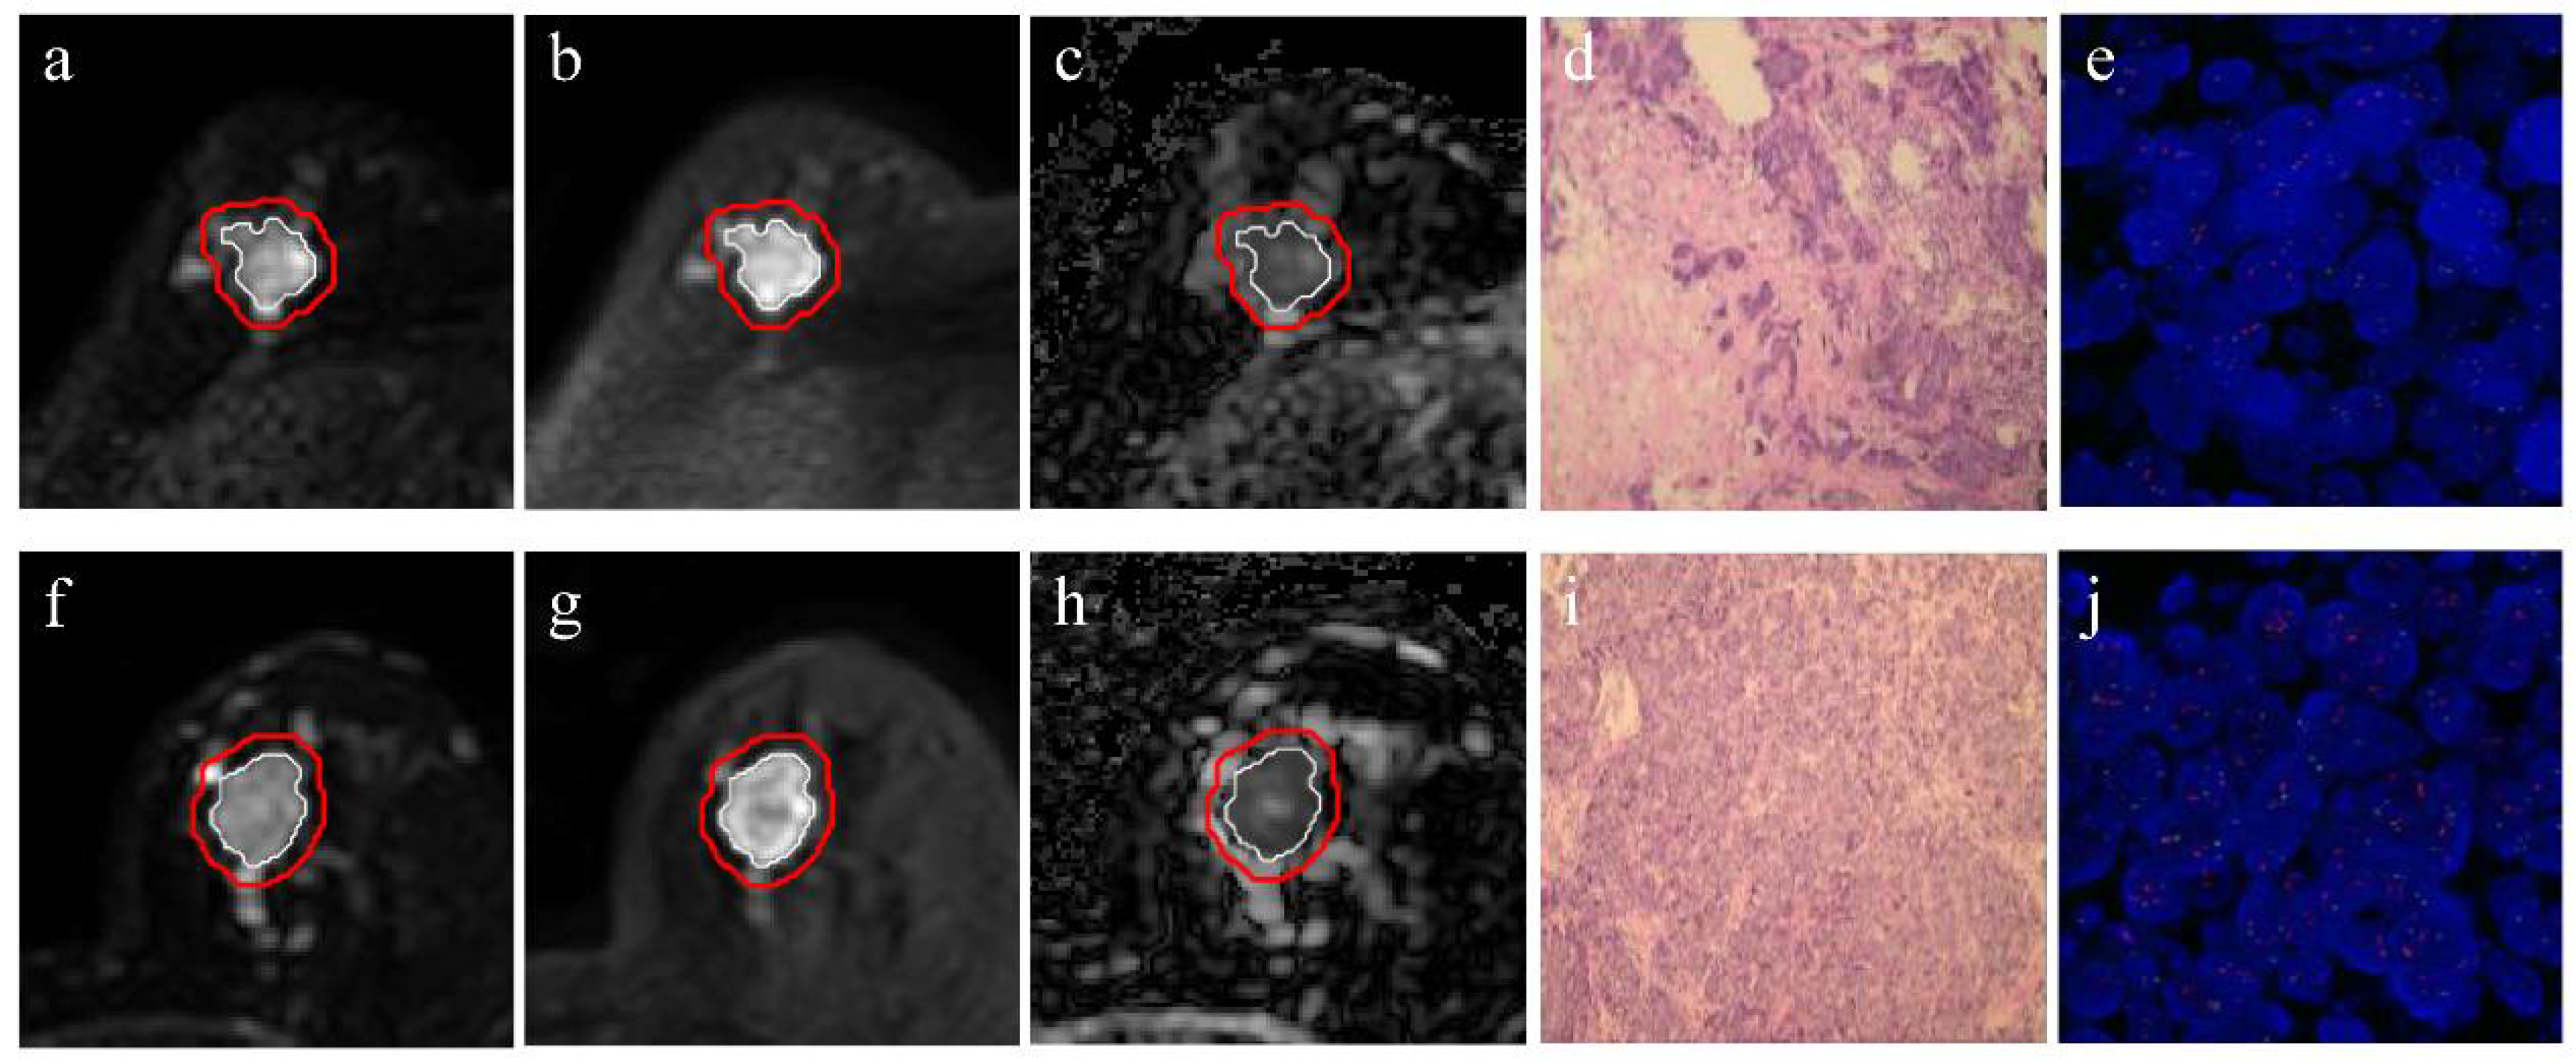
2.3. Tumor Segmentation
2.4. Radiomic Feature Extraction
2.5. Interobserver Variability Evaluation
2.6. Feature Selection and Radiomics Score Calculation
2.7. Radiomics Nomogram Establishment
2.8. Statistical Analysis
3. Results
3.1. Patient Characteristics
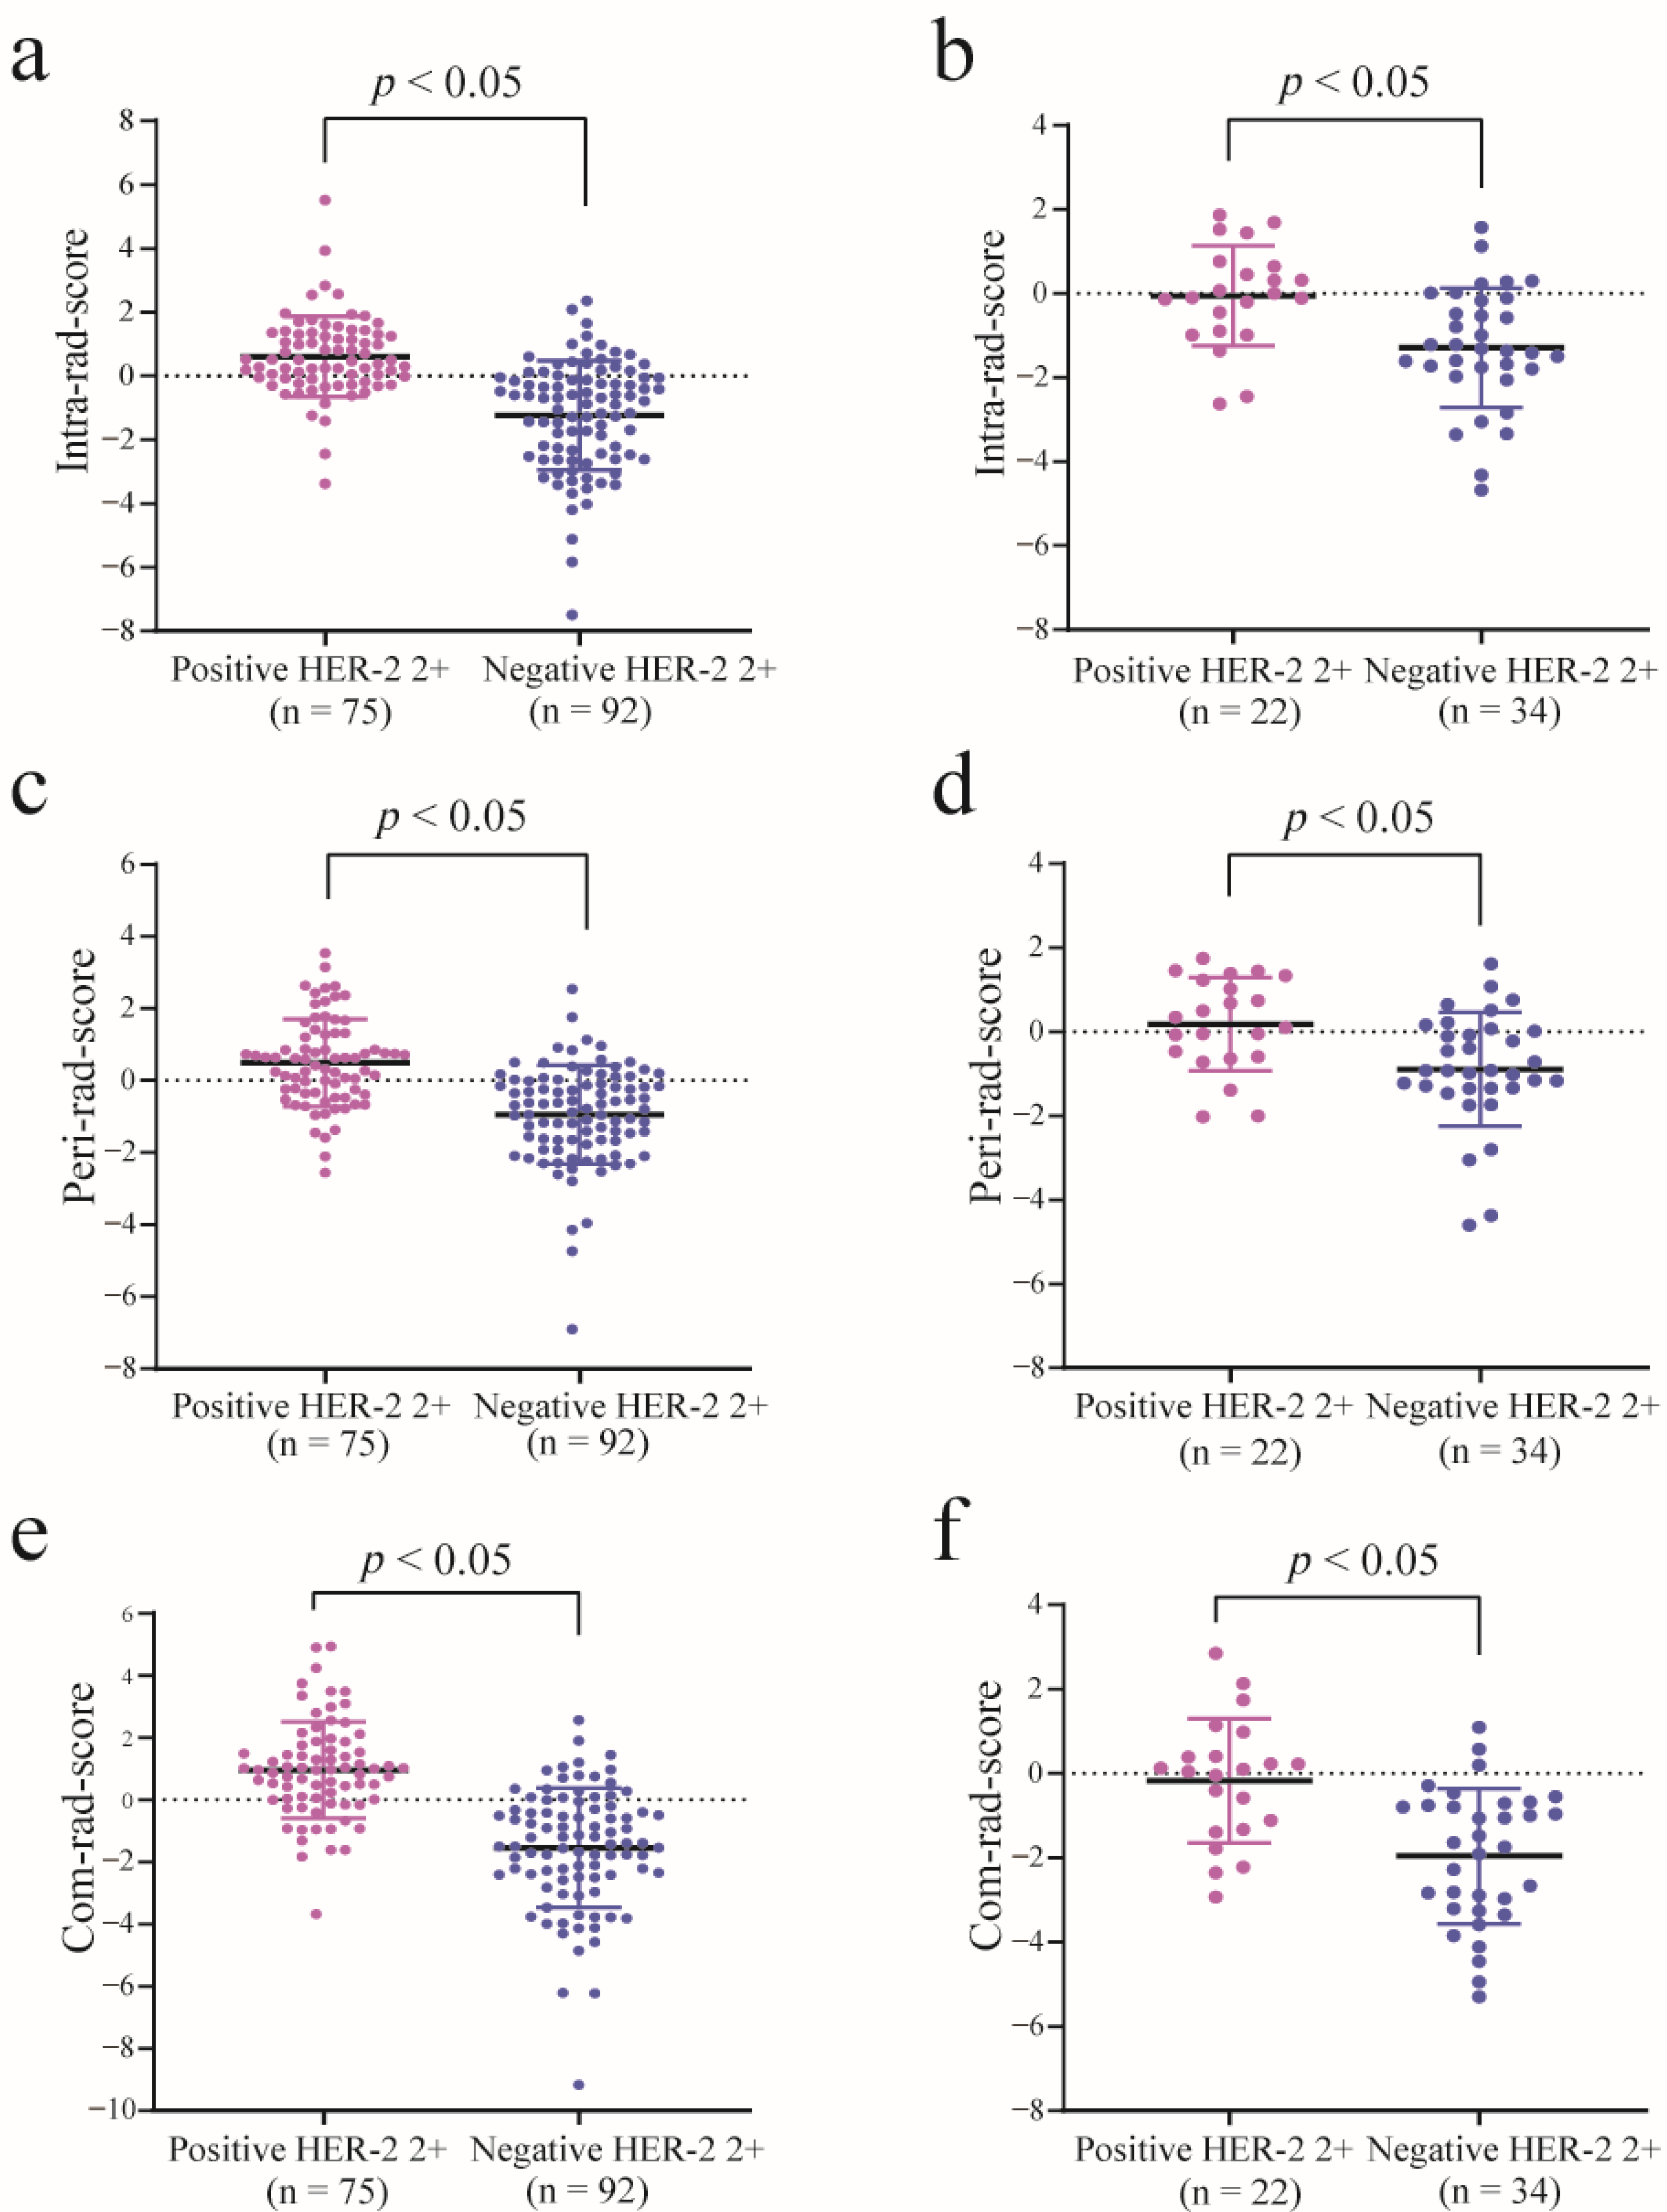
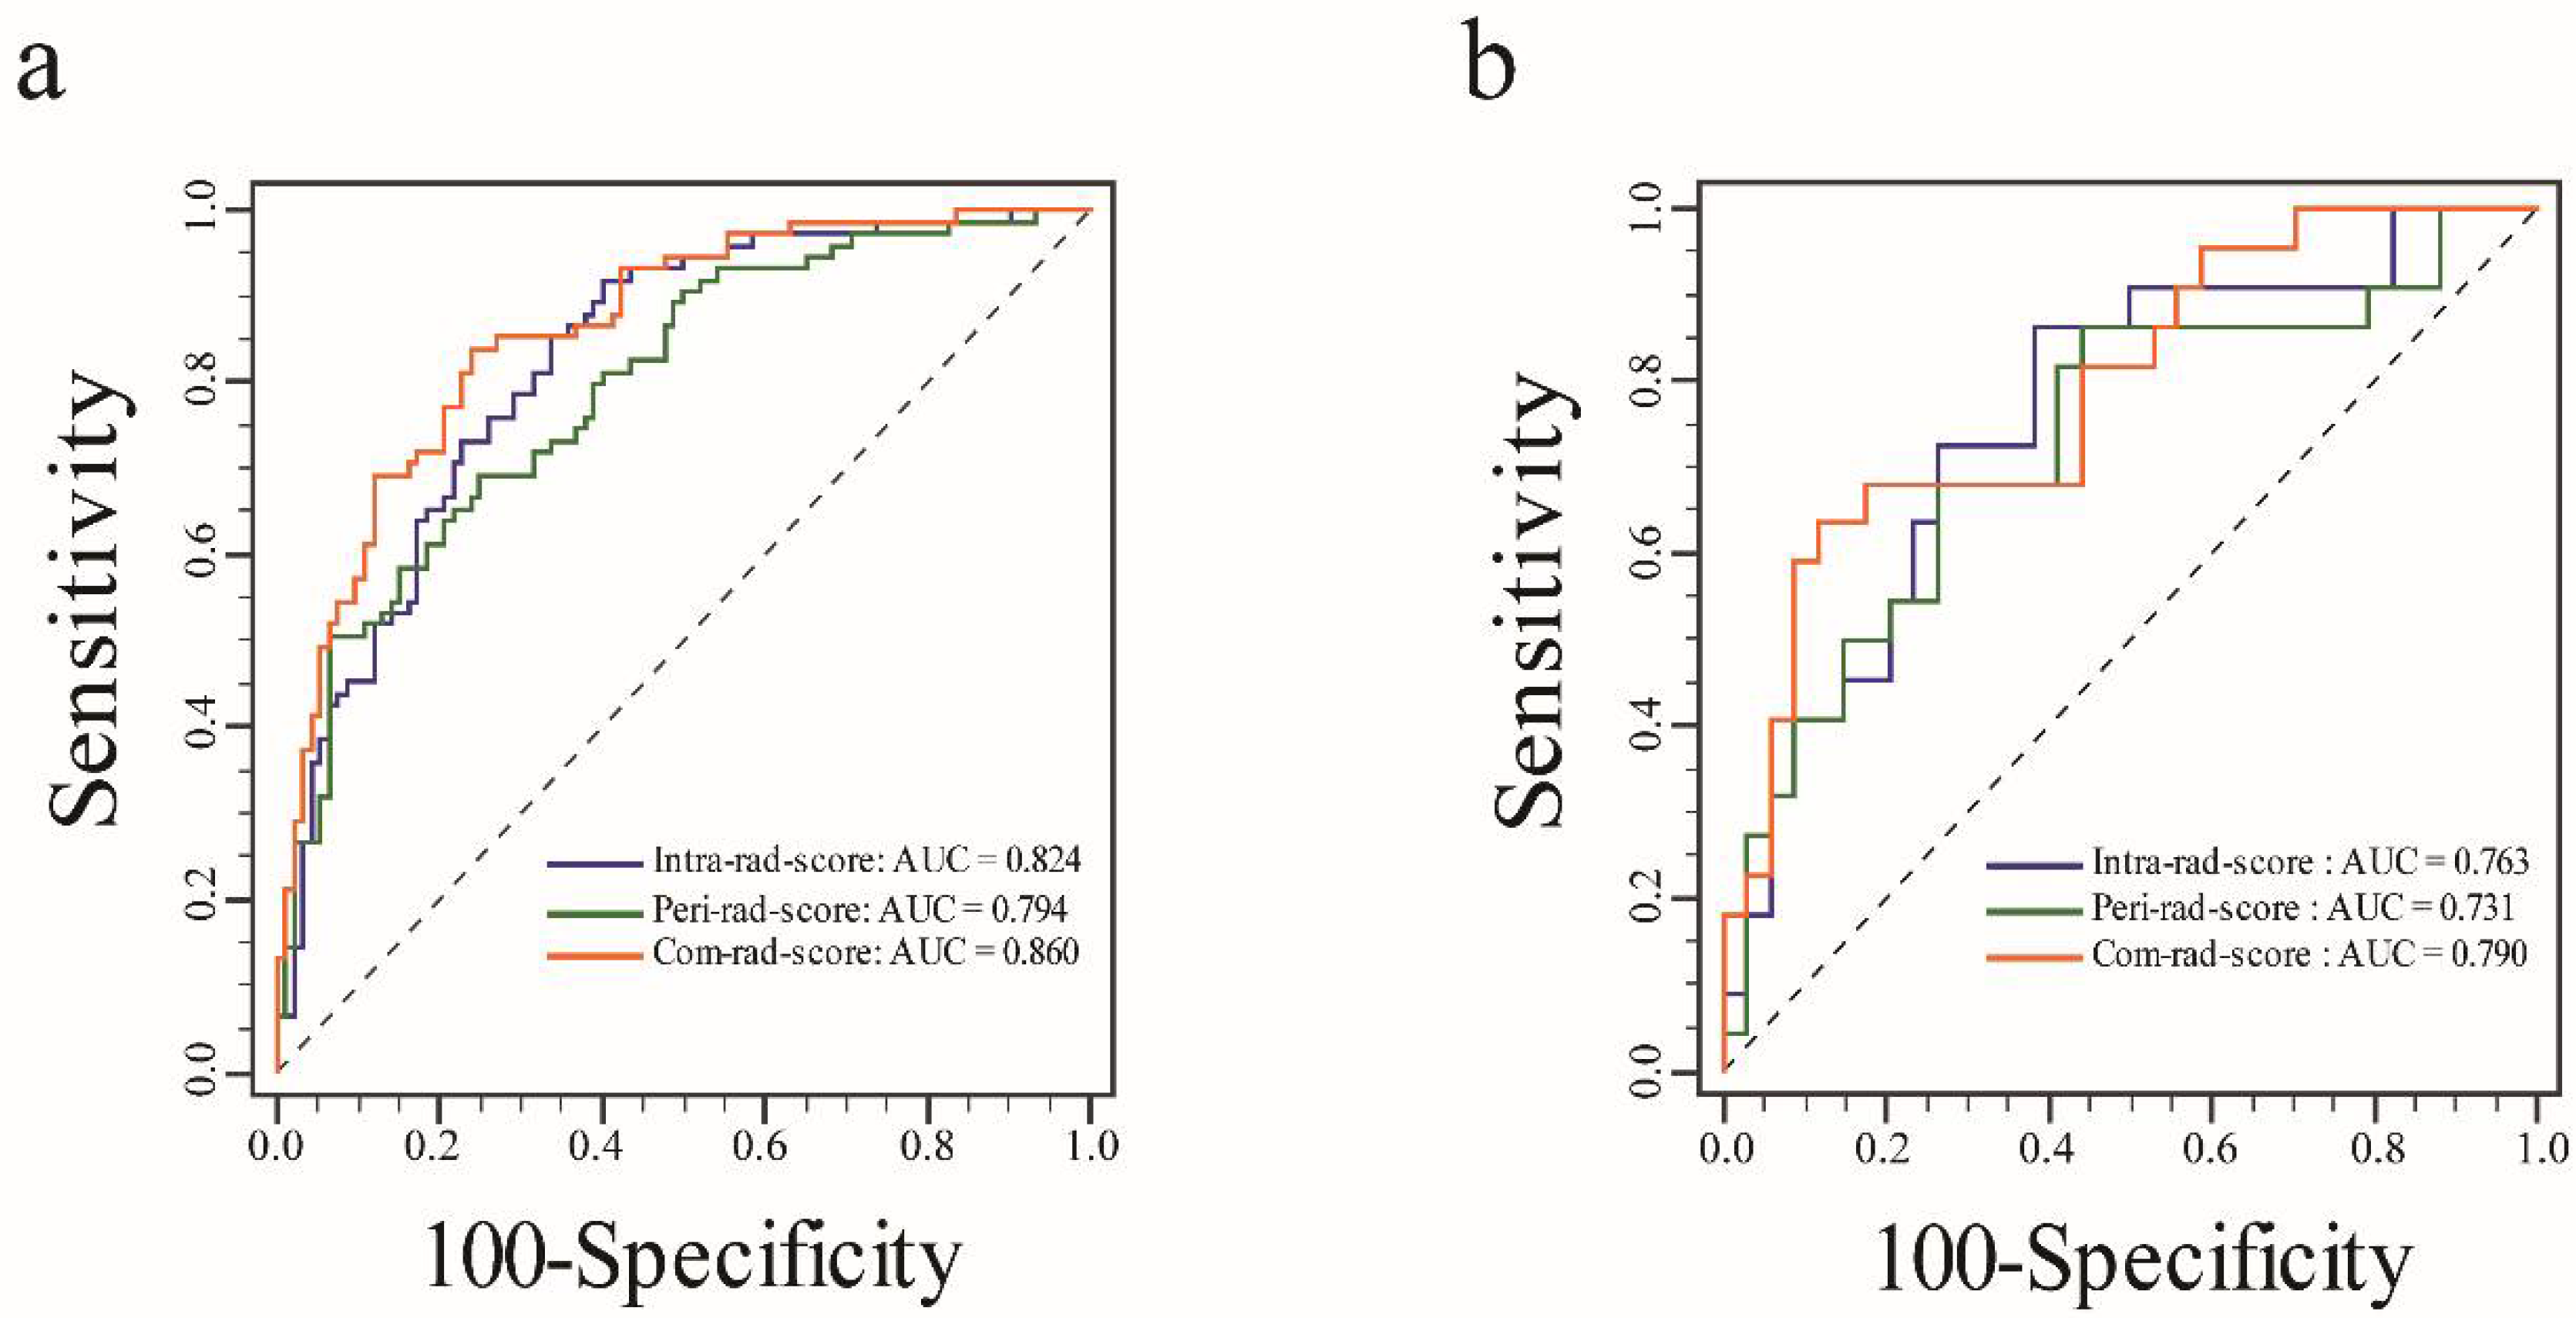
3.2. Feature Selection, Rad-Score Calculation, and Evaluation
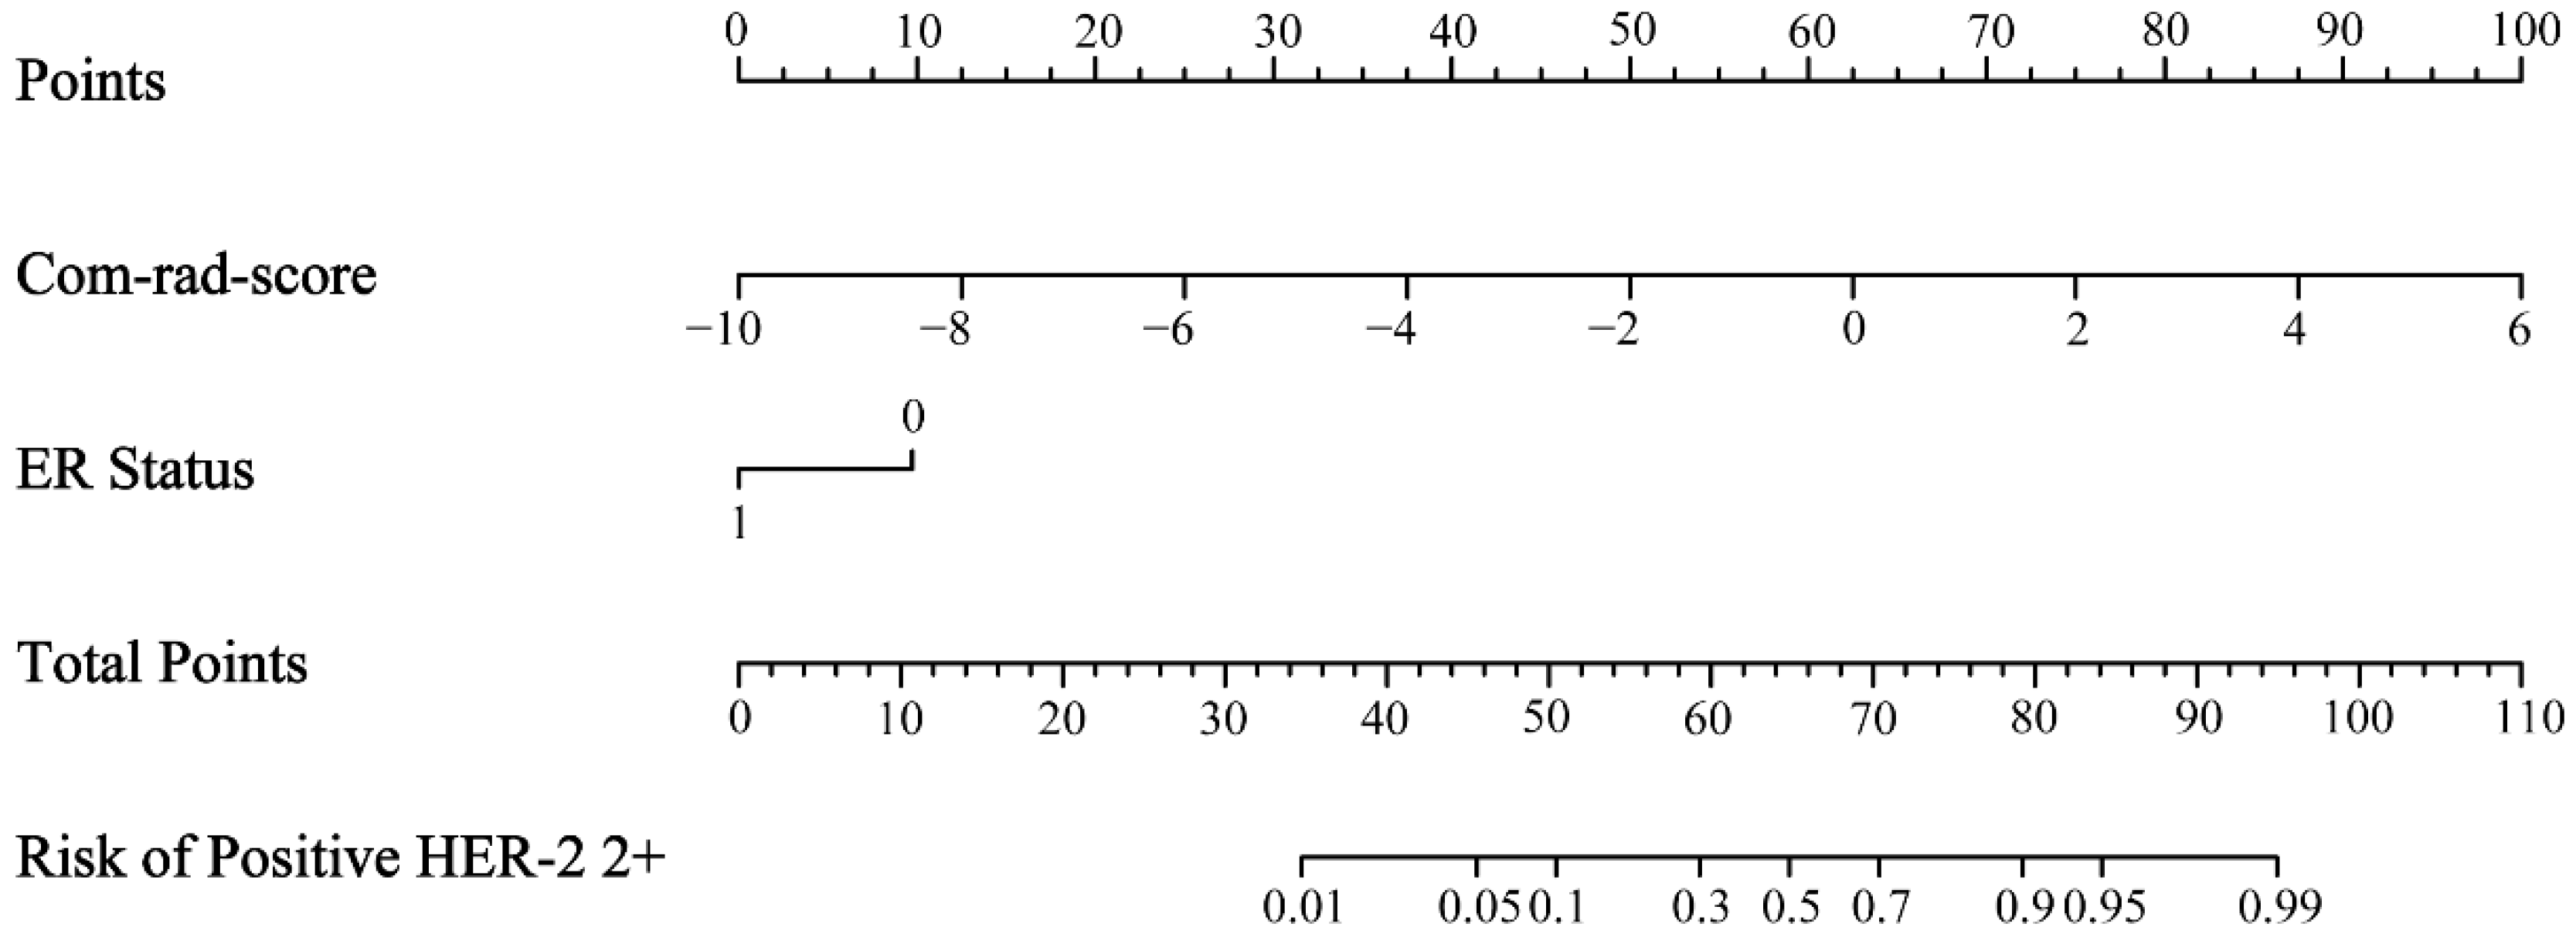
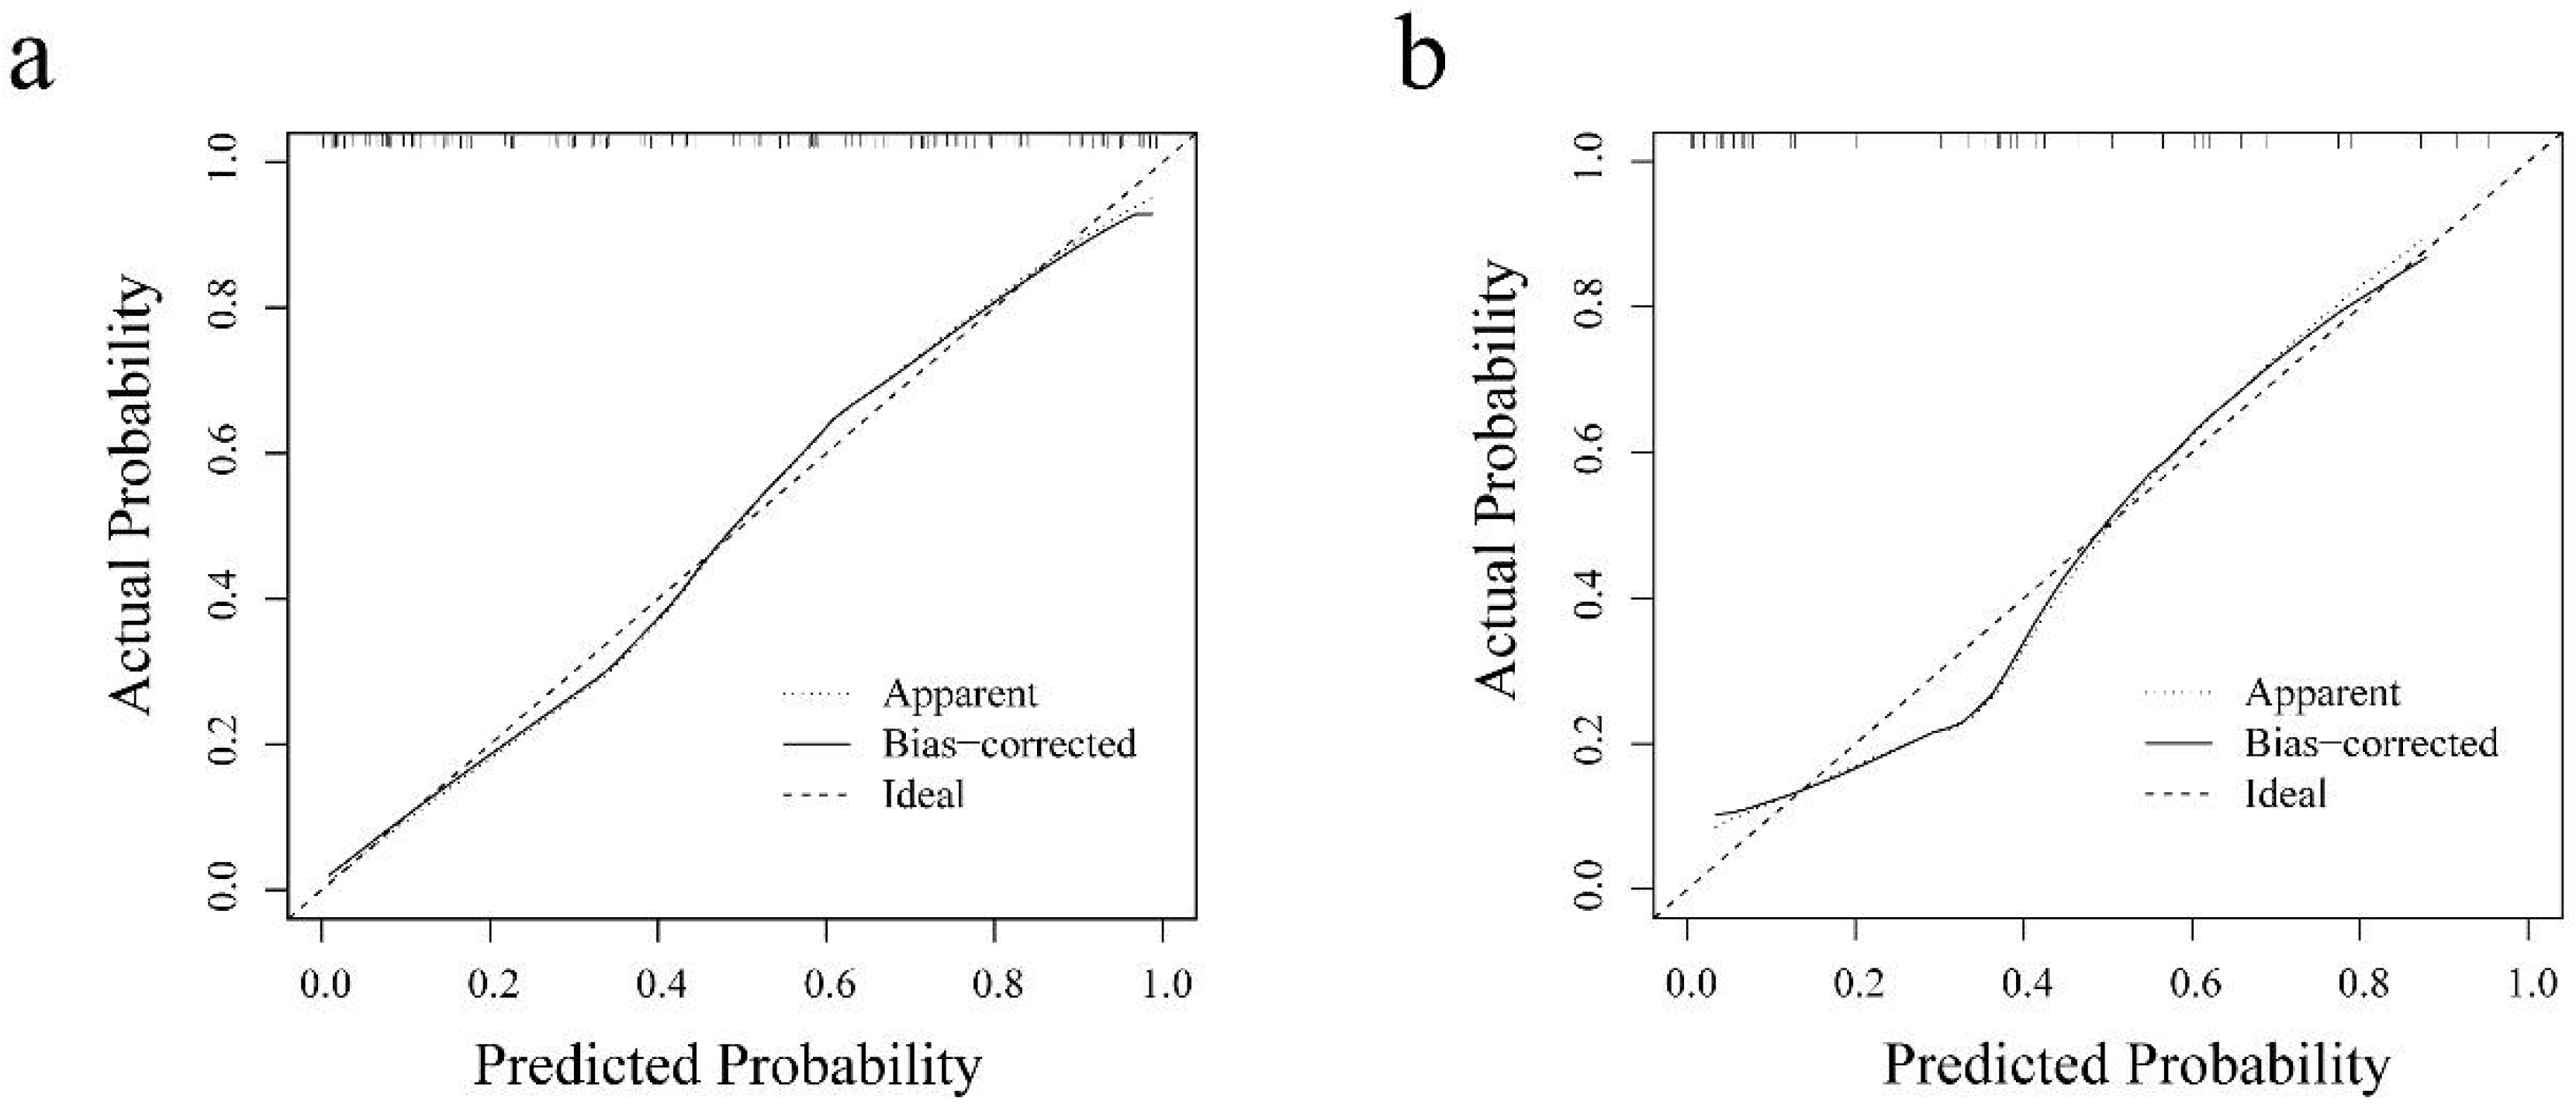
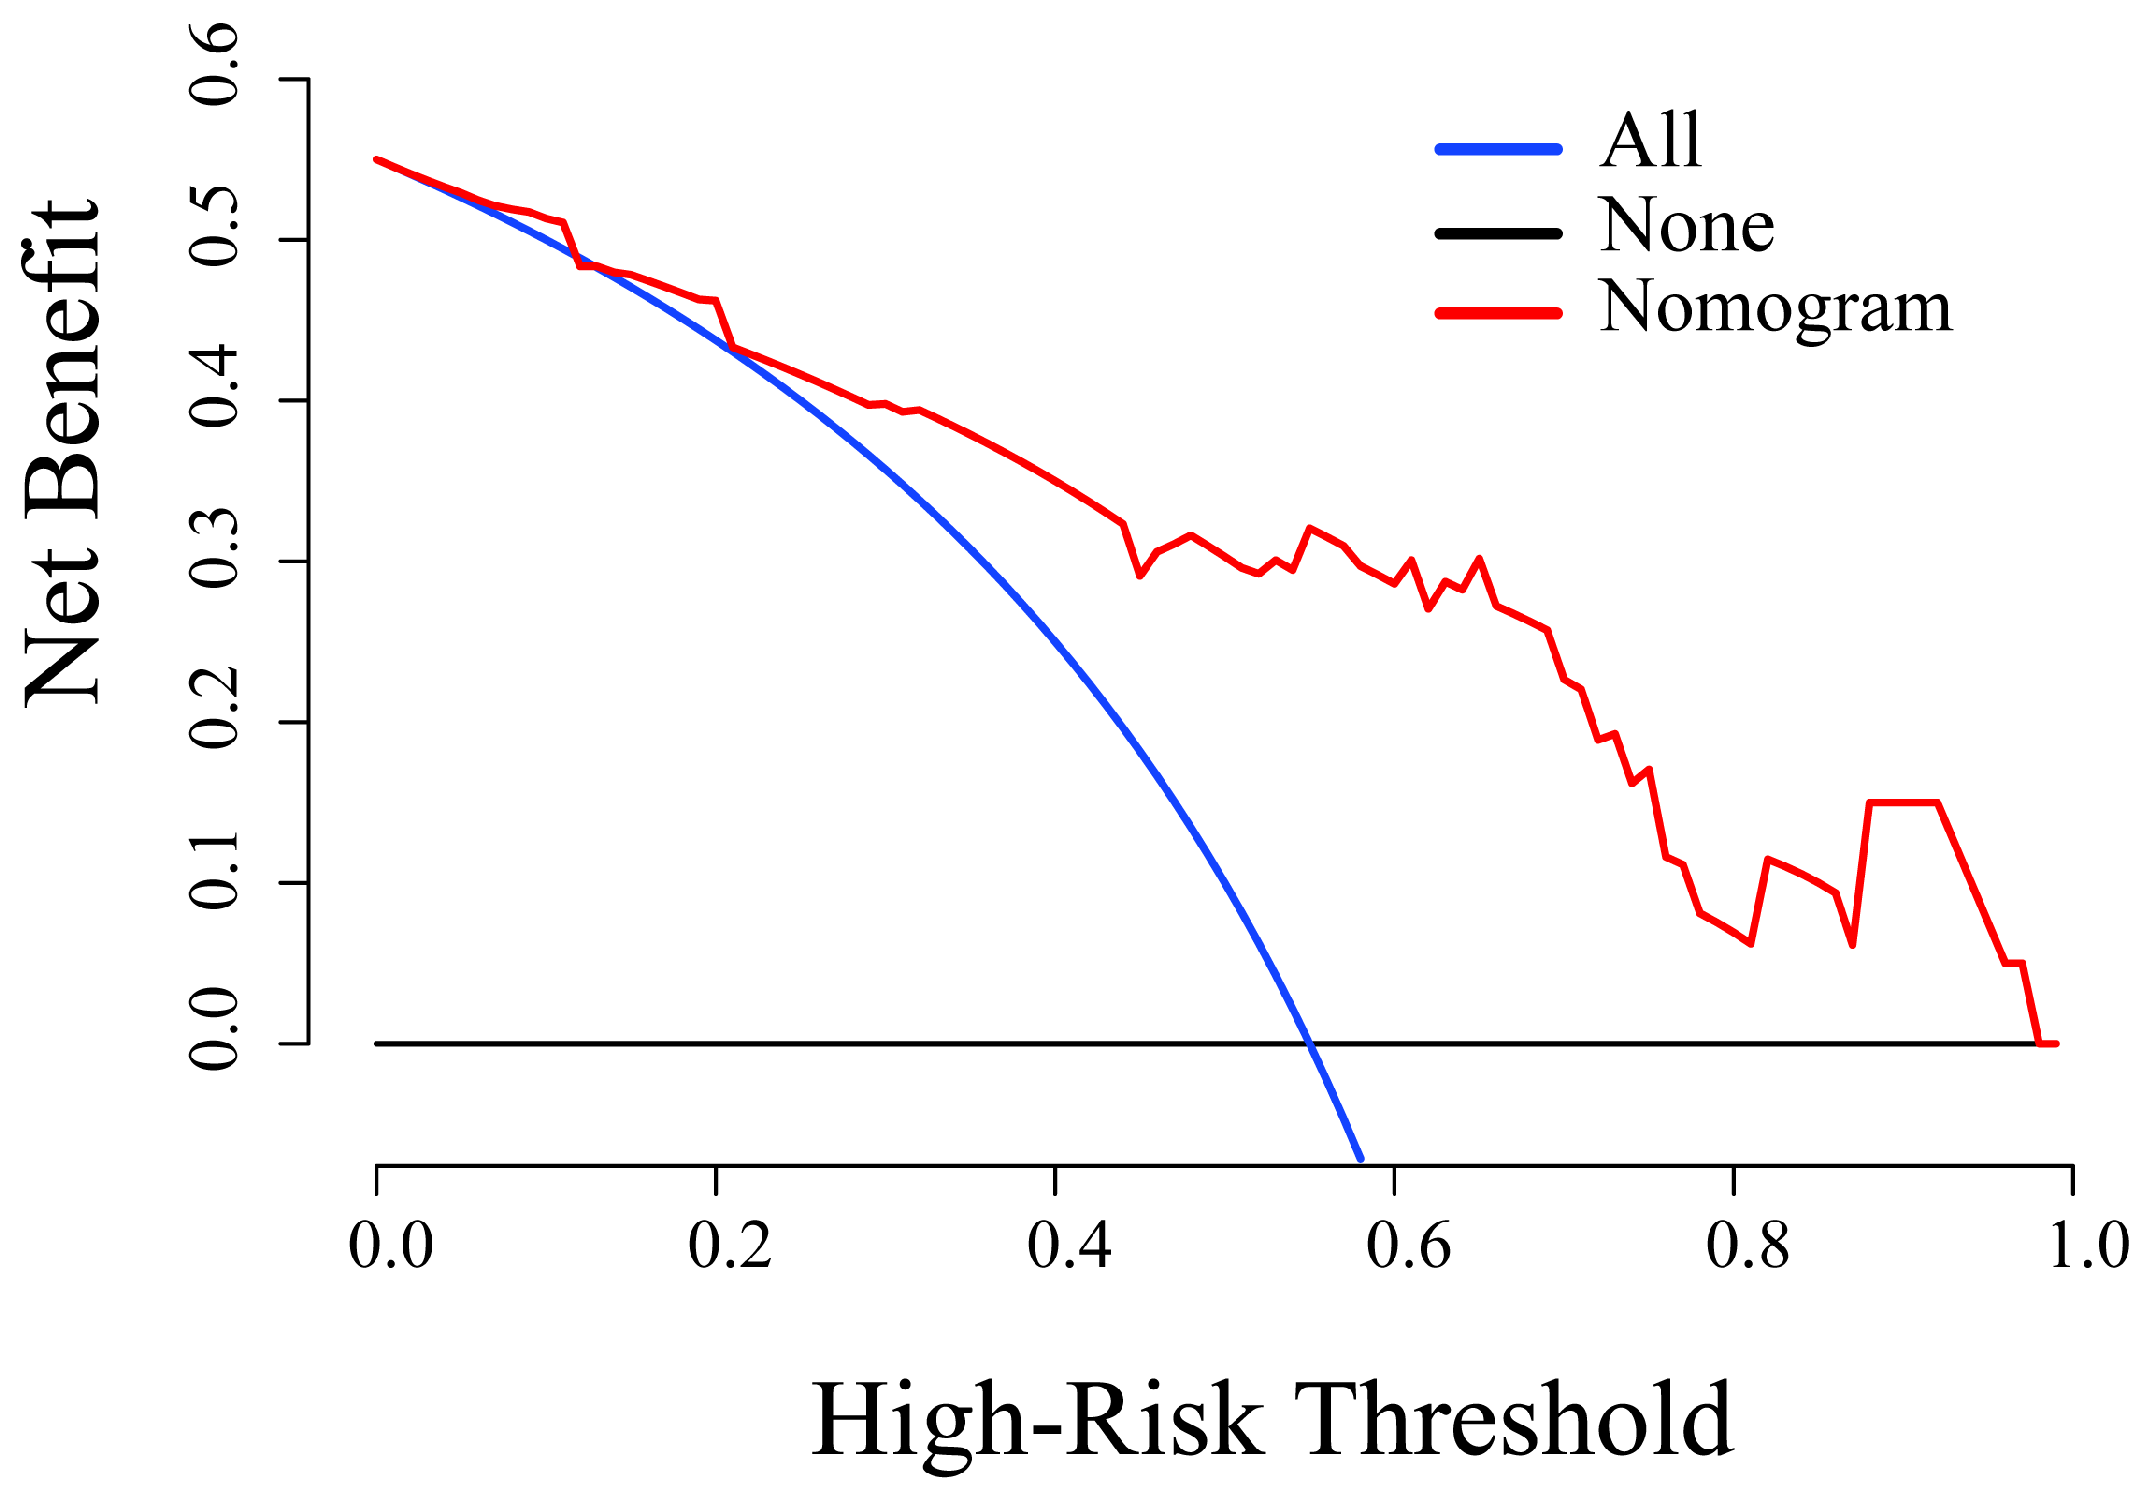
3.3. Radiomics Nomogram Establishment and Assessment
4. Discussion
5. Conclusions
Supplementary Materials
Author Contributions
Funding
Institutional Review Board Statement
Informed Consent Statement
Data Availability Statement
Conflicts of Interest
References
- Sung, H.; Ferlay, J.; Siegel, R.L.; Laversanne, M.; Soerjomataram, I.; Jemal, A.; Bray, F. Global Cancer Statistics 2020: GLOBOCAN Estimates of Incidence and Mortality Worldwide for 36 Cancers in 185 Countries. CA Cancer J. Clin. 2021, 71, 209–249. [Google Scholar] [CrossRef]
- Tamimi, R.M.; Colditz, G.A.; Hazra, A.; Baer, H.J.; Hankinson, S.E.; Rosner, B.; Marotti, J.; Connolly, J.L.; Schnitt, S.J.; Collins, L.C. Traditional breast cancer risk factors in relation to molecular subtypes of breast cancer. Breast Cancer Res. Treat. 2012, 131, 159–167. [Google Scholar] [CrossRef] [Green Version]
- Cameron, D.; Piccart-Gebhart, M.J.; Gelber, R.D.; Procter, M.; Goldhirsch, A.; de Azambuja, E.; Castro, G., Jr.; Untch, M.; Smith, I.; Gianni, L.; et al. 11 years’ follow-up of trastuzumab after adjuvant chemotherapy in HER2-positive early breast cancer: Final analysis of the HERceptin Adjuvant (HERA) trial. Lancet 2017, 389, 1195–1205. [Google Scholar] [CrossRef] [Green Version]
- Waks, A.G.; Winer, E.P. Breast Cancer Treatment: A Review. JAMA 2019, 321, 288–300. [Google Scholar] [CrossRef]
- Ruan, S.; Liu, Y.; Tang, X.; Yang, Z.; Huang, J.; Li, X.; Wu, N.; Deng, F.; Luo, S.; He, X.; et al. HER-2 status and its clinicopathologic significance in breast cancer in patients from southwest China: Re-evaluation of correlation between results from FISH and IHC. Int. J. Clin. Exp. Pathol. 2017, 10, 7270–7276. [Google Scholar]
- Guo, Q.; Chen, K.; Lin, X.; Su, Y.; Xu, R.; Dai, Y.; Qiu, C.; Song, X.; Mao, S.; Chen, Q. A nomogram to predict HER2 status in breast cancer patients with HER2-borderline disease as determined via immunohistochemistry. Oncotarget 2017, 8, 93492–93501. [Google Scholar] [CrossRef] [PubMed] [Green Version]
- Monticciolo, D.L.; Newell, M.S.; Moy, L.; Niell, B.; Monsees, B.; Sickles, E.A. Breast Cancer Screening in Women at Higher-Than-Average Risk: Recommendations From the ACR. J. Am. Coll. Radiol. 2018, 15, 408–414. [Google Scholar] [CrossRef]
- Bogner, W.; Pinker-Domenig, K.; Bickel, H.; Chmelik, M.; Weber, M.; Helbich, T.H.; Trattnig, S.; Gruber, S. Readout-segmented echo-planar imaging improves the diagnostic performance of diffusion-weighted MR breast examinations at 3.0 T. Radiology 2012, 263, 64–76. [Google Scholar] [CrossRef] [PubMed]
- Spick, C.; Bickel, H.; Pinker, K.; Bernathova, M.; Kapetas, P.; Woitek, R.; Clauser, P.; Polanec, S.H.; Rudas, M.; Bartsch, R.; et al. Diffusion-weighted MRI of breast lesions: A prospective clinical investigation of the quantitative imaging biomarker characteristics of reproducibility, repeatability, and diagnostic accuracy. NMR Biomed. 2016, 29, 1445–1453. [Google Scholar] [CrossRef]
- Ramalho, J.; Semelka, R.C.; Ramalho, M.; Nunes, R.H.; AlObaidy, M.; Castillo, M. Gadolinium-Based Contrast Agent Accumulation and Toxicity: An Update. AJNR Am. J. Neuroradiol. 2016, 37, 1192–1198. [Google Scholar] [CrossRef] [Green Version]
- Cheeney, S.; Rahbar, H.; Dontchos, B.N.; Javid, S.H.; Rendi, M.H.; Partridge, S.C. Apparent diffusion coefficient values may help predict which MRI-detected high-risk breast lesions will upgrade at surgical excision. J. Magn. Reson. Imaging 2017, 46, 1028–1036. [Google Scholar] [CrossRef] [PubMed]
- Rotili, A.; Trimboli, R.M.; Penco, S.; Pesapane, F.; Tantrige, P.; Cassano, E.; Sardanelli, F. Double reading of diffusion-weighted magnetic resonance imaging for breast cancer detection. Breast Cancer Res. Treat. 2020, 180, 111–120. [Google Scholar] [CrossRef]
- Partridge, S.C.; Nissan, N.; Rahbar, H.; Kitsch, A.E.; Sigmund, E.E. Diffusion-weighted breast MRI: Clinical applications and emerging techniques. J. Magn. Reson. Imaging 2017, 45, 337–355. [Google Scholar] [CrossRef]
- Kim, J.Y.; Kim, J.J.; Hwangbo, L.; Lee, J.W.; Lee, N.K.; Nam, K.J.; Choo, K.S.; Kang, T.; Park, H.; Son, Y.; et al. Diffusion-weighted MRI of estrogen receptor-positive, HER2-negative, node-negative breast cancer: Association between intratumoral heterogeneity and recurrence risk. Eur. Radiol. 2020, 30, 66–76. [Google Scholar] [CrossRef]
- Horvat, J.V.; Bernard-Davila, B.; Helbich, T.H.; Zhang, M.; Morris, E.A.; Thakur, S.B.; Ochoa-Albiztegui, R.E.; Leithner, D.; Marino, M.A.; Baltzer, P.A.; et al. Diffusion-weighted imaging (DWI) with apparent diffusion coefficient (ADC) mapping as a quantitative imaging biomarker for prediction of immunohistochemical receptor status, proliferation rate, and molecular subtypes of breast cancer. J. Magn. Reson. Imaging 2019, 50, 836–846. [Google Scholar] [CrossRef]
- Gillies, R.J.; Kinahan, P.E.; Hricak, H. Radiomics: Images Are More than Pictures, They Are Data. Radiology 2016, 278, 563–577. [Google Scholar] [CrossRef] [Green Version]
- Zhang, Y.; Zhu, Y.; Zhang, K.; Liu, Y.; Cui, J.; Tao, J.; Wang, Y.; Wang, S. Invasive ductal breast cancer: Preoperative predict Ki-67 index based on radiomics of ADC maps. Radiol. Med. 2020, 125, 109–116. [Google Scholar] [CrossRef]
- Hwang, K.T.; Kim, Y.A.; Kim, J.; Chu, A.J.; Chang, J.H.; Oh, S.W.; Hwang, K.R.; Chai, Y.J. The influences of peritumoral lymphatic invasion and vascular invasion on the survival and recurrence according to the molecular subtypes of breast cancer. Breast Cancer Res. Treat. 2017, 163, 71–82. [Google Scholar] [CrossRef] [PubMed]
- Ocaña, A.; Diez-Gónzález, L.; Adrover, E.; Fernández-Aramburo, A.; Pandiella, A.; Amir, E. Tumor-infiltrating lymphocytes in breast cancer: Ready for prime time? J. Clin. Oncol. 2015, 33, 1298–1299. [Google Scholar] [CrossRef] [Green Version]
- Uematsu, T. Focal breast edema associated with malignancy on T2-weighted images of breast MRI: Peritumoral edema, prepectoral edema, and subcutaneous edema. Breast Cancer 2015, 22, 66–70. [Google Scholar] [CrossRef] [PubMed]
- Fan, M.; He, T.; Zhang, P.; Zhang, J.; Li, L. Heterogeneity of Diffusion-Weighted Imaging in Tumours and the Surrounding Stroma for Prediction of Ki-67 Proliferation Status in Breast Cancer. Sci. Rep. 2017, 7, 2875. [Google Scholar] [CrossRef] [PubMed] [Green Version]
- Yin, J.D.; Song, L.R.; Lu, H.C.; Zheng, X. Prediction of different stages of rectal cancer: Texture analysis based on diffusion-weighted images and apparent diffusion coefficient maps. World J. Gastroenterol. 2020, 26, 2082–2096. [Google Scholar] [CrossRef] [PubMed]
- Mao, N.; Yin, P.; Li, Q.; Wang, Q.; Liu, M.; Ma, H.; Dong, J.; Che, K.; Wang, Z.; Duan, S.; et al. Radiomics nomogram of contrast-enhanced spectral mammography for prediction of axillary lymph node metastasis in breast cancer: A multicenter study. Eur. Radiol. 2020, 30, 6732–6739. [Google Scholar] [CrossRef]
- Chen, S.; Shu, Z.; Li, Y.; Chen, B.; Tang, L.; Mo, W.; Shao, G.; Shao, F. Machine Learning-Based Radiomics Nomogram Using Magnetic Resonance Images for Prediction of Neoadjuvant Chemotherapy Efficacy in Breast Cancer Patients. Front. Oncol. 2020, 10, 1410. [Google Scholar] [CrossRef]
- Yin, J.; Yang, J.; Han, L.; Guo, Q.; Zhang, W. Quantitative discrimination between invasive ductal carcinomas and benign lesions based on semi-automatic analysis of time intensity curves from breast dynamic contrast enhanced MRI. J. Exp. Clin. Cancer Res. 2015, 34, 24. [Google Scholar] [CrossRef] [PubMed] [Green Version]
- Liu, C.; Ding, J.; Spuhler, K.; Gao, Y.; Serrano Sosa, M.; Moriarty, M.; Hussain, S.; He, X.; Liang, C.; Huang, C. Preoperative prediction of sentinel lymph node metastasis in breast cancer by radiomic signatures from dynamic contrast-enhanced MRI. J. Magn. Reson. Imaging 2019, 49, 131–140. [Google Scholar] [CrossRef] [Green Version]
- Tunali, I.; Stringfield, O.; Guvenis, A.; Wang, H.; Liu, Y.; Balagurunathan, Y.; Lambin, P.; Gillies, R.J.; Schabath, M.B. Radial gradient and radial deviation radiomic features from pre-surgical CT scans are associated with survival among lung adenocarcinoma patients. Oncotarget 2017, 8, 96013–96026. [Google Scholar] [CrossRef] [PubMed] [Green Version]
- Collewet, G.; Strzelecki, M.; Mariette, F. Influence of MRI acquisition protocols and image intensity normalization methods on texture classification. Magn. Reson. Imaging 2004, 22, 81–91. [Google Scholar] [CrossRef]
- Li, C.; Song, L.; Yin, J. Intratumoral and Peritumoral Radiomics Based on Functional Parametric Maps from Breast DCE-MRI for Prediction of HER-2 and Ki-67 Status. J. Magn. Reson. Imaging 2021. [Google Scholar] [CrossRef]
- Braman, N.M.; Etesami, M.; Prasanna, P.; Dubchuk, C.; Gilmore, H.; Tiwari, P.; Plecha, D.; Madabhushi, A. Intratumoral and peritumoral radiomics for the pretreatment prediction of pathological complete response to neoadjuvant chemotherapy based on breast DCE-MRI. Breast Cancer Res. 2017, 19, 57. [Google Scholar] [CrossRef]
- Braman, N.; Prasanna, P.; Whitney, J.; Singh, S.; Beig, N.; Etesami, M.; Bates, D.D.B.; Gallagher, K.; Bloch, B.N.; Vulchi, M.; et al. Association of Peritumoral Radiomics With Tumor Biology and Pathologic Response to Preoperative Targeted Therapy for HER2 (ERBB2)-Positive Breast Cancer. JAMA Netw. Open 2019, 2, e192561. [Google Scholar] [CrossRef] [Green Version]
- Tang, T.Y.; Li, X.; Zhang, Q.; Guo, C.X.; Zhang, X.Z.; Lao, M.Y.; Shen, Y.N.; Xiao, W.B.; Ying, S.H.; Sun, K.; et al. Development of a Novel Multiparametric MRI Radiomic Nomogram for Preoperative Evaluation of Early Recurrence in Resectable Pancreatic Cancer. J. Magn. Reson. Imaging 2020, 52, 231–245. [Google Scholar] [CrossRef] [PubMed]
- Kan, Y.; Dong, D.; Zhang, Y.; Jiang, W.; Zhao, N.; Han, L.; Fang, M.; Zang, Y.; Hu, C.; Tian, J.; et al. Radiomic signature as a predictive factor for lymph node metastasis in early-stage cervical cancer. J. Magn. Reson. Imaging 2019, 49, 304–310. [Google Scholar] [CrossRef] [Green Version]
- Yu, X.; Song, W.; Guo, D.; Liu, H.; Zhang, H.; He, X.; Song, J.; Zhou, J.; Liu, X. Preoperative Prediction of Extramural Venous Invasion in Rectal Cancer: Comparison of the Diagnostic Efficacy of Radiomics Models and Quantitative Dynamic Contrast-Enhanced Magnetic Resonance Imaging. Front. Oncol. 2020, 10, 459. [Google Scholar] [CrossRef] [PubMed]
- Ren, C.; Zou, Y.; Zhang, X.; Li, K. Diagnostic value of diffusion-weighted imaging-derived apparent diffusion coefficient and its association with histological prognostic factors in breast cancer. Oncol. Lett. 2019, 18, 3295–3303. [Google Scholar] [CrossRef] [Green Version]
- Soysal, S.D.; Tzankov, A.; Muenst, S.E. Role of the Tumor Microenvironment in Breast Cancer. Pathobiology 2015, 82, 142–152. [Google Scholar] [CrossRef]
- Sun, Q.; Lin, X.; Zhao, Y.; Li, L.; Yan, K.; Liang, D.; Sun, D.; Li, Z.C. Deep Learning vs. Radiomics for Predicting Axillary Lymph Node Metastasis of Breast Cancer Using Ultrasound Images: Don’t Forget the Peritumoral Region. Front. Oncol. 2020, 10, 53. [Google Scholar] [CrossRef] [PubMed] [Green Version]
- Bouchbika, Z. Association between Overexpression of Her-2 and Other Clinicopathologic Prognostic Factors in Breast Cancer in Morocco. J. Cancer Ther. 2012, 03, 787–792. [Google Scholar] [CrossRef] [Green Version]
- Nie, P.; Yang, G.; Wang, Z.; Yan, L.; Miao, W.; Hao, D.; Wu, J.; Zhao, Y.; Gong, A.; Cui, J.; et al. A CT-based radiomics nomogram for differentiation of renal angiomyolipoma without visible fat from homogeneous clear cell renal cell carcinoma. Eur. Radiol. 2020, 30, 1274–1284. [Google Scholar] [CrossRef] [PubMed]
- Baltres, A.; Al Masry, Z.; Zemouri, R.; Valmary-Degano, S.; Arnould, L.; Zerhouni, N.; Devalland, C. Prediction of Oncotype DX recurrence score using deep multi-layer perceptrons in estrogen receptor-positive, HER2-negative breast cancer. Breast Cancer 2020, 27, 1007–1016. [Google Scholar] [CrossRef]
- Zemouri, R.; Zerhouni, N.; Racoceanu, D. Deep Learning in the Biomedical Applications: Recent and Future Status. Appl. Sci. 2019, 9, 1526. [Google Scholar] [CrossRef] [Green Version]
- Zemouri, R.; Devalland, C.; Valmary-Degano, S.; Zerhouni, N. Neural network: A future in pathology? Ann. Pathol. 2019, 39, 119–129. [Google Scholar] [CrossRef] [PubMed]
- Zemouri, R.; Omri, N.; Morello, B.; Devalland, C.; Fnaiech, F. Constructive Deep Neural Network for Breast Cancer Diagnosis. IFAC PapersOnLine 2018, 51, 98–103. [Google Scholar] [CrossRef]


| Category (Quantity) | Radiomic Features |
|---|---|
| Shape n = 14 a | Area, Perimeter, Sphericity, Elongation, Extent, Circularity, Solidity, Eccentricity, Equivalent diameter, Major axis length, Minor axis length, Perimeter to area ratio, Maximum 2D diameter, Spherical disproportion. |
| First-order statistics n = 5 b | Mean, Median, SD, Skewness, Kurtosis. |
| GLCM n = 45 c | Energy, Contrast, Correlation, Variance, Entropy, Homogeneity, Inverse difference moment, Information measures of correlation 1, Information measures of correlation 2. |
| Laws n = 125 c | Response to 5-pixel × 5-pixel filter targeting the specific texture enhancement patterns in the X and Y directions. 25 descriptors are derived from all combinations of five one-dimensional filters: level (L), edge (E), spot (S), wave (W), and ripple (R). L5 = (1 4 6 4 1), E5 = (−1 −2 0 2 1), S5 = (−1 0 2 0 −1), R5 = (1 −4 6 −4 1), and W5 = (−1 2 0 −2 −1). The 25 filters were L5L5, L5E5, L5S5, L5W5, L5R5, E5L5, E5E5, E5S5, E5W5, E5R5, S5L5, S5E5, S5S5, S5W5, S5R5, W5L5, W5E5, W5S5, W5W5, W5R5, R5L5, R5E5, R5S5, R5W5, and R5R5. |
| Gabor n = 240 c | Gabor wavelet is sensitive to image edge and has good spatial locality and directional selectivity and can grasp the spatial frequency (scale) and local structure characteristics of multiple directions in the local area of the image. Each descriptor quantifies response to a given Gabor filter at a specific frequency ( = 0, 2, 4, 8, 16, 32) and orientation (θ = 0°, 22.5°, 45°, 67.5°, 90°, 112.5°, 135°, 167.5°). |
| FISH Results | |||
|---|---|---|---|
| Characteristics | Positive HER-2 2+ (n = 97, 43.50%) | Negative HER-2 2+ (n = 126, 56.50%) | p Value |
| Age (%) | 0.866 | ||
| <40 years | 17 (17.53) | 21 (16.67) | |
| ≥40 years | 80 (82.47) | 105 (83.33) | |
| ER status (%) | <0.001 * | ||
| Negative | 39 (40.21) | 14 (11.11) | |
| Positive | 58 (59.79) | 112 (88.89) | |
| PR status (%) | <0.001 * | ||
| Negative | 38 (39.18) | 21 (16.67) | |
| Positive | 59 (60.82) | 105 (83.33) | |
| Ki-67 (%) | 0.002 * | ||
| <14% | 17 (17.53) | 46 (36.51) | |
| ≥14% | 80 (82.47) | 80 (63.49) | |
| Cohort | Intra-Rad-Score | Peri-Rad-Score | Com-Rad-Score | Radiomics Nomogram |
|---|---|---|---|---|
| Training cohort | ||||
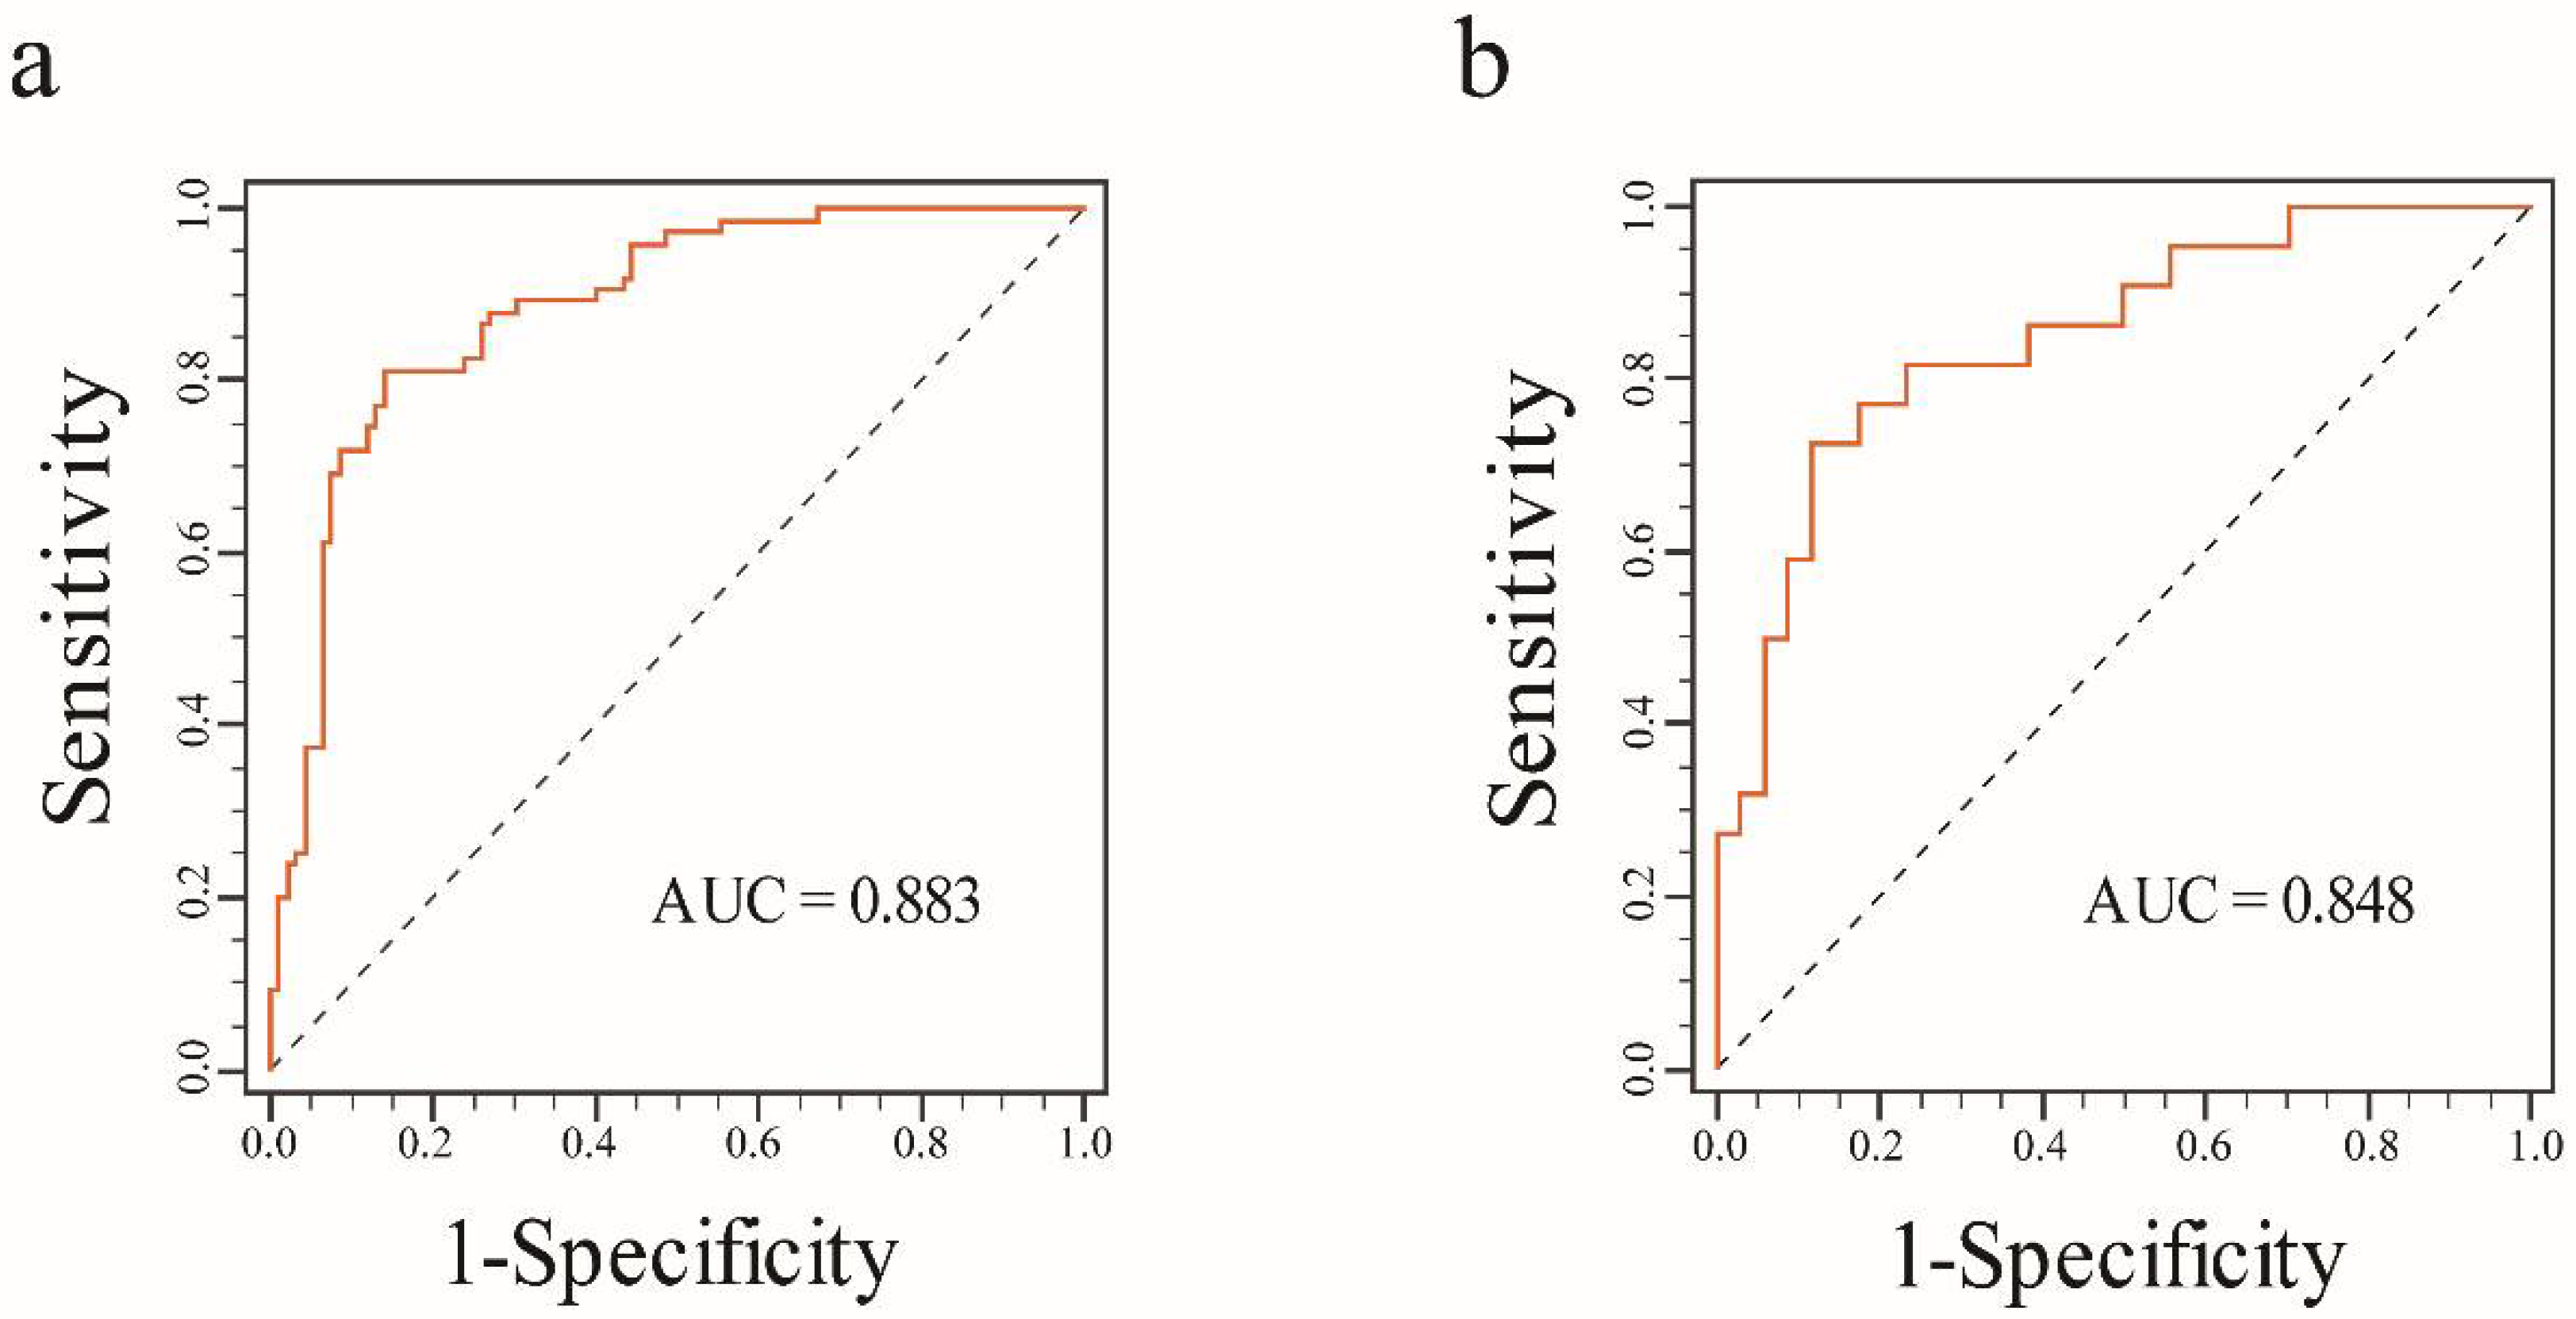
| AUC (95% CI) | 0.824 (0.769–0.884) | 0.794 (0.726–0.850) | 0.860 (0.824–0.925) | 0.883 (0.844–0.938) |
| Sensitivity (95% CI) | 0.920 (0.859–0.981) | 0.693 (0.589–0.798) | 0.840 (0.757–0.923) | 0.813 (0.725–0.902) |
| Specificity (95% CI) | 0.598 (0.498–0.698) | 0.750 (0.662–0.838) | 0.761 (0.674–0.848) | 0.859 (0.788–0.930) |
| Accuracy (95% CI) | 0.743 (0.740–0.745) | 0.725 (0.722–0.727) | 0.796 (0.795–0.798) | 0.838 (0.837–0.840) |
| Validation cohort | ||||
| AUC (95% CI) | 0.763 (0.631–0.867) | 0.731 (0.596–0.841) | 0.790 (0.661–0.887) | 0.848 (0.726–0.930) |
| Sensitivity (95% CI) | 0.864 (0.720–1.000) | 0.864 (0.720–1.000) | 0.636 (0.435–0.837) | 0.727 (0.541–0.913) |
| Specificity (95% CI) | 0.618 (0.454–0.781) | 0.559 (0.392–0.726) | 0.882 (0.774–0.991) | 0.882 (0.774–0.991) |
| Accuracy (95% CI) | 0.714 (0.707–0.721) | 0.679 (0.671–0.686) | 0.786 (0.780–0.792) | 0.821 (0.816–0.827) |
| Cohort | Models | Intra-Rad-Score | Peri-Rad-Score | Com-Rad-Score | Radiomics Nomogram |
|---|---|---|---|---|---|
| Training | Intra-rad-score | / | 0.476 | 0.182 | 0.053 |
| Peri-rad-score | 0.476 | / | 0.031 | 0.002 | |
| Com-rad-score | 0.182 | 0.031 | / | 0.068 | |
| Radiomics nomogram | 0.053 | 0.002 | 0.068 | / | |
| Validation | Intra-rad-score | / | 0.681 | 0.637 | 0.162 |
| Peri-rad-score | 0.681 | / | 0.370 | 0.082 | |
| Com-rad-score | 0.637 | 0.370 | / | 0.096 | |
| Radiomics nomogram | 0.162 | 0.082 | 0.096 | / |
| Univariate Analysis | Multivariate Analysis | |||
|---|---|---|---|---|
| Parameters | OR (95% CI) | p Value | OR (95% CI) | p Value |
| Age | ||||
| <40 years | 1 | |||
| ≥40 years | 1.126 (0.538–2.359) | 0.753 | ||
| ER status | ||||
| Negative | 1 | 1 | ||
| Positive | 5.480 (2.516–11.936) | <0.001 * | 8.255 (1.745–39.044) | 0.008 * |
| PR status | ||||
| Negative | 1 | 1 | ||
| Positive | 3.535 (1.743–7.169) | <0.001 * | 0.422 (0.096–1.860) | 0.254 |
| Ki-67 | ||||
| <14% | 1 | 1 | ||
| ≥14% | 0.447 (0.220–0.908) | 0.026 * | 0.589 (0.227–1.528) | 0.277 |
| Com-rad-score | 2.718 (1.975–3.741) | <0.001 * | 2.644 (1.888–3.702) | <0.001 * |
Publisher’s Note: MDPI stays neutral with regard to jurisdictional claims in published maps and institutional affiliations. |
© 2021 by the authors. Licensee MDPI, Basel, Switzerland. This article is an open access article distributed under the terms and conditions of the Creative Commons Attribution (CC BY) license (https://creativecommons.org/licenses/by/4.0/).
Share and Cite
Li, C.; Yin, J. Radiomics Nomogram Based on Radiomics Score from Multiregional Diffusion-Weighted MRI and Clinical Factors for Evaluating HER-2 2+ Status of Breast Cancer. Diagnostics 2021, 11, 1491. https://doi.org/10.3390/diagnostics11081491
Li C, Yin J. Radiomics Nomogram Based on Radiomics Score from Multiregional Diffusion-Weighted MRI and Clinical Factors for Evaluating HER-2 2+ Status of Breast Cancer. Diagnostics. 2021; 11(8):1491. https://doi.org/10.3390/diagnostics11081491
Chicago/Turabian StyleLi, Chunli, and Jiandong Yin. 2021. "Radiomics Nomogram Based on Radiomics Score from Multiregional Diffusion-Weighted MRI and Clinical Factors for Evaluating HER-2 2+ Status of Breast Cancer" Diagnostics 11, no. 8: 1491. https://doi.org/10.3390/diagnostics11081491