
The Applications of Artificial Intelligence in Chest Imaging of COVID-19 Patients: A Literature Review

 , , , ,
  and
and
Abstract
:1. Introduction
- For the diagnostic workup of COVID-19 when RT-PCR testing is not available; when RT-PCR testing is available, but results are delayed; and when initial RT-PCR testing is negative, but with high clinical suspicion of COVID-19. In addition to clinical and laboratory data for patients with suspected or confirmed COVID-19, not currently hospitalized and with mild symptoms in order to decide on hospital admission/home discharge or on regular ward admission/intensive care unit admission.
- In addition to clinical and laboratory data for therapeutic management of patients with suspected or confirmed COVID-19, currently hospitalized and with moderate to severe symptoms.
2. Search Strategy
- (1)
- What are the main indications for COVID-19 imaging?
- (2)
- What is the workflow followed in image elaboration for AI solutions?
- (3)
- Does DL improve the diagnostic abilities of radiologists in COVID-19 patients?
- (4)
- What are the other applications of AI in COVID-19 patients (apart from the identification of the lesions?
- (5)
- Are there any limitations for AI in this field?
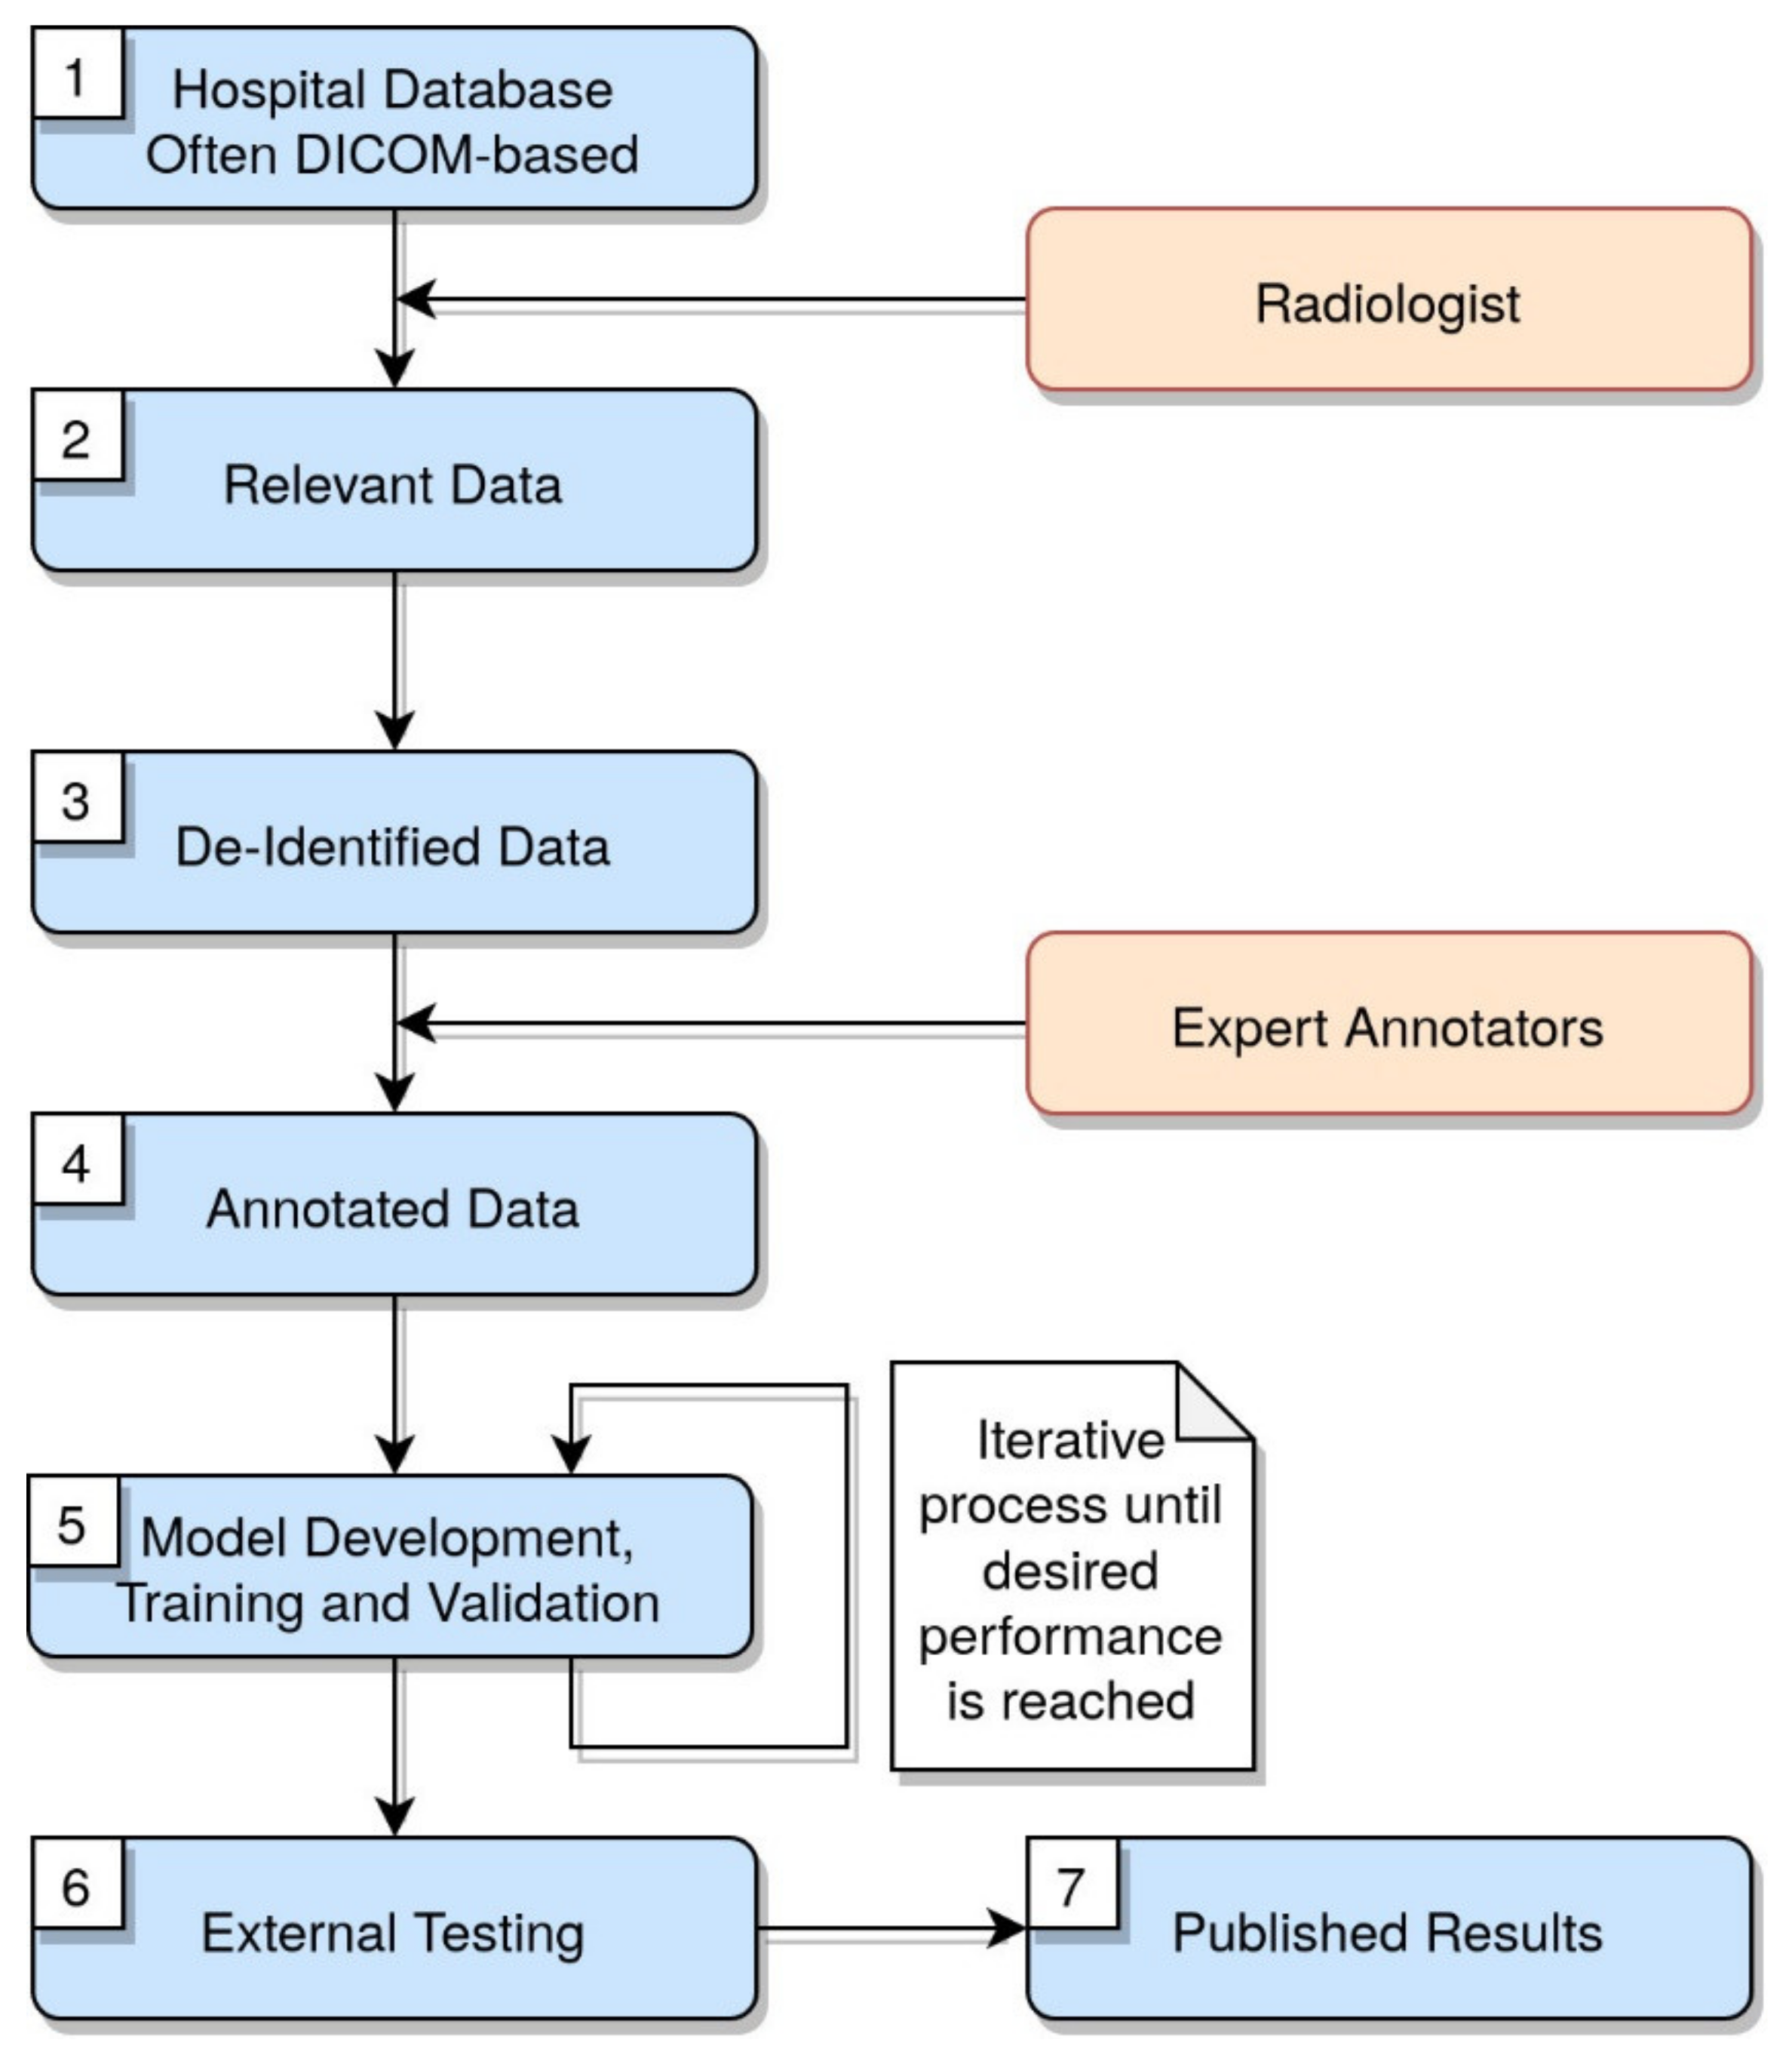
3. Workflow of Images Segmentation, Annotation and Elaboration
4. Artificial Intelligence in Chest X-ray
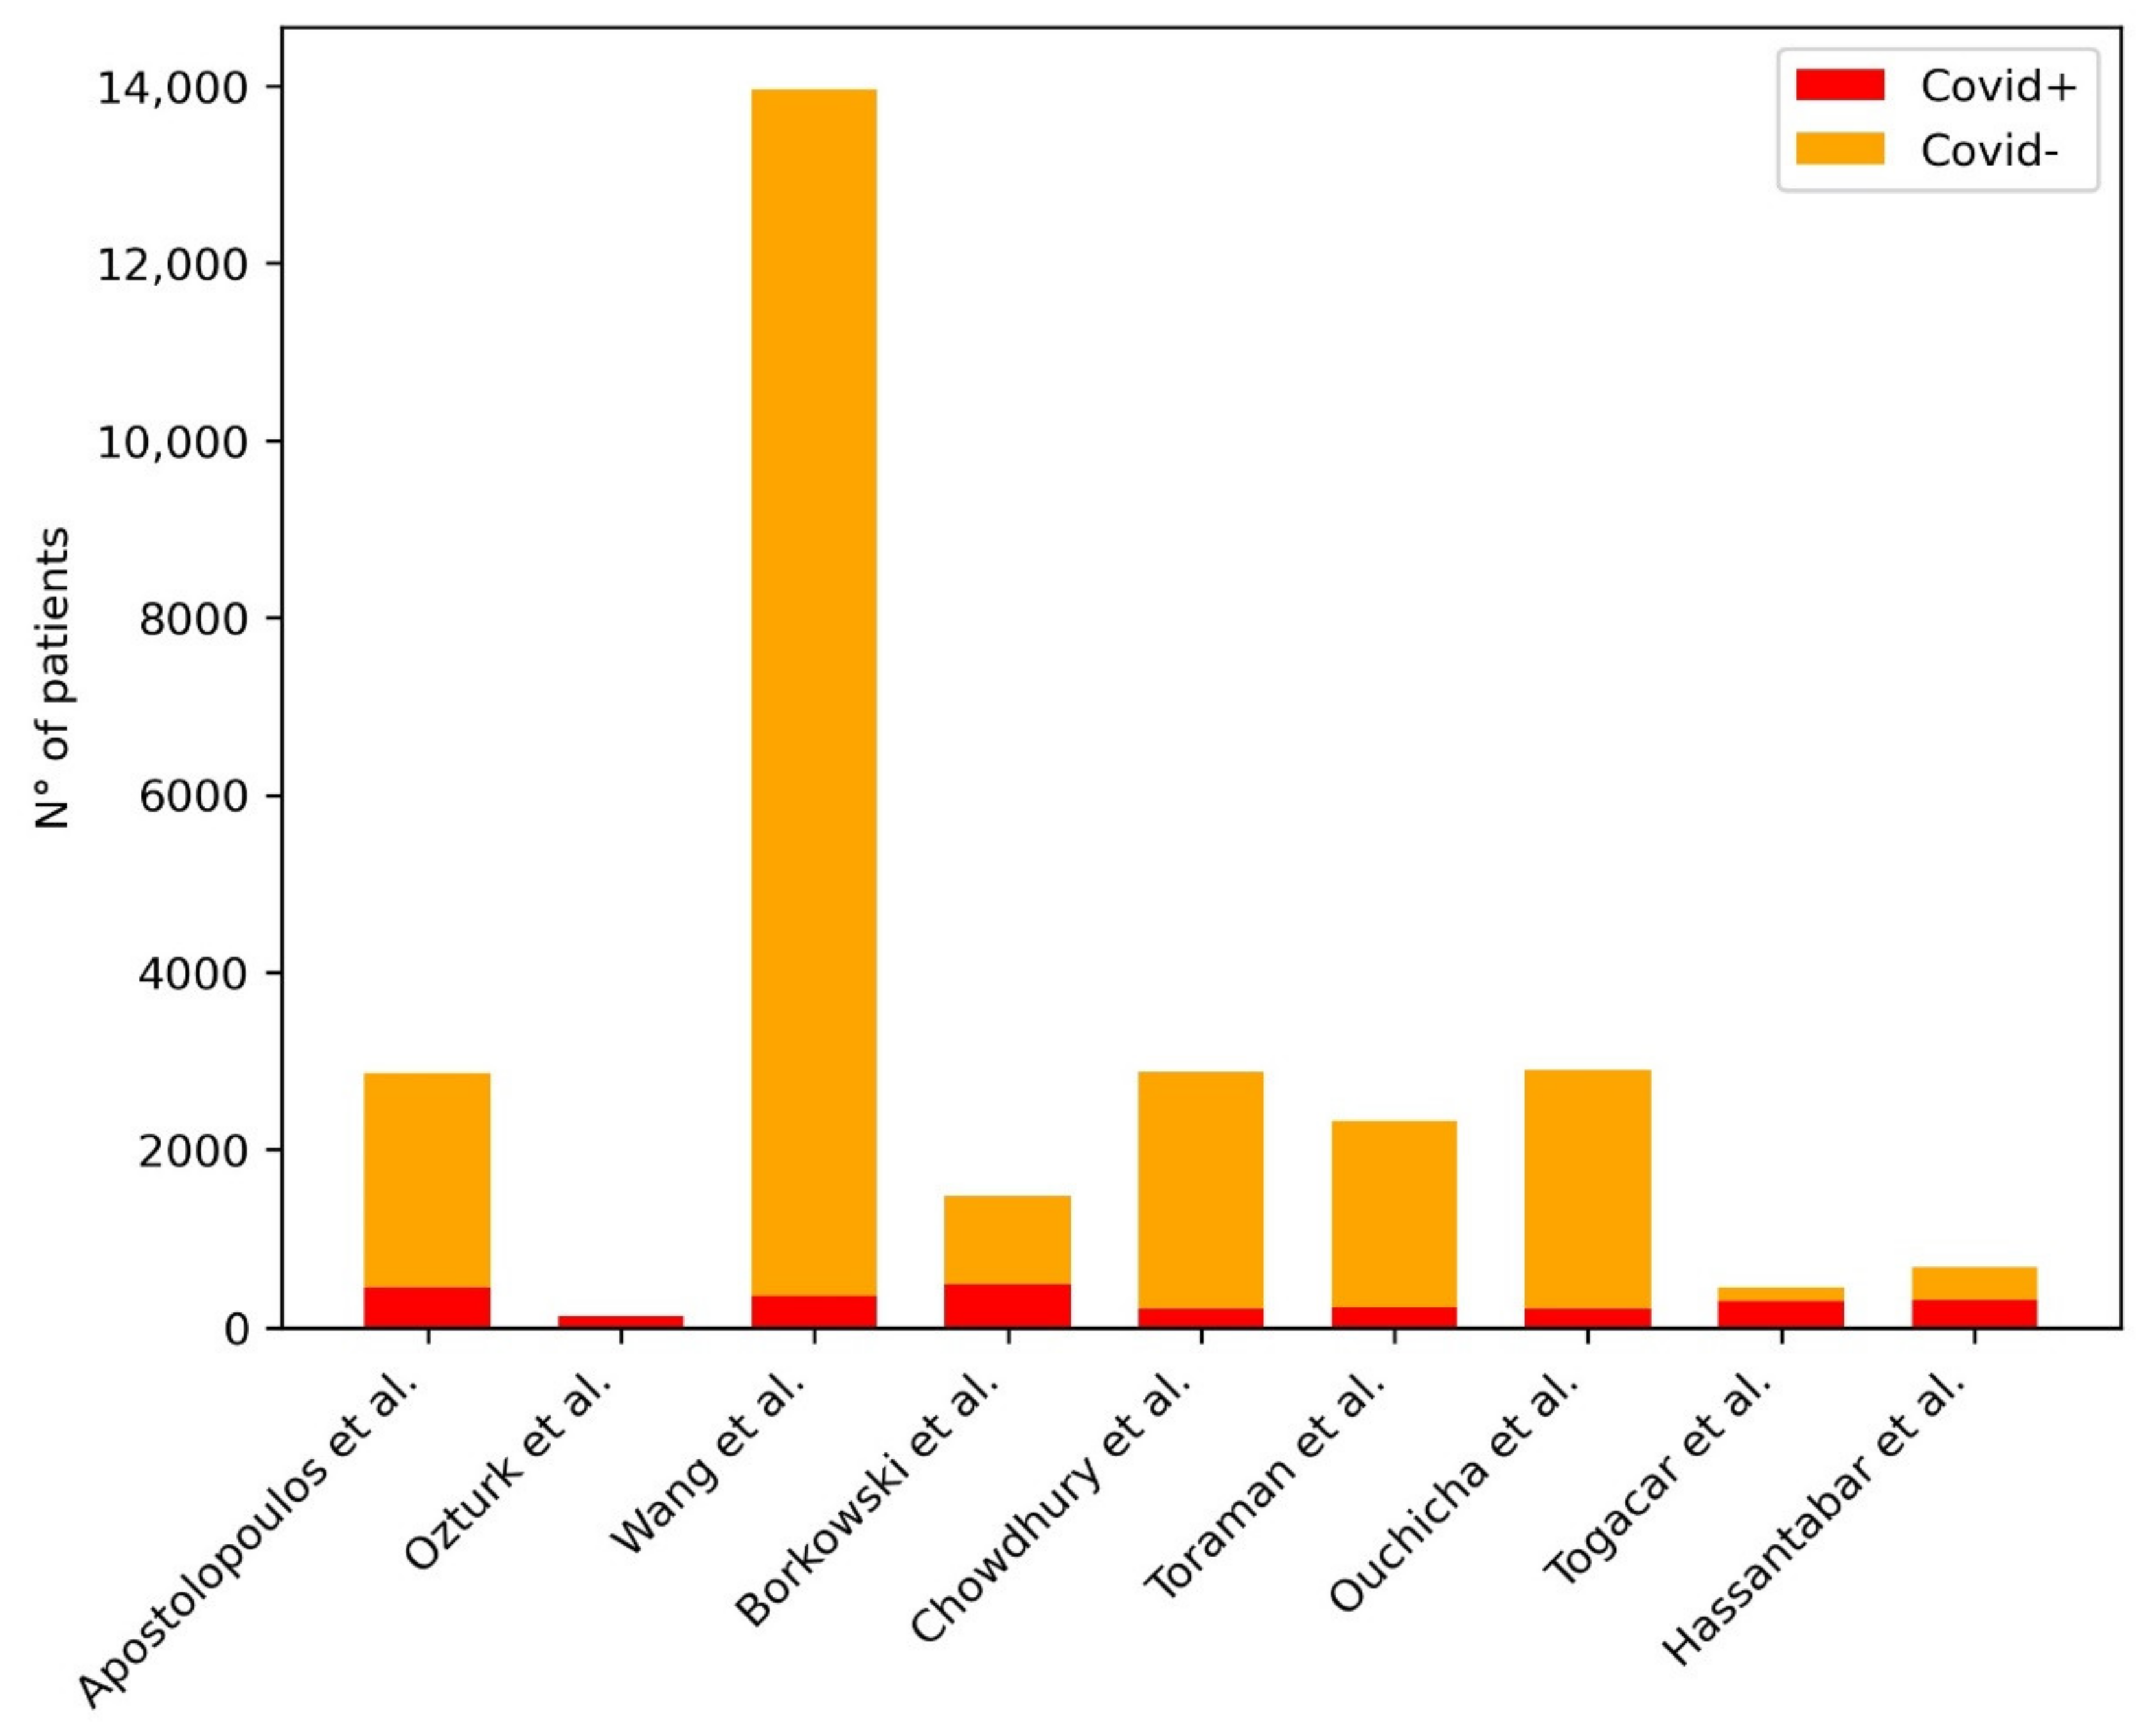
4.1. AI in the Identification of COVID-19 Pneumonia at Chest X-ray
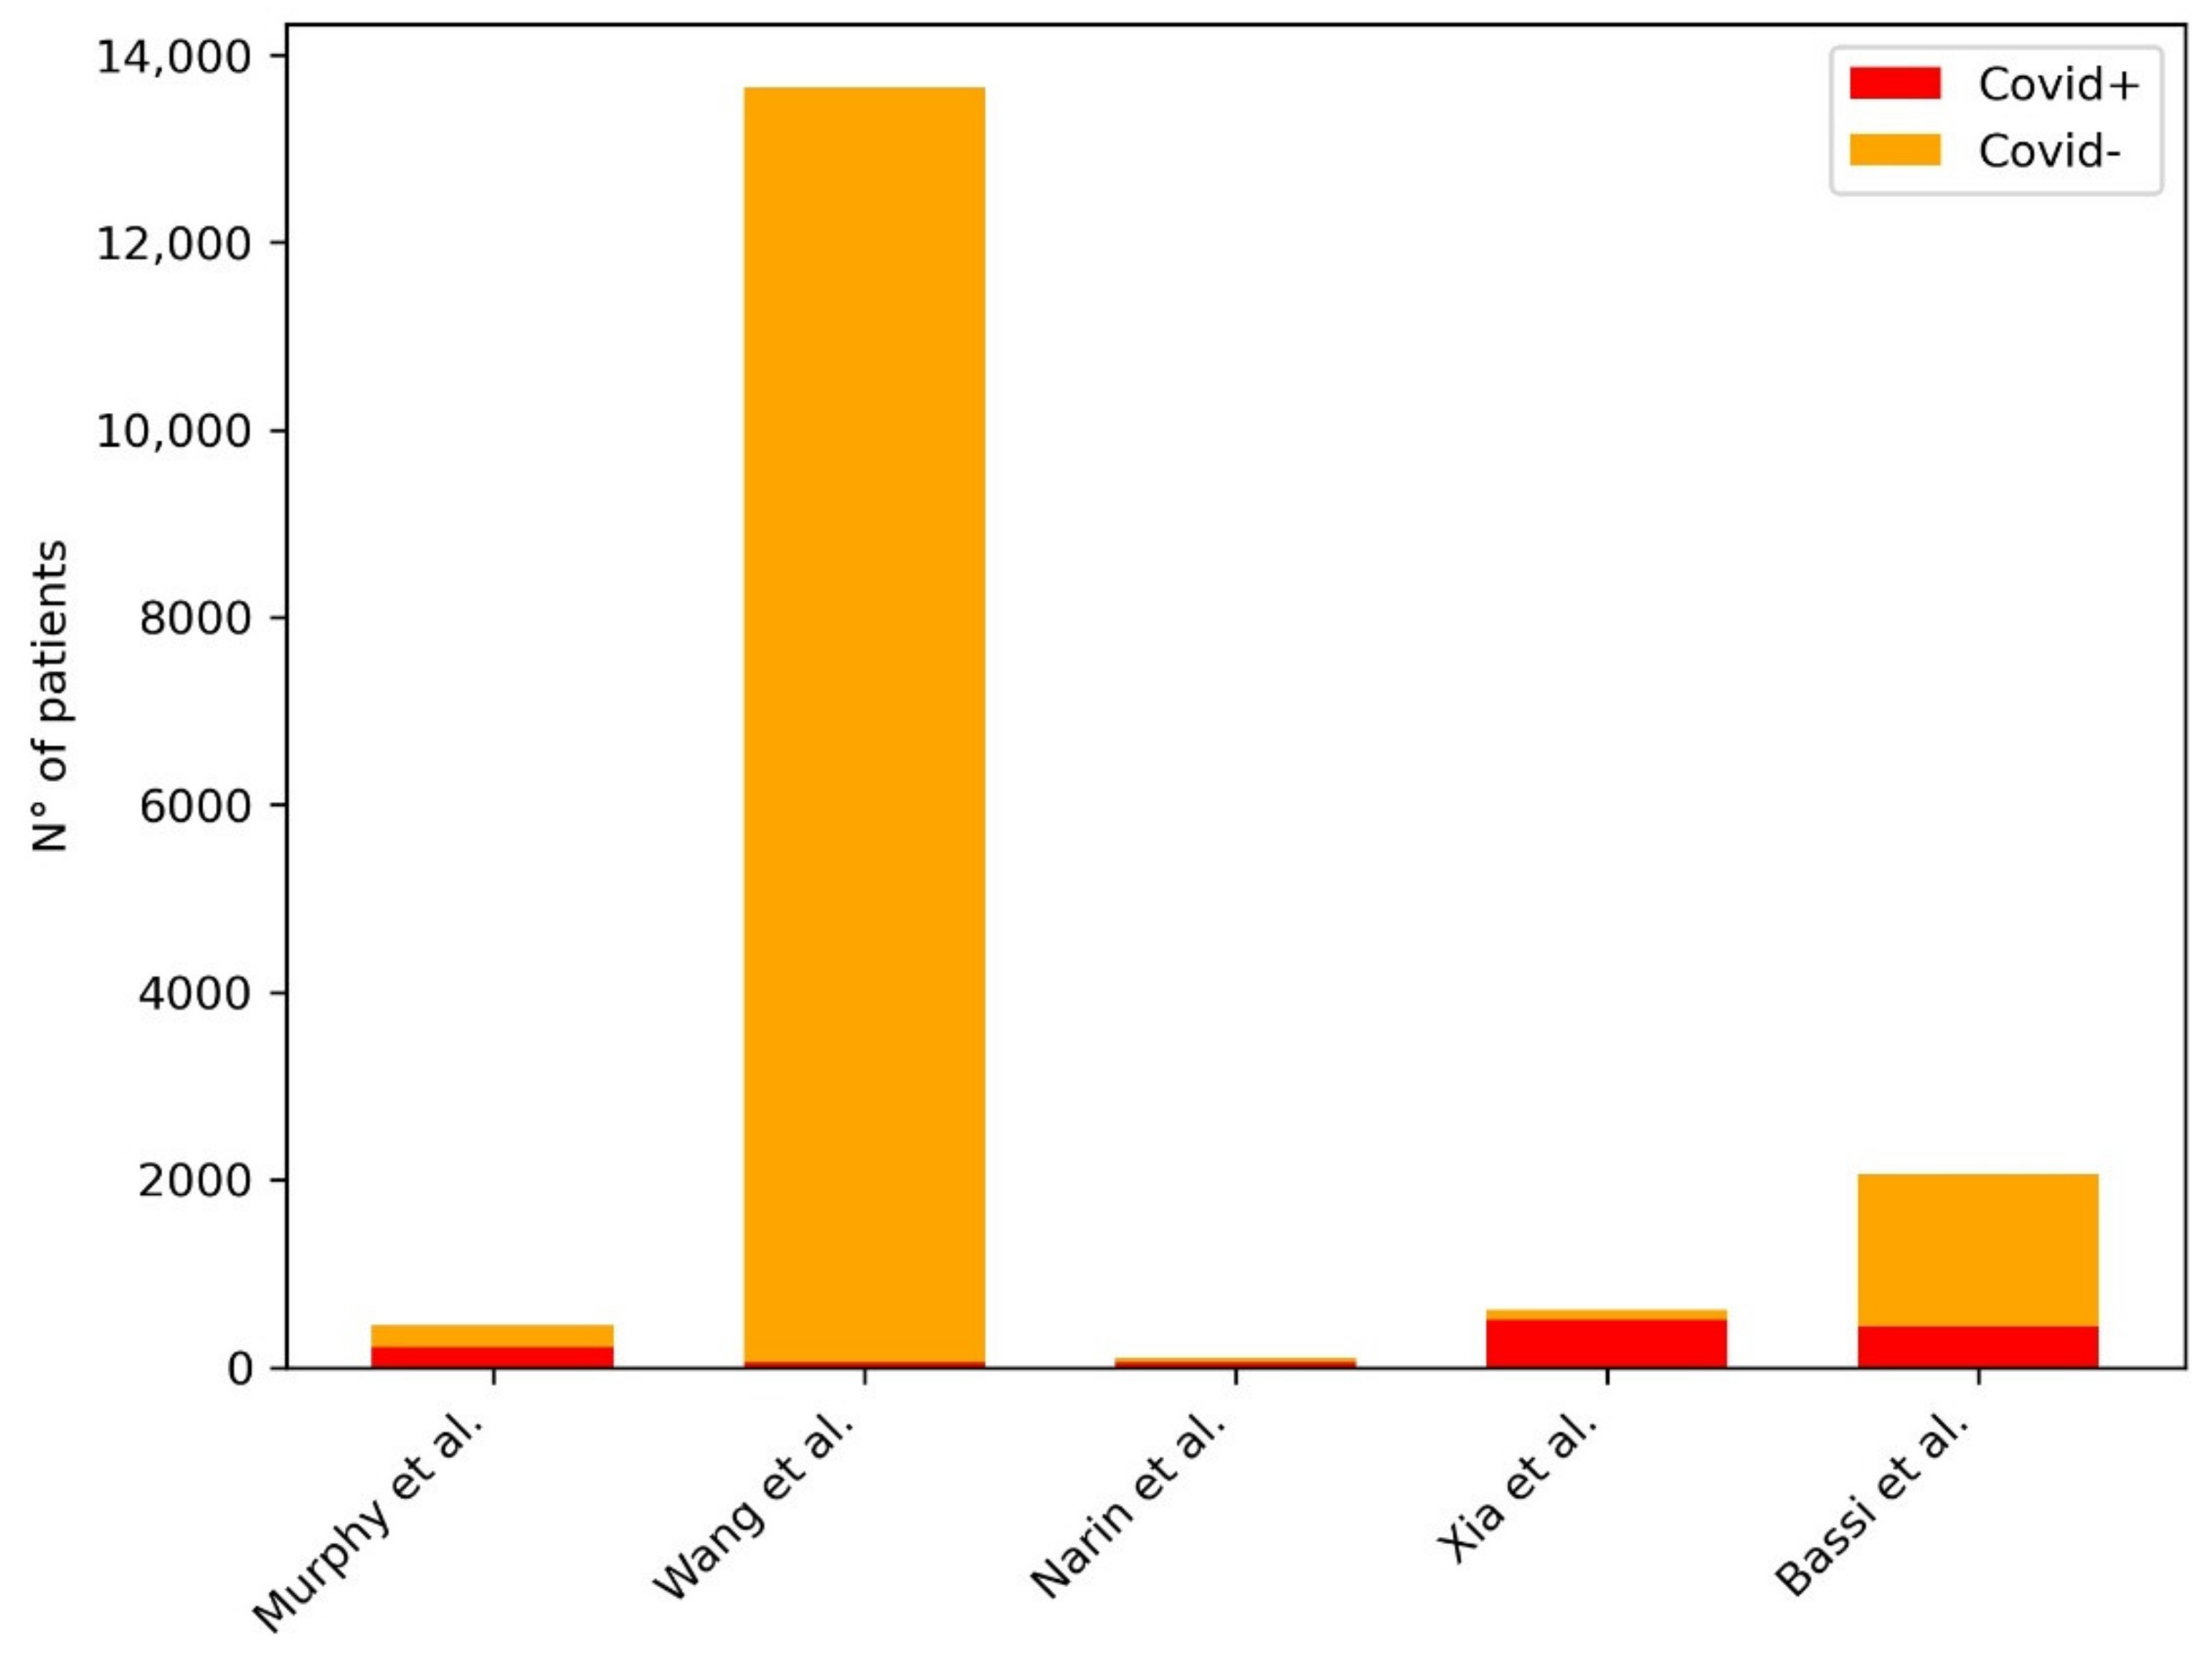
4.2. AI in the First Assessment of COVID-19 Pneumonia at Chest X-ray
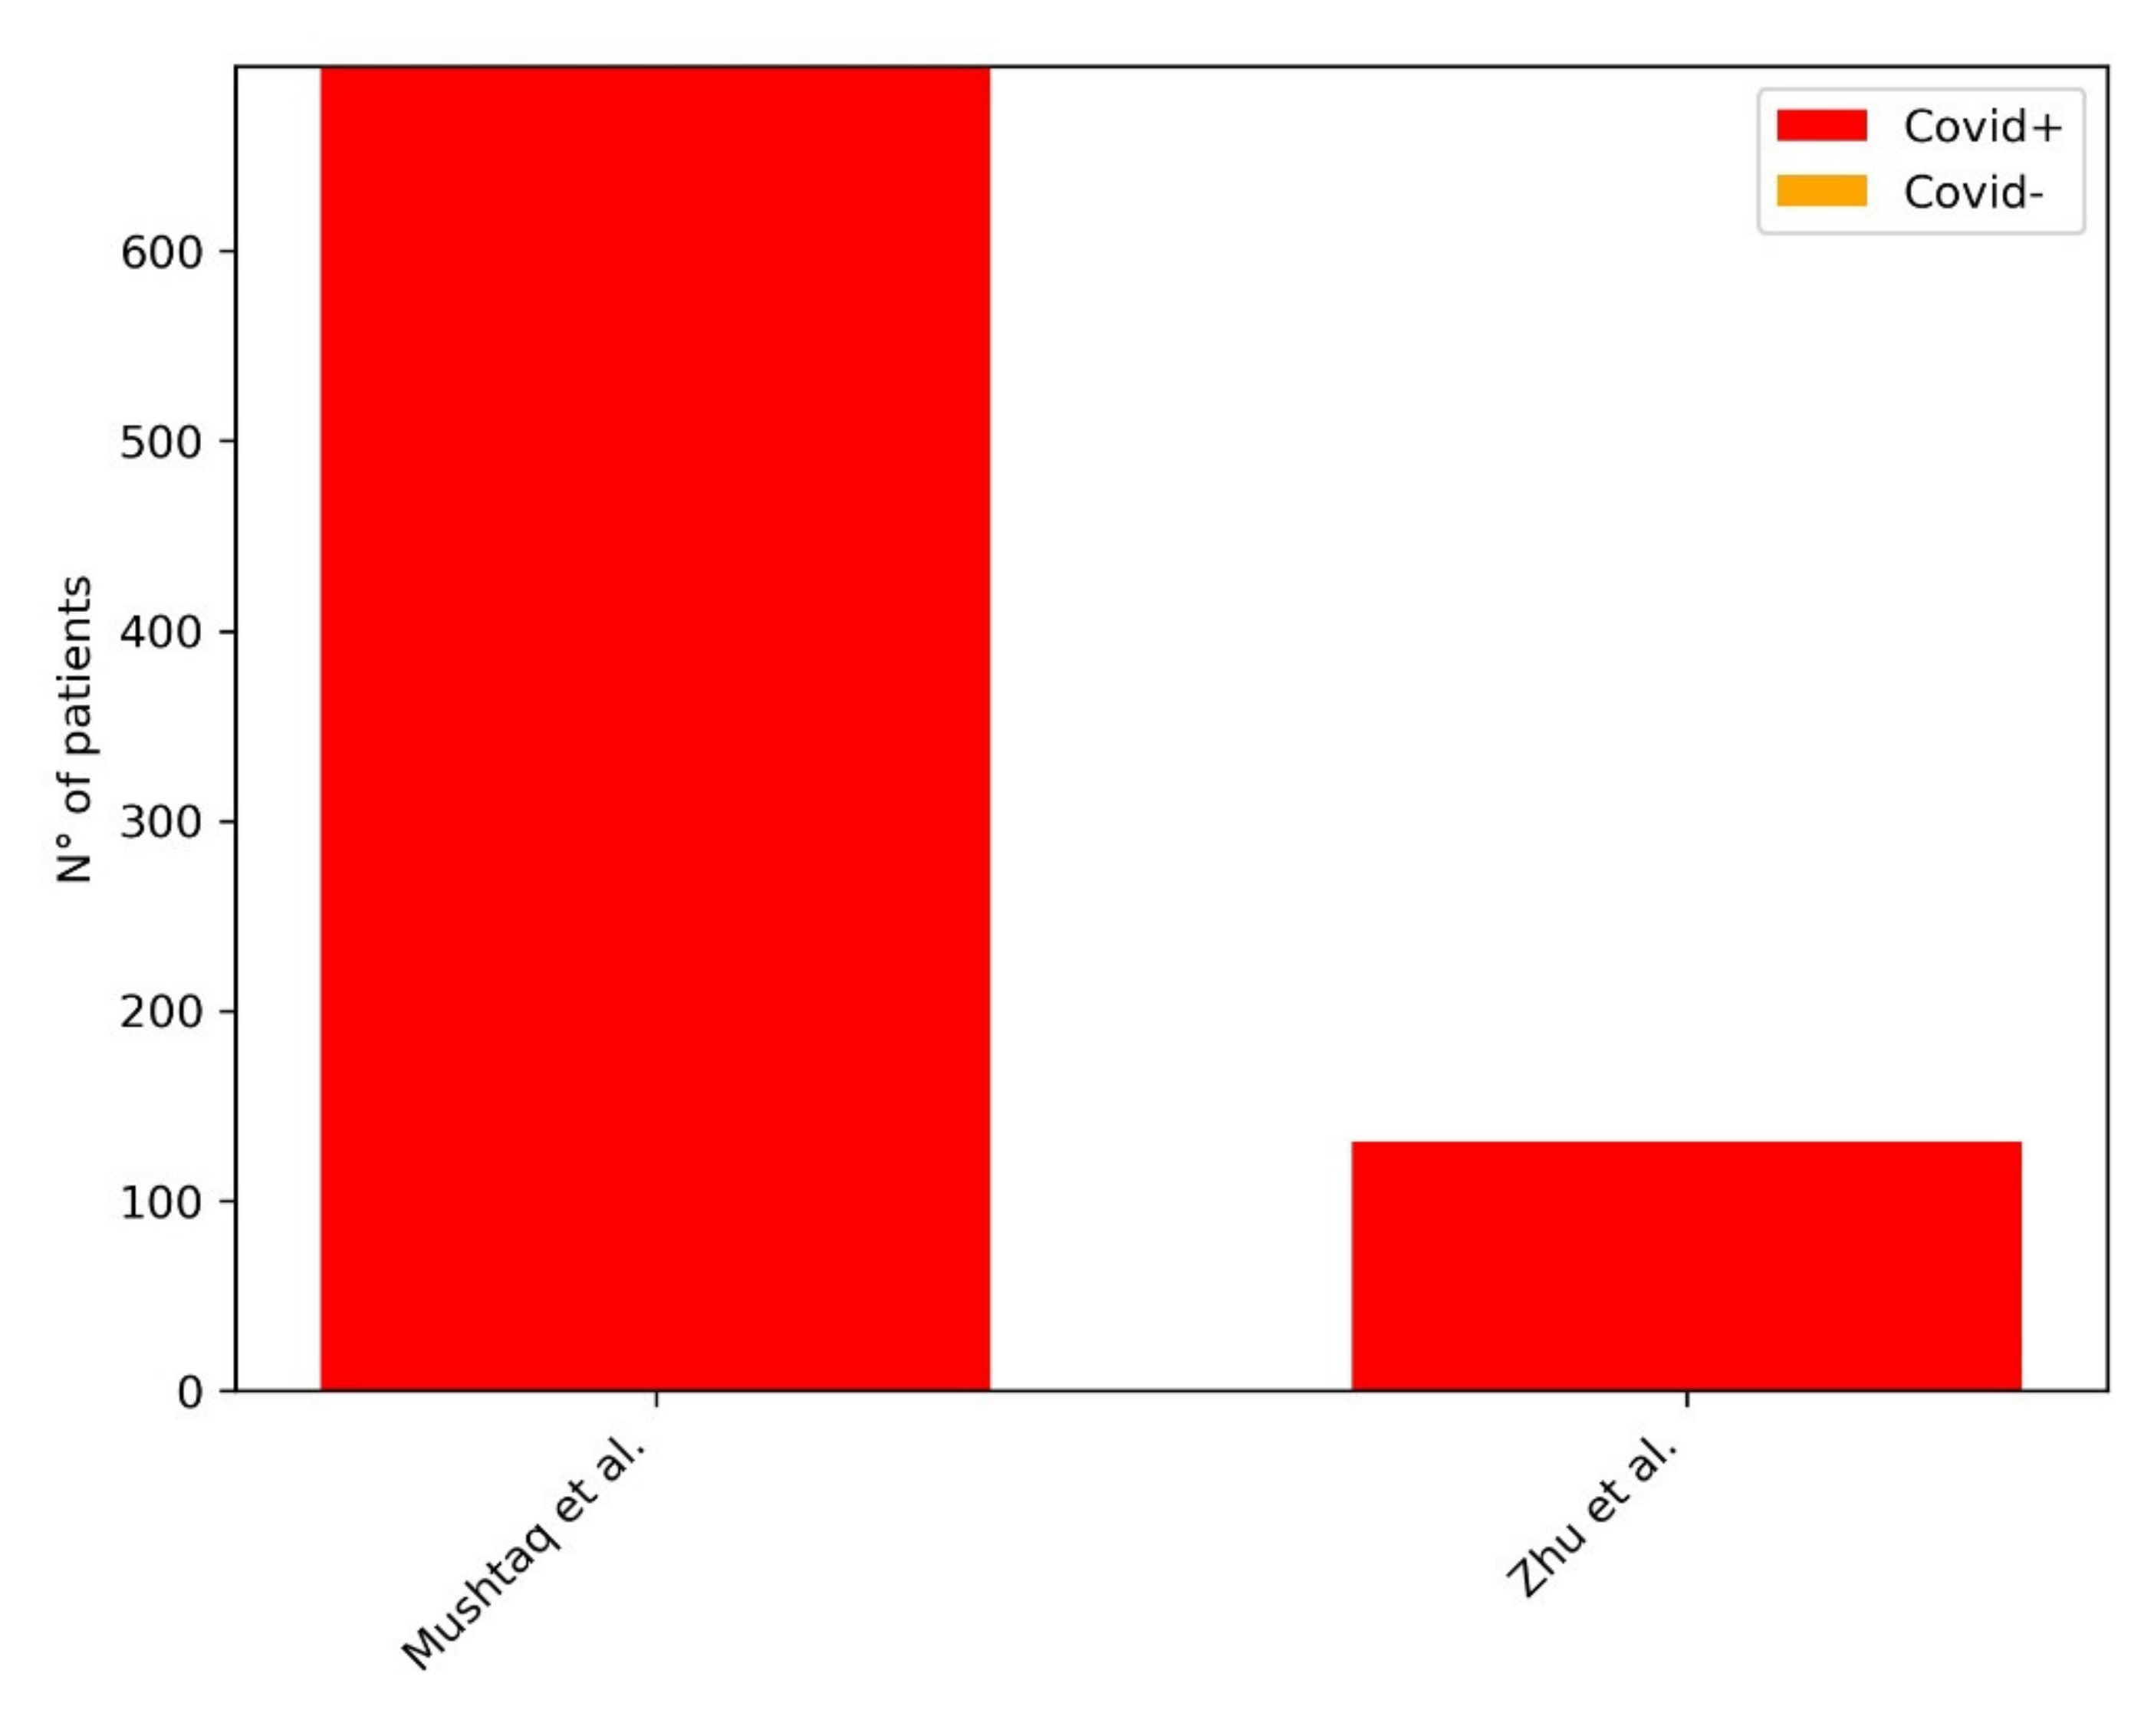
4.3. AI in the Stratification and Definition of Severity and Complications of COVID-19 Pneumonia at Chest X-ray
4.4. AI in the Differential Diagnosis of COVID-19 Pneumonia from Other Pneumonia at Chest X-ray
5. Artificial Intelligence in Chest CT
5.1. AI in the Identification of COVID-19 Pneumonia and Its Complications at Chest CT
5.2. AI in the Screening of COVID-19 Pneumonia at Chest CT
5.3. AI in the Stratification and Definition of Severity and Complications of COVID-19 Pneumonia at Chest CT
5.4. AI in the Differential Diagnosis of COVID-19 Pneumonia from Other Pneumonia at Chest CT
6. Computational Cost
7. Discussion
- a warning about using online repositories because of (1) the potential bias attributable to source issues and the inability to match demographics through populations (2) the possible overfitting on the shared dataset (3) the eventual low-resolution unbalanced across classes of the images of the shared dataset.
- to pay attention to CXRs projections (anteroposterior vs. posteroanterior) since models can wrongly correlate more severe disease to the view of the radiogram and not to the actual radiographic findings
- most studies did not report the timing between imaging and RT–PCR tests, since a negative RT–PCR test is a definitive exclusion criteria COVID-19 infection.
8. Conclusions
Author Contributions
Funding
Institutional Review Board Statement
Informed Consent Statement
Data Availability Statement
Conflicts of Interest
References
- Tan, B.S.; Dunnick, N.R.; Gangi, A.; Goergen, S.; Jin, Z.-Y.; Neri, E.; Nomura, C.H.; Pitcher, R.D.; Yee, J.; Mahmood, U. RSNA International Trends: A Global Perspective on the COVID-19 Pandemic and Radiology in Late 2020. Radiology 2021, 299, E193–E203. [Google Scholar] [CrossRef]
- Coppola, F.; Faggioni, L.; Neri, E.; Grassi, R.; Miele, V. Impact of the COVID-19 Outbreak on the Profession and Psychological Wellbeing of Radiologists: A Nationwide Online Survey. Insights Imaging 2021, 12, 23. [Google Scholar] [CrossRef] [PubMed]
- Akl, E.A.; Blažić, I.; Yaacoub, S.; Frija, G.; Chou, R.; Appiah, J.A.; Fatehi, M.; Flor, N.; Hitti, E.; Jafri, H.; et al. Use of Chest Imaging in the Diagnosis and Management of COVID-19: A WHO Rapid Advice Guide. Radiology 2021, 298, E63–E69. [Google Scholar] [CrossRef] [PubMed]
- Jacobi, A.; Chung, M.; Bernheim, A.; Eber, C. Portable Chest X-Ray in Coronavirus Disease-19 (COVID-19): A Pictorial Review. Clin. Imaging 2020, 64, 35–42. [Google Scholar] [CrossRef]
- Li, X.; Zeng, W.; Li, X.; Chen, H.; Shi, L.; Li, X.; Xiang, H.; Cao, Y.; Chen, H.; Liu, C.; et al. CT Imaging Changes of Corona Virus Disease 2019(COVID-19): A Multi-Center Study in Southwest China. J. Transl. Med. 2020, 18, 154. [Google Scholar] [CrossRef] [Green Version]
- Bao, C.; Liu, X.; Zhang, H.; Li, Y.; Liu, J. Coronavirus Disease 2019 (COVID-19) CT Findings: A Systematic Review and Meta-Analysis. J. Am. Coll. Radiol. 2020, 17, 701–709. [Google Scholar] [CrossRef] [PubMed]
- Cao, Y.; Liu, X.; Xiong, L.; Cai, K. Imaging and Clinical Features of Patients with 2019 Novel Coronavirus SARS-CoV-2: A Systematic Review and Meta-Analysis. J. Med. Virol. 2020, 92, 1449–1459. [Google Scholar] [CrossRef] [Green Version]
- Buonsenso, D.; Piano, A.; Raffaelli, F.; Bonadia, N.; de Gaetano Donati, K.; Franceschi, F. Point-of-Care Lung Ultrasound Findings in Novel Coronavirus Disease-19 Pnemoniae: A Case Report and Potential Applications during COVID-19 Outbreak. Eur. Rev. Med. Pharmacol. Sci. 2020, 24, 2776–2780. [Google Scholar] [CrossRef]
- Moore, S.; Gardiner, E. Point of Care and Intensive Care Lung Ultrasound: A Reference Guide for Practitioners during COVID-19. Radiography 2020, 26, e297–e302. [Google Scholar] [CrossRef] [PubMed]
- Soldati, G.; Smargiassi, A.; Inchingolo, R.; Buonsenso, D.; Perrone, T.; Briganti, D.F.; Perlini, S.; Torri, E.; Mariani, A.; Mossolani, E.E.; et al. Is There a Role for Lung Ultrasound During the COVID-19 Pandemic? J. Ultrasound Med. 2020, 39, 1459–1462. [Google Scholar] [CrossRef] [Green Version]
- Neri, E.; Coppola, F.; Miele, V.; Bibbolino, C.; Grassi, R. Artificial Intelligence: Who Is Responsible for the Diagnosis? Radiol. Med. 2020, 125, 517–521. [Google Scholar] [CrossRef] [PubMed] [Green Version]
- Neri, E.; Miele, V.; Coppola, F.; Grassi, R. Use of CT and Artificial Intelligence in Suspected or COVID-19 Positive Patients: Statement of the Italian Society of Medical and Interventional Radiology. Radiol. Med. 2020, 125, 505–508. [Google Scholar] [CrossRef]
- Grassi, R.; Belfiore, M.P.; Montanelli, A.; Patelli, G.; Urraro, F.; Giacobbe, G.; Fusco, R.; Granata, V.; Petrillo, A.; Sacco, P.; et al. COVID-19 Pneumonia: Computer-Aided Quantification of Healthy Lung Parenchyma, Emphysema, Ground Glass and Consolidation on Chest Computed Tomography (CT). Radiol. Med. 2021, 126, 553–560. [Google Scholar] [CrossRef]
- Scapicchio, C.; Gabelloni, M.; Barucci, A.; Cioni, D.; Saba, L.; Neri, E. A Deep Look into Radiomics. Radiol. Med. 2021. [Google Scholar] [CrossRef]
- Santos, M.K.; Ferreira Júnior, J.R.; Wada, D.T.; Tenório, A.P.M.; Barbosa, M.H.N.; Marques, P.M.D.A. Artificial Intelligence, Machine Learning, Computer-Aided Diagnosis, and Radiomics: Advances in Imaging towards to Precision Medicine. Radiol. Bras. 2019, 52, 387–396. [Google Scholar] [CrossRef] [Green Version]
- Ghaderzadeh, M.; Asadi, F. Deep Learning in the Detection and Diagnosis of COVID-19 Using Radiology Modalities: A Systematic Review. J. Healthc. Eng. 2021, 2021, 6677314. [Google Scholar] [CrossRef]
- Shi, F.; Wang, J.; Shi, J.; Wu, Z.; Wang, Q.; Tang, Z.; He, K.; Shi, Y.; Shen, D. Review of Artificial Intelligence Techniques in Imaging Data Acquisition, Segmentation, and Diagnosis for COVID-19. IEEE Rev. Biomed. Eng. 2021, 14, 4–15. [Google Scholar] [CrossRef] [Green Version]
- MIRC CTP—MircWiki. Available online: https://mircwiki.rsna.org/index.php?title=CTP-The_RSNA_Clinical_Trial_Processor (accessed on 8 April 2021).
- Cao, Y.; Xu, Z.; Feng, J.; Jin, C.; Han, X.; Wu, H.; Shi, H. Longitudinal Assessment of COVID-19 Using a Deep Learning–Based Quantitative CT Pipeline: Illustration of Two Cases. Radiol. Cardiothorac. Imaging 2020, 2, e200082. [Google Scholar] [CrossRef] [Green Version]
- Huang, L.; Han, R.; Ai, T.; Yu, P.; Kang, H.; Tao, Q.; Xia, L. Serial Quantitative Chest CT Assessment of COVID-19: A Deep Learning Approach. Radiol. Cardiothorac. Imaging 2020, 2, e200075. [Google Scholar] [CrossRef] [Green Version]
- Yue, H.; Yu, Q.; Liu, C.; Huang, Y.; Jiang, Z.; Shao, C.; Zhang, H.; Ma, B.; Wang, Y.; Xie, G.; et al. Machine Learning-Based CT Radiomics Method for Predicting Hospital Stay in Patients with Pneumonia Associated with SARS-CoV-2 Infection: A Multicenter Study. Ann. Transl. Med. 2020, 8, 859. [Google Scholar] [CrossRef]
- Gozes, O.; Frid-Adar, M.; Greenspan, H.; Browning, P.D.; Zhang, H.; Ji, W.; Bernheim, A.; Siegel, E. Rapid AI Development Cycle for the Coronavirus (COVID-19) Pandemic: Initial Results for Automated Detection & Patient Monitoring Using Deep Learning CT Image Analysis. arXiv 2020, arXiv:2003.05037. [Google Scholar]
- Tang, L.; Zhang, X.; Wang, Y.; Zeng, X. Severe COVID-19 Pneumonia: Assessing Inflammation Burden with Volume-Rendered Chest CT. Radiol. Cardiothorac. Imaging 2020, 2, e200044. [Google Scholar] [CrossRef] [Green Version]
- Shan, F.; Gao, Y.; Wang, J.; Shi, W.; Shi, N.; Han, M.; Xue, Z.; Shen, D.; Shi, Y. Abnormal Lung Quantification in Chest CT Images of COVID-19 Patients with Deep Learning and Its Application to Severity Prediction. Med. Phys. 2021, 48, 1633–1645. [Google Scholar] [CrossRef]
- Pan, S.J.; Yang, Q. A Survey on Transfer Learning. IEEE Trans. Knowl. Data Eng. 2010, 22, 1345–1359. [Google Scholar] [CrossRef]
- Sethy, P.K.; Behera, S.K. Detection of Coronavirus Disease (COVID-19) Based on Deep Features. Available online: https://www.preprints.org/manuscript/202003.0300/v1 (accessed on 8 April 2021).
- Apostolopoulos, I.D.; Mpesiana, T.A. Covid-19: Automatic Detection from X-Ray Images Utilizing Transfer Learning with Convolutional Neural Networks. Phys. Eng. Sci. Med. 2020, 43, 635–640. [Google Scholar] [CrossRef] [Green Version]
- Asif, S.; Wenhui, Y.; Jin, H.; Tao, Y.; Jinhai, S. Classification of COVID-19 from Chest X-Ray Images Using Deep Convolutional Neural Networks. In Proceedings of the 2020 IEEE 6th International Conference on Computer and Communications (ICCC), Chengdu, China, 11–14 December 2020. [Google Scholar]
- Chowdhury, M.E.H.; Rahman, T.; Khandakar, A.; Mazhar, R.; Kadir, M.A.; Mahbub, Z.B.; Islam, K.R.; Khan, M.S.; Iqbal, A.; Emadi, N.A.; et al. Can AI Help in Screening Viral and COVID-19 Pneumonia? IEEE Access 2020, 8, 132665–132676. [Google Scholar] [CrossRef]
- Islam, M.Z.; Islam, M.M.; Asraf, A. A Combined Deep CNN-LSTM Network for the Detection of Novel Coronavirus (COVID-19) Using X-Ray Images. Inform. Med. Unlocked 2020, 20, 100412. [Google Scholar] [CrossRef]
- Nour, M.; Cömert, Z.; Polat, K. A Novel Medical Diagnosis Model for COVID-19 Infection Detection Based on Deep Features and Bayesian Optimization. Appl. Soft Comput. 2020, 97, 106580. [Google Scholar] [CrossRef]
- Oh, Y.; Park, S.; Ye, J.C. Deep Learning COVID-19 Features on CXR Using Limited Training Data Sets. IEEE Trans. Med. Imaging 2020, 39, 2688–2700. [Google Scholar] [CrossRef]
- Ozturk, T.; Talo, M.; Yildirim, E.A.; Baloglu, U.B.; Yildirim, O.; Acharya, U.R. Automated Detection of COVID-19 Cases Using Deep Neural Networks with X-Ray Images. Comput. Biol. Med. 2020, 121, 103792. [Google Scholar] [CrossRef] [PubMed]
- Pereira, R.M.; Bertolini, D.; Teixeira, L.O.; Silla, C.N.; Costa, Y.M.G. COVID-19 Identification in Chest X-Ray Images on Flat and Hierarchical Classification Scenarios. Comput. Methods Programs Biomed. 2020, 194, 105532. [Google Scholar] [CrossRef]
- Wang, L.; Lin, Z.Q.; Wong, A. COVID-Net: A Tailored Deep Convolutional Neural Network Design for Detection of COVID-19 Cases from Chest X-Ray Images. Sci. Rep. 2020, 10, 19549. [Google Scholar] [CrossRef]
- Yoon, S.H.; Lee, K.H.; Kim, J.Y.; Lee, Y.K.; Ko, H.; Kim, K.H.; Park, C.M.; Kim, Y.H. Chest Radiographic and CT Findings of the 2019 Novel Coronavirus Disease (COVID-19): Analysis of Nine Patients Treated in Korea. Korean J. Radiol. 2020, 21, 494–500. [Google Scholar] [CrossRef]
- Wong, H.Y.F.; Lam, H.Y.S.; Fong, A.H.; Leung, S.T.; Chin, T.W.; Lo, C.S.Y.; Lui, M.M.; Lee, J.C.Y.; Chiu, K.W.; Chung, T.; et al. Frequency and Distribution of Chest Radiographic Findings in COVID-19 Positive Patients. Radiology 2020, 296, E72–E78. [Google Scholar] [CrossRef] [Green Version]
- Lomoro, P.; Verde, F.; Zerboni, F.; Simonetti, I.; Borghi, C.; Fachinetti, C.; Natalizi, A.; Martegani, A. COVID-19 Pneumonia Manifestations at the Admission on Chest Ultrasound, Radiographs, and CT: Single-Center Study and Comprehensive Radiologic Literature Review. European J. Radiol. Open 2020, 7, 100231. [Google Scholar] [CrossRef]
- Borkowski, A.A.; Viswanadhan, N.A.; Thomas, L.B.; Guzman, R.D.; Deland, L.A.; Mastorides, S.M. Using Artificial Intelligence for COVID-19 Chest X-Ray Diagnosis. Fed. Pract. 2020, 37, 398–404. [Google Scholar] [CrossRef]
- Chowdhury, N.K.; Rahman, M.M.; Kabir, M.A. PDCOVIDNet: A Parallel-Dilated Convolutional Neural Network Architecture for Detecting COVID-19 from Chest X-Ray Images. Health Inf. Sci. Syst. 2020, 8, 27. [Google Scholar] [CrossRef]
- Toraman, S.; Alakus, T.B.; Turkoglu, I. Convolutional Capsnet: A Novel Artificial Neural Network Approach to Detect COVID-19 Disease from X-Ray Images Using Capsule Networks. Chaos Solitons Fractals 2020, 140, 110122. [Google Scholar] [CrossRef]
- Ouchicha, C.; Ammor, O.; Meknassi, M. CVDNet: A Novel Deep Learning Architecture for Detection of Coronavirus (Covid-19) from Chest x-Ray Images. Chaos Solitons Fractals 2020, 140, 110245. [Google Scholar] [CrossRef]
- Kilicarslan, S.; Adem, K.; Celik, M. Diagnosis and Classification of Cancer Using Hybrid Model Based on ReliefF and Convolutional Neural Network. Med. Hypotheses 2020, 137, 109577. [Google Scholar] [CrossRef]
- Toğaçar, M.; Ergen, B.; Cömert, Z. COVID-19 Detection Using Deep Learning Models to Exploit Social Mimic Optimization and Structured Chest X-Ray Images Using Fuzzy Color and Stacking Approaches. Comput. Biol. Med. 2020, 121, 103805. [Google Scholar] [CrossRef]
- Özkaya, U.; Öztürk, Ş.; Budak, S.; Melgani, F. Classification of COVID-19 in Chest CT Images Using Convolutional Support Vector Machines. arXiv 2020, arXiv:2011.05746. [Google Scholar]
- Bassi, P.R.A.S.; Attux, R. A Deep Convolutional Neural Network for COVID-19 Detection Using Chest X-Rays. Res. Biomed. Eng. 2021. [Google Scholar] [CrossRef]
- Zhang, Y.-D.; Satapathy, S.C.; Liu, S.; Li, G.-R. A Five-Layer Deep Convolutional Neural Network with Stochastic Pooling for Chest CT-Based COVID-19 Diagnosis. Mach. Vis. Appl. 2021, 32, 14. [Google Scholar] [CrossRef] [PubMed]
- Ismael, A.M.; Şengür, A. The Investigation of Multiresolution Approaches for Chest X-Ray Image Based COVID-19 Detection. Health Inf. Sci. Syst. 2020, 8, 29. [Google Scholar] [CrossRef]
- Hassantabar, S.; Ahmadi, M.; Sharifi, A. Diagnosis and Detection of Infected Tissue of COVID-19 Patients Based on Lung x-Ray Image Using Convolutional Neural Network Approaches. Chaos Solitons Fractals 2020, 140, 110170. [Google Scholar] [CrossRef] [PubMed]
- Sahlol, A.T.; Yousri, D.; Ewees, A.A.; Al-Qaness, M.A.A.; Damasevicius, R.; Elaziz, M.A. COVID-19 Image Classification Using Deep Features and Fractional-Order Marine Predators Algorithm. Sci. Rep. 2020, 10, 15364. [Google Scholar] [CrossRef] [PubMed]
- Sule, W.F.; Oluwayelu, D.O. Real-Time RT-PCR for COVID-19 Diagnosis: Challenges and Prospects. Pan Afr. Med. J. 2020, 35, 121. [Google Scholar] [CrossRef] [PubMed]
- Murphy, K.; Smits, H.; Knoops, A.J.G.; Korst, M.B.J.M.; Samson, T.; Scholten, E.T.; Schalekamp, S.; Schaefer-Prokop, C.M.; Philipsen, R.H.H.M.; Meijers, A.; et al. COVID-19 on Chest Radiographs: A Multireader Evaluation of an Artificial Intelligence System. Radiology 2020, 296, E166–E172. [Google Scholar] [CrossRef]
- Wang, L.; Wong, A. COVID-Net: A Tailored Deep Convolutional Neural Network Design for Detection of COVID-19 Cases from Chest Radiography Images. arXiv 2020, arXiv:abs/2003.09871. [Google Scholar]
- Narin, A.; Kaya, C.; Pamuk, Z. Automatic Detection of Coronavirus Disease (COVID-19) Using X-Ray Images and Deep Convolutional Neural Networks. arXiv 2020, arXiv:abs/2003.10849. [Google Scholar]
- Zhang, J.; Xie, Y.; Li, Y.; Shen, C.; Xia, Y. COVID-19 Screening on Chest X-Ray Images Using Deep Learning Based Anomaly Detection. arXiv 2020, arXiv:2003.12338. [Google Scholar]
- Xia, Y.; Chen, W.; Ren, H.; Zhao, J.; Wang, L.; Jin, R.; Zhou, J.; Wang, Q.; Yan, F.; Zhang, B.; et al. A Rapid Screening Classifier for Diagnosing COVID-19. Int. J. Biol. Sci. 2021, 17, 539–548. [Google Scholar] [CrossRef] [PubMed]
- Salehi, S.; Abedi, A.; Balakrishnan, S.; Gholamrezanezhad, A. Coronavirus Disease 2019 (COVID-19) Imaging Reporting and Data System (COVID-RADS) and Common Lexicon: A Proposal Based on the Imaging Data of 37 Studies. Eur. Radiol. 2020, 30, 4930–4942. [Google Scholar] [CrossRef]
- Toussie, D.; Voutsinas, N.; Finkelstein, M.; Cedillo, M.A.; Manna, S.; Maron, S.Z.; Jacobi, A.; Chung, M.; Bernheim, A.; Eber, C.; et al. Clinical and Chest Radiography Features Determine Patient Outcomes in Young and Middle-Aged Adults with COVID-19. Radiology 2020, 297, E197–E206. [Google Scholar] [CrossRef] [PubMed]
- Li, M.D.; Little, B.P.; Alkasab, T.K.; Mendoza, D.P.; Succi, M.D.; Shepard, J.-A.O.; Lev, M.H.; Kalpathy-Cramer, J. Multi-Radiologist User Study for Artificial Intelligence-Guided Grading of COVID-19 Lung Disease Severity on Chest Radiographs. Acad. Radiol. 2021, 28, 572–576. [Google Scholar] [CrossRef] [PubMed]
- Li, M.D.; Arun, N.T.; Gidwani, M.; Chang, K.; Deng, F.; Little, B.P.; Mendoza, D.P.; Lang, M.; Lee, S.I.; O’Shea, A.; et al. Automated Assessment and Tracking of COVID-19 Pulmonary Disease Severity on Chest Radiographs Using Convolutional Siamese Neural Networks. Radiol. Artif. Intell. 2020, 2, e200079. [Google Scholar] [CrossRef] [PubMed]
- Mushtaq, J.; Pennella, R.; Lavalle, S.; Colarieti, A.; Steidler, S.; Martinenghi, C.M.A.; Palumbo, D.; Esposito, A.; Rovere-Querini, P.; Tresoldi, M.; et al. Initial Chest Radiographs and Artificial Intelligence (AI) Predict Clinical Outcomes in COVID-19 Patients: Analysis of 697 Italian Patients. Eur. Radiol. 2021, 31, 1770–1779. [Google Scholar] [CrossRef]
- Zhu, J.; Shen, B.; Abbasi, A.; Hoshmand-Kochi, M.; Li, H.; Duong, T.Q. Deep Transfer Learning Artificial Intelligence Accurately Stages COVID-19 Lung Disease Severity on Portable Chest Radiographs. PLoS ONE 2020, 15, e0236621. [Google Scholar] [CrossRef]
- Varela-Santos, S.; Melin, P. A New Approach for Classifying Coronavirus COVID-19 Based on Its Manifestation on Chest X-Rays Using Texture Features and Neural Networks. Inf. Sci. 2021, 545, 403–414. [Google Scholar] [CrossRef]
- Bai, H.X.; Hsieh, B.; Xiong, Z.; Halsey, K.; Choi, J.W.; Tran, T.M.L.; Pan, I.; Shi, L.-B.; Wang, D.-C.; Mei, J.; et al. Performance of Radiologists in Differentiating COVID-19 from Non-COVID-19 Viral Pneumonia at Chest CT. Radiology 2020, 296, E46–E54. [Google Scholar] [CrossRef]
- Jin, W.; Dong, S.; Dong, C.; Ye, X. Hybrid Ensemble Model for Differential Diagnosis between COVID-19 and Common Viral Pneumonia by Chest X-Ray Radiograph. Comput. Biol. Med. 2021, 131, 104252. [Google Scholar] [CrossRef]
- Sharma, A.; Rani, S.; Gupta, D. Artificial Intelligence-Based Classification of Chest X-Ray Images into COVID-19 and Other Infectious Diseases. Int. J. Biomed. Imaging 2020, 2020, 8889023. [Google Scholar] [CrossRef]
- Tsiknakis, N.; Trivizakis, E.; Vassalou, E.E.; Papadakis, G.Z.; Spandidos, D.A.; Tsatsakis, A.; Sánchez-García, J.; López-González, R.; Papanikolaou, N.; Karantanas, A.H.; et al. Interpretable Artificial Intelligence Framework for COVID-19 Screening on Chest X-Rays. Exp. Ther. Med. 2020, 20, 727–735. [Google Scholar] [CrossRef] [PubMed]
- Fleishon, H.; Haffty, B. Comments of the American College of Radiology Regarding the Evolving Role of Artificial Intelligence in Radiological Imaging 2020. Available online: https://www.acr.org/-/media/ACR/NOINDEX/Advocacy/acr_rsna_comments_fda-ai-evolvingrole-ws_6-30-2020.pdf (accessed on 8 April 2021).
- Li, D.; Wang, D.; Dong, J.; Wang, N.; Huang, H.; Xu, H.; Xia, C. False-Negative Results of Real-Time Reverse-Transcriptase Polymerase Chain Reaction for Severe Acute Respiratory Syndrome Coronavirus 2: Role of Deep-Learning-Based CT Diagnosis and Insights from Two Cases. Korean J. Radiol. 2020, 21, 505–508. [Google Scholar] [CrossRef] [PubMed]
- Dong, D.; Tang, Z.; Wang, S.; Hui, H.; Gong, L.; Lu, Y.; Xue, Z.; Liao, H.; Chen, F.; Yang, F.; et al. The Role of Imaging in the Detection and Management of COVID-19: A Review. IEEE Rev. Biomed. Eng. 2021, 14, 16–29. [Google Scholar] [CrossRef]
- Anastasopoulos, C.; Weikert, T.; Yang, S.; Abdulkadir, A.; Schmülling, L.; Bühler, C.; Paciolla, F.; Sexauer, R.; Cyriac, J.; Nesic, I.; et al. Development and Clinical Implementation of Tailored Image Analysis Tools for COVID-19 in the Midst of the Pandemic: The Synergetic Effect of an Open, Clinically Embedded Software Development Platform and Machine Learning. Eur. J. Radiol. 2020, 131, 109233. [Google Scholar] [CrossRef]
- Yang, S.; Jiang, L.; Cao, Z.; Wang, L.; Cao, J.; Feng, R.; Zhang, Z.; Xue, X.; Shi, Y.; Shan, F. Deep Learning for Detecting Corona Virus Disease 2019 (COVID-19) on High-Resolution Computed Tomography: A Pilot Study. Ann. Transl. Med. 2020, 8, 450. [Google Scholar] [CrossRef] [PubMed]
- Harmon, S.A.; Sanford, T.H.; Xu, S.; Turkbey, E.B.; Roth, H.; Xu, Z.; Yang, D.; Myronenko, A.; Anderson, V.; Amalou, A.; et al. Artificial Intelligence for the Detection of COVID-19 Pneumonia on Chest CT Using Multinational Datasets. Nat. Commun. 2020, 11, 4080. [Google Scholar] [CrossRef] [PubMed]
- Ni, Q.; Sun, Z.Y.; Qi, L.; Chen, W.; Yang, Y.; Wang, L.; Zhang, X.; Yang, L.; Fang, Y.; Xing, Z.; et al. A Deep Learning Approach to Characterize 2019 Coronavirus Disease (COVID-19) Pneumonia in Chest CT Images. Eur. Radiol. 2020, 30, 6517–6527. [Google Scholar] [CrossRef]
- Chen, J.; Wu, L.; Zhang, J.; Zhang, L.; Gong, D.; Zhao, Y.; Chen, Q.; Huang, S.; Yang, M.; Yang, X.; et al. Deep Learning-Based Model for Detecting 2019 Novel Coronavirus Pneumonia on High-Resolution Computed Tomography. Sci. Rep. 2020, 10, 19196. [Google Scholar] [CrossRef]
- Ye, Z.; Zhang, Y.; Wang, Y.; Huang, Z.; Song, B. Chest CT Manifestations of New Coronavirus Disease 2019 (COVID-19): A Pictorial Review. Eur. Radiol. 2020, 30, 4381–4389. [Google Scholar] [CrossRef] [Green Version]
- Zhang, H.-T.; Zhang, J.-S.; Zhang, H.-H.; Nan, Y.-D.; Zhao, Y.; Fu, E.-Q.; Xie, Y.-H.; Liu, W.; Li, W.-P.; Zhang, H.-J.; et al. Automated Detection and Quantification of COVID-19 Pneumonia: CT Imaging Analysis by a Deep Learning-Based Software. Eur. J. Nucl. Med. Mol. Imaging 2020, 47, 2525–2532. [Google Scholar] [CrossRef] [PubMed]
- Ma, C.; Wang, X.-L.; Xie, D.-M.; Li, Y.-D.; Zheng, Y.-J.; Zhang, H.-B.; Ming, B. Dynamic Evaluation of Lung Involvement during Coronavirus Disease-2019 (COVID-19) with Quantitative Lung CT. Emerg. Radiol. 2020, 27, 671–678. [Google Scholar] [CrossRef] [PubMed]
- Du, S.; Gao, S.; Huang, G.; Li, S.; Chong, W.; Jia, Z.; Hou, G.; Wáng, Y.X.J.; Zhang, L. Chest Lesion CT Radiological Features and Quantitative Analysis in RT-PCR Turned Negative and Clinical Symptoms Resolved COVID-19 Patients. Quant. Imaging Med. Surg. 2020, 10, 1307–1317. [Google Scholar] [CrossRef] [PubMed]
- Prokop, M.; van Everdingen, W.; van Rees Vellinga, T.; Quarles van Ufford, H.; Stöger, L.; Beenen, L.; Geurts, B.; Gietema, H.; Krdzalic, J.; Schaefer-Prokop, C.; et al. CO-RADS: A Categorical CT Assessment Scheme for Patients Suspected of Having COVID-19-Definition and Evaluation. Radiology 2020, 296, E97–E104. [Google Scholar] [CrossRef]
- Lessmann, N.; Sánchez, C.I.; Beenen, L.; Boulogne, L.H.; Brink, M.; Calli, E.; Charbonnier, J.-P.; Dofferhoff, T.; van Everdingen, W.M.; Gerke, P.K.; et al. Automated Assessment of COVID-19 Reporting and Data System and Chest CT Severity Scores in Patients Suspected of Having COVID-19 Using Artificial Intelligence. Radiology 2021, 298, E18–E28. [Google Scholar] [CrossRef]
- Liu, H.; Ren, H.; Wu, Z.; Xu, H.; Zhang, S.; Li, J.; Hou, L.; Chi, R.; Zheng, H.; Chen, Y.; et al. CT Radiomics Facilitates More Accurate Diagnosis of COVID-19 Pneumonia: Compared with CO-RADS. J. Transl. Med. 2021, 19, 29. [Google Scholar] [CrossRef]
- Fang, X.; Li, X.; Bian, Y.; Ji, X.; Lu, J. Radiomics Nomogram for the Prediction of 2019 Novel Coronavirus Pneumonia Caused by SARS-CoV-2. Eur. Radiol. 2020, 30, 6888–6901. [Google Scholar] [CrossRef]
- Chen, Y.; Wang, Y.; Zhang, Y.; Zhang, N.; Zhao, S.; Zeng, H.; Deng, W.; Huang, Z.; Liu, S.; Song, B. A Quantitative and Radiomics Approach to Monitoring ARDS in COVID-19 Patients Based on Chest CT: A Retrospective Cohort Study. Int. J. Med. Sci. 2020, 17, 1773–1782. [Google Scholar] [CrossRef]
- Voulodimos, A.; Protopapadakis, E.; Katsamenis, I.; Doulamis, A.; Doulamis, N. Deep Learning Models for COVID-19 Infected Area Segmentation in CT Images. In Proceedings of the 14th PErvasive Technologies Related to Assistive Environments Conference, Corfu, Greece, 29 June–2 July 2021. [Google Scholar] [CrossRef]
- Wang, Y.; Zhang, Y.; Liu, Y.; Tian, J.; Zhong, C.; Shi, Z.; Zhang, Y.; He, Z. Does Non-COVID-19 Lung Lesion Help? Investigating Transferability in COVID-19 CT Image Segmentation. Comput. Methods Programs Biomed. 2021, 202, 106004. [Google Scholar] [CrossRef]
- Saood, A.; Hatem, I. COVID-19 Lung CT Image Segmentation Using Deep Learning Methods: U-Net versus SegNet. BMC Med. Imaging 2021, 21, 19. [Google Scholar] [CrossRef]
- Akram, T.; Attique, M.; Gul, S.; Shahzad, A.; Altaf, M.; Naqvi, S.S.R.; Damaševičius, R.; Maskeliūnas, R. A Novel Framework for Rapid Diagnosis of COVID-19 on Computed Tomography Scans. Pattern Anal. Appl. 2021, 1–14. [Google Scholar] [CrossRef]
- Mukherjee, H.; Ghosh, S.; Dhar, A.; Obaidullah, S.M.; Santosh, K.C.; Roy, K. Deep Neural Network to Detect COVID-19: One Architecture for Both CT Scans and Chest X-Rays. Appl. Intell. 2020. [Google Scholar] [CrossRef]
- Javor, D.; Kaplan, H.; Kaplan, A.; Puchner, S.B.; Krestan, C.; Baltzer, P. Deep Learning Analysis Provides Accurate COVID-19 Diagnosis on Chest Computed Tomography. Eur. J. Radiol. 2020, 133, 109402. [Google Scholar] [CrossRef]
- Mei, X.; Lee, H.-C.; Diao, K.-Y.; Huang, M.; Lin, B.; Liu, C.; Xie, Z.; Ma, Y.; Robson, P.M.; Chung, M.; et al. Artificial Intelligence-Enabled Rapid Diagnosis of Patients with COVID-19. Nat. Med. 2020, 26, 1224–1228. [Google Scholar] [CrossRef] [PubMed]
- Hermans, J.J.R.; Groen, J.; Zwets, E.; Boxma-De Klerk, B.M.; Van Werkhoven, J.M.; Ong, D.S.Y.; Hanselaar, W.E.J.J.; Waals-Prinzen, L.; Brown, V. Chest CT for Triage during COVID-19 on the Emergency Department: Myth or Truth? Emerg. Radiol. 2020, 27, 641–651. [Google Scholar] [CrossRef]
- Francone, M.; Iafrate, F.; Masci, G.M.; Coco, S.; Cilia, F.; Manganaro, L.; Panebianco, V.; Andreoli, C.; Colaiacomo, M.C.; Zingaropoli, M.A.; et al. Chest CT Score in COVID-19 Patients: Correlation with Disease Severity and Short-Term Prognosis. Eur. Radiol. 2020, 30, 6808–6817. [Google Scholar] [CrossRef] [PubMed]
- Zhao, W.; Zhong, Z.; Xie, X.; Yu, Q.; Liu, J. Relation Between Chest CT Findings and Clinical Conditions of Coronavirus Disease (COVID-19) Pneumonia: A Multicenter Study. AJR Am. J. Roentgenol. 2020, 214, 1072–1077. [Google Scholar] [CrossRef]
- Li, K.; Wu, J.; Wu, F.; Guo, D.; Chen, L.; Fang, Z.; Li, C. The Clinical and Chest CT Features Associated With Severe and Critical COVID-19 Pneumonia. Investig. Radiol. 2020, 55, 327–331. [Google Scholar] [CrossRef]
- Metlay, J.P.; Waterer, G.W.; Long, A.C.; Anzueto, A.; Brozek, J.; Crothers, K.; Cooley, L.A.; Dean, N.C.; Fine, M.J.; Flanders, S.A.; et al. Diagnosis and Treatment of Adults with Community-Acquired Pneumonia. An Official Clinical Practice Guideline of the American Thoracic Society and Infectious Diseases Society of America. Am. J. Respir. Crit. Care Med. 2019, 200, e45–e67. [Google Scholar] [CrossRef]
- Chatzitofis, A.; Cancian, P.; Gkitsas, V.; Carlucci, A.; Stalidis, P.; Albanis, G.; Karakottas, A.; Semertzidis, T.; Daras, P.; Giannitto, C.; et al. Volume-of-Interest Aware Deep Neural Networks for Rapid Chest CT-Based COVID-19 Patient Risk Assessment. Int. J. Environ. Res. Public Health 2021, 18, 2842. [Google Scholar] [CrossRef]
- Zhu, X.; Song, B.; Shi, F.; Chen, Y.; Hu, R.; Gan, J.; Zhang, W.; Li, M.; Wang, L.; Gao, Y.; et al. Joint Prediction and Time Estimation of COVID-19 Developing Severe Symptoms Using Chest CT Scan. Med. Image Anal. 2021, 67, 101824. [Google Scholar] [CrossRef]
- Wang, S.; Zha, Y.; Li, W.; Wu, Q.; Li, X.; Niu, M.; Wang, M.; Qiu, X.; Li, H.; Yu, H.; et al. A Fully Automatic Deep Learning System for COVID-19 Diagnostic and Prognostic Analysis. Eur. Respir. J. 2020, 56, 2000775. [Google Scholar] [CrossRef]
- Meng, L.; Dong, D.; Li, L.; Niu, M.; Bai, Y.; Wang, M.; Qiu, X.; Zha, Y.; Tian, J. A Deep Learning Prognosis Model Help Alert for COVID-19 Patients at High-Risk of Death: A Multi-Center Study. IEEE J. Biomed. Health Inform. 2020, 24, 3576–3584. [Google Scholar] [CrossRef]
- Li, D.; Zhang, Q.; Tan, Y.; Feng, X.; Yue, Y.; Bai, Y.; Li, J.; Li, J.; Xu, Y.; Chen, S.; et al. Prediction of COVID-19 Severity Using Chest Computed Tomography and Laboratory Measurements: Evaluation Using a Machine Learning Approach. JMIR Med. Inform. 2020, 8, e21604. [Google Scholar] [CrossRef] [PubMed]
- Ho, T.T.; Park, J.; Kim, T.; Park, B.; Lee, J.; Kim, J.Y.; Kim, K.B.; Choi, S.; Kim, Y.H.; Lim, J.-K.; et al. Deep Learning Models for Predicting Severe Progression in COVID-19-Infected Patients. JMIR Med. Inform. 2021, 9, e24973. [Google Scholar] [CrossRef]
- Hu, X.; Zeng, W.; Zhang, Y.; Zhen, Z.; Zheng, Y.; Cheng, L.; Wang, X.; Luo, H.; Zhang, S.; Wu, Z.; et al. CT Imaging Features of Different Clinical Types of COVID-19 Calculated by AI System: A Chinese Multicenter Study. J. Thorac. Dis. 2020, 12, 5336–5346. [Google Scholar] [CrossRef]
- Li, Z.; Zhong, Z.; Li, Y.; Zhang, T.; Gao, L.; Jin, D.; Sun, Y.; Ye, X.; Yu, L.; Hu, Z.; et al. From Community-Acquired Pneumonia to COVID-19: A Deep Learning-Based Method for Quantitative Analysis of COVID-19 on Thick-Section CT Scans. Eur. Radiol. 2020, 30, 6828–6837. [Google Scholar] [CrossRef] [PubMed]
- Zhang, Y.; Liu, Y.; Gong, H.; Wu, L. Quantitative Lung Lesion Features and Temporal Changes on Chest CT in Patients with Common and Severe SARS-CoV-2 Pneumonia. PLoS ONE 2020, 15, e0236858. [Google Scholar] [CrossRef] [PubMed]
- Pan, F.; Li, L.; Liu, B.; Ye, T.; Li, L.; Liu, D.; Ding, Z.; Chen, G.; Liang, B.; Yang, L.; et al. A Novel Deep Learning-Based Quantification of Serial Chest Computed Tomography in Coronavirus Disease 2019 (COVID-19). Sci. Rep. 2021, 11, 417. [Google Scholar] [CrossRef]
- Cheng, Z.; Qin, L.; Cao, Q.; Dai, J.; Pan, A.; Yang, W.; Gao, Y.; Chen, L.; Yan, F. Quantitative Computed Tomography of the Coronavirus Disease 2019 (COVID-19) Pneumonia. Radiol. Infect. Dis. 2020, 7, 55–61. [Google Scholar] [CrossRef] [PubMed]
- Ippolito, D.; Ragusi, M.; Gandola, D.; Maino, C.; Pecorelli, A.; Terrani, S.; Peroni, M.; Giandola, T.; Porta, M.; Talei Franzesi, C.; et al. Computed Tomography Semi-Automated Lung Volume Quantification in SARS-CoV-2-Related Pneumonia. Eur. Radiol. 2020, 31, 2726–2736. [Google Scholar] [CrossRef]
- Mergen, V.; Kobe, A.; Blüthgen, C.; Euler, A.; Flohr, T.; Frauenfelder, T.; Alkadhi, H.; Eberhard, M. Deep Learning for Automatic Quantification of Lung Abnormalities in COVID-19 Patients: First Experience and Correlation with Clinical Parameters. Eur. J. Radiol. Open 2020, 7, 100272. [Google Scholar] [CrossRef] [PubMed]
- Lanza, E.; Muglia, R.; Bolengo, I.; Santonocito, O.G.; Lisi, C.; Angelotti, G.; Morandini, P.; Savevski, V.; Politi, L.S.; Balzarini, L. Quantitative Chest CT Analysis in COVID-19 to Predict the Need for Oxygenation Support and Intubation. Eur. Radiol. 2020, 30, 6770–6778. [Google Scholar] [CrossRef]
- Kimura-Sandoval, Y.; Arévalo-Molina, M.E.; Cristancho-Rojas, C.N.; Kimura-Sandoval, Y.; Rebollo-Hurtado, V.; Licano-Zubiate, M.; Chapa-Ibargüengoitia, M.; Muñoz-López, G. Validation of Chest Computed Tomography Artificial Intelligence to Determine the Requirement for Mechanical Ventilation and Risk of Mortality in Hospitalized Coronavirus Disease-19 Patients in a Tertiary Care Center In Mexico City. Rev. Investig. Clin. 2020, 73, 111–119. [Google Scholar] [CrossRef] [PubMed]
- Burian, E.; Jungmann, F.; Kaissis, G.A.; Lohöfer, F.K.; Spinner, C.D.; Lahmer, T.; Treiber, M.; Dommasch, M.; Schneider, G.; Geisler, F.; et al. Intensive Care Risk Estimation in COVID-19 Pneumonia Based on Clinical and Imaging Parameters: Experiences from the Munich Cohort. J. Clin. Med. 2020, 9, 1514. [Google Scholar] [CrossRef]
- Liu, F.; Zhang, Q.; Huang, C.; Shi, C.; Wang, L.; Shi, N.; Fang, C.; Shan, F.; Mei, X.; Shi, J.; et al. CT Quantification of Pneumonia Lesions in Early Days Predicts Progression to Severe Illness in a Cohort of COVID-19 Patients. Theranostics 2020, 10, 5613–5622. [Google Scholar] [CrossRef]
- Noll, E.; Soler, L.; Ohana, M.; Ludes, P.-O.; Pottecher, J.; Bennett-Guerrero, E.; Veillon, F.; Goichot, B.; Schneider, F.; Meyer, N.; et al. A Novel, Automated, Quantification of Abnormal Lung Parenchyma in Patients with COVID-19 Infection: Initial Description of Feasibility and Association with Clinical Outcome. Anaesth. Crit. Care Pain Med. 2020, 40, 100780. [Google Scholar] [CrossRef]
- Durhan, G.; Düzgün, S.A.; Demirkazık, F.B.; Irmak, İ.; İdilman, İ.; Akpınar, M.G.; Akpınar, E.; Öcal, S.; Telli, G.; Topeli, A.; et al. Visual and Software-Based Quantitative Chest CT Assessment of COVID-19: Correlation with Clinical Findings. Diagn. Interv. Radiol. 2020, 26, 557–564. [Google Scholar] [CrossRef]
- Wang, Y.; Chen, Y.; Wei, Y.; Li, M.; Zhang, Y.; Zhang, N.; Zhao, S.; Zeng, H.; Deng, W.; Huang, Z.; et al. Quantitative Analysis of Chest CT Imaging Findings with the Risk of ARDS in COVID-19 Patients: A Preliminary Study. Ann. Transl. Med. 2020, 8, 594. [Google Scholar] [CrossRef]
- Qiu, J.; Peng, S.; Yin, J.; Wang, J.; Jiang, J.; Li, Z.; Song, H.; Zhang, W. A Radiomics Signature to Quantitatively Analyze COVID-19-Infected Pulmonary Lesions. Interdiscip. Sci. 2021, 13, 61–72. [Google Scholar] [CrossRef] [PubMed]
- Homayounieh, F.; Babaei, R.; Mobin, H.K.; Arru, C.D.; Sharifian, M.; Mohseni, I.; Zhang, E.; Digumarthy, S.R.; Kalra, M.K. Computed Tomography Radiomics Can Predict Disease Severity and Outcome in Coronavirus Disease 2019 Pneumonia. J. Comput. Assist. Tomogr. 2020, 44, 640–646. [Google Scholar] [CrossRef]
- Fu, L.; Li, Y.; Cheng, A.; Pang, P.; Shu, Z. A Novel Machine Learning-Derived Radiomic Signature of the Whole Lung Differentiates Stable From Progressive COVID-19 Infection: A Retrospective Cohort Study. J. Thorac. Imaging 2020, 35, 361. [Google Scholar] [CrossRef] [PubMed]
- Chen, H.; Zeng, M.; Wang, X.; Su, L.; Xia, Y.; Yang, Q.; Liu, D. A CT-Based Radiomics Nomogram for Predicting Prognosis of Coronavirus Disease 2019 (COVID-19) Radiomics Nomogram Predicting COVID-19. Br. J. Radiol. 2021, 94, 20200634. [Google Scholar] [CrossRef]
- Wu, Q.; Wang, S.; Li, L.; Wu, Q.; Qian, W.; Hu, Y.; Li, L.; Zhou, X.; Ma, H.; Li, H.; et al. Radiomics Analysis of Computed Tomography Helps Predict Poor Prognostic Outcome in COVID-19. Theranostics 2020, 10, 7231–7244. [Google Scholar] [CrossRef] [PubMed]
- Li, C.; Dong, D.; Li, L.; Gong, W.; Li, X.; Bai, Y.; Wang, M.; Hu, Z.; Zha, Y.; Tian, J. Classification of Severe and Critical Covid-19 Using Deep Learning and Radiomics. IEEE J. Biomed. Health Inform. 2020, 24, 3585–3594. [Google Scholar] [CrossRef]
- Cai, Q.; Du, S.-Y.; Gao, S.; Huang, G.-L.; Zhang, Z.; Li, S.; Wang, X.; Li, P.-L.; Lv, P.; Hou, G.; et al. A Model Based on CT Radiomic Features for Predicting RT-PCR Becoming Negative in Coronavirus Disease 2019 (COVID-19) Patients. BMC Med. Imaging 2020, 20, 118. [Google Scholar] [CrossRef]
- Yang, J.; Zheng, Y.; Gou, X.; Pu, K.; Chen, Z.; Guo, Q.; Ji, R.; Wang, H.; Wang, Y.; Zhou, Y. Prevalence of Comorbidities and Its Effects in Patients Infected with SARS-CoV-2: A Systematic Review and Meta-Analysis. Int. J. Infect. Dis. 2020, 94, 91–95. [Google Scholar] [CrossRef]
- Lu, X.; Cui, Z.; Pan, F.; Li, L.; Li, L.; Liang, B.; Yang, L.; Zheng, C. Glycemic Status Affects the Severity of Coronavirus Disease 2019 in Patients with Diabetes Mellitus: An Observational Study of CT Radiological Manifestations Using an Artificial Intelligence Algorithm. Acta Diabetol. 2021, 58, 575–586. [Google Scholar] [CrossRef]
- Wang, B.; Li, R.; Lu, Z.; Huang, Y. Does Comorbidity Increase the Risk of Patients with COVID-19: Evidence from Meta-Analysis. Aging 2020, 12, 6049–6057. [Google Scholar] [CrossRef]
- Zhang, C.; Yang, G.; Cai, C.; Xu, Z.; Wu, H.; Guo, Y.; Xie, Z.; Shi, H.; Cheng, G.; Wang, J. Development of a Quantitative Segmentation Model to Assess the Effect of Comorbidity on Patients with COVID-19. Eur. J. Med. Res. 2020, 25, 49. [Google Scholar] [CrossRef]
- Song, J.; Wang, H.; Liu, Y.; Wu, W.; Dai, G.; Wu, Z.; Zhu, P.; Zhang, W.; Yeom, K.W.; Deng, K. End-to-End Automatic Differentiation of the Coronavirus Disease 2019 (COVID-19) from Viral Pneumonia Based on Chest CT. Eur. J. Nucl. Med. Mol. Imaging 2020, 47, 2516–2524. [Google Scholar] [CrossRef] [PubMed]
- Yan, T.; Wong, P.K.; Ren, H.; Wang, H.; Wang, J.; Li, Y. Automatic Distinction between COVID-19 and Common Pneumonia Using Multi-Scale Convolutional Neural Network on Chest CT Scans. Chaos Solitons Fractals 2020, 140, 110153. [Google Scholar] [CrossRef] [PubMed]
- Liu, C.; Wang, X.; Liu, C.; Sun, Q.; Peng, W. Differentiating Novel Coronavirus Pneumonia from General Pneumonia Based on Machine Learning. Biomed. Eng. Online 2020, 19, 66. [Google Scholar] [CrossRef]
- Yang, Y.; Lure, F.Y.M.; Miao, H.; Zhang, Z.; Jaeger, S.; Liu, J.; Guo, L. Using Artificial Intelligence to Assist Radiologists in Distinguishing COVID-19 from Other Pulmonary Infections. J. Xray Sci. Technol. 2020, 29, 1–17. [Google Scholar] [CrossRef]
- Bai, H.X.; Wang, R.; Xiong, Z.; Hsieh, B.; Chang, K.; Halsey, K.; Tran, T.M.L.; Choi, J.W.; Wang, D.-C.; Shi, L.-B.; et al. Artificial Intelligence Augmentation of Radiologist Performance in Distinguishing COVID-19 from Pneumonia of Other Origin at Chest CT. Radiology 2020, 296, E156–E165. [Google Scholar] [CrossRef] [PubMed]
- Li, L.; Qin, L.; Xu, Z.; Yin, Y.; Wang, X.; Kong, B.; Bai, J.; Lu, Y.; Fang, Z.; Song, Q.; et al. Using Artificial Intelligence to Detect COVID-19 and Community-Acquired Pneumonia Based on Pulmonary CT: Evaluation of the Diagnostic Accuracy. Radiology 2020, 296, E65–E71. [Google Scholar] [CrossRef]
- Ardakani, A.A.; Acharya, U.R.; Habibollahi, S.; Mohammadi, A. COVIDiag: A Clinical CAD System to Diagnose COVID-19 Pneumonia Based on CT Findings. Eur. Radiol. 2021, 31, 121–130. [Google Scholar] [CrossRef] [PubMed]
- Zeng, Q.-Q.; Zheng, K.I.; Chen, J.; Jiang, Z.-H.; Tian, T.; Wang, X.-B.; Ma, H.-L.; Pan, K.-H.; Yang, Y.-J.; Chen, Y.-P.; et al. Radiomics-Based Model for Accurately Distinguishing between Severe Acute Respiratory Syndrome Associated Coronavirus 2 (SARS-CoV-2) and Influenza A Infected Pneumonia. MedComm 2020, 1, 240–248. [Google Scholar] [CrossRef]
- Howard, A.G.; Zhu, M.; Chen, B.; Kalenichenko, D.; Wang, W.; Weyand, T.; Andreetto, M.; Adam, H. MobileNets: Efficient Convolutional Neural Networks for Mobile Vision Applications. arXiv 2017, arXiv:1704.04861. [Google Scholar]
- Real, E.; Aggarwal, A.; Huang, Y.; Le, Q.V. Regularized Evolution for Image Classifier Architecture Search. In Proceedings of the AAAI Conference on Artificial Intelligence; AAAI Press: Palo Alto, CA, USA, 2019; Volume 33. [Google Scholar]
- Roberts, M.; Driggs, D.; Thorpe, M.; Gilbey, J.; Yeung, M.; Ursprung, S.; Aviles-Rivero, A.I.; Etmann, C.; McCague, C.; Beer, L.; et al. Common Pitfalls and Recommendations for Using Machine Learning to Detect and Prognosticate for COVID-19 Using Chest Radiographs and CT Scans. Nat. Mach. Intell. 2021, 3, 199–217. [Google Scholar] [CrossRef]
- Alizadehsani, R.; Roshanzamir, M.; Hussain, S.; Khosravi, A.; Koohestani, A.; Zangooei, M.H.; Abdar, M.; Beykikhoshk, A.; Shoeibi, A.; Zare, A.; et al. Handling of Uncertainty in Medical Data Using Machine Learning and Probability Theory Techniques: A Review of 30 Years (1991–2020). Ann. Oper. Res. 2021, 1–42. [Google Scholar] [CrossRef]
- Cohen, J.P.; Morrison, P.; Dao, L. COVID-19 Image Data Collection. arXiv 2020, arXiv:2006.11988. [Google Scholar]
- Calderon-Ramirez, S.; Yang, S.; Moemeni, A.; Colreavy-Donnelly, S.; Elizondo, D.A.; Oala, L.; Rodriguez-Capitan, J.; Jimenez-Navarro, M.; Lopez-Rubio, E.; Molina-Cabello, M.A. Improving Uncertainty Estimation With Semi-Supervised Deep Learning for COVID-19 Detection Using Chest X-Ray Images. IEEE Access 2021, 9, 85442–85454. [Google Scholar] [CrossRef]
- Zhou, J.; Jing, B.; Wang, Z.; Xin, H.; Tong, H. SODA: Detecting COVID-19 in Chest X-Rays with Semi-Supervised Open Set Domain Adaptation. IEEE/ACM Trans. Comput. Biol. Bioinform. 2021. [Google Scholar] [CrossRef] [PubMed]
- Ilyas, M.; Rehman, H.; Nait-ali, A. Detection of Covid-19 from Chest X-Ray Images Using Artificial Intelligence: An Early Review. arXiv 2020, arXiv:2004.05436. [Google Scholar]
- López-Cabrera, J.D.; Orozco-Morales, R.; Portal-Diaz, J.A.; Lovelle-Enríquez, O.; Pérez-Díaz, M. Current Limitations to Identify COVID-19 Using Artificial Intelligence with Chest X-Ray Imaging. Health Technol. 2021, 1–14. [Google Scholar] [CrossRef]


| Authors | Year | Population (No. of Patients) | ML Model | Results |
|---|---|---|---|---|
| Apostolopoulos et al. | 2020 | First dataset: 224 Covid+, 1204 covid-. plus a second dataset with 224 Covid+, 1218 Covid- | different CNNs (VGG19, MobileNet v2, Inception, Xception, Inception ResNet v2) | acc 96.78%, sen 98.66%, spe 96.46% (for binary class), acc 93.48% (for multi-class) |
| Ozturk et al. | 2020 | 127 Covid+ | DarkNet | acc 98.08%, sen 95.13%, spe 95.3%, (for binary class) acc 87.02%, sen 85.35%, spe 92.18%, (for multi-class) |
| Wang et al. | 2020 | 358 Covid+, 13,604 Covid- | covid-net | acc 95%, sen 93%, spe 96% (for multi-class) |
| Borkowski et al. | 2020 | training: 484 Covid+, 1000 Covid-; validation: 10 Covid+, 20 Covid- | Microsoft custom vision | acc 97%, sen 100%, spe 95% (for binary) |
| Chowdhury et al. | 2020 | 219 Covid+, 2659 Covid- | PDCOVID-net | acc 96.58%, pre 96.58%, rec 96.59%, F1 96.58% (for multi-class: covid, normal, viral pneumonia) |
| Toraman et al. | 2020 | 231 Covid+ (1050 with data augmentation), 2100 Covid- | CapsNet | acc 89.48%, sen 84.22%, spe 92.11% (for multi-class: covid, normal, pneumonia) |
| Ouchicha et al. | 2020 | 219 Covid+, 2686 Covid- | CVDNet | acc 97.79%, sen 96.83%, spe 98.02% (for multi-class: covid, normal, pneumonia) |
| Togacar et al. | 2020 | 295 Covid+, 163 Covid- | MobileNet+squeezenet+SVM | acc 98.83%, sen 97.04%, spe 99.15% (for multi-class: covid, normal, pneumonia) |
| Hassantabar et al. | 2020 | 315 Covid+, 367 Covid- | CNN and DNN | CNN: accuracy 93.2, sensitivity 96.1, DNN: accuracy 83.4, sensitivity 86 |
| Mukherjee et al. | 2021 | Various datasets | CNN | Accuracy: 96.13 |
| Authors | Year | Population (No. of Patients) | ML Model | Results |
|---|---|---|---|---|
| Murphy et al. | 2020 | 217 covid+, 237 covid- | CAD4COVID-XRay | AUC 0.81, specificity 85% |
| Wang et al. | 2020 | 53 COVID+, 13,592 COVID- | covid-net | accuracy 92.4% |
| Narin et al. | 2020 | 50 covid+, 50 covid- | ResNet-50, Inception V3, Inception-ResNet V2, ResNet101, ResNet152 | accuracy 98% (ResNet-50) |
| Zhang et al. | 2020 | various datasets for internal and external validation | ResNet-18 | sen 72.00%, spe 97.97%, AUC 95.18% (for binary class) |
| Xia et al. | 2021 | 512 covid+, 106 covid- | DNN | AUC 0.919 (when combining cxr and clinical features: AUC 0.952, sensitivity 91.5, specificity 81.2) |
| Bassi et al. | 2021 | 439 covid+, 1625 covid- | DenseNet201 and DenseNet121 | accuracy 100 |
| Authors | Year | Population (No. of Patients) | ML Model | Results |
|---|---|---|---|---|
| Li et al. | 2020 | various datasets | convolutional siamese NN | AUC 0.80 |
| Mushtaq et al. | 2021 | 697 covid+ | qXR | Achieving a statistical significance in predicting negative outcome in ED patients. |
| Zhu et al. | 2020 | 131 covid+ | VGG16 | AI-predicted scores were highly correlated with radiologist scores |
| Authors | Year | Population (No. of Patients) | ML Model | Results |
|---|---|---|---|---|
| Varela-Santos et al. | 2021 | various datasets (Cohen, Kermany) | FFNN, CNN | Various AUC values depending on the dataset/population/network considered |
| Jin et al. | 2021 | various datasets (NIH chext x ray database and others): 543 covid+, 600 covid-, 600 normal | hybrid ensemble model (AlexNet with ReliefF algorithm and SVM classifier) | accuracy 98.642, specificity 98.644, sensitivity 98.643, AUC 0.9997 |
| Sharma et al. | 2020 | various datasets | CovidPred | accuracy 93.8 |
| Tsiknakis et al. | 2020 | various datasets (Cohen, QUIBIM imagingcovid19): 137 covid+, 150 covid-, 150 normal | Inception-V3 | sensibility 99, specificity 100, accuracy 100, AUC 1 for binary class (covid vs. other pneumonia) |
| Authors | Year | ML Model | Population (No. of Patients) | Results |
|---|---|---|---|---|
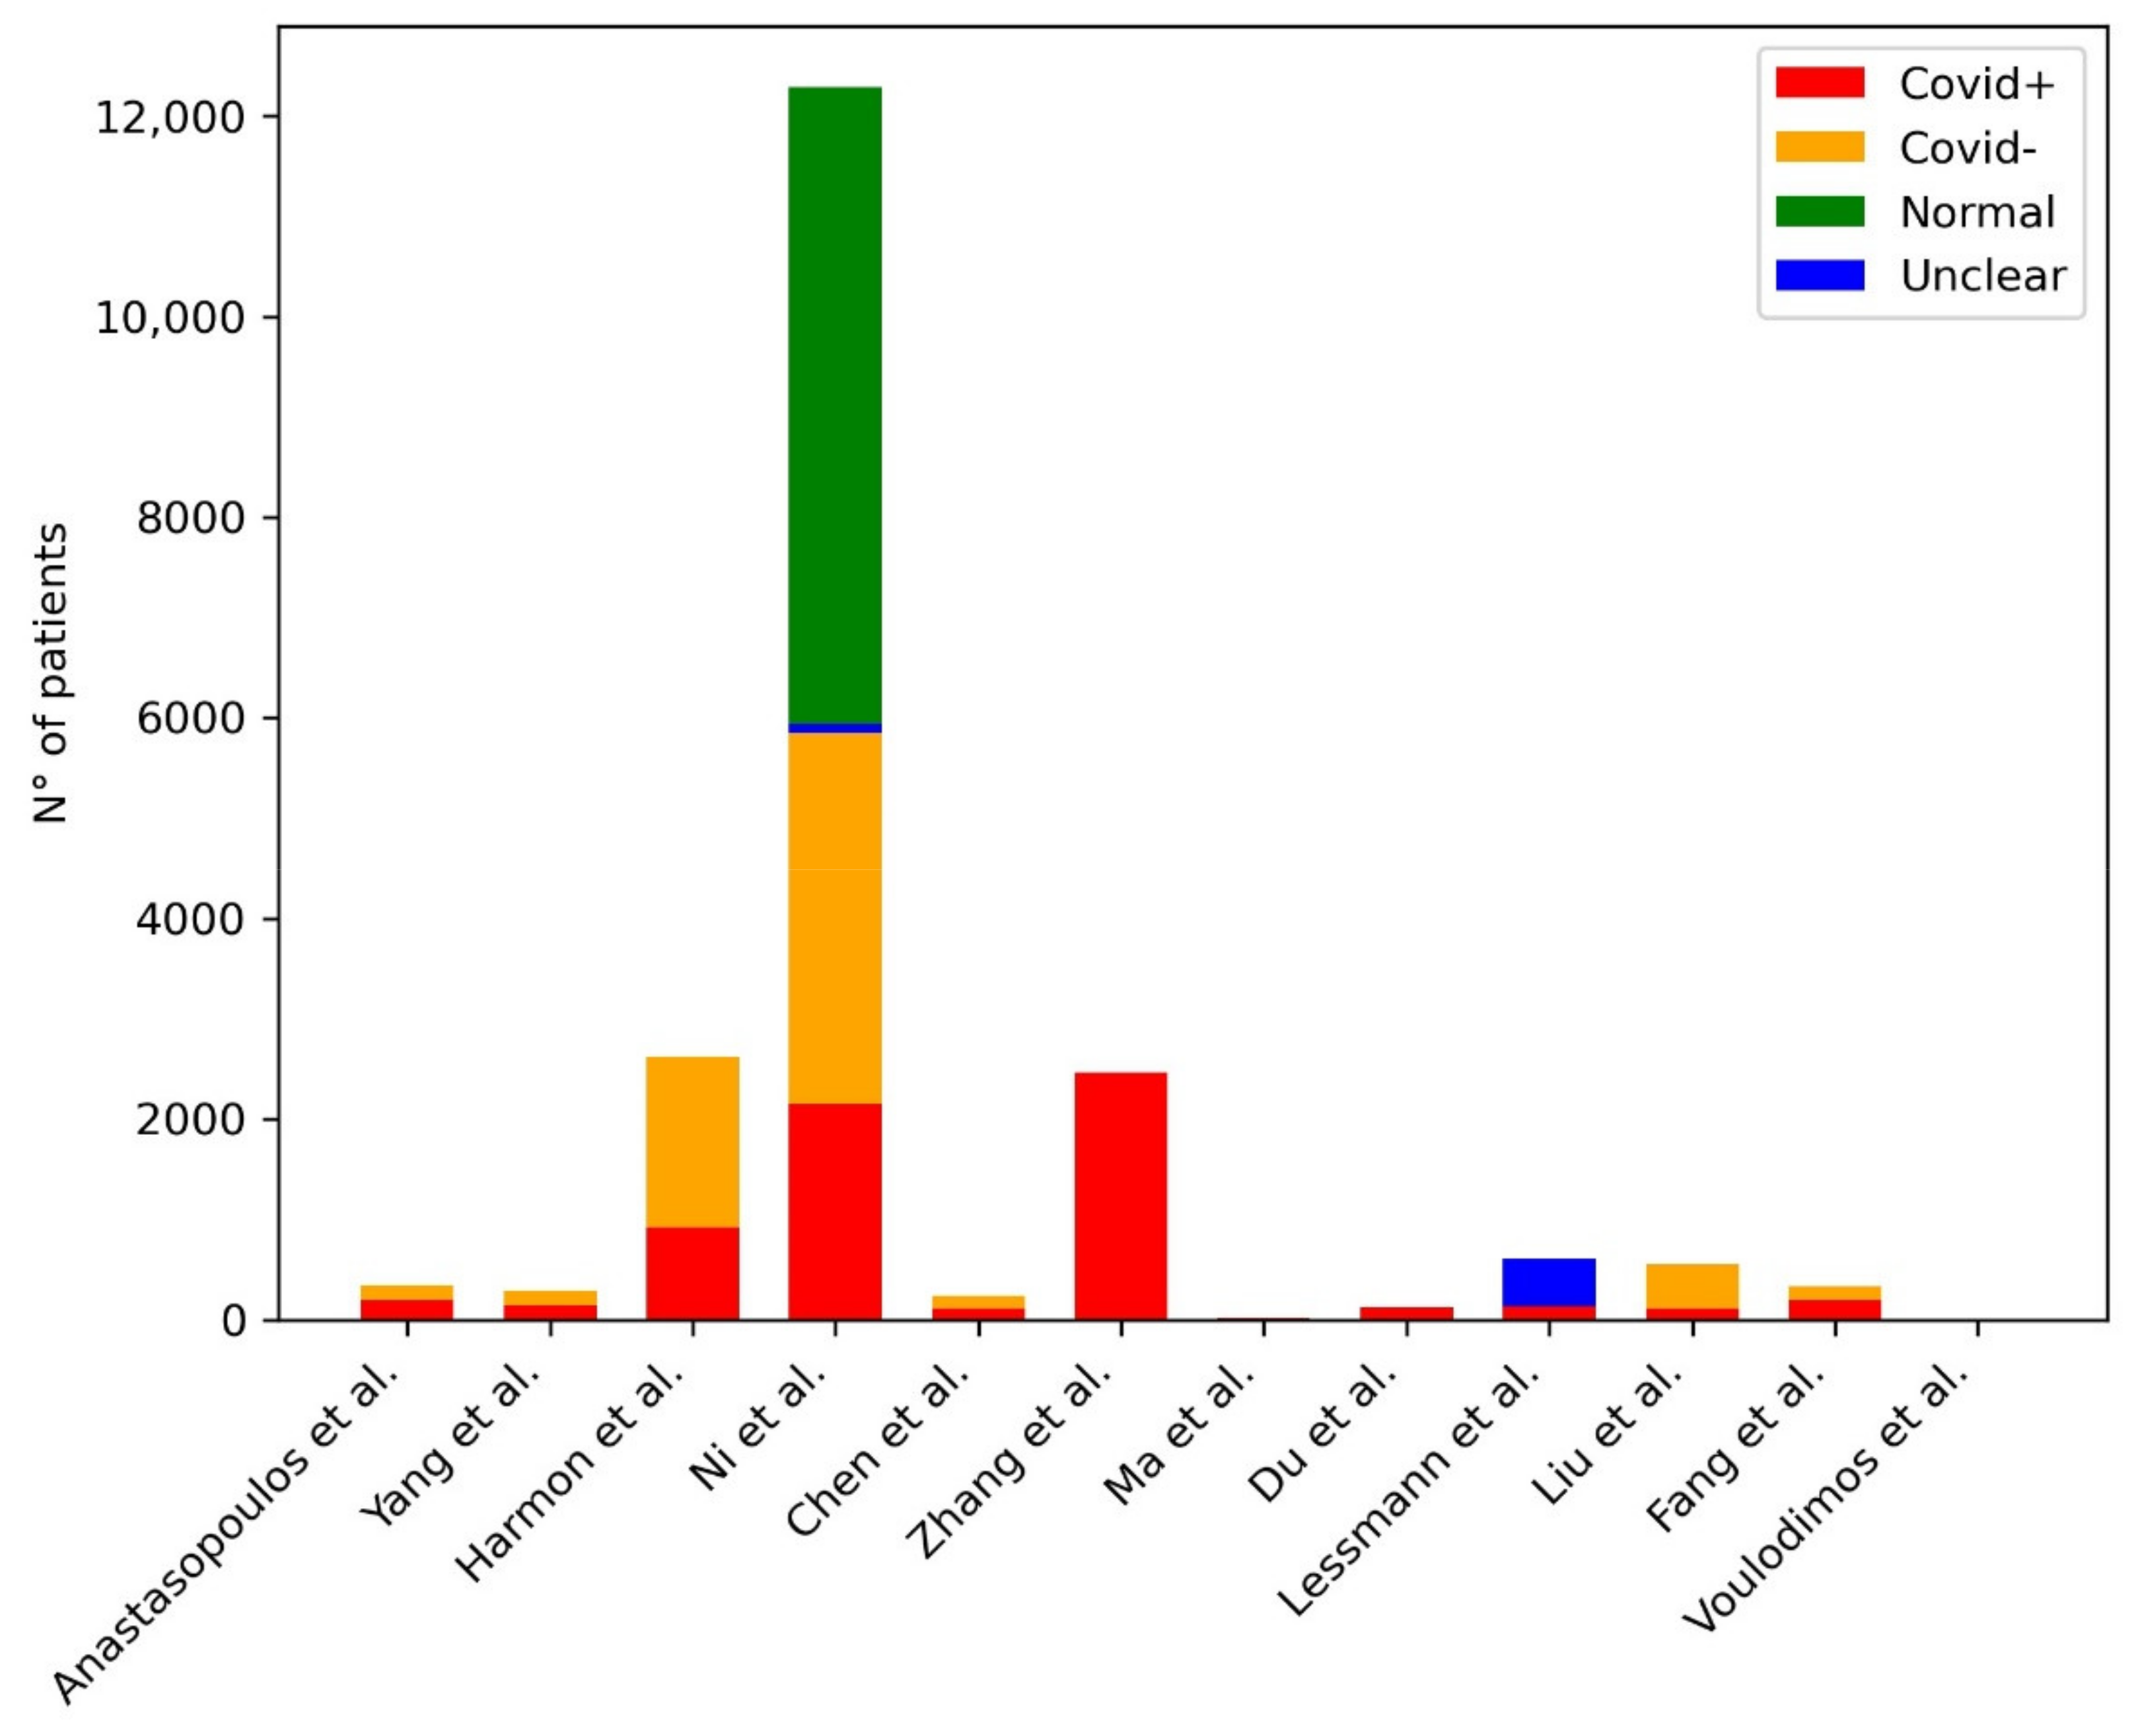
| Anastasopoulos et al. | 2020 | U-Net | 197 COVID+, 141 COVID- | Dice coefficient: 0.97 |
| Yang et al. | 2020 | DenseNet | 146 COVID+, 149 COVID- | AUC: 0.98 |
| Harmon et al. | 2020 | AH-Net(segmentation) Densenet3D/2D+1 (classification) | 922 COVID+, 1695 COVID- | AUC: 0.949—original design, 0.941—independent population |
| Ni et al. | 2020 | MVP-Net, 3D U-Net | 14,435 (training): 2154 COVID+, 12,281 COVID- + 96 COVID+ (testing) | Accuracy: 82—per-lobe lung level, 0.94—per-patient level |
| Chen et al. | 2020 | U-Net++ with a ResNet50 backbone | 106 (training and retrospective testing): 51 COVID+, 55 COVID- +27 (internal prospective testing): 16 COVID+, 11 COVID- +100 (external prospective testing): 50 COVID+, 50 COVID- 27 (internal prospec-tive testing): 16 COVID+, 11 COVID- + 100 (external pro-spective testing): 50 COVID+, 50 COVID- | Accuracy: 95.24—retrospective testing, 92.59—internal prospective testing, 96—external prospective testing |
| Zhang et al. | 2020 | QCT | 2460 COVID+ | Identification of lesions |
| Ma et al. | 2020 | QCT | 18 COVID+ | Identification of lesions and dynamic changes |
| Du et al. | 2020 | QCT | 125 COVID+ | Identification of lesions and dynamic changes |
| Lessmann et al. | 2020 | Two-stage U-Net (lobe segmentation and labeling), 3D U-net with nnU-Net framework (CT severity score prediction), 3D-inflated Inception (CO-RADS score prediction) | 476 (training) 105 (internal test): 58 COVID+, 47 COVID- 262 (external test): 179 COVID+, 83 COVID- | AUC: 0.95—internal testing, 0.88—external testing |
| Liu et al. | 2021 | Radiomics | 115 COVID+, 435 COVID- | AUC: 0.93 |
| Fang et al. | 2020 | Radiomics | 239 (training): 136 COVID+, 103 COVID- 90 (validation): 56 COVID+, 34 COVID- | AUC: 0.955 |
| Chen et al. | 2020 | Radiomics | 84 COVID+ | AUC: 0.94 |
| Voulodimos et al. | 2020 | FCN, U-net | 10 COVID+ | Unclear data: FCN Accuracy: ~0.9 (validation); Accuracy U-net: >0.9 (validation) |
| Sahood et al. | 2021 | U-net, SegNet | 100—one slice CT scans | Accuracy: SegNet: 0.954; U-Net: 0.949 |
| Mukherjee et al. | 2021 | CNN | 336 COVID+, 336 COVID—(CXR + CT) | AUC CXR+CT: 0.9808 (AUC CT: 0.9731) |
| Authors | Year | ML Model | Population (No. of Patients) | Results |
|---|---|---|---|---|
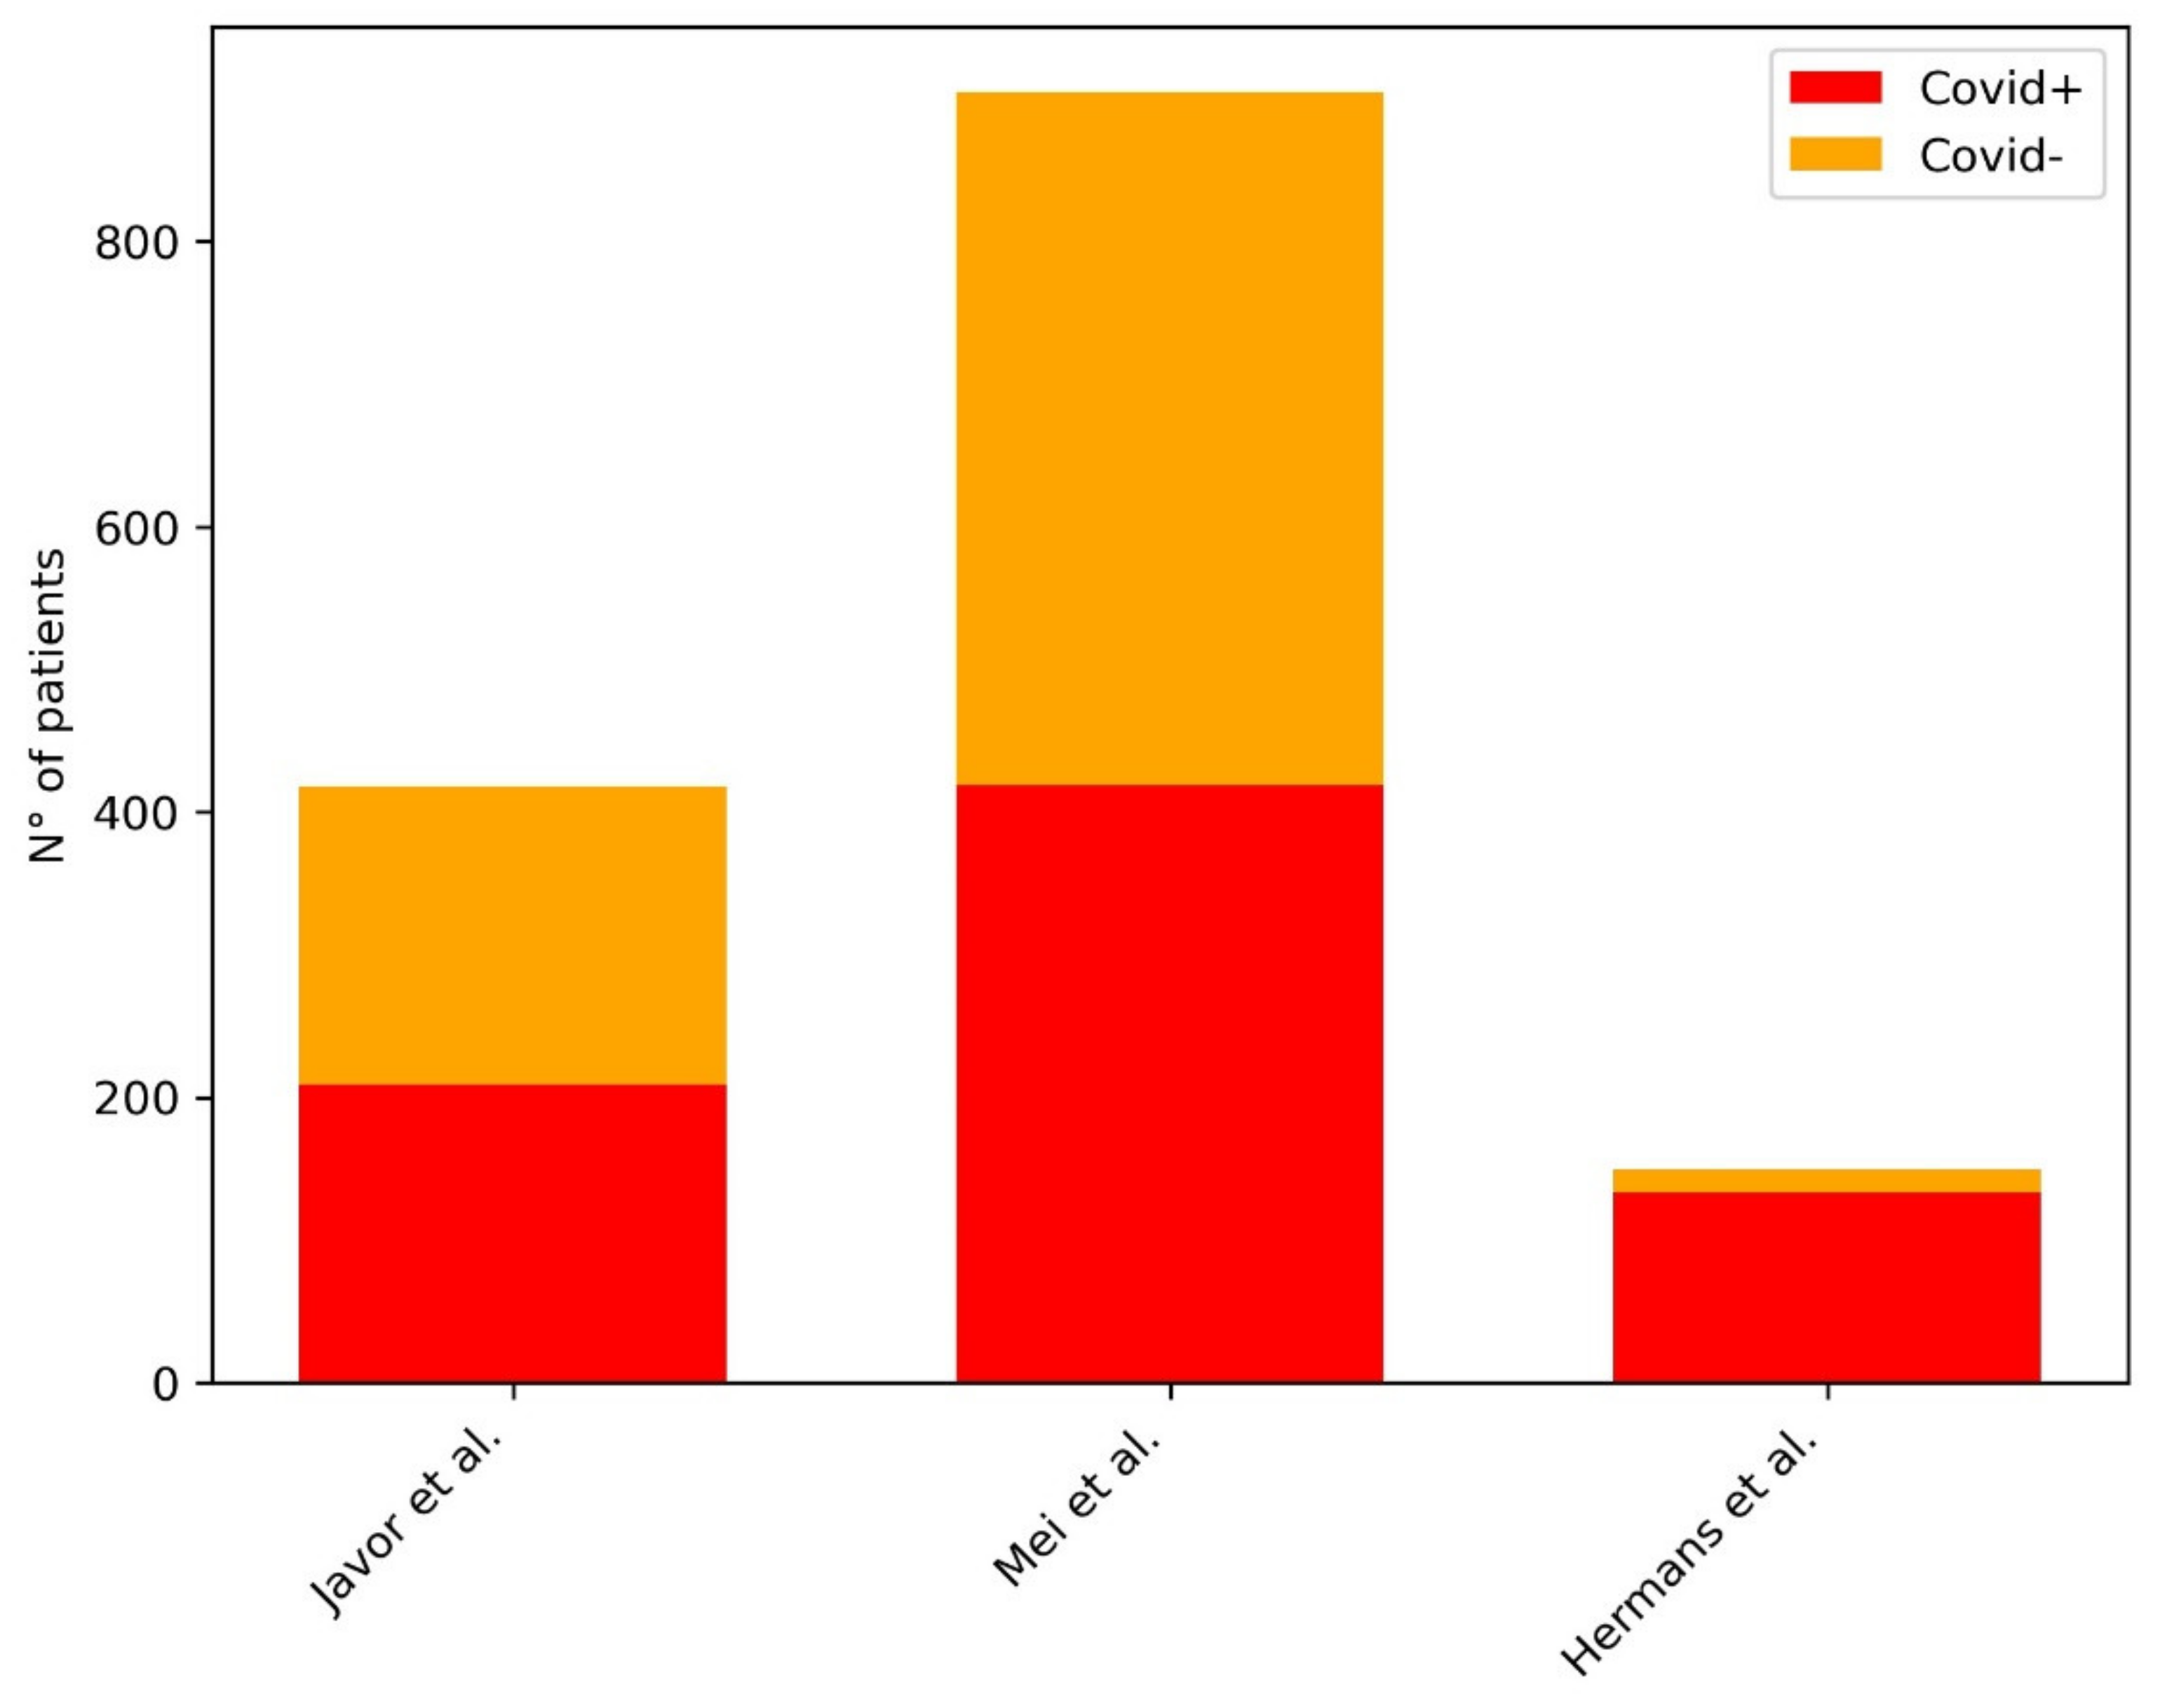
| Javor et al. | 2020 | ResNet50 | 209 COVID+, 209 COVID- | AUC: 0.956 |
| Mei et al. | 2020 | LeNet, YOLO, DenseNet (pipeline developed in previous work) | 419 COVID+, 486 COVID- | AUC: 0.92 |
| Hermans et al. | 2020 | Logistic regression (no DL) | 133 COVID+, 16 COVID- | AUC: 0.953 |
| Authors | Year | ML Model | Population (No. of Patients) | Results |
|---|---|---|---|---|
| Chatzitofis | 2021 | DenseNet201 | 497 COVID+ | AUC: 0.79–0.97—moderate risk, 0.81–0.92—severe risk, 0.93–1.00—extreme risk |
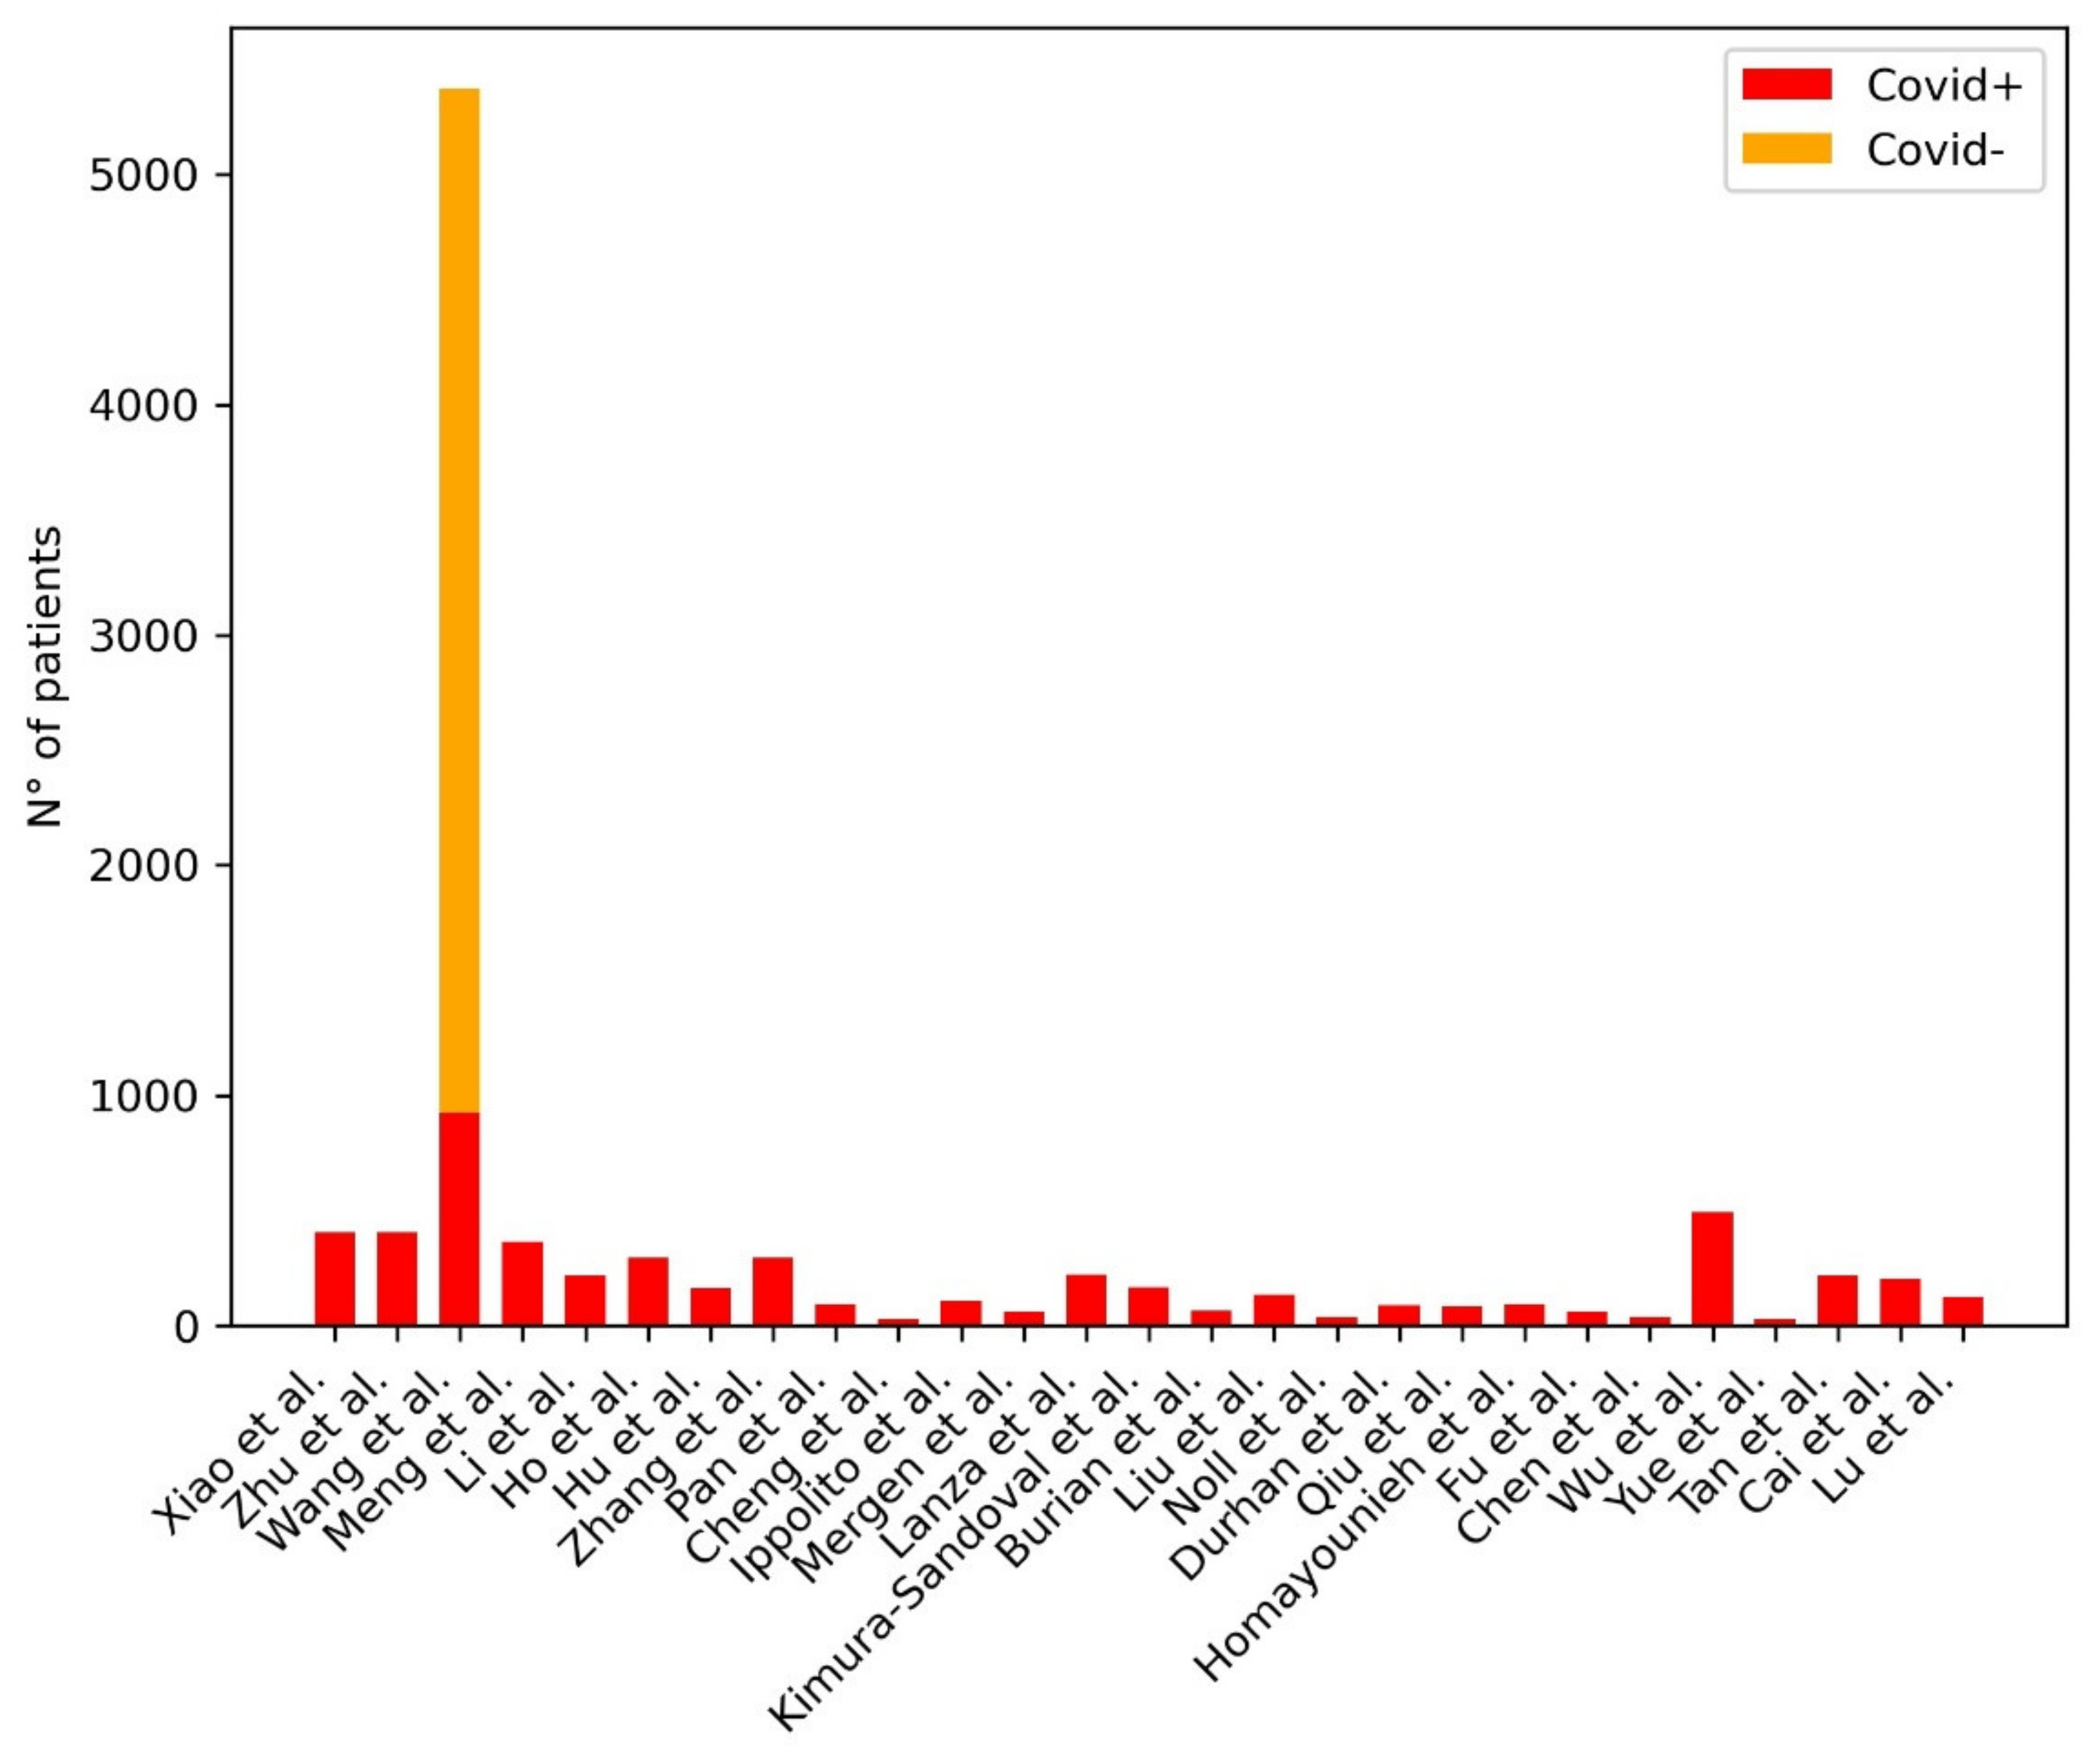
| Xiao et al. | 2020 | Instance Aware ResNet34 | 408 COVID+ | AUC: 0.892 |
| Zhu et al. | 2020 | DL | 408 COVID+ | Accuracy: 85.91 |
| Wang et al. | 2020 | DenseNet121-FPN (lung segmentation), COVID-19Net (novel) (COVID-19 diagnostic and prognostic analysis) | 924 COVID+, 4448 COVID- | AUC-3 sets: 0.87, 0.88, 0.86 |
| Meng et al. | 2020 | De-COVID19-Net (novel) | 366 COVID+ | AUC: 0.943 |
| Li et al. | 2020 | DenseNet | 46 COVID+ | AUC: 0.93 |
| Ho et al. | 2021 | Custom architectures (not very interesting) + an assortment of existing architectures | 297 COVID+ | AUC: 0.916 |
| Hu et al. | 2020 | Custom architectures (not very interesting) + an assortment of existing architectures | 164 COVID+ | Identification of lesions |
| Li et al. | 2020 | QCT | 196 COVID+ | AUC: 0.97 |
| Zhang et al. | 2020 | QCT | 73 COVID+ | Identification of volumes and dynamic changes |
| Pan et al. | 2021 | QCT | 95 COVID+ | Correlation with CT score—Spearman’s correlation coefficient 0.920 |
| Cheng et al. | 2020 | QCT | 30 COVID+ | Significant correlation with laboratory data, PSI and CT score |
| Ippolito et al. | 2020 | QCT | 108 COVID+ | Significant correlation with laboratory data and CT score |
| Mergen et al. | 2020 | QCT | 60 COVID+ | Significant correlation with laboratory and clinical data |
| Lanza et al. | 2020 | QCT | 222 COVID+ | AUC: 0.83—oxygenation support, 0.86—intubation |
| Kimura-Sandoval et al. | 2020 | QCT | 166 COVID+ | AUC: 0.884—MV, 0.876—Mortality |
| Burian et al. | 2020 | QCT | 65 COVID+ | AUC: 0.79 |
| Liu et al. | 2020 | QCT | 134 COVID+ | AUC: 0.93 |
| Noll et al. | 2020 | QCT | 37 COVID+ | Correlation with clinical data |
| Durhan et al. | 2020 | QCT | 90 COVID+ | AUC: 0.902—severe pneumonia, 0.944—ICU admission |
| Wang et al. | 2020 | QCT | 27 COVID+ | Correlation with clinical data |
| Qiu et al. | 2021 | Radiomics | 84 COVID+ | AUC: 0.87 |
| Homayounieh et al. | 2020 | Radiomics | 92 COVID+ | AUC: 0.99—disease severity, 0.90—outcome |
| Fu et al. | 2020 | Radiomics | 64 COVID+ | AUC: 0.833 |
| Chen et al. | 2021 | Radiomics | 40 COVID+ | “AUC -3 classifiers: 0.82, 0.88,0.86, c-index-nomogram: 0.85” |
| Wu et al. | 2020 | Radiomics | 492 COVID+ | “AUC: 0.862—early-phase group, 0.976—late-phase group” |
| Li et al. | 2020 | DL-Radiomics | 217 COVID+ | AUC: 0.861 |
| Yue et al. | 2020 | Radiomics | 31 COVID+ | AUC-2 models: 0.97, 0.92 |
| Tan et al. | 2020 | Radiomics | 219 COVID+ | AUC-3 cohorts: 0.95, 0.95, 0.98 |
| Cai et al. | 2020 | Radiomics | 203 COVID+ | AUC: 0.812 |
| Lu et al. | 2021 | QCT | 126 COVID+ | AUC: 0.796—PLV, 0.783—PGV, 0.816—PCV |
| Zhang et al. | 2020 | QCT | 294 COVID+ | (Dice coefficients >0.85 and all accuracies >0.95) |
| Authors | Year | ML Model | Population (No. of Patients) | Results |
|---|---|---|---|---|
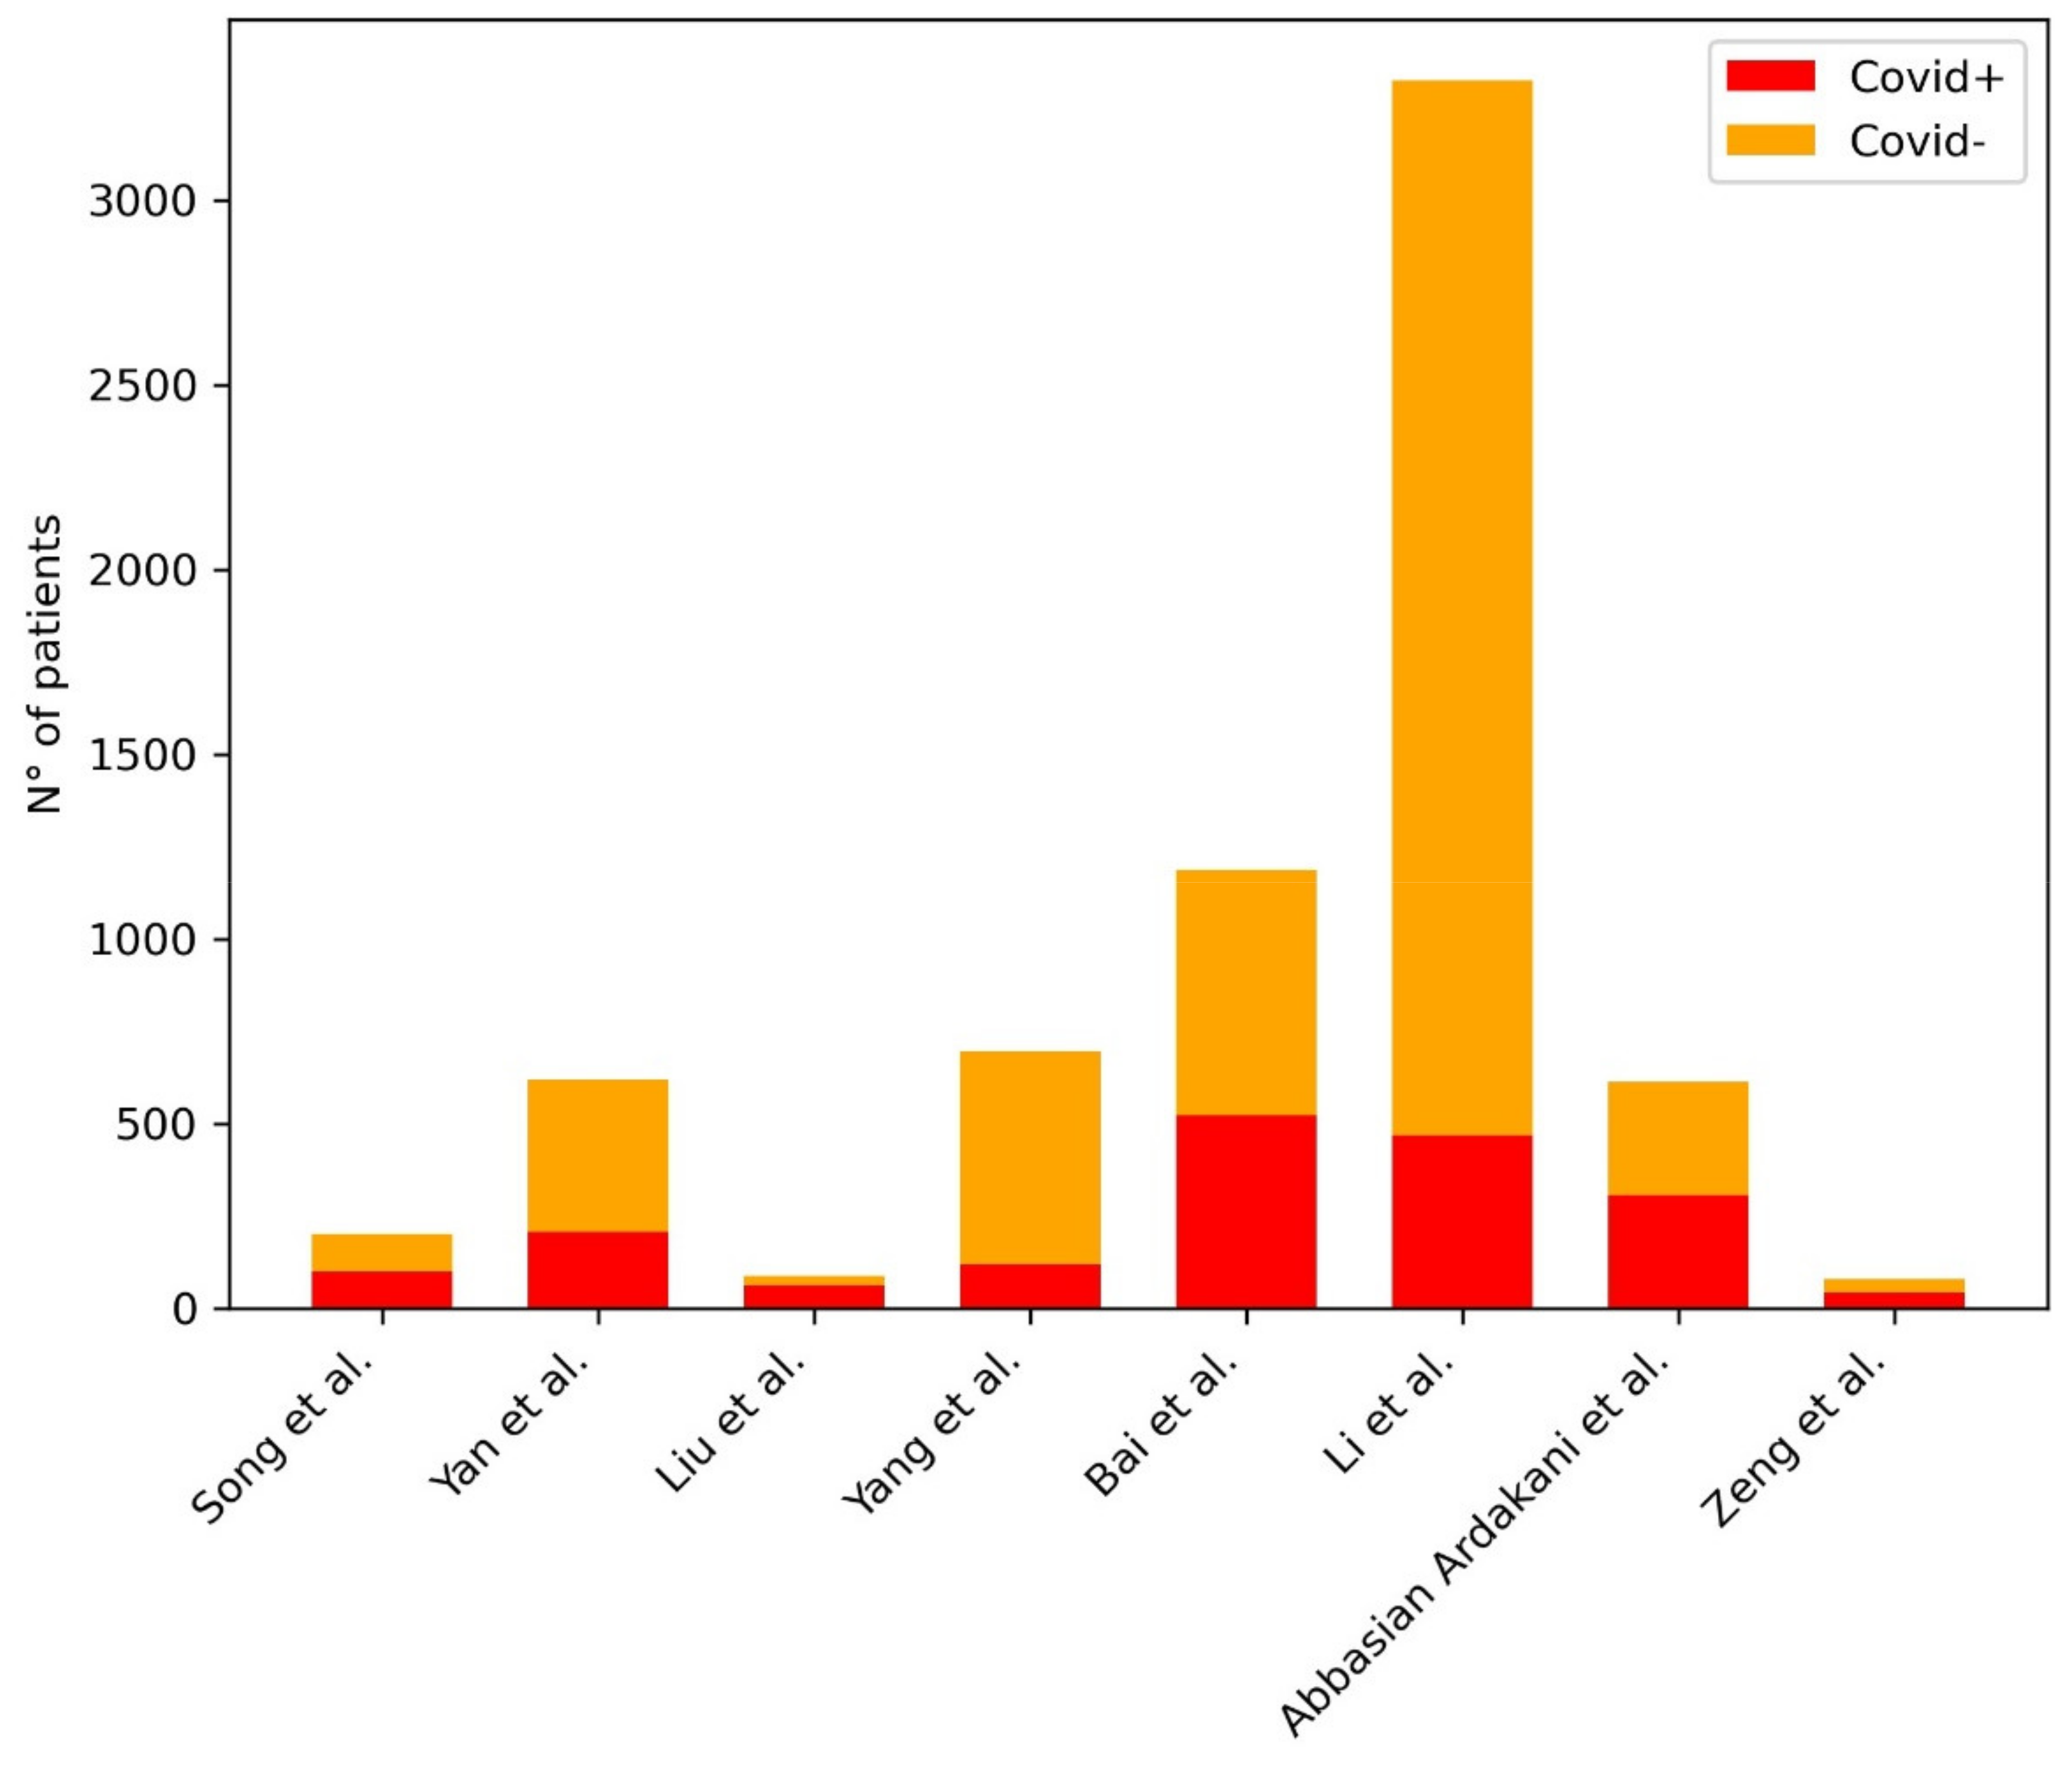
| Song et al. | 2020 | BigBiGAN | 98 COVID+, 103 COVID- | AUC: 0.972—internal test, 0.850—external validation |
| Yan et al. | 2020 | EfficientNetB0 | 206 COVID+, 412 COVID- | AUC: 0.962—per-slice, 0.934—per-scan |
| Liu et al. | 2020 | Radiomics | 61 COVID+, 27 COVID- | AUC: 0.99 |
| Yang et al. | 2020 | ResUNet | 118 COVID+, 576 COVID- | AUC: 0.903 |
| Bai et al. | 2020 | EfficientNet-B4 | 521 COVID+, 665 COVID- | AUC: 0.95—internal testing, 0.90—independent testing |
| Li et al. | 2020 | COVNet (novel) | 468 COVID+, 2854 COVID- | AUC: 0.96 |
| Abbasian Ardakani et al. | 2021 | COVIDiag | 306 COVID+, 306 COVID- | AUC: 0.965 |
| Zeng et al. | 2020 | Radiomics | 41 COVID+, 37 COVID- | AUC: 0.87 |
Publisher’s Note: MDPI stays neutral with regard to jurisdictional claims in published maps and institutional affiliations. |
© 2021 by the authors. Licensee MDPI, Basel, Switzerland. This article is an open access article distributed under the terms and conditions of the Creative Commons Attribution (CC BY) license (https://creativecommons.org/licenses/by/4.0/).
Share and Cite
Laino, M.E.; Ammirabile, A.; Posa, A.; Cancian, P.; Shalaby, S.; Savevski, V.; Neri, E. The Applications of Artificial Intelligence in Chest Imaging of COVID-19 Patients: A Literature Review. Diagnostics 2021, 11, 1317. https://doi.org/10.3390/diagnostics11081317
Laino ME, Ammirabile A, Posa A, Cancian P, Shalaby S, Savevski V, Neri E. The Applications of Artificial Intelligence in Chest Imaging of COVID-19 Patients: A Literature Review. Diagnostics. 2021; 11(8):1317. https://doi.org/10.3390/diagnostics11081317
Chicago/Turabian StyleLaino, Maria Elena, Angela Ammirabile, Alessandro Posa, Pierandrea Cancian, Sherif Shalaby, Victor Savevski, and Emanuele Neri. 2021. "The Applications of Artificial Intelligence in Chest Imaging of COVID-19 Patients: A Literature Review" Diagnostics 11, no. 8: 1317. https://doi.org/10.3390/diagnostics11081317