Exploration of Youth’s Digital Competencies: A Dataset in the Educational Context of Vietnam

 , ,
, ,  ,
,  and
and 
Abstract
:1. Summary
2. Data Description
2.1. Group (1) Personal Background Questions
2.1.1. Domain (1): Student Personal Background
2.1.2. Domain (2): Access and Usage of Digital Devices
2.1.3. Domain (3): Socioeconomic Status (SES)
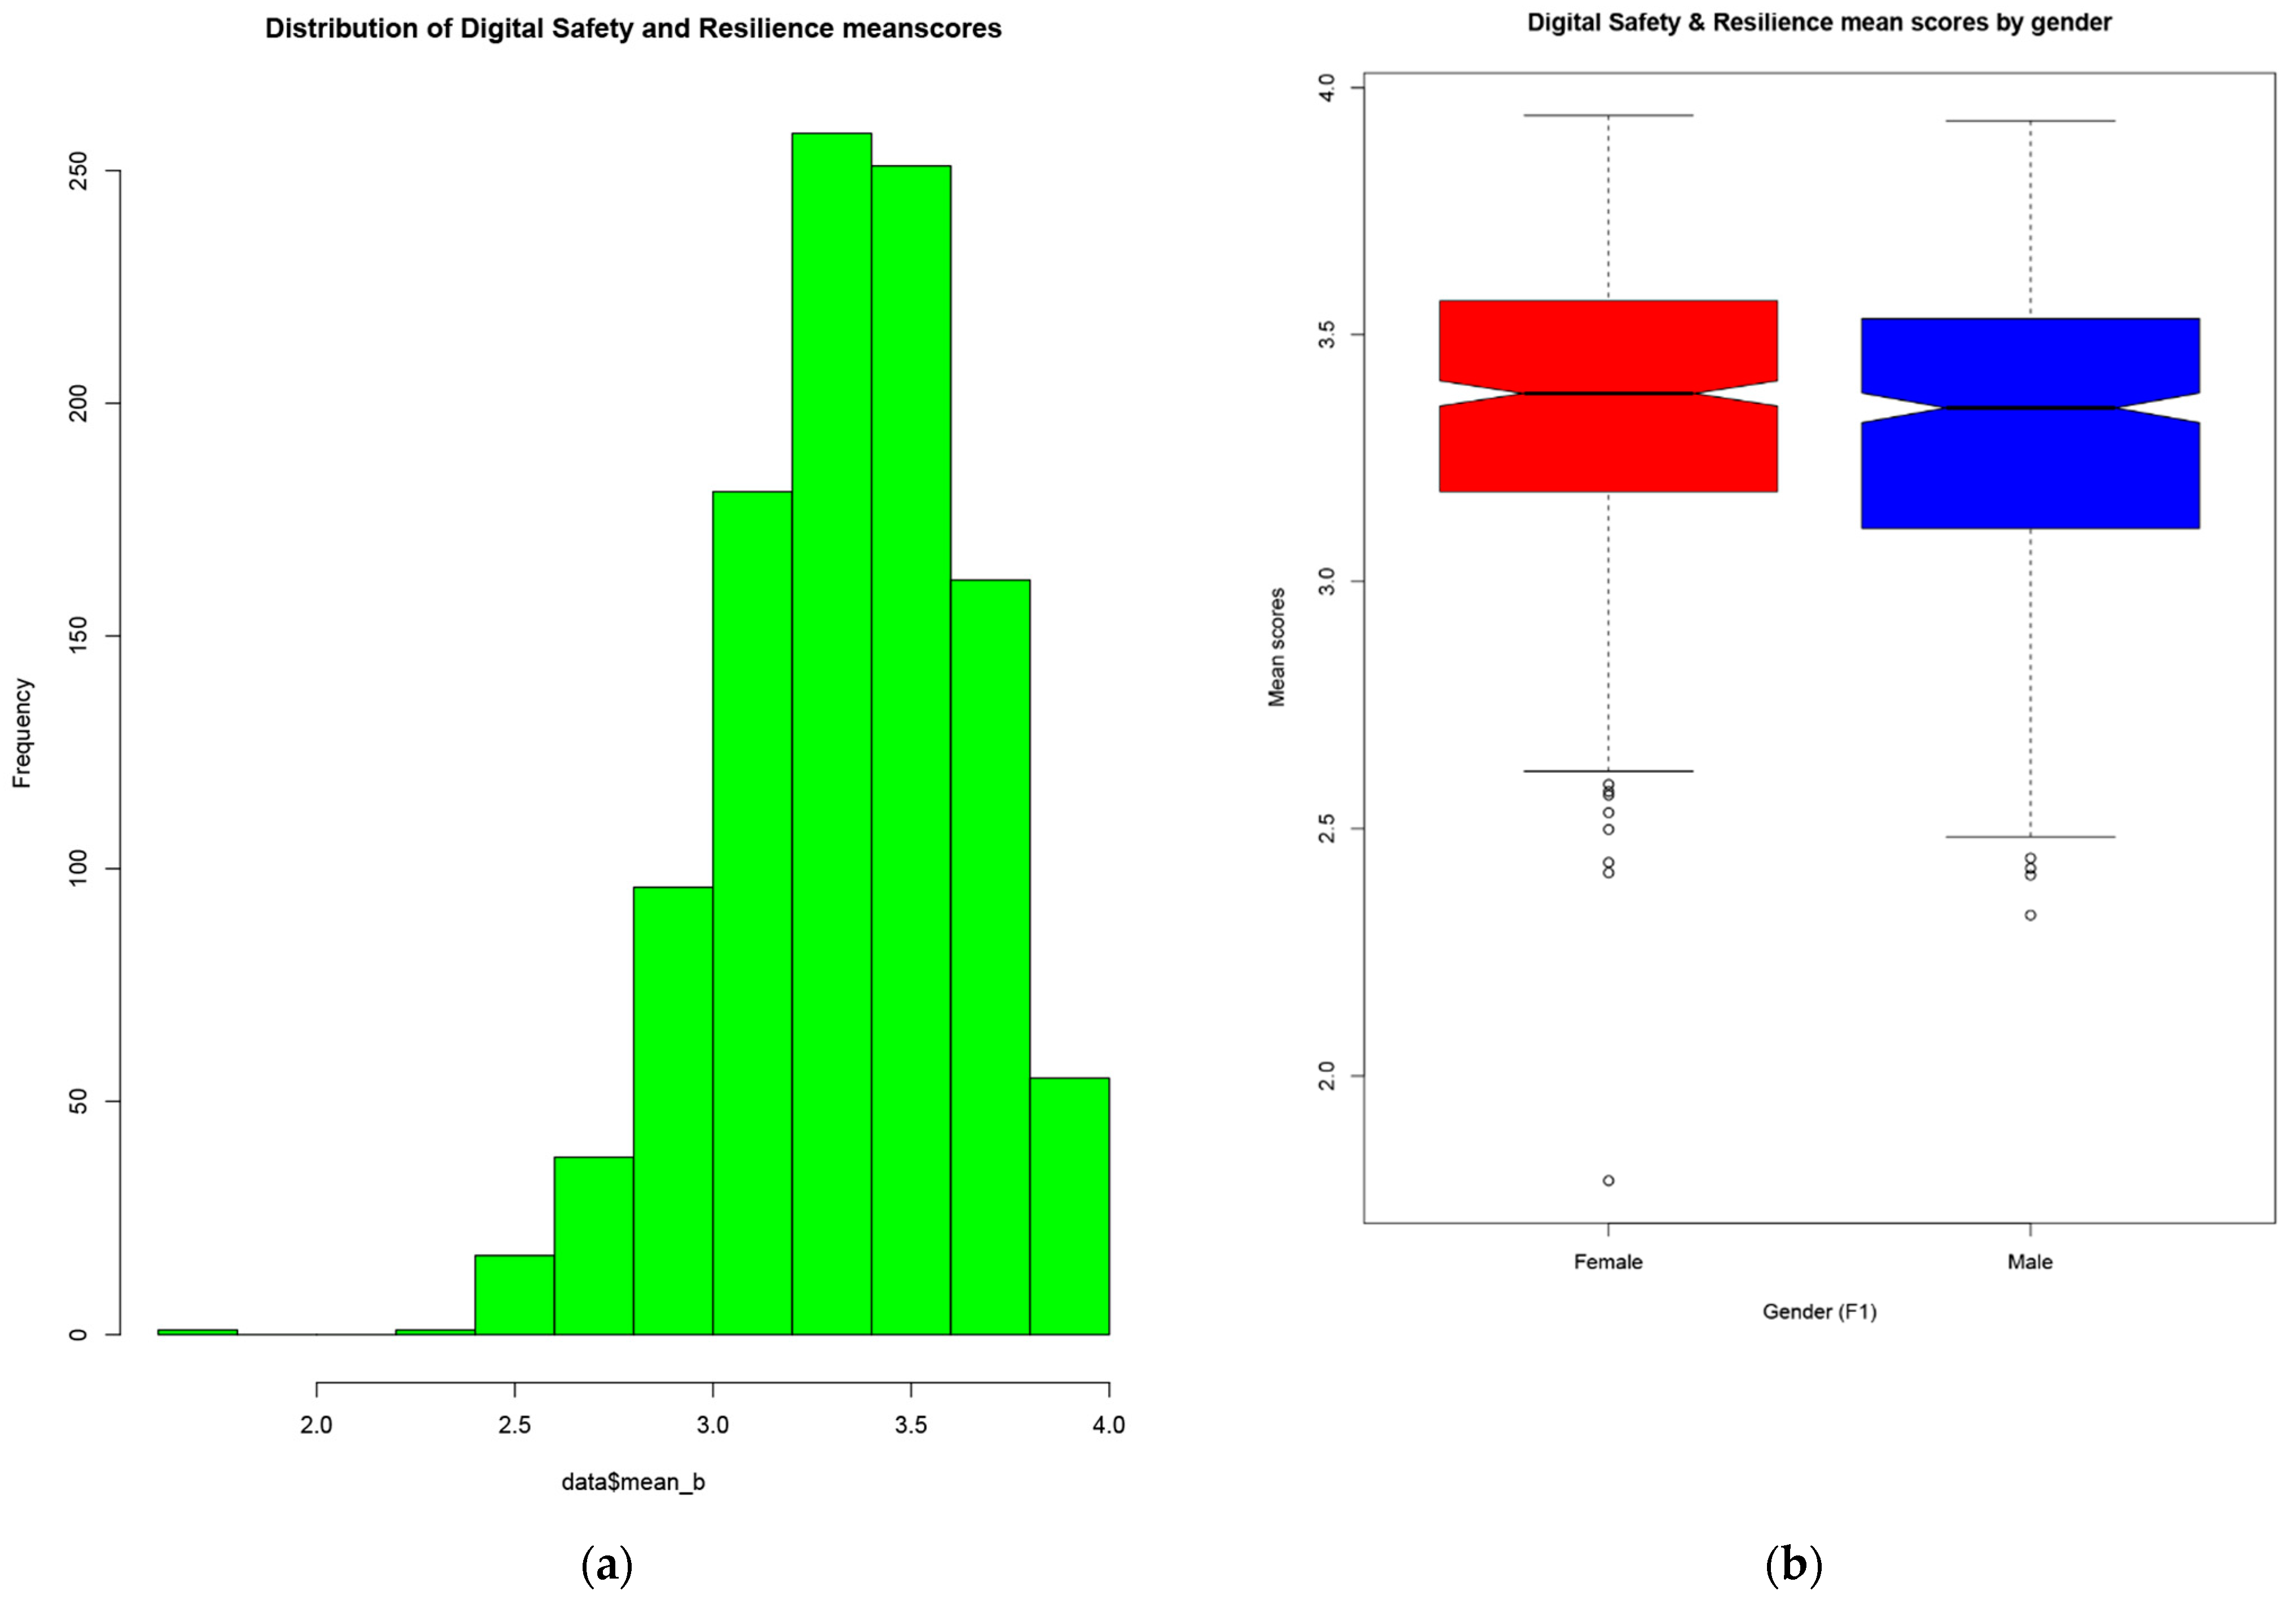
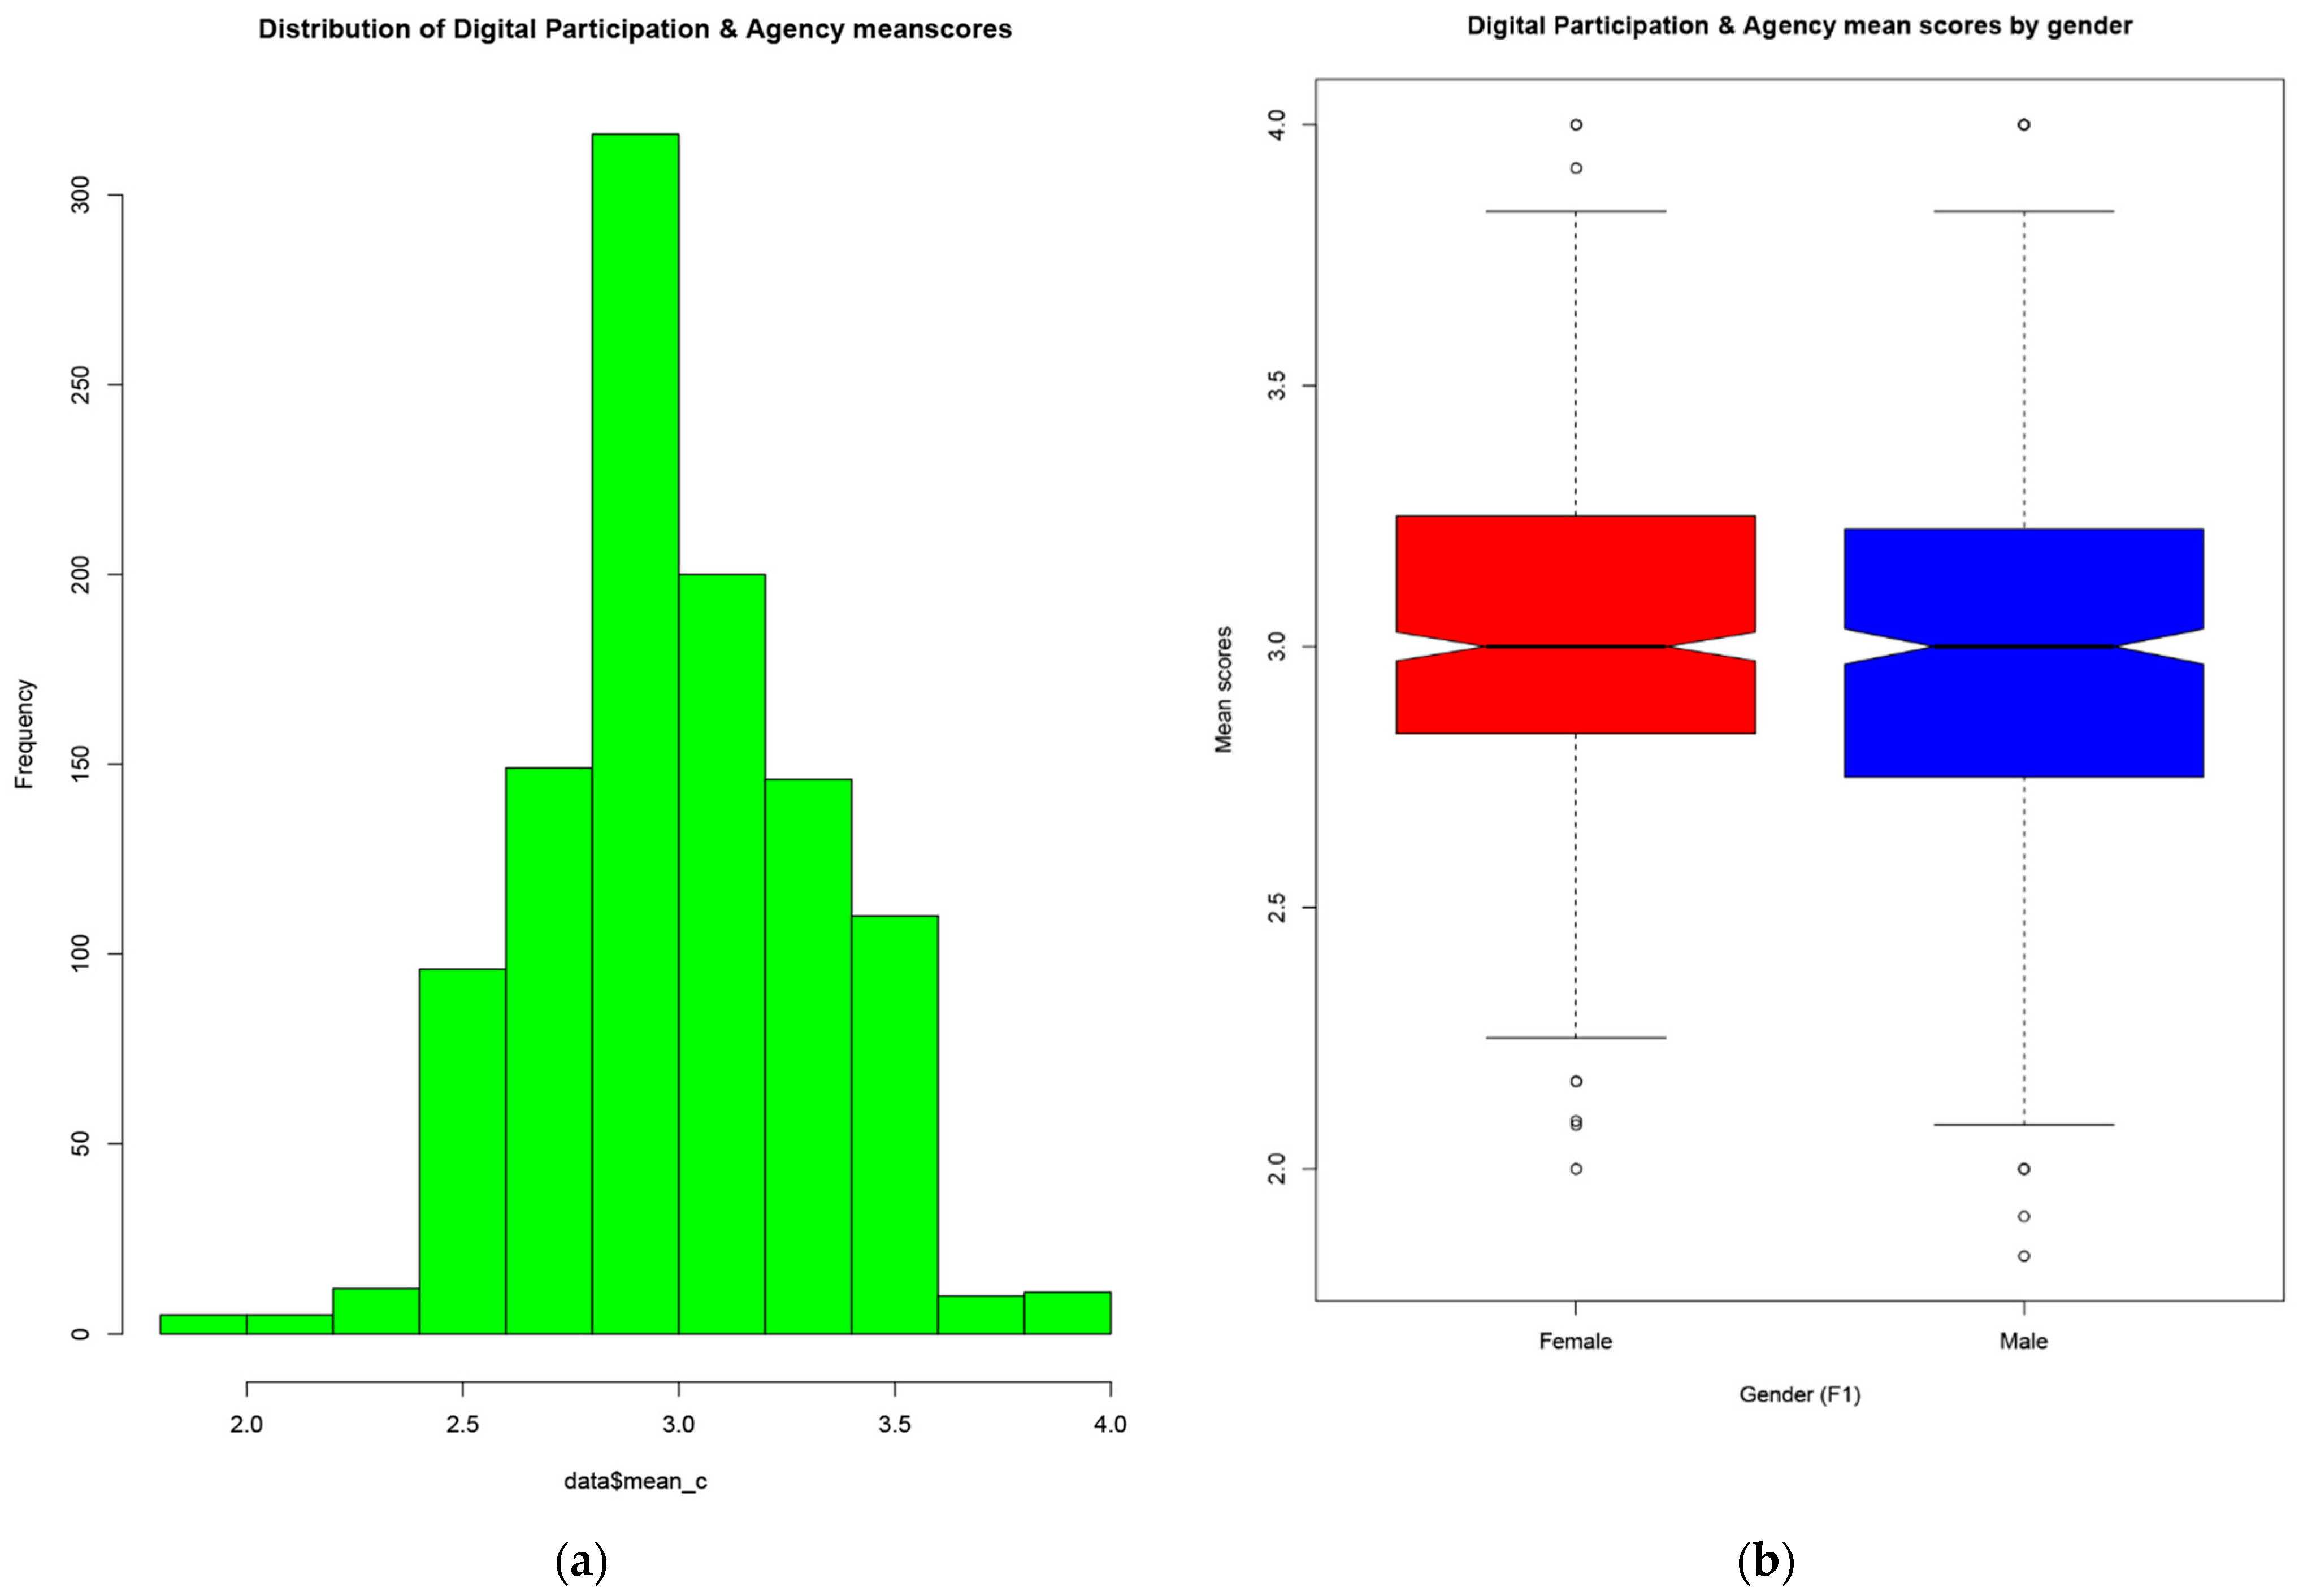
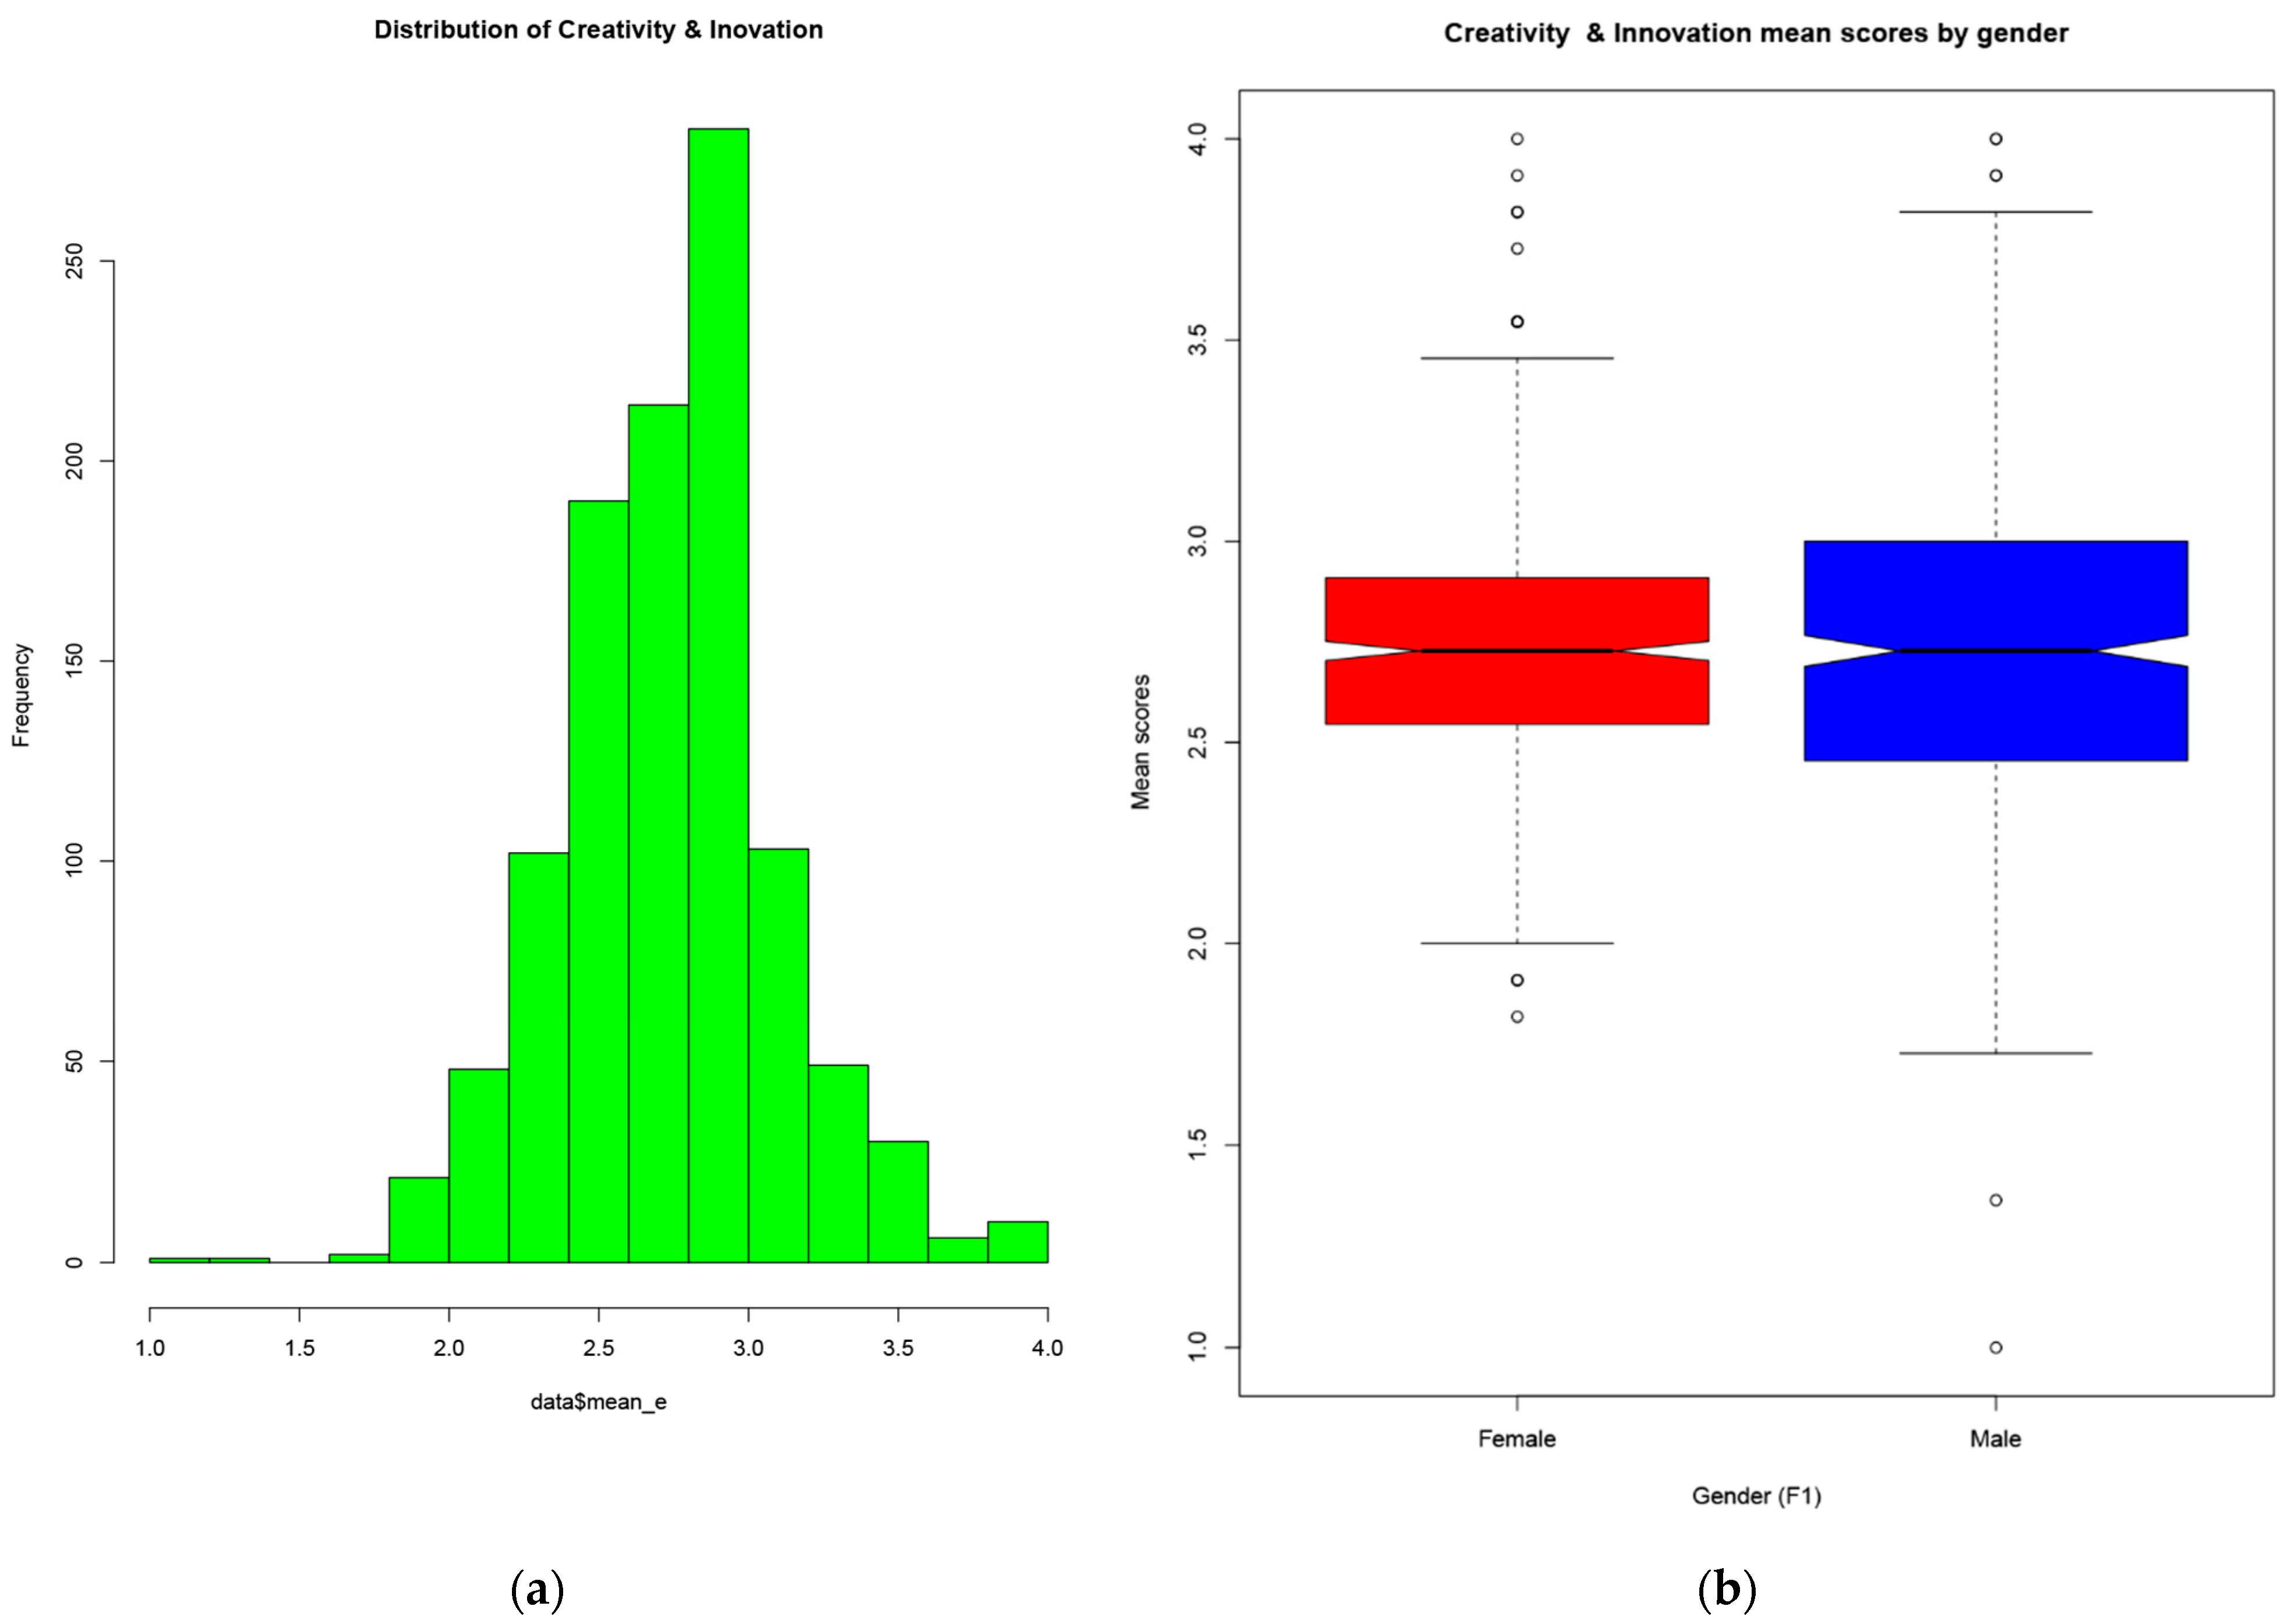
2.2. Group (2) Competency Questions
2.3. Potential Research Questions
- What are the background factors that could affect students’ digital competency levels?
- How do socioeconomic conditions affect students’ digital competency levels?
- What are the factors related to the access and usage of digital devices that could affect the digital competencies of students in any domains?
- Is there any relationship between high academic expectation and students’ digital competency levels?
- Is there any correlation among the five domains of digital competencies?
- Are there any differences in the digital competency levels of male and female school students?
3. Methods
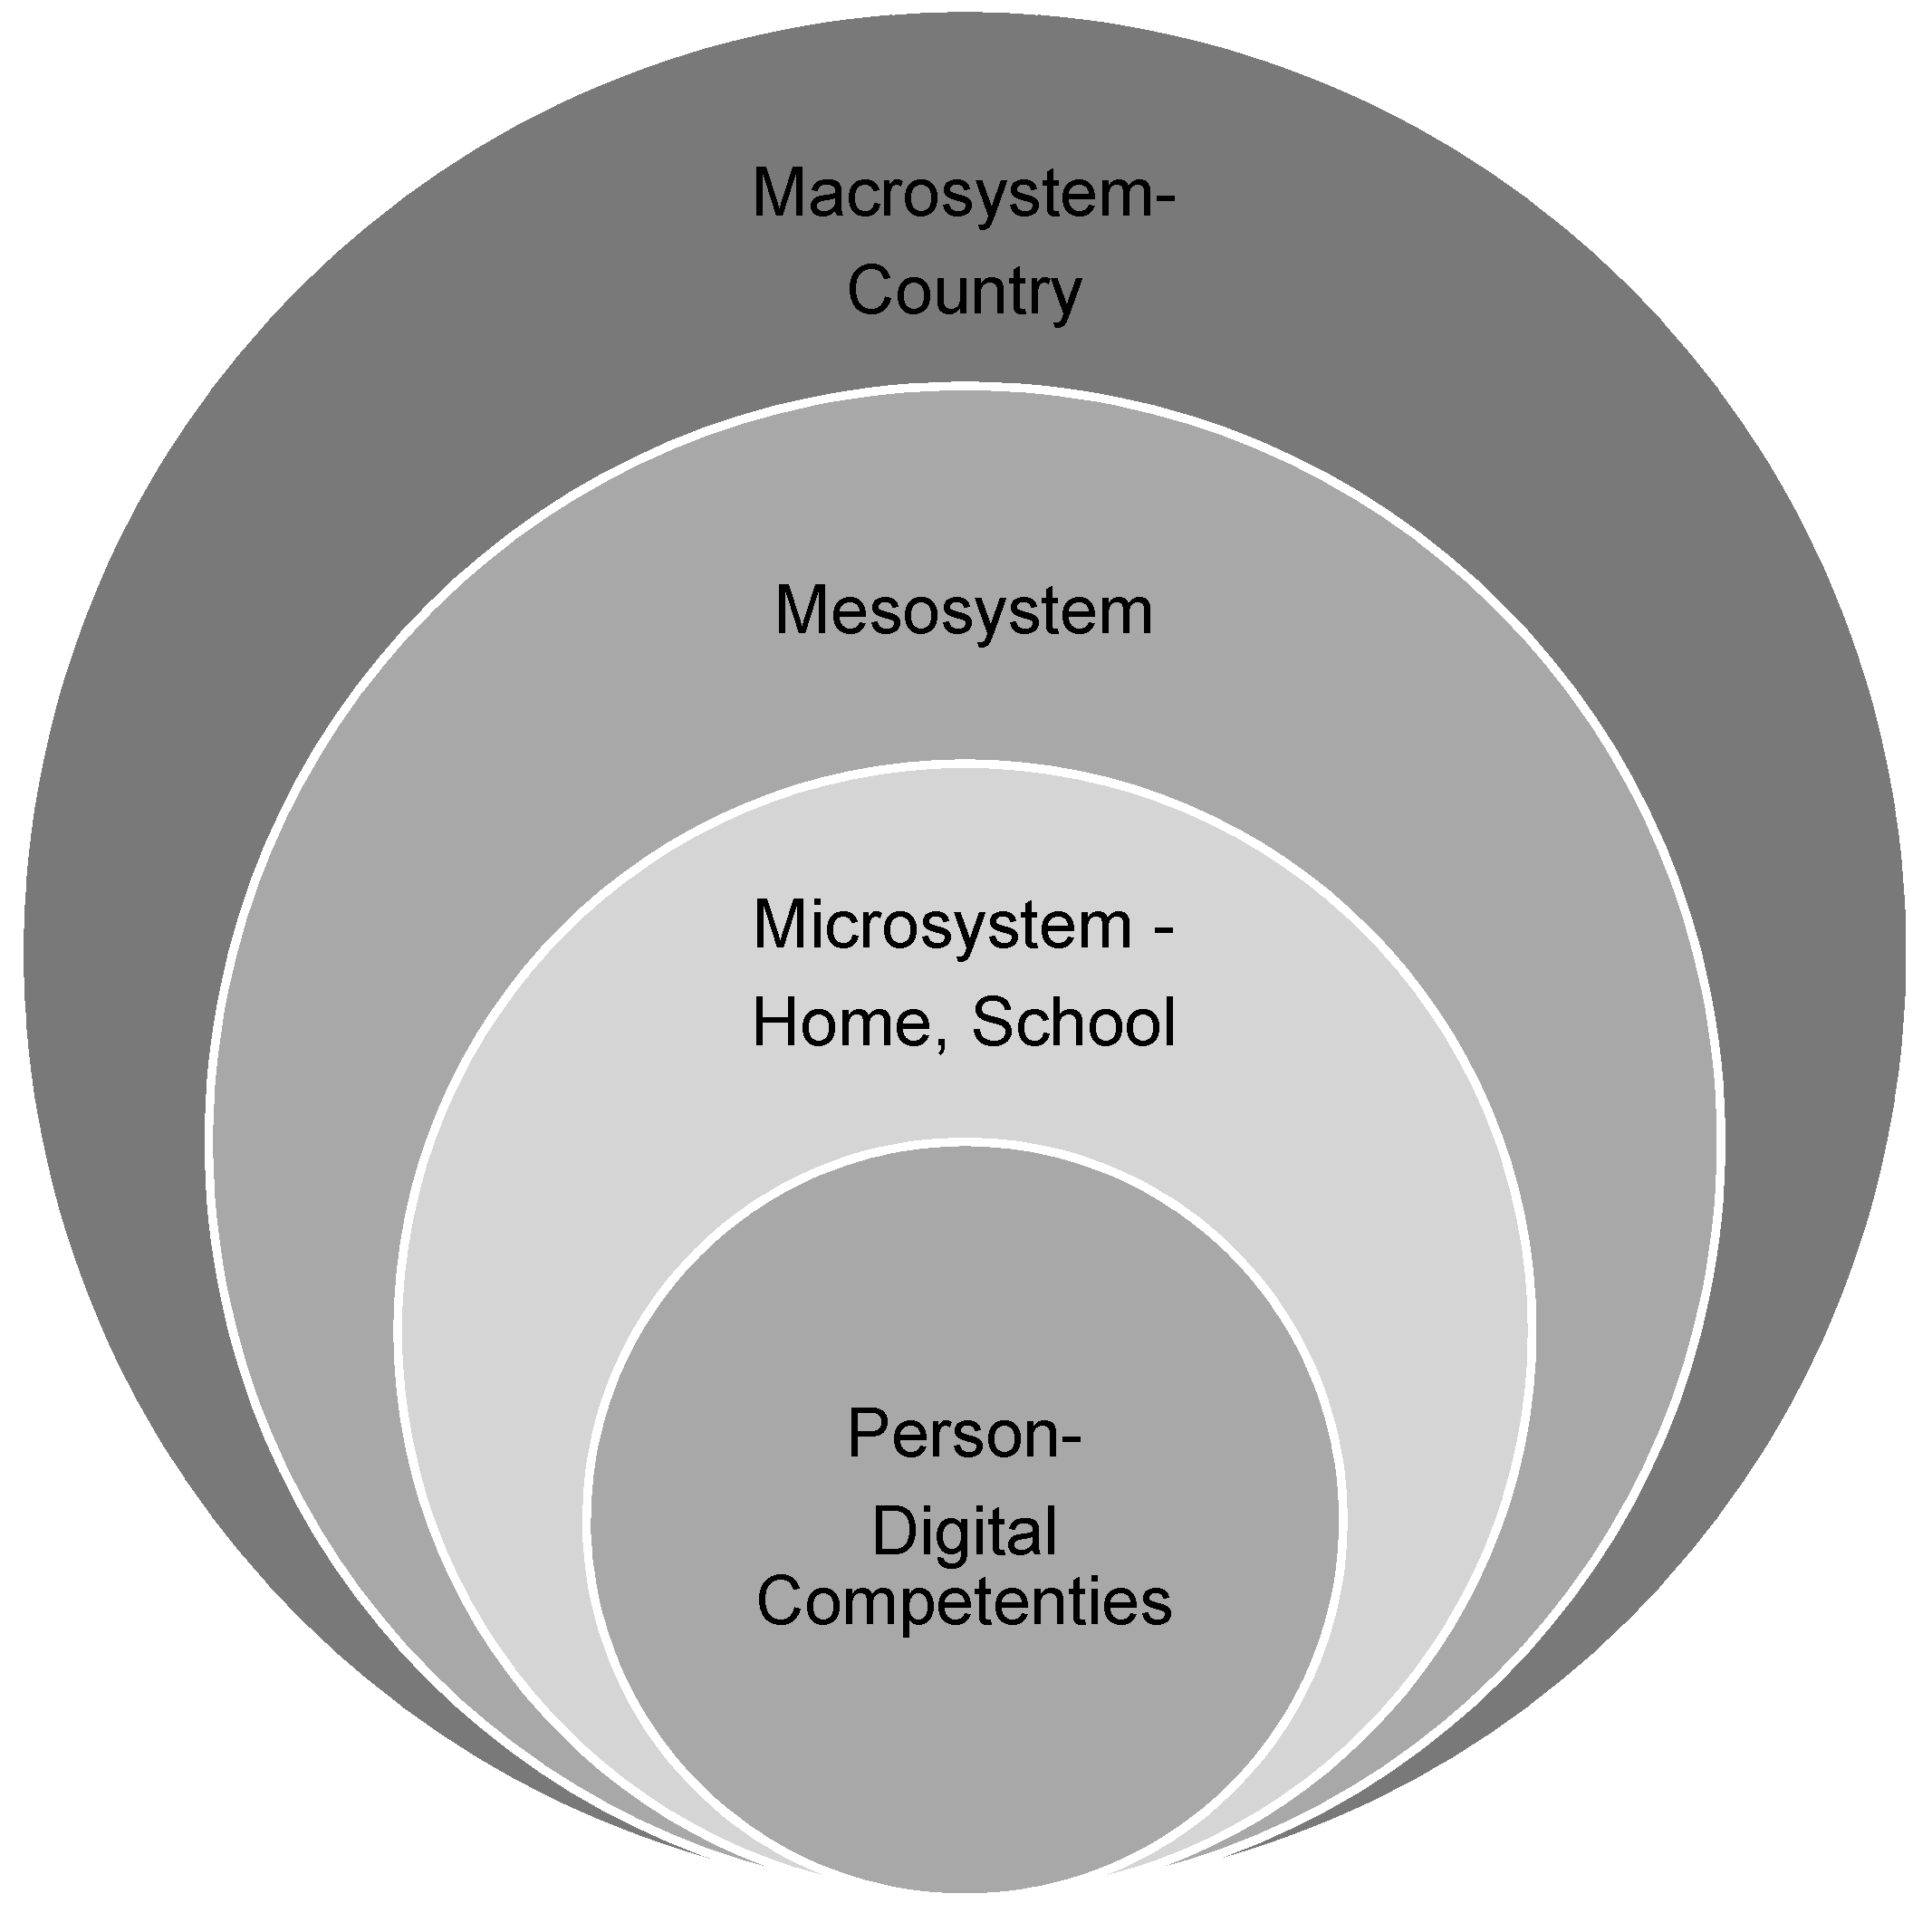
3.1. Research Framework
- ○
- Personal level within the microsystem;
- ○
- Social mediation level, primarily concerning home, school system, and peer networks within the mesosystem; and
- ○
- National level where the country is the subject of analysis, and the macro levels of socioeconomic classification, systems of regulation, and cultural values act as influential factors.
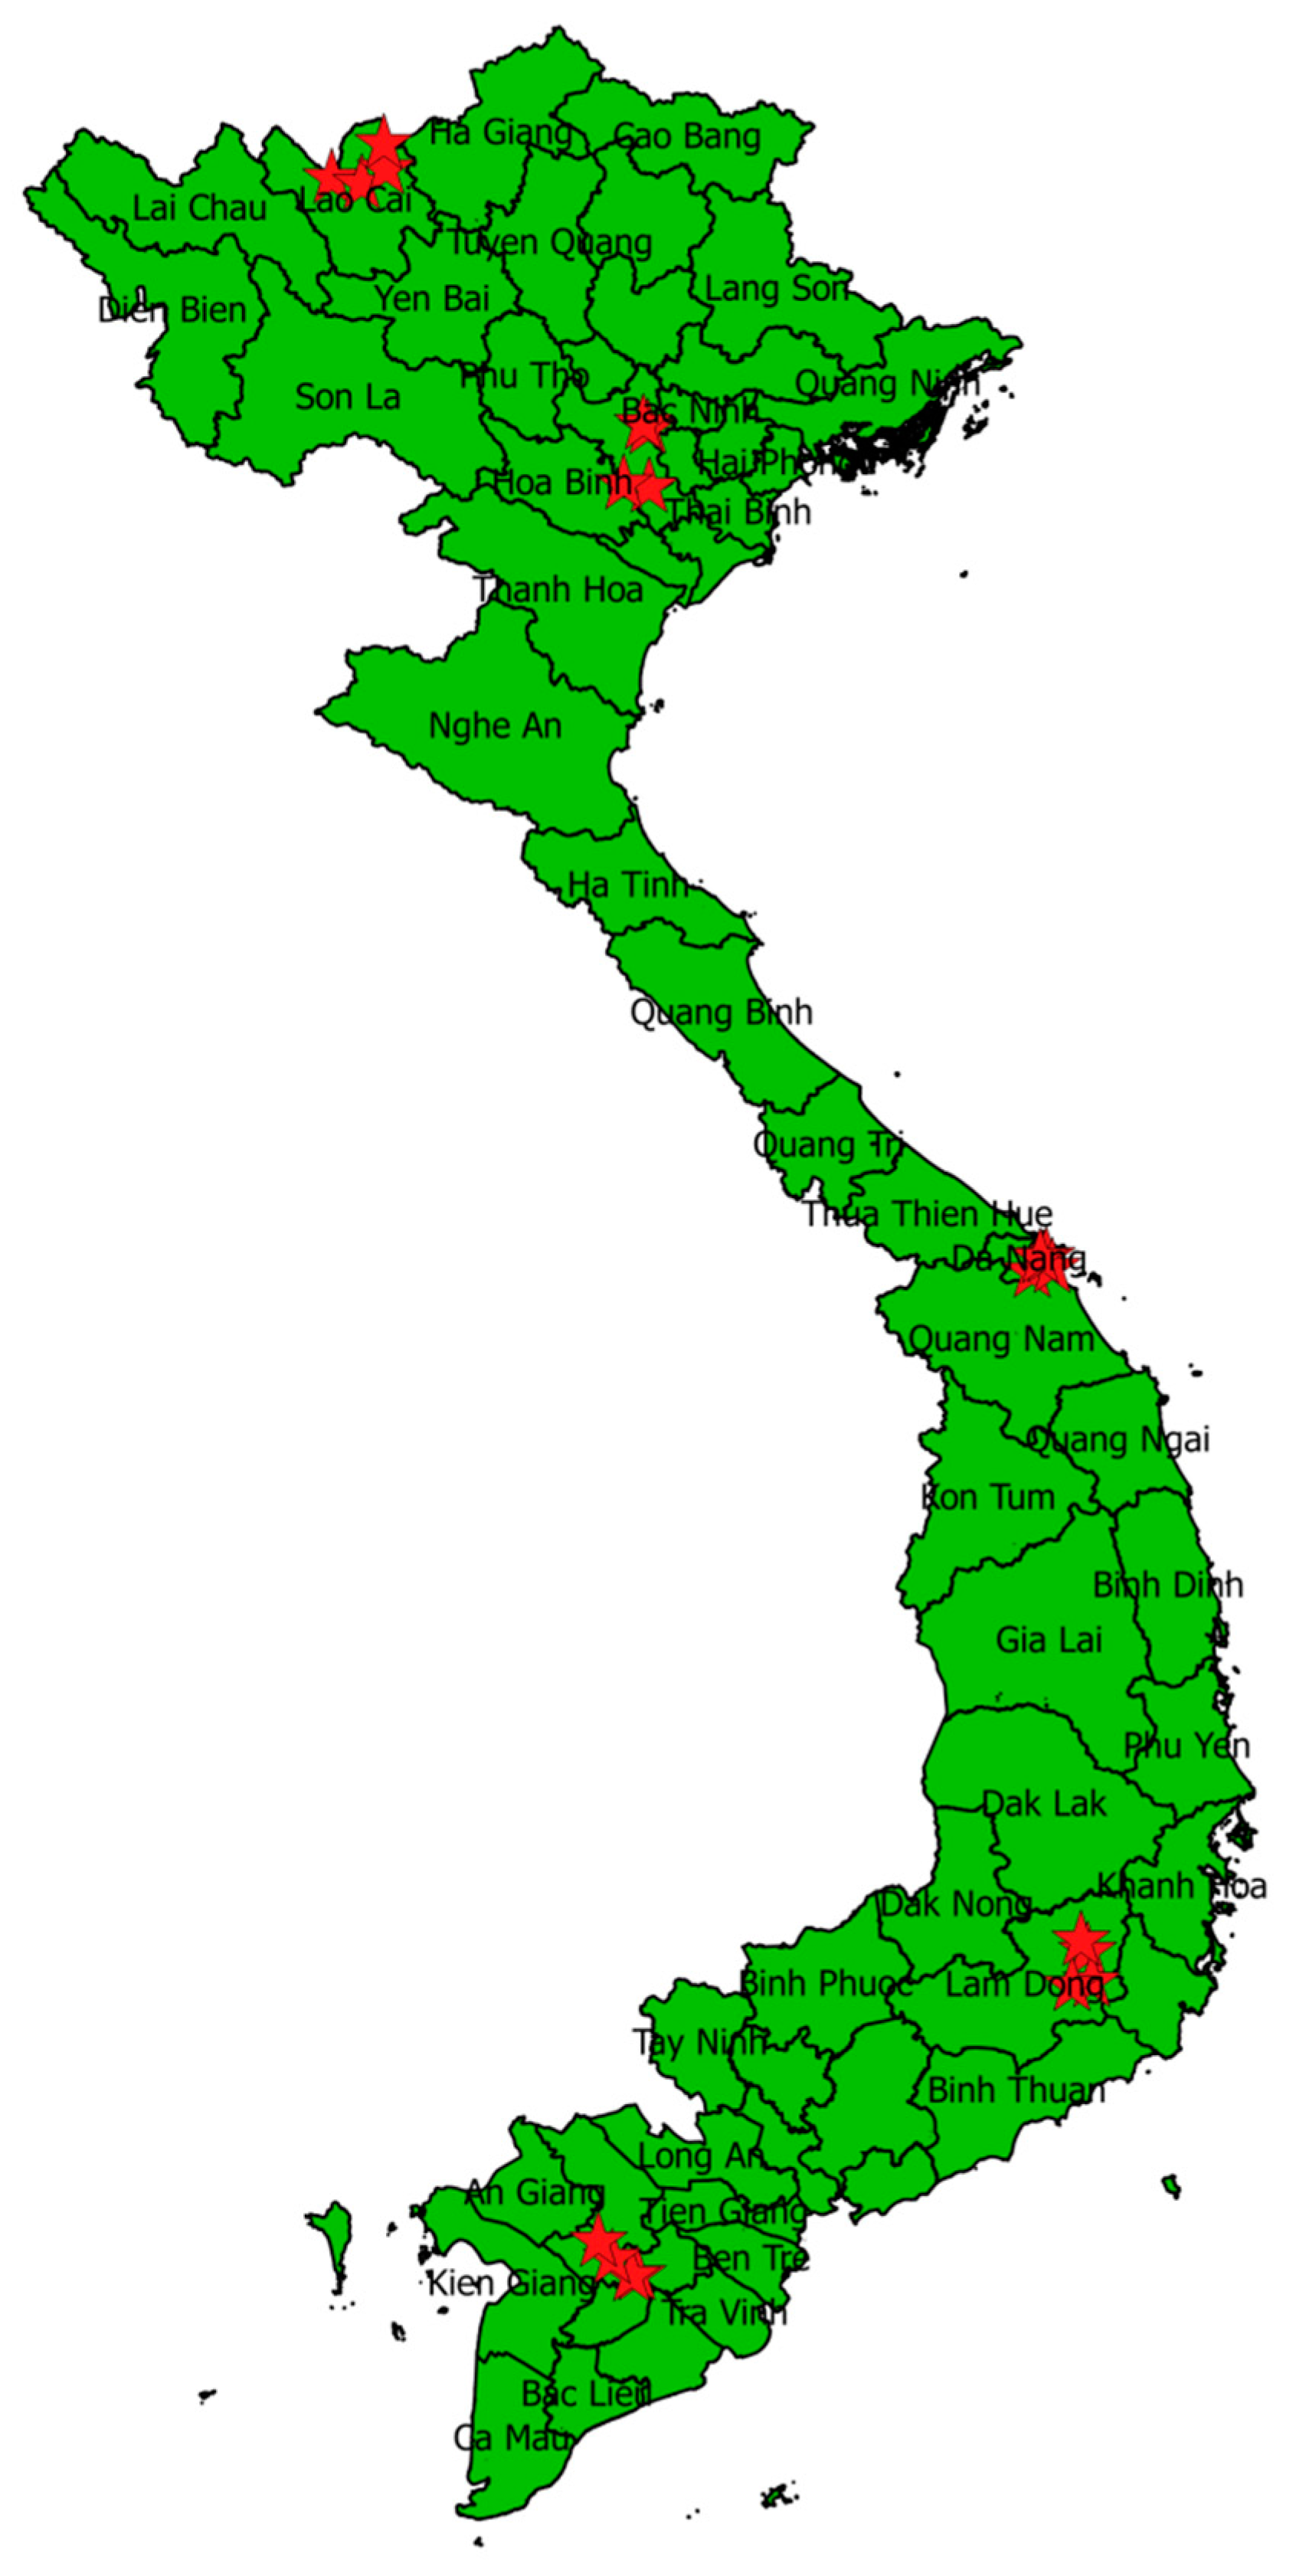
3.2. Data Collection
3.3. Data Analysis
3.3.1. Frequentist Analysis
| >t=file.choose() >data=read.csv(t, header=T, na.strings=“99”) >attach(data) > ds = lm(mean_b3 ~ factor(g1) + factor(f6) + factor(h2), data=data) > summary(ds) |
- Y = −0.182 − 0.034 × G1 (Less than 1 year) + 0.035 × G1 (1–2 years)
- + 0.046 × G1 (3–4 years) + 0.062 × G1 (More than 5 years) + 0.083 × F6 (Upper secondary)
- + 0.148 × F6 (Post-secondary) + 0.203 × F6 (Master/Doctoral) + 0.159 × F6 (I don’t know)
- + 0.019 × H2 (No education) − 0.008 × H2 (Primary) + 0.013 H2 (Lower secondary)
- −0.049 × H2 (Post-education) − 0.125 × H2 (Masters/Doctoral) − (−0.061) × H2 (I don’t know)
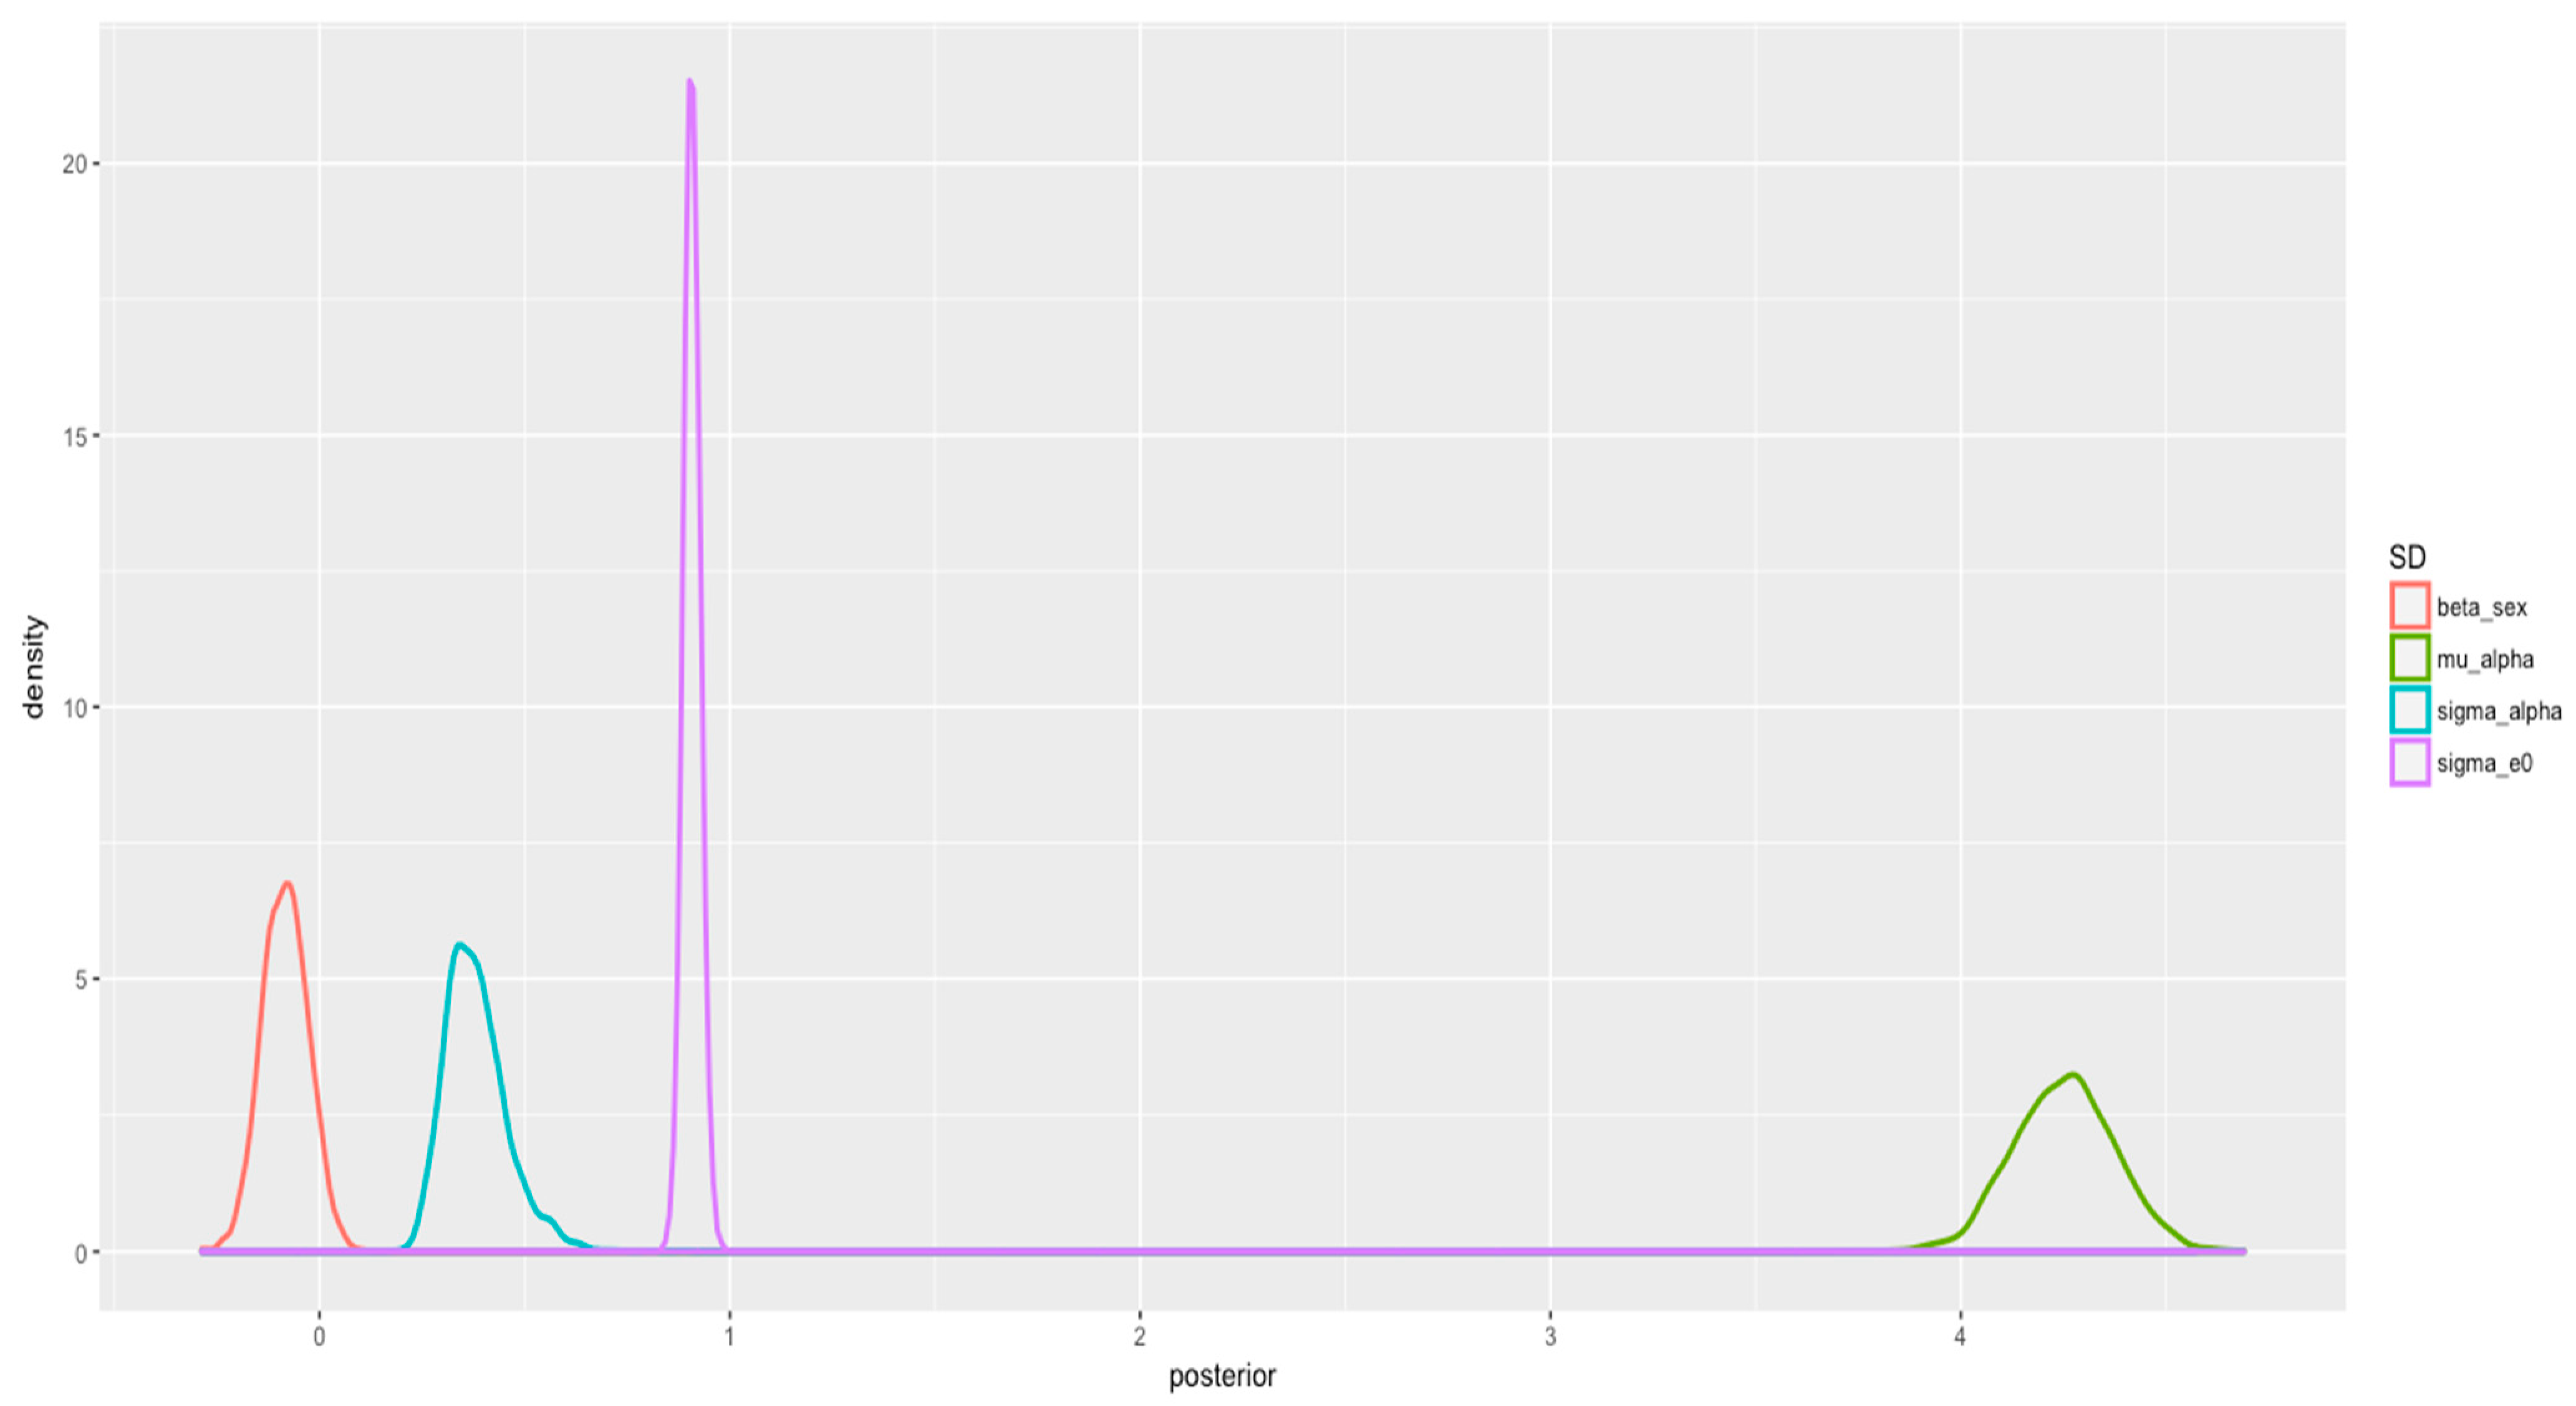
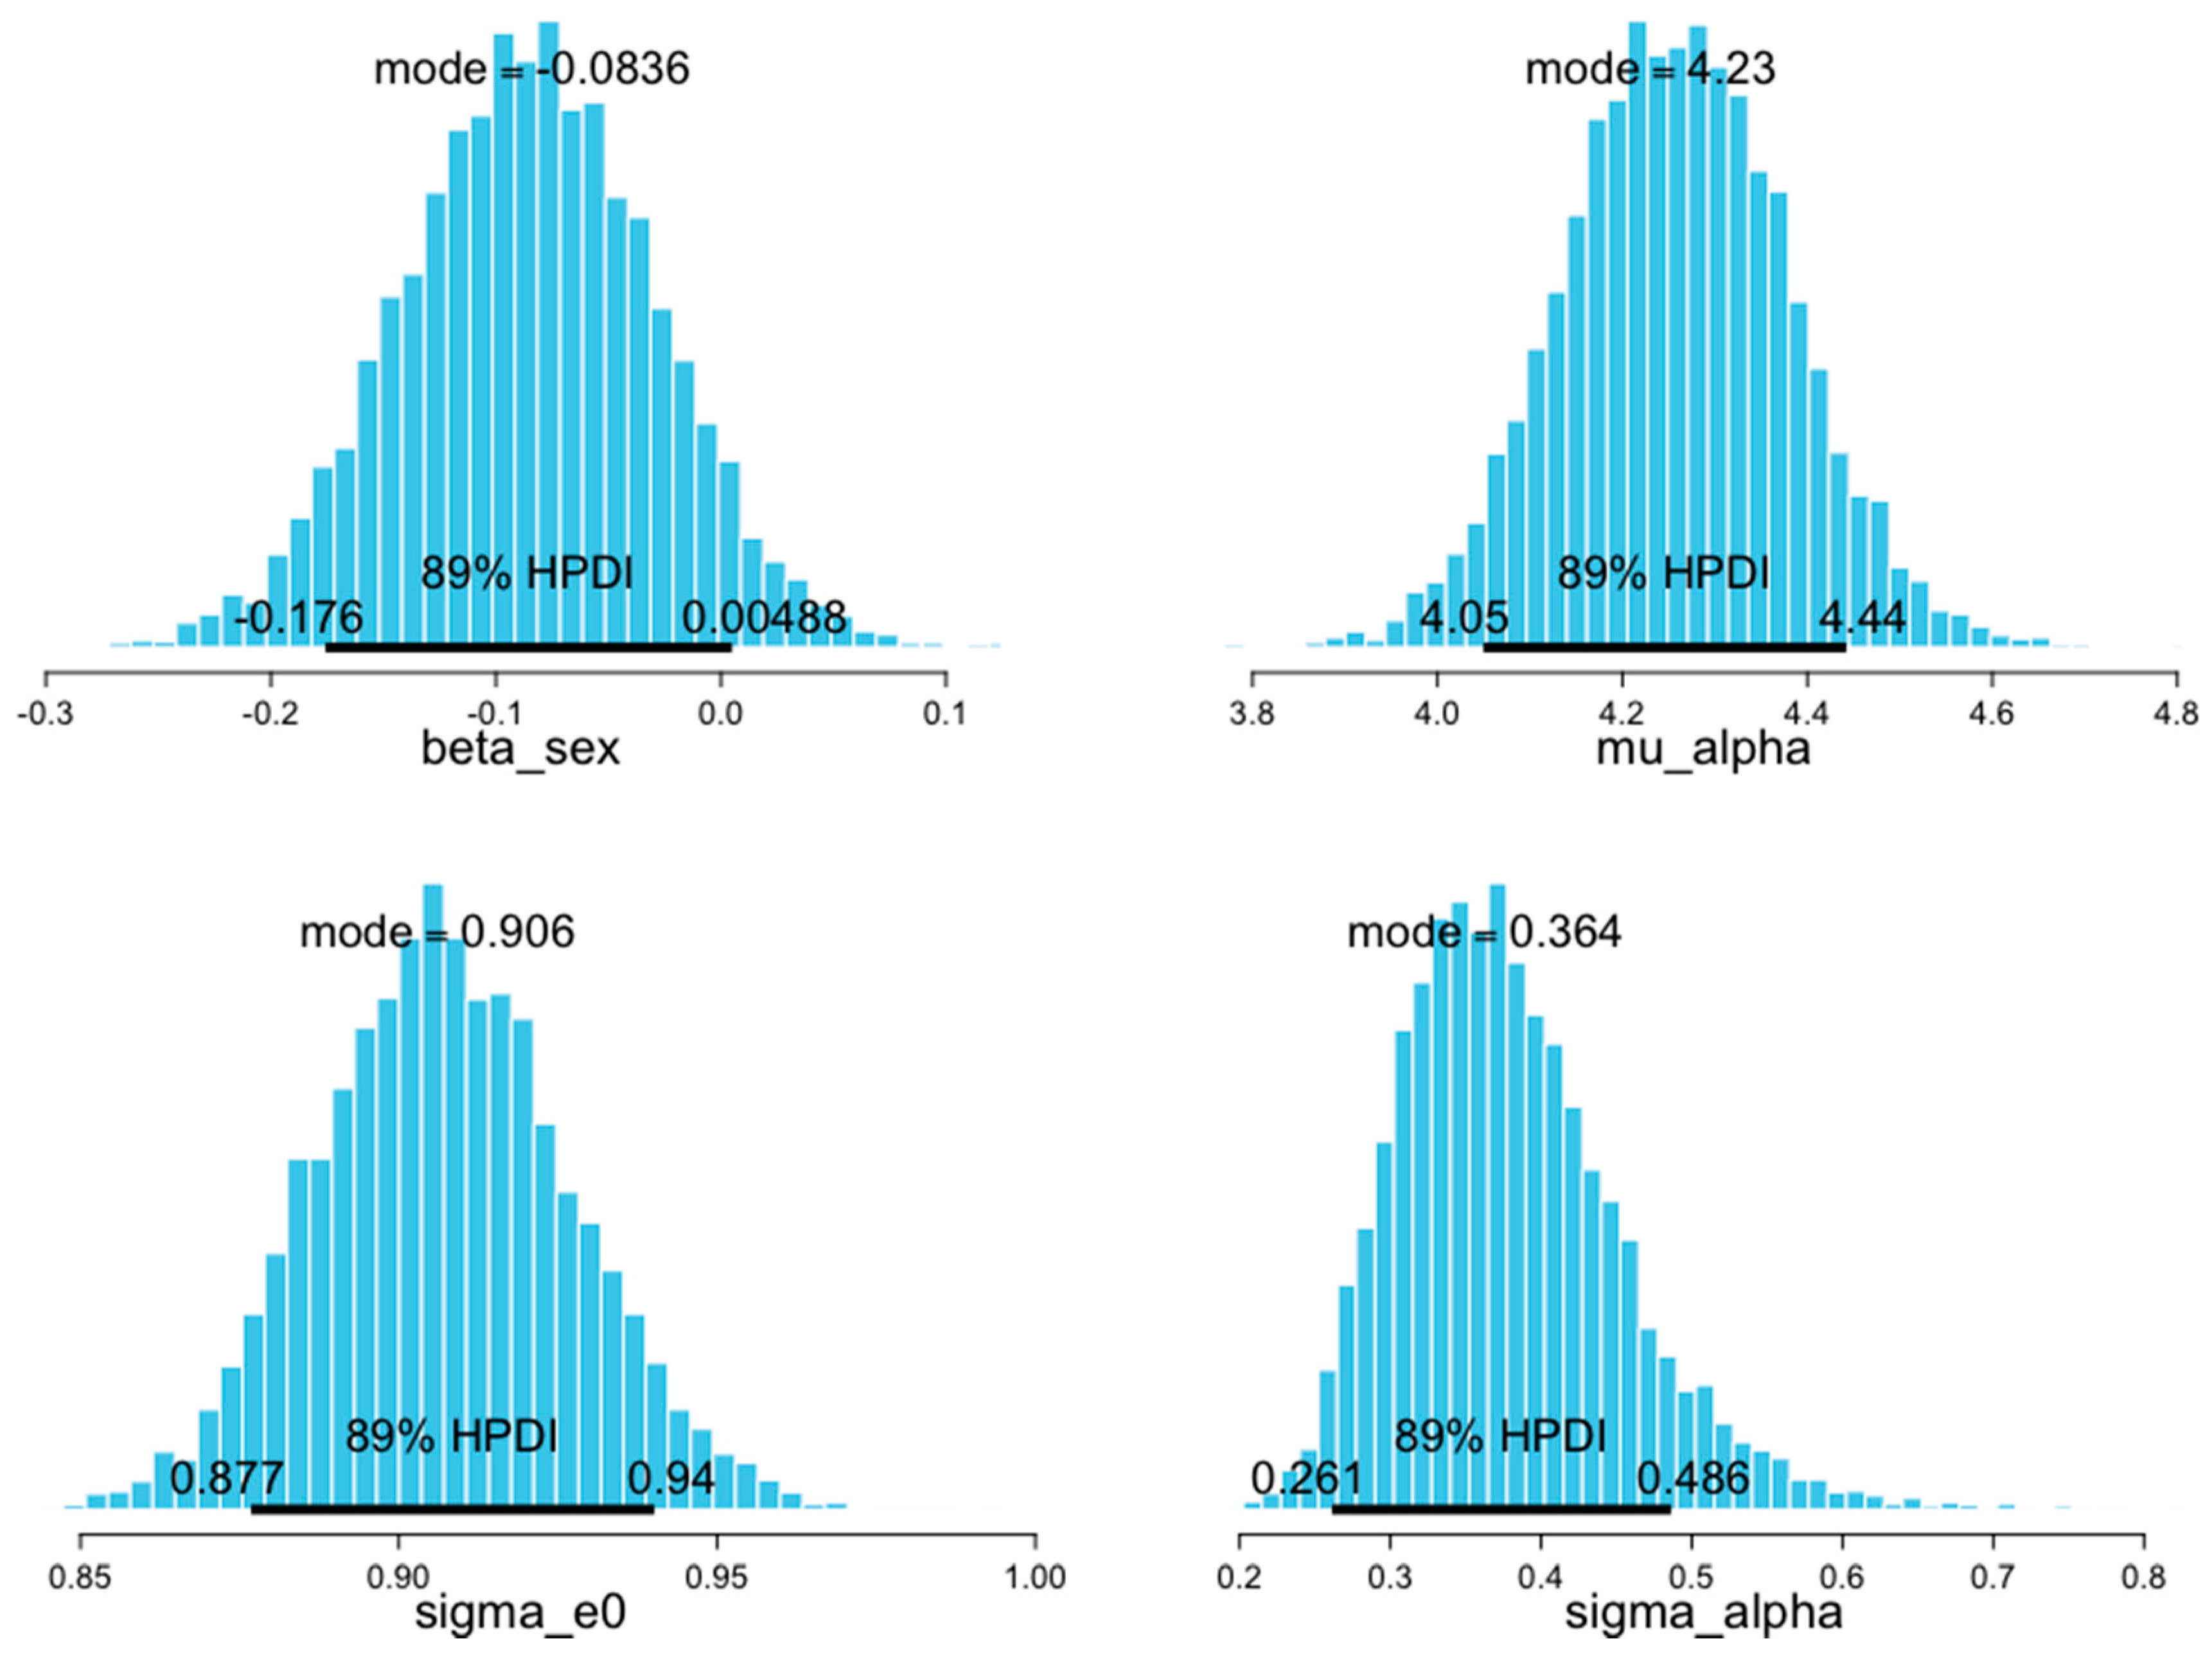
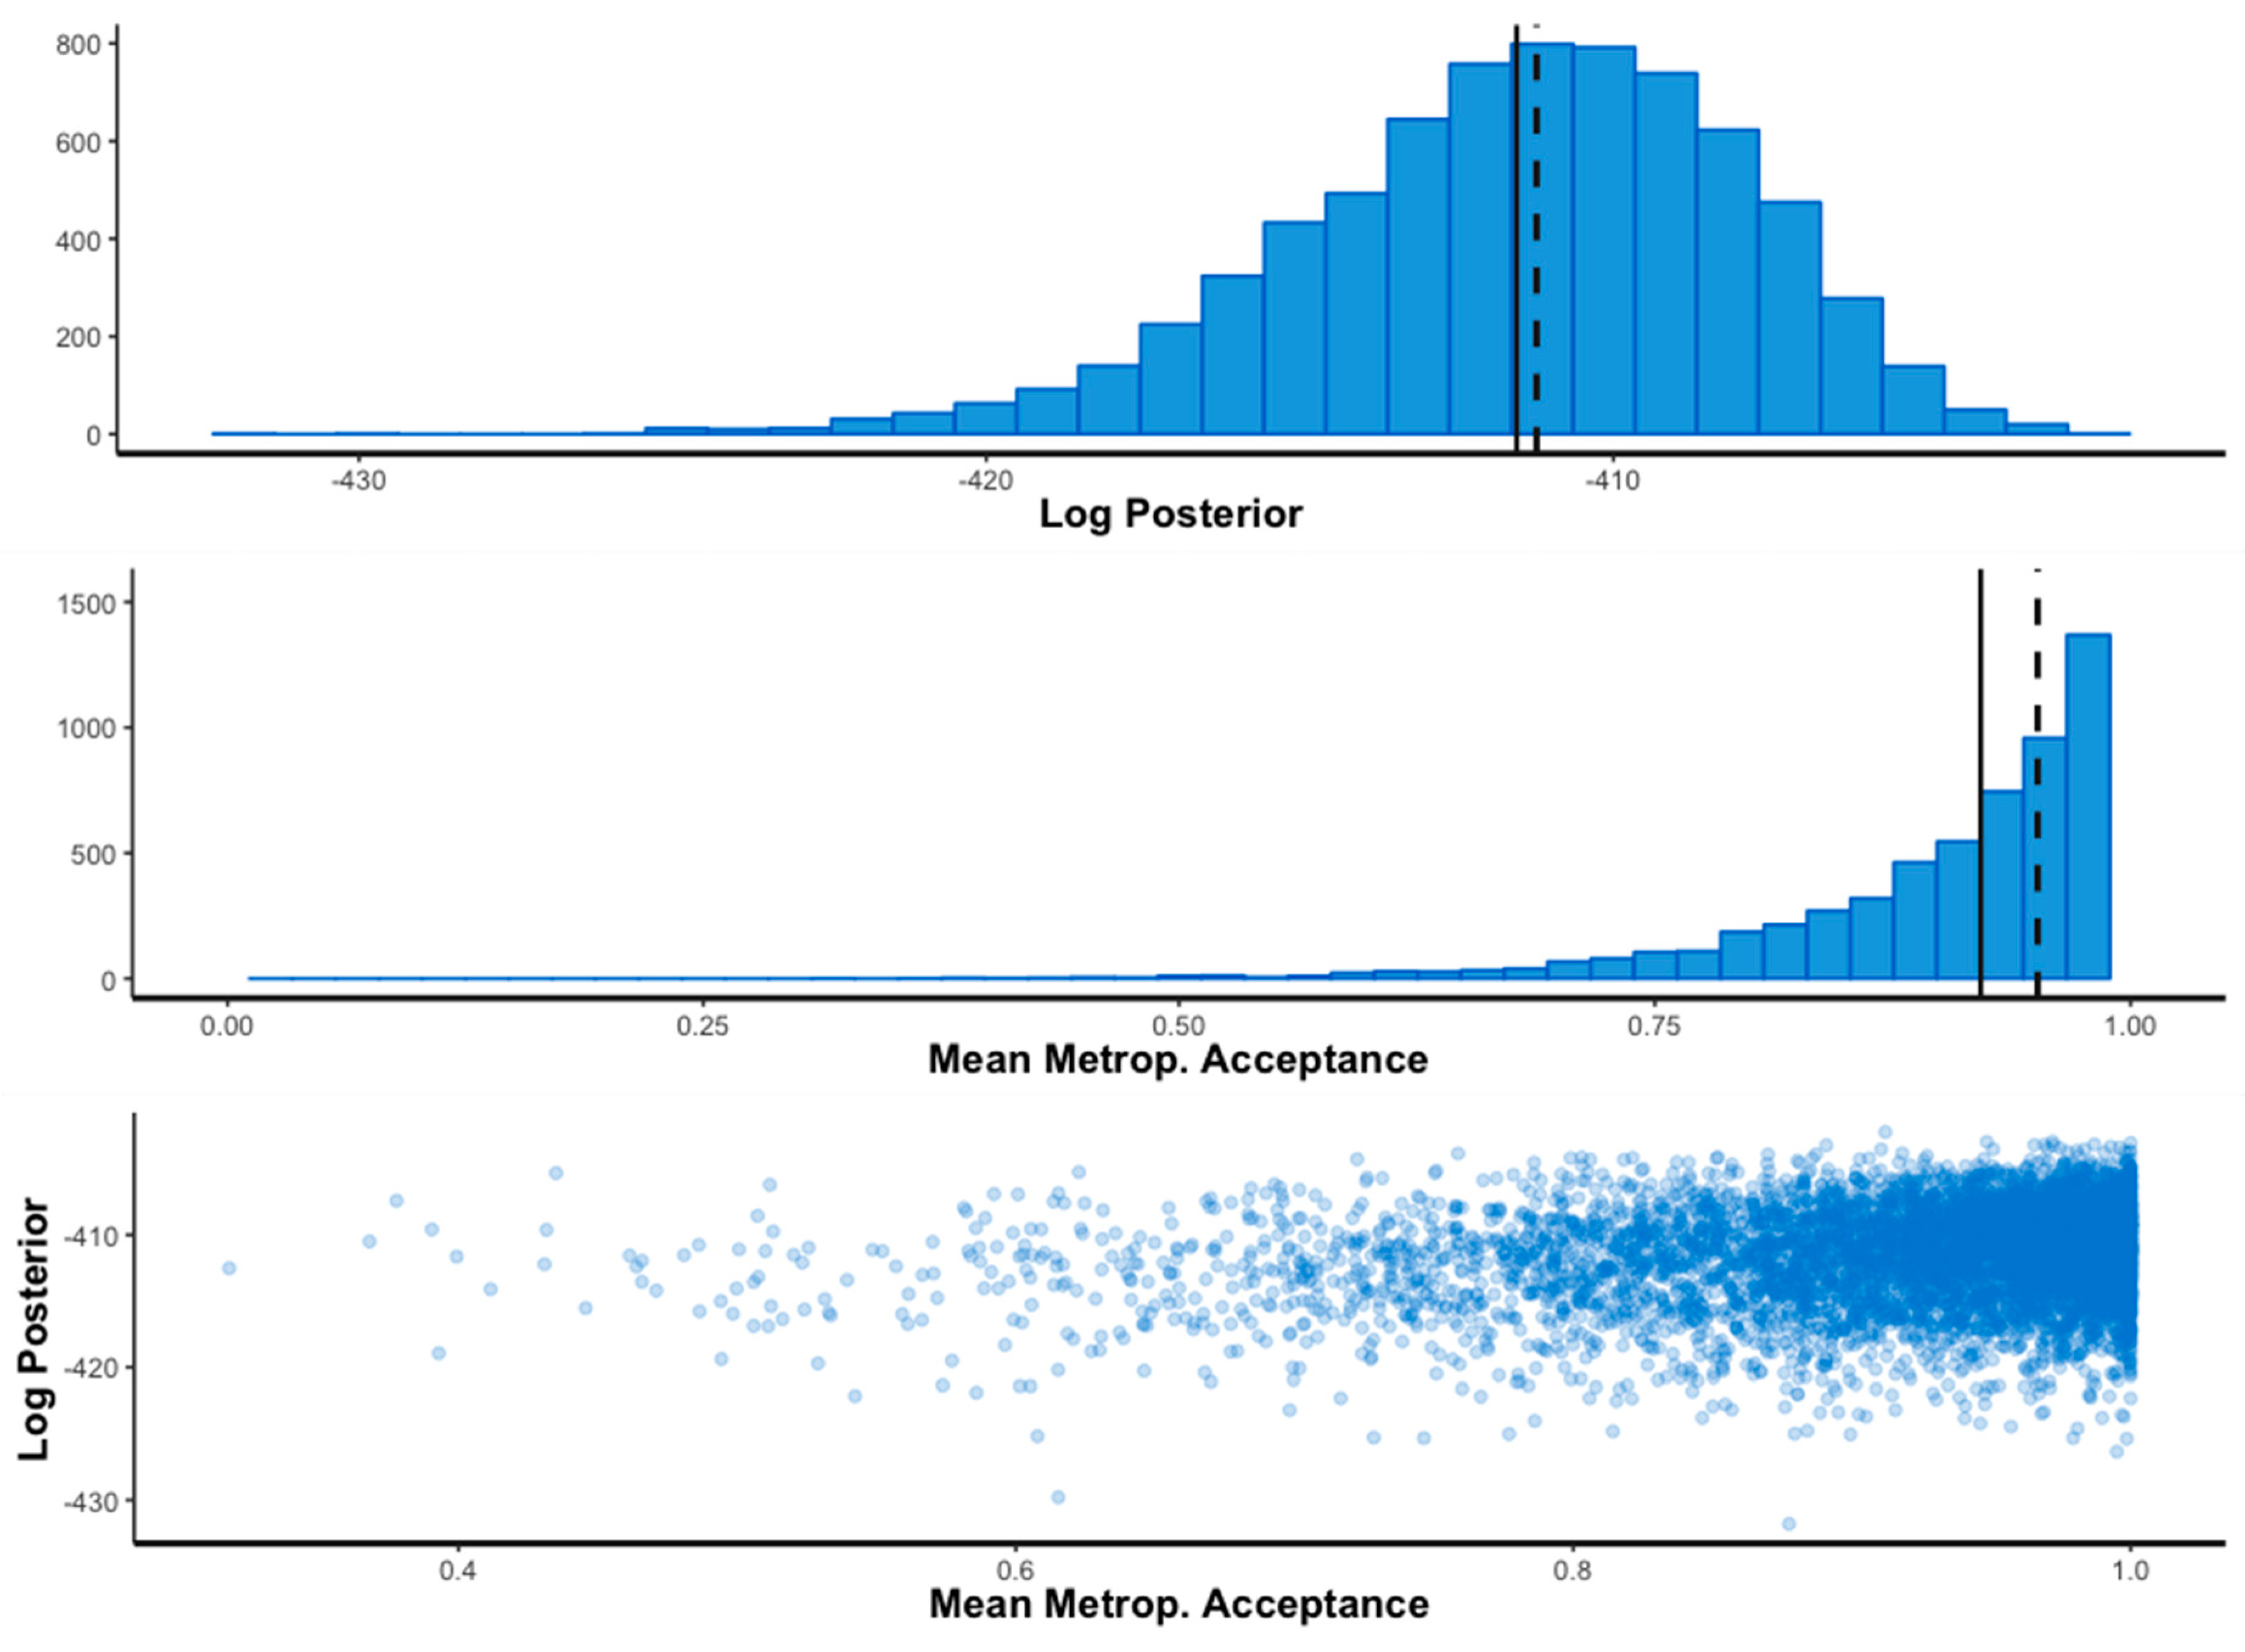
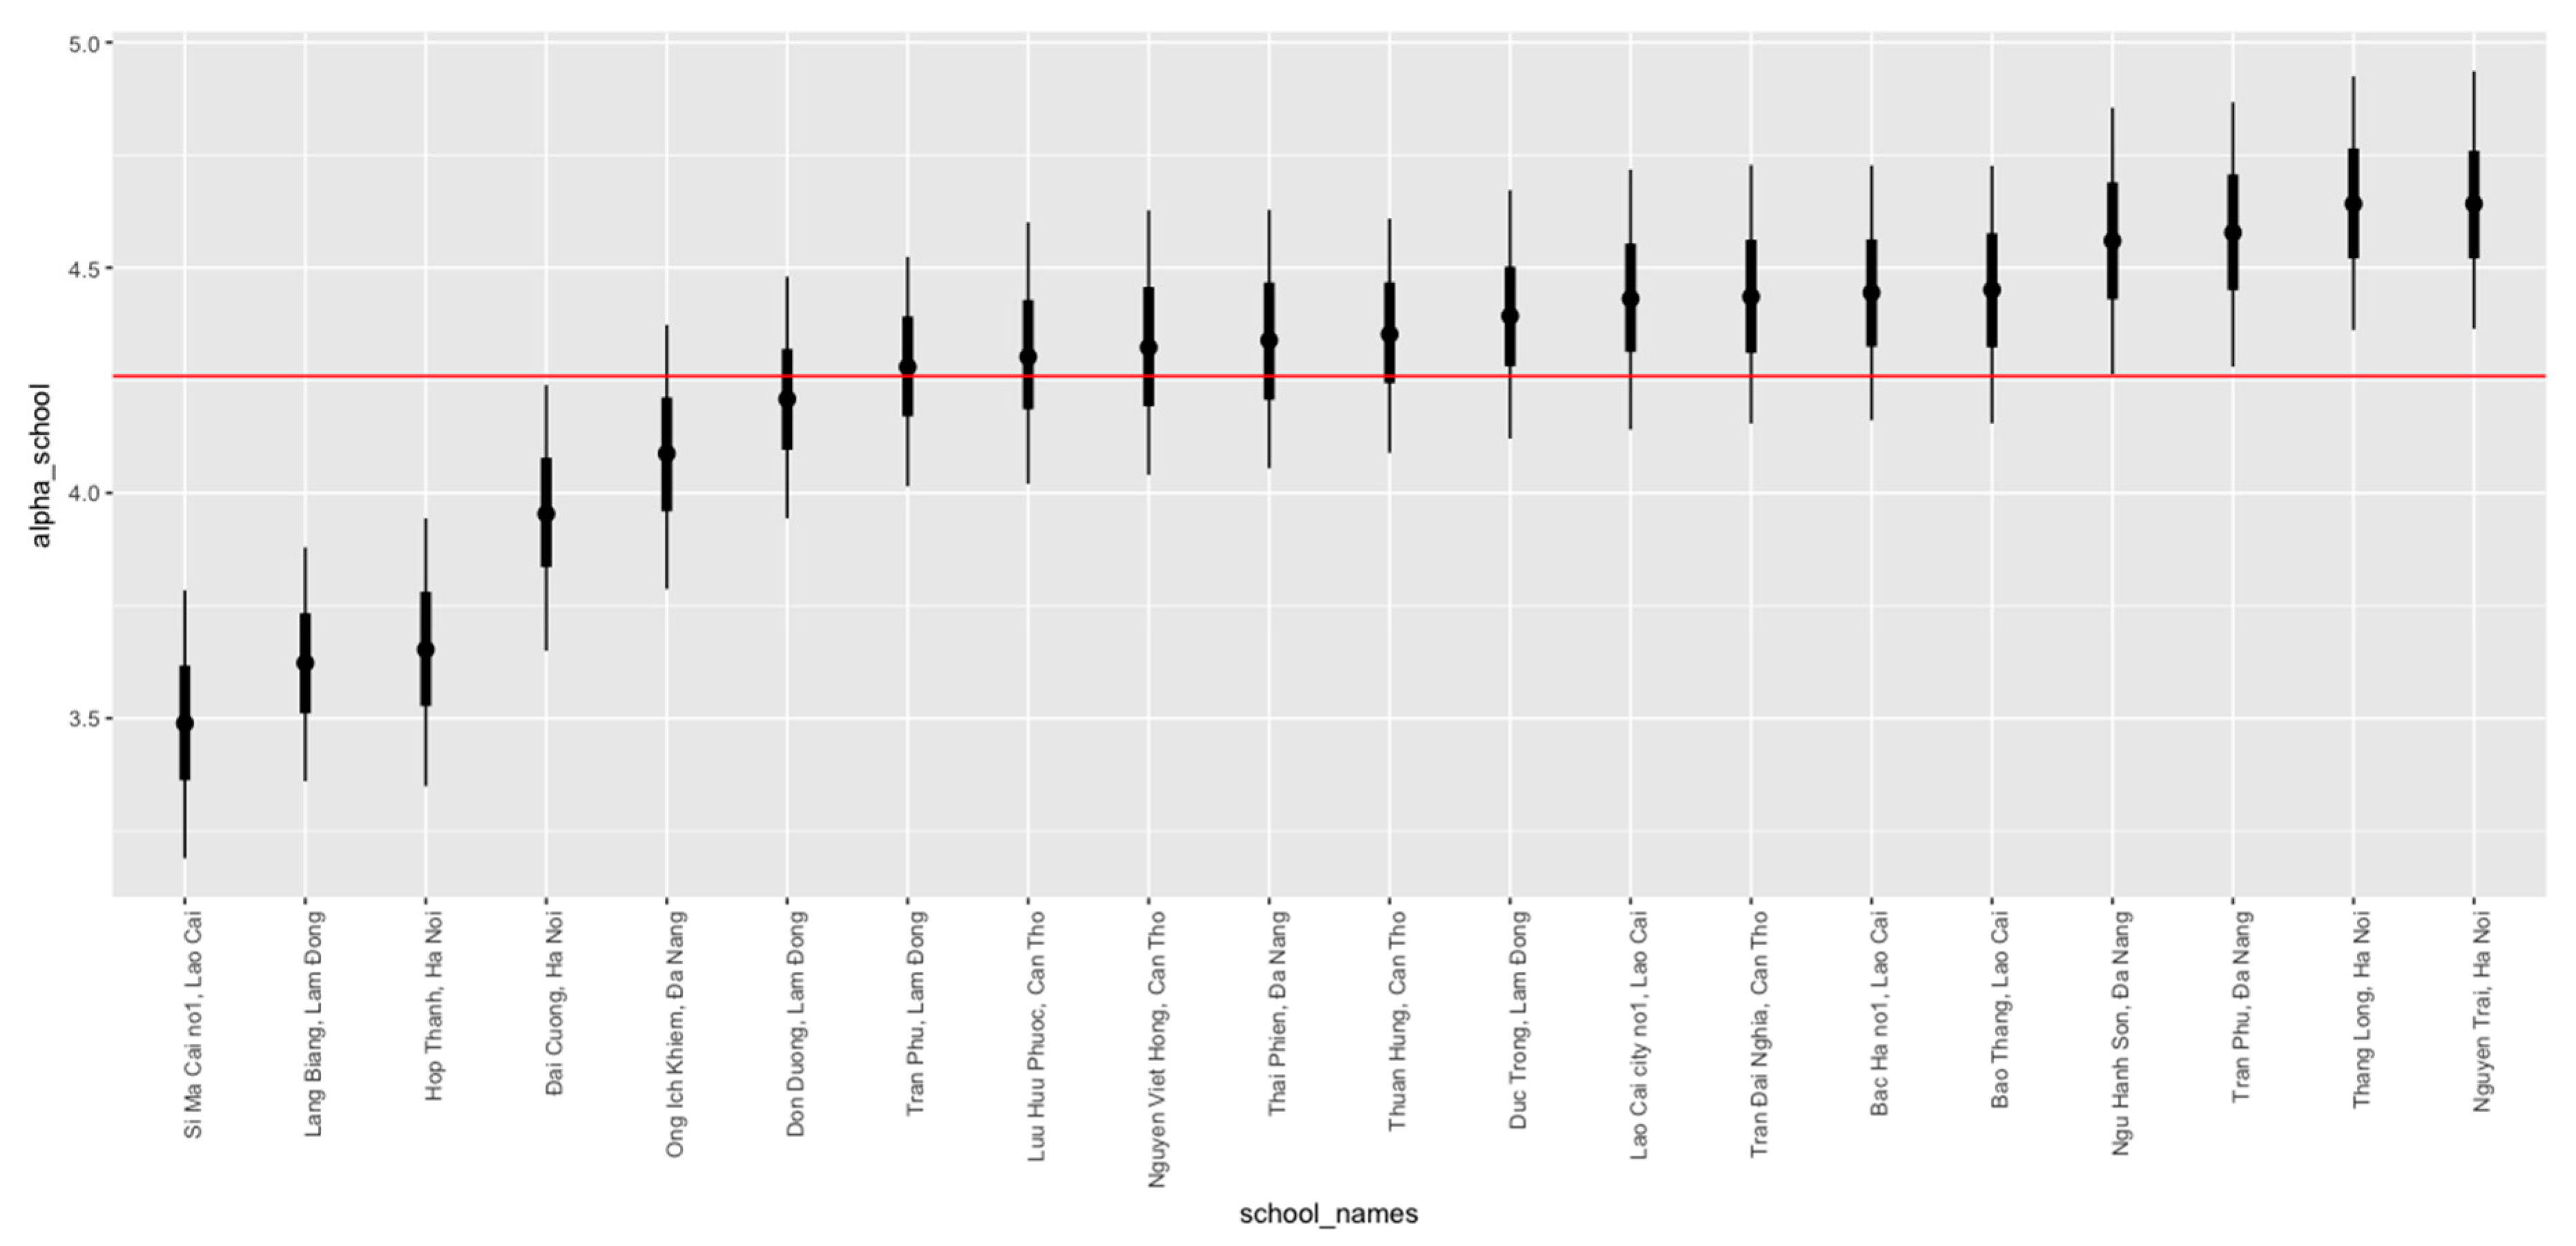
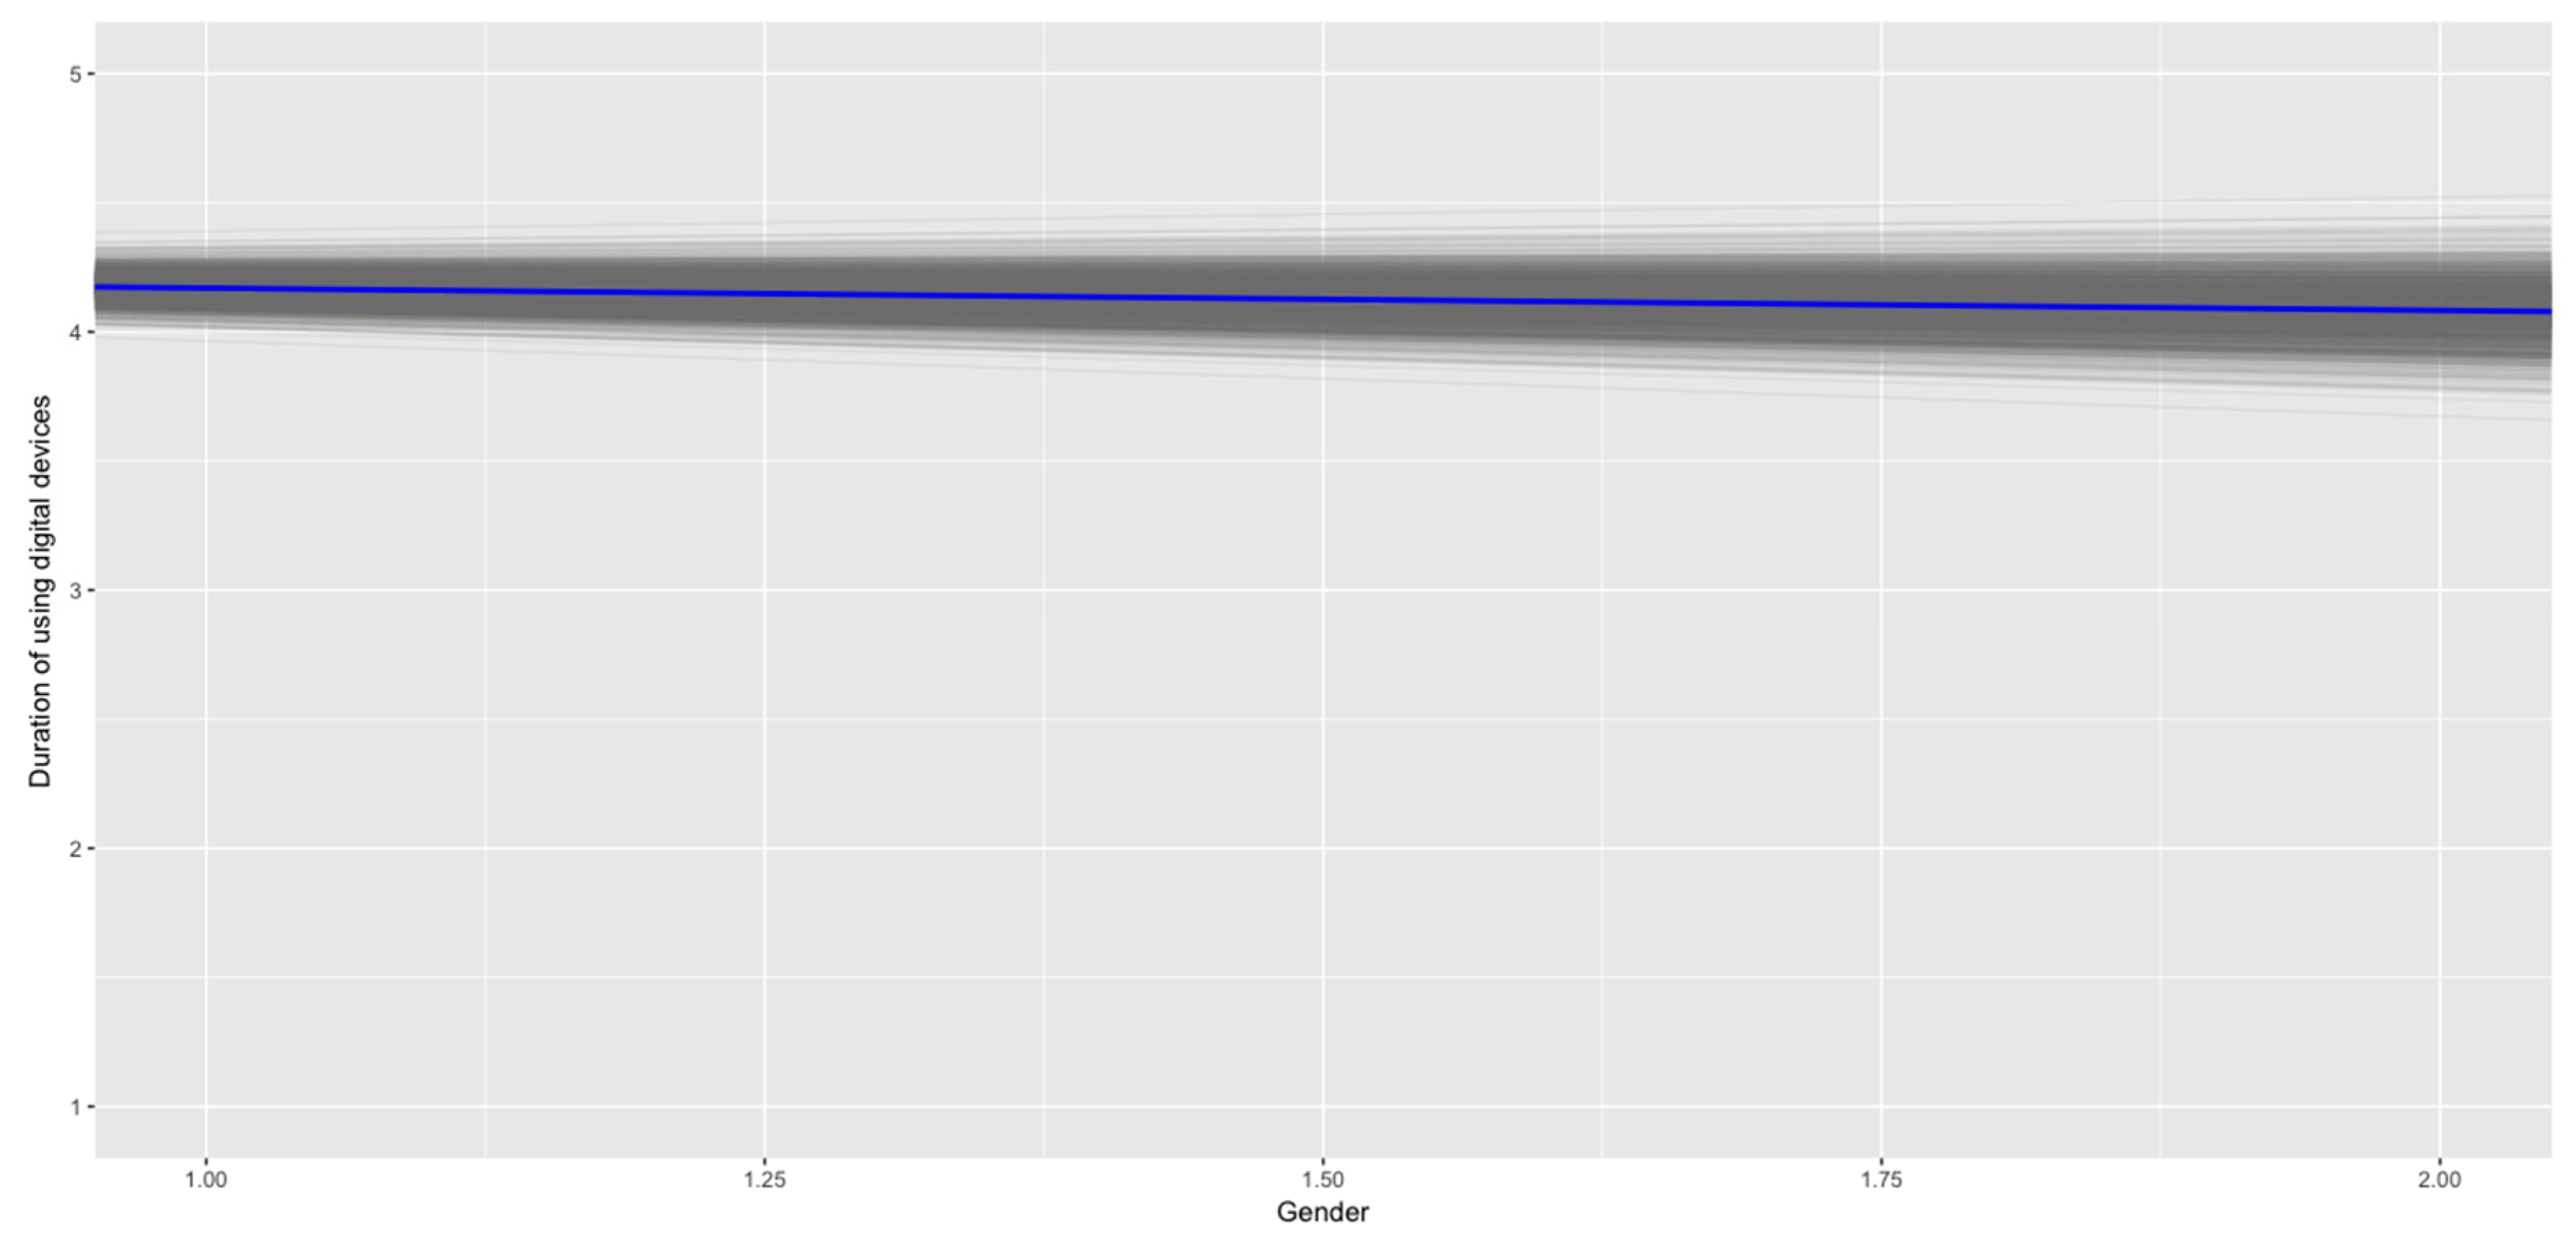
3.3.2. Bayesian Analysis
4. Conclusions and User Notes
Supplementary Materials
Author Contributions
Funding
Acknowledgments
Conflicts of Interest
Appendix A

| DOMAINS | COMPETENCIES | SAMPLE PERFORMANCE INDICATORS |
|---|---|---|
| Digital Literacy | 1.1 ICT Literacy: Managing and operating ICT hardware and software responsibly in digital environments to access and search for data, information, and content, and to utilize them | 1.1.1 The child is able to copy and move a file or folder. 1.1.2 The child is able to copy and paste tools to duplicate or move information within a document. 1.1.3 The child is able to send e-mails with attached files (e.g., document, picture, video). 1.1.4 The child is able to use arithmetic formulae in a spreadsheet. 1.1.5 The child is able to connect and install new devices (e.g., a modem, camera, printer). 1.1.6 The child is able to find, download, install, and configure software. 1.1.7 The child is able to create electronic presentations with presentation software (including text, images, sound, video, or charts). 1.1.8 The child is able to transfer files between a computer and other devices. 1.1.9 The child is able to write a computer program using a specialized programming language. 1.1.10 The child is able to use a search engine and advanced applications (e.g., digital financial services, online shopping, e-governance, online learning). 1.1.11 The child is open to learning new digital technology. 1.1.12 The child uses social media platforms to share ideas, participate in discussions, and collaborate with others. 1.1.13 The child is able to use mobile devices and applications with confidence. |
| 1.2 Information Literacy: The ability to seek, critically evaluate, and use digital information effectively to make informed decisions. | 1.2.1 The child has knowledge of the different information categories (e.g., PR, Advertising, Propaganda, Entertainment, Educational) and their motivations, goals, and outputs. 1.2.2 The child has knowledge of disinformation and unethical platforms e.g., clones, bots, fishing sites. 1.2.3 The child is able to contextualize and analyze information by a diverse range of categories (e.g., by location, culture, values, age, and ownership). 1.2.4 The child is able to analyze digital profiles of individuals and institutions. 1.2.5 The child is able to identify and evaluate information for credibility and reliability. 1.2.6 The child is able to make an informed judgment or decision based on information classification and local context (e.g., age, location, applicable laws) 1.2.7 The child is motivated to disseminate credible and reliable information. | |
| Digital Safety & Resilience | 2.1 Understanding Child Rights: Knowledge of legal rights and obligations within the global and local context | 2.1.1 RIGHTS (GLOBAL /LOCAL): The child demonstrates a comprehensive understanding of their legal rights under the Convention on the Rights of the Child and in applicable local laws (particularly rights to protection from all kinds of online violence, to access to information and education, to play and recreation, to freedom of thought, expression, and to participation). 2.1.2 OBLIGATIONS (GLOBAL /LOCAL): The child demonstrates a comprehensive understanding of their obligations under the Convention on the Rights of the Child and in applicable local laws to respect the rights of others (particularly the responsibilities to respect the rights, freedoms, and reputations of others, and not to breach applicable criminal, civil, or administrative laws online). |
| 2.2 Personal data, privacy and reputation: To understand how to use and share personally identifiable information while being able to protect oneself and others from harm. Be able to implement strategies for information and device security and personal security protocols | 2.2.1 DATA (YOURS): The child can apply principles of managing their personal data to maintain digital privacy and security and is able to take preventive measures against digital data collection. 2.2.2 PRIVACY (YOURS/OTHERS): The child understands the implications of sharing personal identifying information, photos, videos, comments, and opinions in different online contexts, and is able to engage in safe, legal, and ethical behavior that respects their own privacy as well as the privacy of others. 2.2.3 REPUTATION (YOURS/OTHERS): The child is able to cultivate and manage their digital identity and reputation and is aware of the permanence of their actions in the digital world. 2.2.4 INTELLECTUAL PROPERTY: The child understands and respects the rights and obligations of using and sharing intellectual property. | |
| 2.3 Promoting and Protecting Health and Well-Being: Ability to identify and manage health risks, and use digital technology in order to protect and improve the physical and psychological well-being of oneself and others | 2.3.1 BULLYING HARASSMENT and HATE SPEECH: Understand, identify, and successfully manage risks related to being a victim, perpetrator, or witness of bullying, harassment, or hate speech. 2.3.2 UNPLUG and ADDICTION: The child is able to manage their own use of technology, taking full advantage of technology while avoiding excessive time online and addiction. 2.3.3 PROTECTION (SEXUAL VIOLENCE): The child understands and is able to identify and successfully manage risks related to being a victim, perpetrator, or witness of sexual harassment, sexual extortion, grooming, and exposure to disturbing sexually violent or inappropriately graphic content. 2.3.4 IMPROVEMENT (PHYSICAL/PSYCHOLOGICAL): The child understands, accesses, and uses information to improve mental, physical, psychological, and sexual health online. | |
| 2.4 Digital Resilience: A set of preventative, reactive and transformative competencies that allow young people to avoid or cope with risky situations they face and improve themselves. | 2.4.1 AWARENESS: The child understands the potential risks in the digital environment. 2.4.2 INSTRUMENTAL ACTIONS: The child can prevent and respond to risk using digital skills and media literacy. 2.4.3 COGNITIVE ACTIONS: The child safely and critically engages with online content, adopts problem-solving and decision-making skills when facing online risks, and transforms challenging experiences into positive lessons. 2.4.4 COMMUNICATING: The child is willing to communicate with people when faced with a risky, upsetting, or potentially dangerous situation online. | |
| Digital Participation & Agency | 3.1 Interacting, Sharing, and Collaborating: The ability to interact, share data and information, and collaborate with others using suitable digital technologies to achieve shared goals (work, social, leveraging network, education, entertainment, etc.). | 3.1.1 The child is able to use digital tools to interact and share information and data with peers and other children from a variety of background and cultures. 3.1.2 The child is able to use digital tools to interact and share information and data with adults from a variety of background and cultures. 3.1.3 The child is able to use digital tools to work together with peers and other children to achieve a common goal. 3.1.4 The child is able to use digital tools to work together with adults to achieve a common goal. |
| 3.2 Civic Engagement: The ability and willingness to recognize, seek, and act on opportunities to positively influence local and global communities online and/or offline through appropriate digital technologies. | 3.2.1 The child is able to use ICT to discuss political and social issues with other people online 3.2.2 The child is able to use ICT to be involved in activities, associations, and movements on social and political issues. 3.2.3 The child is able to use ICT with the intention to influence society, locally or globally. 3.2.4 The child believes that their involvement contributed to a better world. | |
| 3.3 Netiquette: Demonstrate ethical and courteous behavior to inform choices in interacting and engaging in different digital environments with different audiences. | 3.3.1 The child acts with courtesy in their interaction with others while using digital tools. 3.3.2 The child demonstrates respect for others’ rights through their online behavior. 3.3.3 The child demonstrates non-discriminatory behavior that is also gender and culturally sensitive. | |
| Digital Emotional Intelligence | 4.1 Self-Awareness: Ability to explain one’s moods, emotions, drives, and how these affect oneself and others in the digital world through introspection. | 4.1.1 The child is able to explain emotions they have in any given time as a result of digital experiences. 4.1.2 The child is able to reflect on the relationship between emotions, action, and consequences as they engage in digital activities. 4.1.3 The child is able to assess his or her own strengths and weaknesses in managing one’s emotions when using digital technologies. |
| 4.2 Self-Regulation: Ability to manage one’s emotions, moods, and impulses during online engagements | 4.2.1 The child sets personal limits on the use of digital devices. 4.2.2 The child is able to control one’s emotions in the online environment. | |
| 4.3 Self-Motivation: Demonstrates initiative, commitment to attain internal or external goals despite setbacks in the digital sphere. | 4.3.1 The child sets goals to improve the self through digital opportunities. 4.3.2 The child acts on the set goals even in the face of challenges. 4.3.3 The child revises set goals based on digital experiences. | |
| 4.4 Interpersonal Skills: Build positive online relationships to communicate, build rapport and trust, embrace diversities, manage conflicts, and make sound decisions. | 4.4.1 The child can communicate with others with due courtesy, respect, and regard for one’s and others’ welfare through varied digital forms and contexts (e.g., words, symbols, or images). 4.4.2 The child demonstrates tact and diplomacy during online disagreements, differences of opinions, and the ability to diffuse difficult situations. 4.4.3 The child builds rapport and nurtures positive relationships through online engagements. 4.4.4 The child demonstrates respect and value for the dignity and worth of others through online interactions. | |
| 4.5 Empathy: Demonstrate awareness and compassion for the feelings, needs, and concerns of others during digital interactions | 4.5.1 The child displays sensitivity and takes emotional cues to respond to the needs, feelings, and perspectives of others when online. 4.5.2 The child takes appropriate actions to help those facing challenging circumstances or threats to their digital rights. | |
| Digital Creativity & Innovation: | 5.1 Creative Literacy: Apply skills and use tools to create/adapt and/or curate digital content | 5.1.1 The child applies a wide range of digital media tools to manipulate, create, or remix digital content (including photos, videos, music, text, etc.). 5.1.2 The child is capable of coding and developing applications. 5.1.3 The child is able to express ideas through the curation of existing digital material. |
| 5.2 Expression: The ability to use technology to represent or express creatively children’s identities. | 5.6.1 The child is able to utilize digital platforms to explore, experiment, and generate ideas. 5.6.2 The child is able to use digital platforms to creatively represent digital and real-life identities. 5.6.3 The child is able to use creative digital formats to express ideas and connect with others. |
| No | School Name | City/Province | School ID | Area |
|---|---|---|---|---|
| 1 | Đại Cường | Hanoi | V01 | rural |
| 2 | Hợp Thanh | Hanoi | V02 | rural |
| 3 | Thăng Long | Hanoi | V03 | urban |
| 4 | Nguyễn Trãi | Hanoi | V04 | urban |
| 5 | Lào Cai city no1 | Lao Cai | V05 | urban |
| 6 | Bảo Thắng | Lao Cai | V06 | urban |
| 7 | Bắc Hà no1 | Lao Cai | V07 | rural |
| 8 | Si Ma Cai no1 | Lao Cai | V08 | rural |
| 9 | Ông Ích Khiêm | Danang | V09 | rural |
| 10 | Trần Phú | Danang | V10 | urban |
| 11 | Ngũ Hành Sơn | Danang | V11 | rural |
| 12 | Thái Phiên | Danang | V12 | urban |
| 13 | Trần Phú | Lam Dong | V13 | urban |
| 14 | Don Duong | Lam Dong | V14 | rural |
| 15 | Duc Trong | Lam Dong | V15 | urban |
| 16 | Lang Biang | Lam Dong | V16 | rural |
| 17 | Trần Đại Nghĩa | Can Tho | V17 | rural |
| 18 | Nguyễn Việt Hồng | Can Tho | V18 | urban |
| 19 | Lưu Hưu Phước | Can Tho | V19 | urban |
| 20 | Thuận Hưng | Can Tho | V20 | rural |
References
- Lee, J.-W. Education for Technology Readiness: Prospects for Developing Countries. J. Hum. Dev. 2001, 2, 115–151. [Google Scholar] [CrossRef]
- Mutula, S.M.; Van Brakel, P. ICT skills readiness for the emerging global digital economy among small businesses in developing countries: Case study of Botswana. Library Hi Tech 2007, 25, 231–245. [Google Scholar] [CrossRef]
- Cameron, A.; Pham, T.; Atherton, J. Vietnam Today—First Report of the Vietnam’s Future Digital Economy Project; CSIRO: Brisbane, Australia, 2018. [Google Scholar]
- Vuong, Q.H. Computational entrepreneurship: From economic complexities to interdisciplinary research. Prob. Perspect. Manage. 2019, 17, 117–129. [Google Scholar] [CrossRef]
- Vuong, Q.H.; Tran, T.D. The cultural dimensions of the Vietnamese private entrepreneurship. IUP J. Entrepreneurship Dev. 2009, VI, 54–78. [Google Scholar] [CrossRef]
- Chang, J.-H.; Rynhart, G.; Huynh, P. ASEAN in Transformation: How Technology is Changing Jobs and Enterprises; International Labour Office: Geneva, Switzerland, 2016. [Google Scholar]
- GSO. Annual Employed Population at 15 Years of Age and Above by Occupation and Year; General Statistics Office: Hanoi, Vietnam, 2016.
- VNA. Vietnam Lacks High-Quality IT Workforce. 2016. Available online: https://english.vietnamnet.vn/fms/science-it/166260/vietnam-lacks-high-quality-it-workforce.html (accessed on 8 May 2019).
- Oxford Business Group. The Report—Vietnam 2017; Oxford Business Group: Dubai, United Arab Emirates, 2017. [Google Scholar]
- ITU. Global Cybersecurity Index 2017; International Telecommunication Union (ITU): Geneva, Switzerland, 2017. [Google Scholar]
- UNESCO. Viet Nam Takes Action Towards STEM Education for Sustainable Development. 2017. Available online: http://un.org.vn/en/unesco-agencypresscenter1-100/4388-viet-nam-takes-action-towards-stem-education-for-sustainable-development.html (accessed on 8 May 2019).
- Illing, S. Bored and Lonely? Blame Your Phone. 2019. Available online: https://www.vox.com/recode/2019/5/2/18510958/social-media-addiction-boredom-loneliness-society-technology-smart-phones (accessed on 8 May 2019).
- Aesaert, K.; Van Nijlen, D.; Vanderlinde, R.; Tondeur, J.; Devlieger, I.; van Braak, J. The contribution of pupil, classroom and school level characteristics to primary school pupils’ ICT competences: A performance-based approach. Comput. Educ. 2015, 87, 55–69. [Google Scholar] [CrossRef]
- Heinz, J. Digital skills and the influence of students’ socio-economic background. An exploratory study in German elementary schools. Italian J. Sociol. Educ. 2016, 8, 186–212. [Google Scholar] [CrossRef]
- Tondeur, J.; Sinnaeve, I.; van Houtte, M.; van Braak, J. ICT as cultural capital: The relationship between socioeconomic status and the computer-use profile of young people. New Med. Soc. 2011, 13, 151–168. [Google Scholar] [CrossRef]
- Popa, D.; Topală, I.R. Students’ Digital Competencies, Related Attitudes and Self Directed Learning. In Proceedings of the International Scientific Conference eLearning and Software for Education, Bucharest, Romania, 19–20 April 2018; pp. 90–95. [Google Scholar]
- Vázquez-Cano, E.; Meneses, E.L.; García-Garzón, E. Differences in basic digital competences between male and female university students of Social Sciences in Spain. Int. J. Educ. Technol. High. Edu. 2017, 14, 27. [Google Scholar] [CrossRef]
- Bronfenbrenner, U.; Ceci, S.J. Nature-nuture reconceptualized in developmental perspective: A bioecological model. Psychol. Rev. 1994, 101, 568–586. [Google Scholar] [CrossRef] [PubMed]
- Fienberg, S.E.; Junker, B.W. Categorical Data Analysis. In International Encyclopedia of Education, 3rd ed.; Peterson, P., Baker, E., McGaw, B., Eds.; Elsevier: Oxford, UK, 2010; pp. 58–65. [Google Scholar]
- Agresti, A. Categorical Data Analysis, 3rd ed.; Wiley: Hoboken, NJ, USA, 2013. [Google Scholar]
- Vuong, Q.H.; La, V.-P. BayesVL Package for Bayesian Statistical Analyses in R. Github: BayesVL Package Version 0.6. 2019. Available online: https://github.com/sshpa/bayesvl (accessed on 20 April 2019).
- Vuong, Q.-H.; Bui, Q.-K.; La, V.-P.; Vuong, T.-T.; Nguyen, V.-H.T.; Ho, M.-T.; Nguyen, H.-K.T.; Ho, M.-T. Cultural additivity: Behavioural insights from the interaction of Confucianism, Buddhism and Taoism in folktales. Palgrave Commun. 2018, 4, 143. [Google Scholar] [CrossRef]
- Vuong, Q.-H.; Bui, Q.-K.; La, V.-P.; Vuong, T.-T.; Ho, M.-T.; Nguyen, H.-K.T.; Nguyen, H.-N.; Nghiem, K.-C.P.; Ho, M.-T. Cultural evolution in Vietnam’s early 20th century: A Bayesian networks analysis of Franco-Chinese house designs. arXiv 2019, arXiv:1903.00817v1. [Google Scholar] [CrossRef]
- Scutari, M.; Denis, J.-B. Bayesian Networks: With Examples in R; Chapman and Hall/CRC: London, UK, 2014. [Google Scholar]
- Kruschke, J. Doing Bayesian Data Analysis: A Tutorial with R, JAGS, and Stan, 2nd ed.; Academic Press: London, UK, 2014. [Google Scholar]
- Lynch, S.M. Introduction to Applied Bayesian Statistics and Estimation for Social Scientists; Springer: New York, NY, USA, 2007. [Google Scholar]
- McElreath, R. Statistical Rethinking: A Bayesian Course with Examples in R and Stan; Chapman and Hall/CRC: London, UK, 2018. [Google Scholar]
- Ejiwale, J.A. Barriers to successful implementation of STEM education. J. Educ. Learn. 2013, 7, 63–74. [Google Scholar] [CrossRef]
- Vuong, Q.-H. The (ir)rational consideration of the cost of science in transition economies. Nat. Hum. Behav. 2018, 2, 5. [Google Scholar] [CrossRef] [PubMed]
- Vuong, Q.H.; Ho, M.T.; La, V.-P. ‘Stargazing’ and p-hacking behaviours in social sciences: Some insights from a developing country. Eur. Sci. Edit. 2019, 45, 54–55. [Google Scholar]
- Vuong, Q.H. Open Data, Open Review and Open Dialogue in Making Social Sciences Plausible. 2017. Available online: http://blogs.nature.com/scientificdata/2017/12/12/authors-corner-open-data-open-review-and-open-dialogue-in-making-social-sciences-plausible/ (accessed on 8 May 2019).
- Wilkinson, M.D.; Dumontier, M.; Aalbersberg, I.J.; Appleton, G.; Axton, M.; Baak, A.; Blomberg, N.; Boiten, J.-W.; da Silva Santos, L.B.; Bourne, P.E.; et al. The FAIR Guiding Principles for scientific data management and stewardship. Sci. Data 2016, 3, 160018. [Google Scholar] [CrossRef] [PubMed]
- Collaboration, E.H.T. First M87 Event Horizon Telescope results. I. The shadow of the supermassive black hole. Astrophys. J. Lett. 2019, 875, L1. [Google Scholar] [CrossRef]
- Whitehouse, H.; François, P.; Savage, P.E.; Currie, T.E.; Feeney, K.C.; Cioni, E.; Purcell, R.; Ross, R.M.; Larson, J.; Baines, J.; et al. Complex societies precede moralizing gods throughout world history. Nature 2019, 568, 226–229. [Google Scholar] [CrossRef] [PubMed]


| Coded Name | Descriptions | Values | Frequencies | Proportions |
|---|---|---|---|---|
| F1 | Gender | Female | 558 | 53.10% |
| Male | 493 | 46.90% | ||
| F2 | Year of birth | 2001 | 1 | 0.09% |
| 2002 | 10 | 0.95% | ||
| 2003 | 1043 | 98.96% | ||
| F3 | Study grade level | 10 | 1061 | 100.00% |
| F4 | Language | Vietnamese | 1016 | 95.90% |
| Other, please specify | 43 | 4.10% | ||
| F5 | Country | Vietnam | 1061 | 100.00% |
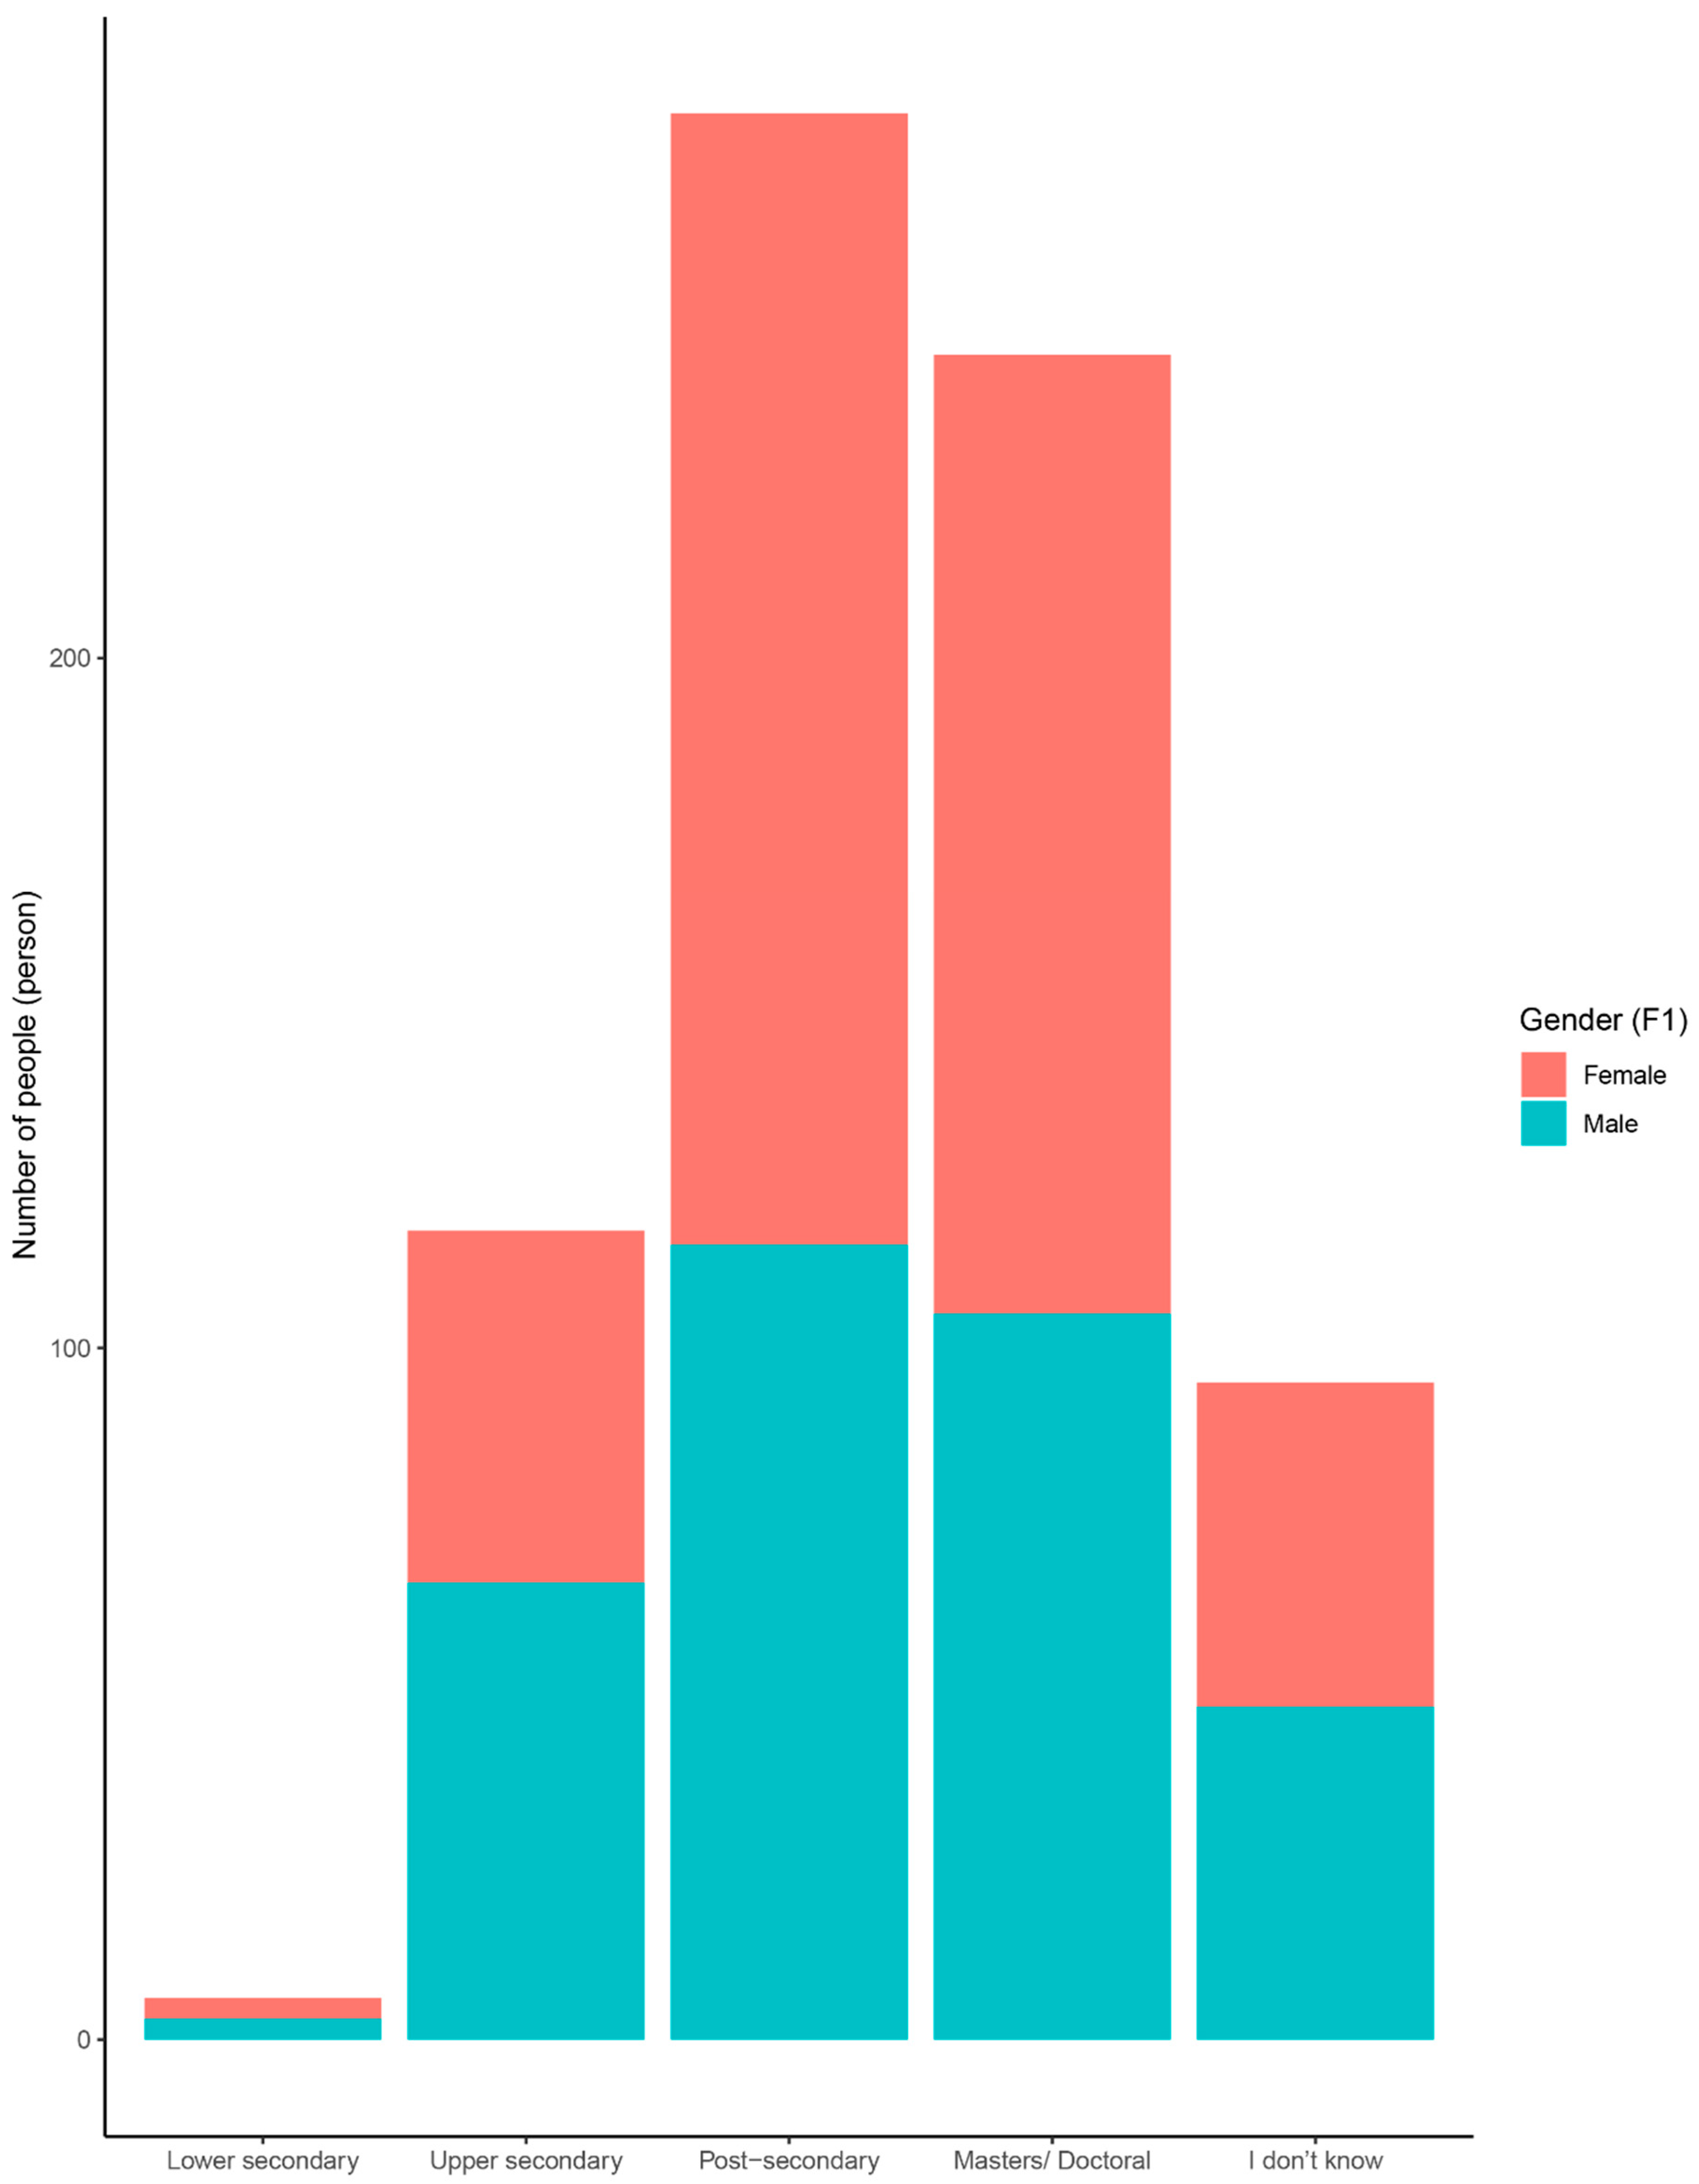
| F6 | Expected highest level of education | Lower secondary | 10 | 0.90% |
| Upper secondary | 190 | 18.00% | ||
| Post-secondary | 381 | 36.00% | ||
| Masters/Doctoral | 354 | 33.50% | ||
| I don’t know | 123 | 11.60% | ||
| F7 | Number of days absent from school | None | 928 | 87.50% |
| 1 or 2 days | 87 | 8.20% | ||
| 3 or 4 days | 29 | 2.70% | ||
| 5 to 10 days | 9 | 0.80% | ||
| More than 10 days | 8 | 0.80% | ||
| F8 | Time spent on outside-school activities | |||
| F8_1 | Socializing with friends | Less than an hour | 246 | 23.20% |
| 1–2 h a day | 484 | 45.70% | ||
| 3–4 h a day | 240 | 22.60% | ||
| 5–6 h a day | 49 | 4.60% | ||
| 7 h a day or more | 41 | 3.90% | ||
| F8_2 | Helping family with work, housework, or caretaking | Less than an hour | 112 | 10.60% |
| 1–2 h a day | 392 | 37.20% | ||
| 3–4 h a day | 332 | 31.50% | ||
| 5–6 h a day | 144 | 13.60% | ||
| 7 h a day or more | 75 | 7.10% | ||
| F8_3 | Doing homework or other academic activities | Less than an hour | 50 | 4.70% |
| 1–2 h a day | 328 | 31.00% | ||
| 3–4 h a day | 407 | 38.50% | ||
| 5–6 h a day | 197 | 18.60% | ||
| 7 h a day or more | 76 | 7.20% | ||
| F8_4 | Doing volunteer work | Less than an hour | 759 | 72.10% |
| 1–2 h a day | 204 | 19.40% | ||
| 3–4 h a day | 57 | 5.40% | ||
| 5–6 h a day | 18 | 1.70% | ||
| 7 h a day or more | 15 | 1.40% | ||
| F8_5 | Doing fine arts activities | Less than an hour | 663 | 63.00% |
| 1–2 h a day | 266 | 25.30% | ||
| 3–4 h a day | 67 | 6.40% | ||
| 5–6 h a day | 29 | 2.80% | ||
| 7 h a day or more | 28 | 2.70% | ||
| Coded Name | Descriptions | Values | Frequencies | Proportions |
|---|---|---|---|---|
| G1 | Amount of experience that students have regarding usage of digital devices | Never | 13 | 1.20% |
| Less than 1 year | 60 | 5.70% | ||
| 1–2 years | 180 | 17.00% | ||
| 3–4 years | 333 | 31.50% | ||
| More than 5 years | 472 | 44.60% | ||
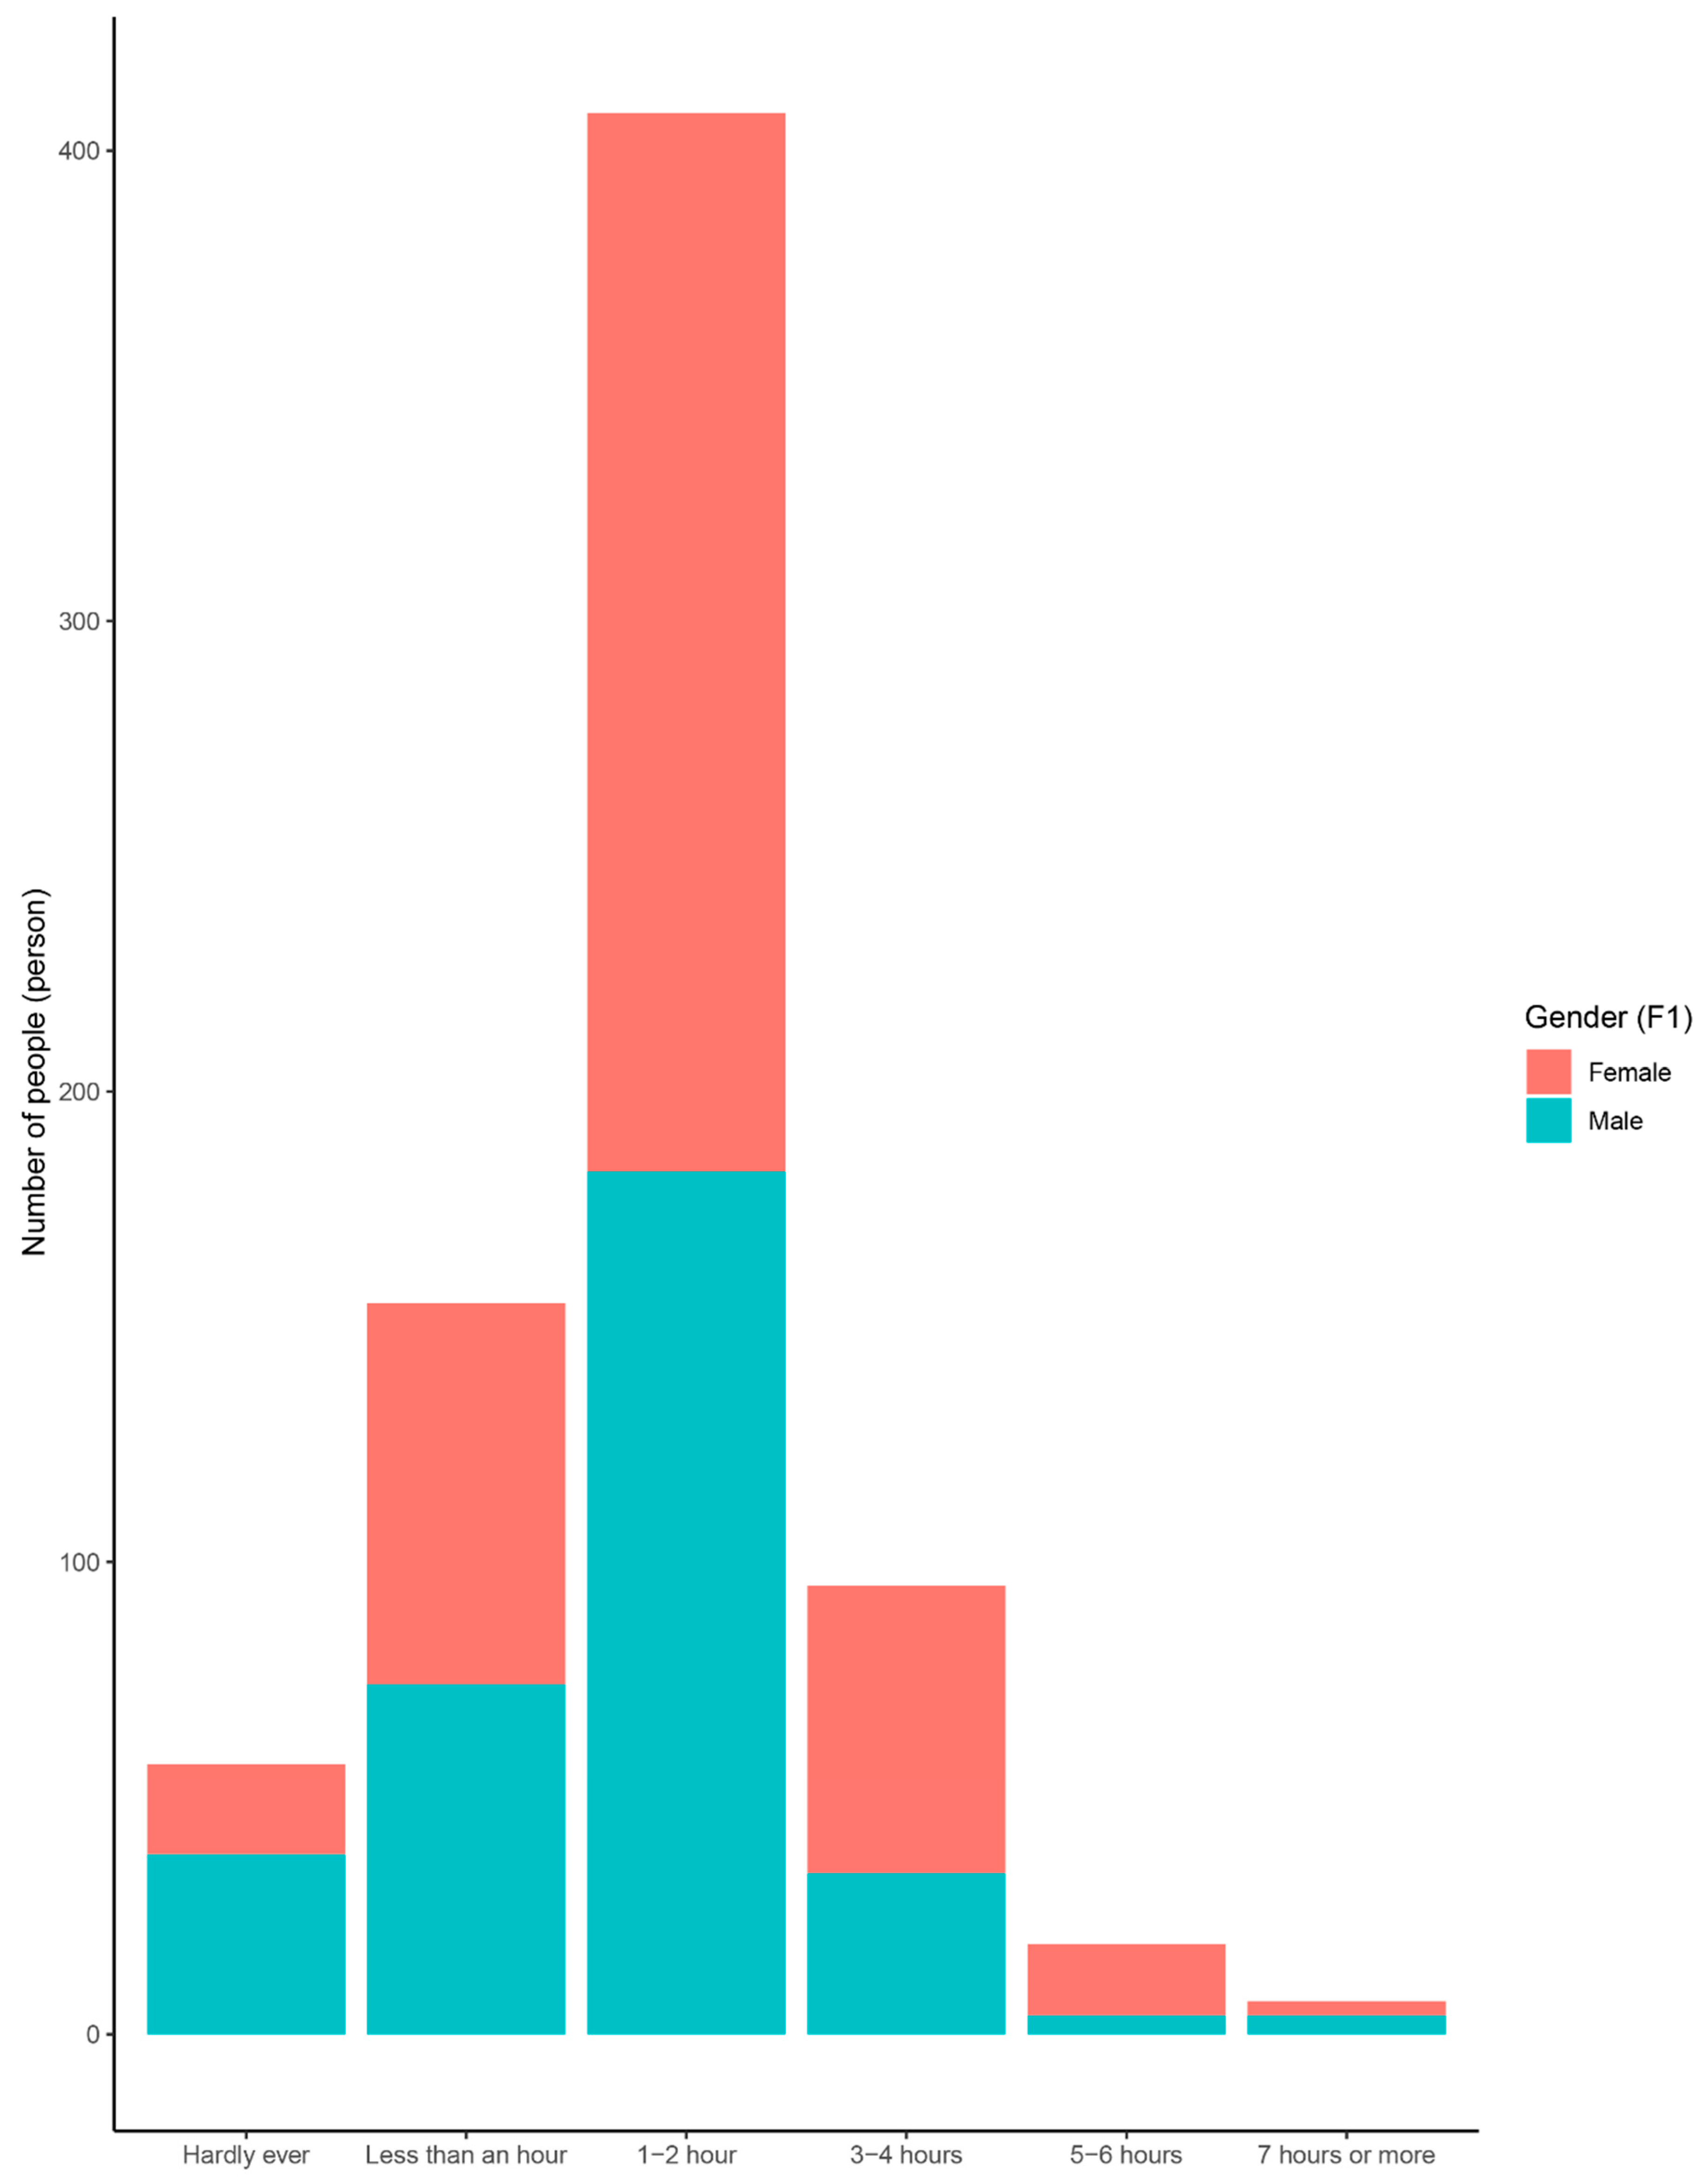
| G2 | Amount of time accessing the Internet using digital devices per day | Hardly ever | 22 | 2.10% |
| Less than an hour | 54 | 5.10% | ||
| 1–2 h | 329 | 31.10% | ||
| 3–4 h | 414 | 39.10% | ||
| 5–6 h | 156 | 14.70% | ||
| 7 h or more | 84 | 7.90% | ||
| G3 | Location of Internet access | |||
| G3_1 | Frequency of Internet connection from home | Hardly ever | 32 | 3.00% |
| At least every month | 10 | 1.00% | ||
| At least every week | 32 | 3.00% | ||
| Less than an hour | 83 | 7.90% | ||
| 1–2 h a day | 298 | 28.40% | ||
| 3–4 h a day | 367 | 35.00% | ||
| 5–6 h a day | 128 | 12.20% | ||
| 7 h a day or more | 100 | 9.50% | ||
| G3_2 | Frequency of Internet connection from school | Hardly ever | 663 | 63.80% |
| At least every month | 34 | 3.30% | ||
| At least every week | 91 | 8.80% | ||
| Less than an hour | 172 | 16.60% | ||
| 1–2 h a day | 43 | 4.10% | ||
| 3–4 h a day | 10 | 1.00% | ||
| 5–6 h a day | 20 | 1.90% | ||
| 7 h a day or more | 6 | 0.60% | ||
| G3_3 | Frequency of connection from Internet cafe | Hardly ever | 585 | 56.10% |
| At least every month | 127 | 12.20% | ||
| At least every week | 151 | 14.50% | ||
| Less than an hour | 85 | 8.20% | ||
| 1–2 h a day | 64 | 6.10% | ||
| 3–4 h a day | 19 | 1.80% | ||
| 5–6 h a day | 3 | 0.30% | ||
| 7 h a day or more | 8 | 0.80% | ||
| G3_4 | Frequency of connection from a local Internet access point | Hardly ever | 779 | 74.50% |
| At least every month | 81 | 7.80% | ||
| At least every week | 69 | 6.60% | ||
| Less than an hour | 69 | 6.60% | ||
| 1–2 h a day | 27 | 2.60% | ||
| 3–4 h a day | 13 | 1.20% | ||
| 5–6 h a day | 3 | 0.30% | ||
| 7 h a day or more | 4 | 0.40% | ||
| G4 | Digital devices used for Internet access at home | |||
| G4_1 | Desktop computer | No | 623 | 58.70% |
| Yes | 438 | 41.30% | ||
| G4_2 | Laptop | No | 555 | 52.30% |
| Yes | 506 | 47.70% | ||
| G4_3 | Smartphone | No | 80 | 7.50% |
| Yes | 981 | 92.5% | ||
| G4_4 | Tablet PC | No | 729 | 68.70% |
| Yes | 332 | 31.30% | ||
| G4_5 | Printer | No | 938 | 88.40% |
| Yes | 123 | 9.80% | ||
| G4_6 | None of the above | No | 1053 | 99.20% |
| Yes | 8 | 0.80% | ||
| G5 | Digital devices used for Internet access at school | |||
| G5_1 | Desktop computer | No | 374 | 35.30% |
| Yes | 686 | 64.70% | ||
| G5_2 | Laptop | No | 1006 | 94.90% |
| Yes | 54 | 5.10% | ||
| G5_3 | Smartphone | No | 656 | 61.90% |
| Yes | 404 | 38.10% | ||
| G5_4 | Tablet PC | No | 1028 | 97.00% |
| Yes | 32 | 3.00% | ||
| G5_5 | Printer | No | 1005 | 94.80% |
| Yes | 55 | 5.20% | ||
| G5_6 | None of the above | No | 906 | 85.50% |
| Yes | 154 | 14.50% | ||
| G6 | Digital devices used for Internet access at a local community access point | |||
| G6_1 | Desktop computer | No | 770 | 72.60% |
| Yes | 291 | 27.40% | ||
| G6_2 | Laptop | No | 924 | 87.10% |
| Yes | 137 | 12.90% | ||
| G6_3 | Smartphone | No | 572 | 53.90% |
| Yes | 489 | 46.10% | ||
| G6_4 | Tablet PC | No | 982 | 92.60% |
| Yes | 79 | 7.40% | ||
| G6_5 | Printer | No | 1002 | 94.40% |
| Yes | 59 | 5.60% | ||
| G6_6 | None of the above | No | 714 | 67.30% |
| Yes | 347 | 32.70% | ||
| G7 | Type of Internet connection at home | |||
| G7_1 | Wired Internet | No | 652 | 61.50% |
| Yes | 409 | 38.50% | ||
| G7_2 | Wireless Internet | No | 205 | 19.30% |
| Yes | 856 | 80.70% | ||
| G7_3 | None | No | 1031 | 97.20% |
| Yes | 30 | 2.80% | ||
| G8 | Type of Internet connection at school | |||
| G8_1 | Wired Internet | No | 726 | 68.40% |
| Yes | 335 | 31.60% | ||
| G8_2 | Wireless Internet | No | 477 | 45.00% |
| Yes | 584 | 55.00% | ||
| G8_3 | None | No | 803 | 75.80% |
| Yes | 257 | 24.20% | ||
| G9 | Availability of local Internet access point | No | 713 | 67.80% |
| Yes | 338 | 32.20% | ||
| G10 | Type of Internet connection at a local community access point | |||
| G10_1 | Wired Internet | No | 802 | 75.70% |
| Yes | 257 | 24.30% | ||
| G10_2 | Wireless Internet | No | 356 | 33.60% |
| Yes | 703 | 66.40% | ||
| G10_3 | None | No | 860 | 81.20% |
| Yes | 199 | 18.80% | ||
| G11 | People who provided the most instructions on how to use computers | My teachers | 309 | 29.40% |
| My friends | 110 | 10.50% | ||
| My family | 130 | 12.40% | ||
| I learned myself | 495 | 47.10% | ||
| My local community | 2 | 0.20% | ||
| Others | 6 | 6 | ||
| G12 | People who provided the most instructions on how to use the Internet | My teachers | 95 | 9.00% |
| My friends | 131 | 12.40% | ||
| My family | 98 | 9.30% | ||
| I learned myself | 715 | 67.70% | ||
| My local community | 9 | 0.90% | ||
| Others | 8 | 0.80% | ||
| G13 | Computers or Internet usage per day for school study purposes | Hardly ever | 356 | 33.60% |
| Less than an hour | 257 | 24.30% | ||
| 1–2 h | 365 | 34.50% | ||
| 3–4 h | 57 | 5.40% | ||
| 5–6 h | 14 | 1.30% | ||
| 7 h or more | 9 | 0.90% | ||
| G14 | Computers or Internet usage per day for personal study purposes | Hardly ever | 87 | 8.20% |
| Less than an hour | 220 | 20.80% | ||
| 1–2 h | 582 | 55.00% | ||
| 3–4 h | 129 | 12.20% | ||
| 5–6 h | 33 | 3.10% | ||
| 7 h or more | 8 | 0.80% | ||
| G15 | Computers or Internet usage per day for leisure purposes | Hardly ever | 19 | 1.80% |
| Less than an hour | 124 | 11.70% | ||
| 1–2 h | 520 | 49.10% | ||
| 3–4 h | 286 | 27.00% | ||
| 5–6 h | 78 | 7.40% | ||
| 7 h or more | 33 | 3.10% | ||
| G16 | Computers or Internet usage per day for peer socializing and communication purposes | Hardly ever | 28 | 2.60% |
| Less than an hour | 227 | 21.50% | ||
| 1–2 h | 506 | 47.80% | ||
| 3–4 h | 205 | 19.40% | ||
| 5–6 h | 66 | 6.20% | ||
| 7 h or more | 26 | 2.50% | ||
| G17 | Learning experiences of basic coding skills at school | No | 445 | 42.10% |
| Yes | 611 | 57.90% | ||
| G18 | Experiences of website or application development | No | 142 | 13.40% |
| Yes | 916 | 86.60% |
| Coded Name | Descriptions | Values | Frequencies | Proportions |
|---|---|---|---|---|
| H1 | People sharing the same household | |||
| H1_1 | Mother | No | 134 | 12.70% |
| Yes | 925 | 87.30% | ||
| H1_2 | Father | No | 205 | 19.40% |
| Yes | 853 | 80.60% | ||
| H1_3 | Grandparent(s) or other relatives | No | 744 | 70.30% |
| Yes | 314 | 29.70% | ||
| H1_4 | Siblings (including half, step, or foster siblings) | No | 290 | 27.40% |
| Yes | 768 | 72.60% | ||
| H1_5 | Living in a foster home or children’s home | No | 1053 | 99.50% |
| Yes | 5 | 0.50% | ||
| H1_6 | Living alone | No | 1051 | 99.30% |
| Yes | 7 | 0.70% | ||
| H1_7 | Someone or somewhere else | No | 1039 | 98.20% |
| Yes | 19 | 1.80% | ||
| H2 | Mother’s highest education level | No education | 27 | 2.60% |
| Primary | 86 | 8.10% | ||
| Lower secondary | 275 | 26.00% | ||
| Upper secondary | 250 | 23.70% | ||
| Post-secondary | 273 | 25.90% | ||
| Masters/Doctoral | 55 | 5.20% | ||
| I don’t know | 90 | 8.50% | ||
| H3 | Father’s highest education level | No Education | 18 | 1.70% |
| Primary | 73 | 6.90% | ||
| Lower secondary | 249 | 23.60% | ||
| Upper secondary | 239 | 22.60% | ||
| Post-secondary | 310 | 29.30% | ||
| Masters/Doctoral | 60 | 5.70% | ||
| I don’t know | 108 | 10.20% | ||
| H4 | Access to physical facilities and resources | |||
| H4_1 | Car | Yes | 254 | 25.50% |
| No | 744 | 74.50% | ||
| H4_2 | Television | Yes | 1030 | 97.60% |
| No | 25 | 2.40% | ||
| H4_3 | Bathrooms with a bathtub or shower | Yes | 883 | 84.60% |
| No | 161 | 15.40% | ||
| H5 | Home access to print books | 0–10 books | 205 | 19.40% |
| 11–25 books | 320 | 30.40% | ||
| 26–100 books | 364 | 34.50% | ||
| 101–200 books | 96 | 9.10% | ||
| 201–500 books | 44 | 4.20% | ||
| More than 500 books | 25 | 2.40% | ||
| H6 | Level of support from others on ways to use the Internet safely | |||
| H6_1 | Parents/caregivers | Never | 227 | 21.60% |
| Hardly ever | 281 | 26.80% | ||
| Sometimes | 307 | 29.30% | ||
| Often | 138 | 13.20% | ||
| Very often | 28 | 2.70% | ||
| All the time | 68 | 6.50% | ||
| H6_2 | Teachers | Never | 150 | 14.30% |
| Hardly ever | 243 | 23.20% | ||
| Sometimes | 413 | 39.40% | ||
| Often | 194 | 18.50% | ||
| Very often | 26 | 2.50% | ||
| All the time | 23 | 2.20% | ||
| H6_3 | Siblings | Never | 158 | 15.00% |
| Hardly ever | 160 | 15.20% | ||
| Sometimes | 356 | 33.80% | ||
| Often | 251 | 23.80% | ||
| Very often | 80 | 7.60% | ||
| All the time | 48 | 4.60% | ||
| H6_4 | Peers | Never | 117 | 11.10% |
| Hardly ever | 208 | 19.70% | ||
| Sometimes | 336 | 31.90% | ||
| Often | 236 | 22.40% | ||
| Very often | 97 | 9.20% | ||
| All the time | 60 | 5.70% | ||
| H7 | Level of encouragement from others to explore or learn things on the Internet | |||
| H7_1 | Parents/caregivers | Never | 224 | 21.40% |
| Hardly ever | 315 | 30.10% | ||
| Sometimes | 320 | 30.60% | ||
| Often | 116 | 11.10% | ||
| Very often | 30 | 2.90% | ||
| All the time | 41 | 3.90% | ||
| H7_2 | Teachers | Never | 71 | 6.80% |
| Hardly ever | 188 | 17.90% | ||
| Sometimes | 348 | 33.10% | ||
| Often | 315 | 30.00% | ||
| Very often | 68 | 6.50% | ||
| All the time | 61 | 5.80% | ||
| H7_3 | Siblings | Never | 117 | 11.20% |
| Hardly ever | 197 | 18.80% | ||
| Sometimes | 346 | 33.00% | ||
| Often | 239 | 22.80% | ||
| Very often | 99 | 9.40% | ||
| All the time | 50 | 4.80% | ||
| H7_4 | Peers | Never | 81 | 7.70% |
| Hardly ever | 163 | 15.40% | ||
| Sometimes | 320 | 30.30% | ||
| Often | 293 | 27.70% | ||
| Very often | 127 | 12.00% | ||
| All the time | 72 | 6.80% |
| Coded Name | Descriptions | Values | Frequencies | Proportion |
|---|---|---|---|---|
| B15 | Reaction when exposed to unwanted disturbing files or websites | |||
| B15_1 | Get rid of it immediately by closing the page, deleting the file, or scrolling away | No | 138 | 13.00% |
| Yes | 923 | 87.00% | ||
| B15_2 | Talk about it with parents/caregivers | No | 907 | 85.50 |
| Yes | 154 | 14.50% | ||
| B15_3 | Use a program that prevents it from happening again | No | 414 | 39.00% |
| Yes | 647 | 61.00% | ||
| B15_4 | Talk about it with a friend | No | 955 | 90.00% |
| Yes | 106 | 10.00% | ||
| B15_5 | Look away or close my eyes | No | 988 | 93.10% |
| Yes | 73 | 6.90% | ||
| B15_6 | Keep on browsing | No | 1035 | 97.50% |
| Yes | 26 | 2.50% | ||
| B15_7 | Block the webpage or website | No | 271 | 25.50% |
| Yes | 790 | 74.50% | ||
| B15_8 | Don’t know what to do | No | 1042 | 98.20% |
| Yes | 19 | 1.80% | ||
| B16 | Reaction when receiving unwanted disturbing messages including annoying messages or embarrassing pictures from someone in the contact list | |||
| B16_1 | Block and report the person | No | 216 | 20.40% |
| Yes | 845 | 79.60% | ||
| B16_2 | Delete the contact | No | 475 | 44.80% |
| Yes | 586 | 55.20% | ||
| B16_3 | Ignore the messages and the person | No | 874 | 82.40% |
| Yes | 187 | 17.60% | ||
| B16_4 | Talk with parents/caregivers about what to do | No | 826 | 77.90% |
| Yes | 235 | 22.10% | ||
| B16_5 | Ask the person to stop sending these messages or pictures | No | 377 | 35.50% |
| Yes | 684 | 64.50% | ||
| B16_6 | Talk with teachers about what to do | No | 985 | 92.80% |
| Yes | 76 | 7.20% | ||
| B16_7 | Report the issue to the police and show them what happened | No | 848 | 79.90% |
| Yes | 213 | 20.10% | ||
| B16_8 | Don’t know what to do | No | 1057 | 99.60% |
| Yes | 4 | 0.40% | ||
| B17 | Reaction when finding out about personal information being misused, compromised, or acquired online without permission | |||
| B17_1 | Change account password | No | 301 | 28.40% |
| Yes | 760 | 71.60% | ||
| B17_2 | Review privacy settings and choose a more secure password | No | 158 | 14.90% |
| Yes | 903 | 85.10% | ||
| B17_3 | Use a report button | No | 525 | 49.50% |
| Yes | 536 | 50.50% | ||
| B17_4 | Disable or delete the account and create a new account | No | 711 | 67.00% |
| Yes | 350 | 33.00% | ||
| B17_5 | Ask parents/caregivers to help | No | 905 | 85.30% |
| Yes | 156 | 14.70% | ||
| B17_6 | Ask teachers to help | No | 1001 | 94.30% |
| Yes | 60 | 5.70% | ||
| B17_7 | Report the issue to the police and show them what happened | No | 803 | 75.70% |
| Yes | 258 | 24.30% | ||
| B17_8 | Don’t know what to do | No | 1044 | 98.40% |
| Yes | 17 | 1.60% | ||
| B18 | Reaction when being bullied online by friends or others? | |||
| B18_1 | Block and report the persons | No | 347 | 32.80% |
| Yes | 711 | 67.20% | ||
| B18_2 | Delete the contact | No | 605 | 57.20% |
| Yes | 453 | 42.80% | ||
| B18_3 | Show the persons I am not bothered by their behavior by ignoring them | No | 730 | 69.00% |
| Yes | 328 | 31.00% | ||
| B18_4 | Talk with parents/caregivers about what to do | No | 746 | 70.50% |
| Yes | 312 | 29.50% | ||
| B18_5 | Ask the persons to stop sending annoying messages or pictures | No | 519 | 49.10% |
| Yes | 539 | 50.90% | ||
| B18_6 | Talk with teachers about what to do | No | 917 | 86.70% |
| Yes | 141 | 13.30% | ||
| B18_7 | Report the issue to the police and show them what happened | No | 855 | 80.80% |
| Yes | 203 | 19.20% | ||
| B18_8 | Keep the evidence of bullying (e.g., screenshot) | No | 351 | 33.20% |
| Yes | 707 | 66.80% | ||
| B18_9 | Don’t know what to do | No | 1043 | 98.60% |
| Yes | 15 | 1.40% |
| Domain | Definition |
|---|---|
| Digital Literacy | The ability to seek, critically evaluate, and use digital tools and information effectively to make informed decisions |
| Digital Safety and Resilience | The ability to understand how to protect oneself and others from harm in a digital space |
| Digital Participation and Agency | The ability to equitably interact, engage, and positively influence society through ICT |
| Digital Emotional Intelligence | The ability to recognize, navigate, and express emotions in one’s digital intrapersonal and interpersonal interactions |
| Digital Creativity and Innovation | The ability to express and explore oneself through the creation of content using ICT tools |
| Estimate | Std. Error | t Value | Pr(>|t|) | |
|---|---|---|---|---|
| (Intercept) | −0.182 | 0.123 | −1.476 | 0.140 |
| factor(g1)2 | −0.034 | 0.093 | −0.365 | 0.715 |
| factor(g1)3 | 0.035 | 0.088 | 0.403 | 0.687 |
| factor(g1)4 | 0.046 | 0.088 | 0.520 | 0.603 |
| factor(g1)5 | 0.062 | 0.088 | 0.710 | 0.478 |
| factor(f6)2 | 0.083 | 0.097 | 0.855 | 0.393 |
| factor(f6)3 | 0.148 | 0.096 | 1.538 | 0.124 |
| factor(f6)4 | 0.203 | 0.096 | 2.115 | 0.035 * |
| factor(f6)5 | 0.159 | 0.099 | 1.615 | 0.107 |
| factor(f6)6 | 0.243 | 0.229 | 1.058 | 0.290 |
| factor(h2)2 | 0.019 | 0.067 | 0.284 | 0.778 |
| factor(h2)3 | −0.008 | 0.063 | −0.133 | 0.894 |
| factor(h2)4 | 0.013 | 0.063 | 0.212 | 0.832 |
| factor(h2)5 | −0.049 | 0.064 | −0.778 | 0.437 |
| factor(h2)6 | −0.125 | 0.073 | −1.709 | 0.088 |
| factor(h2)7 | −0.061 | 0.068 | −0.895 | 0.371 |
| Estimate | Std. Error | t Value | Pr(>|t|) | |
|---|---|---|---|---|
| (Intercept) | 2.79685 | 0.07177 | 38.970 | < 2 × 10⁻¹⁶ *** |
| factor(g2)2 | 0.10545 | 0.08408 | 1.254 | 0.21003 |
| factor(g2)3 | 0.11177 | 0.07321 | 1.527 | 0.12714 |
| factor(g2)4 | 0.14963 | 0.07281 | 2.055 | 0.04013 * |
| factor(g2)5 | 0.22707 | 0.07582 | 2.995 | 0.00281 ** |
| factor(g2)6 | 0.19926 | 0.07973 | 2.499 | 0.01260 * |
| factor(f1)2 | 0.02989 | 0.02075 | 1.440 | 0.15008 |
| 4 Chains, Each with Iter = 5000; Warmup = 2000; Thin = 10; Post-Warmup Draws per Chain = 300, Total Post-Warmup Draws = 1200. | ||||||||||
|---|---|---|---|---|---|---|---|---|---|---|
| Mean | se_mean | sd | 2.5% | 25% | 50% | 75% | 97.5% | n_eff | Rhat | |
| alpha_school[1] | 3.95 | 0 | 0.15 | 3.65 | 3.86 | 3.95 | 4.05 | 4.24 | 1179 | 1 |
| alpha_school[2] | 3.65 | 0 | 0.15 | 3.35 | 3.55 | 3.65 | 3.76 | 3.94 | 1072 | 1 |
| alpha_school[3] | 4.64 | 0 | 0.15 | 4.36 | 4.54 | 4.64 | 4.74 | 4.93 | 1162 | 1 |
| alpha_school[4] | 4.64 | 0 | 0.15 | 4.36 | 4.55 | 4.64 | 4.74 | 4.94 | 1165 | 1 |
| alpha_school[5] | 4.43 | 0 | 0.15 | 4.14 | 4.34 | 4.43 | 4.53 | 4.72 | 1049 | 1 |
| alpha_school[6] | 4.45 | 0 | 0.15 | 4.15 | 4.35 | 4.45 | 4.56 | 4.73 | 1158 | 1 |
| alpha_school[7] | 4.44 | 0 | 0.14 | 4.16 | 4.35 | 4.45 | 4.54 | 4.73 | 943 | 1 |
| alpha_school[8] | 3.49 | 0 | 0.15 | 3.19 | 3.38 | 3.49 | 3.59 | 3.78 | 1267 | 1 |
| alpha_school[9] | 4.09 | 0 | 0.15 | 3.79 | 3.99 | 4.09 | 4.19 | 4.37 | 1204 | 1 |
| alpha_school[10] | 4.58 | 0 | 0.15 | 4.28 | 4.48 | 4.58 | 4.69 | 4.87 | 1290 | 1 |
| alpha_school[11] | 4.56 | 0 | 0.15 | 4.26 | 4.46 | 4.56 | 4.67 | 4.86 | 928 | 1 |
| alpha_school[12] | 4.34 | 0 | 0.15 | 4.05 | 4.23 | 4.34 | 4.44 | 4.63 | 1278 | 1 |
| alpha_school[13] | 4.28 | 0 | 0.13 | 4.01 | 4.19 | 4.28 | 4.37 | 4.52 | 1009 | 1 |
| alpha_school[14] | 4.21 | 0 | 0.13 | 3.94 | 4.11 | 4.21 | 4.30 | 4.48 | 1187 | 1 |
| alpha_school[15] | 4.39 | 0 | 0.14 | 4.12 | 4.31 | 4.39 | 4.48 | 4.67 | 1183 | 1 |
| alpha_school[16] | 3.62 | 0 | 0.13 | 3.36 | 3.53 | 3.62 | 3.71 | 3.88 | 1130 | 1 |
| alpha_school[17] | 4.44 | 0 | 0.15 | 4.15 | 4.33 | 4.43 | 4.53 | 4.73 | 1311 | 1 |
| alpha_school[18] | 4.32 | 0 | 0.16 | 4.04 | 4.21 | 4.32 | 4.43 | 4.63 | 1209 | 1 |
| alpha_school[19] | 4.30 | 0 | 0.15 | 4.02 | 4.20 | 4.30 | 4.41 | 4.60 | 1199 | 1 |
| alpha_school[20] | 4.35 | 0 | 0.13 | 4.09 | 4.26 | 4.35 | 4.44 | 4.61 | 1203 | 1 |
| beta_sex | −0.09 | 0 | 0.06 | −0.20 | −0.12 | −0.09 | −0.05 | 0.02 | 1172 | 1 |
| sigma_e0 | 0.91 | 0 | 0.02 | 0.87 | 0.89 | 0.91 | 0.92 | 0.95 | 1254 | 1 |
| mu_alpha | 4.26 | 0 | 0.12 | 4.02 | 4.18 | 4.25 | 4.35 | 4.51 | 1320 | 1 |
| sigma_alpha | 0.38 | 0 | 0.08 | 0.26 | 0.33 | 0.37 | 0.42 | 0.55 | 1028 | 1 |
© 2019 by the authors. Licensee MDPI, Basel, Switzerland. This article is an open access article distributed under the terms and conditions of the Creative Commons Attribution (CC BY) license (http://creativecommons.org/licenses/by/4.0/).
Share and Cite
Le, A.-V.; Do, D.-L.; Pham, D.-Q.; Hoang, P.-H.; Duong, T.-H.; Nguyen, H.-N.; Vuong, T.-T.; Nguyen, H.-K.T.; Ho, M.-T.; La, V.-P.; et al. Exploration of Youth’s Digital Competencies: A Dataset in the Educational Context of Vietnam. Data 2019, 4, 69. https://doi.org/10.3390/data4020069
Le A-V, Do D-L, Pham D-Q, Hoang P-H, Duong T-H, Nguyen H-N, Vuong T-T, Nguyen H-KT, Ho M-T, La V-P, et al. Exploration of Youth’s Digital Competencies: A Dataset in the Educational Context of Vietnam. Data. 2019; 4(2):69. https://doi.org/10.3390/data4020069
Chicago/Turabian StyleLe, Anh-Vinh, Duc-Lan Do, Duc-Quang Pham, Phuong-Hanh Hoang, Thu-Huong Duong, Hoai-Nam Nguyen, Thu-Trang Vuong, Hong-Kong T. Nguyen, Manh-Toan Ho, Viet-Phuong La, and et al. 2019. "Exploration of Youth’s Digital Competencies: A Dataset in the Educational Context of Vietnam" Data 4, no. 2: 69. https://doi.org/10.3390/data4020069