Genomic Tools for Effective Conservation of Livestock Breed Diversity


1
Departamento de Producción Animal, Facultad de Veterinaria, Universidad Complutense de Madrid, 28040 Madrid, Spain
2
VELOGEN.SL. Servicio de Genética. Facultad de Veterinaria, Universidad Complutense, Avenida Puerta de Hierro, s/n, 28040 Madrid, Spain
3
Departamento de Genética, Edificio Gregor Mendel, Campus de Rabanales, Universidad de Córdoba, 14071 Córdoba, Spain
*
Authors to whom correspondence should be addressed.
Diversity 2020, 12(1), 8; https://doi.org/10.3390/d12010008
Submission received: 4 November 2019
/
Revised: 13 December 2019
/
Accepted: 17 December 2019
/
Published: 20 December 2019
(This article belongs to the Special Issue Conservation of Rare Breeds of Livestock)
Abstract
:Human concern about the status of genetic diversity in livestock breeds and their conservation has increased, as intense selection and reduced population sizes in many breeds has caused losses on the global livestock genetic biodiversity. Traditionally, pedigree data provided by the breeders were used to estimate genetic diversity parameters, but over the past decades, technology has made possible the development of genomic markers. The result has been new opportunities to estimate genetic diversity in more detail, and to improve selection as well as prioritizing animals for conservation of genetic resources. The aim of the review is to summarize the evolution of livestock genomic markers and to explore the potential of the newest high-throughput technologies for estimation and conservation of livestock genetic diversity. More accurate diversity parameters are observed when genomic information is used for selection decisions instead of the traditional estimates using pedigree data. It is also possible to estimate additional parameters such as linkage disequilibrium to calculate effective population size or to minimize the genetic relatedness among the selected individuals based on runs of homozygosity. For long-term perspectives, new methods on genome editing are considered as new perspectives to reach a genetic diversity balance.
1. Animal Genetic Resources in Livestock Species
Domestic farm animals contribute daily to the livelihoods of millions of people. Around two billion people (one third of the global population) depend on farm animals for their livelihoods. Strikingly, it is estimated that about one third of domestic animal breeds are endangered in Europe and the Caucasus and 16% of mammalian breeds in North America. These are the two regions with the most highly specialized livestock industries, in which production is dominated by a small number of breeds [1]. Over the last years, numerous countries have joined efforts to create the Commission on Genetic Resources for Food and Agriculture in response to the concerns about the threats and challenges that livestock species are presently facing, such as climate change, new diseases, restrictions on the availability of natural resources and changing market demands. These efforts were taken in order to promote the sustainable management of livestock diversity and to increase the diverse range of Animal Genetic Resources (AnGR) available to adapt to those challenges.
The sustainable management of AnGR has been acquiring an increasing foothold on policy agendas, as revealed in the second report of the states of the World´s Animal genetic Resources for Food and Agriculture [1] and in the Aichi Targets draft post-2015 development goals developed at the Convention on Biological Diversity’s Strategic Plan for Biodiversity. Both highlight the development of major initiatives related to AnGR, stating that 177 countries had nominated national coordinators for the management of AnGR. [1].
Despite these efforts, the past three decades have experienced an alarming rate of livestock species extinction and genetic erosion, estimating that approximately 200 uniquely adapted breeds have become extinct, and up to 30% of global livestock breeds (~1.200–1.500) are currently endangered [1]. The message of the Aichi Targets was clear: if sufficient within-species genetic diversity is not conserved, the ecological and economic effects will be widespread and catastrophic [2]. Genetic diversity can be defined as the set of differences between species, breeds within species and individuals within breeds present in their DNA or observed in animals as a consequence [3]. Thus, it is necessary to preserve species and breeds genetic resources, prioritizing selection strategies to for the present-day demands, such as adaptations to the changing environments, enhanced immune responses or consumer demands.
Other important reasons to preserve genetic diversity in livestock populations are the insurance against the losses of genetic resources from local adapted populations with socio-economic, cultural, historic and ecological value. Accordingly, genetic diversity analysis has been essential to reconstruct genetic events that shaped the diversity parameters of current populations, including ancestry, prehistoric and historical migrations, admixture events and genetic isolation [4].
Traditionally, genetic diversity parameters were performed based on pedigree records. The probability of an individual being homozygous at a locus (inbreeding coefficient), the probability of sampling two identical alleles in a pair of individuals (coancestry coefficient), the proportion of genetic information in the population arising from a particular ancestor or the probability of lost alleles are classic genetic diversity parameters that can be estimated from genealogical records or pedigrees [4]. However, genealogical records present some drawbacks that limit their use in genetic diversity analysis. (1) In many local breeds, because of extensive management systems, the absence of pedigrees is common; (2) it is assumed that founders are unrelated and carry two different alleles in all loci; (3) a common assumption when measuring genetic relationships based on pedigree information is that full siblings share exactly 50% of their genes, but this can vary considerably; (4) in subdivided populations without genealogical connections, it is impossible to estimate the genetic relationships among sub-populations, such as the caste study on the Lidia breed, which we will explain later. In spite of these drawbacks, pedigree records are still important tools in conservation genetics analysis, in a way that they can inform on gene-mapping analyses, provide data for demographic studies and assess population structure in advance of genotyping in those populations, to mention some [5,6,7].
The paper is divided in eight sections. First, we present the advances of genomic tools and a brief discussion about the term “breed” as traditional conservation unit in livestock (Section 2 and Section 3). Then, we grouped the genomic diversity measurements in three broad categories: Heterozigosity (Section 4), Linkage disequilibrium (Section 5) and Runs of Homozygosity (Section 6), providing a case study on the Lidia breed (Section 7). Finally, we discuss strategies of genomic diversity measurements based on Next Generation Sequencing and genome editing (Section 8 and Section 9).
2. Genomic Tools in Livestock Genetic Resources Conservation
The fast development of molecular genetics has made possible to directly study and quantify genomic diversity instead of using the statistical inferences based on pedigree information. This is true even in populations without genealogical records [8,9]. Molecular genetic markers are at present one of the most powerful tools for genome analysis and allow the study of the association of heritable traits with underlying genomic variation. This is important not only to analyze a population’s genetic diversity, but also to study the genetic relationships among them.
Before the introduction of DNA analysis, biochemical polymorphic characters were traditionally used to study genetic differences between and within populations and to estimate genetic divergence [10]. A large number of studies, particularly during the 1970s, analyzed the genetic variability among livestock populations through the use of blood groups and allozyme systems [11]. These studies became necessary to improve selection strategies on farm animals given the fact that some polymorphic alleles may be connected or linked with economic-important traits.
However, the development of automatic or semi-automatic DNA polymorphism screening techniques prompted the substitution of protein polymorphism by DNA polymorphisms as the markers of choice for genetic diversity studies [12]. At present, genetic diversity parameters can be estimated directly from DNA providing accurate outputs of the genetic variations between and within breeds, populations and individuals.
Beginning in 1990, microsatellite molecular markers became very successful and extensively used for parentage testing, individual identification, and breed allocation in domestic animals, and were used for genetic diversity characterization studies [13,14,15,16,17,18,19]. The developments of microsatellite marker maps became available to estimate additive genetic effects of markers and were routinely used, for example, for Quantitative Locus (QTL) detection in most livestock species. This resulted in a breakthrough in genetic diversity analyses [20,21,22,23].
In the past decade modern genetic analyses arose with the emergence of high-throughput sequencing, obtaining genomic information such as single nucleotide polymorphisms (SNPs) and shotgun whole genome sequencing (WGS). SNPs are single mutations of the genome sequence located in coding and non-coding regions, so that both neutral and functional genetic variation can be analyzed with them [24]. The availability of automation, their low cost and their high frequency in domestic animal genomes have favored their used in livestock genetic studies. Currently, commercial SNPs high throughput arrays are available for the majority of the livestock species, targeting genetic variants widely spread along their entire genomes. Importantly, commercial breeds are used to design the arrays; thus, there is some ascertainment bias regarding local breeds [25]. Complete genome-reference assemblies of livestock species are continuously being updated, as well as commercial SNP chips (Table 1).
The latest advances and increasing economic accessibility of WGS brings new perspectives for genetic diversity conservation. Unlike SNPs, WGS is the complete genome sequence containing all the polymorphism present on the genome. Thus, WGS does not have the problem of ascertainment biases. Another advantage of WGS is that it contains information on rare variants and their causal mutations, and it maps genomic regions highly affected by selection pressure, for example, the potential causal mutation for dwarfism in the Miniature Shetland pony [26], and novel mutations associated with polledness in cattle [27]. Conservation of rare variants has received little attention due to the inaccessibility through SNP arrays. As WGS data capture both common and rare variants, its usage opens new possibilities for programs on conservation of genetic diversity. This is especially the case for rare variants, which may represent one of the major goals of genetic diversity management in livestock species, for both long- and short-term perspectives [24,25,28].
3. Breeds as Conservation Units
The last 250 years have seen unprecedented opportunities for livestock genetic diversity. Systematic performance recording, identification of animals and pedigree recording managed by breeders’ associations and documented in their herd books, have led to the development of more homogenous populations. Explicit breeding objectives accentuated the existing differences between geographically separated populations [1]. This not only led to the fixation of population-specific traits, coat color being the easiest target, but also to an increase in production traits [29]. These events culminated in the formation of numerous structured breeds used for a wide variety of purposes and with different performance levels. Over time, domesticated livestock species have evolved into more or less distinct subgroups, or “breeds,” traditionally used as the basis of genetic diversity conservation. However the question “What is a breed?” has no simple answer and many definitions have been proposed [30]. Some definitions involve concepts other than those related with genetic characterization, for example: “A breed is either a sub-specific group of domestic livestock with definable and identifiable external characteristics that enable it to be separated by visual appraisal from other similarly defined groups within the same species, or a group for which geographical and/or cultural separation from phenotypically separate groups has led to acceptance of its separate identity” (FAO). Others are more simple and ethereal like “A breed is a breed if enough people say it is”. The aim of this review is not to propose a definition of breed, but it does use breed as the classical unit of conservation. However, “livestock population” could also be used for our purposes.
4. Heterozygosity: An Estimator of Genetic Diversity
The classical measures of genetic diversity estimated from molecular information include some essential parameters including observed and expected heterozygosity, and allelic diversity or number of polymorphic alleles by locus. Probably the most widely used is the expected heterozygosity (He) that was defined by Nei in 1973 [31] as the probability that two alleles chosen at random from a population are different. Alternatively, it may also be defined as the proportion of heterozygous individuals in a population at Hardy-Weinberg equilibrium with the same allelic frequencies as observed in the actual population [32]. The classical formula to estimate it is: , where p is the frequency of all the alleles at that locus. It is assumed that populations with higher He are genetically more diverse and hence, more capable to adapt to changes and to respond to selection (natural or artificial) [33]. Complementarily, Observed Heterozygosity (HO) is a measure defined as the frequency of heterozygotes in a population. It is correlated negatively to inbreeding depression, which is the performance decline of a trait due to the expression of deleterious recessive alleles in homozygotes [32]. In general, natural (finite) populations are not assumed to be at Hardy-Weinberg equilibrium so the relationships between He and HO can reveal a deficit of heterozygosity. This can be used to estimate a population’s inbreeding through the estimation of FIS ().
Microsatellites have traditionally been used to estimate genetic diversity and genetic relationships between breeds. One major problem surrounding those analyses is the comparison between them if different numbers or subsets of microsatellites are genotyped. Fortunately, large-scale microsatellite analyses have been developed in livestock breeds [19,34,35,36,37].
Gradually, SNP markers replaced microsatellites for various reasons. SNPs are available in higher numbers and more broadly across the genome, which makes it possible to evaluate genetic diversity more precisely and separately for each specific segment of the genome [38,39]. It is expected that neighboring SNPs show differences in diversity, and therefore, it is difficult to identify specific regions with higher or lower diversity based on individual SNPs or on average estimates of diversity parameters through the genome. Thus, to identify differences in diversity at specific chromosome regions, He can be estimated through defining sliding windows of specified size and, for each sliding window, estimate the He by considering the average of all SNP values lying within that window [40]. Accordingly, conservation efforts may focus either on regions with reduced diversity or on those regions where diversity is disappearing. It is also possible to differentiate among regions related to diversity in traits and non-functional diversity. From a conservation point of view, this procedure also allows identifying differences in diversity for specific chromosome regions, even among closely related populations. This can be valuable when animals need to be selected for maintaining diversity in a gene banks. For example, we can identify conserved diversity across the genome preserved in a gene bank and add candidates with different diversity. Furthermore, as SNPs are located mostly in non-coding regions but also in regions that affect traits of interest, they can be used as a measure of non-neutral genetic diversity. This information can be used in conservation programs in order to maintain genetic diversity but also to assure performance in functional or fitness related traits, which may improve the probability of survival of the population itself.
Traditionally, genetic diversity was estimated by pedigree records based on coefficient of inbreeding and kinship, as the proportion of the genome that it is expected to be identical by descent (IBD) within and between individuals respectively. Animals with the least pedigree relatedness were selected for conservation purposes. This commonly used method is called the optimal contribution method [41,42]. However, genealogical information has several disadvantages as it is biased by the depth of information, and mendelian sampling variation it is not considered. The development of high throughput SNP arrays favored new and more accurate estimates of genome-wide diversity with specific genome regions showing a more detailed picture. An important difference among pedigree- and molecular-marker-based diversity is related to founder populations. With pedigree records, it is assumed that all alleles are defined as being not IBD, while with molecular markers, all alleles that are identical by state (IBS) are assumed to be IBD [43]. Consequently, pedigree- and marker-based diversity is estimated on a different scale, as pedigree-based diversity reflects only diversity as a result of recent and documented ancestry.
It is often of interest to combine different sources of information in conservation programs. If pedigree information is available, a first analysis of the least related animals following their genotyping with a high density SNP chip and optimal contribution analysis based on molecular information allows a better identification of those animals that most contribute to the genetic diversity of the population. Subsequently, as the SNP analysis is a sampling of the total genome, those animals selected can be sequenced in order to identify specific favorable alleles, related to traits of interest or to non-functional alleles, in order to preserve them.
5. Linkage Disequilibrium: Understanding the Demographic History and Selection
Linkage disequilibrium (LD) refers to non-random association between alleles at different loci within a population, resulting in a higher frequency of certain haplotypes at a locus than expected by chance. Genomic linkage disequilibrium is a consequence of different genetic forces, such as selection, mutation, drift and non-random mating, and can also be due to non-genetic causes. Traditionally, LD has been measured by the estimation of |D´| and r2. |D´| is overestimated in small samples and in the presence of rare alleles; r2 is the correlation between two loci and is usually preferred for association studies [44]. The r2 values depend mostly on the population size, fraction of recombination and time [45]. Numerous studies have been conducted to estimate the LD pattern in livestock species [46,47,48,49,50]. These results shown that LD in livestock populations are more extensive than in human populations as a consequence of their smaller effective population size and their recent strong directional selection [51].
The availability of high-throughput SNP arrays favored the analysis of LD patterns across the genome. When a polymorphism is under balancing selection the LD rates will decrease over the time but may increase in a transient phase. Thus, specific allelic combinations are inherited over generations more often than the expected by chance. This information has become in an important tool for genomic selection, genome-wide association studies (GWAS) and QTL mapping for complex traits. Positive selection leaves a recognizable haplotype structure until the polymorphism is fixed, and several statistical methods have been developed for detecting selection based on LD patterns [52,53,54]. However, in those studies, it is necessary to determine which pair of chromosomes holds each allele (persistence of phase). The persistence of a linkage phase can explain why the linkage between a marker and a QTL detected in a population is not always validated in another. While the r2 statistic between two SNP markers at the same distance in different breeds or populations can be the same value even if the phases of the haplotypes are reversed, they will only have the same value and sign for the r statistic if the phase is the same in both pairs of breeds or populations. In addition, the correlation between marker pairs of a given distance is equal to the correlation of the effects of the marker between both populations, assuming the same distance to the QTL of both markers [55].
Generally, as the distance among markers increase, the LD among them decreases. This trend was previously detected in goats [56], sheep [57], cattle [58] and pigs [46]. Additionally, the LD patterns have shown clear differences among species. In sheep and goats, the LD levels are lower than in cattle, pig and dogs [59], probably due to comparably lower selection intensities. However, it is important to consider that LD patterns and scale within and between populations/breeds are influenced by several factors such as marker allele frequencies, selection history, population structure and effective size, marker type and density, as well as which LD measure is used. Thus, an appropriate comparison between studies must consider the methodology used, and hence, these factors should be considered when conclusions are drawn from comparisons between different studies.
LD patterns and effective population size (Ne) have recently received special attention due to their relationships with demographic processes, such as migration and admixture, their implications for understanding the architecture of the animal genome and for conservation purposes [60]. During the 1960s, the first methodologies describing the relationships among Ne an LD were developed [45,61,62,63], followed by several modifications introduced in the early 21th century [64,65]. The methodologies are based on the correlation between alleles at different loci to estimate Ne. The analysis of unlinked or linked loci reflects the inbreeding effective population size in the last generation or over long periods of time, respectively [66]. Even a recent methodology based on SNP data allows the Ne estimation over a range of time points from a single sample for population [67]. However, methodological aspects can substantially affect Ne estimations from LD patterns and have been taken into consideration [67]. For example, small sample sizes leads to LD estimation biases; thus, it has been postulated that a minimal sample size of 55 was required to accurately estimate LD by r2 [44].
6. Runs of Homozygosity: Inbreeding Measurement
The outcome of consanguineous mating is offspring with increased rates of identical genomic segments, known as identity by descent (IBD) genomic regions. The length of this identical genomic segments is proportional to the nearest of its common ancestors because recombination events interrupt long chromosome segments. In this context, long identical genomic segments are expected to have a recent common ancestral origin. On the contrary, short segments arise from remote ancestors. The availability of denser genome-wide microsatellite scans led to the detection of uninterrupted long runs of homozygous genotypes, commonly known as runs of homozygosity (ROH) defined as continuous and uninterrupted stretches of DNA sequences without heterozygosity in the diploid state [68]. The use of high-density SNP arrays opened the possibility to develop new approaches to study the ROH patterns across the genome related to demographic variations of populations. In outbred populations, the number of ROH is associated with the effective population size, with smaller populations tending to have more ROH and larger populations fewer. On the contrary, populations with high inbreeding rates have much longer ROHs segments as a consequence of deep parental relatedness. Admixed populations have fewer ROH segments comparing with their respective parental populations. After a bottleneck effect, the number of ROH increases while the length decreases. The greatest burden of ROH is expected in populations with low effective size in the past and recent inbreeding. Several studies analyzed the ROH distribution pattern across the genome in livestock populations to explain their demographic history and provide insights to propose strategies to their conservation management [69].
One of the first examples in which SNP data were analyzed to address important questions in conservation genetics matter was performed in domestic and wild pigs [70]. The simultaneous analyses on LD to estimate past and present Ne, and ROH, provided valuable insights to settle future management strategies in Iberian Peninsula pig breeds. Further studies developed in cattle, goats and sheep allowed the detection of selection signatures based on common shared runs of homozygosity (ROH islands) [69,71,72,73]. As selection is distinguished by local reductions in haplotype diversity, depending on the distribution of ROH patterns across the genome, results allow the identification of genomic regions that have been subjected to either recent and/or ancient selective pressure events [74,75]. These regions also allow, through gene ontology and enrichment analyses, identifying of candidate genes associated with selection for different traits, highlighting those of economic-interest in different livestock populations such as horses, cattle, sheep and poultry [76,77,78,79].
It is well known that the frequency of homozygotes increases in relation to the inbreeding values in a population and, as a consequence, this information can reveal the harmful effects of recessive deleterious variants present within the ROHs. This effect, known as inbreeding depression, affects population fitness, and consequently, also affects traits of economic interest. Therefore, the estimation of the inbreeding coefficient (F) is crucial to breeding schemes and strategies for conservation purposes. Traditionally, F has been estimated from pedigree data (FPED), but estimates from SNP markers are substantially more accurate and less biased than FPED, even when large pedigrees are considered [80]. Accordingly, ROH have been proposed as an effective way to estimate F (FROH), defined as the proportion of the genome within these segments. It should be noted that, because FROH values are obtained from molecular information, they are based on the observed homozygosity instead of the FPED, whose values are obtained from probabilities. Based on FPED, it has been documented that recent inbreeding is more harmful than ancient inbreeding in milk production traits [81]. Deleterious allele frequencies decrease over time as a result of selection and strengthened by purging, which is more effective under strong selection and slow accumulation of inbreeding over generations. However, studies of the relationship among long (recent inbreeding) and short ROH (ancient inbreeding) with inbreeding depression revealed different results [82,83]. While Szpiech et al. [84] predicted higher deleterious variants in long ROH than in shorter segments in human populations, Zhang et al [85] stated that short and medium sizes of ROH are associated to significant enrichment of deleterious variants comparing to longer segments in cattle breeds. It has also been suggested in dogs that the ROH of all sizes may contribute to inbreeding depression.
There are several aspects that affect the accuracy of ROH estimates and, as a consequence, its further analyses and interpretations. First, the parameters settled to define the ROH are essential and vary significantly in both, amount and distribution through the genome. Rodríguez-Ramilo and Fernández [86] stated that minimum length, minimum number of SNPs, minimum SNP density and maximum distance between two adjacent SNPs are the parameters with higher influence in FROH values. Lencz et al. [87] proposed a new formula to estimate the minimum number of SNPs needed to define the ROHs based on the availability and density of the SNPS. Additionally, Purcell et al. [88] developed a new method to remove those SNPs in linkage equilibrium in order to avoid false ROH. Second, the density of the SNP parelationel is important, because panels shorter than 2 Mb may result in a higher rate of false positives [85]. Thus, efficient estimation of ancient inbreeding requires higher resolution panels. Finally, the recombination rate across the genome it is not uniform; thus, ROH with the same length located in genomic regions with different recombination rates reveals a different inbreeding history, but these are considered as equal FROH estimations.
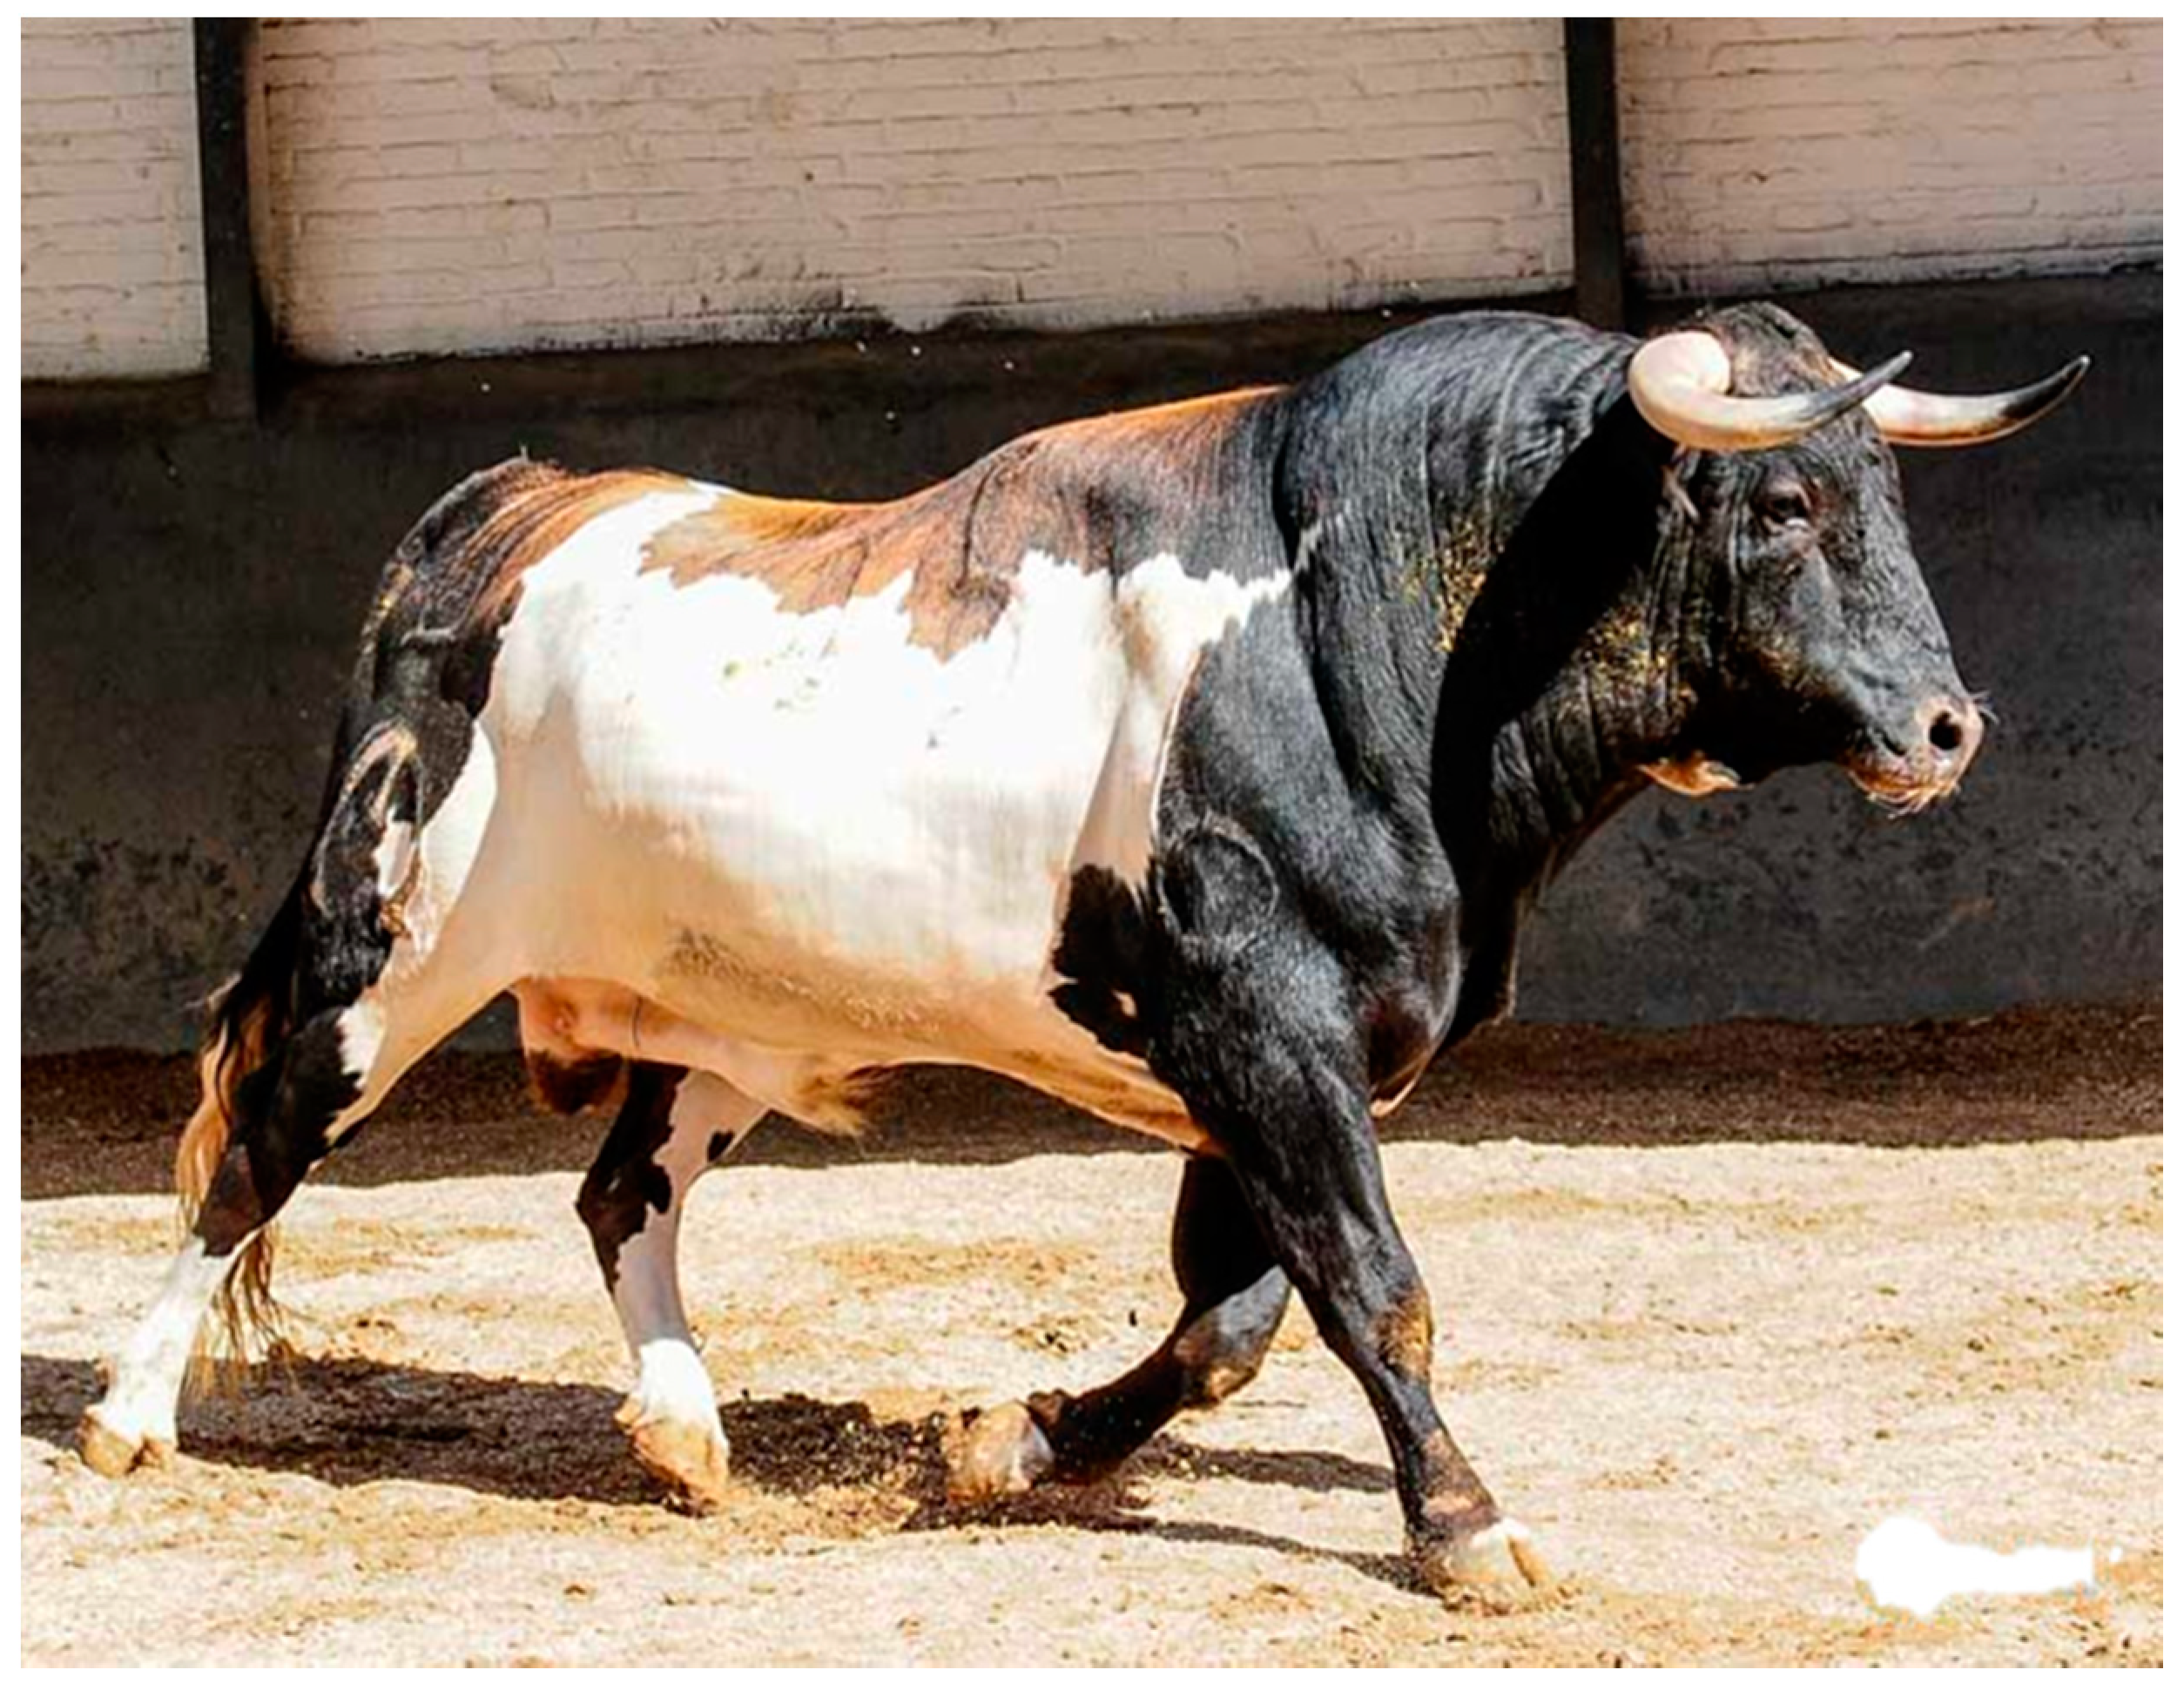
7. Case Study: Example of the Lidia Breed
The Lidia bovine breed is one of the most successful domestic local breed among any Spanish cattle breeds, being one of the most popular and most inclusive intergrading bovine breeds (Figure 1). It has spread through some European countries, such as France, Portugal and Spain, and numerous Central and South American countries. This breed is one of a kind among bovine populations for being selected for behavioral traits with a long history of isolation [89]. Different types of traditional popular events demand different types of behavior, with a desirable common pattern of aggressiveness present in the behavior of the whole breed. These variations in behavioral needs have been one of the principal reasons why this racial group is fragmented into small lineages, traditionally called encastes, with different levels of gene flow among them and different behavioral traits favored in each one. Some of the more isolated lineages, with a low number of animals contributing to the gene pool, can suffer from a loss of genetic variation and inbreeding depression, while others are the result of a mixture of ancestral lineages. The genetic diversity within lineages has been analyzed using pedigree records [90,91]. However, the genetic relationships among lineages can only be achieved by molecular data due to the absence of pedigree connections between lineages. Microsatellite markers and SNPs have achieved high genetic differentiation between lineages (average FST = 0.18) and have also allowed the analysis of the genetic relationships among herds located in different countries such as Spain and Mexico [89,92]. Results are revealing the fact that the population subdivision has been, in an unintended way, a powerful mechanism to maintain genetic richness, because different alleles at a locus can be fixed in different lineages and kept as variation source [91,93].
8. Next Generation and DNA Sequencing: Past and Present
The novel Next Generation Sequencing (NGS) techniques have evolved rapidly, allowing, in contrast to the SNP beadchips, unbiased and comprehensive analysis of genetic diversity parameters. Genome sequences provide individuals´ entire genetic information of neutral loci and coding regions, thus, demographic parameters related to selective or adaptive processes can be estimated more accurately. In addition to simple measures of genetic diversity, such as the number of polymorphic nucleotides or nucleotide diversity, whole genome sequences (WGS) offer new possibilities in genetic diversity analysis, such as (a) the detection of other types of polymorphisms such as Copy Number Variants (CNV); (b) the discovery of new causal mutations associated with traits of interest in livestock; (c) the identification of rare genetic variants with minor allele frequencies [93]. Rare variants represents an important source of variation with higher probabilities to be lost than common variants due to genetic drift or natural or artificial selection. However, conservation of rare variants has received little attention because are not included in commercial SNPs chip in spite of could be important in future breeding programs. Different selection strategies results in dramatic losses of rare genetic variants, up to 72%, that are negligible when SNP data are used because they are focused on more common variants [94].
Animal selection for breeding purposes is commonly based on the estimation of genetic relationships and inbreeding coefficients of the population under study. In this context, inference of genetic relationships estimations has evidenced significant changes when alleles with a frequency lower than 5% were removed for the analysis [94]. The results evidenced that genetic diversity conservation procedures could be affected by these differences, especially in long-term scenarios. Thus, methods that weigh rare genetic variants are preferred in order to conserve such variants for future settings. A key factor in WGS analysis is the sequencing coverage, which directly affects the genotyping quality, especially in rare genetic variants. The accuracy of genetic variants identified from WGS data is greatly dependent on the sequencing depth, defined as the average number of times each base is sequenced. The proportions of transitions versus transversions, called transitions/transversions ratio (Ti/Tv), have been proposed as a measure of the quality assessment of SNPs inferred from sequencing data; they are in a higher ratio associated with higher accuracy [95]. Recent studies with pig data have achieved that a depth of 10× ensures good SNP validation, while 4× is the low boundary for reasonable sequencing quality [96].
Adaptation to climate changes or to extreme environments, loss of genetic diversity, effects of rare alleles in genomic relationship estimations or genomic diversity characterization of livestock breeds are relevant areas of WGS application. Furthermore, the development of sequencing technologies has prompted floodgates to other research areas previously closed. Prior to the development of Next Generation Sequencing (NGS), ancient DNA (aDNA) analysis were limited to mitochondrial DNA or small genomic regions due to the inherent difficulties of the paleo genomics field to obtain fossil DNA of good quality and quantity. In this regard, the novel methodologies of DNA extraction, libraries preparation and NGS techniques have increase genomic studies of extinct species or ancient samples of current livestock breeds. NGS has provided unique glimpses into (human-mediated) population dynamics since domestication in horses [97,98], pigs [99], sheep and goats [100] and chickens [101], as well as into functional gene changes associated with domestication [102]. Additionally, WGS analysis have improved our understanding of the degradation processes that aDNA undergoes over time. Cytosine deamination [103], resulting in C>U changes at regular cytosines and C>T changes at 5-methylated cytosines [103]. In addition, epigenetic modifications and microbiome alterations have been recently considered when discussing the evolutionary history of a particular species, mainly because they have the potential to add new insights into the modern synthesis [104].
9. A New Era of Genetic Diversity Improvements: Synthetic Biology
Recent advances in genome editing methods like CRISPR/Cas9 allow the deletion, addition or change of alleles at specific locations in the genome of a cell. If made in germline cells, those changes are permanent and heritable. These advances have attracted interest in using this technology to accelerate genetic gain in breeding programs [105].
At present, there are several genome editing applications in livestock addressing simple traits that are controlled by a small number of causal variants with large effects, such as the myostatin gene responsible for the "double muscling" in cows, pigs and sheep [106], the introduction of the polled (hornless) gene in cattle [107], and in pigs, the pre-determination of sex [108] and resistance to certain viral diseases such as the Porcine Reproductive Respiratory Syndrome and African Swine Fever [109,110]. However, livestock breeding improvement programs are oriented to traits of quantitative interest, probably affected by multiple causal variants with small effects. In this regard, the novel editing strategy called PAGE (promotion of alleles through genome editing) allows editing a small number of causal variants, doubling the rate of genetic gain in the short and long term compared to traditional selection [105].
Beyond selection, genome editing techniques could be used for genetic diversity re-introgression when it has fully disappeared from the population, or even for the artificial addition of variations of interest. For example, Shen et al. showed that CRISPR/Cas9 could allow the rapid introduction of genetic diversity in crop breeding [111].
Genome editing has the potential to create a major change in how we perceive and implement genetic diversity improvement of livestock species; however, genome editing is still challenging, with an uncertainty about future acceptance of application of the technique in animal breeding. An ethical debate is needed on when and why the application of genome editing in livestock breeding is desired, and if accepted, the potential costs and benefits of need also need to be considered [112].
Author Contributions
P.G.E. and O.C. - original draft preparation and writing, A.M. reviewed and edited the manuscript. All authors have read and agreed to the published version of the manuscript.
Funding
This research received no external funding.
Conflicts of Interest
The authors declare no conflict of interest
References
- FAO. The Second Report on the State of the World’s Animal Genetic Resources for Food and Agriculture; Scherf, B.D., Pilling, D., Eds.; FAO Commission on Genetic Resources for Food and Agriculture Assessments: Rome, Italy, 2015; Available online: http://www.fao.org/3/a-i4787e/index.html (accessed on 1 October 2019).
- Hoban, S.M.; Hauffe, H.C.; Pérez-Espona, S.; Arntzen, J.W.; Bertorelle, G.; Bryja, J.; Frith, K.; Gaggiotti, O.E.; Galbusera, P.; Godoy, J.A.; et al. Bringing genetic diversity to the forefront of conservation policy and management. Conserv. Genet. 2013, 5, 593–598. [Google Scholar] [CrossRef] [Green Version]
- Woolliams, J.A.; Oldenbroek, J.K. Genetic diversity issues in animal populations in the genomic era. In Genomic Management of Animal Genetic Resources, 1st ed.; Oldenbroek, J.K., Ed.; Wageningen Academic Publisher: Gelderland, The Netherlands, 2018; pp. 13–47. [Google Scholar]
- Caballero, A.; Toro, M.A. Interrelations between effective population size and other pedigree tools for the management of conserved populations. Genet. Res. 2000, 75, 331–343. [Google Scholar] [CrossRef]
- Schäler, J.; Hinrichs, D.; Thaller, G. The benefit of native uniqueness in a local red cattle breed from Northern Germany. J. Anim. Breed. Genet. 2019, 136, 518–525. [Google Scholar] [CrossRef]
- Doublet, A.C.; Croiseau, P.; Fritz, S.; Michenet, A.; Hozé, C.; Danchin-Burge, C.; Laloë, D.; Restoux, G. The impact of genomic selection on genetic diversity and genetic gain in three French dairy cattle breeds. Genet. Sel. Evol. 2019, 51, 52. [Google Scholar] [CrossRef] [Green Version]
- Cortés, O.; Eusebi, P.; Dunner, S.; Sevane, N.; Cañón, J. Comparison of diversity parameters from SNP, microsatellites and pedigree records in the Lidia cattle breed. Livest. Sci. 2019, 219, 80–85. [Google Scholar] [CrossRef]
- Frankham, R.; Ballou, J.D.; Briscoe, D.A. Introduction to Conservation Genetics, 2nd ed.; Cambridge University Press: Cambridge, UK, 2002. [Google Scholar]
- Sonesson, A.K.; Woolliams, J.A.; Meuwissen, T.H.E. Genomic selection requires genomic control of inbreeding. Genet. Sel. Evol. 2012, 44, 27. [Google Scholar] [CrossRef] [PubMed] [Green Version]
- Lee, M. DNA markers and plant breeding programs. Adv. Agron. 1995, 55, 265–344. [Google Scholar]
- Georges, M.; Lathrop, M.; Bouquet, Y.; Hilbert, P.; Marcotte, A.; Schwers, A.; Roupain, G.; Hanset, R. Linkage relationships among 20 genetic markers in cattle Evidence for linkage between two pairs of blood group systems: B-Z and S-F/V respectively. Anim. Genet. 1990, 21, 95–105. [Google Scholar] [CrossRef] [PubMed]
- Robertson, J.S. Polymerase chain reaction (PCR) and sequencing. Dev. Biol. Stand. 1994, 83, 81–85. [Google Scholar] [PubMed]
- Fredholm, M.; Winterø, A.K. Efficient resolution of parentage in dogs by amplification of microsatellites. Anim. Genet. 1996, 27, 19–23. [Google Scholar] [CrossRef] [PubMed]
- Bowling, A.T.; Eggleston-Stott, M.L.; Byrns, G.; Clark, R.S.; Dileanis, S.; Wictum, E. Validation of microsatellite markers for routine horse parentage testing. Anim. Genet. 1997, 28, 247–252. [Google Scholar] [CrossRef] [PubMed]
- Cañón, J.; Alexandrino, P.; Bessa, I.; Carleos, C.; Carretero, Y.; Dunner, S.; Ferran, N.; Garcia, D.; Jordana, J.; Laloë, D.; et al. Genetic diversity measures of local European beef cattle breeds for conservation purposes. Genet. Sel. Evol. 2001, 33, 311. [Google Scholar] [CrossRef] [PubMed] [Green Version]
- Delgado, J.V.; Martínez, A.M.; Acosta, A.; Alvarez, L.A.; Armstrong, E.; Camacho, E.; Cañón, J.; Cortés, O.; Dunner, S.; Landi, V.; et al. Genetic characterization of Latin-American Creole cattle using microsatellite markers. Anim. Genet. 2012, 43, 2–10. [Google Scholar] [PubMed]
- Lenstra, J.A.; Groeneveld, L.F.; Eding, H.; Kantanen, J.; Williams, J.L.; Taberlet, P.; Nicolazzi, E.L.; Solkner, J.; Simianer, H.; Ciani, E.; et al. Molecular tools and analytical approaches for the characterization of farm animal genetic diversity. Anim. Genet. 2012, 43, 483–502. [Google Scholar] [PubMed]
- Eusebi, P.G.; Cortés, O.; Dunner, S.; Cañón, J. Genetic diversity of the Mexican Lidia bovine breed and its divergence from the Spanish population. J. Anim. Breed. Genet. 2017, 134, 332–339. [Google Scholar] [CrossRef] [PubMed]
- Ginja, C.; Gama, L.T.; Cortés, O.; Burriel, I.M.; Vega-Pla, J.L.; Penedo, C.; Sponenberg, P.; Cañón, J.; Sanz, A.; do Egito, A.A.; et al. The genetic ancestry of American Creole cattle inferred from uniparental and autosomal genetic markers. Sci. Rep. 2019, 9, 11486. [Google Scholar] [CrossRef]
- Fernando, R.L.; Grossman, M. Marker assisted selection using best linear unbiased prediction. Genet. Sel. Evol. 1989, 21, 467. [Google Scholar]
- Sternstein, I.; Reissmann, M.; Maj, D.; Bieniek, J.; Brockmann, G.A. A comprehensive linkage map and QTL map for carcass traits in a cross between Giant Grey and New Zealand White rabbits. BMC Genet. 2015, 11, 16. [Google Scholar] [CrossRef] [Green Version]
- Yoo, C.K.; Park, H.B.; Lee, J.B.; Jung, E.J.; Kim, B.M.; Kim, H.I.; Ahn, S.J.; Ko, M.S.; Cho, I.C.; Lim, H.T. QTL analysis of body weight and carcass body length traits in an F2 intercross between Landrace and Korean native pigs. Anim. Genet. 2014, 45, 589–592. [Google Scholar]
- Sahana, G.; Guldbrandtsen, B.; Thomsen, B.; Lund, M.S. Confirmation and fine-mapping of clinical mastitis and somatic cell score QTL in Nordic Holstein cattle. Anim. Genet. 2013, 44, 620–626. [Google Scholar] [CrossRef]
- Toro, M.A.; Fernandez, J.; Caballero, A. Molecular characterization of breeds and it use in conservation. Livest. Sci. 2009, 120, 174–195. [Google Scholar] [CrossRef]
- Pérez-Enciso, M.; Rincón, J.C.; Legarra, A. Sequence- vs. chip-assisted genomic selection: Accurate biological information is advised. Genet. Sel. Evol. 2015, 47, 43. [Google Scholar]
- Metzger, J.; Gast, A.C.; Schrimpf, R.; Rau, J.; Eikelberg, D.; Beineke, A.; Hellige, M.; Distl, O. Whole-genome sequencing reveals a potential causal mutation for dwarfism in the Miniature Shetland pony. Mamm. Genome 2017, 28, 143–151. [Google Scholar] [CrossRef] [PubMed]
- Medugorac, I.; Graf, A.; Grohs, C.; Rothammer, S.; Zagdsuren, Y.; Gladyr, E.; Zinovieva, N.; Barbieri, J.; Seichter, D.; Russ, I.; et al. Whole-genome analysis of introgressive hybridization and characterization of the bovine legacy of Mongolian yaks. Nat. Genet. 2017, 49, 470. [Google Scholar] [CrossRef] [PubMed]
- Bijma, P. Long-term genomic improvement—New challenges for population genetics. Livest. Sci. 2012, 129, 1–2. [Google Scholar] [CrossRef] [PubMed]
- Linderholm, A.; Larson, G. The role of humans in facilitating and sustaining coat colour variation in domestic animals. Semin. Cell Dev. Biol. 2013, 24, 587–593. [Google Scholar] [CrossRef] [PubMed]
- Woolliams, J.A.; Toro, M.A. What is genetic diversity. Utilisation and Conservation of Farm Animal Genetic Resources, 1st ed.; Oldenbroek, J.K., Ed.; Wageningen Academic Publisher: Gelderland, The Netherlands, 2007; pp. 55–74. [Google Scholar]
- Nei, M. Analysis of gene diversity in subdivided populations. Proc. Natl. Acad. Sci. USA 1973, 70, 3321–3323. [Google Scholar] [CrossRef] [Green Version]
- Mäki-Tanila, A.; Fernandez, J.; Toro, M.A.; Meuwissen, T.H.E.; Hiemstra, S.J.; de Haas, Y.; Mäki-Tanila, A.; Gandini, G. Assesment and management of genetic variation. In Local Cattle Breeds in Europe, 1st ed.; Wageningen Academic Publishers: Wageningen, The Netherlands, 2010; pp. 98–117. [Google Scholar]
- Allendorf, F.W.; Luikart, G.H.; Aitken, S.N. Conservation and the Genetics of Populations, 2nd ed.; Wiley-Blackwell: Hoboken, NJ, USA, 2013. [Google Scholar]
- Hillel, J.; Groenen, M.A.M.; Tixier-Boichard, M.; Korol, A.B.; David, L.; Kirzhner, V.M.; Burke, T.; Barre-Dirie, A.; Crooijmans, R.P.M.A.; Elo, K.; et al. Biodiversity of 52 chicken populations assessed by microsatellite typing of DNA pools. Genet. Sel. Evol. 2003, 35, 533–557. [Google Scholar] [CrossRef] [Green Version]
- Ollivier, L.; Alderson, L.; Gandini, G.C.; Foulley, J.L.; Haley, C.S.; Joosten, R.; Rattink, A.P.; Harlizius, B.; Groenen, M.A.M.; Amigues, Y.; et al. An assessment of European pig diversity using molecular markers: Partitioning of diversity among breeds. Conserv. Genet. 2005, 6, 729–741. [Google Scholar] [CrossRef] [Green Version]
- Cañón, J.; García, D.; García-Atance, M.A.; Obexer-Ruff, G.; Lenstra, J.A.; Ajmone-Marsan, P.; Dunner, S.; Econogene Consortium. Geographical partitioning of goat diversity in Europe and the Middle East. Anim. Genet. 2006, 37, 327–334. [Google Scholar] [CrossRef]
- Peter, C.; Bruford, M.; Perez, T.; Dalamitra, S.; Hewitt, G.; Erhardt, G.; Econogen Consortium. Genetic diversity and subdivision of 57 European and Middle-Eastern sheep breeds. Anim. Genet. 2007, 38, 37–44. [Google Scholar] [CrossRef]
- Engelsman, K.A.; Calus, M.P.L.; Bijma, P.; Windig, J.J. Estimating genetic diversity across the neutral genome with the use of dense marker maps. Genet. Sel. Evol. 2010, 42, 12. [Google Scholar] [CrossRef] [PubMed] [Green Version]
- Kleinman-Ruiz, D.; Villanueva, B.; Fernández, J.; Toro, M.A.; García-Cortés, L.A.; Rodríguez-Ramilo, S.T. Intra-chromosomal estimates of inbreeding and coancestry in the Spanish Holstein cattle population. Livest. Sci. 2016, 185, 34–42. [Google Scholar] [CrossRef] [Green Version]
- Engelsma, K.A.; Veerkamp, R.F.; Calus, M.P.L.; Bijma, P.; Windig, J.J. Pedigree- and marker-based methods in the estimation of genetic diversity in small groups of Holstein cattle. J. Anim. Breed. Genet. 2012, 129, 195–205. [Google Scholar] [CrossRef] [PubMed]
- Grundy, B.; Villanueva, B.; Woolliams, J.A. Dynamic selection procedures for constrained inbreeding and their consequences for pedigree development. Genet. Res. 1998, 72, 159–168. [Google Scholar] [CrossRef]
- Meuwissen, T.H.E. Maximizing the response of selection with a predefined rate of inbreeding. J. Anim. Sci. 1997, 75, 934–940. [Google Scholar] [CrossRef]
- Oliehoek, P.A.; Windig, J.; Arendonk, J.A.M.; Bijma, P. Estimating relatedness between individuals in general populations with a focus on their use in conservation programs. Genetics 2006, 173, 483–496. [Google Scholar] [CrossRef] [Green Version]
- Bohmanova, J.; Sargolzaei, M.; Schenkel, F.S. Characteristics of linkage disequilibrium in North American Holsteins. BMC Genom. 2010, 11, 421. [Google Scholar] [CrossRef] [Green Version]
- Hill, W.G.; Robertson, A. Linkage disequilibrium in finite populations. Appl. Genet. 1968, 38, 226–231. [Google Scholar] [CrossRef]
- Badke, Y.M.; Bates, R.O.; Ernst, C.W.; Schwab, C.; Steibel, J.P. Estimation of linkage disequilibrium in four US pig breeds. BMC Genom. 2012, 13, 24. [Google Scholar] [CrossRef] [Green Version]
- Meadows, J.R.S.; Chan, E.K.F.; Kijas, J.W. Linkage disequilibrium compared between five populations of domestic sheep. BMC Genet. 2008, 9, 61. [Google Scholar] [CrossRef] [PubMed] [Green Version]
- Corbin, L.J.; Blott, S.C.; Swinburne, J.E.; Vaudin, M.; Bishop, S.C.; Woolliams, J.A. Linkage disequilibrium and historical effective population size in the Thoroughbred horse. Anim. Genet. 2010, 41, 8–15. [Google Scholar] [CrossRef] [PubMed] [Green Version]
- Mokry, F.; Buzanskas, M.; Mudadu, M.; Grossi, D.; Higa, R.; Ventura, R.V.; de Lima, A.; Sargolzaei, M. Linkage disequilibrium and haplotype block structure in a composite beef cattle breed. BMC Genom. 2014, 15, S6. [Google Scholar] [CrossRef] [PubMed] [Green Version]
- Qanbari, S.; Hansen, M.; Weigend, S.; Preisinger, R.; Simianer, H. Linkage disequilibrium reveals different demographic history in egg laying chickens. BMC Genet. 2010, 11, 103. [Google Scholar] [CrossRef] [PubMed] [Green Version]
- Khatkar, M.S.; Nicholas, F.W.; Collins, A.R.; Zenger, K.R.; Al Cavanagh, J.; Barris, W.; Schnabel, R.D.; Taylor, J.F.; Raadsma, H.W. Extent of genome-wide linkage disequilibrium in Australian Holstein-Friesian cattle based on a high-density SNP panel. BMC Genom. 2008, 9, 187. [Google Scholar] [CrossRef] [Green Version]
- Kelly, J.K. A test of neutrality based on interlocus associations. Genetics 1997, 146, 1197–1206. [Google Scholar]
- Kim, Y.; Stephan, W. Detecting a local signature of genetic hitchhiking along a recombining chromosome. Genetics 2002, 160, 765–777. [Google Scholar]
- Sabeti, P.C.; Reich, D.E.; Higgins, J.M.; Levine, H.Z.P.; Richter, D.J.; Schaffner, S.F.; Gabriel, S.B.; Platko, J.V.; Patterson, N.J.; McDonald, G.J.; et al. Detecting recent positive selection in the human genome from haplotype structure. Nature 2002, 419, 832–837. [Google Scholar] [CrossRef]
- De Roos, A.P.W.; Hayes, B.J.; Spelman, R.J.; Goddard, M.E. Linkage disequilibrium and persistence of phase in Holstein-Friesian, Jersey and Angus cattle. Genetics 2008, 179, 1503–1512. [Google Scholar] [CrossRef] [Green Version]
- Visser, C.; Lashmar, S.F.; Van Marle-Köster, E.; Poli, M.A.; Allain, D. Genetic Diversity and Population Structure in South African, French and Argentinian Angora Goats from Genome-Wide SNP Data. PLoS ONE 2016, 11, e0154353. [Google Scholar] [CrossRef]
- Liu, S.; He, S.; Chen, L.; Li, W.; Di, J.; Liu, M. Estimates of linkage disequilibrium and effective population sizes in Chinese Merino (Xinjiang type) sheep by genome-wide SNPs. Genes Genom. 2017, 39, 733–745. [Google Scholar] [CrossRef] [PubMed] [Green Version]
- Shin, D.H.; Cho, K.H.; Park, K.D.; Lee, H.J.; Kim, H. Accurate estimation of effective population size in the korean dairy cattle based on linkage disequilibrium corrected by genomic relationship matrix. Asian-Australas J. Anim. Sci. 2013, 26, 1672–1679. [Google Scholar] [CrossRef] [PubMed] [Green Version]
- Mészáros, G. Genomic descriptors of biodiversity—A review. J. Land Manag. Food Environ. 2018, 69, 73–83. [Google Scholar] [CrossRef] [Green Version]
- Berihulay, H.; Islam, R.; Jiang, L.; Ma, Y. Genome-Wide Linkage Disequilibrium and the Extent of Effective Population Sizes in Six Chinese Goat Populations Using a 50K Single Nucleotide Polymorphism Panel. Animals 2019, 9, 350. [Google Scholar] [CrossRef] [PubMed] [Green Version]
- Ohta, T.; Kimura, M. Linkage disequilibrium between two segregating nucleotide sites under the steady flux of mutations in a finite population. Genetics 1971, 68, 571–580. [Google Scholar] [PubMed]
- Sved, J.A. Linkage disequilibrium and homozygosity of chromosome segments in finite populations. Popul. Biol. 1971, 2, 125–141. [Google Scholar] [CrossRef]
- Hill, W.G. Estimation of effective population-size from data on linkage disequilibrium. Genet. Res. 1981, 38, 209–216. [Google Scholar] [CrossRef] [Green Version]
- Waples, R.S. A bias correction for estimates of effective population size based on linkage disequilibrium at unlinked gene loci. Conserv. Genet. 2006, 7, 167–184. [Google Scholar] [CrossRef] [Green Version]
- Hayes, B.J.; Visscher, P.M.; McPartlan, H.C.; Goddard, M.E. Novel multilocus measure of linkage disequilibrium to estimate past effective population size. Genome Res. 2003, 13, 635–643. [Google Scholar]
- Hollenbeck, C.M.; Portnoy, D.S.; Gold, J.R. A method for detecting recent changes in contemporary effective population size from linkage disequilibrium at linked and unlinked loci. Heredity 2016, 117, 207–216. [Google Scholar] [CrossRef] [Green Version]
- Prieur, V.; Clarke, S.M.; Brito, L.F.; McEwan, J.C.; Lee, M.A.; Brauning, R. Estimation of linkage disequilibrium and effective population size in New Zealand sheep using three different methods to create genetic maps. BMC Genet. 2017, 18, 68. [Google Scholar] [CrossRef] [PubMed] [Green Version]
- Gibson, J.; Morton, N.E.; Collins, A. Extended tracts of homozygosity in outbred human populations. Hum. Mol. Genet. 2006, 15, 789–795. [Google Scholar] [CrossRef] [PubMed] [Green Version]
- Peripolli, E.; Stafuzza, N.B.; Munari, D.P.; Lima, A.L.F.; Irgang, R.; Machado, M.A.; Panetto, J.C.D.C.; Ventura, R.V.; Baldi, F.; da Silva, M.V.G.B. Assessment of runs of homozygosity islands and estimates of genomic inbreeding in Gyr (Bos indicus) dairy cattle. BMC Genom. 2018, 19, 34. [Google Scholar] [CrossRef] [PubMed]
- Herrero-Medrano, J.M.; Megens, H.J.; Groenen, M.A.M.; Ramis, G.; Bosse, M.; Perez-Enciso, M.; Crooijmans, R.P. Conservation genomic analysis of domestic and wild pig populations from the Iberian Peninsula. BMC Genet. 2013, 14, 106. [Google Scholar] [CrossRef] [PubMed] [Green Version]
- Mastrangelo, S.; Tolone, M.; Sardina, M.T.; Sottile, G.; Sutera, A.M.; Di Gerlando, R.; Portolano, B. Genome-wide scan for runs of homozygosity identifies potential candidate genes associated with local adaptation in Valle del Belice sheep. Genet. Sel. Evol. 2017, 49, 84. [Google Scholar] [CrossRef] [PubMed] [Green Version]
- Bertolini, F.; Cardoso, T.F.; Marras, G.; Nicolazzi, E.L.; Rothschild, M.F.; Amills, M.; AdaptMap Consortium. Genome-wide patterns of homozygosity provide clues about the population history and adaptation of goats. Genet. Sel. Evol. 2018, 50, 59. [Google Scholar] [CrossRef] [Green Version]
- Peripolli, E.; Metzger, J.; De Lemos, M.V.A.; Stafuzza, N.B.; Kluska, S.; Olivieri, B.F.; Lôbo, R.B. Autozygosity islands and ROH patterns in Nellore lineages: Evidence of selection for functionally important traits. BMC Genom. 2018, 19, 680. [Google Scholar] [CrossRef]
- Kim, E.S.; Cole, J.B.; Huson, H.; Wiggans, G.R.; Van Tassell, C.P.; Crooker, B.A.; Liu, G.; Da, Y.; Sonstegard, T.S. Effect of Artificial Selection on Runs of Homozygosity in US Holstein Cattle. PLoS ONE 2013, 8, e80813. [Google Scholar]
- Pryce, J.E.; Haile-Mariam, M.; Goddard, M.E.; Hayes, B.J. Identification of genomic regions associated with inbreeding depression in Holstein and Jersey dairy cattle. Genet. Sel. Evol. 2014, 46, 71. [Google Scholar] [CrossRef] [Green Version]
- Purfield, D.C.; McParland, S.; Wall, E.; Berry, D.P. The distribution of runs of homozygosity and selection signatures in six commercial meat sheep breeds. PLoS ONE 2017, 12, e0176780. [Google Scholar] [CrossRef] [Green Version]
- Cesarani, A.; Sorbolini, S.; Criscione, A.; Bordonaro, S.; Pulina, G.; Battacone, G.; Marletta, D.; Gaspa, G.; Macciotta, N.P.P. Genome-wide variability and selection signatures in Italian island cattle breeds. Anim. Genet. 2018, 49, 371–383. [Google Scholar] [CrossRef] [PubMed]
- Almeida, O.A.C.; Moreira, G.C.M.; Rezende, F.M.; Boschiero, C.; Peixoto, J.O.; Ibelli, A.M.G.; Ledur, M.C.; Novais, F.J.; Coutinho, L.L. Identification of selection signatures involved in performance traits in a paternal broiler line. BMC Genom. 2019, 20, 449. [Google Scholar] [CrossRef] [PubMed] [Green Version]
- Grilz-Seger, G.; Neuditschko, M.; Ricard, A.; Velie, B.; Lindgren, G.; Mesarič, M.; Cotman, M.; Horna, M.; Dobretsberger, M.; Brem, G.; et al. Genome-wide homozygosity patterns and evidence for selection in a set of European and near eastern horse breeds. Genes 2019, 10, 491. [Google Scholar] [CrossRef] [PubMed] [Green Version]
- Kardos, M.; Luikart, G.; Allendorf, F.W. Measuring individual inbreeding in the age of genomics: Markerbased measures are better than pedigrees. Heredity 2015, 115, 63–72. [Google Scholar] [CrossRef]
- Doekes, H.P.; Veerkamp, R.F.; Bijma, P.; Hiemstra, S.J.; Windig, J.J. Trends in genome-wide and region-specific genetic diversity in the Dutch-Flemish Holstein–Friesian breeding program from 1986 to 2015. Genet. Sel. Evol. 2018, 50, 15. [Google Scholar] [CrossRef] [Green Version]
- Ferenčaković, M.; Sölkner, J.; Kapš, M.; Curik, I. Genome-wide mapping and estimation of inbreeding depression of semen quality traits in a cattle population. J. Dairy Sci. 2017, 100, 4721–4730. [Google Scholar] [CrossRef]
- Saura, M.; Fernández, A.; Varona, L.; Fernández, A.I.; de Cara, M.Á.; Barragán, C.; Villanueva, B. Detecting inbreeding depression for reproductive traits in Iberian pigs using genome-wide data. Genet. Sel. Evol. 2015, 47, 1. [Google Scholar] [CrossRef] [Green Version]
- Szpiech, Z.A.; Xu, J.; Pemberton, T.J.; Peng, W.; Zöllner, S.; Rosenberg, N.A.; Li, J.Z. Long runs of homozygosity are enriched for deleterious variation. Am. J. Hum. Genet. 2013, 93, 90–102. [Google Scholar] [CrossRef] [Green Version]
- Zhang, Q.; Guldbrandtsen, B.; Bosse, M.; Lund, M.S.; Sahana, G. Runs of homozygosity and distribution of functional variants in the cattle genome. BMC Genom. 2015, 16, 542. [Google Scholar] [CrossRef] [Green Version]
- Rodriguez-Ramilo, S.T.; Fernández, F. What do we mean by runs of homozygosity? Assessing effect of parameters involved in their detection. In Book of Abstracts of the 67th Annual Meeting of the European Federation of Animal Science; EAAP: Belfast, UK, 2016. [Google Scholar]
- Lencz, T.; Lambert, C.; DeRosse, P.; Burdick, K.E.; Morgan, T.V.; Kane, J.M.; Kucherlapati, R.; Malhotra, A.K. Runs of homozygosity reveal highly penetrant recessive loci in schizophrenia. Proc. Natl. Acad. Sci. USA 2007, 104, 19942–19947. [Google Scholar] [CrossRef] [Green Version]
- Purcell, S.; Neale, B.; Todd-Brown, K.; Thomas, L.; Ferreira, M.A.; Bender, D.; Maller, J.; Sklar, P.; de Bakker, P.I.; Daly, M.J.; et al. PLINK: A tool set for whole genome association and population-based linkage analyses. Am. J. Hum. Genet. 2007, 81, 559–575. [Google Scholar] [CrossRef] [PubMed] [Green Version]
- Cañón, J.; Tupac-Yupanqui, I.; García-Atance, M.A.; Cortés, O.; Garcia, D.; Fernández, J.; Dunner, S. Genetic variation within the Lidia bovine breed. Anim. Genet. 2008, 39, 439–445. [Google Scholar] [CrossRef] [PubMed]
- Eusebi, P.G.; Cortés, O.; Carleos, C.; Dunner, S.; Cañon, J. Detection of selection signatures for agonistic behaviour in cattle. J. Anim. Breed Genet. 2018, 135, 170–177. [Google Scholar] [CrossRef] [PubMed]
- Cortés, O.; Sevane, N.; Baro, J.A.; Cañón, J. Pedigree analysis of a highly fragmented population, the Lidia cattle breed. Livest. Sci. 2014, 167, 1–8. [Google Scholar] [CrossRef]
- Eusebi, P.G.; Cortés, O.; Dunner, S.; Cañón, J. Genomic diversity and population structure of Mexican and Spanish bovine Lidia breed. Anim. Genet. 2017, 48, 682–685. [Google Scholar] [CrossRef] [PubMed]
- Fernandez, J.; Bennewitz, J. Defining genetic diversity based on genomics tools. In Genomic Management of Animal Genetic Resources, 1st ed.; Oldenbroek, J.K., Ed.; Wageningen Academic Publisher: Gelderland, The Netherlands, 2018; pp. 49–76. [Google Scholar]
- Eynard, S.E.; Windig, J.J.; Hiemstra, S.J.; Calus, M.P.L. Whole-genome sequence data uncover loss of genetic diversity due to selection. Genet. Sel. Evol. 2016, 48, 33. [Google Scholar] [CrossRef] [PubMed] [Green Version]
- De Pristo, M.A.; Banks, E.; Poplin, R.; Garimella, K.V.; Maguire, J.R.; Hartl, C.; Philippakis, A.A.; del Angel, G.; Rivas, M.A.; Hanna, M.; et al. A framework for variation discovery and genotyping using next-generation DNA sequencing data. Nat. Genet. 2011, 43, 491. [Google Scholar] [CrossRef]
- Jiang, Y.; Wang, S.; Zhang, Q.; Ding, X. Optimal sequencing depth design for whole genome re-sequencing in pigs. BMC Bioinform. 2019, 20, 556. [Google Scholar] [CrossRef] [Green Version]
- Librado, P.; Gamba, C.; Gaunitz, C.; Der Sarkissian, C.; Pruvost, M.; Albrechtsen, A.; Fages, A.; Khan, N.; Schubert, M.; Jagannathan, V.; et al. Ancient genomic changes associated with domestication of the horse. Science 2017, 356, 442–445. [Google Scholar] [CrossRef]
- Raudsepp, T.; Finno, C.J.; Bellone, R.R.; Petersen, J.L. Ten years of the horse reference genome: Insights into equine biology, domestication and population dynamics in the post-genome era. Anim. Genet. 2019, 50, 569–597. [Google Scholar] [CrossRef] [Green Version]
- Frantz, L.A.; Haile, J.; Lin, A.T.; Scheu, A.; Geörg, C.; Benecke, N.; Alexander, M.; Linderholm, A.; Mullin, V.E.; Daly, K.G.; et al. Ancient pigs reveal a near-complete genomic turnover following their introduction to Europe. Proc. Natl. Acad. Sci. USA 2019, 116, 17231–17238. [Google Scholar] [CrossRef] [PubMed] [Green Version]
- Alberto, F.J.; Boyer, F.; Orozco-terWengel, P.; Streeter, I.; Servin, B.; De Villemereuil, P.; Benjelloun, B.; Librado, P.; Biscarini, F.; Colli, L.; et al. Convergent genomic signatures of domestication in sheep and goats. Nat. Commun. 2018, 9, 813. [Google Scholar] [CrossRef] [PubMed]
- Li, D.; Che, T.; Chen, B.; Tian, S.; Zhou, X.; Zhang, G.; Li, M.; Gaur, U.; Li, Y.; Luo, M.; et al. Genomic data for 78 chickens from 14 populations. GigaScience 2017, 6, 1–5. [Google Scholar] [CrossRef] [PubMed] [Green Version]
- Ludwig, A.; Pruvost, M.; Reissmann, M.; Benecke, N.; Brockmann, G.A.; Castaños, P.; Cieslak, M.; Lippold, S.; Llorente, L.; Malaspinas, A.S.; et al. Coat color variation at the beginning of horse domestication. Science 2009, 324, 485. [Google Scholar] [CrossRef] [Green Version]
- Briggs, A.W.; Stenzel, U.; Meyer, M.; Krause, J.; Kircher, M.; Pääbo, S. Removal of deaminated cytosines and detection of in vivo methylation in ancient DNA. Nucleic Acids Res. 2010, 38, e87. [Google Scholar] [CrossRef] [Green Version]
- Liu, Y.; Weyrich, L.S.; Llamas, B. More arrows in the ancient DNA quiver: Use of paleoepigenomes and paleomicrobiomes to investigate animal adaptation to environment. Mol. Biol. Evol. 2019. [Google Scholar] [CrossRef]
- Jenko, J.; Gorjanc, G.; Cleveland, M.A.; Varshney, R.K.; Whitelaw, C.B.A.; Woolliams, J.A.; Hickey, J.M. Potential of promotion of alleles by genome editing to improve quantitative traits in livestock breeding programs. Genet. Sel. Evol. 2015, 47, 55. [Google Scholar] [CrossRef] [Green Version]
- He, Z.; Proudfoot, C.; Mileham, A.J.; McLaren, D.G.; Whitelaw, C.B.A.; Lillico, S.G. Highly efficient targeted chromosome deletions using CRISPR/Cas9. Biotechnol. Bioeng. 2015, 112, 1060–1064. [Google Scholar] [CrossRef]
- Tan, W.; Carlson, D.F.; Lancto, C.A.; Garbe, J.R.; Webster, D.A.; Hackett, P.B.; Fahrenkrug, S.C. Efficient nonmeiotic allele introgression in livestock using custom endonucleases. Proc. Natl. Acad. Sci. USA 2013, 110, 16526–16531. [Google Scholar] [CrossRef] [Green Version]
- Kurtz, S.; Frenzel, A.; Lucas-Hahn, A.; Hassel, P.; Becker, R.; Ziegler, M.; Nowak-Imialek, M.; Schlegelberger, B.; Göhring, G.; Niemann, H.; et al. The knockout of the HMG-Box Domain of the porcine SRY-gene by CRISPR/Cas RNP microinjection causes sex reversal in gene-edited pigs. bioRxiv 2019, 617589. [Google Scholar] [CrossRef]
- Lillico, S.G.; Proudfoot, C.; Carlson, D.F.; Stverakova, D.; Neil, C.; Blain, C.; King, T.J.; Ritchie, W.A.; Tan, W.; Mileham, A.J.; et al. Live pigs produced from genome edited zygotes. Sci. Rep. 2013, 3, 2847. [Google Scholar] [CrossRef] [PubMed] [Green Version]
- Whitworth, K.M.; Benne, J.A.; Spate, L.D.; Murphy, S.L.; Samuel, M.S.; Murphy, C.N.; Wells, K.D. Zygote injection of CRISPR/Cas9 RNA successfully modifies the target gene without delaying blastocyst development or altering the sex ratio in pigs. Transgenic Res. 2017, 26, 97–107. [Google Scholar] [CrossRef] [PubMed]
- Shen, L.; Hua, Y.; Fu, Y.; Li, J.; Liu, Q.; Jiao, X.; Xin, G.; Wang, J.; Wang, X.; Yan, C.; et al. Rapid generation of genetic diversity by multiplex CRISPR/Cas9 genome editing in rice. Sci. China Life Sci. 2017, 60, 506–515. [Google Scholar] [CrossRef] [PubMed]
- Bastiaansen, J.W.; Bovenhuis, H.; Groenen, M.A.; Megens, H.J.; Mulder, H.A. The impact of genome editing on the introduction of monogenic traits in livestock. Genet. Sel. Evol. 2018, 50, 18. [Google Scholar] [CrossRef] [PubMed] [Green Version]
Figure 1.
Bull of the Lidia breed.


Table 1.
Whole genome assembly references and the most recent single nucleotide polymorphism (SNP) commercial Beadchips in livestock species.
Table 1.
Whole genome assembly references and the most recent single nucleotide polymorphism (SNP) commercial Beadchips in livestock species.
| Species | Assembly ID | Fold Coverage | Genome Length (bp) | Release Year | URL | Latest SNP Bead Chip Eersions |
|---|---|---|---|---|---|---|
| Cow (Bos taurus) | bosTau9 | 80.0x | 2,715,853,792 | 2018 | https://www.ncbi.nlm.nih.gov/assembly/GCF_002263795.1/#/st | Illumina: BovineSNP50 v3 (53,714 SNPs) Illumina: BovineHD (<777,000 SNPs) Affymetrix: Axiom Genotyping Array (54,560) |
| Sheep (Ovis aries) | oviAri4 | 166.0x | 2,615,499,683 | 2015 | https://www.ncbi.nlm.nih.gov/assembly/GCF_000298735.2/ | Illumina: OvineSNP50 (54,241 SNPs) Affymetrix: Axiom Genotyping array: 54,236 SNPs |
| Goat (Capra hircus) | ARS1 | 50.0x | 2,922.813,246 | 2016 | https://www.ncbi.nlm.nih.gov/assembly/GCF_001704415.1 | Affymetrix: AxiomGenotyping array60,034 SNPs Illumina GoatSNP50 (59,000 SNPs) |
| Pig (Sus scrofa) | susScr11 | 65.0x | 2,501,912,388 | 2017 | https://www.ncbi.nlm.nih.gov/assembly/GCF_000003025.6/ | Illumina PorcineSNP60 v2 (64, 232 SNPs) Affymetrix Axiom Genotyping array 658,692 SNPs |
| Horse (Equus caballus) | equCab3 | 88.0x | 2,506,966,135 | 2018 | https://www.ncbi.nlm.nih.gov/assembly/GCF_002863925.1/ | Illumina EquineSNP50 (54,602 SNPs) Affymetrix Axiom Equine HD Array (670,000SNPs) |
| Chicken (Gallus gallus) | galGal6 | 82x | 1,065,365,434 | 2018 | https://www.ncbi.nlm.nih.gov/assembly/GCF_000002315.6 | Illumina 60k SNP BeadChip (57,636 SNPs) Affymetrix 600 K (+/- 600,000 SNPs) |
© 2019 by the authors. Licensee MDPI, Basel, Switzerland. This article is an open access article distributed under the terms and conditions of the Creative Commons Attribution (CC BY) license (http://creativecommons.org/licenses/by/4.0/).
Share and Cite
MDPI and ACS Style
Eusebi, P.G.; Martinez, A.; Cortes, O. Genomic Tools for Effective Conservation of Livestock Breed Diversity. Diversity 2020, 12, 8. https://doi.org/10.3390/d12010008
AMA Style
Eusebi PG, Martinez A, Cortes O. Genomic Tools for Effective Conservation of Livestock Breed Diversity. Diversity. 2020; 12(1):8. https://doi.org/10.3390/d12010008
Chicago/Turabian StyleEusebi, Paulina G., Amparo Martinez, and Oscar Cortes. 2020. "Genomic Tools for Effective Conservation of Livestock Breed Diversity" Diversity 12, no. 1: 8. https://doi.org/10.3390/d12010008
Note that from the first issue of 2016, this journal uses article numbers instead of page numbers. See further details here.