Spatial Response to Linear Infrastructures by the Endangered Golden Lion Tamarin
by
 ,
,
Priscila da Silva Lucas
1,*,† ,
,
Milene Alves-Eigenheer
1,†,
Talitha Mayumi Francisco
1,
James M. Dietz
2 and
Carlos Ramón Ruiz-Miranda
1 1
Laboratório de Ciências Ambientais, Universidade Estadual Norte Fluminense Darcy Ribeiro, Avenida Alberto Lamego, 2000, Parque Califórnia, , Campos dos Goytacazes, Rio de Janeiro CEP 28013-602, Brazil
2
Save The Golden Lion Tamarin, Silver Spring, MD 20901, USA
*
Author to whom correspondence should be addressed.
†
Priscila da Silva Lucas and Milene Alves-Eigenheer should be considered joint first authors.
Diversity 2019, 11(7), 100; https://doi.org/10.3390/d11070100
Submission received: 13 April 2019
/
Revised: 3 June 2019
/
Accepted: 6 June 2019
/
Published: 26 June 2019
(This article belongs to the Special Issue Impacts of Linear Infrastructures on Wildlife)
Abstract
:Linear infrastructures are a primary driver of economic development. However, they also can negatively affect wildlife by mortality and the barrier effect. In this paper, we address how paved and unpaved roads, high-tension power lines, and gas/oil pipelines affect home range size, core areas, and movement in an endangered primate, the golden lion tamarin (GLT). Location data were recorded using radio telemetry on 16 groups in two protected areas and in privately owned forest fragments. The GLT’s home range, not core area, increased in size for the groups that occupied locations far from linear infrastructures; home range was also significantly influenced by available forest size. None of the home ranges contained a road, but home ranges did contain power lines. GLTs used the surrounding landscape near all types of infrastructure. Movement analysis showed that most of the step lengths (distances between subsequent locations) were less than 100 m between two consecutive locations, but step length was longer for roads and longer for groups in fully forested habitats. Tamarins avoided paved roads when in close proximity to this type of infrastructure; this behavior increased in areas without adequate adjacent forest habitat. Our results show that linear infrastructures differ in their level of impact: roads can act as a barrier, whereas other types of infrastructure have minimal effect on movement and home range. We discuss these differences in impact in terms of structure, maintenance schedules, and edge effects of infrastructure.
1. Introduction
Man-made linear structures, such as roads, highways, railways, power lines, canals, pipelines (for petroleum, gas, and water), and wind farms, are vital to any nation’s economic development [1,2,3]. However, these structures come with undesirable negative ecological consequences for native forest ecosystems and wildlife throughout every phase of their implementation [4]. The types of linear structures differ in terms of risks posed to wildlife populations as well as in the understanding of how to mitigate these effects. Research from the fields of road ecology and railway ecology points to two factors that account for most of the negative effects of linear structures on wildlife [5,6,7,8,9,10]. The first factor is direct mortality, which is caused by, for example, wildlife-vehicle collision (wvc) and wildlife-train collision (wtc) [11,12,13]. Powerlines can also cause mortality of arboreal animals by electrocution [14,15].
The second factor, which is known as the “barrier effect”, refers to the combination of a series of factors, including mortality [16], that hinder animal movement over these structures. Animals may change their behavior to avoid clearings caused by habitat loss [17,18], the presence of physical structures, cars or traffic on roads [6,19], noise and vibration of railroads [20], or other disturbances that extend into the surrounding landscape [21,22,23]. Restrictions on individual movement such as daily displacement, home range, seasonal migration, or dispersal [24,25] ultimately have negative consequences for population size and persistence [19,26]. Areas free of linear infrastructure are essential for arboreal species in tropical forests [27,28] because these species rely on canopy connectivity to move through the landscape to perform vital activities, e.g., feed, find mates, and reproduce [29].
Non-human primates vary in their behavioral responses to linear infrastructures. Some species show high behavioral flexibility to anthropogenic landscapes and may forage or move in proximity to paved and unpaved roads or seismic lines within their home ranges. Such species do not avoid areas close to a linear infrastructure or the infrastructure itself [30,31] and may attempt to cross it at points, for example, where the canopy gap is narrow (e.g., red colobus monkeys in Tanzania [32]). Attempts to cross linear structures can result in death from collisions with vehicles [33,34] or from electrocution during attempts to travel over powerlines [14]. Other primate species change their movement patterns and use of space to avoid moving near linear infrastructure. For instance, spider monkeys (Atelles geoffroyi) avoid the 0–50 m distance band from a road and favor the 101–150 m band for occupancy [35].
This report presents a study of spatial displacement of groups of golden lion tamarins (Leontopithecus rosalia; GLT) in relation to different types of linear infrastructures in the Atlantic Rainforest, Rio de Janeiro State, Brazil. Specifically, we address: (1) if linear infrastructures affect home range location, size, and core areas; (2) if space use varies with distance to the linear infrastructures; (3) the extent to which displacement varies with proximity to different types of linear infrastructures; and (4) if GLTs avoid moving near these infrastructures. If GLTs perceive linear infrastructures to be risky or unsuitable habitats, we predict that (i) home range and core area size will be affected by highways, unpaved roads, and pipelines. We would not expect home range to be affected by powerlines because trees or shrubs are found in this type of linear infrastructure. (ii) GLTs will spend more time far from the structure than close to it. The exception is powerlines, which have a continuum of vegetation structure between forest and this type of linear infrastructure. (iii) When near linear infrastructures, GLTs will exhibit faster movements with longer step lengths (distances between subsequent locations) than when far from these structures. (iv) GLTs will exhibit increased road avoidance but no avoidance towards other types of linear infrastructures. We defined avoidance as movements predominantly in the direction away from the road edges.
2. Material and Methods
2.1. Study Species
The endangered golden lion tamarin (GLT) is endemic to the Atlantic Forest, Rio de Janeiro State, Brazil [36,37,38]. Golden lion tamarins are small, arboreal, diurnal primates (average body mass 598–620 g), that live in social groups of 3–14 individuals [39,40,41]. Social groups consist of a breeding pair and their descendant offspring (different ages). Monogamy is the predominant mating system, but behavioral polygyny and polyandry are also observed [42,43]. Social groups are territorial and their home ranges can vary from 50 to 100 ha depending on vegetation and habitat structure [44,45]. Golden lion tamarins are frugivores–insectivores that occasionally feed on small vertebrates, nectar, flowers, and tree exudates [46,47]. On average, they spend 33% of the day moving around the territory, but this varies with resource availability and forest size [48]. Golden lion tamarins play an important ecological role because they are potential seed dispersers for most of the fruits they consume, thus contributing to forest regeneration [49].
2.2. Study Area
Our study was carried out in União Biological Reserve (UN), Poço das Antas Biological Reserve (PA) and in small, isolated forest patches (30–200 ha) (hereafter, isolated patches) within the Área de Proteção Ambiental da Bacia do Rio São João/Mico-Leão-Dourado (São João River Basin environmental protected area; APA), in northeastern Rio de Janeiro State, Brazil. União Biological Reserve, located in the municipalities of Rio das Ostras, Casimiro de Abreu and Macaé (22°27′30″S and 42°02′14″W), is comprised of 7756 ha of well-preserved submontane ombrophilous forest and lowland ombrophilous forest. The topography is comprised of alluvial plains, small rounded hills, and mountain ranges. This protected area is traversed by a high-tension electric powerline and a gas/oil pipeline. The 6100 ha Poço das Antas Biological Reserve, located in the municipality of Silva Jardim (22°32′38″S and 42°16′41″W), was created in 1974 to protect GLTs. The vegetation types at PA are ombrophilous dense forest with two formations: sub-montane and alluvial forest. About 50% of PA is disturbed forest in various successional stages [50]. The topography of the reserve ranges from 20 to 200m above sea level [39].
The isolated patches of native vegetation that remain in the APA da Bacia do Rio São João/Mico-Leão-Dourado typically are located in areas with rugged terrain, predominantly on scarp or on hill tops. In contrast, plains areas have been deforested for agriculture and livestock [51]. The vegetation in isolated patches is comprised of lowland, submontane Atlantic rain forest [52]. The APA is crossed by a high-tension electrical powerline and oil/gas pipelines. The climate in the region is As (humid tropical with a dry winter) according to the Köppen system of classification [53]. Most of the precipitation occurs from October to March; the dry months are mainly between April to September. The mean annual temperature is 24.6 ºC, and average annual precipitation is 1100–2121 mm [54].
GLTs inhabit an anthropogenic landscape; consequently, the main threats to their populations are related to human activities that cause fragmentation and degradation of forests. These processes reduce forest patch size and increase isolation of fragments, acting as filters or barriers to wildlife movements [55,56,57]. Although the installation of linear structures, such as roads, pipelines, and powerlines are necessary for human activities, they are among the factors that can lead to forest isolation. Roads, both paved and unpaved, crisscross this fragmented landscape. One of the major threats to GLT conservation is BR-101, a federal highway that crosses east–west through the remaining forest. This highway isolates three GLT populations in the south from all other populations that are further north [58].
2.3. Golden Lion Tamarin Capture and Radio Telemetry
Golden lion tamarins were captured and examined semiannually. We followed the protocol described in [39] for capture procedures. GLTs were marked individually with Nyanzol dye [59]. One individual, usually the heaviest male in each group, was fitted with a vhf radio transmitter weighing approximately 16 grams; data on movements of 16 social groups were collected from December 2009 to November 2012. Group locations were recorded at 20 min intervals between three to six hours per day (minimum of five points) using a Global Positioning System (GPS) with <3 m accuracy. As a result of the high degree of forest fragmentation in the study area, all of the GLT groups were close to some type of linear infrastructure (<1300 m).
2.4. Spatial Analysis
We computed home range and core areas of the GLT groups for two seasons, wet (October to March) and dry (April to September), as well as for the whole study period. To estimate group home range and core area, we considered only the group-living individuals with more than 100 locations/group in total, resulting in 4190 points for 16 groups of GLT clustered into three regions: UN, PA, and isolated patches. Home range and core areas were calculated using the package adehabitatHR [60] in the R 3.5.3 environment [61], fixed kernel utilization distribution [62]. Home range and core areas were defined as the 95% and 50% utilization distributions, respectively. We computed Kruskal–Wallis tests with a Nemenyi post hoc test to compare home range and core areas among the three study regions.
We evaluated use of space by developing a map of Euclidean distances between the linear infrastructures and the recorded locations of GLTs. For each location, we computed a buffer of three kilometers within which we obtained landscape information. A RapidEye satellite image (50 m resolution) was used to classify the landcover into five categories: forest, regeneration areas, pasture, agriculture, and anthropogenic areas. We also classified the linear infrastructures as highways (all paved roads), unpaved roads, pipelines, and powerlines. We used the software ArcGis 10.6 [63] to develop the map of Euclidean distances between the linear infrastructures (Figure S1). We used the tool ‘extract multi values to points’ to obtain the distance between each location and the closest linear infrastructure. We developed a similar map for highways, in which we calculated the distances between each GLT location and the closest highway.
GLT movement was evaluated by calculating the step length: the distance between two subsequent locations recorded in a trajectory, which is a sequence of steps connecting successive locations of an animal [64,65]. We calculated movement trajectories for each study group. We defined the start of a new trajectory as following a gap larger than 60 min between two locations. We converted the location data into trajectories using the package adehabitatLT [60] in the R 3.5.3 environment [61]. We assessed the direction of trajectories to determine if GLTs moved toward or away from the edge of linear infrastructures.
2.5. Explanatory Variables and Models
We hypothesized that the variables explaining the use of space (home range and core areas) and directionality of GLT movement would be related to season (variation in resource availability), linear infrastructures, and landscape features. Therefore, our explanatory variables were season (wet and dry), type of linear infrastructure (highway, unpaved road, pipeline, and powerline), distance to the closest linear infrastructure, distance to the closest highway, and landscape (habitat, i.e., forest and regeneration areas; non habitat, i.e., pasture and linear infrastructures).
We developed generalized linear models (GLM) with a gamma distribution to test for correlations among home range, core areas, and step lengths and the explanatory variables, as seen in Table S1. We also developed a GLM with a binomial distribution, where the response variable directionality was set as move toward (1) and move away (0) from a linear infrastructure [66]. We selected the models with the best fit based on Akaike Information Criteria (AIC, ΔAIC ≤ 2) [67] using the package bbmle in R 3.5.3 [61].
3. Results
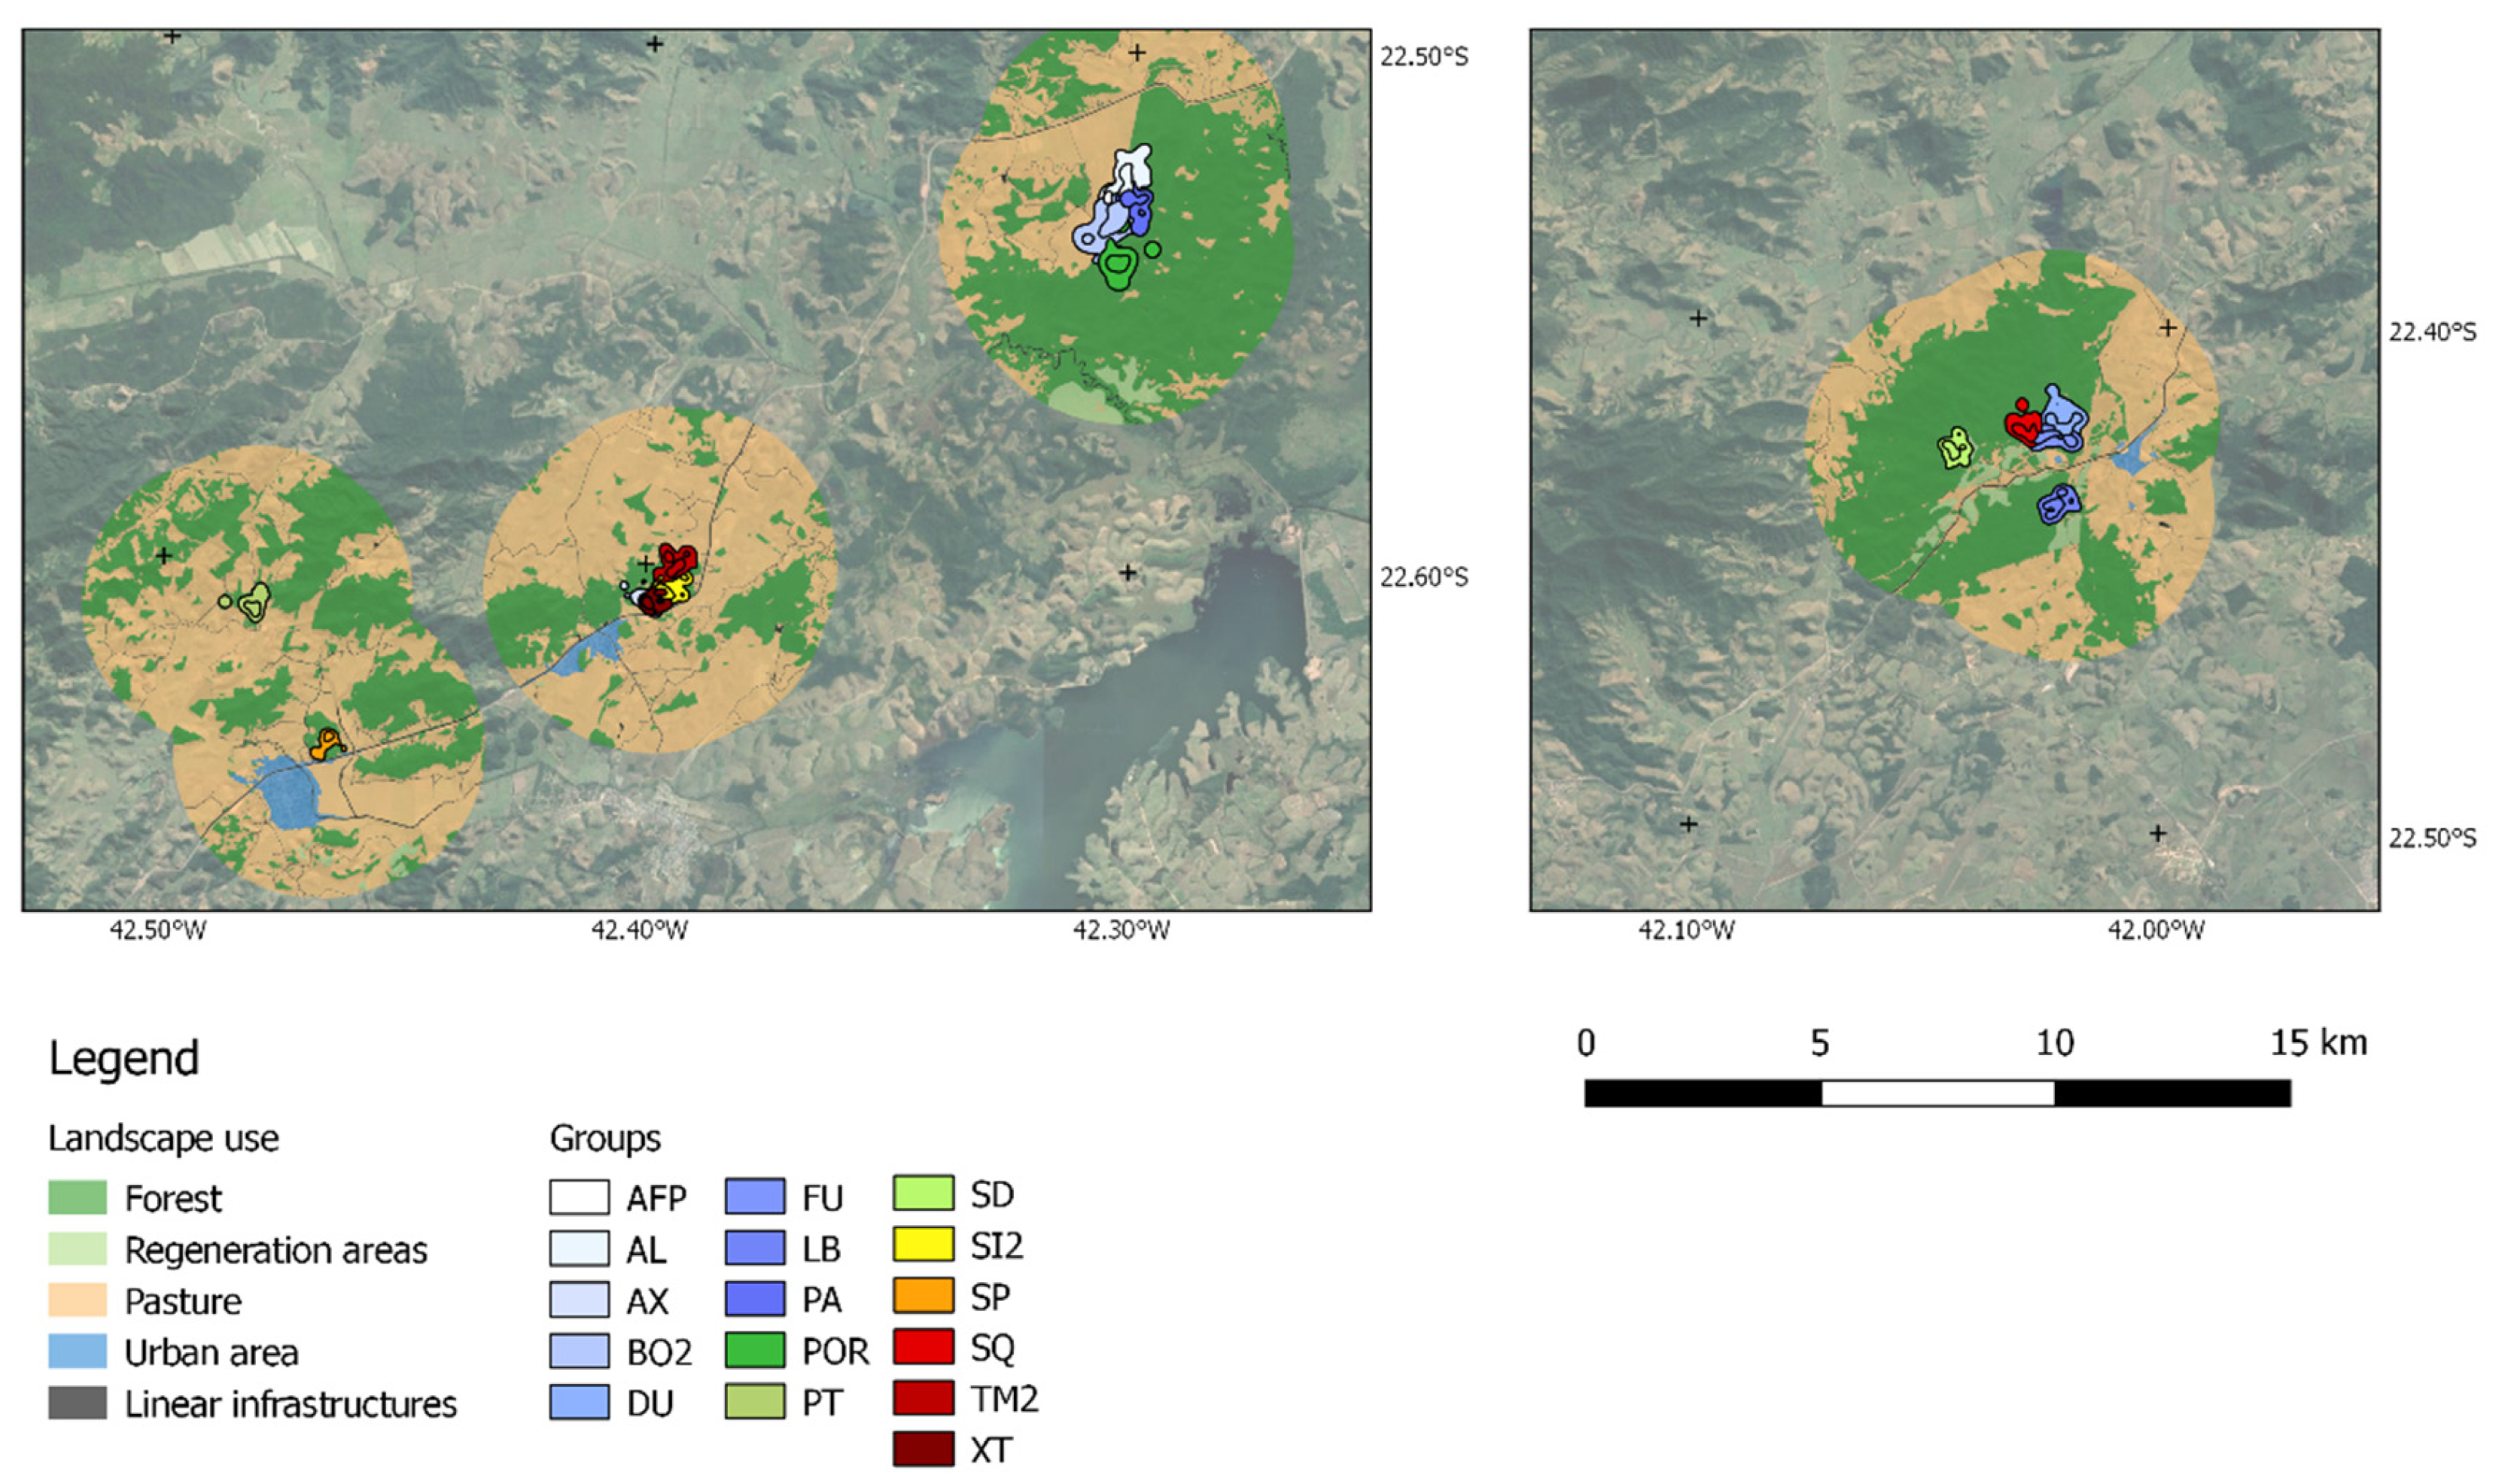
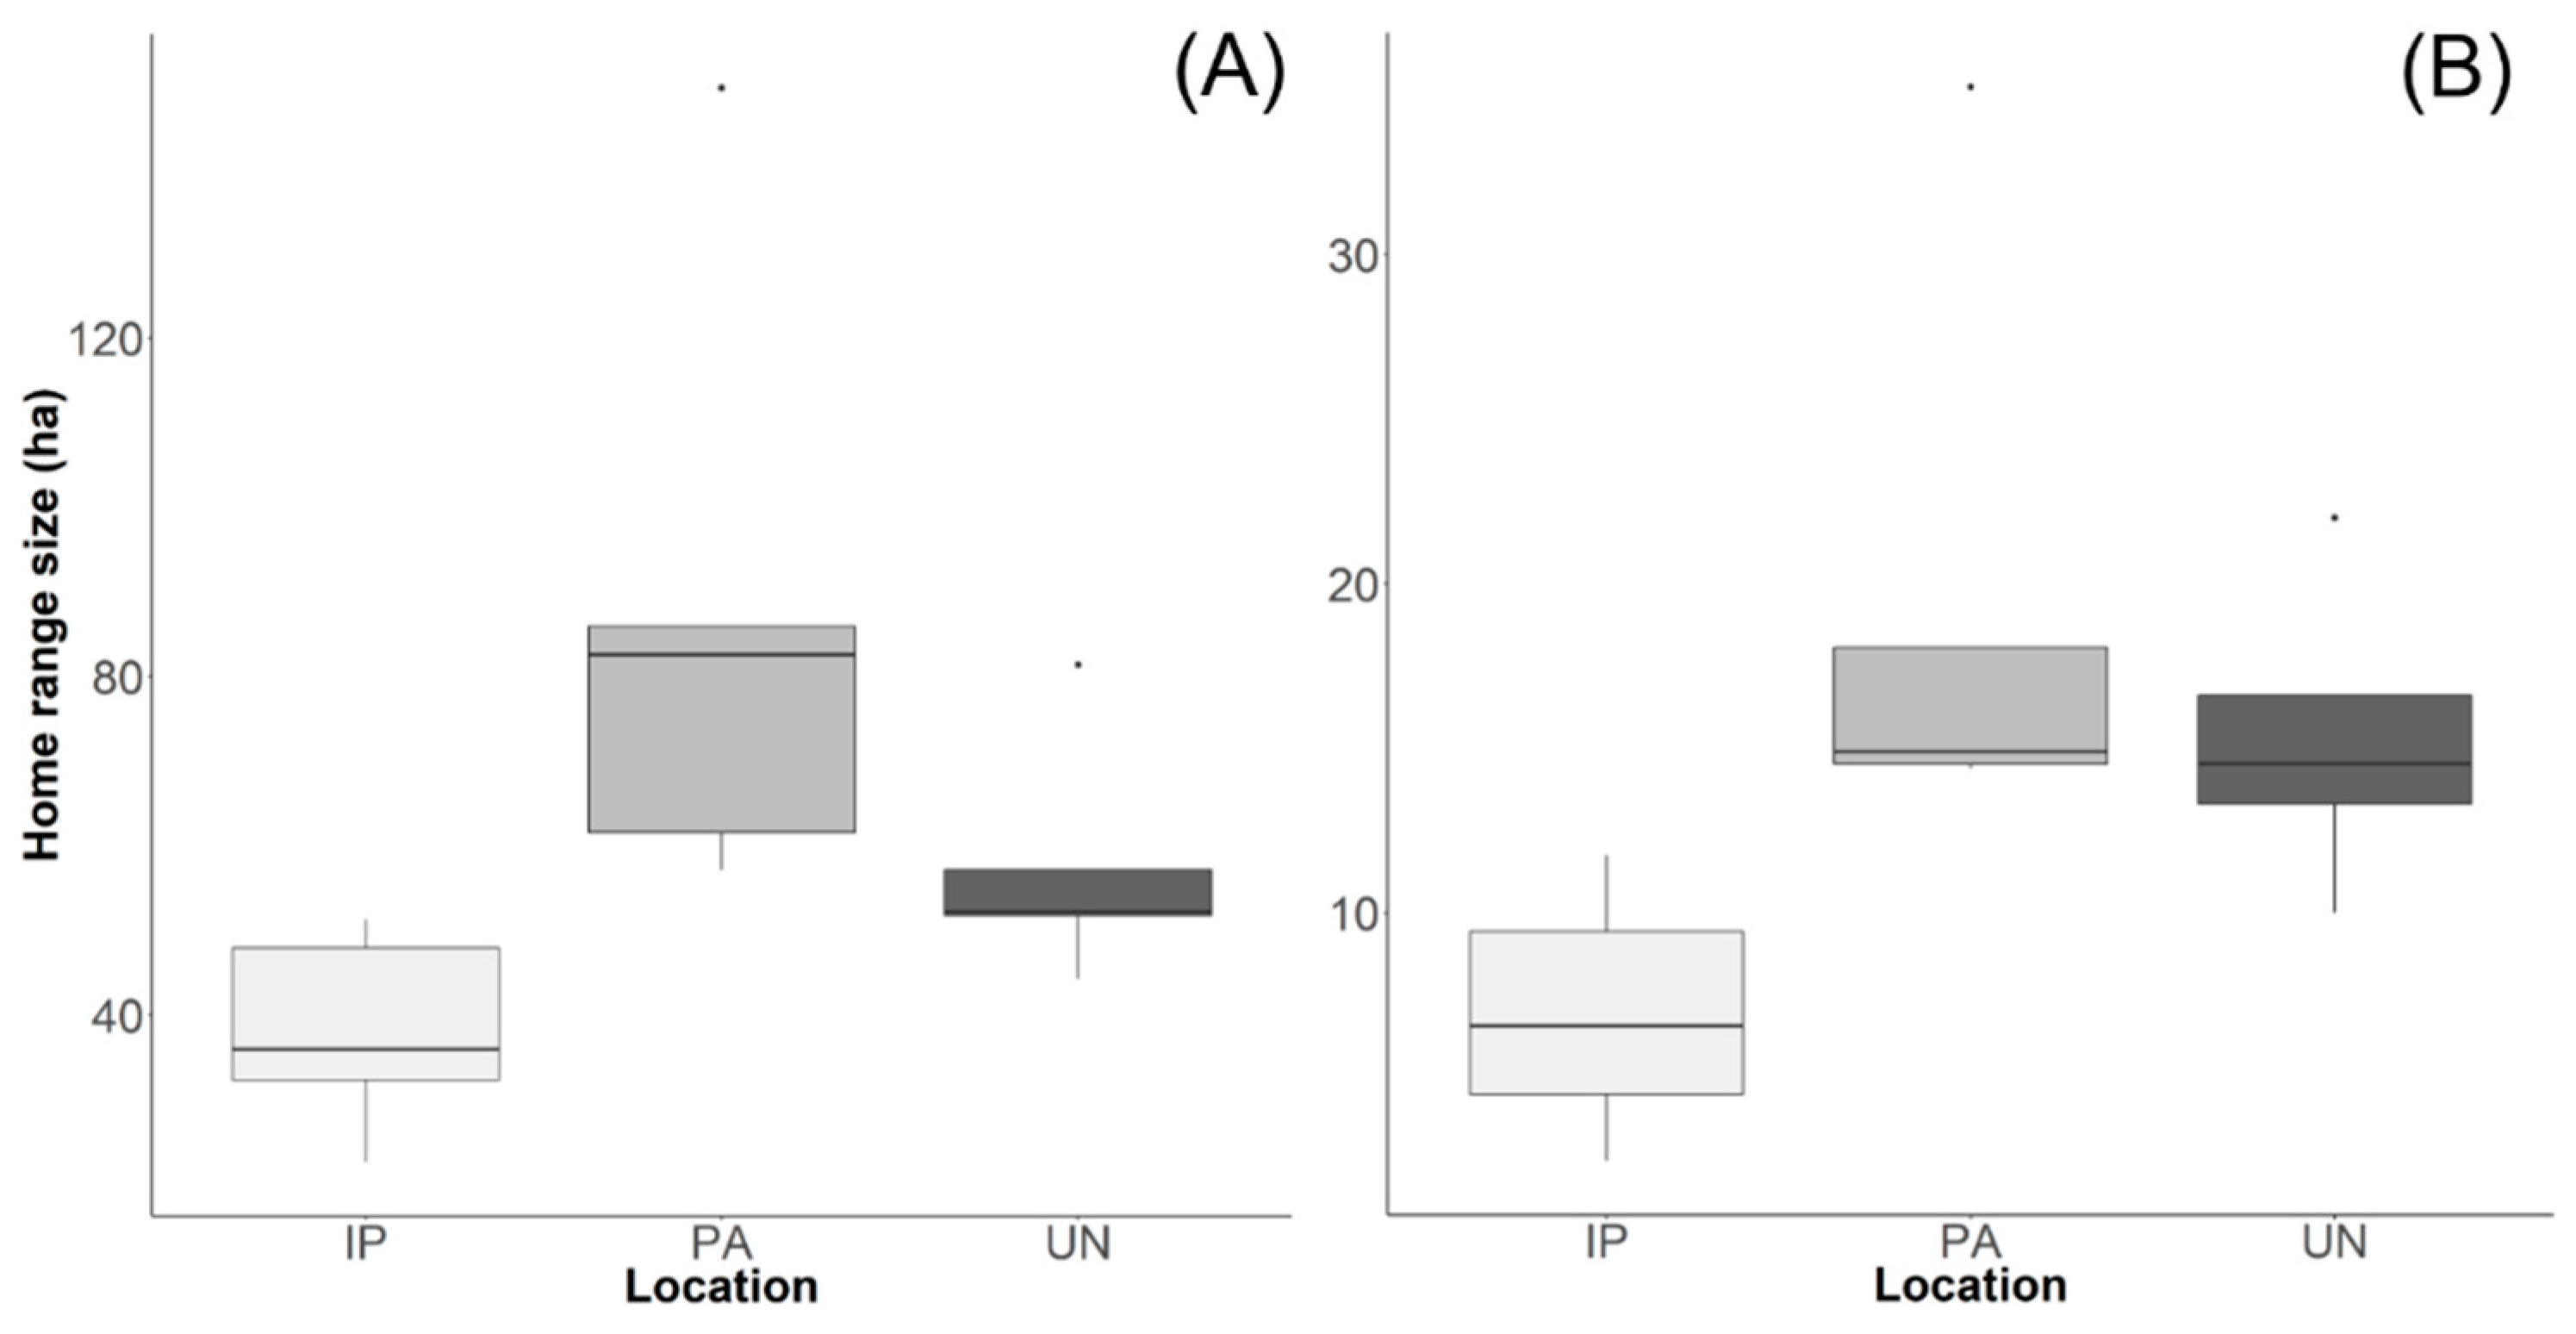
We obtained overall and seasonal home ranges for 16 GLT groups (Figure 1). The mean overall home range size was 59.5 ± 30.0 ha (range: 22.6–149.5 ha) and the seasonal home range size was 49.2 ± 28.8 ha (21.1–134.8 ha) for the wet season and 60.5 ± 44.2 ha (1.1–176 ha) for the dry season. The mean overall core area was 13.4 ± 7.7 ha (2.4–35.1 ha) and the mean seasonal core area was 11.3 ± 7.4 ha (2.4 –30.0 ha) for the wet season and 14.03 ± 9.7 ha (0.3 –37.0 ha) for the dry season. We found significant differences among the three locations for home range sizes (x2 = 11.169, P = 0.003), as seen in Figure 2A and core area (x2 = 10.176, P = 0.005), as seen in Figure 2B. Isolated patches had smaller home range sizes when compared with PA (P = 0.002), and core areas when compared with PA (P = 0.008), and UN (P = 0.042). Model selection indicated that distance to highways was the main determinant of home range size (ΔAICc = 0, weight = 0.741) (mean home range = 47.6 ha between 0.01 to 1 km; mean home range = 79.3 ha between 1 to 4 km). For core areas, the main effects were distance to highways (ΔAICc = 0, weight = 0.536) (mean home range = 11.4 ha between 0.01 to 1 km and mean home range = 16.9 ha between 1 to 4 km), and season (ΔAICc = 2, weight = 0.195).
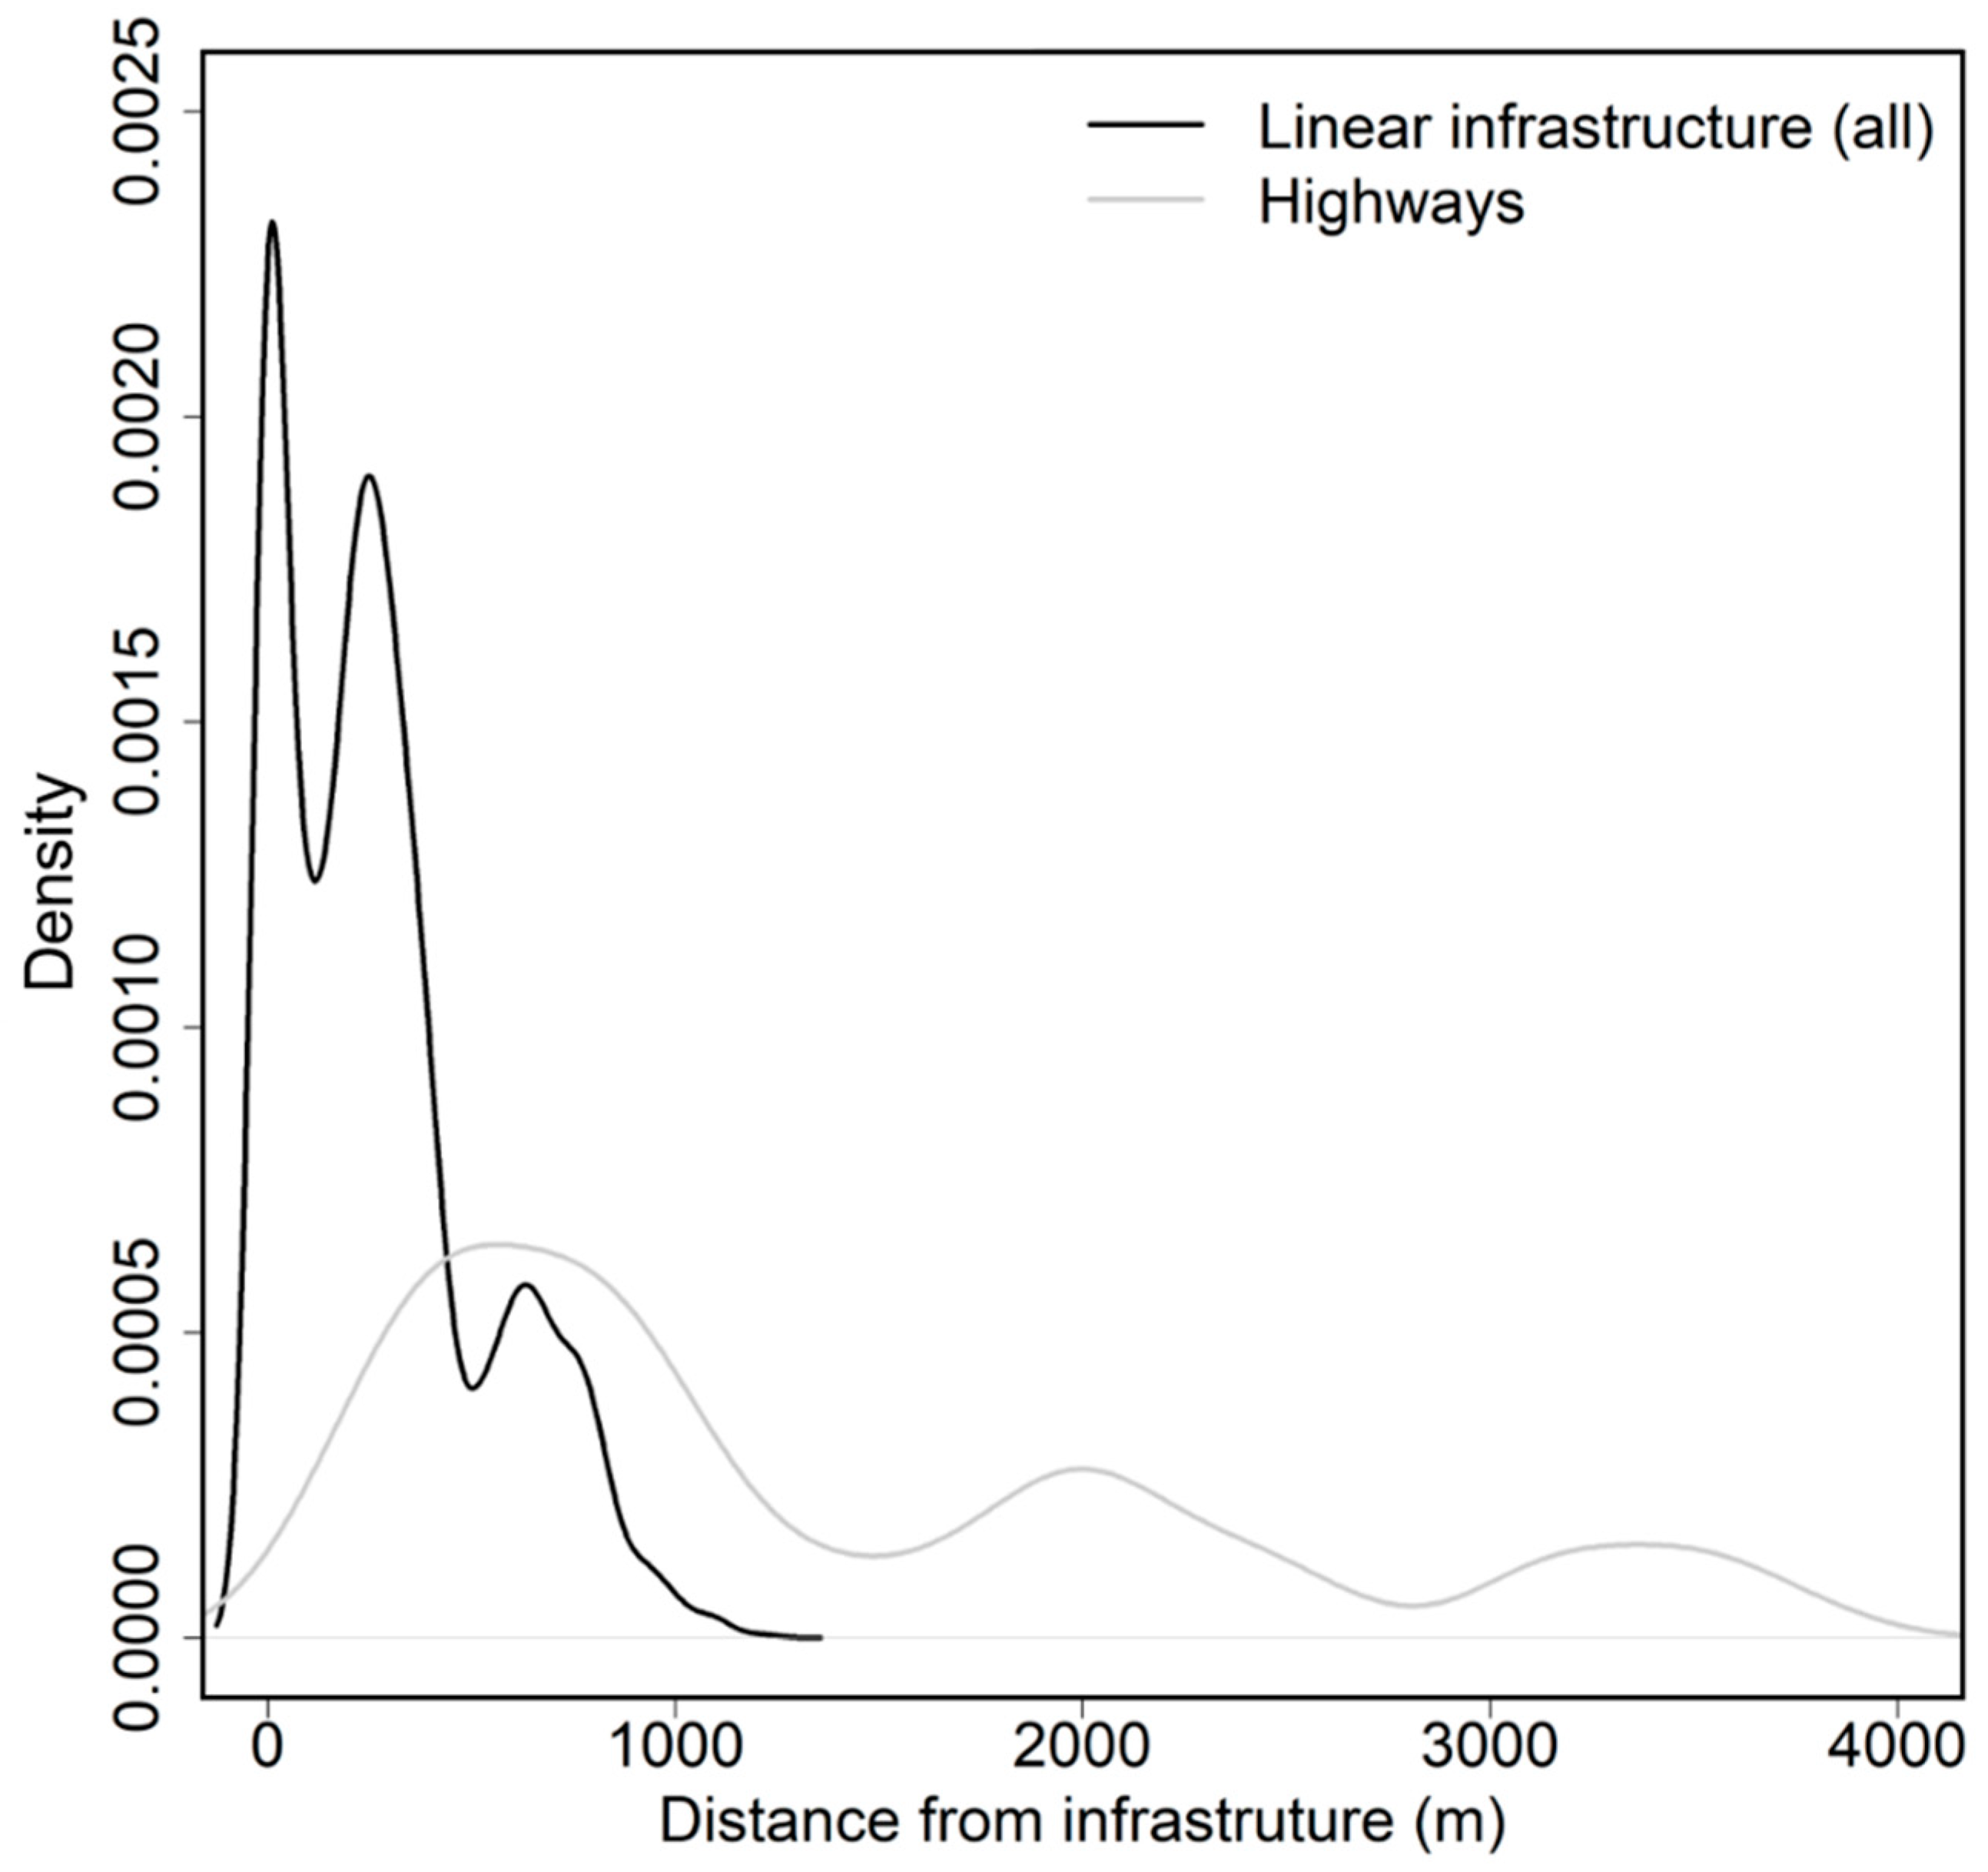
The distances from GLT locations to all types of linear infrastructures varied widely, as seen in Figure S2. For powerlines, the average distance to the structure was within the structure itself ( = 0 m), indicating that tamarins did not avoid the areas under or surrounding the high-tension powerlines. The average distances to the structure were higher for all other types of structures: pipeline ( = 121.5 m ± 88.8), highways ( = 201.4 m ± 102.9), and unpaved roads ( = 340.5 m ± 267.8). When considering all types of infrastructure, the Euclidean distance to the closest infrastructure showed a high density of GLT locations within the 1–1000 m distance band, as seen in Figure 3. When considering only highways, most GLT locations fell into the 1–4000 m distance band.
The mean step length, irrespective of type of infrastructure, was 45.6 m (range: 1–1110.2) and 88.5% of the points were less than 100 meters for GLT locations, as seen in Figure S3. The longest steps were found in relation to unpaved roads (48.5 m; range: 1–1110.2), followed by highways (42.0; range: 1–995.1) and powerlines (41.9 m; range: 1–624.6). The shortest steps were related to pipelines (35.9 m; range: 1–402.1). The model selection indicated that the features that best explained GLT step length were type of linear infrastructure, distance to the linear infrastructure, and habitat, as seen in Table 1. The model selection indicated that directionality was affected both by distance from the linear infrastructures and by the presence of vegetation (Z value = −9.23, P < 0.0001). Golden lion tamarins avoided moving toward paved roads when in close proximity to them (intercept estimate: 1.38, sd = 0.28, Z value = 4.94, P < 0.0001) in places where there was no forest or with regeneration habitat (intercept estimate: −1.58, sd = 0.40, Z value = −3.88, P < 0.0001).
4. Discussion
Our results support the hypothesis that linear infrastructures differ in how they shape home range, space use, and movement of a small arboreal primate. GLT groups located far from linear structures showed larger home ranges than groups adjacent to the structures. GLTs used areas adjacent to the four types of linear infrastructure, but they did so significantly more for powerlines, even including the area under the lines. For powerlines, group home ranges included the linear structure. Some non-human primate species forage or move close to roads (paved or unpaved) and other types of linear infrastructures within their home ranges [30,31]. Locations close to a linear structure may not be avoided because these may be among the few suitable forested areas left in a matrix of unsuitable habitat, especially if the patches are small and isolated.
This seems to be the case for lion tamarins in Brazil [68,69]. For golden lion tamarins, home range size was larger in the two Biological Reserves (União and Poço das Antas) than in isolated patches. The two Reserves are protected areas that are over 10 times larger than the isolated patches (maximum of 200 ha). GLTs can increase home range size when they are far from these linear infrastructures and this is favored by the groups that occupy large areas with forest cover. A similar pattern was observed for the core areas, which were larger for those groups that occurred in the protected areas when compared with the ones in the fragments. However, the distance of core areas from linear structures did not affect the size of core areas. The main factor that affected core area size was season of the year; core area was larger during the dry and colder season. This season is associated with lower availability of resources for GLTs, making individuals explore larger areas to obtain resources irrespective of the proximity to linear infrastructures. Previous studies have shown that GLTs feed heavily on floral nectar during the dry season when there is lower fruit availability [46]. These seasonal changes in fruit availability likely will occur throughout the São João River Basin but could be more pronounced in the small and isolated patches than in the protected areas [70,71].
There also were differences among the linear structures in terms of how each structure affected use of the surrounding area and likelihood that GLTs would move across them. Powerlines, pipelines, and unpaved roads had the least effect on habitat use: GLTs did not avoid these structures and crossed them regularly. Results of the GLM analysis indicated that most movements were toward these structures. Most of the GLT locations were found within the 1–1000 m distance band from any linear infrastructure. However, if only paved roads are considered in the analysis, then most locations lie within the 1–4000 m band. At the very short distance band (0–50 m), GLTs avoided moving toward paved roads when in close proximity to them, mainly in places where there was no native forest or regeneration areas. This result suggests that GLTs actively avoid crossing paved roads. In addition, no GLT track of successive points crossed a paved road. Tamarins appear to move away from paved roads and exclude them from their home ranges. This is important for conservation because a major highway (BR101) crosses the GLT distribution area, separates two areas of the União Biological Reserve, and stands between the Poço das Antas Reserve and other forests. Genetic studies have shown it to be a barrier to gene flow [69]. Moreover, the network of secondary paved roads is expanding in the area; several unpaved roads in the area are in the process of being paved. In contrast, GLTs often use areas surrounding pipelines and unpaved roads, occasionally crossing over them. More research, for example, GPS telemetry on long-term movement patterns, is needed to determine if these types of linear infrastructures do affect GLT movements.
There were differences in how tamarins moved near the various types of linear structures. Movement analysis showed that most of the step lengths were less than 100 m between two consecutive locations. There were two important results to consider regarding tamarin step length. First, step length was shorter near powerlines and pipelines but longer near unpaved and paved roads. This behavior near powerlines and pipelines was contrary to our expectation of a longer step length when near a linear infrastructure. We reasoned that GLTs would move faster and further toward more suitable habitat. One possible explanation relates to vegetation structure and the maintenance schedule for clearing emerging trees in these two types of structures. Powerlines in this region were first built in the 1960s, and strips about 100 m wide were maintained free of vegetation by mowing. Beginning in 2008, most powerlines within the Bacia do Rio São João APA and União Biological Reserve are maintained by selective trimming, in which only tallest parts of trees that could approach the high-tensions wires are cut [51]. The strip above underground pipelines is managed by mowing all vegetation within the right-of-way. However, because the right-of-way is mowed infrequently, once every three months or more, vegetation reaches 0.5–1 m in height at some points, and the edges are less disturbed. In both cases, GLTs may not perceive the surrounding landscape or the linear infrastructure itself as unsuitable habitat. Moreover, the edge effect caused by pipelines and powerlines may be reduced and could even lead to seasonal abundance of insects and fruits [36,72] in contrast to the impoverished edge of paved and unpaved roads. Vegetation along road edges is frequently disturbed and compacted by traffic volume [21,73].
Second, GLT step length was greater in forested areas than non-habitat areas. Two factors may explain this behavior. The forested areas in this study included two protected biological reserves, with mature and extensive forest cover and possibly higher resource availability [70,74,75]. In addition, home ranges in these forested areas were larger and the groups had more neighbors. These factors lead to an increased need to patrol territory boundaries and, consequently, to move further between foraging resources [45].
These results demonstrate that the barrier effect for GLTs is not uniform across types of linear structures. Paved roads act as a barrier, isolating GLTs through behavioral mechanisms that result in reduced gene flow [69] and genetic diversity [76]. These population-level factors can negatively affect the long-term persistence of the GLT metapopulation [77]. Measures to mitigate these threats include human-mediated dispersion (translocations) among subpopulations or the building of canopy-crossing structures [69,78,79]. In contrast, the effects of high-tension power lines appear to have minimal effects on movement patterns of GLTs. For some linear structures, simple changes in the schedules of vegetation maintenance could modify the movements of this endangered species.
Supplementary Materials
The following are available online at https://www.mdpi.com/1424-2818/11/7/100/s1, Figure S1. Map of Euclidean distances between linear infrastructures. The warm colors indicate proximity to linear infrastructures; cold colors indicate greater distances (maximum 2000 meters). The grey dots indicate locations of golden lion tamarins. Figure S2: Distance in meters between golden lion tamarin locations and the closest linear infrastructures (pipelines, highways, unpaved roads, and powerlines). Figure S3: Density of step lengths (in meters) to the different types of linear infrastructures. Table S1. Proposed models to explain golden lion tamarin’s space use and movement. Step = step length; inf = type of linear infrastructure (highway, unpaved road, pipeline, and powerline); land = landscape features (native habitat: forest and regeneration areas; no habitat: pasture and linear infrastructures); dist_inf = distance to the nearest infrastructure; dist_hig = distance to the nearest highway.
Author Contributions
Conceptualization, P.d.S.L. and M.A.-E.; methodology, P.d.S.L., M.A.-E., C.R.R.-M. and T.M.F.; validation, P.d.S.L. and M.A.-E.; formal analysis, M.A.-E., with inputs of P.d.S.L.; investigation, P.d.S.L., M.A.-E., T.M.F., J.M.D. and C.R.R.-M.; resources, J.M.D. and C.R.R.-M.; data curation, M.A.-E. and C.R.R.-M.; writing—original draft preparation, P.d.S.L. with inputs of M.A.-E.; writing—review and editing, P.d.S.L., M.A.-E., T.M.F., J.M.D. and C.R.R.-M.; visualization, P.S.L, M.A.-E., T.M.F., J.M.D. and C.R.R.-M.; supervision, P.d.S.L.; funding acquisition, J.M.D. and C.R.R.-M.
Funding
Support for data collection came from Colchester Zoo, Conservation, Food and Health Foundation, Brazilian National Council for Scientific and Technological Development (CNPq), Copenhagen Zoo, Disney Conservation Fund, Frankfurt Zoological Society Fund for Threatened Species, Lion Tamarins of Brazil Fund, Mohamed bin Zayed Species Conservation Fund, Save the Golden Lion Tamarin, and U.S. Fish and Wildlife Service.
Acknowledgments
This work was performed with permission from the Instituto Chico Mendes de Biodiversidade ICMBio. We thank Associação Mico-Leão-Dourado (AMLD) for logistic support, data collection, and use of data on GLT movements. We thank Andreia F. Martins for information on data collection and storage. We also thank Centro de Pesquisas Leopoldo Américo Miguez de Mello – CENPES/PETROBRÁS Petróleo Brasileiro S.A. for providing a fellowship (2017/00606-7) for P.S.L, M.A.E., and T.M.F. during the writing of the manuscript.
Conflicts of Interest
The authors declare no conflicts of interest.
References
- Laurance, W.F.; Cochrane, M.A.; Bergen, S.; Fearnside, P.M.; Delamônica, P.; Barber, C.; D’Angelo, S.; Fernandes, T. The future of the Brazilian Amazon. Science 2001, 291, 438–439. [Google Scholar] [CrossRef] [PubMed]
- Geneletti, D. Some common shortcomings in the treatment of impacts of linear infrastructures on natural habitat. Environ. Impact Asses. 2006, 26, 257–267. [Google Scholar] [CrossRef]
- Perz, S.G.; Overdevest, C.; Caldas, M.M.; Walker, R.T.; Arima, E.Y. Unofficial road building in the Brazilian Amazon: Dilemmas and models for road governance. Environ. Conserv. 2007, 34, 112–121. [Google Scholar] [CrossRef]
- Roberts, K.; Sjölund, A. Incorporating biodiversity issues into road design: The road agency perspective. In Handbook of Road Ecology; van der Ree, R., Smith, D.J., Grilo, C., Eds.; John Wiley & Sons: Hoboken, NJ, USA, 2015; pp. 27–31. [Google Scholar]
- Fahrig, L.; Rytwinski, T. Effects of roads on animal abundance: An empirical review and synthesis. Ecol. Soc. 2009, 14, 21. Available online: http://www.ecologyandsociety.org/vol14/iss1/art21/ (accessed on 25 February 2019). [CrossRef]
- Da Rosa, C.A.; Bager, A. Review of the factors underlying the mechanisms and effects of roads on vertebrates. Oecol. Aust. 2013, 17, 208–221. [Google Scholar]
- Dorsey, B.; Olsson, M.; Rew, L.J. Ecological effects of railways on wildlife. In Handbook of Road Ecology; van der Ree, R., Smith, D.J., Grilo, C., Eds.; John Wiley & Sons: Hoboken, NJ, USA, 2015; pp. 219–227. [Google Scholar]
- Roy, M.; Sukumar, R. Railways and wildlife: A case study of train-elephant collisions in northern West Bengal, India. In Railway Ecology; Borda-de-Água, L., Barrientos, R., Beja, P., Pereira, H., Eds.; Springer: Cham, Switzerland, 2017; pp. 157–177. [Google Scholar]
- Santos, S.M.; Carvalho, F.; Mira, A. Current knowledge on wildlife mortality in railways. In Railway Ecology; Borda-de-Água, L., Barrientos, R., Beja, P., Pereira, H., Eds.; Springer: Cham, Switzerland, 2017; pp. 11–22. [Google Scholar]
- Barrientos, R.; Ascensão, F.; Beja, P.; Pereira, H.M.; Borda-de-Água, L. Railway ecology vs. road ecology: Similarities and differences. Eur. J. Wildlife Res. 2019, 65, 12. [Google Scholar] [CrossRef]
- Malo, J.E.; Suárez, F.; Díez, A. Can we mitigate animal–vehicle accidents using predictive models? J. Appl. Ecol. 2004, 41, 701–710. [Google Scholar] [CrossRef]
- Taylor, B.D.; Goldingay, R.L. Wildlife road-kills on three major roads in north-eastern New South Wales. Wildlife Res. 2004, 31, 83–91. [Google Scholar] [CrossRef]
- Olson, K.A.; van der Ree, R. Railways, Roads and Fences Across Kazakhstan and Mongolia Threaten the Survival of Wide-Ranging Wildlife. In Handbook of Road Ecology; van der Ree, R., Smith, D.J., Grilo, C., Eds.; John Wiley & Sons: Hoboken, NJ, USA, 2015; pp. 472–478. [Google Scholar]
- Lokschin, L.X.; Rodrigo, C.P.; Cabral, J.N.H.; Buss, G. Power lines and howler monkey conservation in Porto Alegre, Rio Grande do Sul, Brazil. Neotrop. Primates 2007, 14, 76–81. [Google Scholar] [CrossRef]
- Katsis, L.; Cunneyworth, P.M.; Turner, K.M.; Presotto, A. Spatial patterns of primate electrocutions in Diani, Kenya. Int. J. Primatol. 2018, 39, 493–510. [Google Scholar] [CrossRef]
- Barrientos, R.; Borda-de-Água, L. Railways as Barriers for Wildlife: Current Knowledge. In Railway Ecology; Borda-de-Água, L., Barrientos, R., Beja, P., Pereira, H., Eds.; Springer: Cham, Switzerland, 2017. [Google Scholar]
- Goosem, M.; Harding, E.K.; Chester, G.; Tucker, N.; Harriss, C.; Oakley, K. Roads in Rainforest: Best Practice Guidelines for Planning, Design and Management. 2010. Available online: https://researchonline.jcu.edu.au/12113/1/goosem_guidelines.pdf (accessed on 7 June 2019).
- Ascensão, F.; Lucas, P.S.; Costa, A.; Bager, A. The effect of roads on edge permeability and movement patterns for small mammals: A case study with Montane Akodont. Landsc. Ecol. 2017, 32, 781–790. [Google Scholar] [CrossRef]
- Jaeger, J.A.; Bowman, J.; Brennan, J.; Fahrig, L.; Bert, D.; Bouchard, J.; Charbonneau, N.; Frank, K.; Gruber, B.; von Toschanowitz, K.T. Predicting when animal populations are at risk from roads: An interactive model of road avoidance behavior. Ecol. Modell. 2005, 185, 329–348. [Google Scholar] [CrossRef]
- Lucas, P.S.; de Carvalho, R.G.; Grilo, C. Railway disturbances on wildlife: Types, effects, and mitigation measures. In Railway Ecology; Borda-de-Água, L., Barrientos, R., Beja, P., Pereira, H., Eds.; Springer: Cham, Switzerland, 2017; pp. 81–99. [Google Scholar]
- Forman, R.T.; Deblinger, R.D. The ecological road-effect zone of a Massachusetts (USA) suburban highway. Biol. Conserv. 2000, 14, 36–46. [Google Scholar] [CrossRef]
- Eigenbrod, F.; Hecnar, S.J.; Fahrig, L. Quantifying the road-effect zone: Threshold effects of a motorway on anuran populations in Ontario, Canada. Ecol Soc. 2009, 14, 24. Available online: https://eprints.soton.ac.uk/id/eprint/181359 (accessed on 2 March 2019). [CrossRef]
- Benítez-López, A.; Alkemade, R.; Verweij, P.A. The impacts of roads and other infrastructure on mammal and bird populations: A meta-analysis. Biol. Conserv. 2010, 143, 1307–1316. [Google Scholar] [CrossRef] [Green Version]
- Clauzel, C.; Xiqing, D.; Gongsheng, W.; Giraudoux, P.; Li, L. Assessing the impact of road developments on connectivity across multiple scales: Application to Yunnan snub-nosed monkey conservation. Biol. Conserv. 2015, 192, 207–217. [Google Scholar] [CrossRef]
- van der Ree, R.; Smith, D.J.; Grilo, C. The ecological effects of linear infrastructure and traffic: Challenges and opportunities of rapid global growth. In Handbook of Road Ecology; van der Ree, R., Smith, D.J., Grilo, C., Eds.; John Wiley & Sons: Hoboken, NJ, USA, 2015; pp. 1–9. [Google Scholar]
- Ceia-Hasse, A.; Navarro, L.M.; Borda-de-Água, L.; Pereira, H.M. Population persistence in landscapes fragmented by roads: Disentangling isolation, mortality, and the effect of dispersal. Ecol. Model. 2018, 375, 45–53. [Google Scholar] [CrossRef]
- Laurance, W.F.; Goosem, M.; Laurance, S.G. Impacts of roads and linear clearings on tropical forests. Trends Ecol. Evol. 2009, 24, 659–669. [Google Scholar] [CrossRef]
- Laurance, W.F. Bad roads, good roads. In Handbook of Road Ecology; van der Ree, R., Smith, D.J., Grilo, C., Eds.; John Wiley & Sons: Hoboken, NJ, USA, 2015; pp. 10–15. [Google Scholar]
- Soanes, K.; van der Ree, R. Reducing road impacts on tree-dwelling animals. In Handbook of Road Ecology; van der Ree, R., Smith, D.J., Grilo, C., Eds.; John Wiley & Sons: Hoboken, NJ, USA, 2015; pp. 334–340. [Google Scholar]
- Laurance, W.F.; Croes, B.M.; Tchignoumba, L.; Lahm, S.A.; Alonso, A.; Lee, M.E.; Campbell, P.; Ondzeano, C. Impacts of roads and hunting on central African rainforest mammals. Conserv. Biol. 2006, 20, 1251–1261. [Google Scholar] [CrossRef]
- Bryson-Morrison, N.; Tzanopoulos, J.; Matsuzawa, T.; Humle, T. Activity and habitat use of chimpanzees (Pan troglodytes verus) in the anthropogenic landscape of Bossou, Guinea, West Africa. Int. J. Primatol. 2017, 38, 282–302. [Google Scholar] [CrossRef]
- Decker, B.S. Endangered primates in the Selous Game Reserve and an imminent threat to their habitat. Oryx 1994, 28, 183–190. [Google Scholar] [CrossRef]
- Donaldson, A.; Cunneyworth, P. Case Study: Canopy bridges for primate conservation. In Handbook of Road Ecology; van der Ree, R., Smith, D.J., Grilo, C., Eds.; John Wiley & Sons: Hoboken, NJ, USA, 2015; pp. 341–343. [Google Scholar]
- Kioko, J.; Kiffner, C.; Jenkins, N.; Collinson, W.J. Wildlife roadkill patterns on a major highway in northern Tanzania. Afr. Zool. 2015, 50, 17–22. [Google Scholar] [CrossRef]
- Asensio, N.; Murillo-Chacon, E.; Schaffner, C.M.; Aureli, F. The effect of roads on spider monkeys’ home range and mobility in a heterogeneous regenerating forest. Biotropica 2017, 49, 546–554. [Google Scholar] [CrossRef]
- Coimbra-Filho, A.F.; Mittermeier, R.A. Distribution and ecology of the genus Leontopithecus Lesson, 1840 in Brazil. Primates 1973, 14, 47–66. [Google Scholar] [CrossRef]
- Kleiman, D.G.; Beck, B.B.; Dietz, J.M.; Dietz, L.A.; Ballou, J.D.; Coimbra-Filho, A.F. Conservation program for the golden lion tamarin: Captive research and management, ecological studies, educational strategies, and reintroduction. In Primates: The Road to Self-Sustaining Populations; Benirschke, K., Ed.; Springer: New York, NY, USA, 1986; pp. 960–979. [Google Scholar]
- Kierulff, M.C.; Rylands, A.B.; Procópio-de-Oliveira, M.M. Leontopithecus rosalia. The IUCN Red List of Threatened Species 2008: E T11506A3287321. Available online: https://www.iucnredlist.org/species/11506/3287321 (accessed on 7 January 2019).
- Dietz, J.M.; Baker, A.J.; Miglioretti, D. Seasonal variation in reproduction, juvenile growth, and adult body mass in golden lion tamarins (Leontopithecus rosalia). Am. J. Primatol. 1994, 34, 115–132. [Google Scholar] [CrossRef]
- Baker, A.J.; Bales, K.; Dietz, J.M. Mating system and group dynamics in Lion Tamarins. In Lion Tamarins: Biology and Conservation; Kleiman, D.G., Rylands, A.B., Eds.; Smithsonian Institution Press: Washington DC, USA, 2002; pp. 188–212. [Google Scholar]
- Stevenson, M.F.; Rylands, A.B. The marmosets, genus Callithrix. In Ecology end Behavior of Neotropical Primates; Mittermier, R.A., Rylands, A.B., Coimbra-Filho, A., Fonseca, G.A.B., Eds.; World Wildlife Fund: Washington, DC, USA, 1988; pp. 131–222. [Google Scholar]
- Dietz, J.M.; Baker, A.J. Polygyny and female reproductive success in golden lion tamarins, Leontopithecus rosalia. Anim. Behav. 1993, 46, 1067–1078. [Google Scholar] [CrossRef]
- Romano, V.; Martins, A.F.; Ruiz-Miranda, C.R. Unraveling the dispersal patterns and the social drivers of natal emigration of a cooperative breeding mammal, the golden lion tamarin. Am. J. Primatol. 2019, 81, e22959. [Google Scholar] [CrossRef] [PubMed]
- Rylands, A.B.; Faria, D.S. Habitats, feeding, and home range size in the genus Callithrix. In Marmosets and Tamarins (Systematics, Behaviour, and Ecology); Rylands, A.B., Ed.; Oxford Univ. Press: New York, NY, USA, 1993; p. 396. [Google Scholar]
- Peres, C.A. Costs and benefits of territorial defense in wild golden lion tamarins, Leontopithecus rosalia. Behav. Ecol. Sociobiol. 1989, 25, 227–233. [Google Scholar] [CrossRef]
- Dietz, J.M.; Peres, C.A.; Pinder, L. Foraging ecology and use of space in wild golden lion tamarins (Leontopithecus rosalia). Am. J. Primatol. 1997, 41, 289–305. [Google Scholar] [CrossRef]
- Miller, K.E.; Dietz, J.M. Effects of individual and group characteristics on feeding behaviors in Leontopithecus rosalia. Int. J. Primatol. 2005, 26, 1291–1319. [Google Scholar] [CrossRef]
- Coelho, A.S.; Ruiz Miranda, C.R.; Beck, B.B.; Martins Oliveira, A.C.R.; Sabatini, V. Comportamento do mico-leão-dourado (Leontopithecus rosalia, Linnaeus 1766) em relação a fragmentação do habitat. In Conservação do Mico-Leão-Dourado: Enfrentando os Desafios de uma Paisagem Fragmentada; Oliveira, P.P., Grativol, A.D., Ruiz Miranda, C.R., Eds.; Campos dos Goytacazes, Uniuversidade Estadual do Norte Fluminense: Rio de Janeiro, Brazil, 2008; pp. 58–85. [Google Scholar]
- Lapenta, M.J.; Procópio-de-Oliveira, P. Some aspects of seed dispersal effectiveness of golden lion tamarins (Leontopithecus rosalia) in a Brazilian Atlantic forest. Trop. Conserv. Sci. 2008, 1, 122–139. [Google Scholar] [CrossRef]
- Lima, H.C.; Pessoa, S.V.A.; Guedes-Bruni, R.R.; Moraes, L.F.D.; Granzotto, S.V.; Iwamoto, S.; Ciero, J.D. Caracterização fisionômico-florística e mapeamento da vegetação da Reserva Biológica de Poço das Antas, Silva Jardim, Rio de Janeiro, Brasil. Rodriguésia 2006, 53, 369–389. [Google Scholar] [CrossRef]
- ICMBio—Instituto Chico Mendes de Conservação da Biodiversidade. Plano de Manejo da Área de Proteção Ambiental da Bacia do Rio São João/Mico-Leão-Dourado; Instituto Chico Mendes de Conservação da Biodiversidade: Brasília, Brazil, 2008.
- IBGE—Instituto Brasileiro de Geografia e Estatística. Manual Técnico da Vegetação Brasileira: Sistema Fitogeográfico, Inventário das Formações Florestais e Campestres, Técnicas e Manejo de Coleções Botânicas, Procedimentos para Mapeamentos, 2nd ed.; Coordenação de Recursos Naturais e Estudos Ambientais; IBGE: Rio de Janeiro, Brazil, 2012; p. 276.
- Köppen, W. Climatologia: Con un Estudio de los Climas de la Tierra; Fondo de Cultura Economica: Pánuco, Mexico, 1948; p. 478. [Google Scholar]
- SEMA. Secretaria de Estado de Meio Ambiente e Desenvolvimento Sustentável, Governo do Estado do Rio de Janeiro. In Atlas das Unidades de Conservação da Natureza do Estado do Rio de Janeiro; Metalivros: Rio de Janeiro, Brazil, 2001; p. 48. [Google Scholar]
- Valladares-Padua, C.; Cullen Junior, L.; Padua, S. A pole bridge to avoid primate road kills. Neotrop. Primates 1995, 3, 13–15. [Google Scholar]
- Torres, A.; Jaeger, J.A.G.; Alonso, J.C. Assessing large-scale wildlife responses to human infrastructure development. Proc. Natl. Acad. Sci. USA 2016, 113, 8472–8477. [Google Scholar] [CrossRef] [PubMed] [Green Version]
- Walkup, D.K.; Leavitt, D.J.; Fitzgerald, L.A. Effects of habitat fragmentation on population structure of dune-dwelling lizards. Ecosphere 2017, 8, e01729. [Google Scholar] [CrossRef] [Green Version]
- Procópio-de-Oliveira, P.; Grativol, A.; Ruiz-Miranda, C.R. Conservação do Mico-leão-dourado: Enfrentando os Desafios de uma Paisagem Fragmentada; Universidade Estadual do Norte Fluminense Darcy Ribeiro Press: Campos dos Goytacazes, Brazil, 2008. [Google Scholar]
- Baker, A.J.; Dietz, J.M.; Kleiman, D.G. Behavioural evidence for monopolization of paternity in multi-male groups of golden lion tamarins. Anim. Behav. 1993, 46, 1091–1103. [Google Scholar] [CrossRef] [Green Version]
- Calenge, C. The package “adehabitat” for the R software: A tool for the analysis of space and habitat use by animals. Ecol. Model. 2006, 197, 516–519. [Google Scholar] [CrossRef]
- R Core Team. R: A Language and Environment for Statistical Computing; R Foundation for Statistical Computing: Vienna, Austria, 2019; ISBN 3-900051-07-0. [Google Scholar]
- Worton, B.J. Kernel methods for estimating the utilization distribution in home-range studies. Ecology 1989, 70, 164–168. [Google Scholar] [CrossRef]
- ESRI. ArcGIS Desktop: Release 10; Environmental Systems Research Institute: Redlands, CA, USA, 2015. [Google Scholar]
- Turchin, P. Quantitative Analysis of Movement; Sinuaer Associates, Inc. Publishers: Sunderland, UK, 1998. [Google Scholar]
- Calenge, C. Analysis of Animal Movements in R: The adehabitatLT Package. 2016. Available online: https://cran.r-project.org/web/packages/adehabitatLT/vignettes/adehabitatLT.pdf (accessed on 7 June 2019).
- Grilo, C.; Sousa, J.; Ascensão, F.; Matos, H.; Leitão, I.; Pinheiro, P.; Costa, M.; Bernardo, J.; Reto, D.; Lourenço, R.; et al. Individual Spatial Responses towards Roads: Implications for Mortality Risk. PLoS ONE 2012, 7, e43811. [Google Scholar] [CrossRef]
- Burnham, K.P.; Anderson, D.R. Model Selection and Interface: A Practical Information Theoretic Approach, 2nd ed.; Springer: New York, NY, USA, 1998. [Google Scholar]
- Raboy, B.E.; Neves, L.G.; Zeigler, S.; Saraiva, N.A.; Cardoso, N.; dos Santos, G.R.; Ballou, J.D.; Leimgruber, P. Strength of habitat and landscape metrics in predicting golden-headed lion tamarin presence or absence in forest patches in southern Bahia, Brazil. Biotropica 2010, 42, 388–397. [Google Scholar] [CrossRef]
- Moraes, A.M.; Ruiz-Miranda, C.R.; Galetti Jr, P.M.; Niebuhr, B.B.; Alexandre, B.R.; Muylaert, R.L.; Grativol, A.D.; Ribeiro, J.W.; Ferreira, A.N.; Ribeiro, M.C. Landscape resistance influences effective dispersal of endangered golden lion tamarins within the Atlantic Forest. Biol. Conserv. 2018, 224, 178–187. [Google Scholar] [CrossRef] [Green Version]
- Amorim, A.P. Avaliação dos Recursos Alimentares dos Micos Leões Dourados (Leontopithecus Rosalia, LINNAEUS, 1766) e sua Relação com Medidas Corporais: Uma Aplicação da Lógica Fuzzy; Universidade Estadual do Norte Fluminense Darcy Ribeiro: Rio de Janeiro, Brazil, 2007. [Google Scholar]
- Hankerson, S.J.; Franklin, S.P.; Dietz, J.M. Tree and forest characteristics influence sleeping site choice by golden lion tamarins. Am. J. Primatol. 2007, 69, 976–988. [Google Scholar] [CrossRef] [PubMed]
- Didham, R.K. The influence of edge effects and forest fragmentation on leaf litter invertebrates in central Amazonia. In Tropical Forest Remnants: Ecology, Management and Conservation of Fragmented Communities; Laurance, W.F., Bierregaard, J.R.R.O., Eds.; University of Chicago Press: Chicago, IL, USA, 1997; pp. 55–70. [Google Scholar]
- Eldegard, K.; Totland, Ø.; Moe, S.R. Edge effects on plant communities along power line clearings. J. Appl. Ecol. 2015, 52, 871–880. [Google Scholar] [CrossRef] [Green Version]
- Lewis, S.L. Tropical forests and the changing earth system. Philos. Trans. R Soc. B Biol. Sci. 2005, 361, 195–210. [Google Scholar] [CrossRef] [PubMed] [Green Version]
- Malhi, Y. The productivity, metabolism and carbon cycle of tropical forest vegetation. J. Ecol. 2012, 100, 65–75. [Google Scholar] [CrossRef]
- Moraes, A.M.; Ruiz-Miranda, C.R.; Ribeiro, M.C.; Grativol, A.D.; Carvalho, C.D.S.; Dietz, J.M.; Kierulff, M.C.F.; Freitas, L.A.; Galetti, P.M. Temporal genetic dynamics of reintroduced and translocated populations of the endangered golden lion tamarin (Leontopithecus rosalia). Conserv. Genet. 2017, 18, 995–1009. [Google Scholar] [CrossRef]
- Holst, B.; Medici, E.; Marinho-Filho, O.J.; Kleiman, D.; Leus, K.; Pissinatti, A.; Vivekanda, G.; Ballou, J.; Traylor-Holzer, K.; Raboy, B.; et al. Lion Tamarin Population and Habitat Viability Assessment Workshop 2005, Final Report; IUCN/SSC Conservation Breeding Specialist Group: Apple Valley, MN, USA, 2006; p. 193. [Google Scholar]
- Soanes, K.; Lobo, M.C.; Vesk, P.A.; McCarthy, M.A.; Moore, J.L.; van der Ree, R. Movement re-established but not restored: Inferring the effectiveness of road-crossing mitigation for a gliding mammal by monitoring use. Biol. Conserv. 2013, 159, 434–441. [Google Scholar] [CrossRef]
- Teixeira, F.Z.; Printes, R.C.; Fagundes, J.C.G.; Alonso, A.C.; Kindel, A. Canopy bridges as road overpasses for wildlife in urban fragmented landscapes. Biota Neotrop. 2013, 13, 117–123. [Google Scholar] [CrossRef] [Green Version]
Figure 1.
Home range and core areas for the 16 groups of GLTs in three study regions: União Biological Reserve (UN, figure on the right), Poço das Antas Biological Reserve (PA, rightmost fragment on the figure on the left), and isolated patches (intermediate and leftmost fragment on the left figure).

Figure 2.
(A) Home range size and (B) core areas for 16 groups of GLTs in three locations: União Biological Reserve (UN), Poço das Antas Biological Reserve (PA), and isolated forest patches (IP).
Figure 2.
(A) Home range size and (B) core areas for 16 groups of GLTs in three locations: União Biological Reserve (UN), Poço das Antas Biological Reserve (PA), and isolated forest patches (IP).

Figure 3.
Density of step length of GLT locations at variable distances from linear infrastructure.


Table 1.
Models that explained the step length of GLT groups. Step = step length; inf = type of linear infrastructure (highway, unpaved road, pipeline, and powerline); land = landscape features (native habitat (forest and regeneration areas), no habitat (pasture and linear infrastructures)); dist_inf = distance to the closest infrastructure; dist_hig = distance to the closest highway.
| Model | ΔAICc | Weight |
|---|---|---|
| step ~ inf + land | 0 | 0.2992 |
| step ~ dist_inf + inf + land | 0.1 | 0.2850 |
| step ~ dist_inf + inf | 0.3 | 0.2566 |
| step ~ land + dist_inf + inf + dist_hig | 1.3 | 0.1528 |
© 2019 by the authors. Licensee MDPI, Basel, Switzerland. This article is an open access article distributed under the terms and conditions of the Creative Commons Attribution (CC BY) license (http://creativecommons.org/licenses/by/4.0/).
Share and Cite
MDPI and ACS Style
Lucas, P.d.S.; Alves-Eigenheer, M.; Francisco, T.M.; Dietz, J.M.; Ruiz-Miranda, C.R. Spatial Response to Linear Infrastructures by the Endangered Golden Lion Tamarin. Diversity 2019, 11, 100. https://doi.org/10.3390/d11070100
AMA Style
Lucas PdS, Alves-Eigenheer M, Francisco TM, Dietz JM, Ruiz-Miranda CR. Spatial Response to Linear Infrastructures by the Endangered Golden Lion Tamarin. Diversity. 2019; 11(7):100. https://doi.org/10.3390/d11070100
Chicago/Turabian StyleLucas, Priscila da Silva, Milene Alves-Eigenheer, Talitha Mayumi Francisco, James M. Dietz, and Carlos Ramón Ruiz-Miranda. 2019. "Spatial Response to Linear Infrastructures by the Endangered Golden Lion Tamarin" Diversity 11, no. 7: 100. https://doi.org/10.3390/d11070100
Note that from the first issue of 2016, this journal uses article numbers instead of page numbers. See further details here.