Article

Nematic and Cholesteric Liquid Crystal Structures in Cells with Tangential-Conical Boundary Conditions

by
Mikhail N. Krakhalev
1,2,*,
Rashid G. Bikbaev
1,2,
Vitaly S. Sutormin
1,
Ivan V. Timofeev
1,2 and
Victor Ya. Zyryanov
1
1
Kirensky Institute of Physics, Federal Research Center KSC SB RAS, Krasnoyarsk 660036, Russia
2
Siberian Federal University, Krasnoyarsk 660041, Russia
*
Author to whom correspondence should be addressed.
Crystals 2019, 9(5), 249; https://doi.org/10.3390/cryst9050249
Submission received: 27 March 2019 / Revised: 7 May 2019 / Accepted: 9 May 2019 / Published: 14 May 2019
(This article belongs to the Special Issue Advances in Cholesteric Liquid Crystals)

Abstract

:
Orientational structures formed in nematic and cholesteric layers with tangential-conical boundary conditions have been investigated. LC cells with one substrate specifying the conical surface anchoring and another substrate specifying the tangential one have been considered. The director configurations and topological defects have been identified analyzing the texture patterns obtained by polarizing microscope in comparison with the structures and optical textures calculated by free energy minimization procedure of director field and finite-difference time-domain method, respectively. The domains, periodic structures and two-dimensional defects proper to the LC cells with tangential-conical anchoring have been studied depending on the layer thickness and cholesteric pitch.

Graphical Abstract

1. Introduction

Cholesteric liquid crystals (CLCs) are characterized by the helicoidal structure of director n (the unit vector indicating the preferred orientation of the long axes of liquid crystal (LC) molecules). These media have unique structural and optical properties [1]. CLCs can be used in various applications such as electro-optical devices with memory effect [2,3], quantum generation of light [4,5], switchable diffraction gratings [6,7,8,9,10], optical rotators [11], the formation of colloidal systems with a periodic distribution of particles [12], etc. The applications require various stable and metastable orientational structures depending on the boundary conditions, LC material parameters, ratio between LC layer thickness d and cholesteric pitch p, external factors [1,13,14,15,16]. For example, the homeotropic director orientation is formed in the cells at normal CLC anchoring with substrates and confinement ratio d / p < K 33 / 2 K 22 , where K 22 , K 33 are the twist and bend elastic constants, respectively [17,18,19]. The electric field applied to such cells causes the formation of bubble or elongated domains if the cholesteric pitch is slightly larger than the thickness of the LC layer [20,21]. Besides, the topological soliton-like structures can be obtained using laser radiation [22,23], the thermal quenching process [24] or the specific treatment of the orienting surface [25]. At tangential anchoring (non-degenerate planar anchoring) of CLC with the substrates, the Grandjean planar texture or domain structures are formed [3,13,26,27]. The structure with a periodic director modulation can be obtained in the LC cells with certain confinement ratios d / p by application of electric field [7,28]. The structure of modulated hybrid-aligned cholesteric is formed under hybrid surface anchoring (one substrate specifies the tangential boundary conditions and another substrate specifies the normal ones) in the cell with confinement ratio d / p > 1 and can be controlled by light [9], temperature [10] or electric field [29].
In the case of conical surface anchoring the director is tilted to the substrate and the azimuthal direction is degenerated (Figure 1). The structures of cholesteric with conical boundary conditions have not been well studied yet. Smooth transformations of cholesteric orientational structures induced by the modification of normal surface anchoring to tangential one through the formation of tilted or conical boundary conditions have been observed in [30,31]. A modulated structure of cholesteric under tangential surface anchoring at one of the substrates and weak conical boundary conditions formed at the interface of CLC and its isotropic phase at the opposite side have been investigated in [32]. It has been shown that the period of director modulation is equal to the cholesteric pitch and the orientation of periodic structure depends linearly on the confinement ratio d / p . At that, the critical d / p value for formation of the modulated structure depends on the ratio of elastic constants and it was less than in the case of normal or hybrid surface anchoring for some CLC materials.
In present work, the nematic and cholesteric structures formed in the LC cells with tangential-conical boundary conditions have been investigated.

2. Materials and Methods
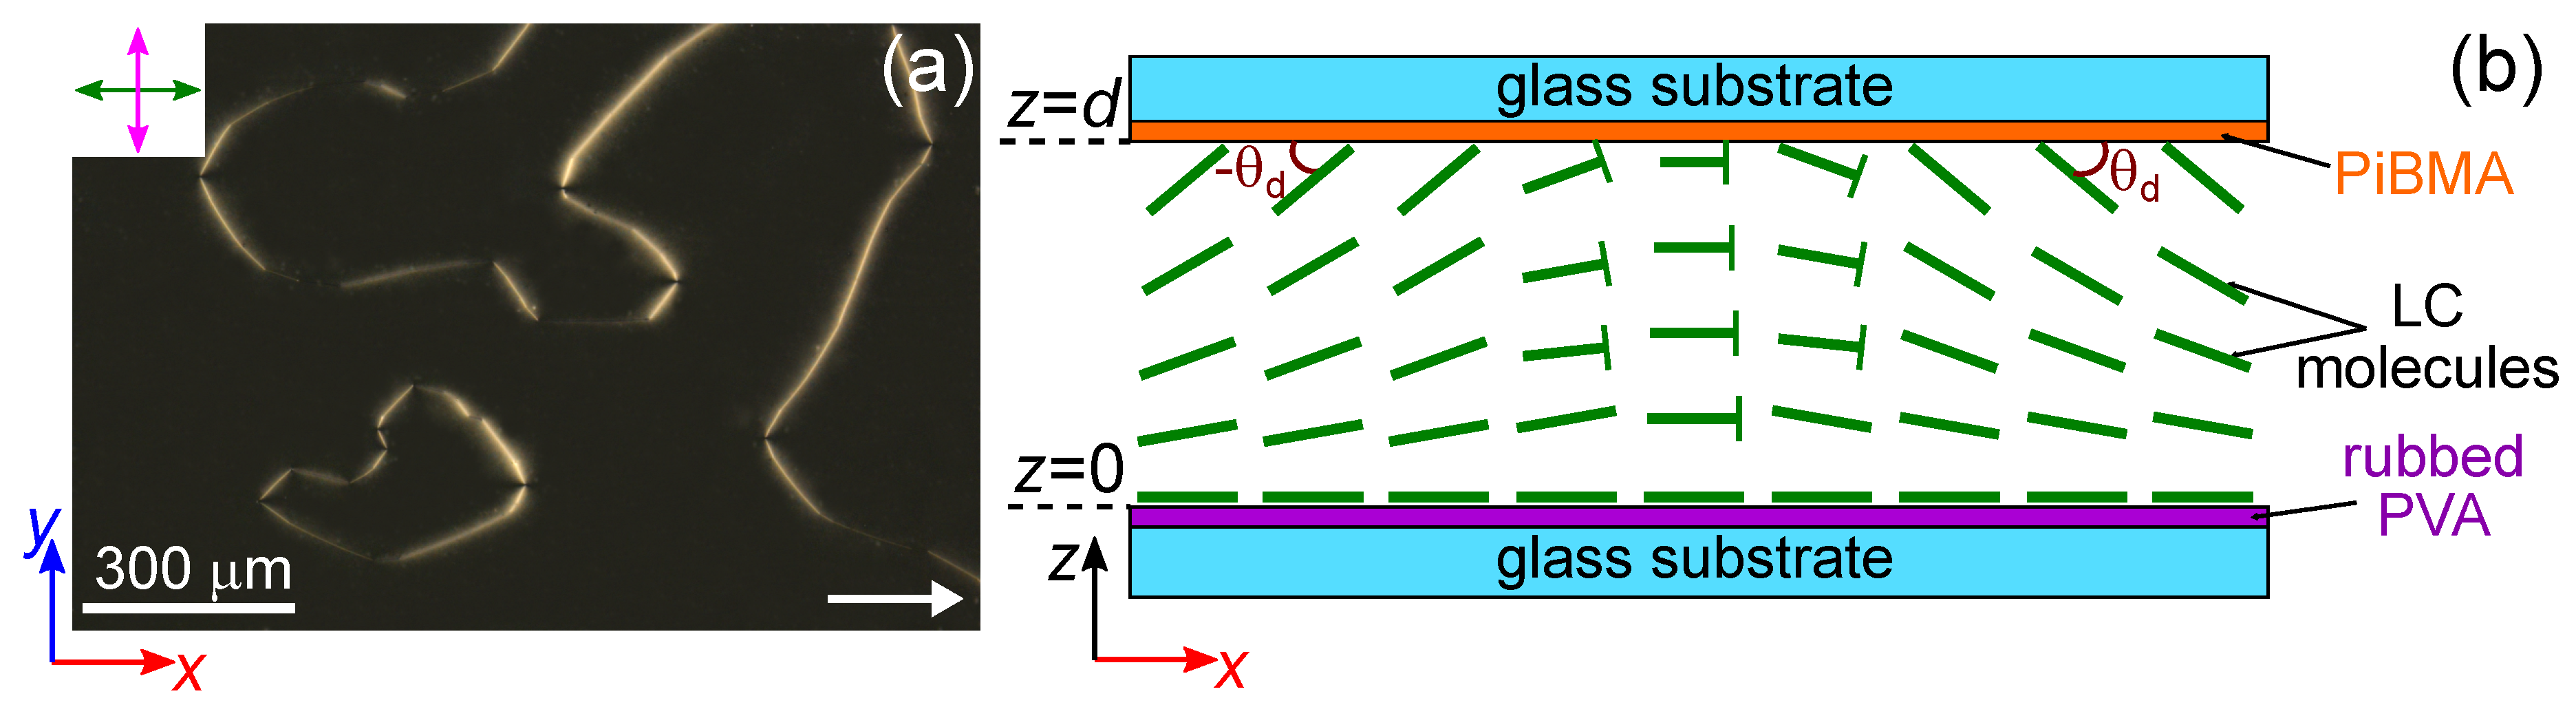
2.1. Experimental

The experiment was carried out with sandwich-like cells consisting of two glass substrates coated with polymer films and the LC layer between them. Bottom substrate was covered by the polyvinyl alcohol (PVA) (Sigma Aldrich, St. Louis, MO, USA) and the top one was covered by the poly(isobutyl methacrylate) (PiBMA) (Sigma Aldrich, St. Louis, MO, USA). The polymer films were deposited on the substrates by spin coating. The PVA film was unidirectionally rubbed while the PiBMA film was not treated after the deposition process. The LC layer thickness d assigned by the glass microspheres was measured by means of the interference method with spectrometer HR4000 (Ocean Optics, Largo, FL, USA) before the filling process. The nematic mixture LN-396 (Belarusian State Technological University, Minsk, Belarus) and LN-396 doped with the left-handed chiral additive cholesterylacetate (Sigma Aldrich, St. Louis, MO, USA) were used as a nematic and cholesteric, respectively. For the nematic mixture LN-396 the PiBMA film specifies the conical boundary conditions with the tilt angle 50 [33,34,35] and azimuthal degeneration. The polar anchoring strength of LN-396 on the PiBMA film is W 0 10 6 J/m 2 [33]. The cells were filled by the LC in the mesophase at room temperature. After the filling process, the cells were kept for at least 24 h before measurements. The helical twisting power HTP = 6.9 μ m 1 of cholesterylacetate in the LN-396 was determined using the Grandjean-Cano method. The cholesteric pitch p of used mixtures was calculated from p = 1 / ( H T P × c w ) , where c w is the weight concentration of the chiral additive. The LC cells with the confinement ratios d / p equal to 0.14, 0.28, 0.43, 0.60, 0.78 and 0.88 were investigated by means of the polarizing optical microscope (POM) Axio Imager.A1m (Carl Zeiss, Oberkochen, Germany). The experiments were carried out using white light or quasi-monochromatic light with wavelength λ = 602 nm produced by the interference filter.

2.2. Computer Simulations

The nematic orientational structure within the layer was calculated by means of the free energy minimization [36]. The method is widely used for the LC systems without singularities of the director field. The Frank elastic energy density F k was expressed as:
F k = 1 2 k 11 ( · n ) 2 + 1 2 k 22 ( n · × n + 2 π / p ) 2 + 1 2 k 33 ( n × × n ) 2 ,
here n is the director, k 11 , k 22 and k 33 are the splay, twist and bend elasticity coefficients, respectively. The main part of LN-396 is the alkyl-cyanobiphenyl and alkyloxy-cyanobiphenyls [33]. Therefore, it can be supposed that the elastic constants of LN-396 and E7 have close values. In the simulations we have taken k 11 = 11.1 pN, k 22 = 7.6 pN, k 33 = 17.1 pN [37,38].
This function was converted into a discrete array of numbers, corresponding to thin, semihomogeneous sublayers. Each layer elastic energy was minimized in gradient direction. The five gradient components can be interpreted as elastic torques to rotate director and find θ , ϕ pair. In this study, we used 100 sublayers for a fairly accurate solution. Numerical convergence of this function was controlled by artificial viscosity. The domain wall orientational structure was analytically interpolated between the neighbouring domain structures. The asymptotic lateral boundary conditions were used. The values of θ ( x ) were reversed approaching the domain bulk value with multiplication by tan 1 ( 4 x / L ) · 2 / π , where L is a characteristic wall thickness. The values of φ ( x ) were adjusted by φ 0 cosh 1 ( 4 x / L ) , where φ 0 were taken from experimental data for each domain wall.
The optical properties of LC structures were calculated by Finite-Difference Time-Domain (FDTD) method in commercial Lumerical package. LC structure was illuminated from below by the plane wave with normal incidence along the z-axis and polarization perpendicular to the rubbing direction. The plane wave source was located at the bottom boundary of the LC layer. Periodic boundary conditions were applied at the lateral boundaries of the simulation box (along the x and y axes), while the perfectly matched layers (PML) were used on the remaining top and bottom sides. The components of the electric field were calculated at the top boundary of the LC layer. POM images were obtained for the wavelength of incident light λ = 602 nm.

3. Results and Discussion
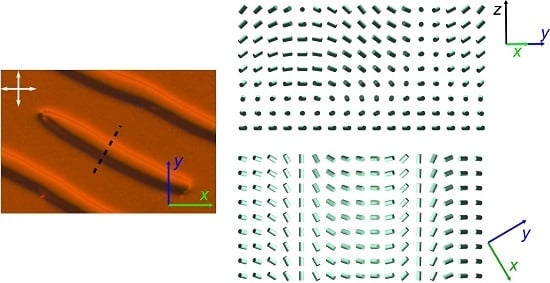
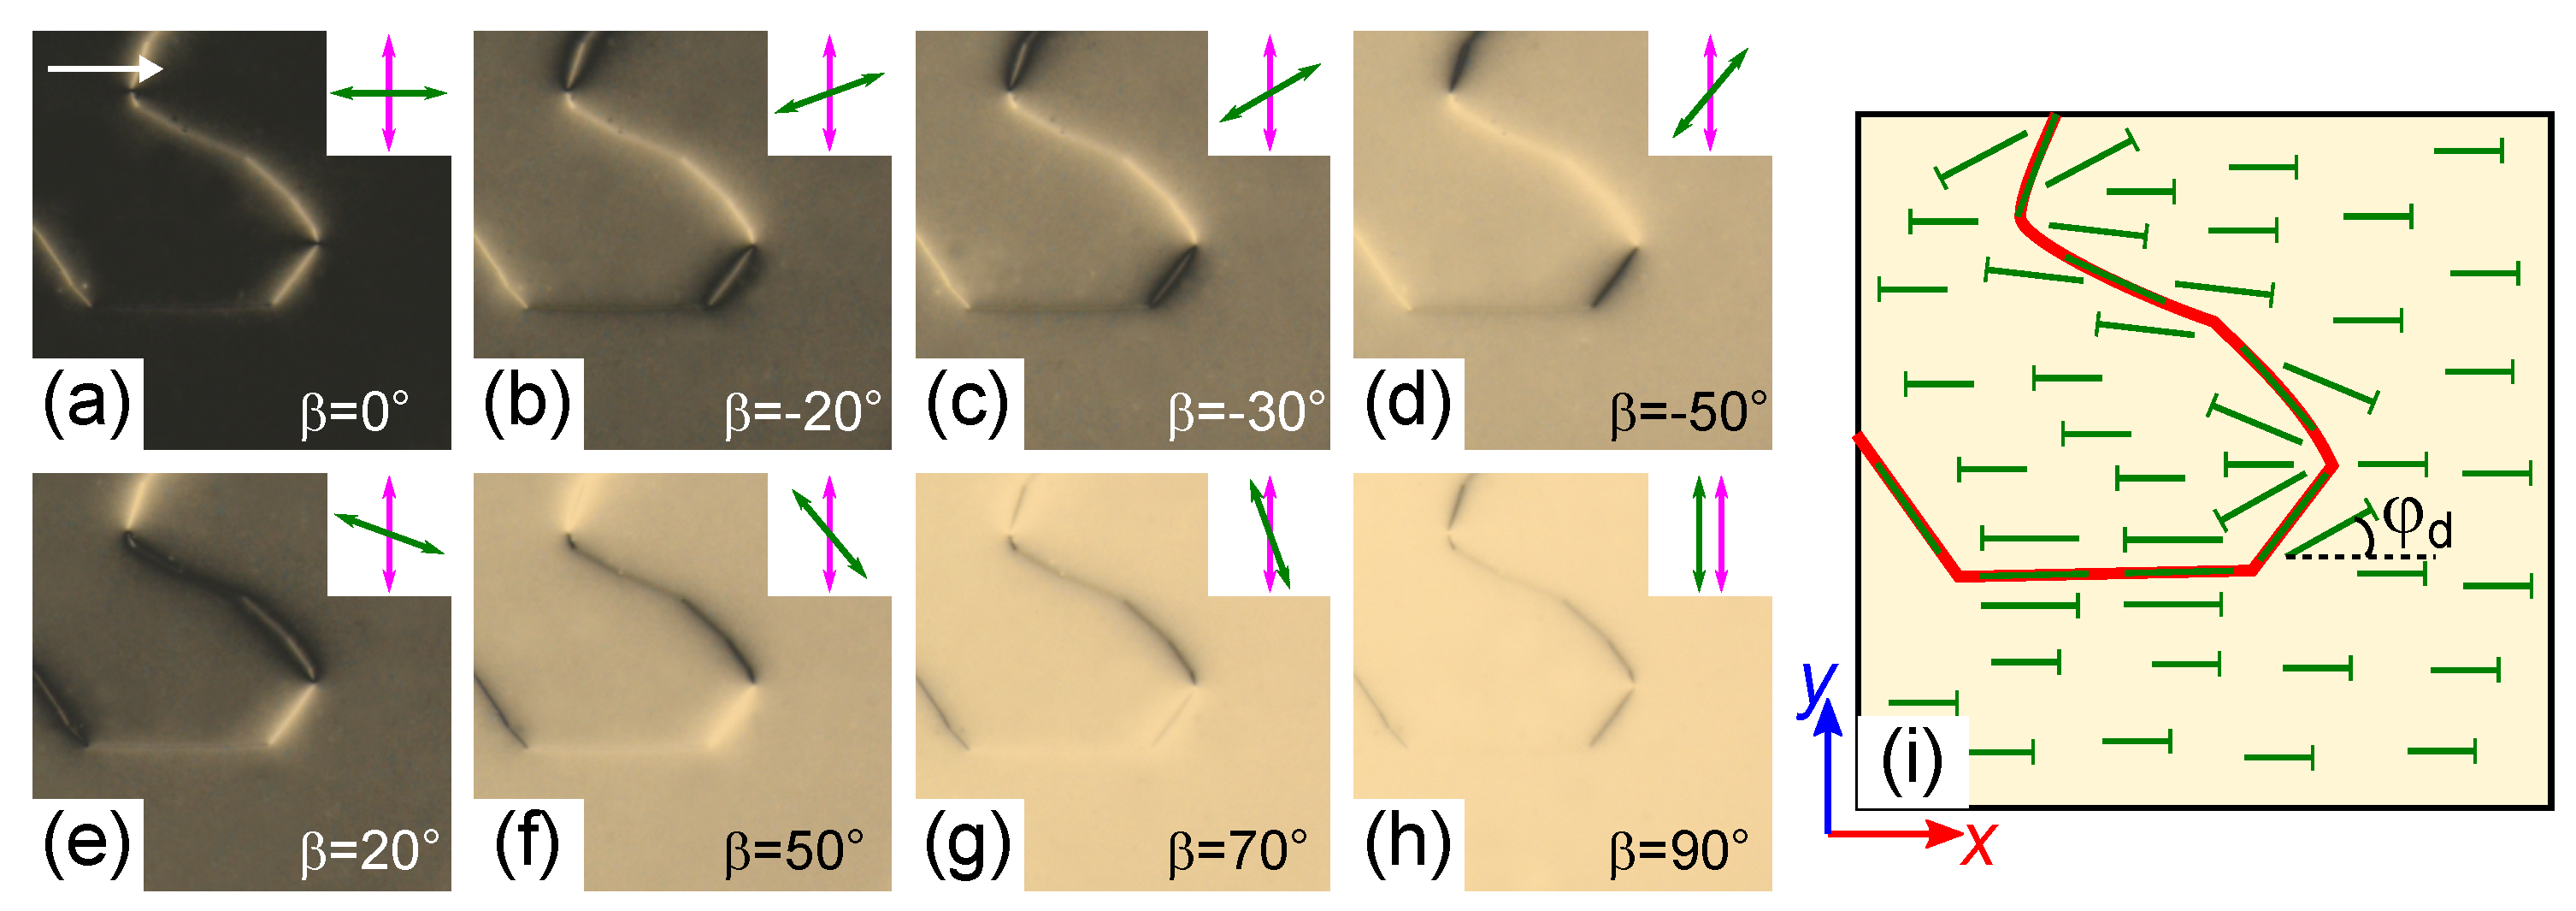
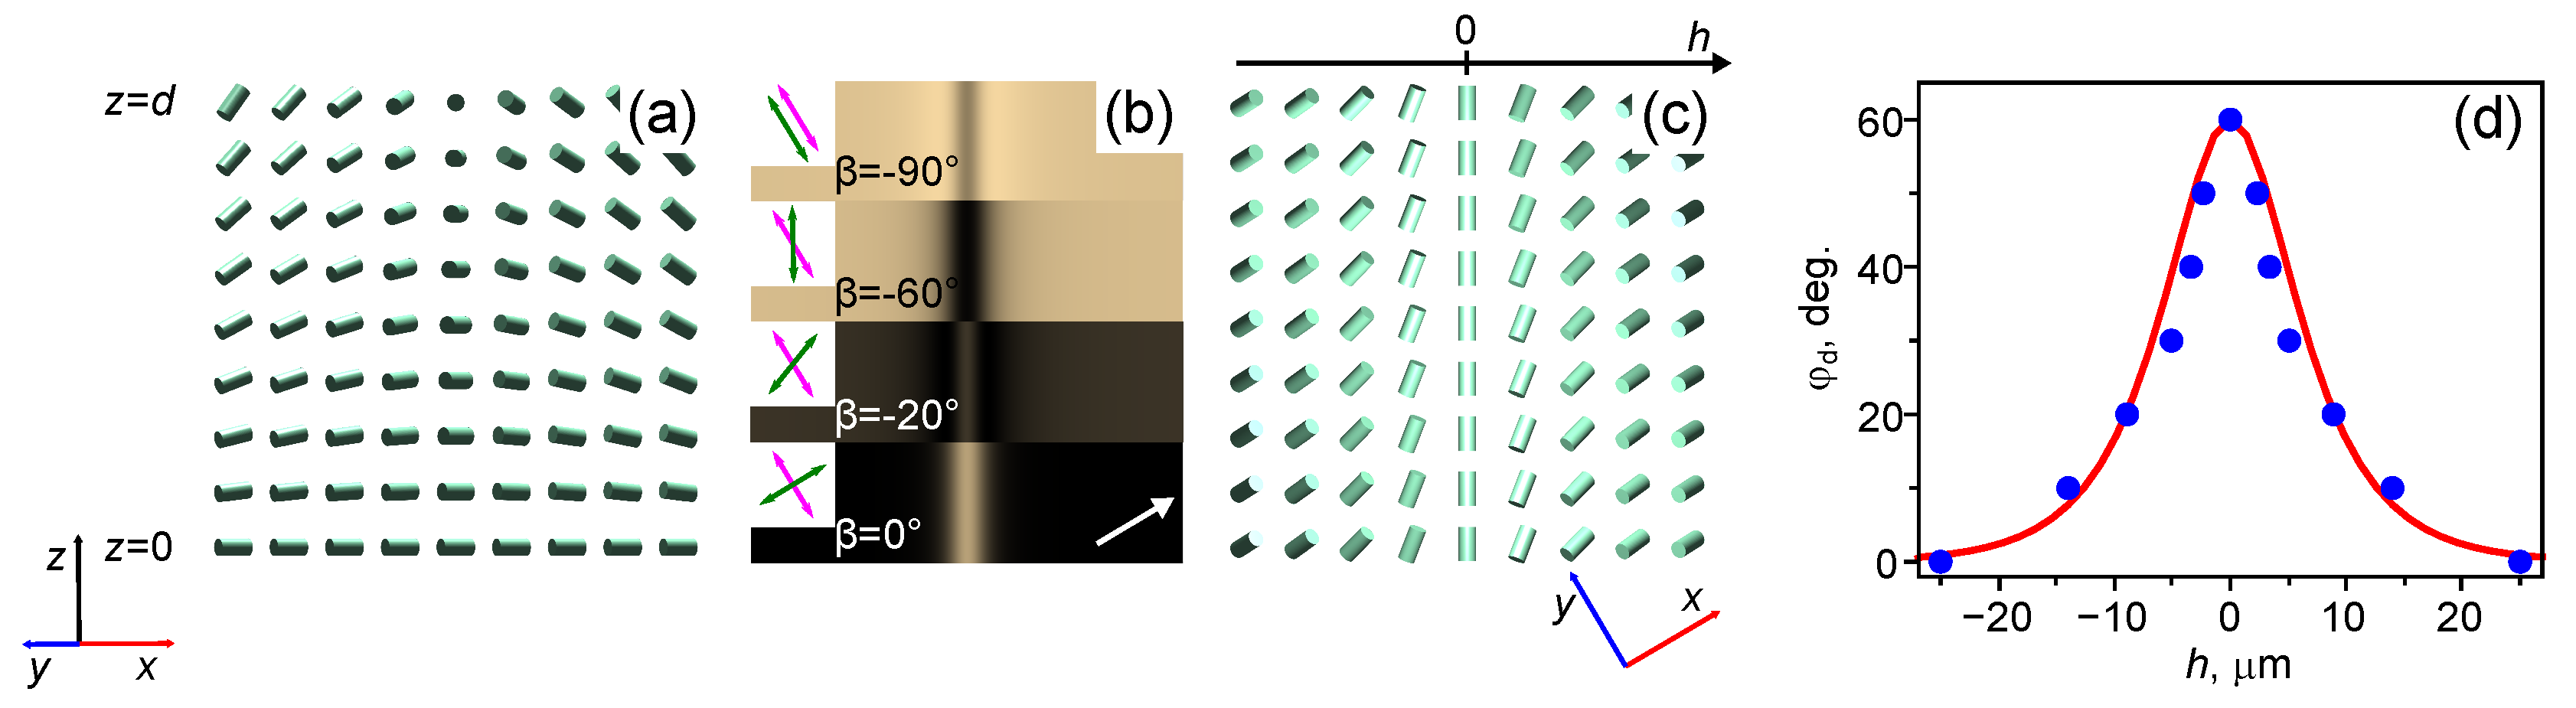
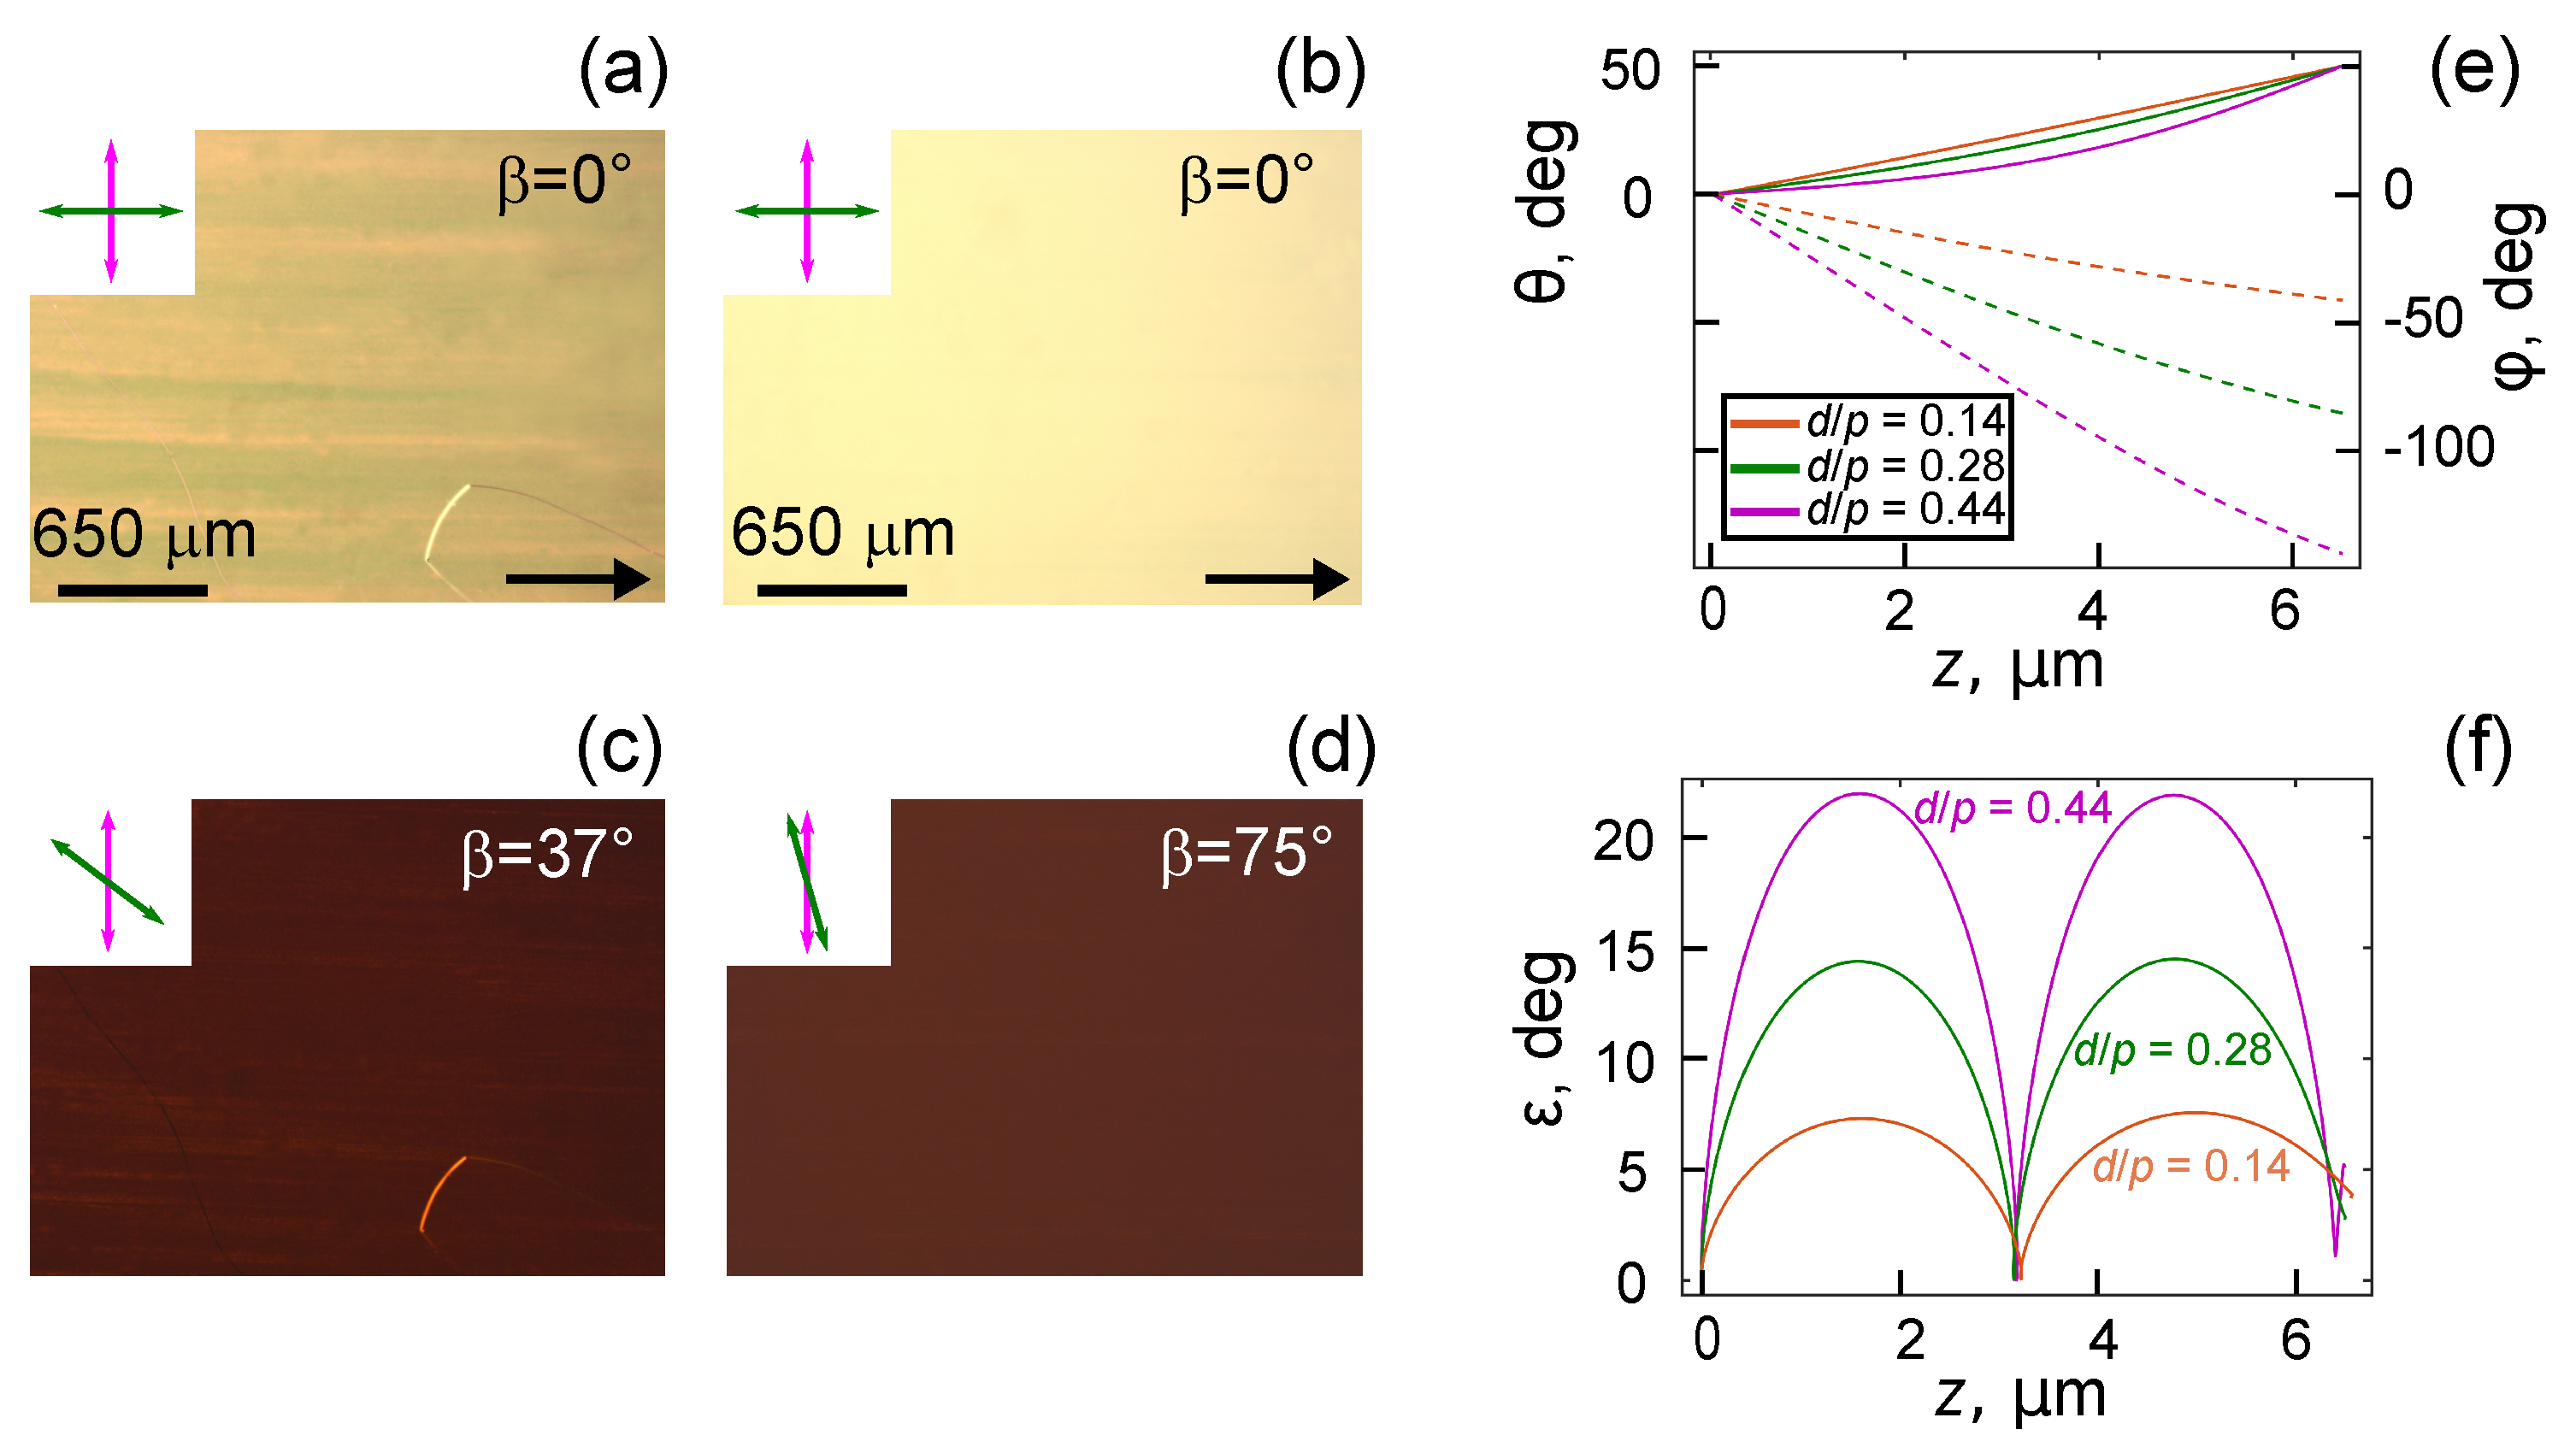
3.1. Nematic Layer

PVA film orients the nematic LN-396 tangentially while PiBMA film specifies the conical boundary conditions with the tilt angle of director θ d = 50 [33,34,35] and azimuthal degeneration. The azimuthal degeneration is eliminated by presence of rubbed PVA film on the bottom substrate specifying the director orientation with azimuthal angle φ 0 = 0 . As a result, the orientational structure with zero azimuthal angle of the director is formed in the cells including the LC-PiBMA interface (Figure 2). At that, two types of domains differing by the tilt angles + θ d and θ d on the PiBMA film are observed. The similar situation was observed in the LC cell with tangential-conical boundary conditions in the case of conical surface anchoring at the interface of LC-isotropic phase [39]. Domains are separated from each other by defect walls which are clearly observed on the optical textures using polarized light (without the crossed analyzer) when the polarization of incident light coincides with rubbing direction of PVA film. In the case of orthogonal orientation of polarizer and rubbing direction of PVA film these defect walls are almost invisible (see Supplementary Materials Figure S1). When the LC cell is placed between crossed polarizers the segments of wall with orientation differing from rubbing direction are clearly observed (Figure 2a) indicating the presence of twist deformation of the director. The similar situation was shown in the domain walls formed by the application of the magnetic field [40]. The director possesses the homogeneous azimuthal orientation along the rubbing direction far from the domain walls (Figure 2a) in the LC cells filled by the nematic in the mesophase and it can be considered as the evidence of the strong anchoring of LN-396 at the PVA film. The similar optical textures were observed in various regions of the LC cell showing the uniformity of boundary conditions across the surfaces of substrates.
The azimuthal angle of director rotation φ d on the top substrate covered with PiBMA film can be measured by means of the analyzer rotation (Figure 3). If the polarization of incident light is parallel or orthogonal to the director on the entrance substrate covered with PVA and Mauguin condition [41] is valid then the polarization of light passed through the LC cell remains linear but rotated relative to the incident light polarization. The angle of polarization rotation is equal to the azimuthal angle of director rotation. In the case of the orthogonal orientation of the light polarization and the director on the entrance substrate the light passed through the LC cell is polarized perpendicularly to the director projection on the plane of the output substrate. Consequently, the darkest areas of optical texture correspond to the parallel orientation of analyzer and director projection on the plane of output substrate covered with PiBMA film. Thus, the topology of the director projection over the area of the substrate covered with PiBMA can be determined.
The optical textures of nematic layer for different β (angle between analyzer and rubbing direction of PVA film) and the director orientation on the PiBMA film near the domain wall are presented in Figure 3. The analysis by the above-mentioned technique revealed that there is the smooth azimuthal rotation of director from φ d = 0 (far away from the wall) to the value φ d in the center of the wall where the director is parallel to its plane. The rotation occurs over a distance of approximately the LC layer thickness. The domain wall contains the reversing points [42], dividing the segments of the wall with different director orientation relative to rubbing direction. The direction of azimuthal rotation (the φ sign) is defined by the condition that the absolute value of azimuthal angle of rotation on the substrate covered with PiBMA does not exceed π / 2 value.
The cross-section of the domain wall is shown in Figure 4a. The angle between the wall plane and rubbing direction is 60 . The orientational structure was calculated by the minimization of elastic energy and analytical interpolation of director between two neighboring domains. The POM photos of domain wall segment for the different β angles have been obtained by the FDTD method (Figure 4b) based on the calculated orientational structure. When the analyzer is parallel to the rubbing direction ( β = 0 ) the darkest area is observed far away from the wall. At the same time, the center of domain wall is bright. The variation of β angle leads to the appearance of a couple of dark areas (extinction bands) merging at the center line of the wall at β = 60 corresponded to the parallel orientation of the analyzer and the wall. The director orientation near the domain wall on the substrate with conical boundary conditions ( z = d ) is shown in Figure 4c. The dependence of the azimuthal angle of director rotation φ d on the distance h from the center of the domain wall has been obtained (Figure 4d, solid line). Besides, the experimentally measured dependence φ d ( h ) using the analyzer rotation method are also shown in Figure 4d. The calculated function φ d ( h ) is in a good agreement with the experimental data.

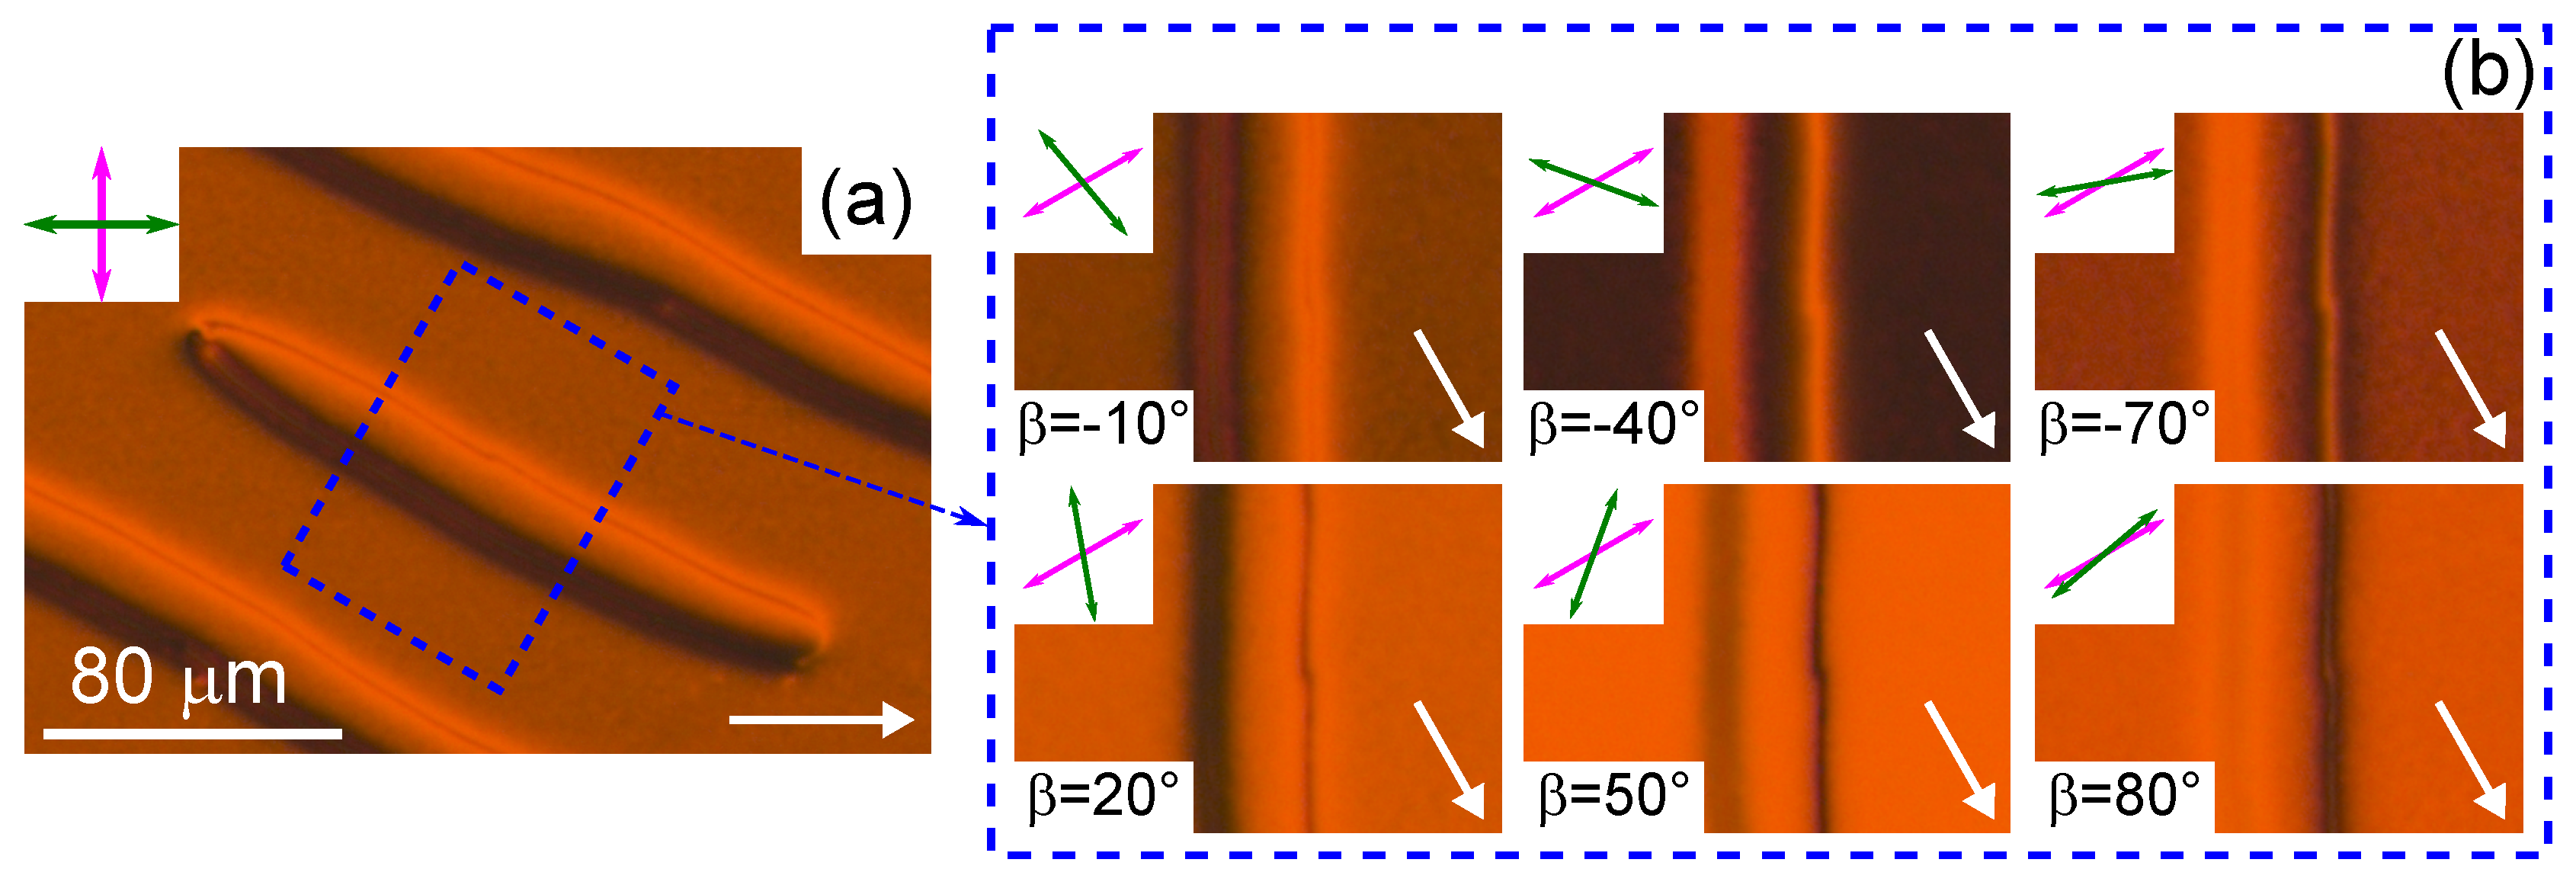
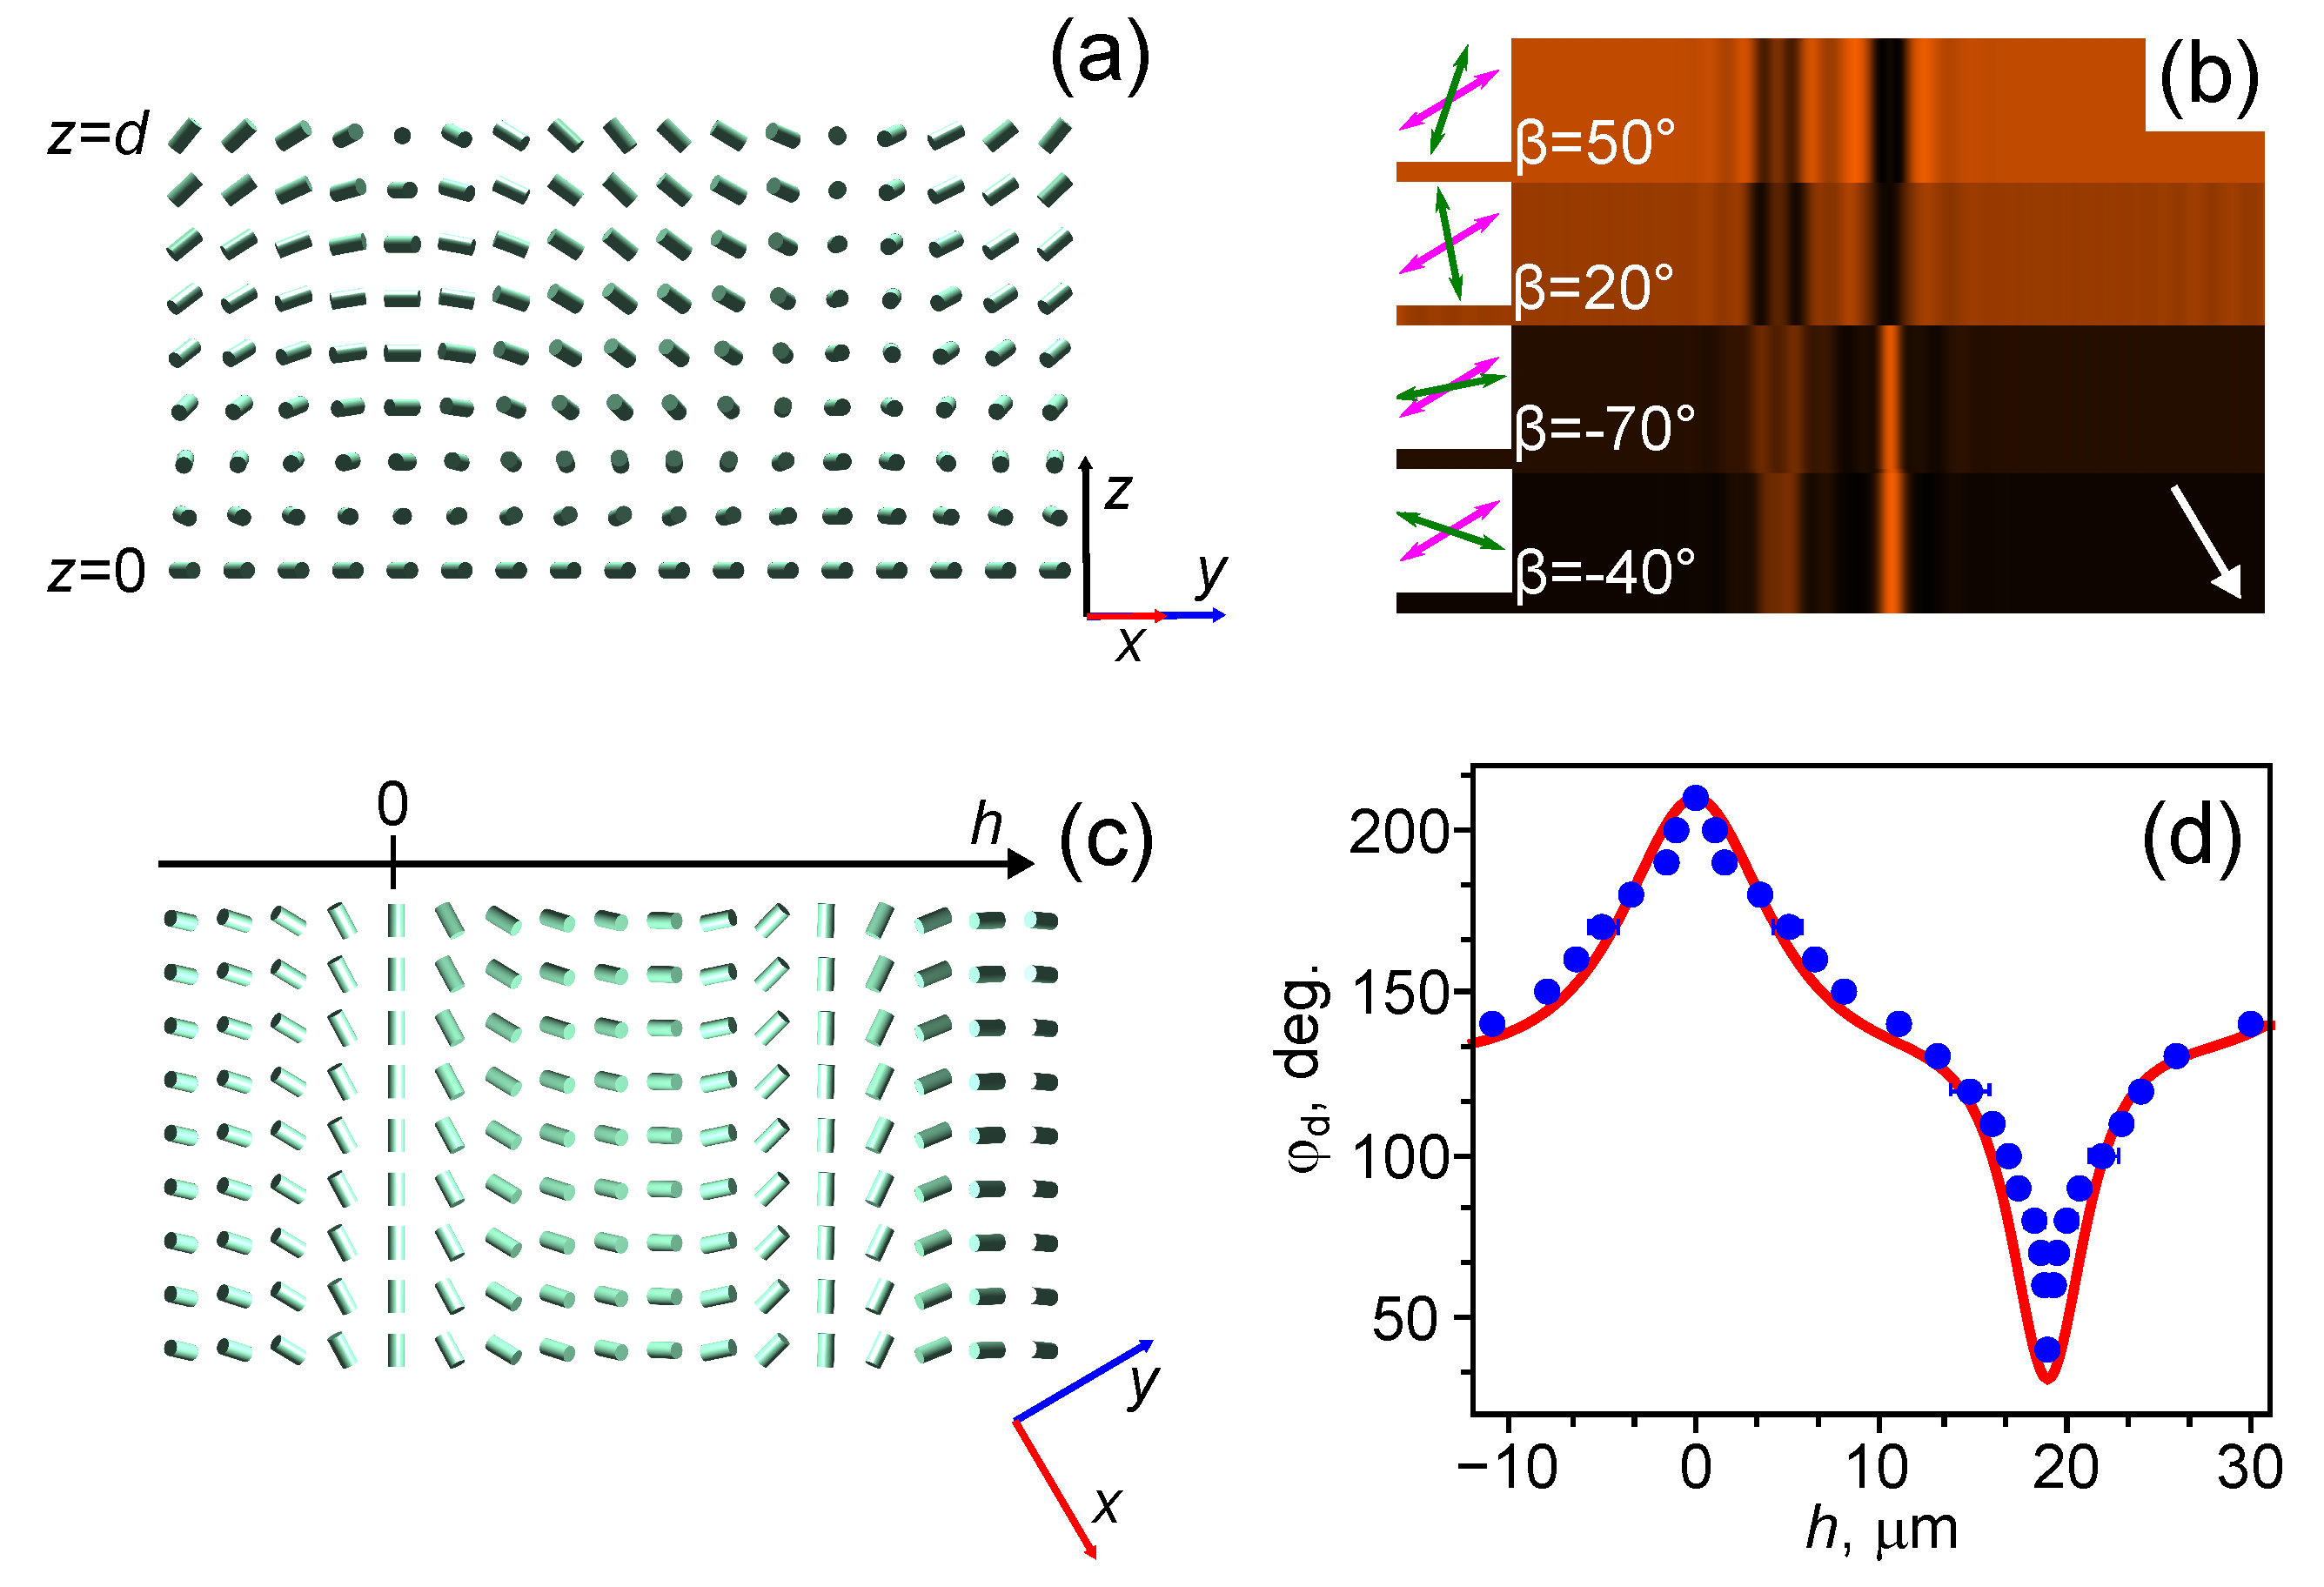
3.2. Twisted Cholesteric Structure

In the nematic LC cells, the defect walls separating the areas with the opposite values of the tilt angle θ d on the PiBMA film were observed (Figure 2a and Figure 3). At that, the different segments of the wall had the opposite sign of the azimuthal director rotation and these segments were separated from each other by the reversing points. In the cholesteric LC cells, the right-handed segments of the walls are less stable that increases the monodomain sizes. POM photos of samples with the LC layer thickness d = 6.5 μ m and confinement ratios d / p = 0.14 , 0.28 are shown in Figure 5a,b. One can see that the monodomains corresponding to the opposite values of tilt angle θ d in the cell with confinement ratio d / p = 0.14 have a larger size (Figure 5a) than in the nematic LC cells (Figure 2a). The monodomain structure is formed in the cell with confinement ratio d / p = 0.28 (Figure 5b).
In the general case, the Mauguin condition is not valid for the homogeneously twisted structure of LC. However, the layer thickness of LC and wavelength of incident light can be chosen so that the Gooch-Terry minimum condition is valid [43]. In this case, the polarization of light passed through the LC cell remains linear but rotated relative to the initial state if the linear polarization of incident light is parallel or orthogonal to the director on the entrance substrate. The angle of polarization rotation is equal to the azimuthal angle of director rotation. The Gooch-Terry minimum condition is independent of the rotation angle of director [41]. The twisted structure with azimuthal angle of director rotation depending on the confinement ratio d / p is formed in the cholesteric cell with tangential-conical boundary conditions (Figure 5e). The tilt and azimuthal angles of the director in the cholesteric bulk were calculated by the minimization of elastic energy for three d / p ( d = 6.5 μ m) values (Figure 5e). The ellipticity angle ε for polarized light with wavelength λ = 602 nm was determined based on these data (Figure 5f). One can see that Gooch-Terry minimum condition is nearly independent of the confinement ratio d / p as in the case of the homogeneously twisted LC structure. For the LC layer thickness d = 6.5 μ m, the wavelength of incident light λ = 602 nm nearly corresponds to the Gooch-Terry minimum condition and the ε value do not exceed 5 after passing the linearly polarized light through the cells with d / p = 0.14 , 0.28 and 0.44. Thus, the method of analyzer rotation can be used for experimental measuring the azimuthal angle φ d of the director on the top substrate covered with PiBMA.
The darkest state of domains for the LC cell with d / p = 0.14 is observed at β = 37 when the interference filter ( λ = 602 nm) is used (Figure 5c). Thus, the azimuthal angle of director rotation at the substrate covered with PiBMA is φ d 37 . For the LC cell with d / p = 0.28 the darkest state of domain (for incident light with wavelength λ = 602 nm) is observed at β = 75 (Figure 5d) and, consequently, φ d 75 .
Structure deformations are observed in the LC cell with d = 6.5 μ m and confinement ratio d / p = 0.44 . In this case, the defects are observed in the form of elongated loops (Figure 6a) or lines originating and ending at the cell edges (interfaces LC-air and LC-glue) or the surface defects. Therefore, the defects number near the edges of LC cell is more than in the central area. They are well observed independently of the polarization of incident light when the LC cell is placed between crossed polarizers. Under analyzer switched-off the lines are clearly visible when the polarizer is parallel to the rubbing direction and the lines are almost invisible when the polarization of incident light is perpendicular to the rubbing direction. The orientation of loops and their relative position can be different. At the same time, there is the twisted director structure between loops and the optical texture has the darkest state (for incident light with wavelength λ = 602 nm) at β 40 (Figure 6b), corresponding to the azimuthal angle of director rotation φ d 140 . The theoretically calculated φ d values (Figure 5e) are in a good agreement with the experimentally measured φ d values (Table 1).
A couple of extinction bands near one of the loop lines can be observed (Figure 6b) by the analyzer rotation. As in the case of nematic described above the couple of extinction bands are gathered to the defect under the analyzer rotation. These lines are merged when the analyzer is almost parallel to the considered segment of the loop. Under further analyzer rotation the similar couple of extinction lines appears near the opposite segment of the loop and the distance between these lines depends on the β angle (Figure 6b). Such orientation of extinction lines indicates that the director is oriented parallel to the line of loop defect on the top substrate and π azimuthal rotation angle of director occurs between two opposite segments of the loop. Thus, the values of azimuthal angles φ d at the opposite segments of the loop differ by π and the tilt angle θ d is zero at the defect line. For example, the angle between the loop line and rubbing direction is approximately 30 (Figure 6a). Consequently, the rotation angle φ d is about 210 at the first loop segment and 30 at the opposite one.
The orientation with different angle of director rotation was simulated by the FDTD method (Figure 7). The calculation was performed based on the spatial distribution of director in the cholesteric layer determined by the elastic energy minimization as in case of nematic. The section of defect loop by the plane perpendicular to the defect lines and oriented at 30 to the rubbing direction is shown in Figure 7a. POM images of cholesteric layer with d / p = 0.44 for different β angles between analyzer and rubbing direction were calculated (Figure 7b). It was revealed that the darkest state of optical texture corresponds to the β = 40 far away from the defect. At the same time, the brightest optical texture is observed at β = 50 . The defect line corresponding to the smaller twist angle becomes dark when the analyzer is parallel to this line, i.e., it is parallel to the director on the top substrate. At that, the second defect line becomes dark when the angle between analyzer and wall is approximately 10 . It is explained by the fact that the effective refractive index near the walls has the larger value than that one far away from them. In this case the wavelength of incident light λ = 602 nm does not satisfy the Gooch-Terry minimum condition at large azimuthal twist of the director. As a consequence, the defect line with a large twist angle has the darkest state when the analyzer is not parallel to the director on the top substrate but this line is appreciably brighter than other sample areas at the minimum intensity condition of transmitted light. Spatial distribution of director on the substrate with conical boundary conditions is shown in Figure 7c. The dependence of the azimuthal angle of director rotation φ d on the distance h from the center of the left domain line in Figure 7c has been obtained (Figure 7d, solid line). Besides, the experimentally measured dependence φ d ( h ) using the analyzer rotation method are also shown in Figure 7d. The calculated function φ d ( h ) is in a good agreement with the experimental data.

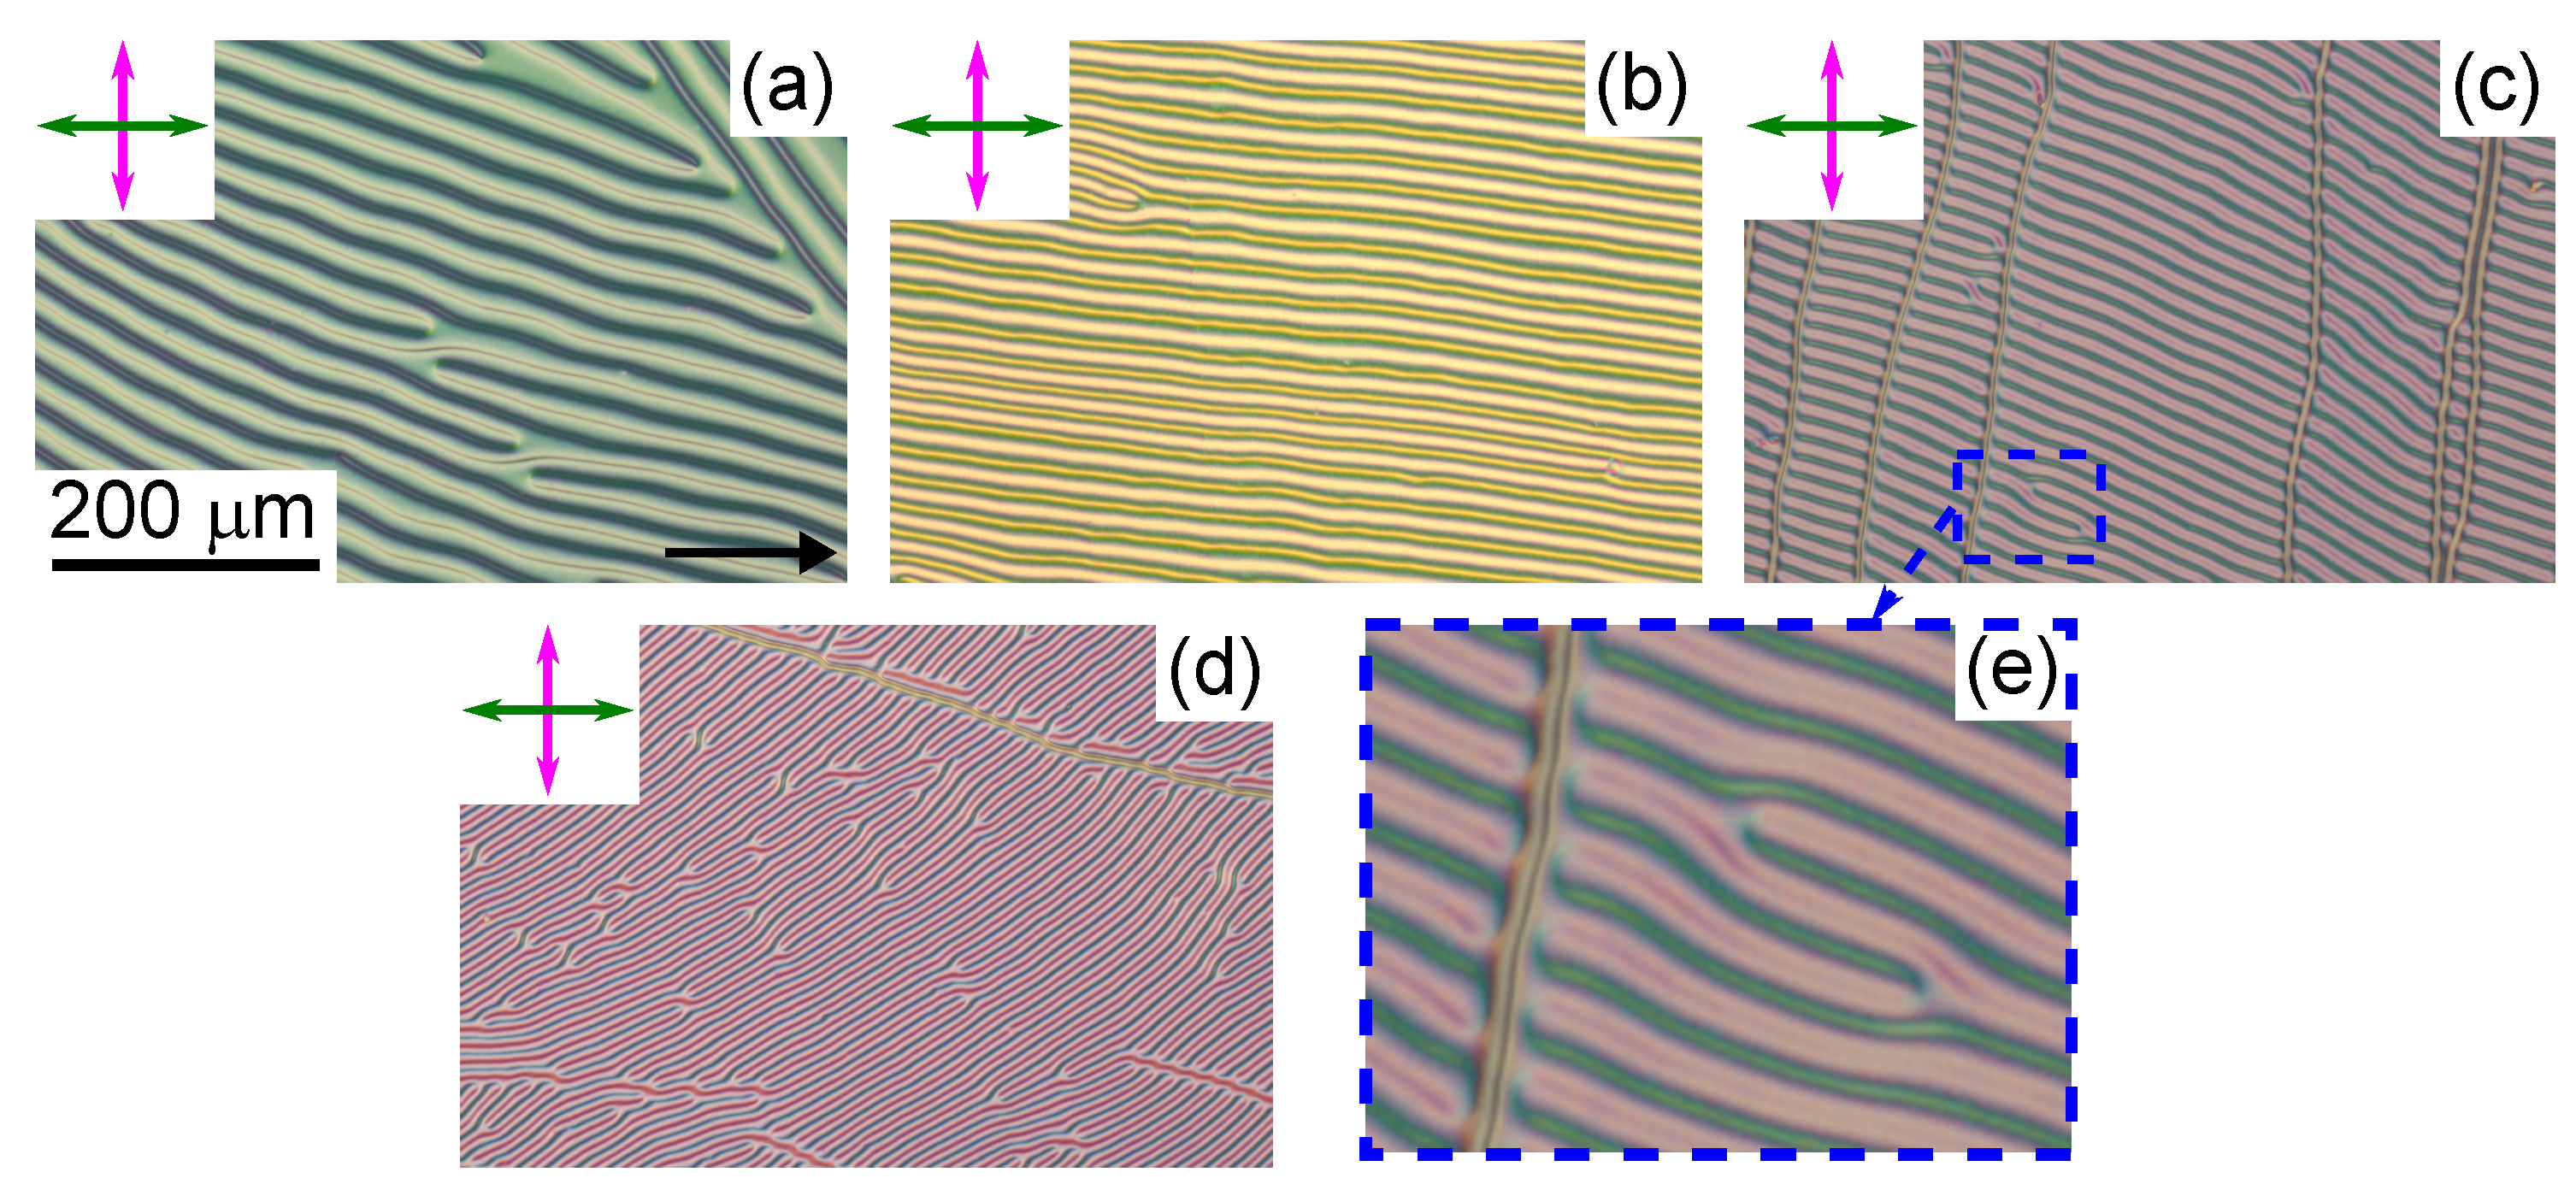
3.3. Periodic Structure

Quasi-periodic structure of defects is formed in the LC cell with d = 6.5 μ m and confinement ratio d / p = 0.44 at the area close to the cell edge (Figure 8a). The azimuthal angle of director rotation φ d on the defect lines differs by π ( π ) and between them φ d has intermediate values (see Supplementary Figure S2). Similar periodic structure is observed through the whole cell area with d / p = 0.60 and in the samples with larger values of confinement ratio (Figure 8b–d). The period of observed structure is about 2p. The periodic structure was formed at similar values of confinement ratios d / p in the LC cells with tangential-weak conical boundary conditions [32], but in that work the period was close to the cholesteric pitch. The disturbance of periodicity of two types can be observed in the samples (Figure 8e). In the first case, the additional couple of defect lines appears leading to the local increasing of period near the region of line bending. In this area one defect line with larger azimuthal twist angle is smoothly transformed into the defect line with a smaller φ d angle. In the second case, some defect lines are formed and their orientation differs from the majority of defect lines. For example, some defect lines are oriented vertically in Figure 8c. The periodic defect lines have 180 turn near these lines and do not intersect them. This way the defect line with larger azimuthal angle of director rotation is modified into line with smaller φ d angle and vice versa.
It should be noted that the formation of defects and their periodic structure depends not only on the confinement ratio d / p but also on the value of cholesteric pitch (the thickness of LC layer). For example, the periodic structure is formed in the LC cell with d / p = 0.60 at d = 6.5 μ m ( p = 10.5 μ m). But the twisted structure similar to the structure observed in LC cell with d = 6.5 μ m and d / p = 0.44 (Figure 6 and Figure 8a) is formed in the sample with LC layer thickness d = 13 μ m ( p = 21 μ m). The twisted structure with 185 azimuthal angle of director rotation containing a small number of defects is formed in the LC cell at d = 21 μ m ( p = 37 μ m). The observed dependence of director configuration on the value of cholesteric pitch (the thickness of LC layer) in LC cells with the same ratio d / p is probably caused by the conical boundary condition on the top substrate. In the system under study the polar anchoring strength of LN-396 on PiBMA is not strong and the tilt angle on this substrate is changed near the defect loop.

4. Conclusions

The orientational structures of nematic and cholesteric LC with the tangential-conical boundary conditions were investigated. The cells with various LC layer thickness d and confinement ratio d / p have been considered. The domain structure was formed in the nematic LC cells containing the areas of positive and negative tilt angle of director at the substrate with conical boundary conditions. The domains were divided by the walls where the tilt angle of director was 0 at both substrates. The monodomain twisted structure without defects was formed in the cholesteric LC cell with d = 6.5 μ m and d / p = 0.28 . At that, the azimuthal angle of director rotation was φ d = 75 at the substrate with conical boundary conditions. Increase of the confinement ratio d / p up to 0.44 led to the appearance of elongated loop defects. These topological defects were characterized by the difference of azimuthal angle of director rotation by ± π at the opposite segments of loop and 0 tilt angle of director at the defect. The periodic structure with a period close to the double cholesteric pitch was formed at d / p 0.60 . The threshold value of d / p to form the periodic structure was relatively small. At the same time, this confinement ratio depended on the LC layer thickness (cholesteric pitch) in contrast to normal boundary conditions [17,18,19]. It was probably caused by the features of asymmetric boundary conditions in the cell.
It was demonstrated that the azimuthal angle φ d of director at the substrate covered with PiBMA depends on the cholesteric pitch p. Consequently, the φ d can be tuned using the different external factors (electric field, temperature, light radiation, etc.) changing p and it is interesting to future research. Besides, the described periodic structures formed in the cholesteric LC cells (Figure 8) have satisfactory quality and can be proposed for the various applications as diffraction gratings. One of the advantages of the CLC diffraction gratings is their tunability. Thus, it is important to investigate the diffraction patterns and their transformations upon application of the external factors to the LC cell.

Supplementary Materials

The following are available at https://www.mdpi.com/2073-4352/9/5/249/s1, Figure S1. POM photos of nematic layer taken using polarized light. The angle between rubbing direction of PVA film and polarizer is 0° (a), 45° (b) and 90° (c). The polarizer direction is indicated by the double arrow and the single arrow is the rubbing direction of PVA film, Figure S2. POM photos of cholesteric layer with confinement ratio d/p = 0.44 are taken using the interference filter (l = 602 nm). The angle between analyzer and rubbing direction of PVA film is −10° (a), −40° (b), −70° (c), 20° (d), 50° (e), 70° (f). Polarizer is perpendicular to the rubbing direction. LC layer thickness is 6.5 mm.

Author Contributions

M.N.K. initiated this study; V.S.S. and M.N.K. performed the experiments and analysed the optical patterns, R.G.B. and I.V.T. performed a simulation of the orientation structures and optical texture, M.N.K. and V.Y.Z. supervised the study. All authors wrote and reviewed the manuscript.

Funding

This work was supported by the Russian Science Foundation (No. 18-72-10036).

Conflicts of Interest

The authors declare no conflict of interest.

References

  1. Oswald, P.; Pieranski, P. Nematic and Cholesteric Liquid Crystals: Concepts and Physical Properties Illustrated by Experiments; The Liquid Crystals Book Series; Taylor & Francis: Boca Raton, FL, USA, 2005. [Google Scholar]
  2. Kim, J.H.; Huh, J.W.; Oh, S.W.; Ji, S.M.; Jo, Y.S.; Yu, B.H.; Yoon, T.H. Bistable switching between homeotropic and focal-conic states in an ion-doped chiral nematic liquid crystal cell. Opt. Express 2017, 25, 29180–29188. [Google Scholar] [CrossRef]
  3. Hsiao, Y.C.; Tang, C.Y.; Lee, W. Fast-switching bistable cholesteric intensity modulator. Opt. Express 2011, 19, 9744–9749. [Google Scholar] [CrossRef] [PubMed]
  4. Il’chishin, I.P.; Tikhonov, E.A.; Tishchenko, V.G.; Shpak, M.T. Generation of tunable radiation by impurity cholesteric liquid crystals. JETP Lett. 1981, 32, 24–27. [Google Scholar]
  5. Kopp, V.I.; Fan, B.; Vithana, H.K.M.; Genack, A.Z. Low-threshold lasing at the edge of a photonic stop band in cholesteric liquid crystals. Opt. Lett. 1998, 23, 1707–1709. [Google Scholar] [CrossRef] [PubMed]
  6. Subacius, D.; Bos, P.J.; Lavrentovich, O.D. Switchable diffractive cholesteric gratings. Appl. Phys. Lett. 1997, 71, 1350–1352. [Google Scholar] [CrossRef]
  7. Subacius, D.; Shiyanovskii, S.V.; Bos, P.; Lavrentovich, O.D. Cholesteric gratings with field-controlled period. Appl. Phys. Lett. 1997, 71, 3323–3325. [Google Scholar] [CrossRef]
  8. Senyuk, B.I.; Smalyukh, I.I.; Lavrentovich, O.D. Switchable two-dimensional gratings based on field-induced layer undulations in cholesteric liquid crystals. Opt. Lett. 2005, 30, 349. [Google Scholar] [CrossRef]
  9. Ryabchun, A.; Bobrovsky, A.; Stumpe, J.; Shibaev, V. Rotatable Diffraction Gratings Based on Cholesteric Liquid Crystals with Phototunable Helix Pitch. Adv. Opt. Mater. 2015, 3, 1273–1279. [Google Scholar] [CrossRef]
  10. Lin, C.H.; Chiang, R.H.; Liu, S.H.; Kuo, C.T.; Huang, C.Y. Rotatable diffractive gratings based on hybrid-aligned cholesteric liquid crystals. Opt. Express 2012, 20, 26837. [Google Scholar] [CrossRef] [PubMed]
  11. Liu, C.K.; Chiu, C.Y.; Morris, S.M.; Tsai, M.C.; Chen, C.C.; Cheng, K.T. Optically Controllable Linear-Polarization Rotator Using Chiral-Azobenzene-Doped Liquid Crystals. Materials 2017, 10, 1299. [Google Scholar] [CrossRef]
  12. Varney, M.C.M.; Zhang, Q.; Senyuk, B.; Smalyukh, I.I. Self-assembly of colloidal particles in deformation landscapes of electrically driven layer undulations in cholesteric liquid crystals. Phys. Rev. E 2016, 94, 042709. [Google Scholar] [CrossRef]
  13. Dierking, I. Textures of Liquid Crystals; Wiley-VCH: Weinheim, Germany, 2003. [Google Scholar]
  14. Ma, L.L.; Li, S.S.; Li, W.S.; Ji, W.; Luo, B.; Zheng, Z.G.; Cai, Z.P.; Chigrinov, V.; Lu, Y.Q.; Hu, W.; et al. Rationally Designed Dynamic Superstructures Enabled by Photoaligning Cholesteric Liquid Crystals. Adv. Opt. Mater. 2015, 3, 1691–1696. [Google Scholar] [CrossRef]
  15. Zheng, Z.G.; Li, Y.; Bisoyi, H.K.; Wang, L.; Bunning, T.J.; Li, Q. Three-dimensional control of the helical axis of a chiral nematic liquid crystal by light. Nature 2016, 531, 352–356. [Google Scholar] [CrossRef] [PubMed]
  16. Nys, I.; Chen, K.; Beeckman, J.; Neyts, K. Periodic Planar-Homeotropic Anchoring Realized by Photoalignment for Stabilization of Chiral Superstructures. Adv. Opt. Mater. 2018, 6, 1701163. [Google Scholar] [CrossRef]
  17. Zel’dovich, B.Y.; Tabiryan, N.V. Freedericksz transition in cholesteric liquid crystals without external fields. JETP Lett. 1981, 34, 406–408. [Google Scholar]
  18. Cladis, P.E.; Kléman, M. The Cholesteric Domain Texture. Mol. Cryst. Liq. Cryst. 1972, 16, 1–20. [Google Scholar] [CrossRef]
  19. Goossens, W.J.A. The influence of homeotropic and planar boundary conditions on the field induced cholesteric-nematic transition. J. Phys. 1982, 43, 1469–1474. [Google Scholar] [CrossRef]
  20. Oswald, P.; Baudry, J.; Pirkl, S. Static and dynamic properties of cholesteric fingers in electric field. Phys. Rep. 2000, 337, 67–96. [Google Scholar] [CrossRef]
  21. Varanytsia, A.; Posnjak, G.; Mur, U.; Joshi, V.; Darrah, K.; Muševič, I.; Čopar, S.; Chien, L.C. Topology-commanded optical properties of bistable electric-field-induced torons in cholesteric bubble domains. Sci. Rep. 2017, 7, 16149. [Google Scholar] [CrossRef] [Green Version]
  22. Ackerman, P.J.; Qi, Z.; Smalyukh, I.I. Optical generation of crystalline, quasicrystalline, and arbitrary arrays of torons in confined cholesteric liquid crystals for patterning of optical vortices in laser beams. Phys. Rev. E 2012, 86, 021703. [Google Scholar] [CrossRef]
  23. Ackerman, P.J.; Trivedi, R.P.; Senyuk, B.; van de Lagemaat, J.; Smalyukh, I.I. Two-dimensional skyrmions and other solitonic structures in confinement-frustrated chiral nematics. Phys. Rev. E 2014, 90, 012505. [Google Scholar] [CrossRef] [PubMed]
  24. Kim, Y.H.; Gim, M.J.; Jung, H.T.; Yoon, D.K. Periodic arrays of liquid crystalline torons in microchannels. RSC Adv. 2015, 5, 19279–19283. [Google Scholar] [CrossRef]
  25. Nys, I.; Beeckman, J.; Neyts, K. Surface-Mediated Alignment of Long Pitch Chiral Nematic Liquid Crystal Structures. Adv. Opt. Mater. 2018, 6, 1800070. [Google Scholar] [CrossRef]
  26. Andrienko, D. Introduction to liquid crystals. J. Mol. Liq. 2018, 267, 520–541. [Google Scholar] [CrossRef]
  27. Belyaev, S.V.; Rumyantsev, V.G.; Belyaev, V.V. Optical and electro-optical properties of confocal cholesteric textures. JETP 1977, 46, 337–340. [Google Scholar]
  28. Belyaev, S.V.; Blinov, L.M. Instability of planar texture of a cholesteric liquid crystal in an electric field. JETP 1976, 43, 96–99. [Google Scholar]
  29. Nose, T.; Miyanishi, T.; Aizawa, Y.; Ito, R.; Honma, M. Rotational Behavior of Stripe Domains Appearing in Hybrid Aligned Chiral Nematic Liquid Crystal Cells. Jpn. J. Appl. Phys. 2010, 49, 051701. [Google Scholar] [CrossRef]
  30. Kumar, T.A.; Le, K.V.; Aya, S.; Kang, S.; Araoka, F.; Ishikawa, K.; Dhara, S.; Takezoe, H. Anchoring transition in a nematic liquid crystal doped with chiral agents. Phase Transit. 2012, 85, 888–899. [Google Scholar] [CrossRef]
  31. Tran, L.; Lavrentovich, M.O.; Durey, G.; Darmon, A.; Haase, M.F.; Li, N.; Lee, D.; Stebe, K.J.; Kamien, R.D.; Lopez-Leon, T. Change in Stripes for Cholesteric Shells via Anchoring in Moderation. Phys. Rev. X 2017, 7, 041029. [Google Scholar] [CrossRef]
  32. Zola, R.S.; Evangelista, L.R.; Yang, Y.C.; Yang, D.K. Surface Induced Phase Separation and Pattern Formation at the Isotropic Interface in Chiral Nematic Liquid Crystals. Phys. Rev. Lett. 2013, 110, 057801. [Google Scholar] [CrossRef] [PubMed]
  33. Krakhalev, M.N.; Prishchepa, O.O.; Sutormin, V.S.; Zyryanov, V.Y. Director configurations in nematic droplets with tilted surface anchoring. Liq. Cryst. 2017, 44, 355–363. [Google Scholar] [CrossRef]
  34. Rudyak, V.Y.; Krakhalev, M.N.; Prishchepa, O.O.; Sutormin, V.S.; Emelyanenko, A.V.; Zyryanov, V.Y. Orientational structures in nematic droplets with conical boundary conditions. JETP Lett. 2017, 106, 384–389. [Google Scholar] [CrossRef]
  35. Rudyak, V.Y.; Krakhalev, M.N.; Sutormin, V.S.; Prishchepa, O.O.; Zyryanov, V.Y.; Liu, J.H.; Emelyanenko, A.V.; Khokhlov, A.R. Electrically induced structure transition in nematic liquid crystal droplets with conical boundary conditions. Phys. Rev. E 2017, 96, 052701. [Google Scholar] [CrossRef]
  36. Timofeev, I.V.; Lin, Y.T.; Gunyakov, V.A.; Myslivets, S.A.; Arkhipkin, V.G.; Vetrov, S.Y.; Lee, W.; Zyryanov, V.Y. Voltage-induced defect mode coupling in a one-dimensional photonic crystal with a twisted-nematic defect layer. Phys. Rev. E 2012, 85, 011705. [Google Scholar] [CrossRef] [PubMed]
  37. Merck E7 Liquid Crystal Datasheet; Merck KGaA: Darmstadt, Germany, 2001.
  38. Raynes, E.P.; Brown, C.V.; Strömer, J.F. Method for the measurement of the K22 nematic elastic constant. Appl. Phys. Lett. 2003, 82, 13–15. [Google Scholar] [CrossRef]
  39. Vilanove, R.; Guyon, E.; Mitescu, C.; Pieranski, P. Mesure de la conductivité thermique et détermination de l’orientation des molécules a l’interface nématique isotrope de MBBA. J. Phys. 1974, 35, 153–162. [Google Scholar] [CrossRef]
  40. Gilli, J.; Morabito, M.; Frisch, T. Ising-Bloch transition in a nematic liquid crystal. J. Phys. II 1994, 4, 319–331. [Google Scholar] [CrossRef]
  41. Yeh, P.; Gu, C. Optics of Liquid Crystal Displays; Wiley Series in Pure and Applied Optics; Wiley: New York, NY, USA, 1999. [Google Scholar]
  42. Ryschenkow, G.; Kleman, M. Surface defects and structural transitions in very low anchoring energy nematic thin films. J. Chem. Phys. 1976, 64, 404–412. [Google Scholar] [CrossRef]
  43. Gooch, C.H.; Tarry, H.A. The optical properties of twisted nematic liquid crystal structures with twist angles ≤ 90 degrees. J. Phys. D Appl. Phys. 1975, 8, 1575–1584. [Google Scholar] [CrossRef]
Figure 1. Scheme of conical surface anchoring of director n with the substrate. θ and φ are the tilt and azimuthal angles, respectively.
Crystals 09 00249 g001
Figure 2. POM photo of LN-396 nematic layer with PiBMA film on the top substrate ( z = d ) and rubbed PVA film on the bottom one ( z = 0 ) (a); The scheme of LC orientation in domains with tilt angle of director + θ d and θ d on the PiBMA film (b). The LC layer thickness is d = 21 μ m. Hereinafter, the polarizer and analyzer directions are indicated by the magenta and green double arrows, respectively. The single arrow is the rubbing direction of PVA film.
Crystals 09 00249 g002
Figure 3. POM photos of sample area presented in Figure 2. The polarizer is perpendicular to the rubbing direction of PVA film. The β angle between the analyzer and rubbing direction is 0 (a), −20 (b), −30 (c), −50 (d), 20 (e), 50 (f), 70 (g), 90 (h). Corresponding scheme of director orientation at the top substrate covered with PiBMA (i). The POM photos show 380 × 380 μ m area. The domain wall is indicated by the red line. The angle φ d is an azimuthal angle of director at the top substrate.
Crystals 09 00249 g003
Figure 4. The calculated director configuration of a nematic in the cross-section of the layer near the domain wall (a); The image of segment of domain wall for different β angles between analyzer and rubbing direction obtained by the FDTD method (b); The director orientation near the domain wall on the substrate covered with PiBMA film (c); The theoretically calculated (solid line) and experimentally measured (points) dependences of the azimuthal angle of director rotation φ d on the distance h from the center of the domain wall (d). The LC layer thickness is d = 21 μ m.
Crystals 09 00249 g004
Figure 5. POM photos of cholesteric layers with confinement ratio d / p = 0.14 (a,c) and d / p = 0.28 (b,d). Calculated dependences of tilt angle θ ( z ) (solid lines), azimuthal angle φ ( z ) (dashed lines) (e) and corresponding dependences of ellipticity angle ε ( z ) (f) for the samples with d / p = 0.14 (orange line), d / p = 0.28 (green line) and d / p = 0.44 (magenta line). POM photos are taken using white light when β angle between analyzer and rubbing direction of PVA film is 0 (a,b). POM photos are taken using the interference filter ( λ = 602 nm) when β angle is 37 (c) and 75 (d). Polarizer is perpendicular to the rubbing direction. LC layer thicknesses are 6.5 μ m.
Crystals 09 00249 g005
Figure 6. POM photos of cholesteric layer with confinement ratio d / p = 0.44 are taken using the interference filter ( λ = 602 nm). The angle β between analyzer and rubbing direction of PVA film is 0 (a); The magnified area of 90 × 65 μ m of loop at different β angles (b). Polarizer is perpendicular to the rubbing direction. LC layer thickness is 6.5 μ m.
Crystals 09 00249 g006
Figure 7. Calculated director configuration in the section perpendicular to the cell substrates and lines of defect (a); Simulated POM image of the area with couple of defects at different values of β angle between the analyzer and rubbing direction (b); The director orientation near the defect on the substrate covered with PiBMA (c); The theoretically calculated (solid line) and experimentally measured (points) dependences of the azimuthal angle of director rotation φ d on the distance h from the center of the left domain line (d). The polarizer is perpendicular to the rubbing direction on the simulated POM image. LC layer thickness is 6.5 μ m and confinement ratio is d / p = 0.44 .
Crystals 09 00249 g007
Figure 8. POM photos of cholesteric layers with confinement ratios d / p : 0.44 (a), 0.60 (b), 0.78 (c) and 0.88 (d). The magnified area of 100 × 70 μ m with two types of defects of periodic structure at d / p = 0.78 (e). POM photos (ad) have the same scale. LC layer thicknesses are 6.5 μ m.
Crystals 09 00249 g008
Table 1. The theoretically calculated ( φ d c a l c ) and experimentally measured ( φ d e x p ) values of the azimuthal angle of director rotation at the substrate covered with PiBMA in the LC cells with d / p = 0.14, 0.28, 0.44.
d / p φ d calc φ d exp
0.14 41.3 37 ± 3
0.28 80.3 75 ± 3
0.44 140.0 140 ± 5

