Improving Linear Range Limitation of Non-Enzymatic Glucose Sensor by OH− Concentration
by
 , and
, and
Lory Wenjuan Yang
, 
Elton Enchong Liu
,
Alex Fan Xu
,
Jason Yuanzhe Chen
,
Ryan Taoran Wang
* and
Gu Xu
* 
Department of Materials Science and Engineering, McMaster University, 1280 Main St. W, Hamilton, ON L8S 4L8, Canada
*
Authors to whom correspondence should be addressed.
Crystals 2020, 10(3), 186; https://doi.org/10.3390/cryst10030186
Submission received: 16 February 2020
/
Revised: 3 March 2020
/
Accepted: 7 March 2020
/
Published: 9 March 2020
(This article belongs to the Special Issue Organic Inorganic Hybrid Perovskite Solar Cells)
Abstract
:The linear range of the non-enzymatic glucose sensor is usually much smaller than the glucose level of diabetic patients, calling for an effective solution. Despite many previous attempts, none have solved the problem. Such a challenge has now been conquered by raising the NaOH concentration in the electrolyte, where amperometry, X-ray diffraction, Fourier-transform infrared spectroscopy, and Nuclear magnetic resonance measurements have been conducted. The linear range has been successfully enhanced to 40 mM in 1000 mM NaOH solution, and it was also found that NaOH affected the degree of glucose oxidation, which influenced the current response during sensing. It was expected that the alkaline concentration must be 25 times higher than the glucose concentration to enhance the linear range, much contrary to prior understanding.
1. Introduction
As a long-term metabolic disease, diabetes may lead to serious complications including cardiovascular diseases, hearing impairment, nerve damage, and kidney damage, etc. [1]. According to the World Health Organization (WHO), there are more than 420 million diabetic patients globally, which causes over one million deaths every year [2,3]. To monitor the glucose level, patients have to detect their blood glucose constantly by invasive enzyme test-strips, which dominate the market currently [4]. Although the result of enzymatic test-strips is accurate; they have many limitations, the most critical of which is their requirement on humidity and temperature [4,5,6,7]. This is caused by the presence of enzyme, which inspired the researchers to focus on non-enzymatic glucose sensing, due to the advantage of easy operation, fast response and low cost [8,9,10,11].
While a non-enzymatic glucose sensor demonstrates many benefits; their measurement range is limited to up to several mmol/L(mM), which is much smaller than the blood glucose level of diabetic patients (1–30 mM) [12,13]. During glucose sensing, the current response first enters a linear range where a linear relationship between the current response and glucose concentration can be expected [14,15]. Next, a non-linear relationship is observed, dubbed non-linear range, during which the relationship between the current response and glucose concentration is unpredictable. Eventually, the current reaches saturation point, beyond which the current response starts to decrease. During the linear range, the glucose level could easily be extracted by the linear relationship and the saturation point is the highest glucose level that the sensor could detect. Although the current could increase along with the glucose level in the range between the linear range and the saturation, i.e., non-linear range, such a range is not useful as the saturation is not fixed. Therefore, the glucose concentration can only be extracted by the current response in the linear range, which leaves the challenge of raising the linear range [14].
A huge number of techniques have been attempted to raise the linear range. Some researchers believed that the linear range was limited by the working potential [16]. By changing the ratio of Pt, Au and Pd metal elements, the working potential was adjusted from 0.45 V vs. Saturated calomel electrode (SCE) to 0.4 V vs. SCE, but the linear range of the measurement was basically unchanged (from 1.5 μM–8 mM to 1μM–8.5 mM) [17]. On the other hand, the others thought this problem was related to the specific surface area of the electrode [18,19,20,21,22]. Mian Li et al. synthesized an electrode of 3D nanostructure with a large specific surface area; but the linear range (50 μM–8 mM) didn’t increase to any appreciable level [23]. This indicated that the reason that limited the linear range had to be uncovered in order to find an effective strategy, as all the previous blind trials could not solve this problem.
It was, therefore, the purposes of the current paper to find out what restricted the linear range and raise this range to the needed level. Employing amperometry, infrared spectroscopy, and nuclear magnetic resonance spectroscopy; the influence of hydroxide ion concentration was found, which had to be 25 times higher than that of the glucose. This high OH− concentration enabled the formation of enediol, which lowered the energy barrier of the subsequent electro-oxidation reaction so that more than four electrons were transferred to the cathode. Meanwhile, the final product was glucuronate, instead of gluconolactone. This increased the current response and raised the linear range to 40 mM. The real cause of the limited linear range revealed by us could not only advance the conceptual understanding of the non-enzymatic glucose sensor working mechanism, but also differentiated various hypotheses and conflict. Hopefully, these discoveries are able to improve the sensor performance, and accelerate its commercialization.
2. Experimental
NaOH pellets (ACS reagent, ≥ 99.0%) were purchased from E-Merck. Dextrose (99.0%, SRL, India) and 5 wt% Nafion solution (Sigma-Aldrich) were adopted for all electrochemical analyses. Deionized water (DI water) (Molecular Biology Reagent, purchased from Sigma-Aldrich, Mississauga, ON, Canada), ethanol (95.0%, Sigma-Aldrich, Mississauga, ON, Canada) and acetone (95.0%, Sigma-Aldrich, Mississauga, ON, Canada) were adopted as the solvents. Ni(NO3)2·6H2O, KBr, Ni sheet (0.05 mm thick) and D2O (analytical reagent grade) were purchased from Sigma-Aldrich.
Ni(OH)2 powders were synthesized by the method proposed in the literature [24]. Concentrated sodium hydroxide solution was dropped into a 1-M Ni(NO3)2 solution. The precipitation reaction occurred under 700 rpm stirring at 45 °C. The green precipitate of Ni (OH)2 powder was filtered, dried, and washed with DI water several times to remove any impurities. The precipitate was next dried in air. Subsequently, a homogeneous suspension liquid of Ni(OH)2 sample was obtained by sonicating the powder in several drops of 95% ethanol. Next, the suspension liquid was dropped on the Ni sheet as an electrode, after which 0.5% Nafion binder solution was dropped on the sample layer to glue the material. Finally, the electrode was air-dried before the measurements.
The electrode was characterized by powder XRD (Bruker D8 DISCOVER diffractometer, Bruker Corporation, Billerica, MA, USA). The three-electrode electrochemical cell was used to monitor glucose levels. Ag/AgCl (saturated KCl solution) was used as a reference electrode, although some reference electrodes would be affected by alkaline electrolyte such as Saturated calomel electrode (SCE); Ag/AgCl reference electrode is stable in alkaline electrolyte [25]. Ni(OH)2/Ni sheet was the working electrode, and Au wire was the counter electrode. All the measurements were carried out on a CMS100 electrochemical workstation (purchased from The Illinois Department of Central Management Services, Springfield, IL, USA) at room temperature. Amperometry I-t responses at an applied potential of +0.55 V vs. Ag/AgCl reference electrode (for 0.1 mM NaOH solution) and +0.5 V (for 0.5 M and 1 M NaOH solution) were recorded under stirring at 350 rpm. The area of Ni (OH)2 on the Ni sheet was 1.2 × 0.15 cm2. Nicolet 6700 FT-IR spectrometer (Thermo Fisher, Waltham, MA, USA) was used to acquire the FTIR spectra in the wavenumber range of 400–4000 cm−1. 13C NMR was recorded on Bruker DRX-500 MHz spectrometers (Bruker Corporation, Billerica, MA, USA) with a frequency of 125.78 MHz at room temperature, analyzed by Bruker Topspin 3.1 (Bruker Corporation, Billerica, MA, USA).
3. Results and Discussion
3.1. X-ray Diffraction (XRD) Measurement of Ni(OH)2/Ni Sheet
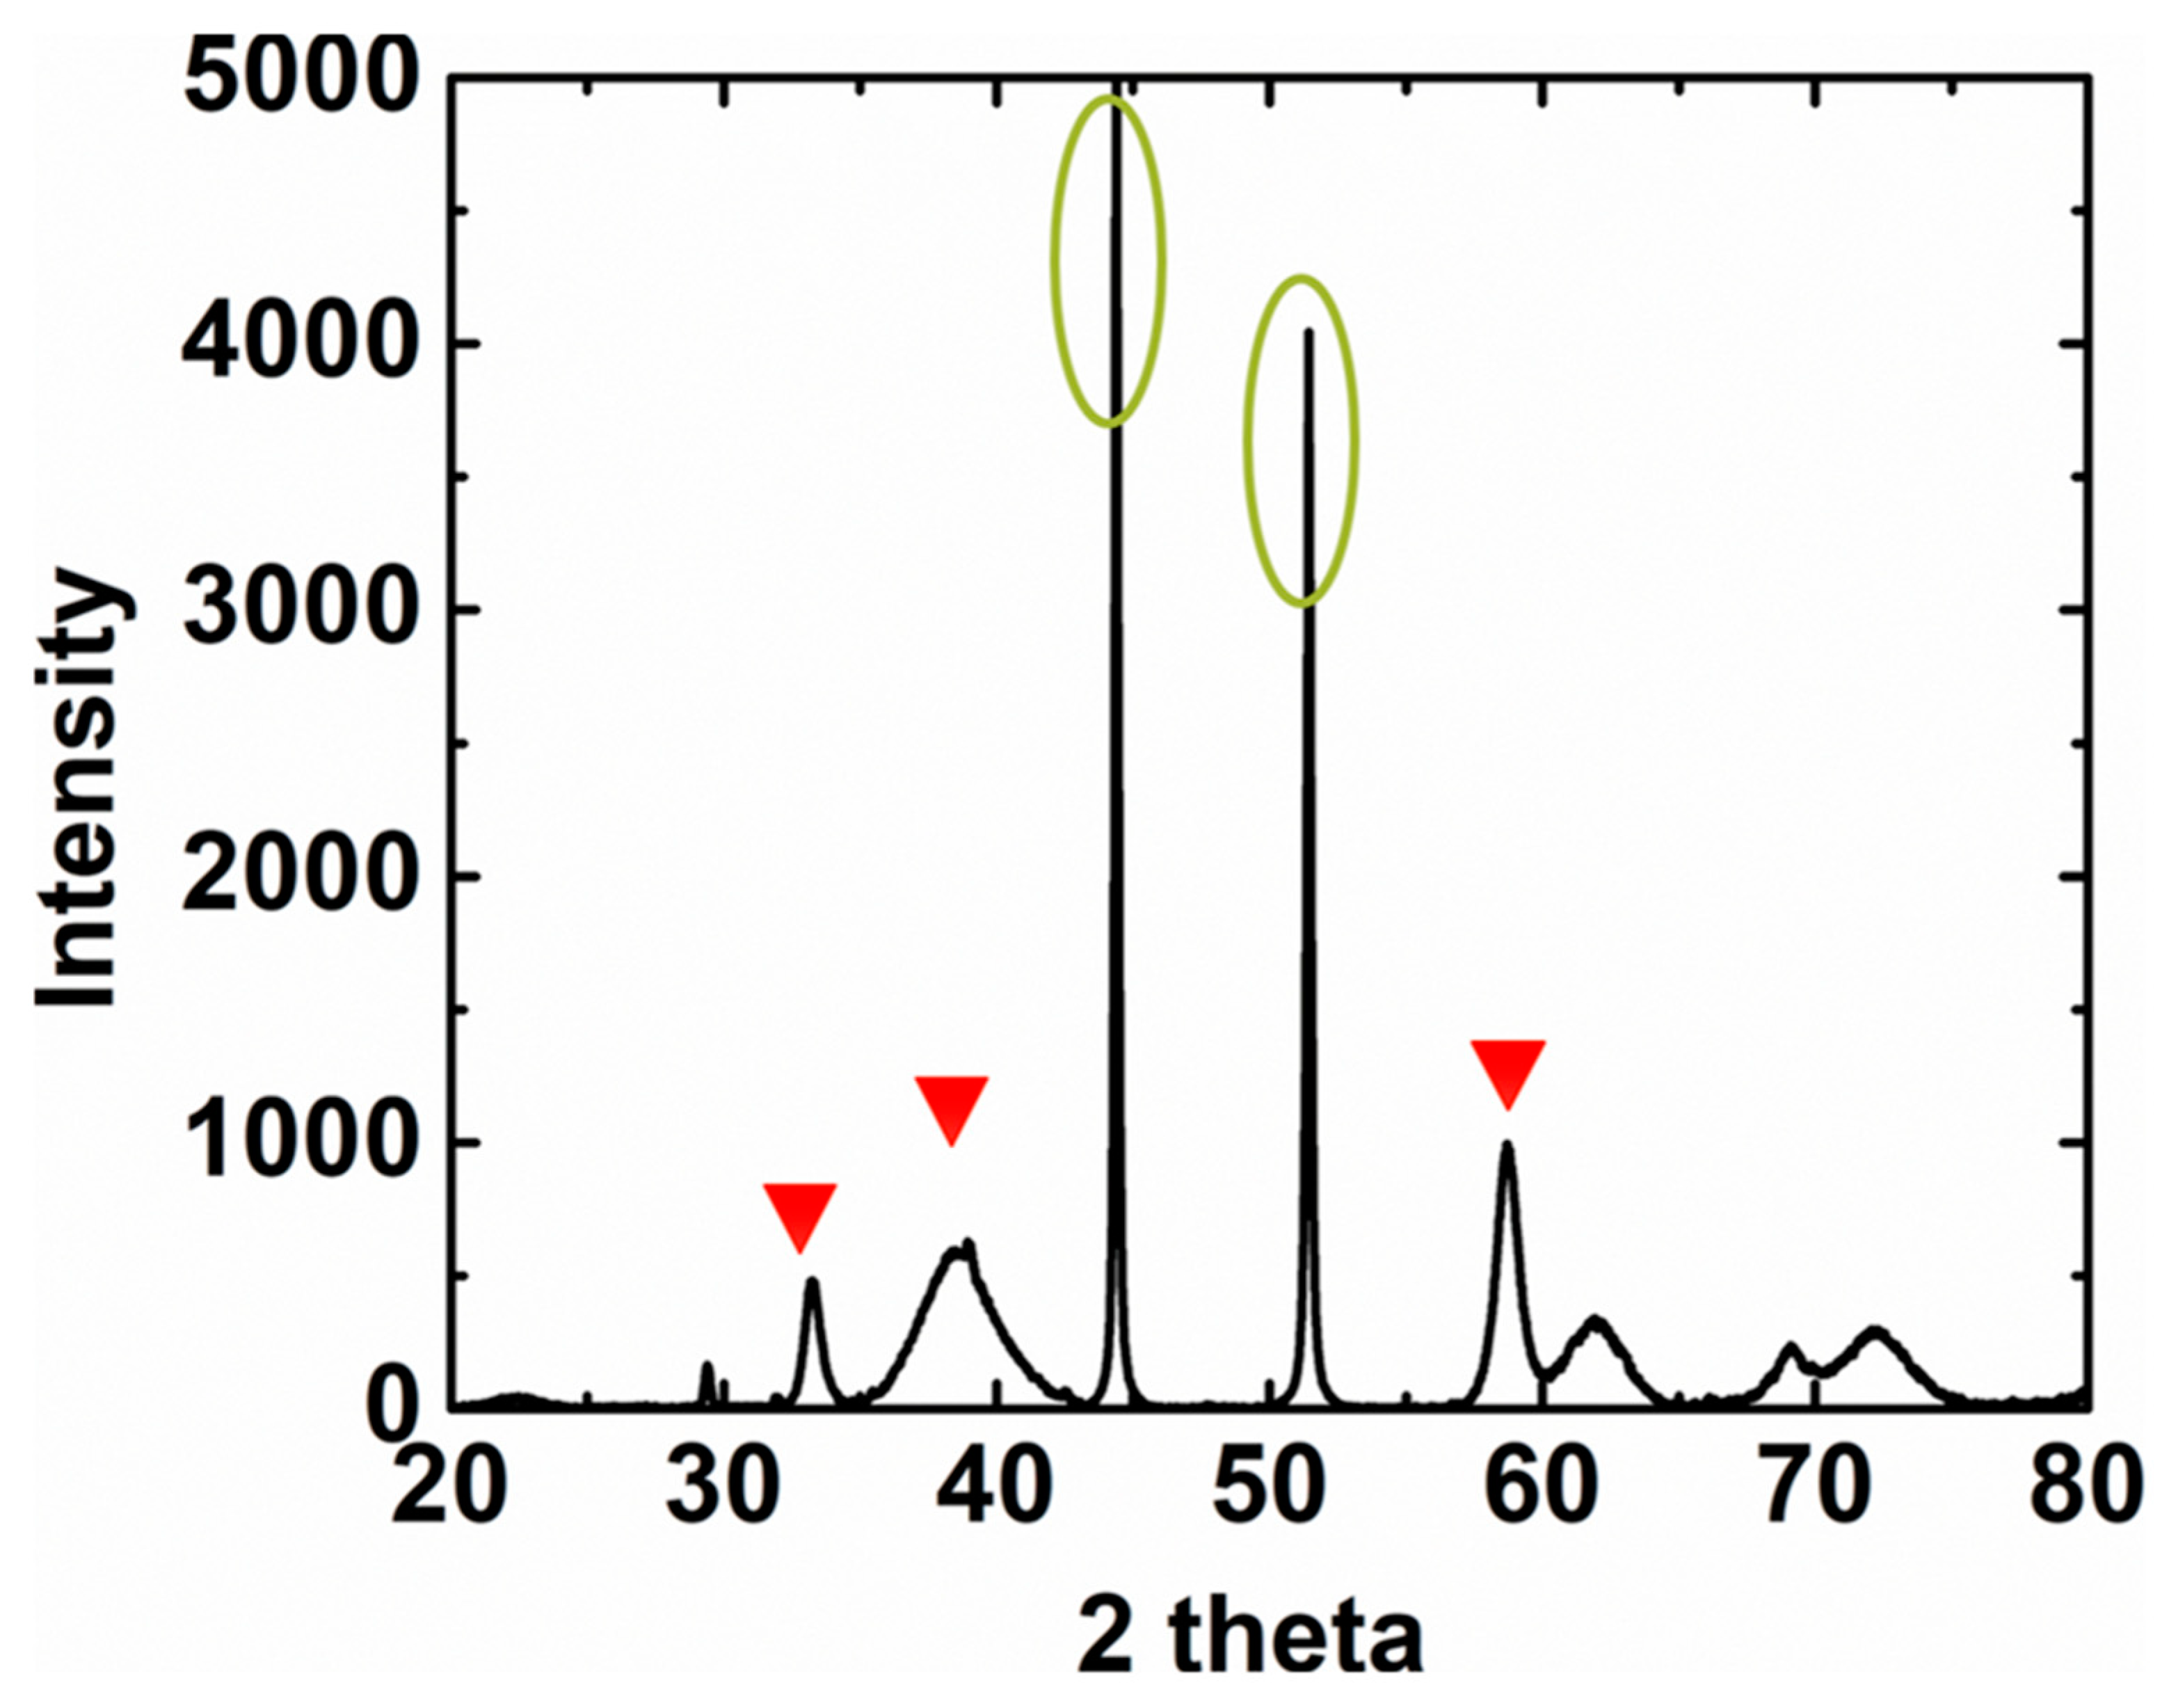
The working electrode was characterized first by XRD, which confirmed the formation of Ni(OH)2 on the Ni sheet, as demonstrated in Figure 1.
3.2. Electrooxidation of Glucose on Ni(OH)2/Ni Sheet
To investigate the influence of the alkaline concentration on the linear range, I-t measurements were conducted. In Figure 2a–c, a typical amperometric response of the Ni(OH)2/Ni sheet upon the successive addition of a certain concentration of glucose into 0.1 mM, 500 mM and 1000 mM NaOH solution stirred at 350 rpm is shown. Figure 2d–f shows the calibration curve of the Ni(OH)2/Ni sheet electrode, revealing a good linear detection ranging from 21.67 μM to 4 mM (R2 = 0.9905) in 100 mM NaOH solution, from 7.40 μM to 20 mM (R2 = 0.9955) in 500 mM NaOH solution, and from 39.98 μM to 40 mM (R2 = 0.9949) in 1000 mM NaOH solution. By a signal-to-noise ratio of 3, the detection limits (LOD) were estimated to be 7.15 μM, 2.44 μM, and 13.19 μM, respectively. Besides, it was found that the linear range was successfully increased to 40 mM in 1000 mM NaOH solution. More importantly, the ratio of the highest point of the linear range and OH− concentration was fixed at around 25, which meant the linear range could be enhanced by raising the OH− concentration.
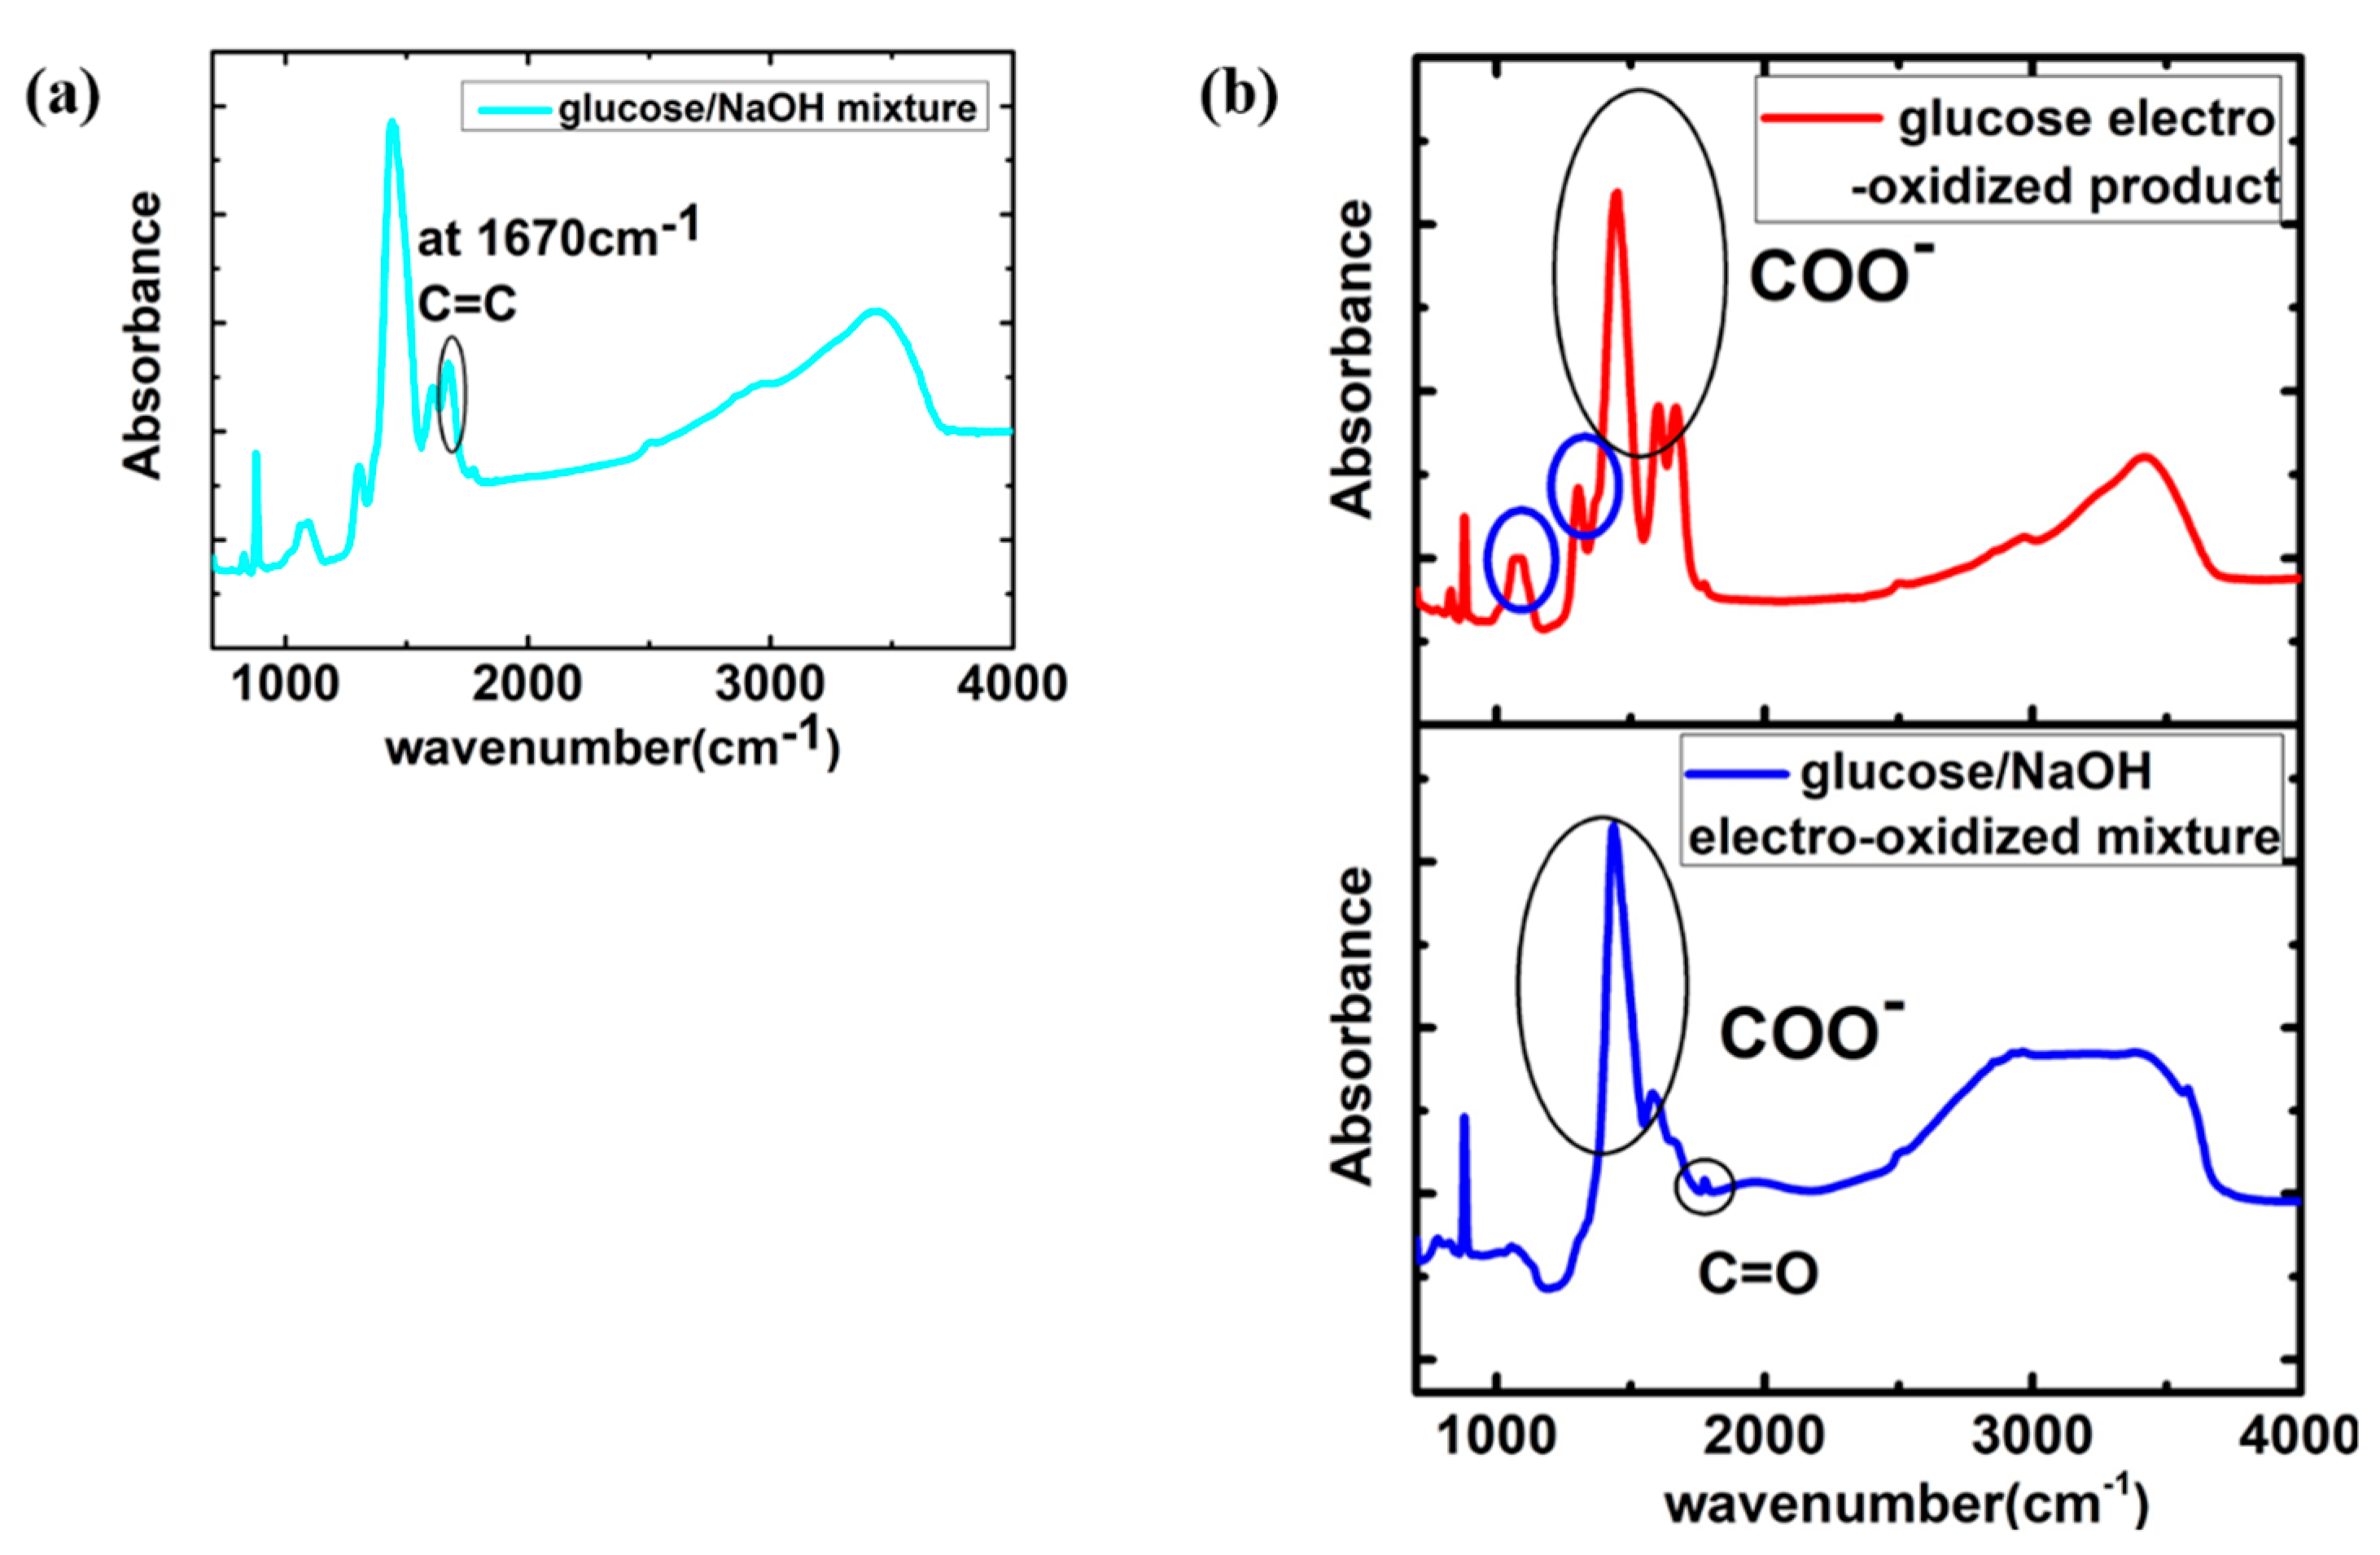
Clearly, OH− affected the glucose electro-oxidation reaction, which needed further investigation by FTIR measurements. The pure glucose electro-oxidized product, glucose/NaOH mixture, and glucose/NaOH electro-oxidized mixture were measured by FTIR. As shown in Figure 3a, the peak of C=C double bond was detected in the glucose/NaOH mixture at 1670 cm−1 [26], which indicated the formation of enediol [27]. This means glucose reacted with NaOH before the electro-oxidation. In addition, the disappearance of the peak at 1080 cm−1 and 1350cm−1 in glucose/NaOH electro-oxidized mixture in Figure 3b proved that the electro-oxidation product was not gluconate, which indicated that more than four electrons were transferred to the cathode [28,29,30,31]. This was beneficial for the glucose sensing.
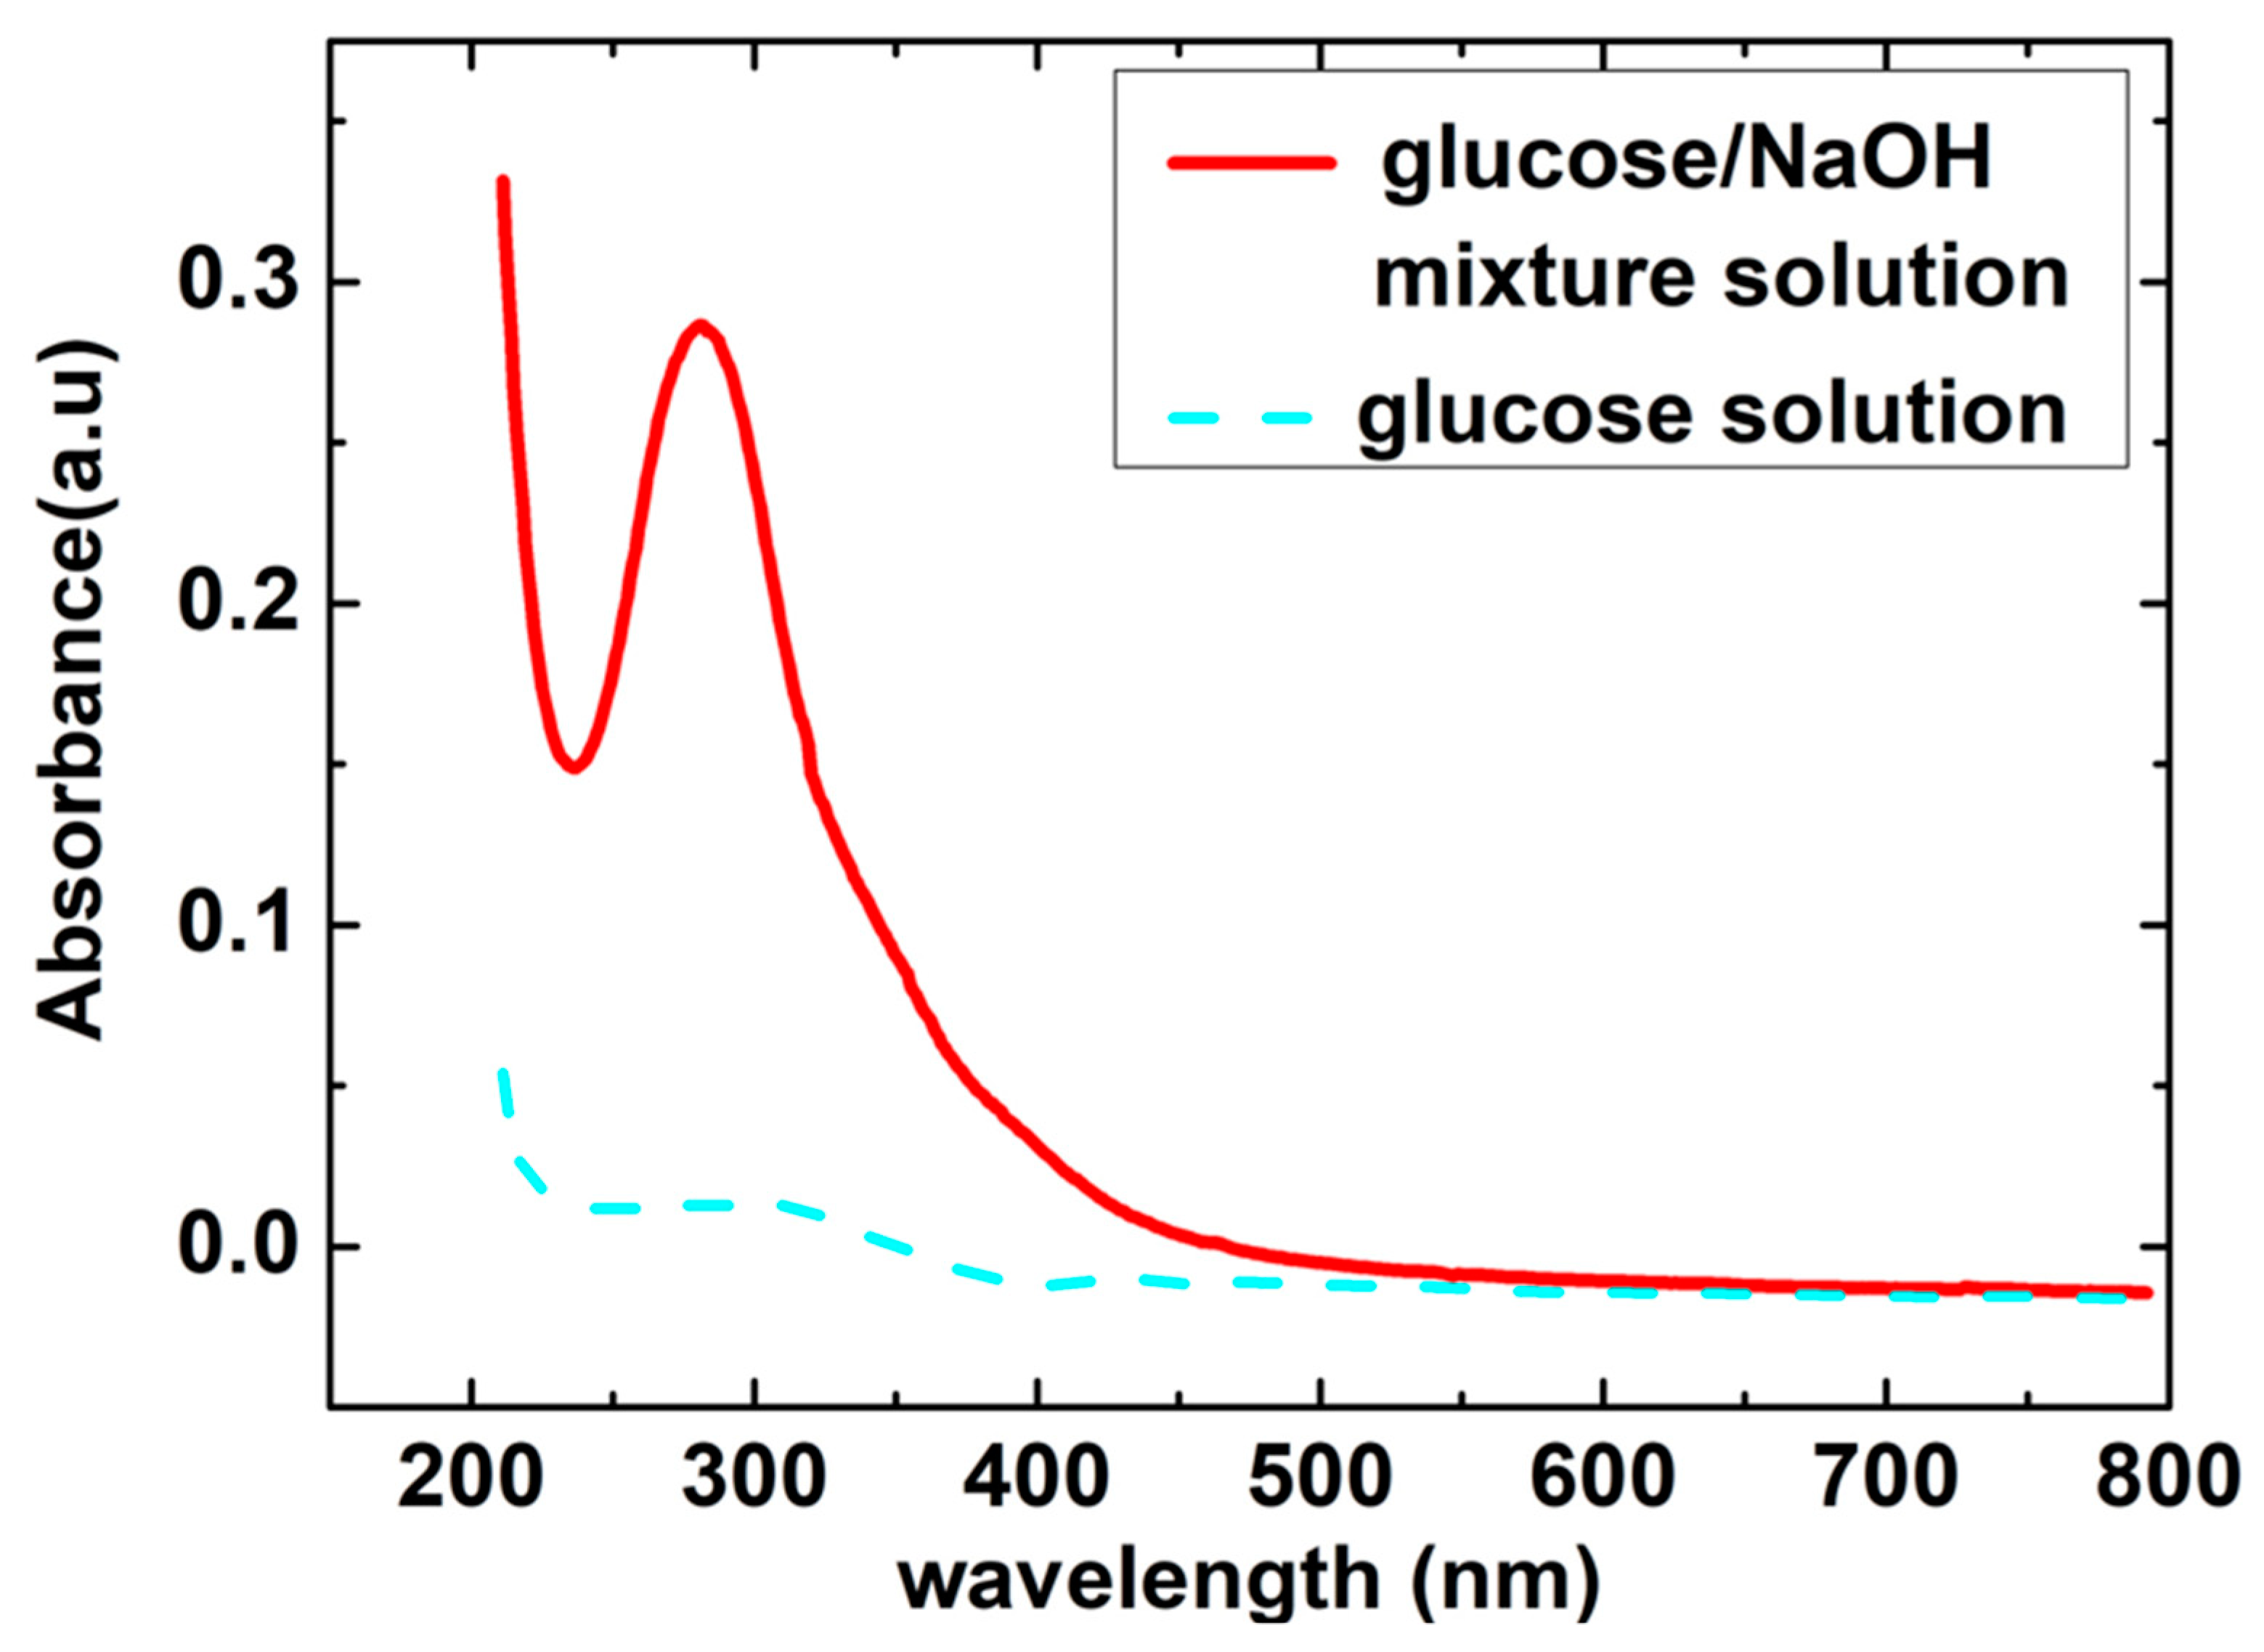
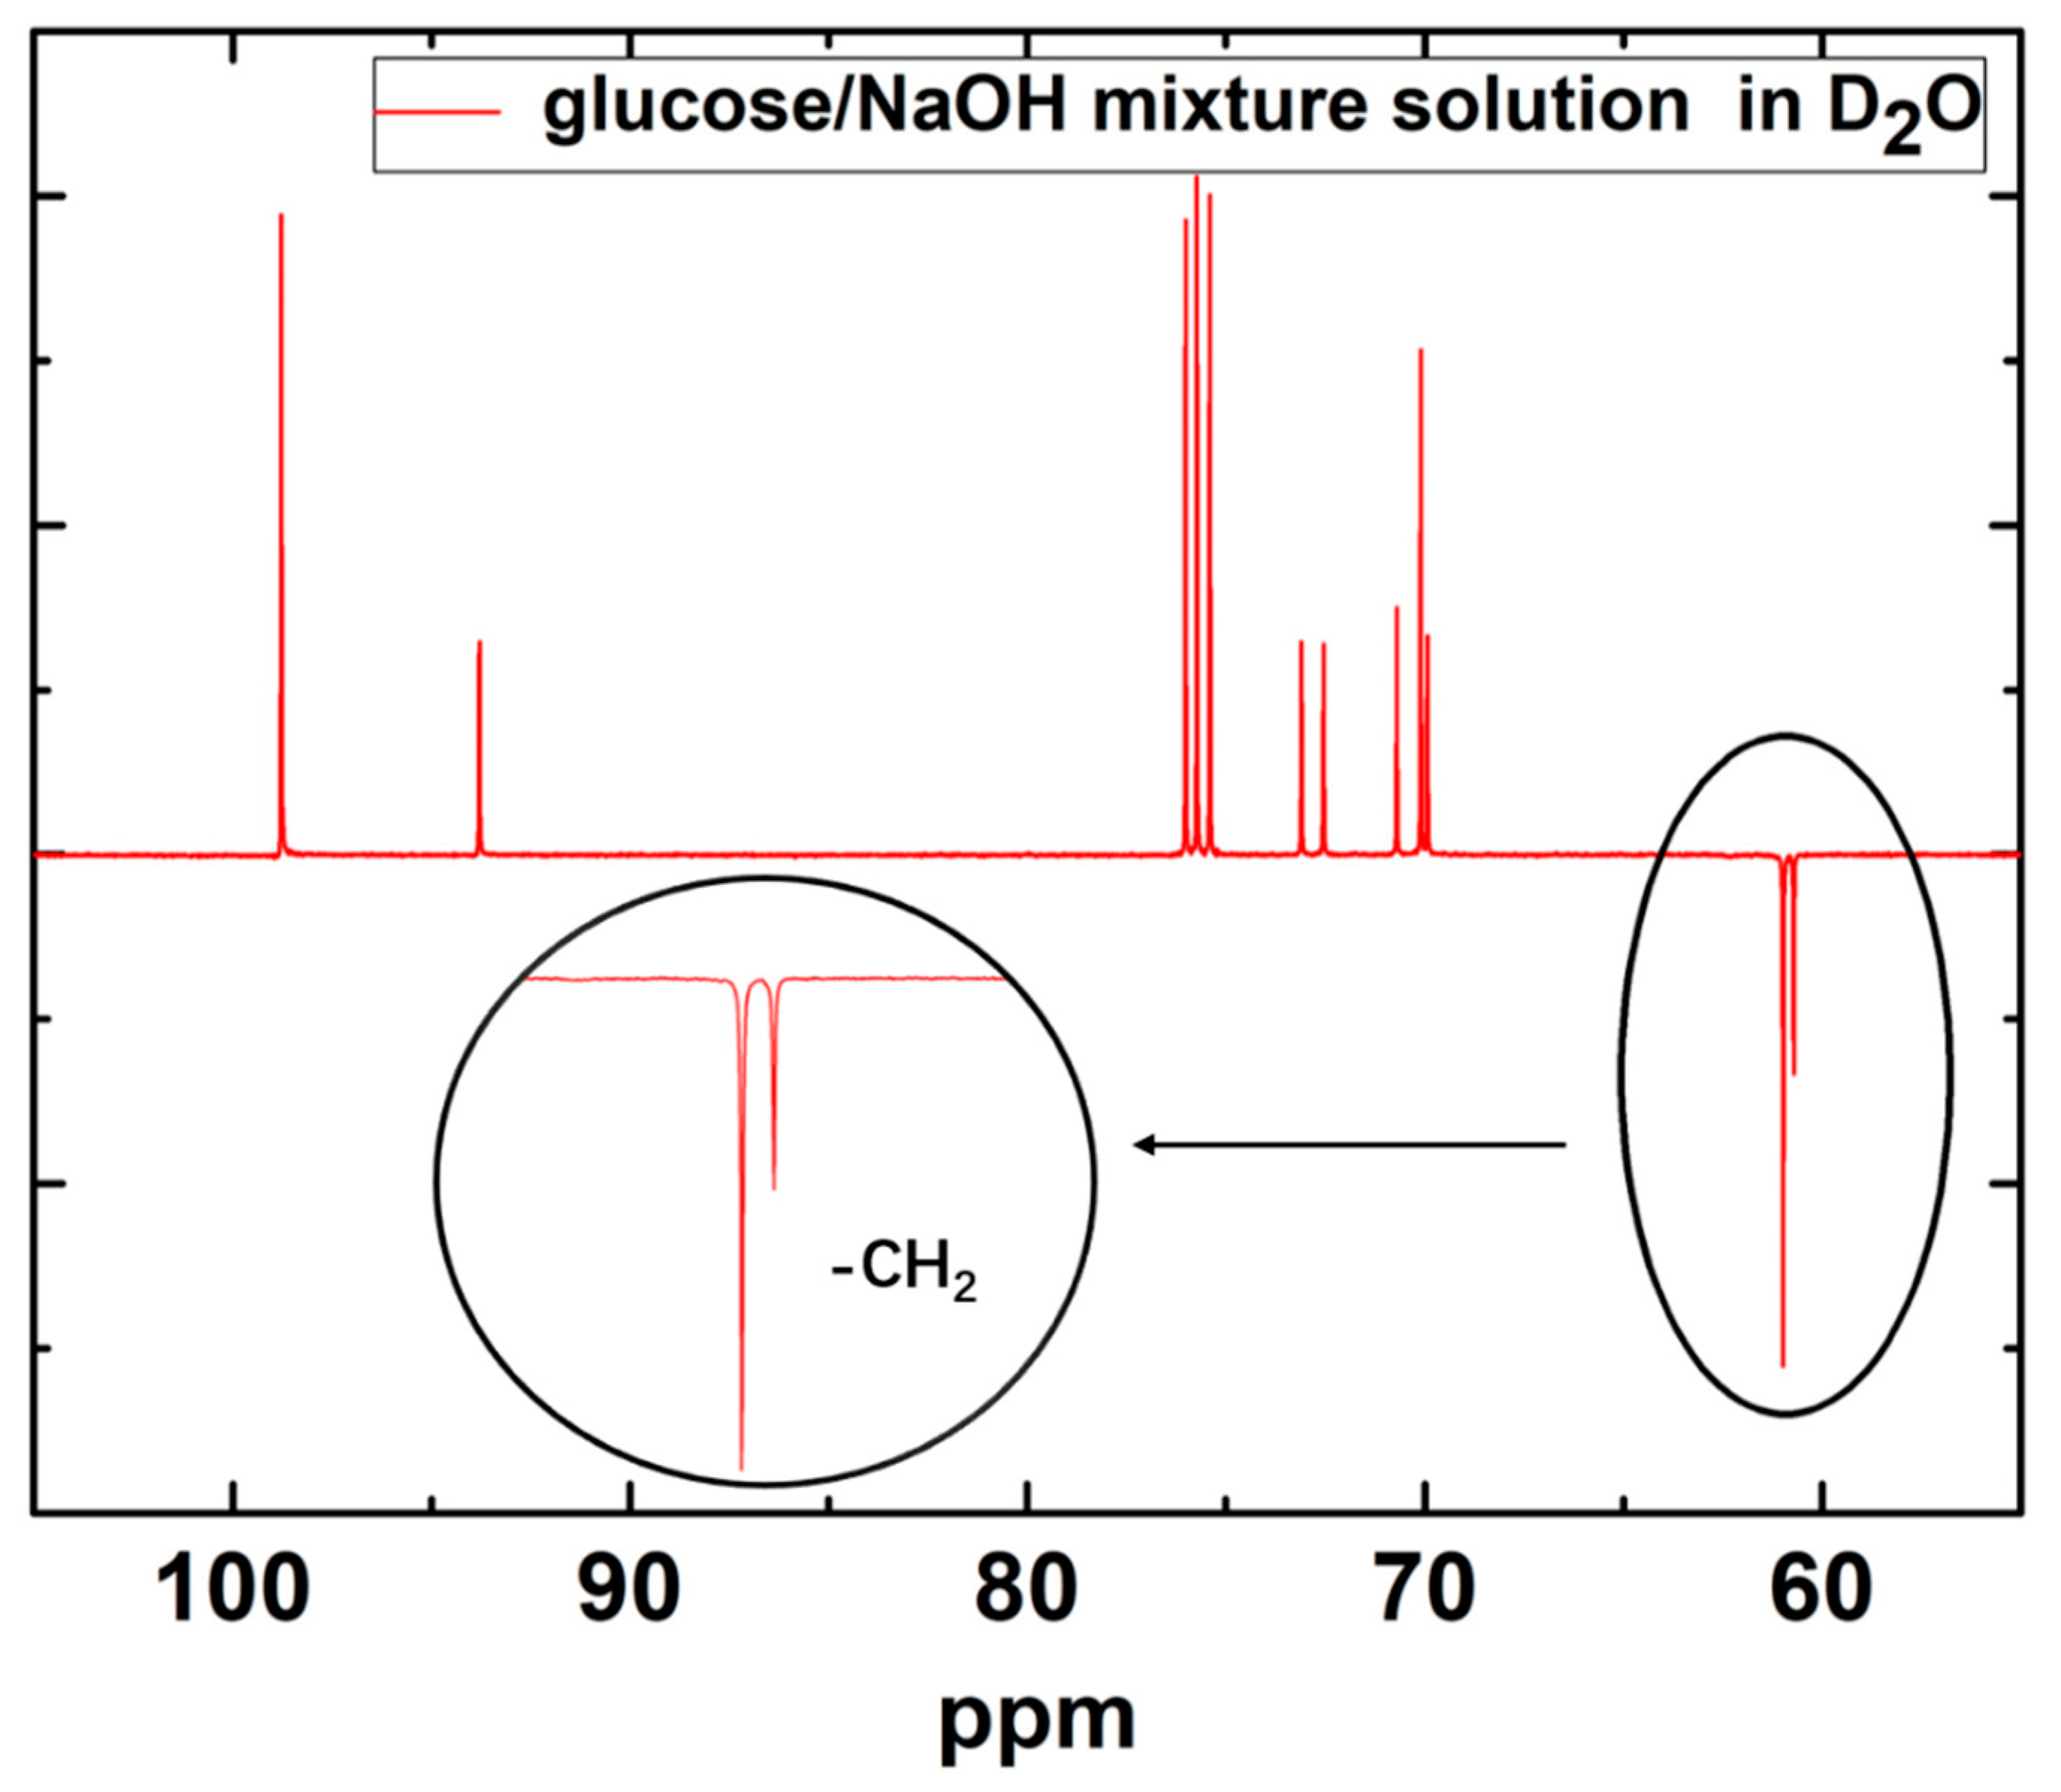
Further evidence was obtained by the UV and NMR measurements. As shown in Figure 4, a new absorption peak was observed in glucose/NaOH mixture solution at 278 nm, which was attributed to enediol [32,33]. Similar results could also be found in NMR data, as shown in Figure 5, where two –CH2 groups were detected, indicating the transformation of glucose to enediol.
It is clear now that we discovered the reason behind the limited linear range and enhanced successfully such a range to 40 mM, which was in sharp contrast to the literature, where the linear range was limited, and the reason was neglected [16,20,21,23]. Although a similar relationship between the linear range and OH− concentration can also be extracted in other literature, this relationship was overlooked before. The actual influence of hydroxide ions was found to be on the reaction with glucose. When the OH− concentration is low, the glucose electro-oxidation reaction only transfers two electrons to the cathode, as opposed to the four or more electrons transferred in the electrolyte with high OH− concentration. Subsequently, the current response was reduced, which corresponded to the non-linear range in the I-t curve. Therefore, insufficient OH− concentration in the electrolyte was the real cause that limited the linear range, instead of the electrode passivation or limited electrode potential [9,16].
To summarize, high OH− concentration is beneficial for glucose sensing, glucose could react with hydroxide ions, generating enediol, which lowered the energy barrier of the electro-oxidation reaction and more than four electrons are transferred to the cathode [28]. The final product was glucuronate (Equation (1)), instead of gluconolactone (Equation (2)). More than four electrons were transferred in this case, indicating a higher measured current in the I-t curve, which could not only increase the linear range but also the measurement accuracy.
Enediol→glucuronate + 4 e
Glucose→gluconolactone + 2 e
4. Conclusions
In conclusion, the root cause of the limited linear range of glucose sensing has been successfully uncovered, attributing to alkaline concentration, which affects the degree of glucose oxidation. By increasing the concentration of hydroxide ions, not only has the linear range increased to 40 mM, but also the sensitivity of glucose sensor has enhanced, indicating better measurement accuracy. These discoveries are hopefully able to offer some impact to the non-enzymatic glucose monitoring community, as they may open a new path for biomedical sensing.
Author Contributions
L.W.Y. and R.T.W. conducted the experiments and wrote the manuscript. E.E.L. and J.Y.C. completed the diagram plot and proofreading. A.F.X. assisted with the X.R.D. measurements. G.X. provided the funding and overall supervision. All authors have read and agreed to the published version of the manuscript.
Funding
This work was financially supported by the Natural Sciences and Engineering Research Council of Canada, grant number 10546964.
Conflicts of Interest
The authors declare no conflict of interest.
References
- O’Connell, P.J.; Hawthorne, W.J.; Holmes-Walker, D.J.; Nankivell, B.J.; Gunton, J.E.; Patel, A.T.; Walters, S.N.; Pleass, H.C.C.; Allen, R.D.M.; Chapman, J.R. Clinical islet transplantation in type 1 diabetes mellitus: Results of Australia’s first trial. Med. J. Aust. 2006, 184, 221–225. [Google Scholar] [CrossRef]
- Risérus, U.; Willett, W.C.; Hu, F.B. Dietary fats and prevention of type 2 diabetes. Prog. Lipid Res. 2009, 48, 44–51. [Google Scholar] [CrossRef] [PubMed] [Green Version]
- Evaluation of certain food additives and contaminants; Technical Report Series; No. 751; World Health Organization: Geneva, Switzerland, 1987; pp. 3–57.
- Yadav, J.; Rani, A.; Singh, V.; Murari, B.M. Prospects and limitations of non-invasive blood glucose monitoring using near-infrared spectroscopy. Biomed. Signal Process. Control 2015, 18, 214–277. [Google Scholar] [CrossRef]
- Gupta, V.K.; Atar, N.; Yola, M.L.; Eryilmaz, M.; Torul, H.; Tamer, U.; Boyaci, I.H.; Üstündaǧ, Z. A novel glucose biosensor platform based on Ag@AuNPs modified graphene oxide nanocomposite and SERS application. J. Colloid Interface Sci. 2013, 406, 231–237. [Google Scholar] [CrossRef] [PubMed]
- Wang, C.; Chen, S.; Xiang, Y.; Li, W.; Zhong, X.; Che, X.; Li, J. Glucose biosensor based on the highly efficient immobilization of glucose oxidase on Prussian blue-gold nanocomposite films. J. Mol. Catal. B Enzym. 2011, 69, 1–7. [Google Scholar] [CrossRef]
- Zhuo, Y.; Chai, Y.Q.; Yuan, R.; Mao, L.; Yuan, Y.L.; Han, J. Glucose oxidase and ferrocene labels immobilized at Au/TiO2 nanocomposites with high load amount and activity for sensitive immunoelectrochemical measurement of ProGRP biomarker. Biosens. Bioelectron. 2011, 26, 3838–3844. [Google Scholar] [CrossRef]
- Wang, Y.; Xu, Y.; Luo, L.; Ding, Y.; Liu, X.; Huang, A. A novel sensitive nonenzymatic glucose sensor based on perovskite LaNi 0.5Ti0.5O3-modified carbon paste electrode. Sens. Actuators B Chem. 2010, 151, 65–70. [Google Scholar] [CrossRef]
- Pal, N.; Saha, B.; Kundu, S.K.; Bhaumik, A.; Banerjee, S. A highly efficient non-enzymatic glucose biosensor based on a nanostructured NiTiO3/NiO material. New J. Chem. 2015, 39, 8035–8043. [Google Scholar] [CrossRef]
- Chinnadayyala, S.R.; Park, K.D.; Cho, S. Editors’ Choice—Review—In Vivo and In Vitro Microneedle Based Enzymatic and Non-Enzymatic Continuous Glucose Monitoring Biosensors. ECS J. Solid State Sci. Technol. 2018, 7, Q3159–Q3171. [Google Scholar] [CrossRef]
- Wang, L.; Tang, Y.; Wang, L.; Zhu, H.; Meng, X.; Chen, Y.; Sun, Y.; Yang, X.J.; Wan, P. Fast conversion of redox couple on Ni(OH)2/C nanocomposite electrode for high-performance nonenzymatic glucose sensor. J. Solid State Electrochem. 2015, 19, 851–860. [Google Scholar] [CrossRef]
- Dong, Q.; Song, D.; Huang, Y.; Xu, Z.; Chapman, J.H.; Willis, W.S.; Li, B.; Lei, Y. High-temperature annealing enabled iridium oxide nanofibers for both non-enzymatic glucose and solid-state pH sensing. Electrochim. Acta 2018, 281, 117–126. [Google Scholar] [CrossRef]
- Jia, L.; Wei, X.; Lv, L.; Zhang, X.; Duan, X.; Xu, Y.; Liu, K.; Wang, J. Electrodeposition of hydroxyapatite on nickel foam and further modification with conductive polyaniline for non-enzymatic glucose sensing. Electrochim. Acta 2018, 280, 315–332. [Google Scholar] [CrossRef]
- Hwang, D.W.; Lee, S.; Seo, M.; Chung, T.D. Recent advances in electrochemical non-enzymatic glucose sensors—A review. Anal. Chim. Acta 2018, 1033, 1–34. [Google Scholar] [CrossRef] [PubMed]
- Shadlaghani, A.; Farzaneh, M.; Kinser, D.; Reid, R.C. Direct electrochemical detection of glutamate, acetylcholine, choline, and adenosine using non-enzymatic electrodes. Sensors 2019, 19, 447. [Google Scholar] [CrossRef] [Green Version]
- Annalakshmi, M.; Balasubramanian, P.; Chen, S.M.; Chen, T.W. Enzyme-free electrocatalytic sensing of hydrogen peroxide using a glassy carbon electrode modified with cobalt nanoparticle-decorated tungsten carbide. Microchim. Acta 2019, 186, 265. [Google Scholar] [CrossRef]
- Mahshid, S.S.; Mahshid, S.; Dolati, A.; Ghorbani, M.; Yang, L.; Luo, S.; Cai, Q. Electrodeposition and electrocatalytic properties of Pt/Ni-Co nanowires for non-enzymatic glucose detection. J. Alloys Compd. 2013, 554, 169–176. [Google Scholar] [CrossRef]
- Ding, Y.; Liu, Y.; Zhang, L.; Wang, Y.; Bellagamba, M.; Parisi, J.; Li, C.M.; Lei, Y. Sensitive and selective nonenzymatic glucose detection using functional NiO-Pt hybrid nanofibers. Electrochim. Acta 2011, 58, 209–214. [Google Scholar] [CrossRef]
- Yuan, J.; Wang, K.; Xia, X. Highly ordered platinum-nanotubule arrays for amperometric glucose sensing. Adv. Funct. Mater. 2005, 15, 803–809. [Google Scholar] [CrossRef]
- Pradhan, D.; Niroui, F.; Leung, K.T. High-performance, flexible enzymatic glucose biosensor based on ZnO nanowires supported on a gold-coated polyester substrate. ACS Appl. Mater. Interfaces 2010, 2, 2409–2412. [Google Scholar] [CrossRef]
- Rong, L.Q.; Yang, C.; Qian, Q.Y.; Xia, X.H. Study of the nonenzymatic glucose sensor based on highly dispersed Pt nanoparticles supported on carbon nanotubes. Talanta 2007, 72, 819–824. [Google Scholar] [CrossRef]
- Luo, J.; Jiang, S.; Zhang, H.; Jiang, J.; Liu, X. A novel non-enzymatic glucose sensor based on Cu nanoparticle modified graphene sheets electrode. Anal. Chim. Acta 2012, 709, 47–53. [Google Scholar] [CrossRef]
- Li, M.; Bo, X.; Mu, Z.; Zhang, Y.; Guo, L. Electrodeposition of nickel oxide and platinum nanoparticles on electrochemically reduced graphene oxide film as a nonenzymatic glucose sensor. Sens. Actuators B Chem. 2014, 192, 261–268. [Google Scholar] [CrossRef]
- Yang, H.; Gao, G.; Teng, F.; Liu, W.; Chen, S.; Ge, Z. Nickel hydroxide nanoflowers for a nonenzymatic electrochemical glucose sensor. J. Electrochem. Soc. 2014, 161, 216–219. [Google Scholar] [CrossRef]
- Elgrishi, N.; Rountree, K.J.; McCarthy, B.D.; Rountree, E.S.; Eisenhart, T.T.; Dempsey, J.L. A Practical Beginner’s Guide to Cyclic Voltammetry. J. Chem. Educ. 2018, 95, 197–206. [Google Scholar] [CrossRef]
- McMurry, J. Organic Chemistry, 8th ed.; Brooks Cole: Belmont, CA, USA, 2012. [Google Scholar]
- Isbell, H.S.; Frush, H.L.; Wade, C.W.R.; Hunter, C.E. Transformations of sugars in alkaline solutions. Carbohydr. Res. 1969, 9, 163–175. [Google Scholar] [CrossRef]
- Larew, L.A.; Johnson, D.C. Concentration dependence of the mechanism of glucose oxidation at gold electrodes in alkaline media. J. Electroanal. Chem. 1989, 262, 167–182. [Google Scholar] [CrossRef]
- Holade, Y.; Engel, A.B.; Servat, K.; Napporn, T.W.; Morais, C.; Tingry, S.; Cornu, D.; Boniface Kokoh, K. Electrocatalytic and electroanalytic investigation of carbohydrates oxidation on gold-based nanocatalysts in alkaline and neutral pHs. J. Electrochem. Soc. 2018, 165, H425–H436. [Google Scholar] [CrossRef]
- Bae, I.T.; Yeager, E.; Xing, X.; Liu, C.C. In situ infrared studies of glucose oxidation on platinum in an alkaline medium. J. Electroanal. Chem. 1991, 309, 131–145. [Google Scholar] [CrossRef]
- Chang, S.C.; Ho, Y.; Weaver, M.J. Applications of Real-Time FTIR Spectroscopy to the Elucidation of Complex Electroorganic Pathways: Electrooxidation of Ethylene Glycol on Gold, Platinum, and Nickel in Alkaline Solution. J. Am. Chem. Soc. 1991, 113, 9506–9513. [Google Scholar] [CrossRef]
- Chen, J.; Zhao, C.X.; Zhi, M.M.; Wang, K.; Deng, L.; Xu, G. Alkaline direct oxidation glucose fuel cell system using silver/nickel foams as electrodes. Electrochim. Acta 2012, 66, 133–138. [Google Scholar] [CrossRef]
- Zhao, C.X.; Wang, K.; Yan, H.; Xu, G. Output current increase in alkaline glucose fuel cells. J. Electrochem. Soc. 2011, 158, 1055–1059. [Google Scholar] [CrossRef]
Figure 1.
X-ray diffraction (XRD) results (WL = 1.54 Ǻ) for Ni (OH)2 on the Ni sheet; ![Crystals 10 00186 i001]() :Ni(OH)2;
:Ni(OH)2; ![Crystals 10 00186 i002]() : Ni sheet.
: Ni sheet.
 :Ni(OH)2;
  : Ni sheet.
Figure 1.
X-ray diffraction (XRD) results (WL = 1.54 Ǻ) for Ni (OH)2 on the Ni sheet; ![Crystals 10 00186 i001]() :Ni(OH)2;
:Ni(OH)2; ![Crystals 10 00186 i002]() : Ni sheet.
: Ni sheet.
:Ni(OH)2; : Ni sheet.
Figure 2.
(a) The amperometric I-t curve at [OH−]=100 mM; (b) the amperometric I-t curve at [OH−] = 1000 mM; (c) the amperometric I-t curve at [OH−] = 500 mM; the linear range concentration of glucose at various OH− concentrations, (d) [OH−] = 100 mM, (e) [OH−] = 500 mM and (f) [OH−] = 1000 mM.
Figure 2.
(a) The amperometric I-t curve at [OH−]=100 mM; (b) the amperometric I-t curve at [OH−] = 1000 mM; (c) the amperometric I-t curve at [OH−] = 500 mM; the linear range concentration of glucose at various OH− concentrations, (d) [OH−] = 100 mM, (e) [OH−] = 500 mM and (f) [OH−] = 1000 mM.

Figure 3.
(a) Fourier-transform infrared spectroscopy (FTIR) results of glucose/NaOH mixture; (b) FTIR results of a pure glucose electro-oxidized product and glucose/NaOH electro-oxidized mixture were measured by FTIR.
Figure 3.
(a) Fourier-transform infrared spectroscopy (FTIR) results of glucose/NaOH mixture; (b) FTIR results of a pure glucose electro-oxidized product and glucose/NaOH electro-oxidized mixture were measured by FTIR.

Figure 4.
UV–vis spectra of the glucose/NaOH mixture solution (solid line) and glucose solution (dash line).
Figure 4.
UV–vis spectra of the glucose/NaOH mixture solution (solid line) and glucose solution (dash line).

Figure 5.
13C DEPTQ-135 NMR spectrum of glucose/NaOH mixture dissolved in D2O with a frequency of 125.78 MHz.
Figure 5.
13C DEPTQ-135 NMR spectrum of glucose/NaOH mixture dissolved in D2O with a frequency of 125.78 MHz.

© 2020 by the authors. Licensee MDPI, Basel, Switzerland. This article is an open access article distributed under the terms and conditions of the Creative Commons Attribution (CC BY) license (http://creativecommons.org/licenses/by/4.0/).
Share and Cite
MDPI and ACS Style
Yang, L.W.; Liu, E.E.; Xu, A.F.; Chen, J.Y.; Wang, R.T.; Xu, G. Improving Linear Range Limitation of Non-Enzymatic Glucose Sensor by OH− Concentration. Crystals 2020, 10, 186. https://doi.org/10.3390/cryst10030186
AMA Style
Yang LW, Liu EE, Xu AF, Chen JY, Wang RT, Xu G. Improving Linear Range Limitation of Non-Enzymatic Glucose Sensor by OH− Concentration. Crystals. 2020; 10(3):186. https://doi.org/10.3390/cryst10030186
Chicago/Turabian StyleYang, Lory Wenjuan, Elton Enchong Liu, Alex Fan Xu, Jason Yuanzhe Chen, Ryan Taoran Wang, and Gu Xu. 2020. "Improving Linear Range Limitation of Non-Enzymatic Glucose Sensor by OH− Concentration" Crystals 10, no. 3: 186. https://doi.org/10.3390/cryst10030186
Note that from the first issue of 2016, this journal uses article numbers instead of page numbers. See further details here.