
Evolution and Trends of Meteorological Drought and Wet Events over the Republic of Djibouti from 1961 to 2021
 , , , ,
Abstract
:1. Introduction
2. Study Area and Data Collection
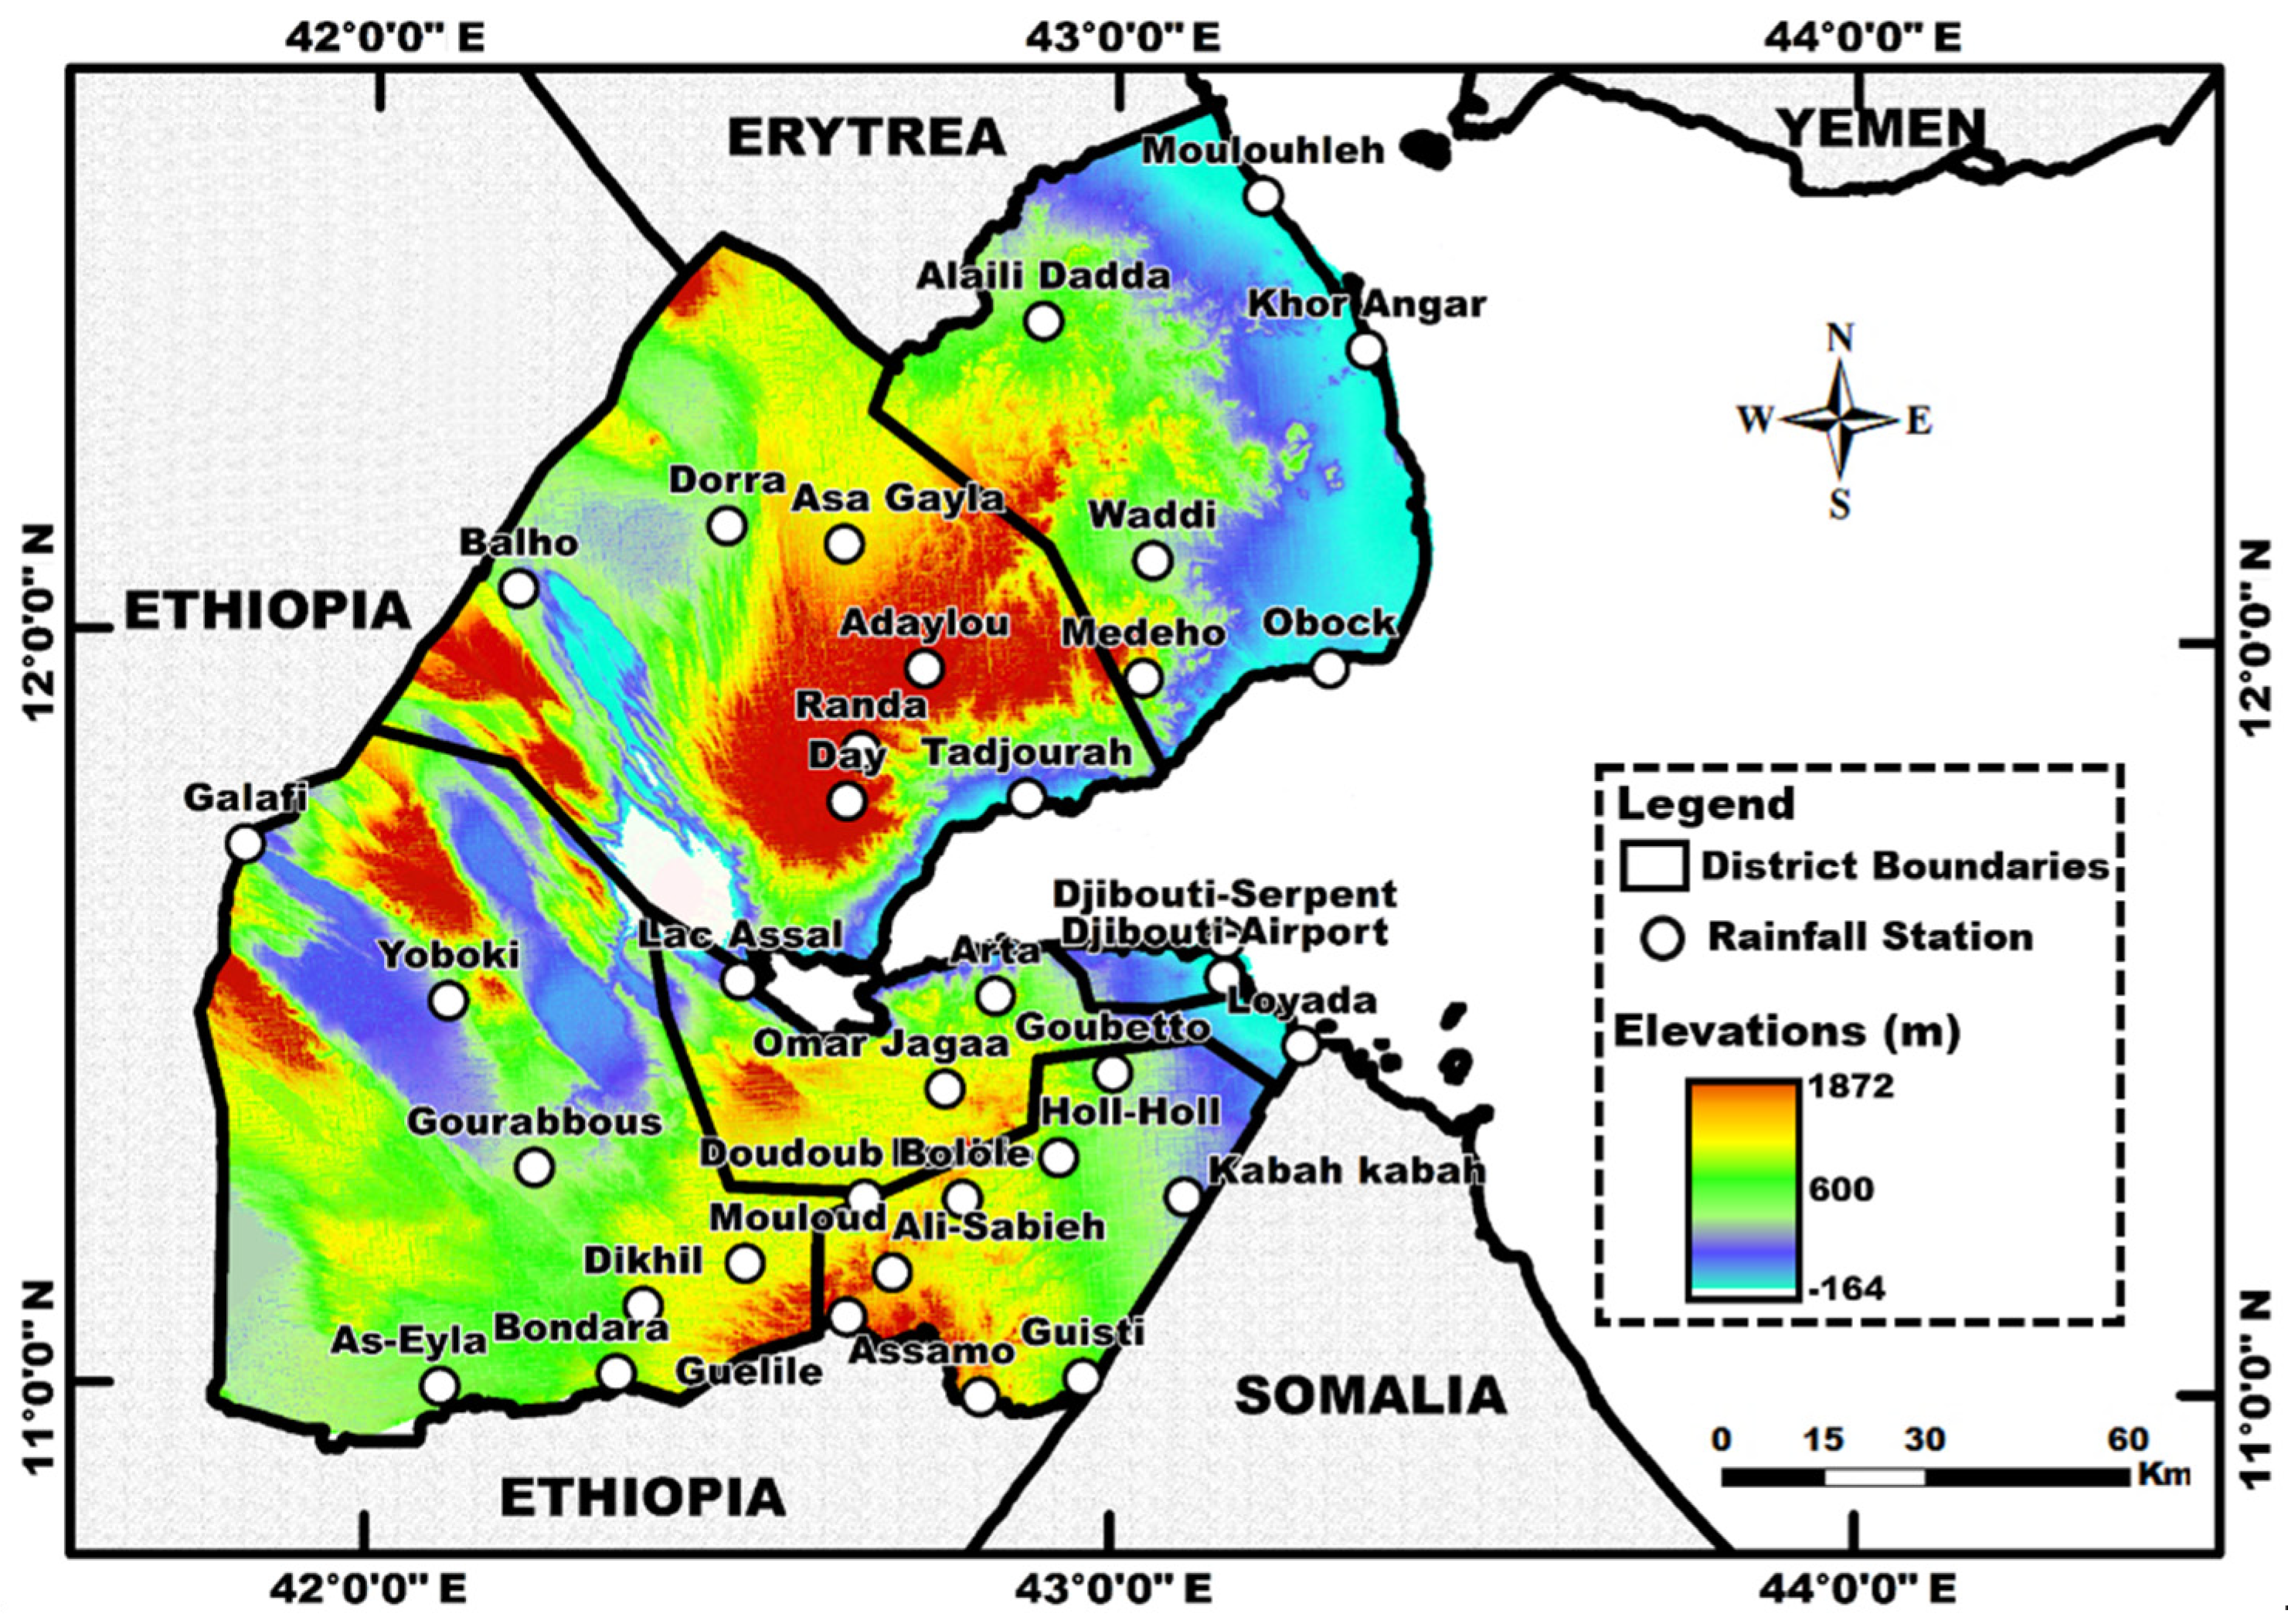
2.1. Study Area
2.2. Data Sources
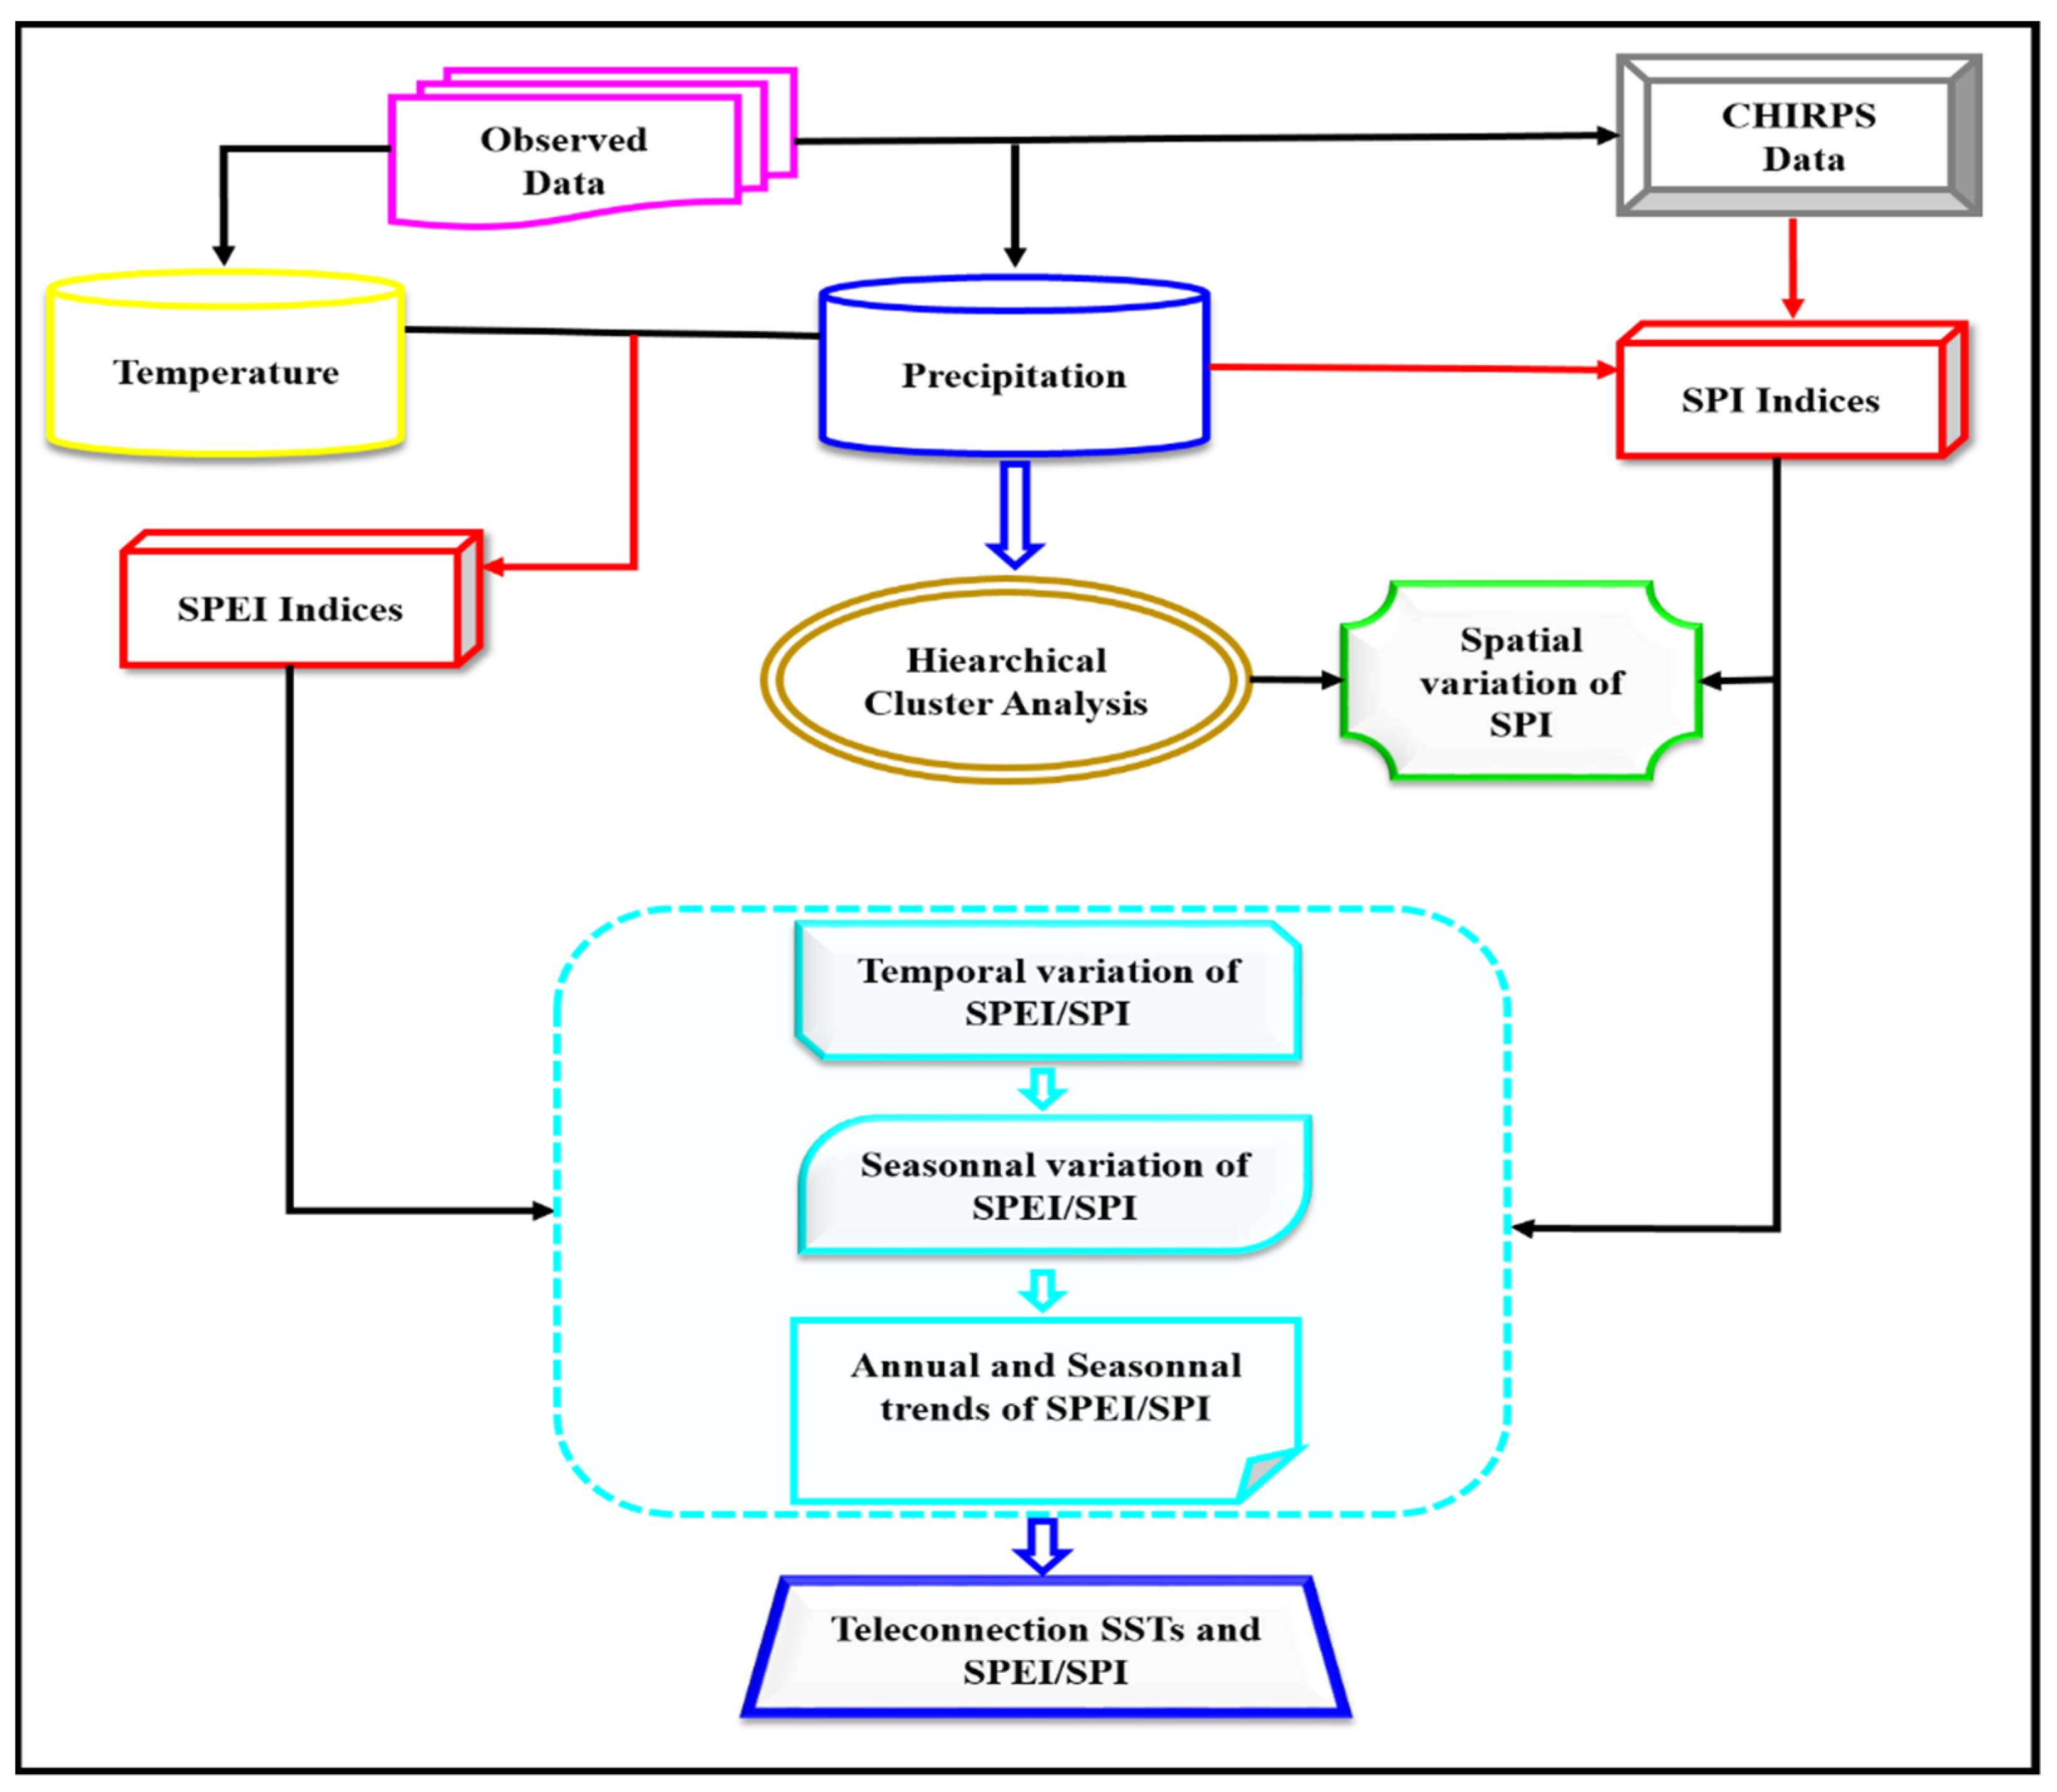
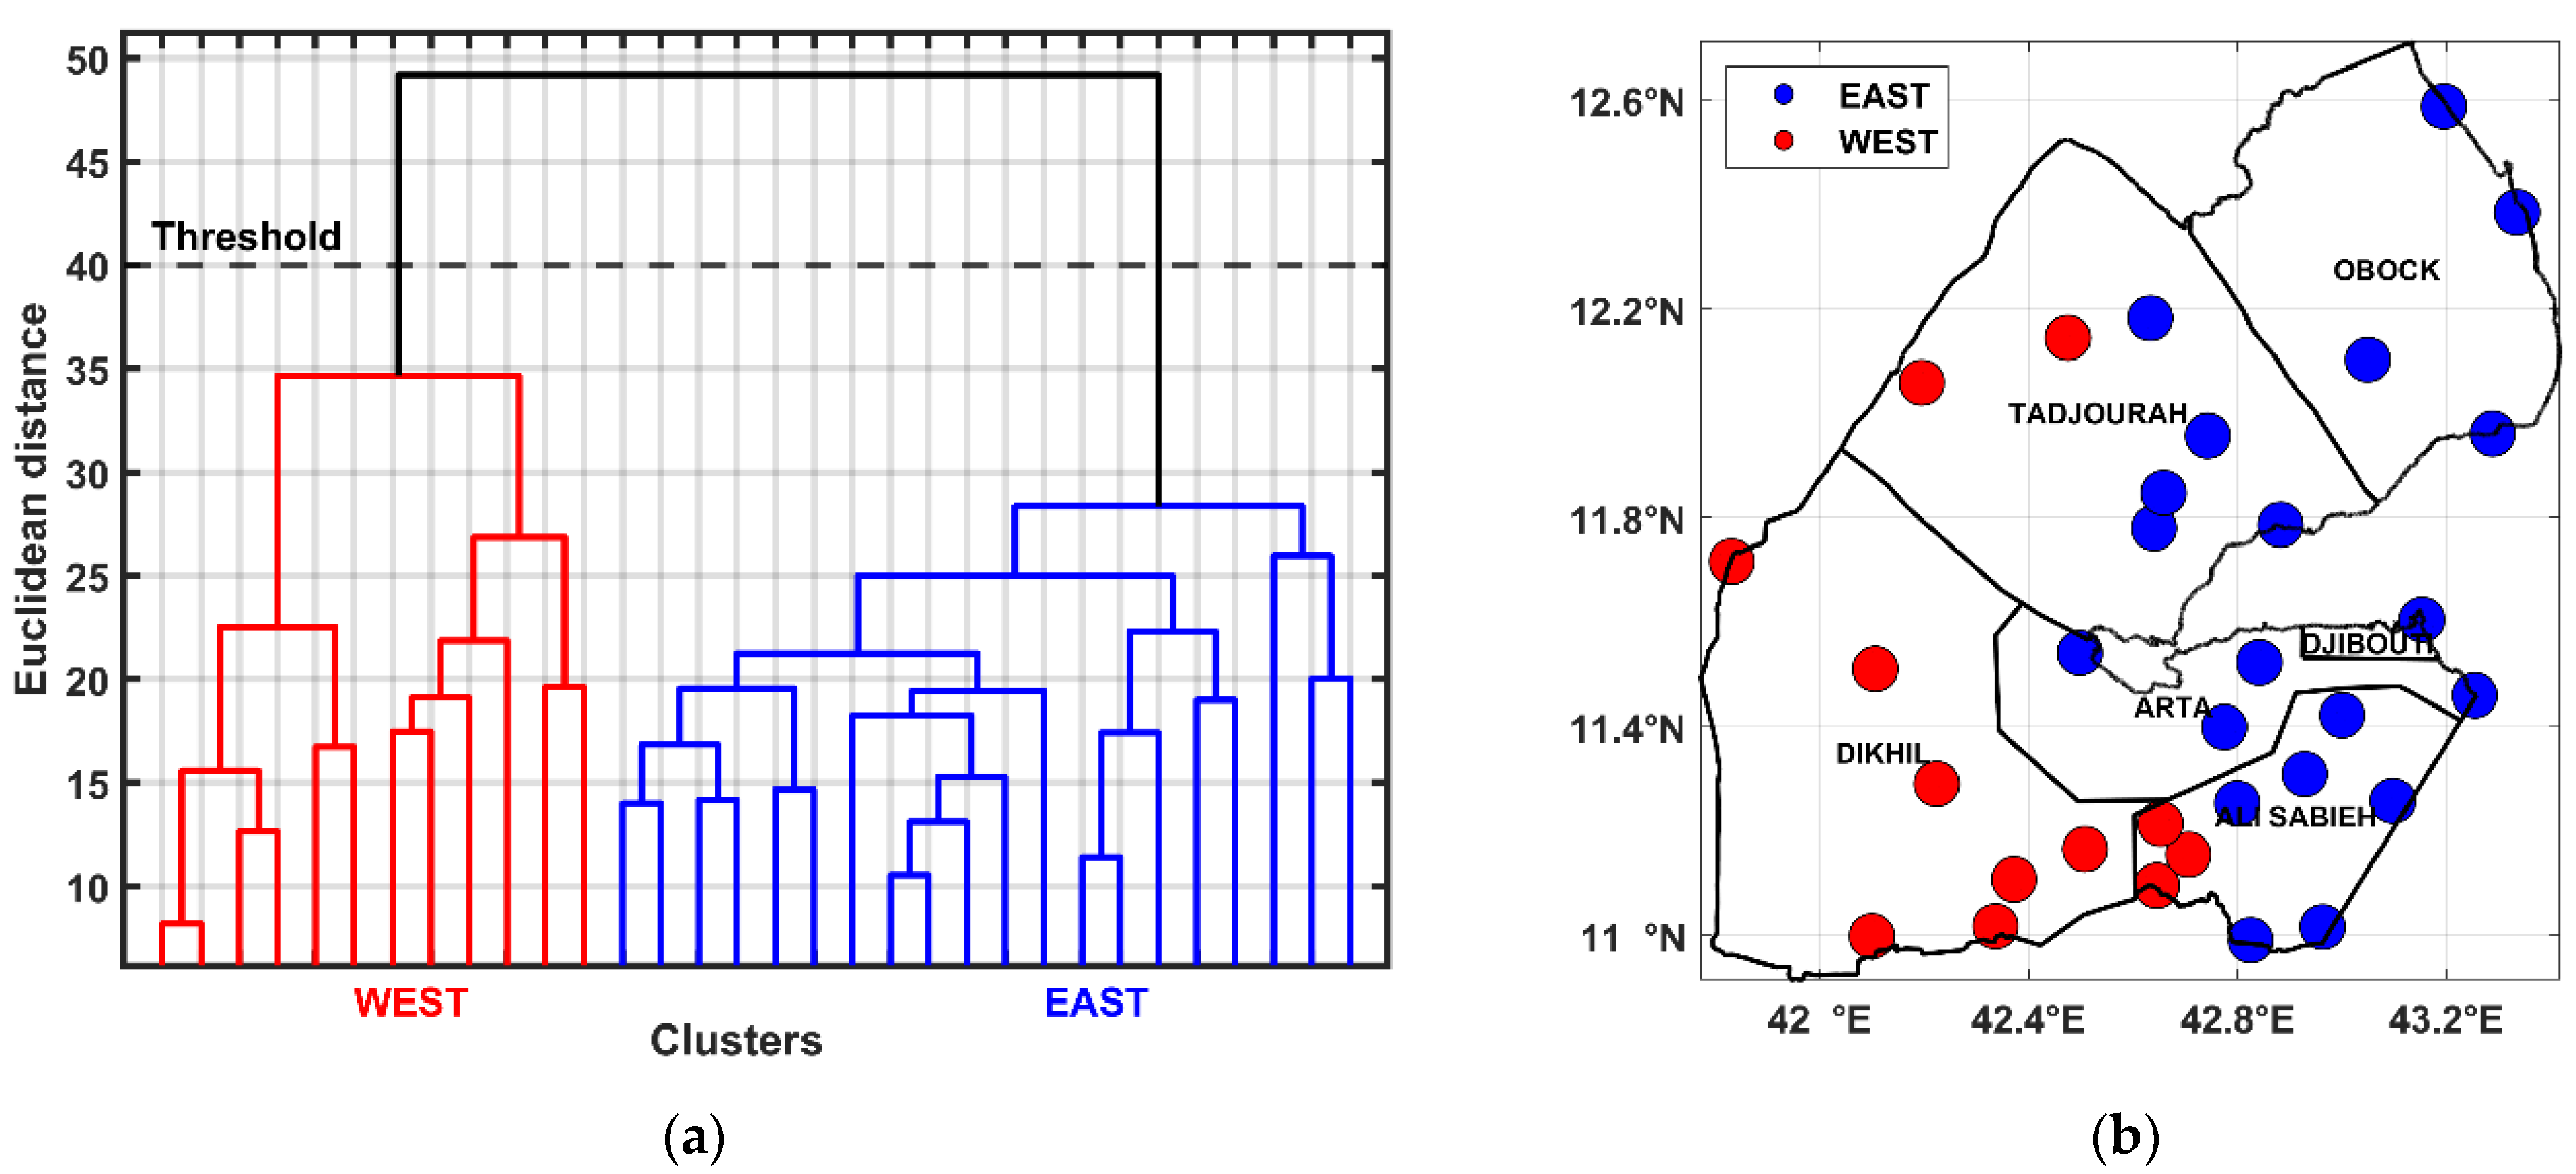
2.3. Methodology
2.3.1. Drought Analysis Procedures
2.3.2. Evaluating Drought Characteristics
3. Results
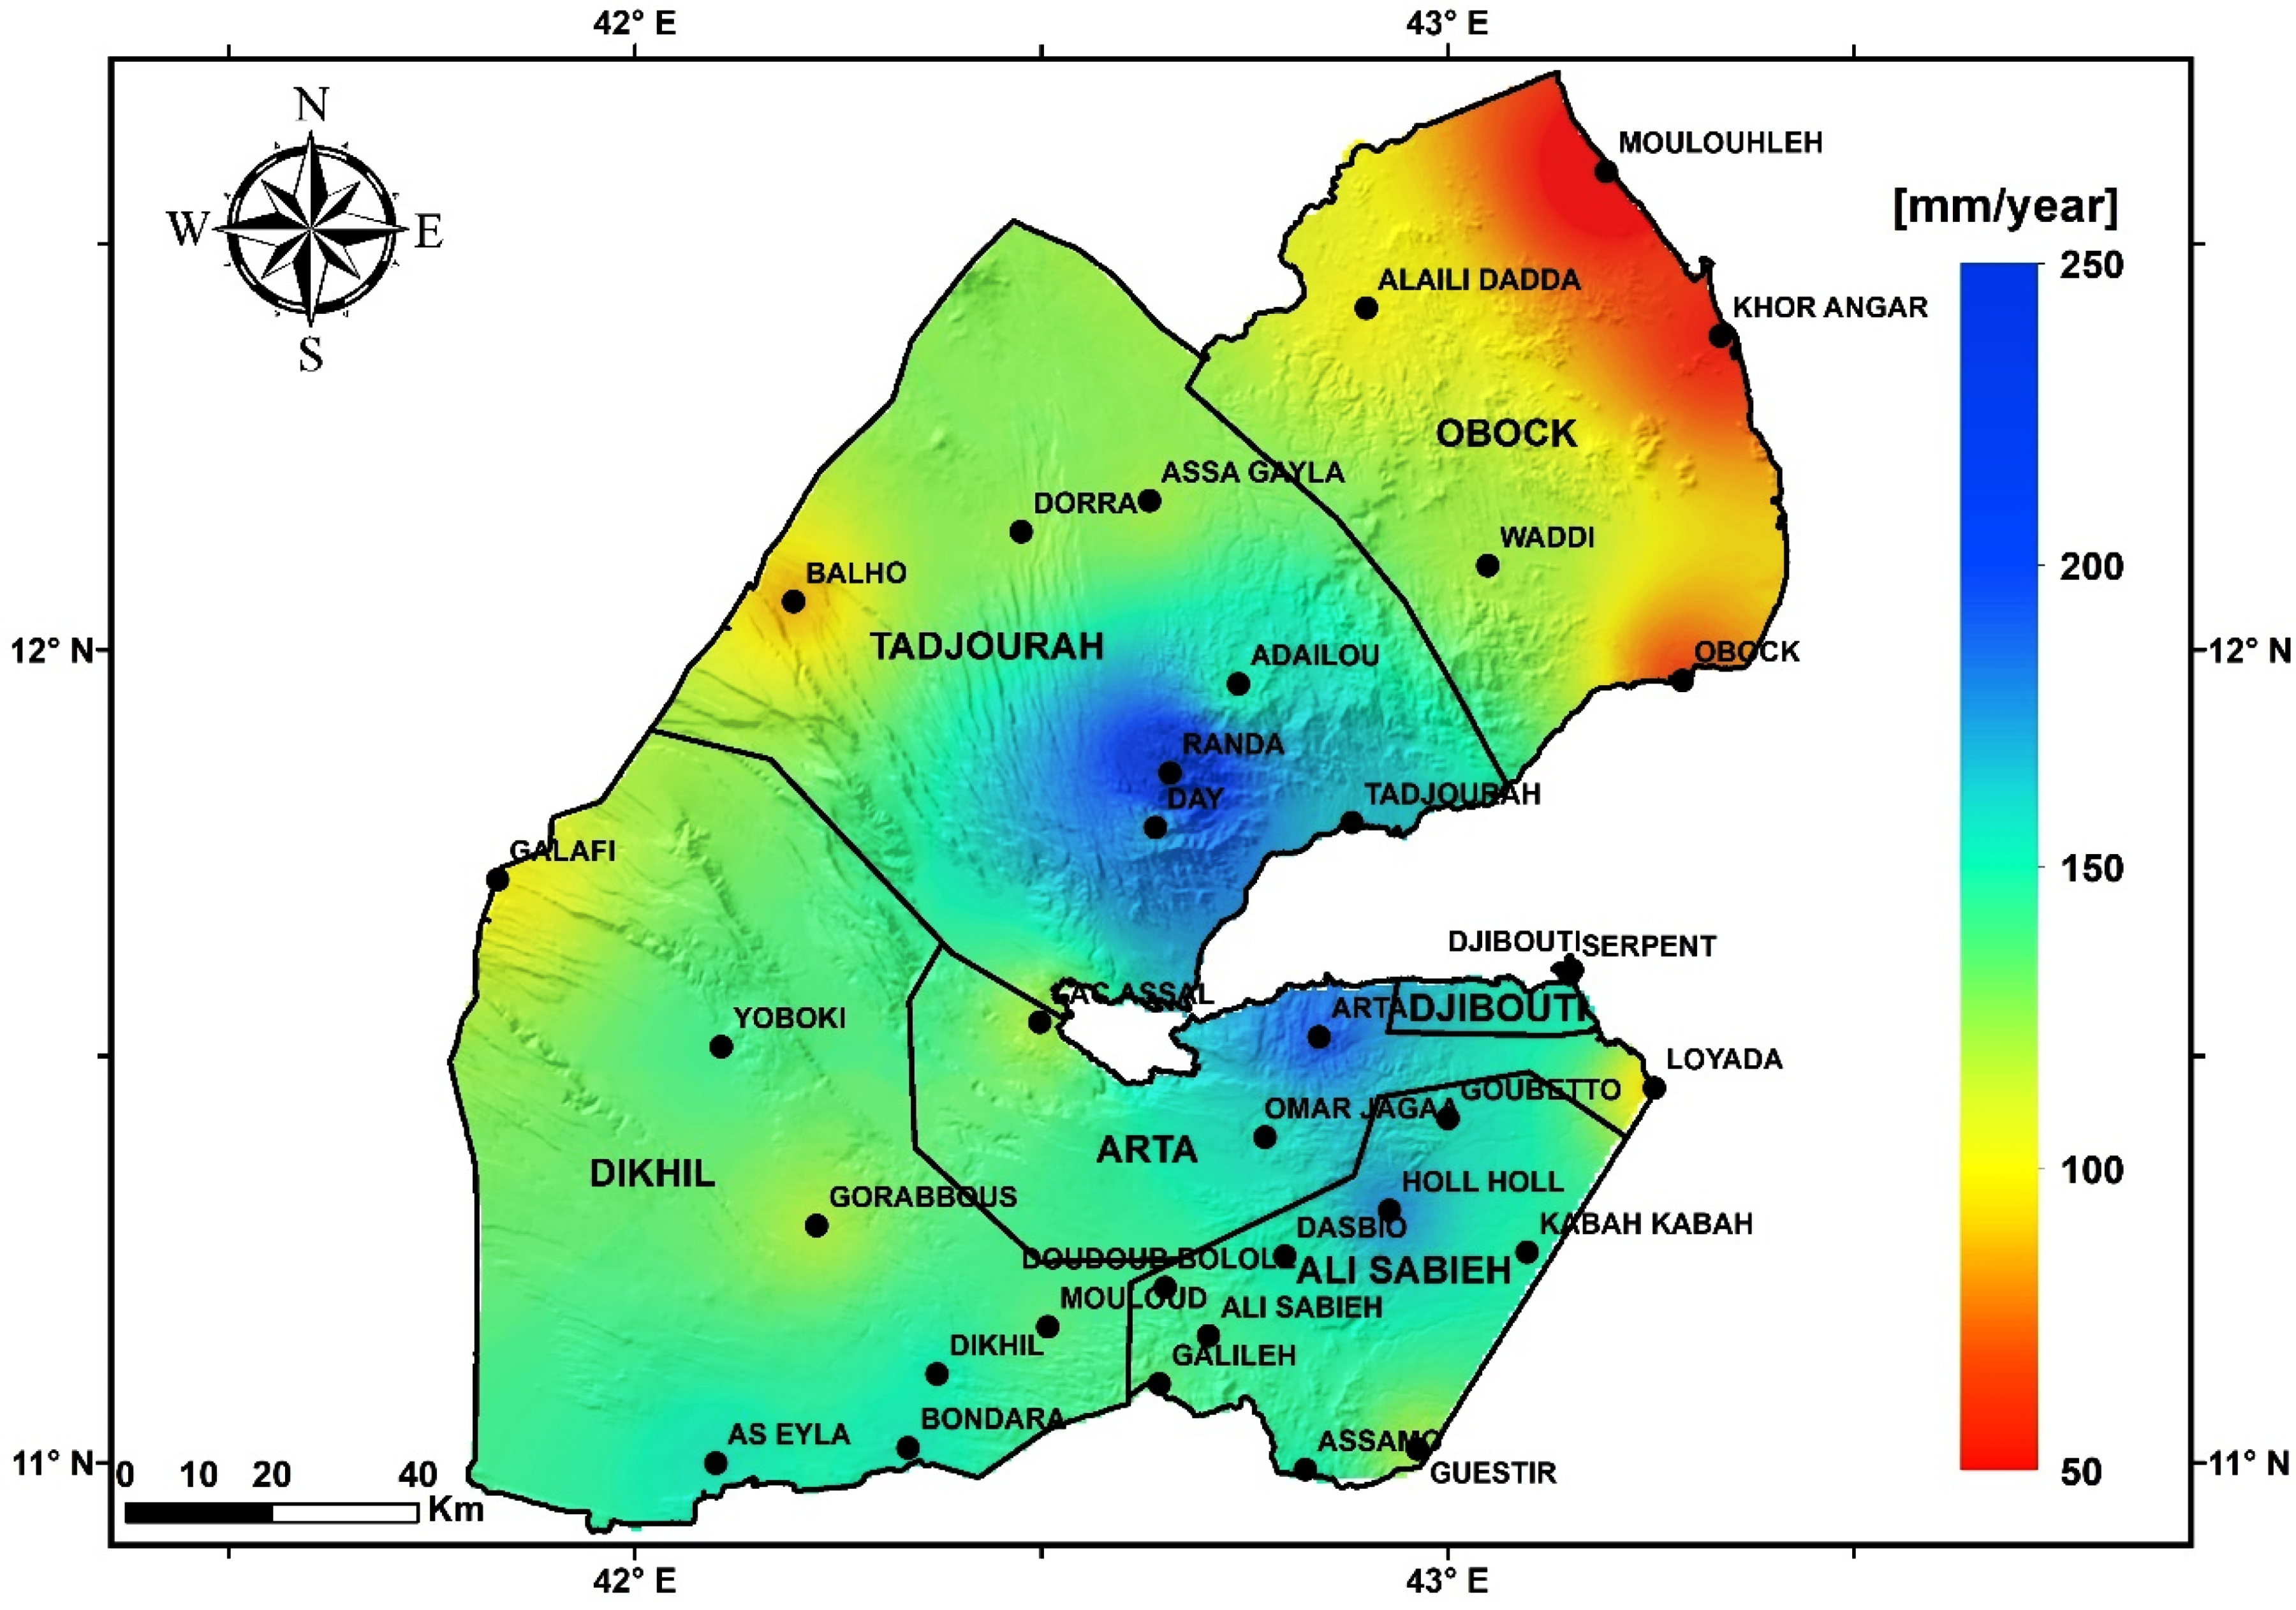
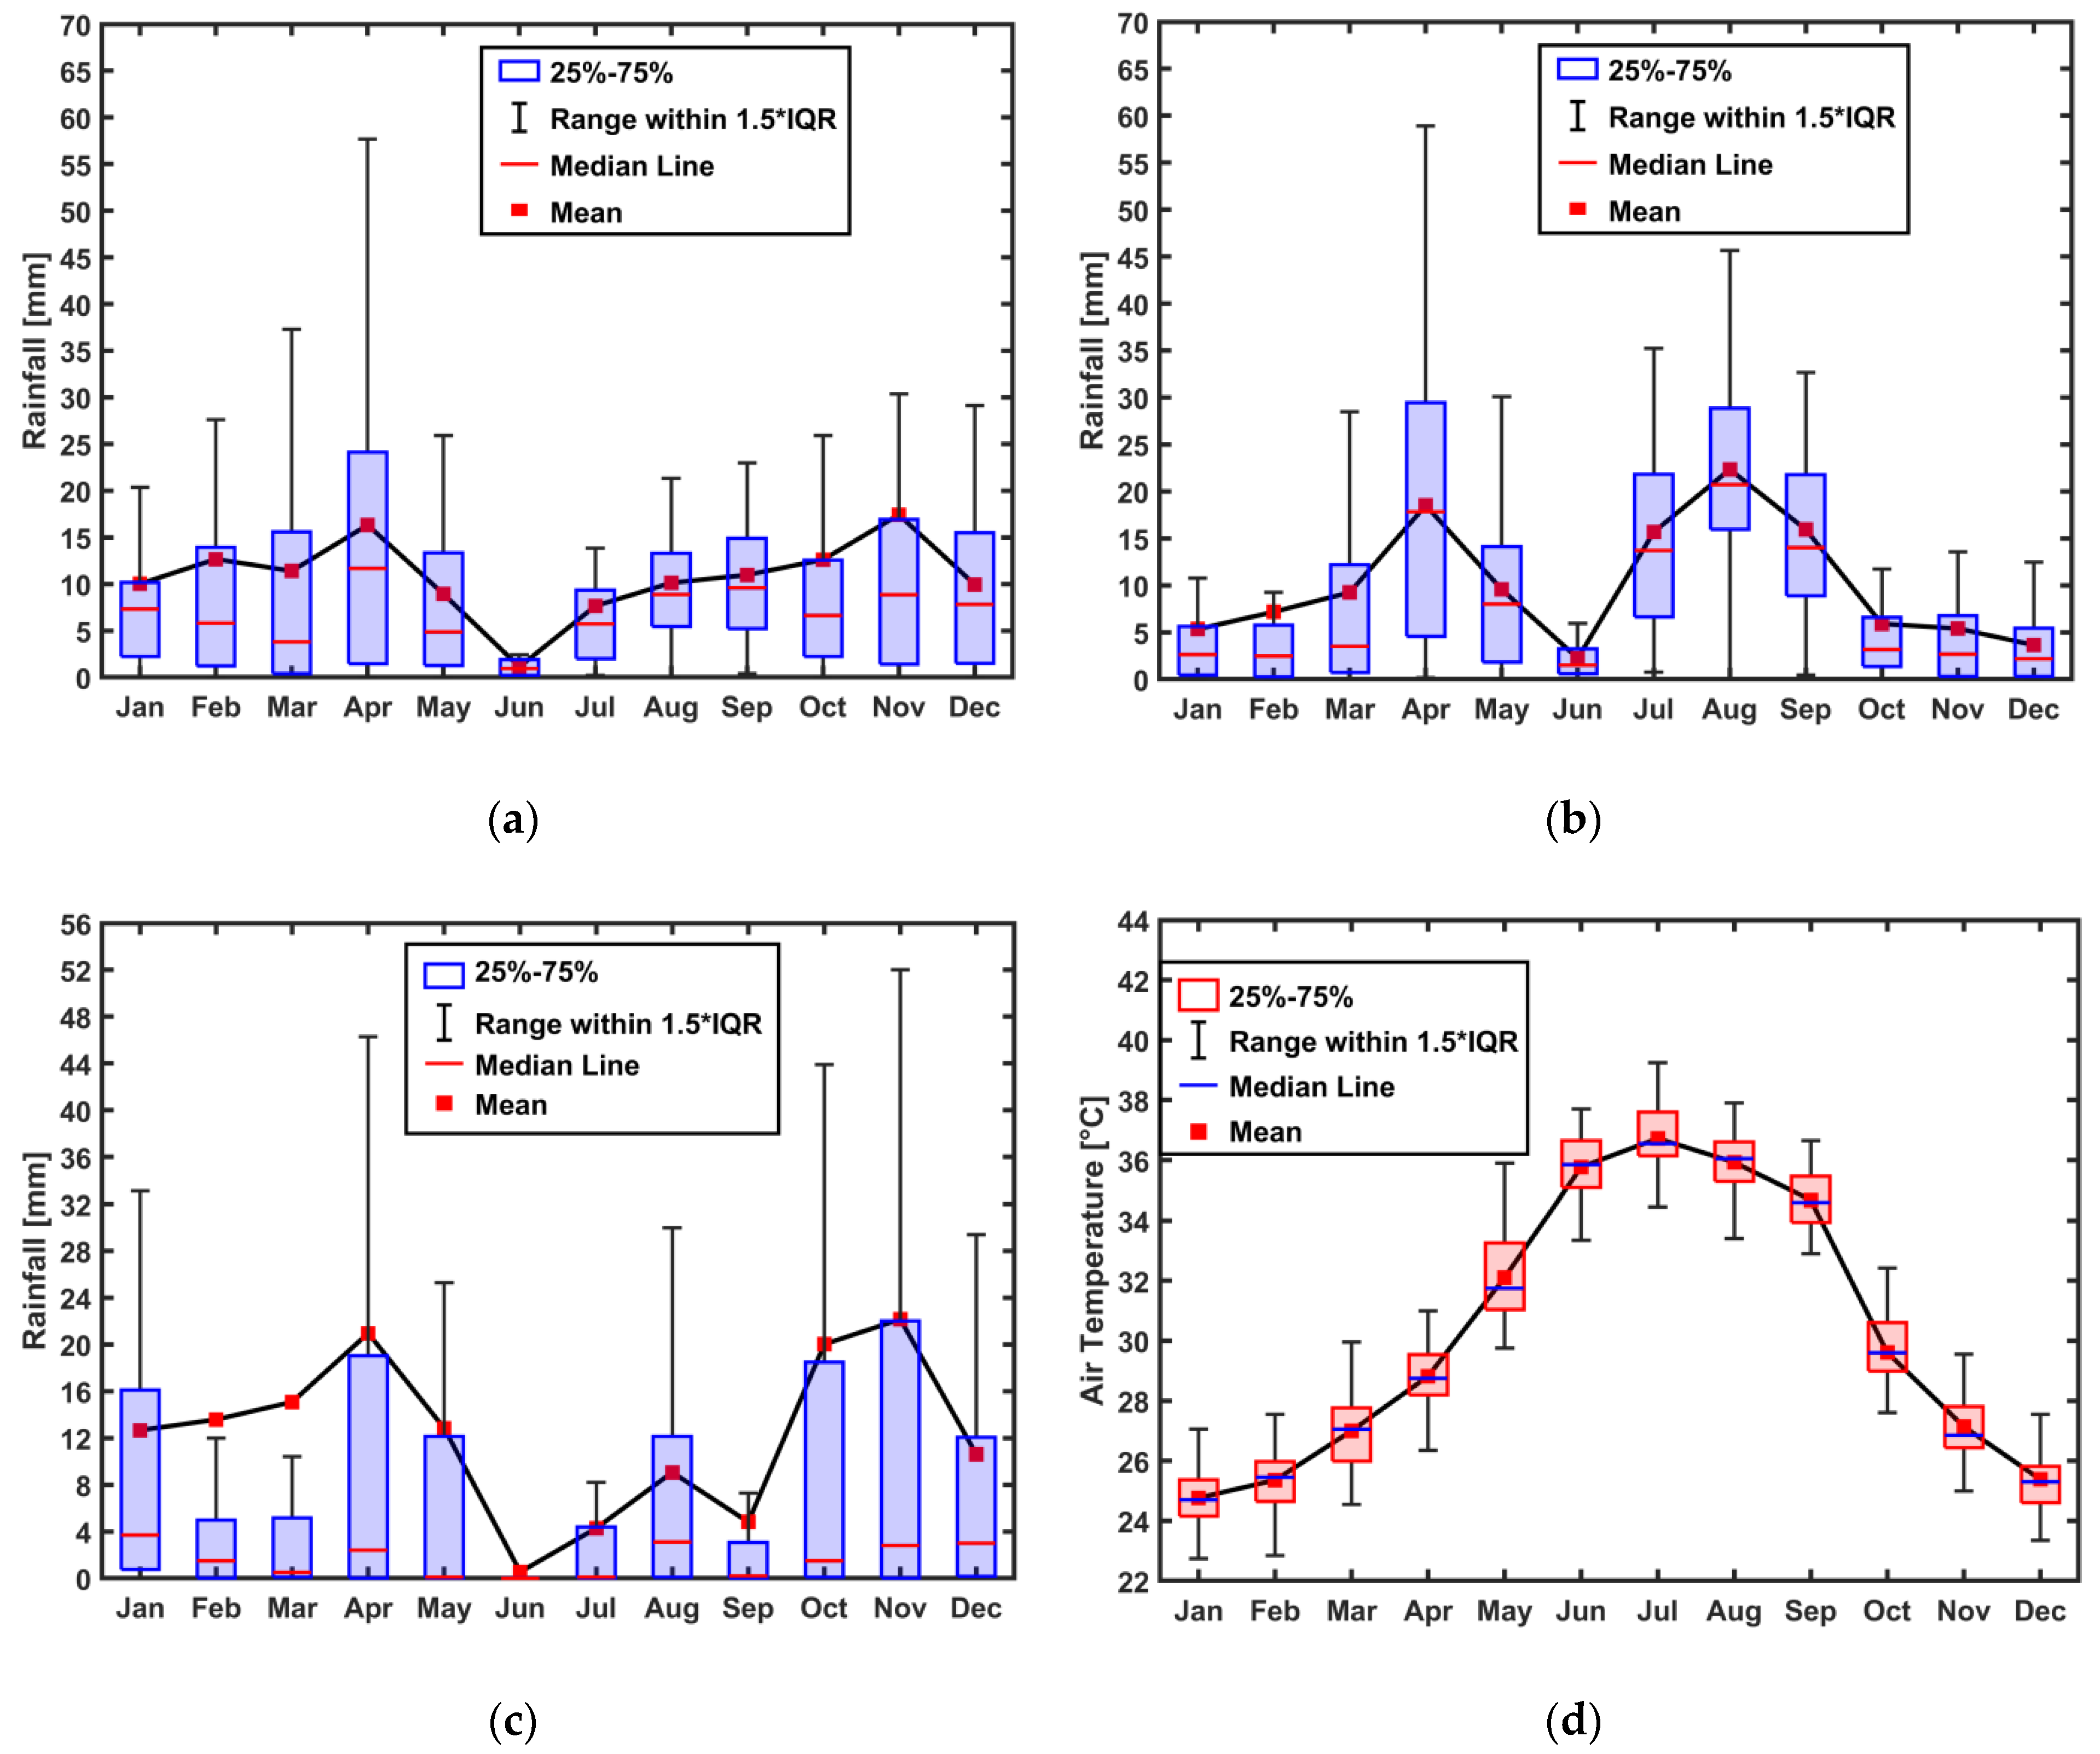
3.1. Mean Climatological Patterns
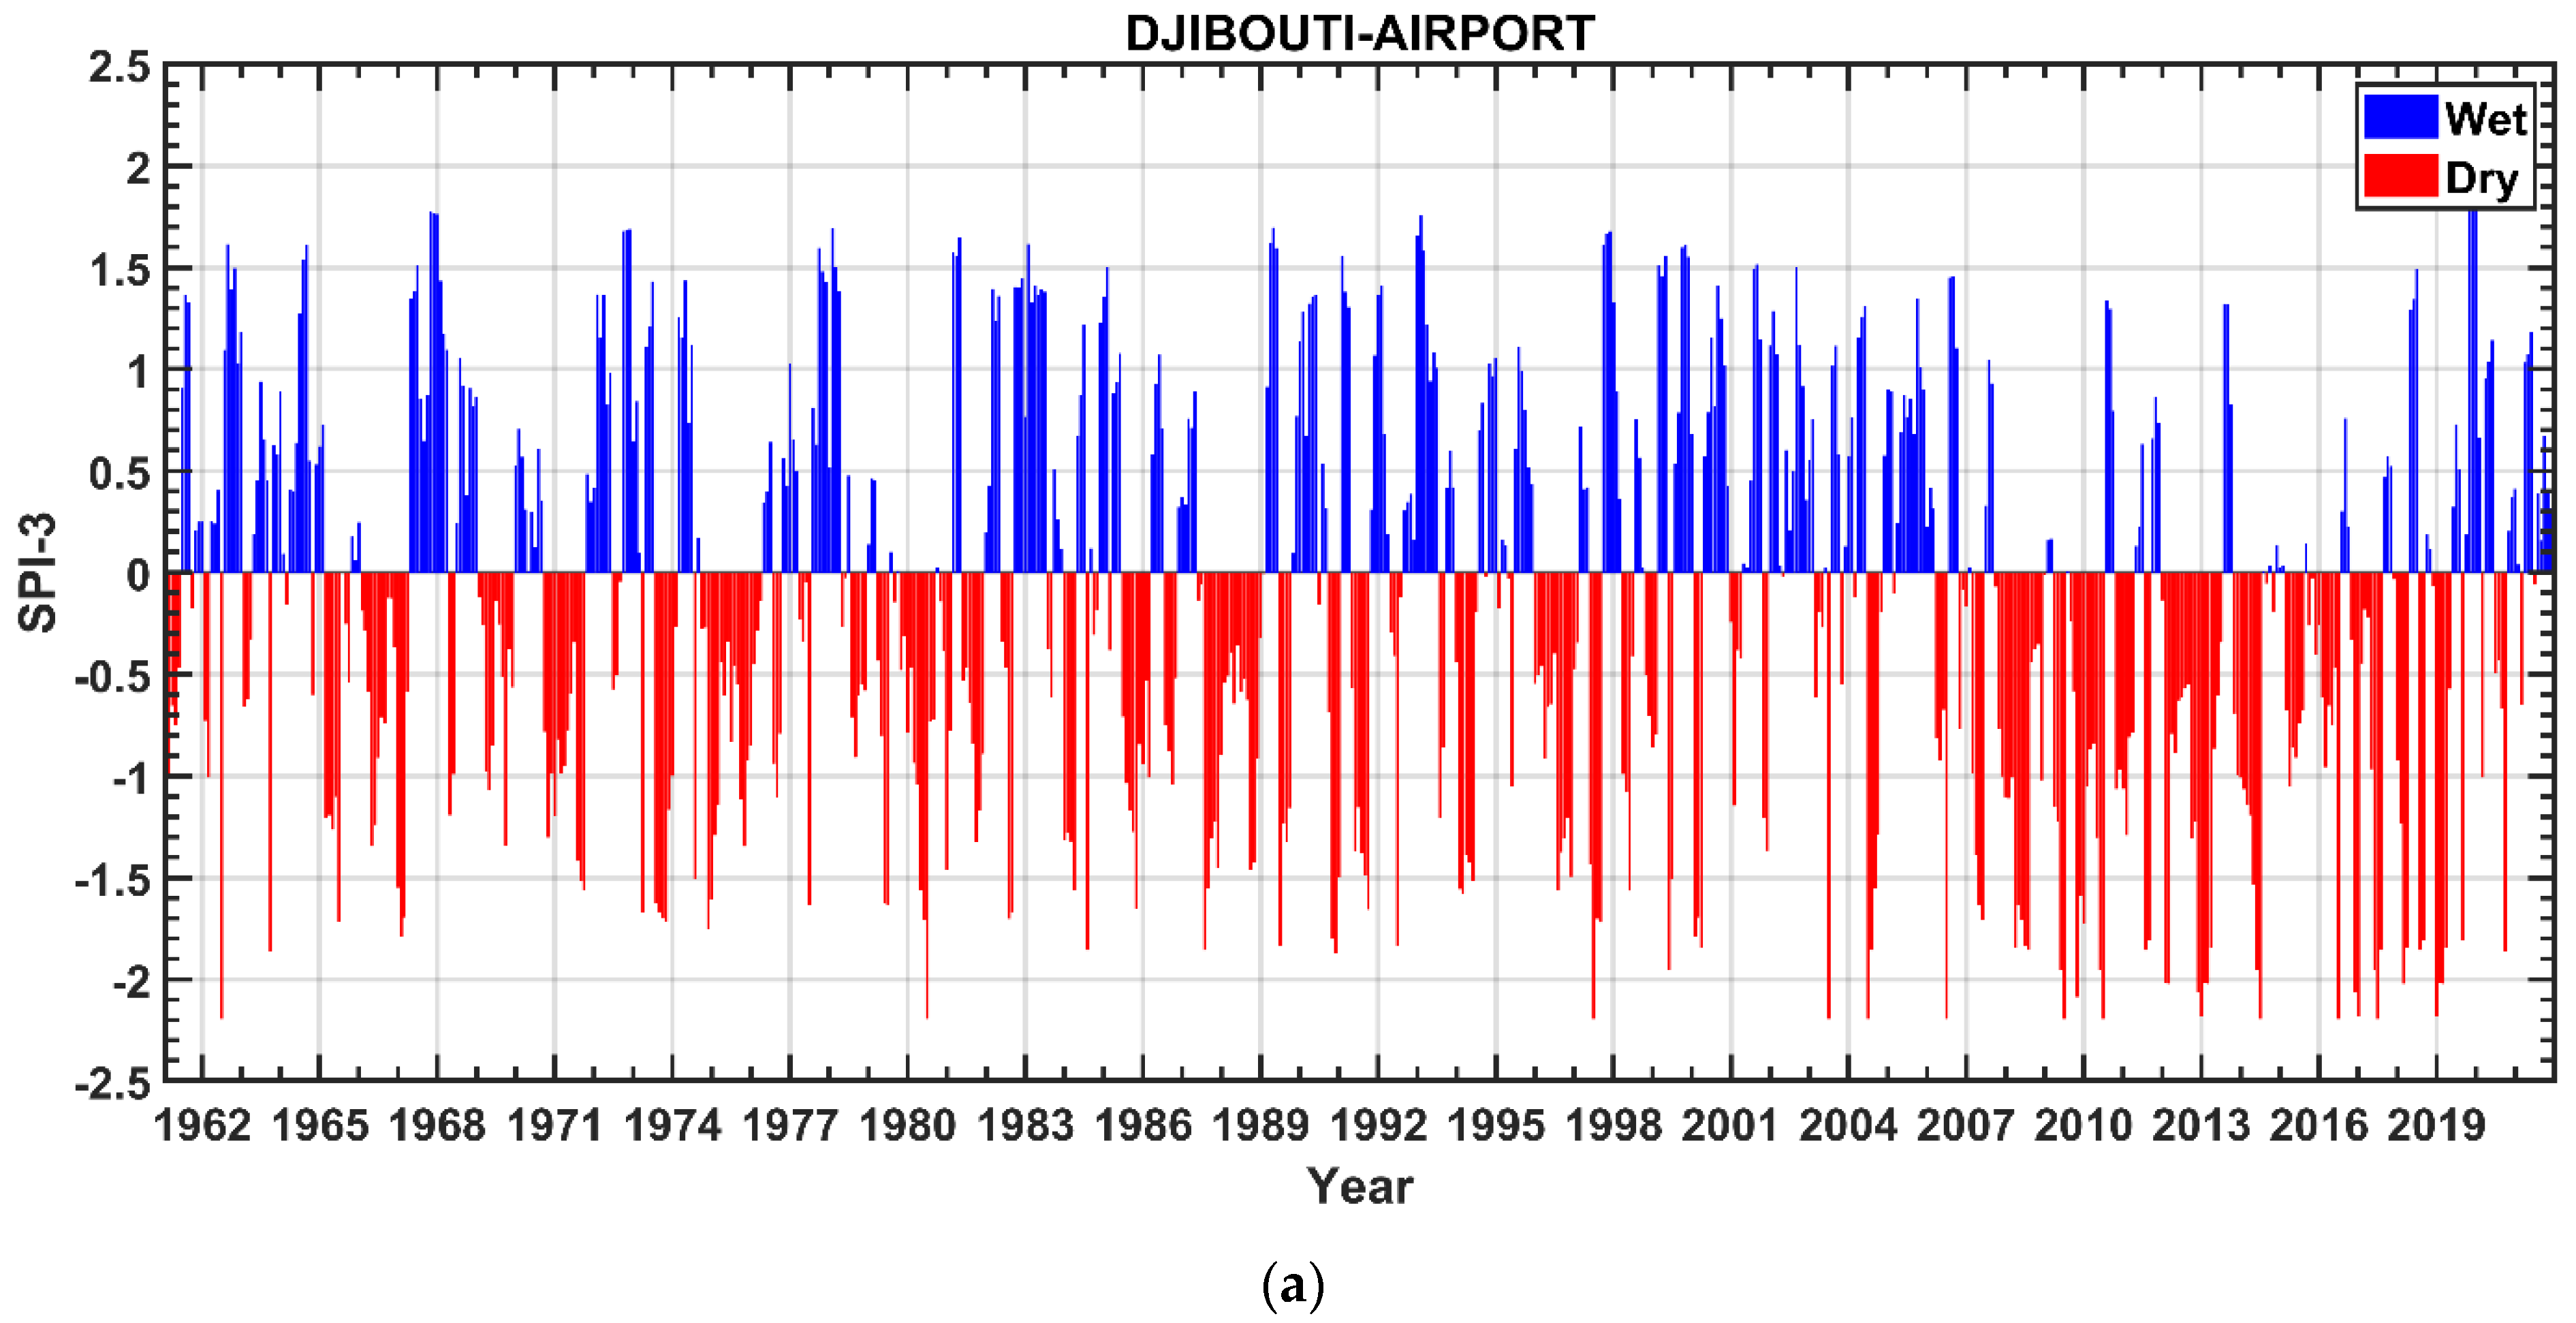
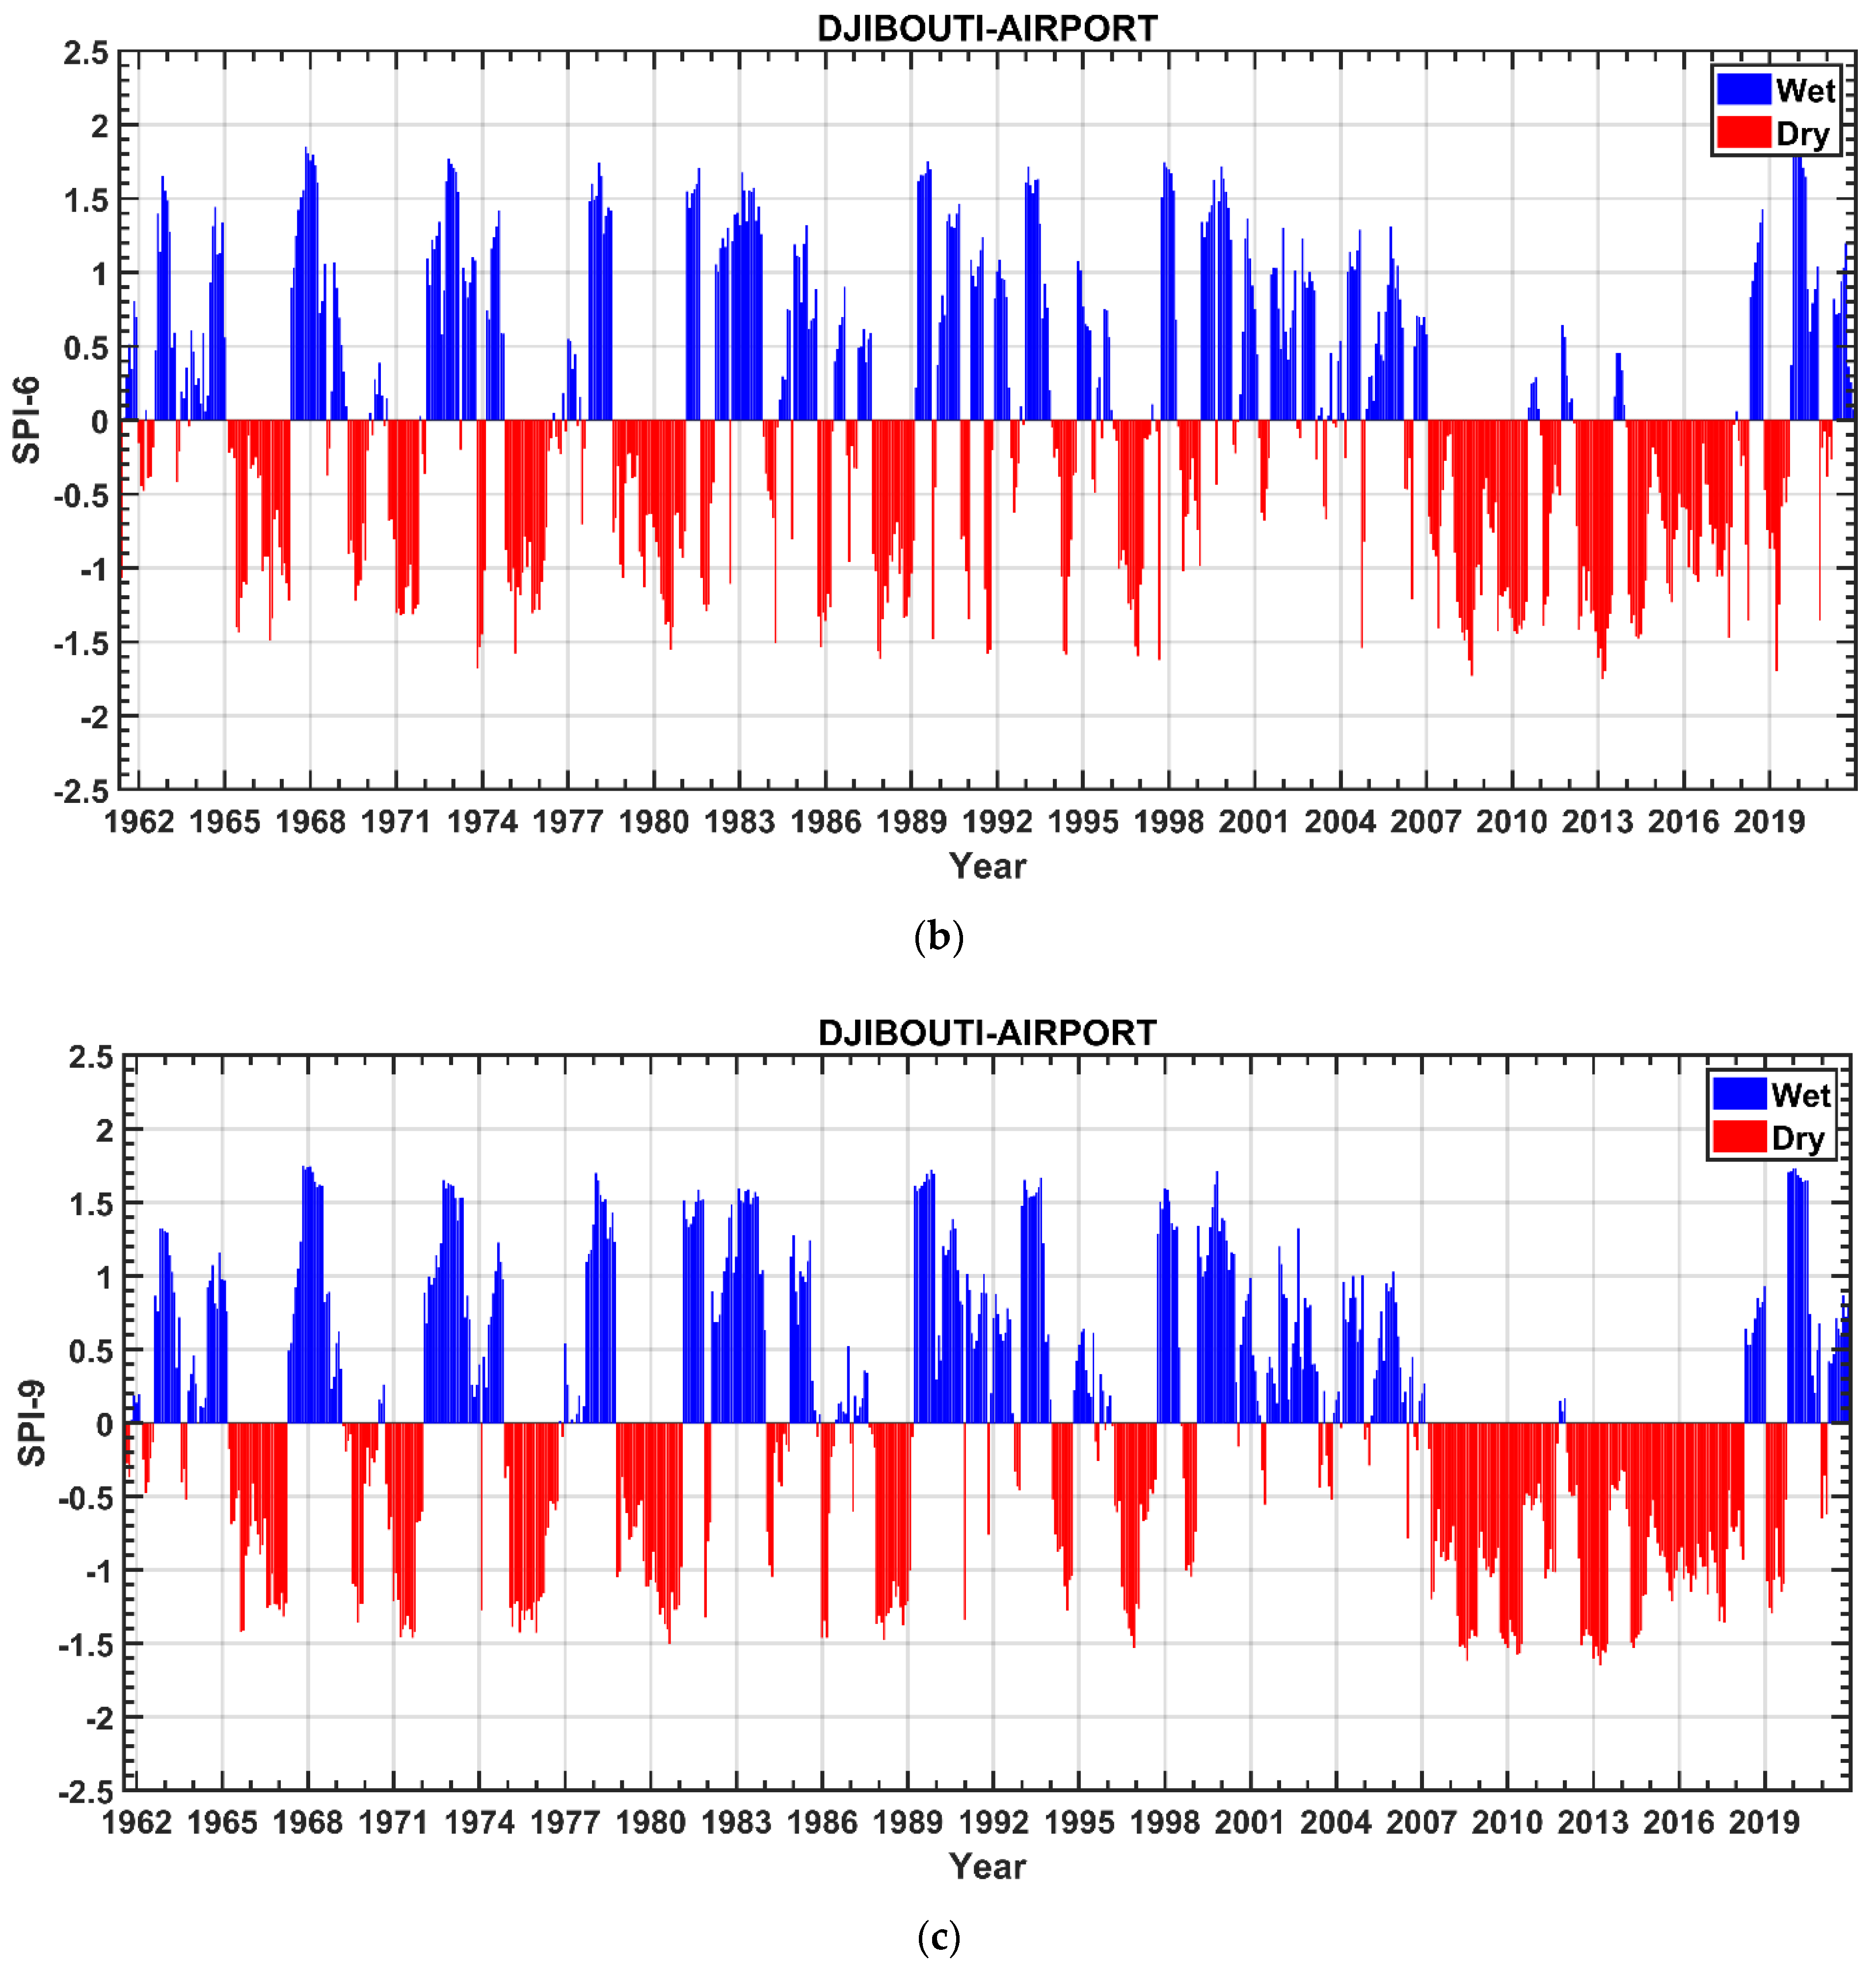
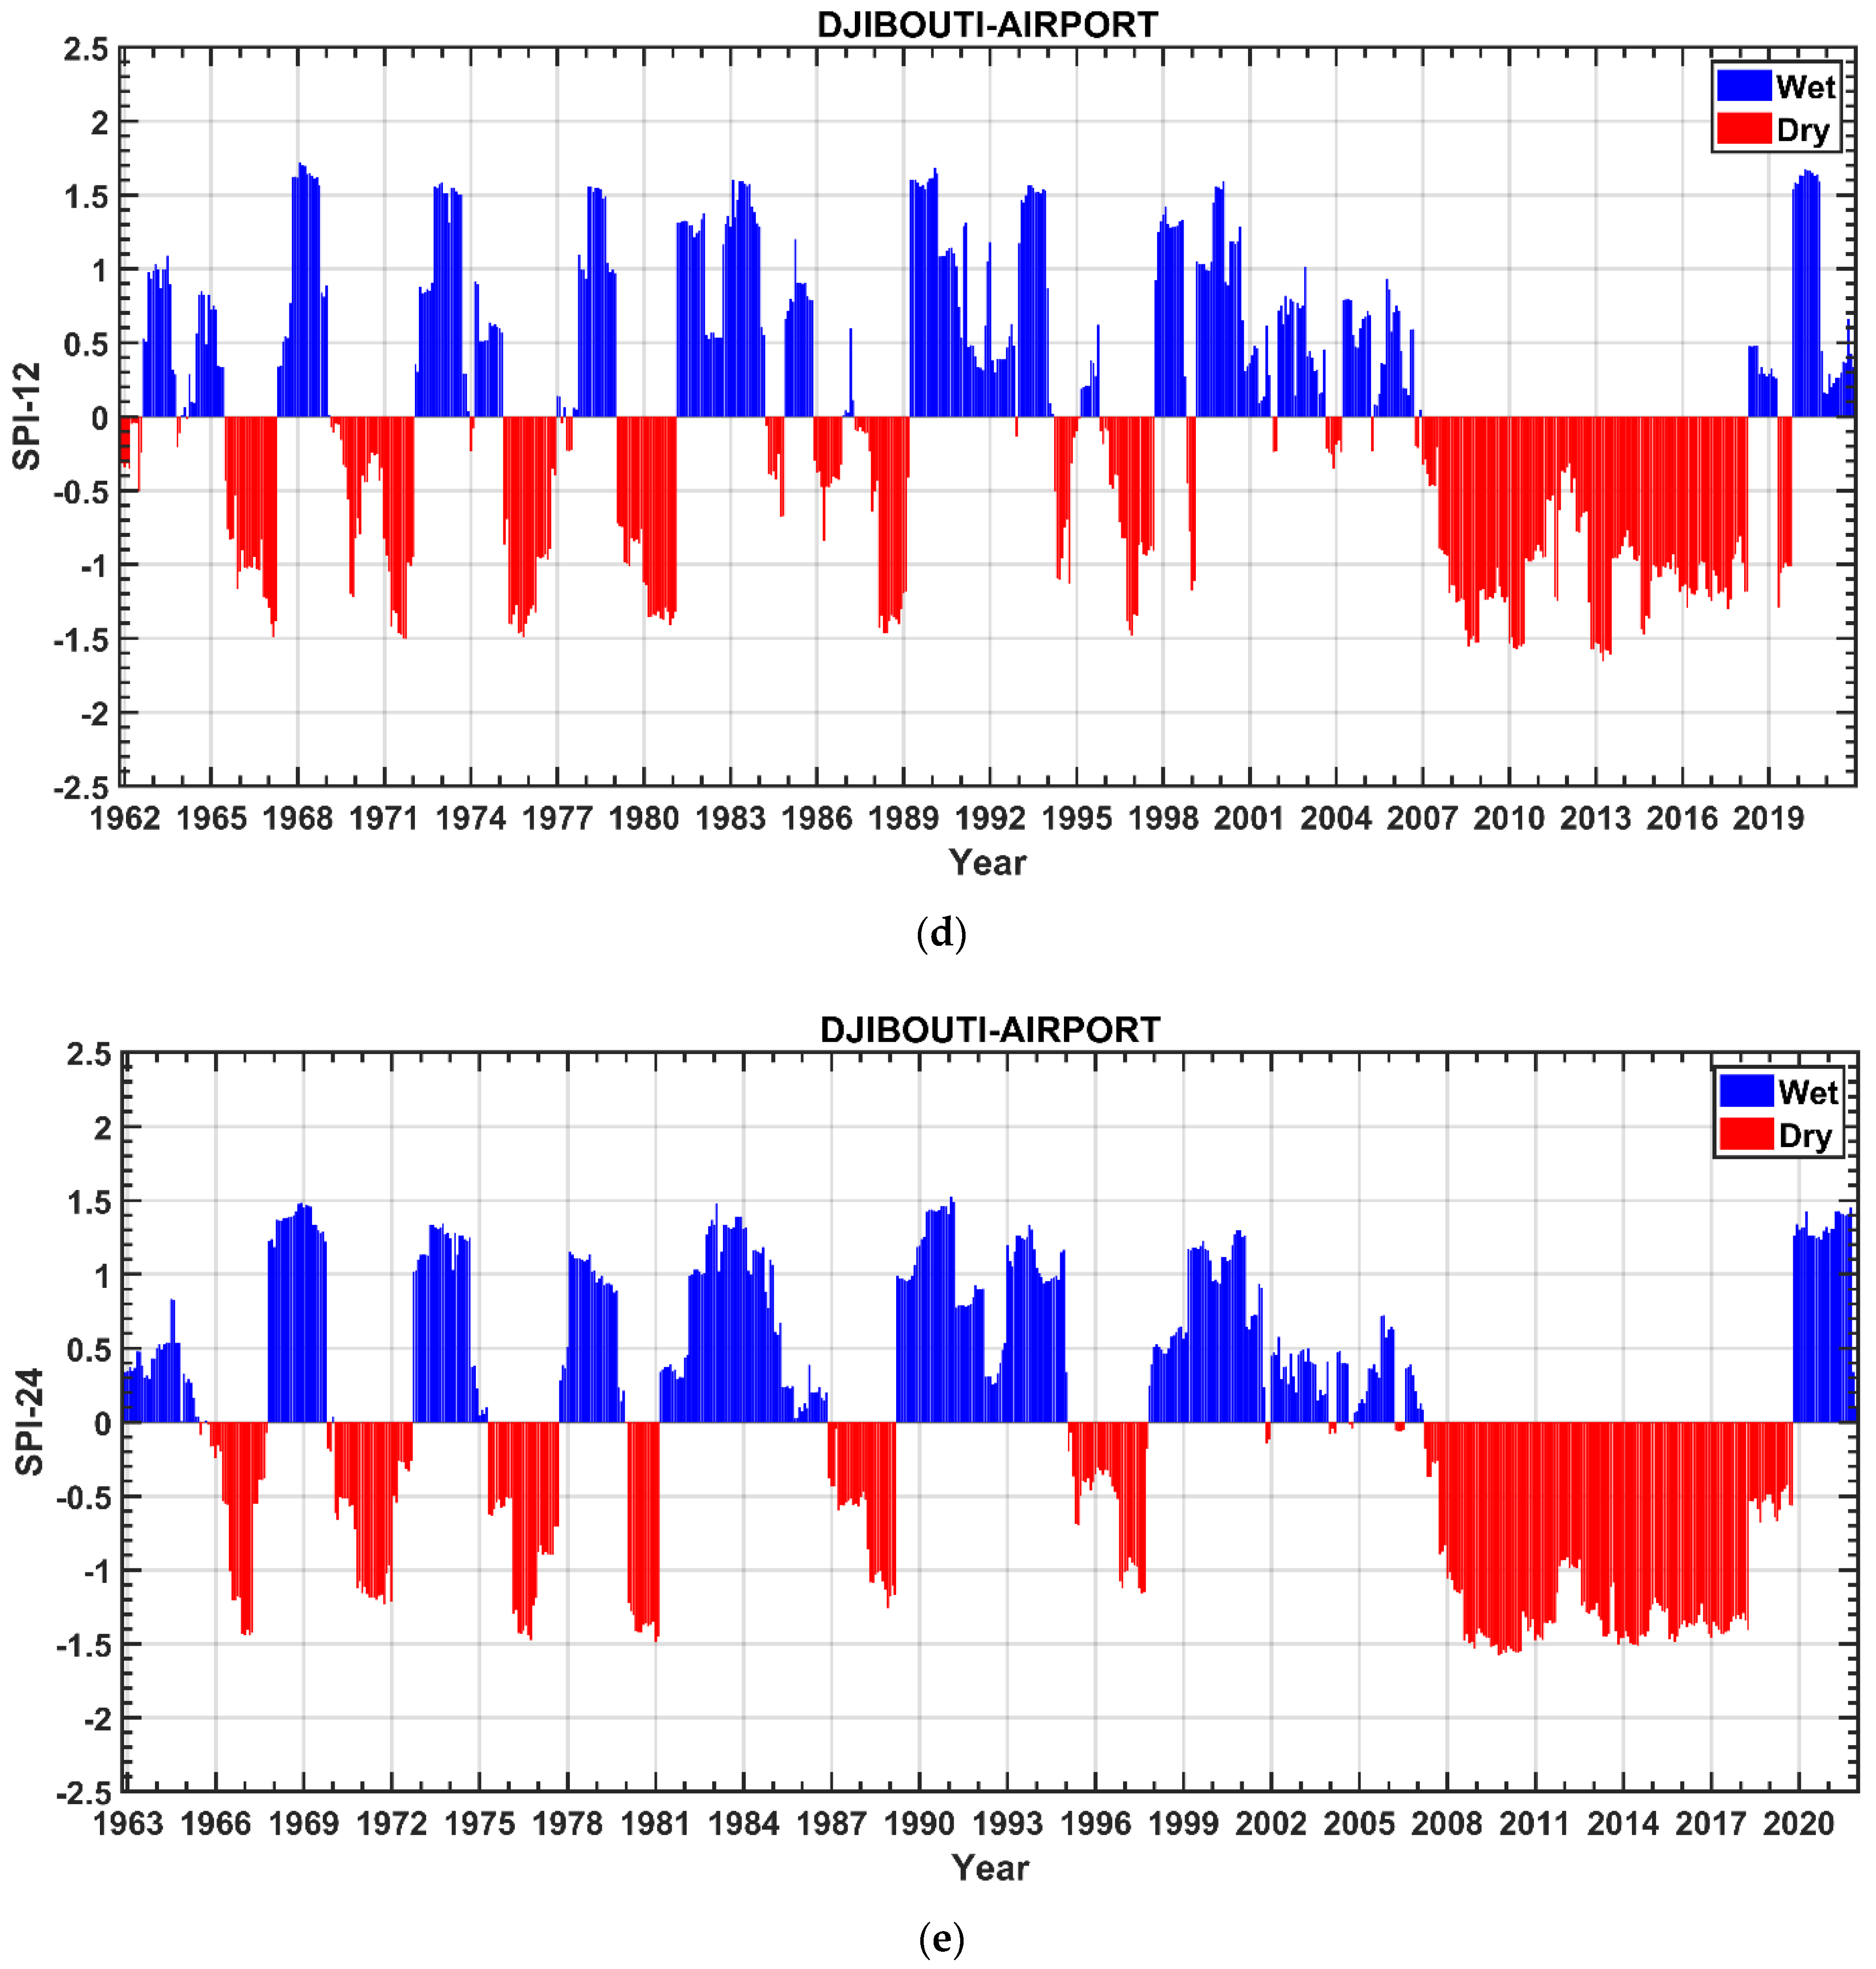
3.2. Temporal Variations in the SPI and SPEI
3.3. Annual and Seasonal Variations in Drought
3.4. Trends and Spatial Patterns of Drought Since 1981
3.5. Relationship between Droughts and SST Indices
4. Conclusions
- -
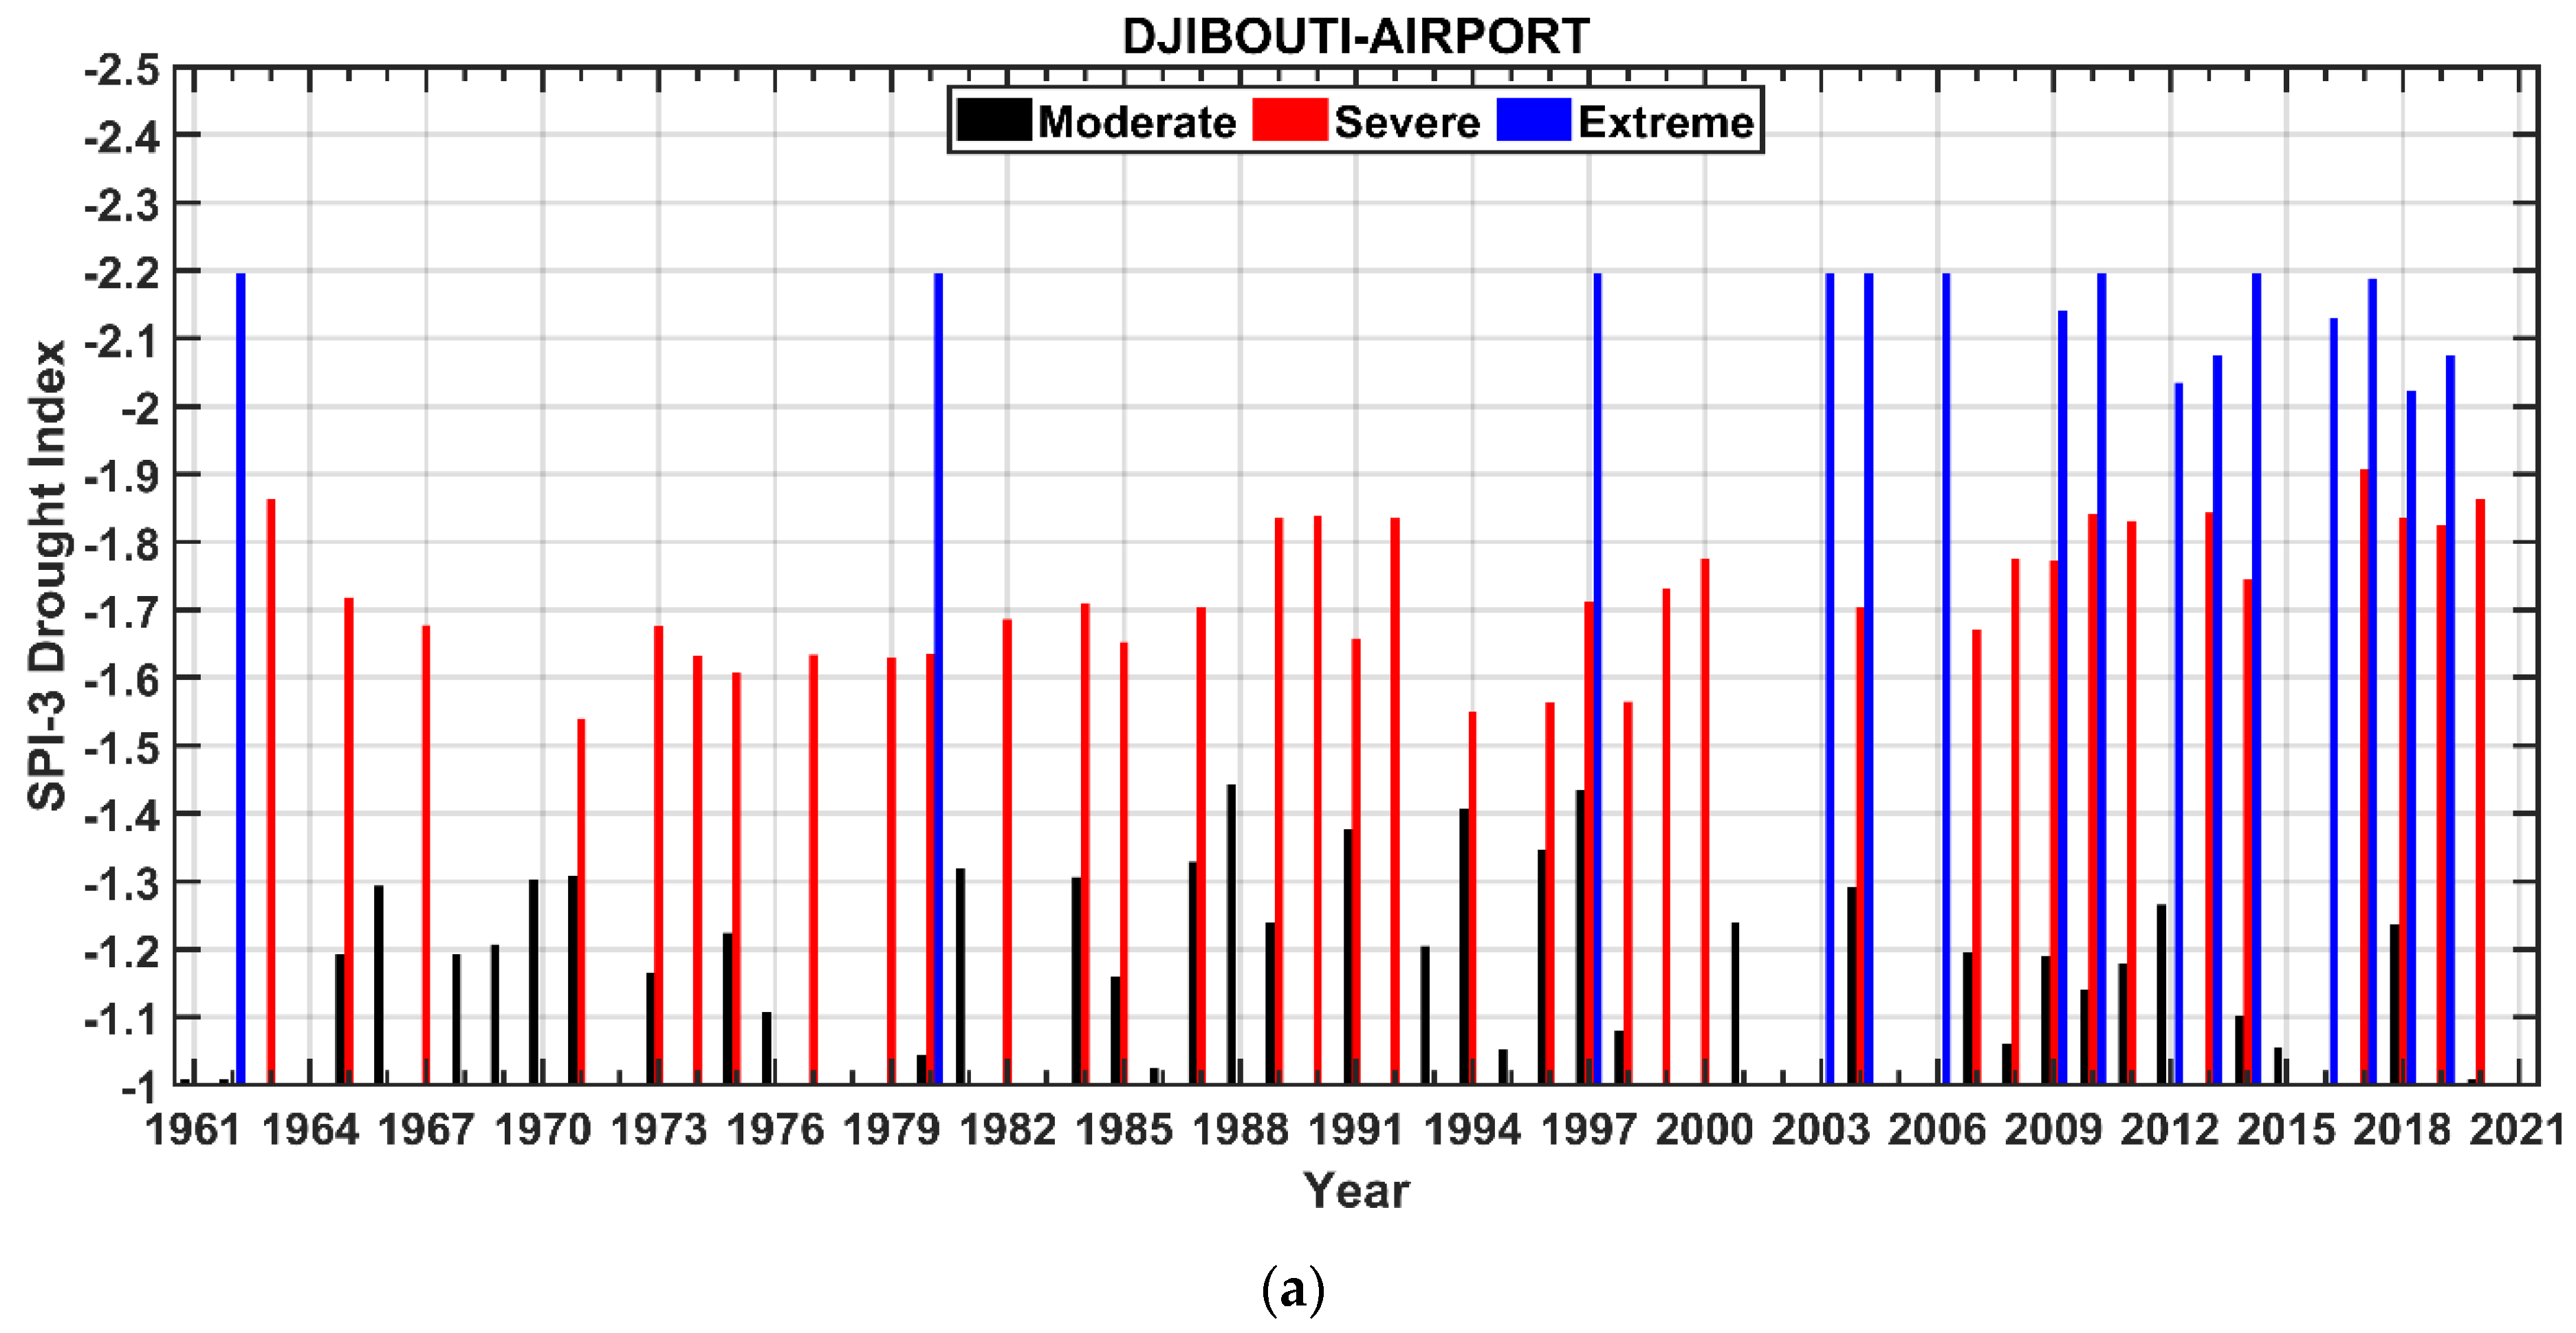
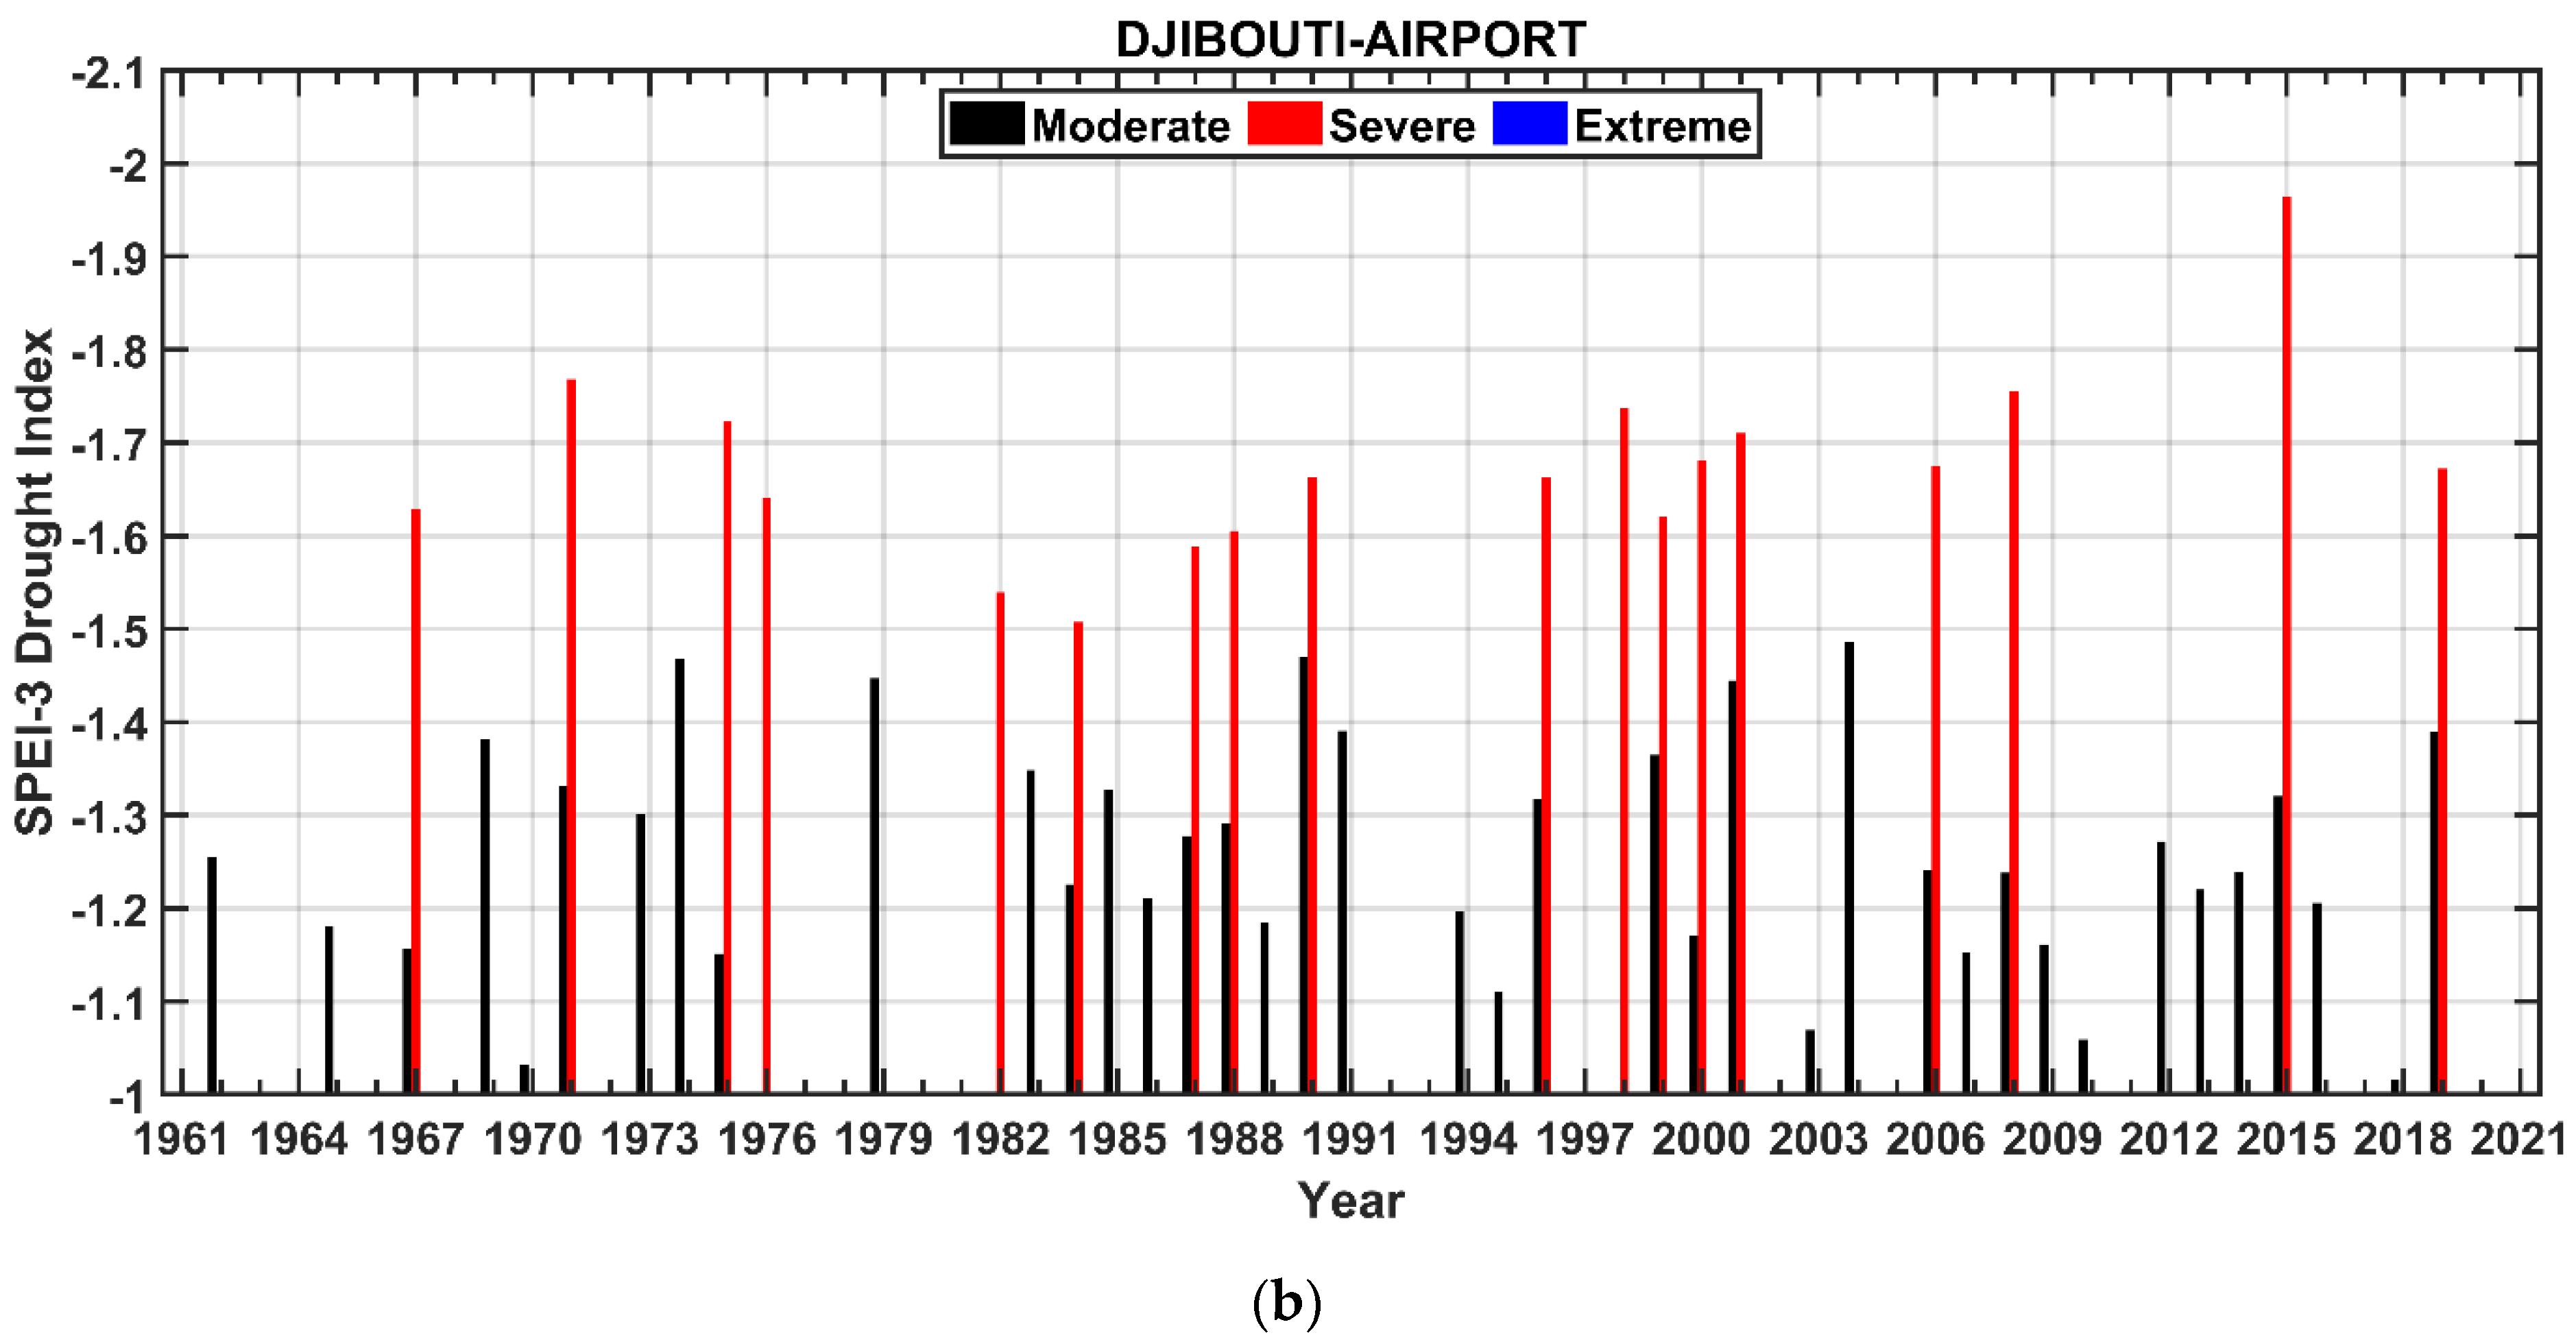
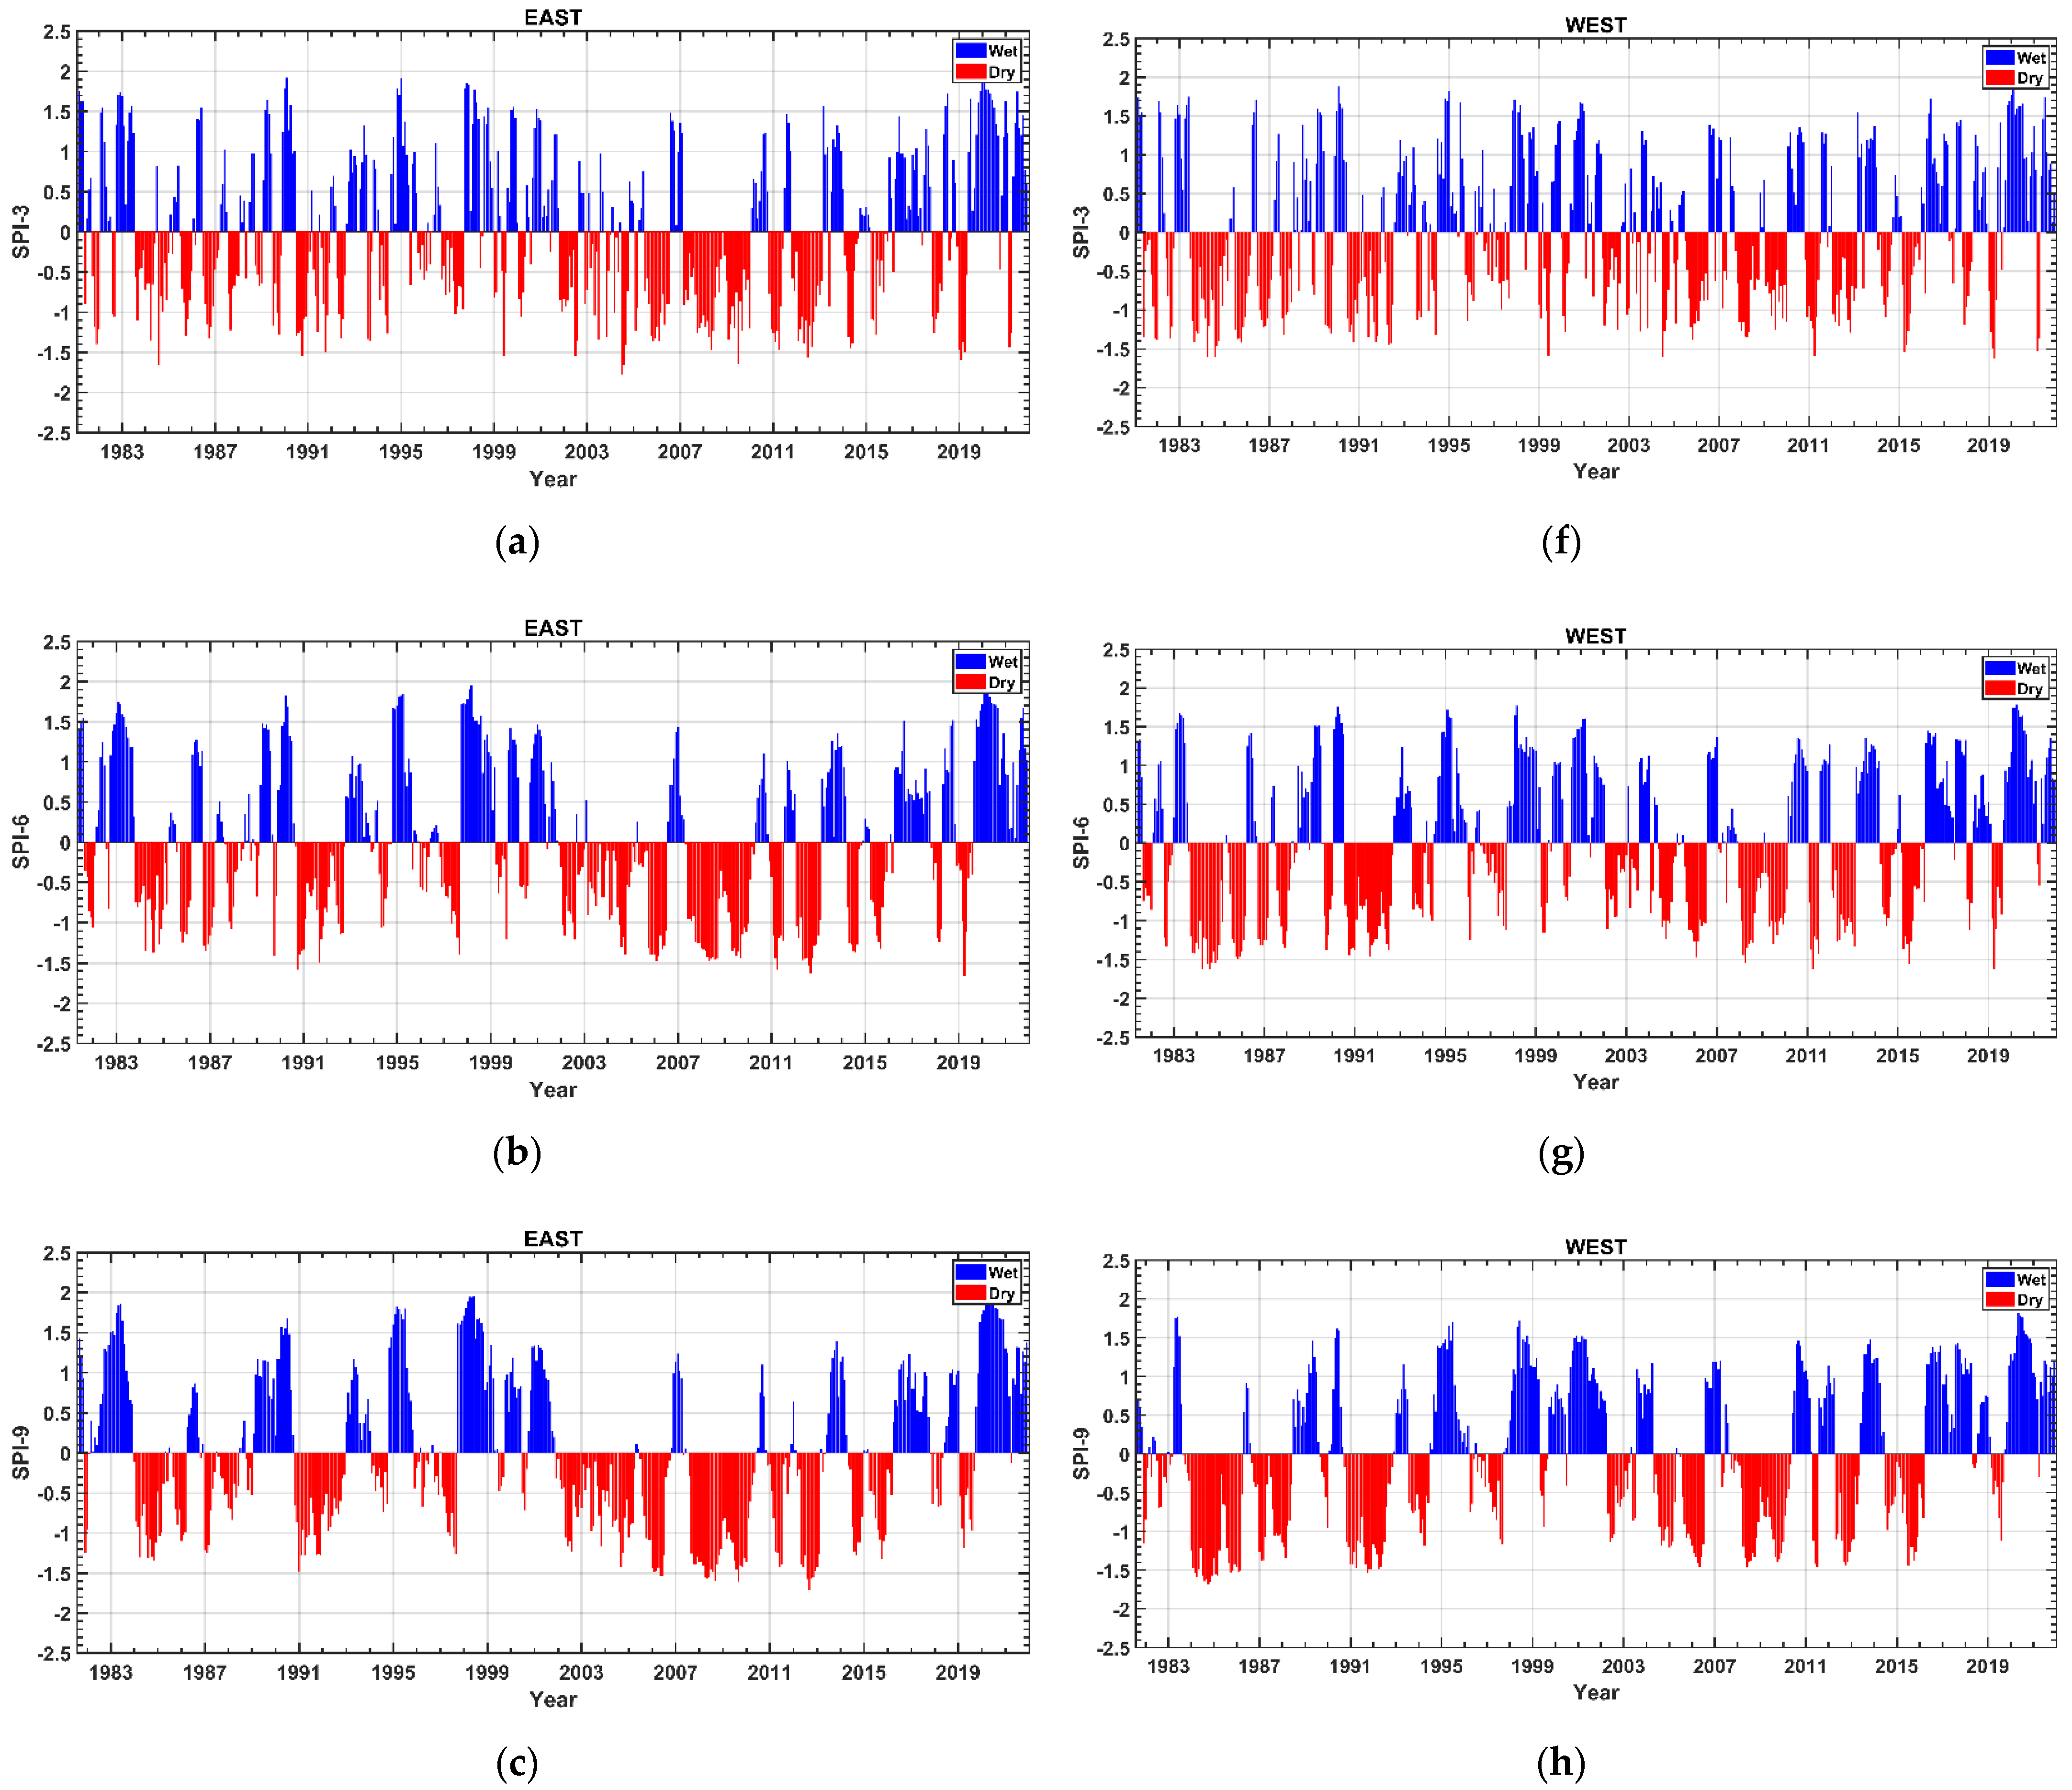
- The temporal evolution of the SPI and SPEI indicates the existence of moderate and severe drought incidents between 1961 and 2000 at the 3-month timescale. However, 12 extreme drought events have been detected by SPI-3 since 2003, representing more than 80% of the total extreme droughts in Djibouti since 1961.
- -
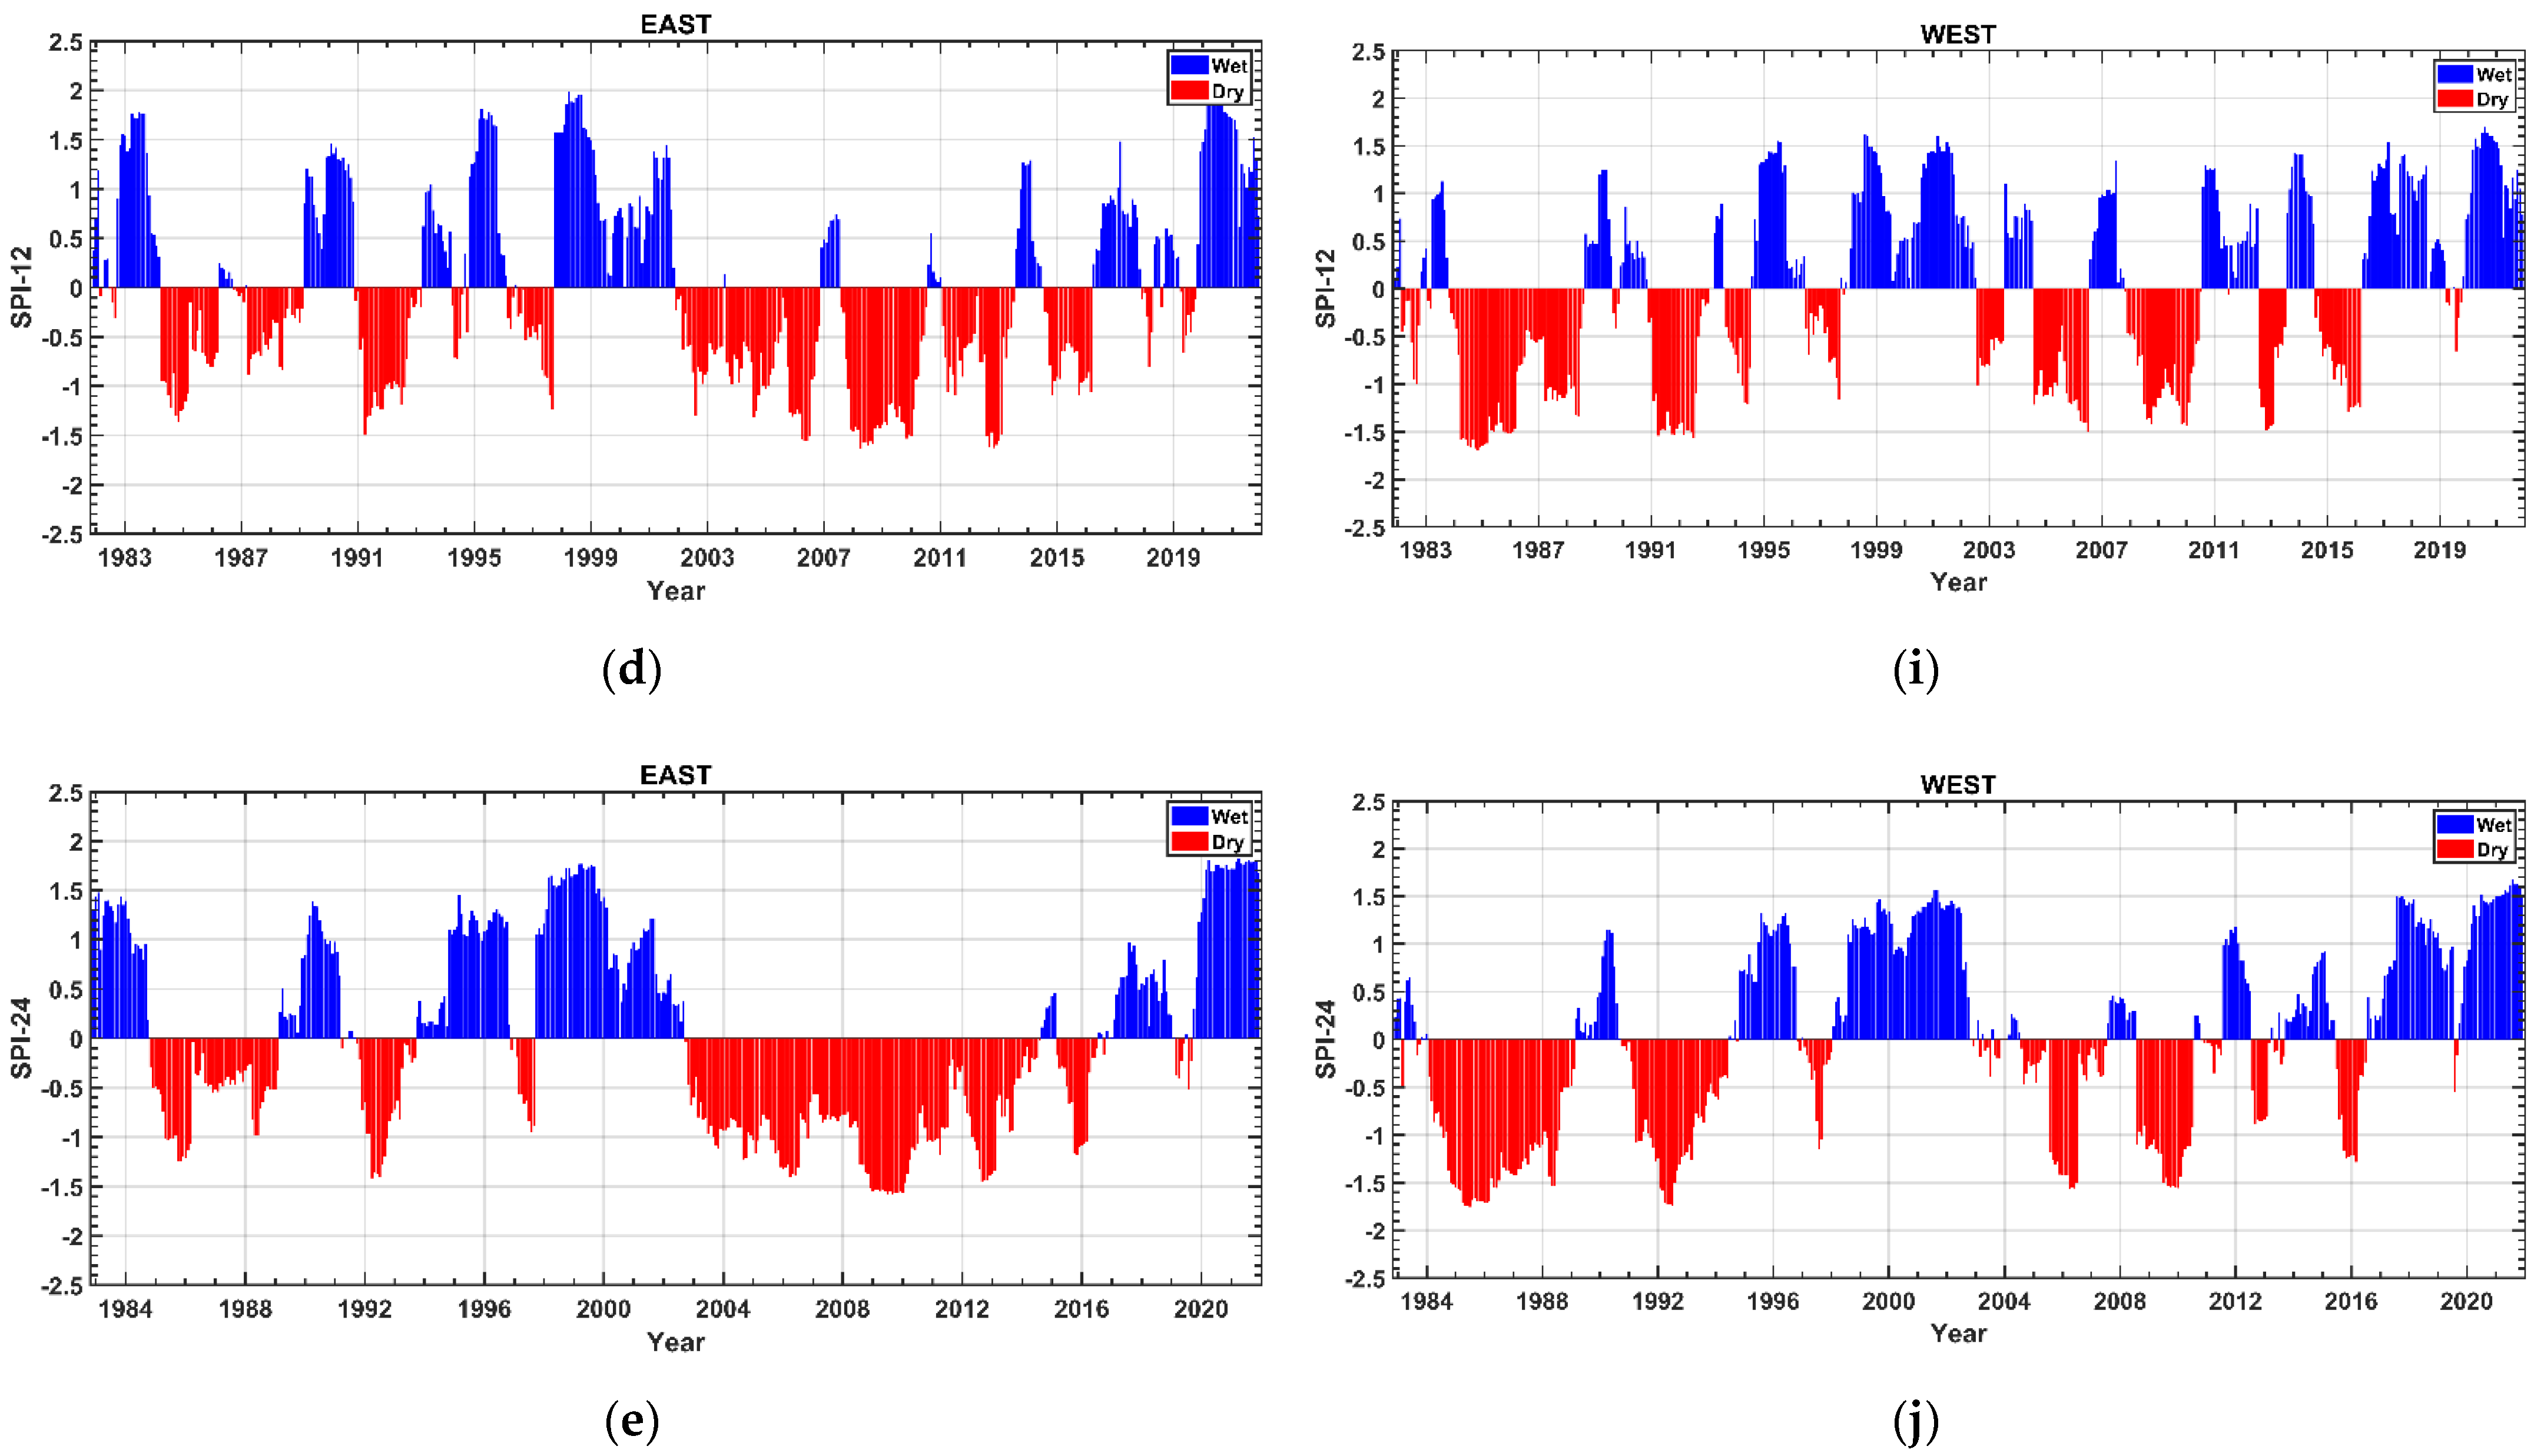
- As expected, drought events of shorter duration (detected by the 3-month SPI) are more frequent. However, the very long drought periods detected by the 12-month and 24-month indices may have more adverse effects. The longest and most intense dry period was 2007–2017 based on both the SPI and the SPEI. Within this period, the whole country experienced the droughts of 2010–2011 and 2013–2015, but the severity of droughts was much higher in the eastern region than in the western region.
- -
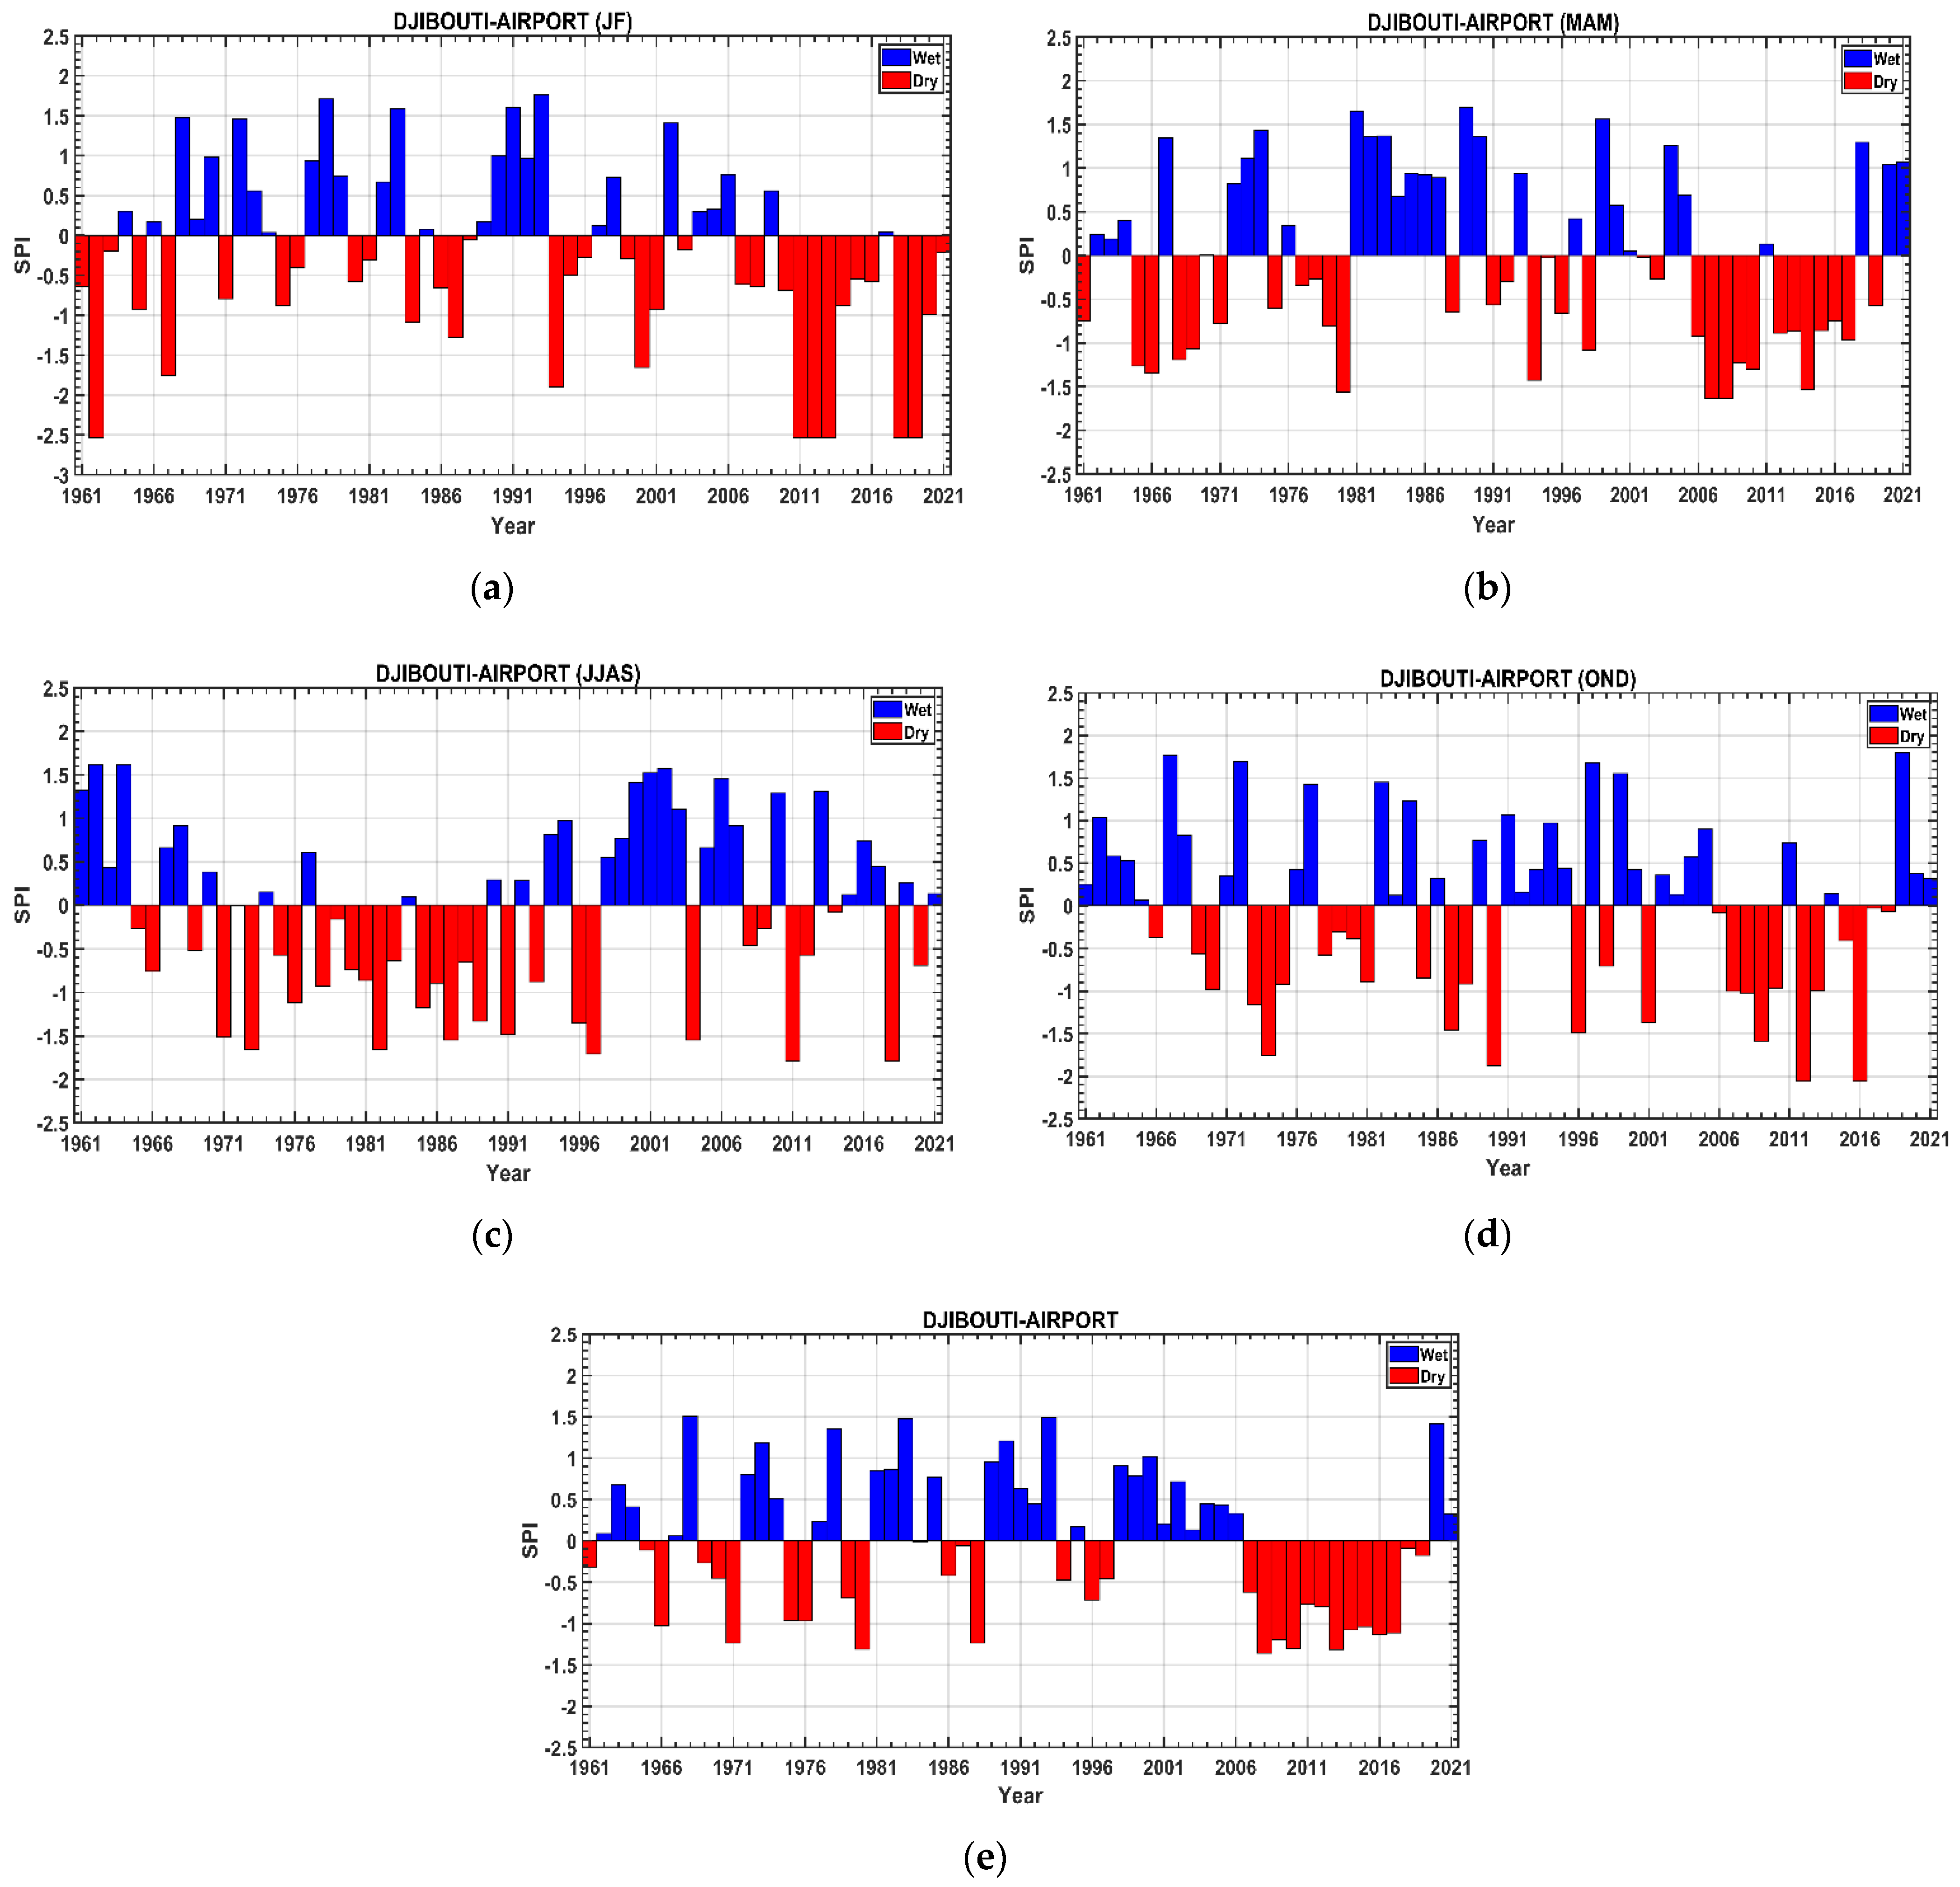
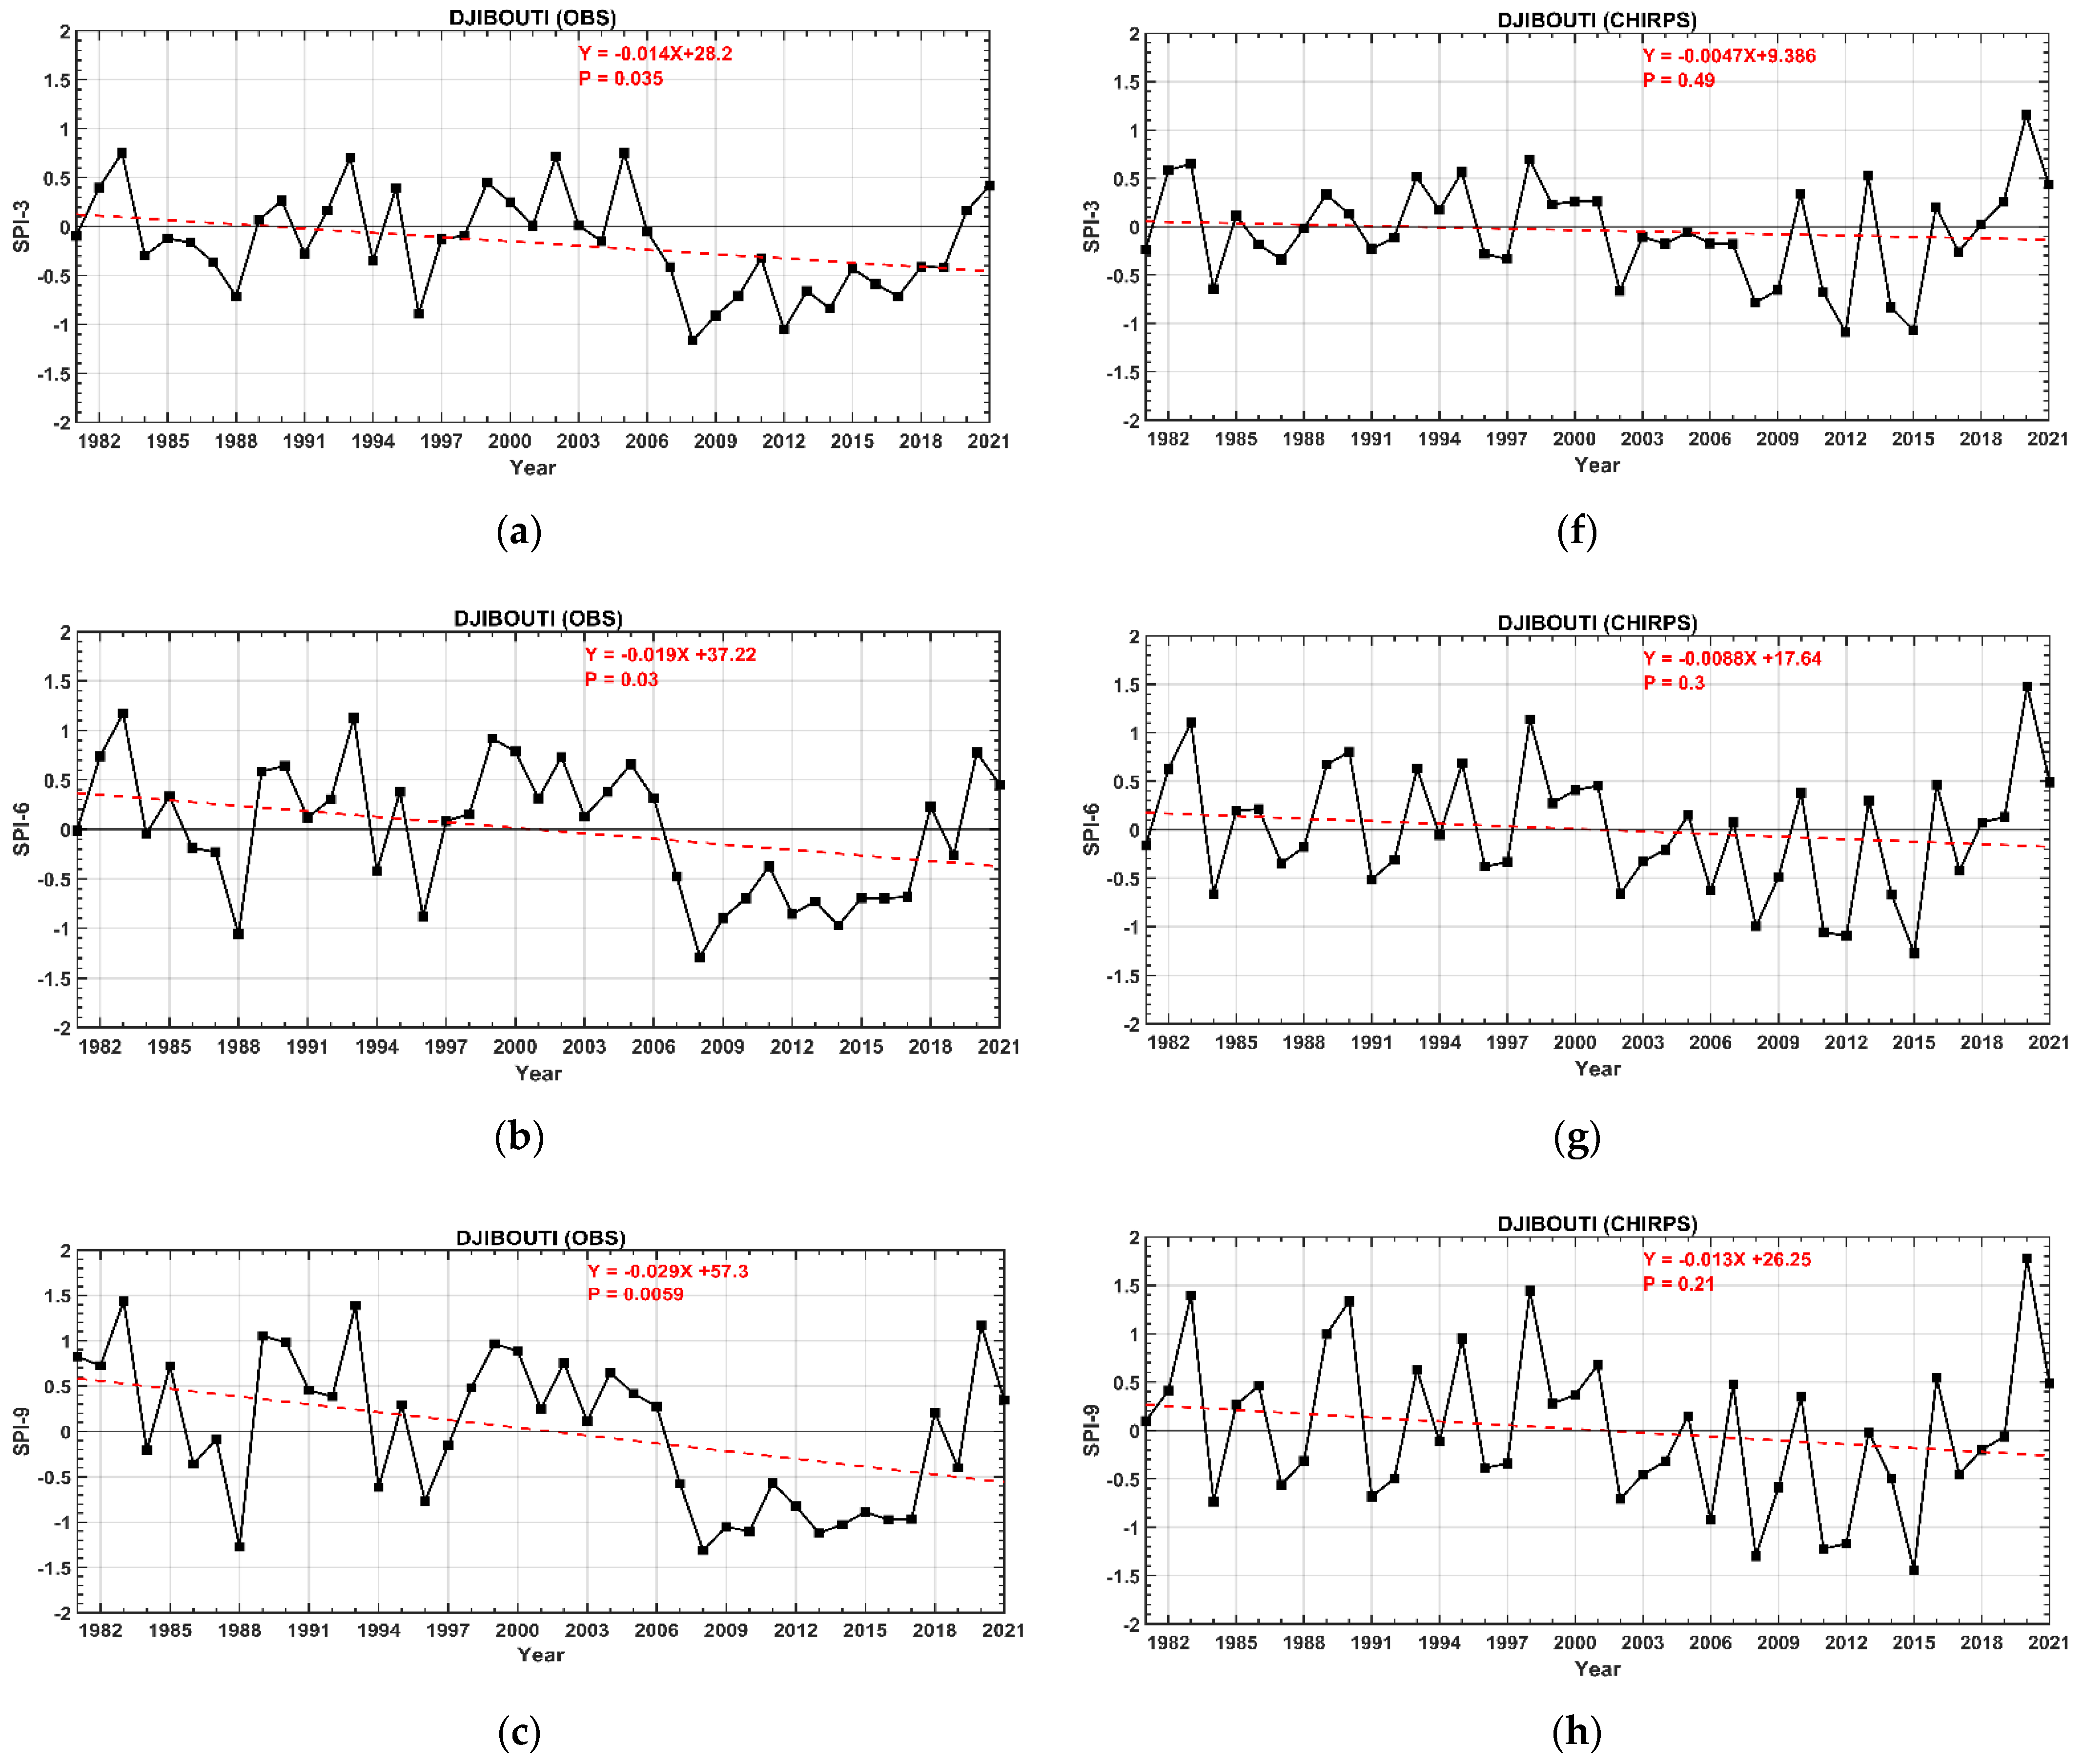
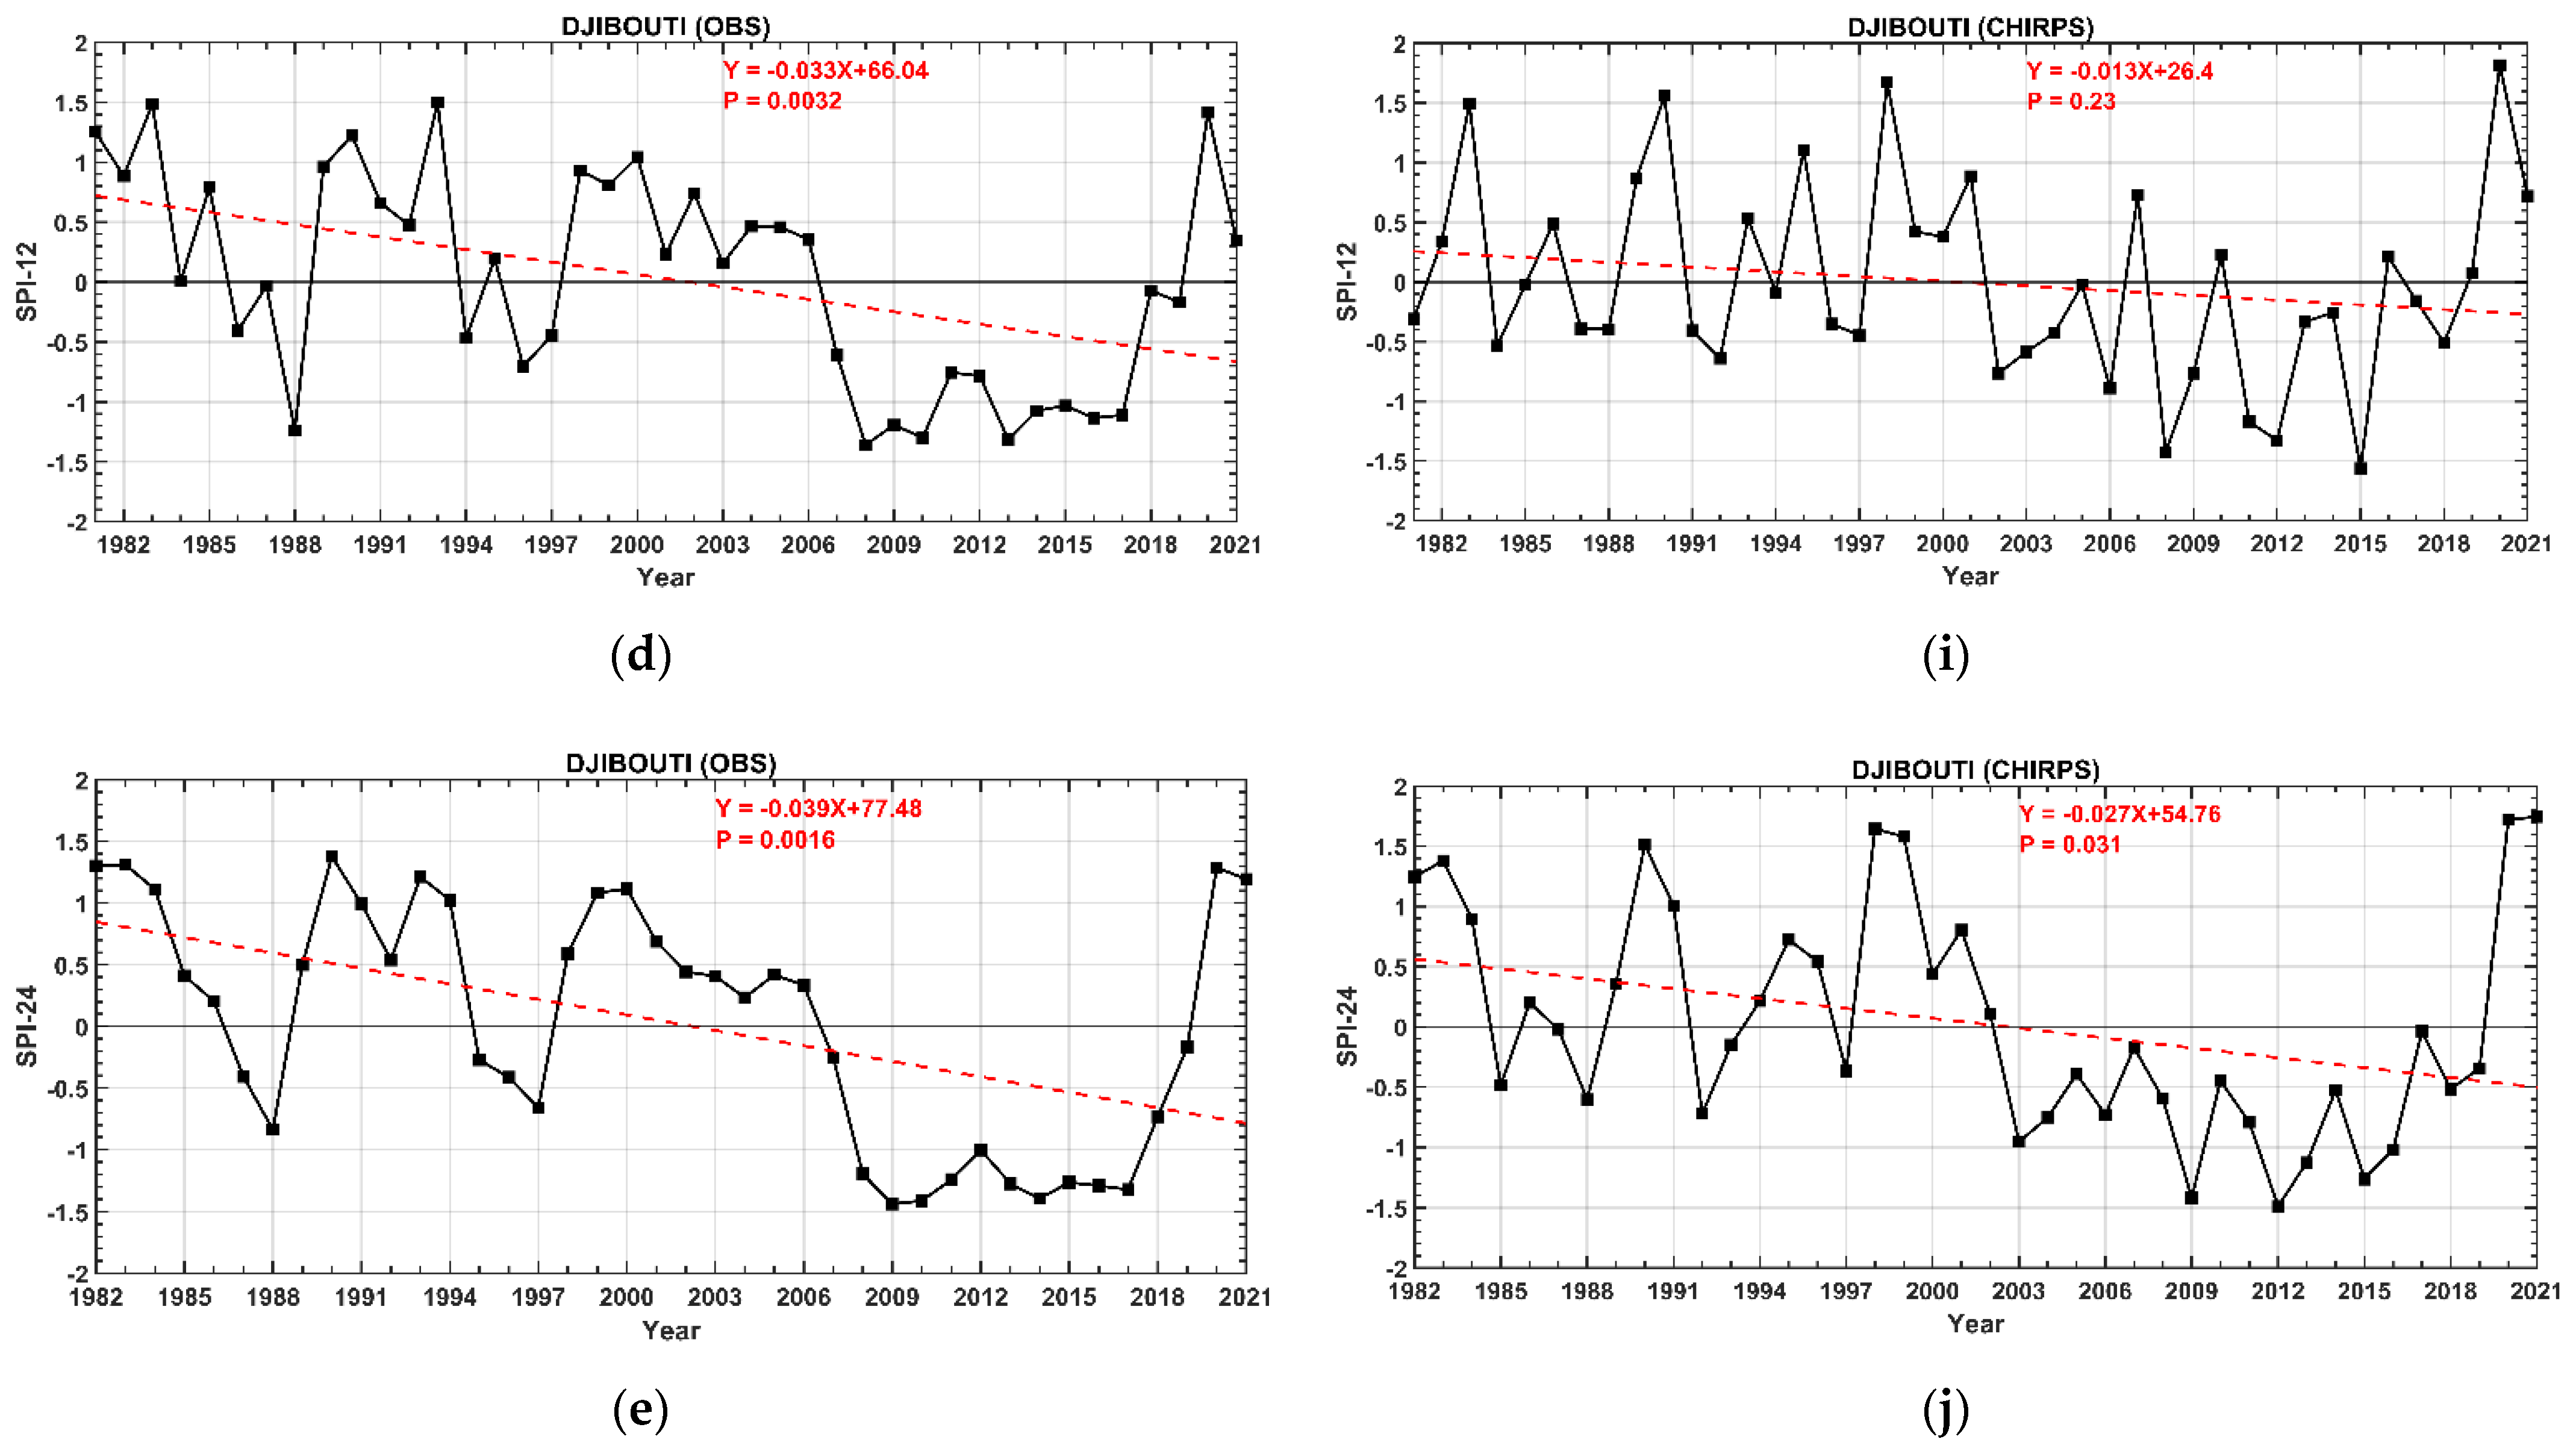
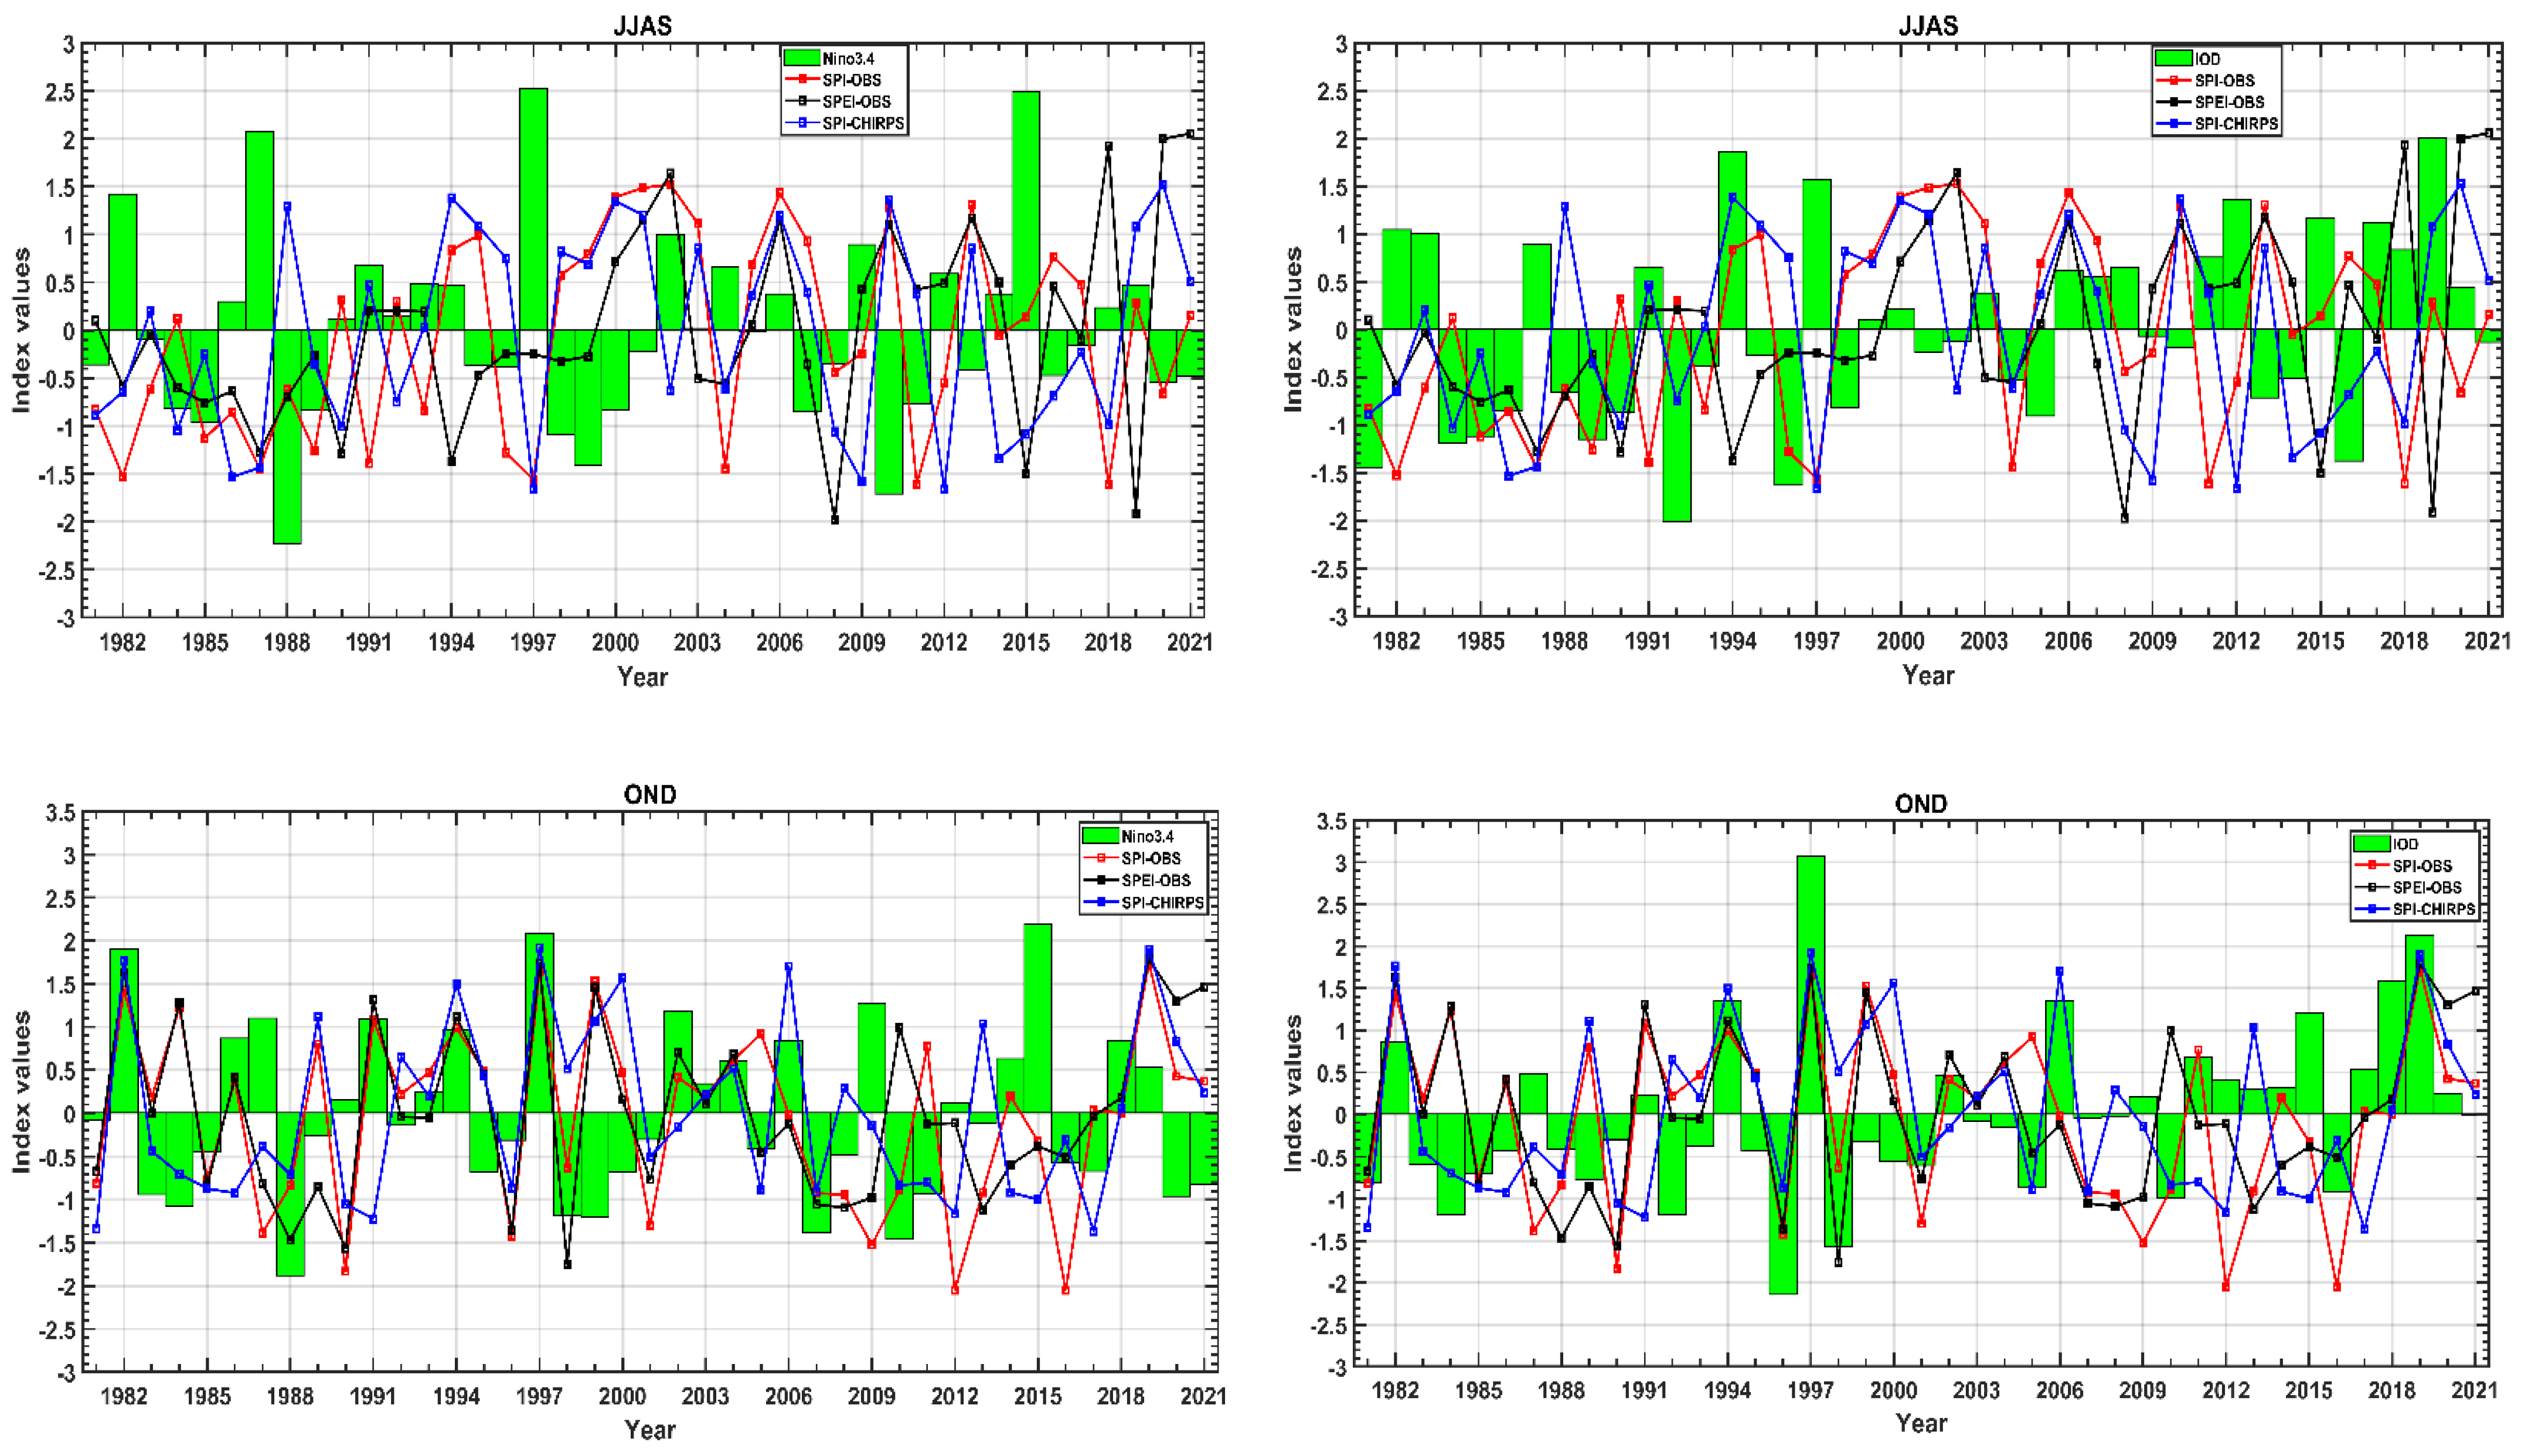
- The SPI for all timescales showed significant decreasing linear trends, while the SPEI indicated a significant decreasing trend only for the 12- and 24-month timescales at the airport station. Non-significant decreasing trends were observed with CHIRPS-SPI in the eastern subregion. Conversely, in the western part of the country, the CHIRPS-SPI trends were positive and even significant (p < 0.05). The contrasting trends for the eastern and western subregions are partially related to their different rainfall regimes, because the JJAS rains—which did not undergo the strong drying trend characteristic of the other seasons—play a dominant role in the west. The analysis also showed that the main drought events of the recent decades have tended to mainly affect the MAM and OND rainy seasons.
Supplementary Materials
Author Contributions
Funding
Institutional Review Board Statement
Informed Consent Statement
Data Availability Statement
Acknowledgments
Conflicts of Interest
References
- IPCC. Climate Change 2014. In Synthesis Report: Assessment Report of the Intergovernmental Panel on Climate Change; Core Writing Team, Pachauri, R.K., Meyer, L.A., Mach, K.J., Planton, S., von Stechow, C., Contribution of Working Groups I, II and III to the Fifth, Eds.; IPCC: Geneva, Switzerland, 2014; pp. 117–130. [Google Scholar]
- Kiros, F.G. Economic consequences of drought, crop failure and famine in Ethiopia 1973–1986. Ambio 1991, 20, 183–185. [Google Scholar]
- Lyon, B. Seasonal drought in the Greater Horn of Africa and its recent increase during the March–May long rains. J. Clim. 2014, 27, 7953–7975. [Google Scholar] [CrossRef]
- Ellis, J.; Galvin, K.A. Climate Patterns and Land-Use Practices in the Dry Zones of Africa. BioScience 1994, 44, 340–349. [Google Scholar] [CrossRef]
- Camberlin, P. More variable tropical climates have a slower demographic growth. Clim. Res. 2010, 41, 157–167. [Google Scholar] [CrossRef] [Green Version]
- Ayana, E.K.; Ceccato, P.; Fisher, J.R.B.; DeFries, R. Examining the relationship between environmental factors and conflict in pastoralist areas of East Africa. Sci. Total Environ. 2016, 557–558, 601–611. [Google Scholar] [CrossRef]
- IPCC. Climate Change 2007. In The Physical Science Basis; Solomon, S., Ed.; Contribution of Working Group I to the Fourth Assessment Report of the Intergovernmental Panel on Climate Change; Cambridge University Press: Cambridge, UK, 2007. [Google Scholar]
- Zhao, T.; Dai, A. The magnitude and causes of global drought changes in the twenty-first century under a low–moderate emissions scenario. J. Clim. 2015, 28, 4490–4512. [Google Scholar] [CrossRef]
- Nicholson, S.E. Climate and climatic variability of rainfall over Eastern Africa. Rev. Geophys. 2017, 55, 590–635. [Google Scholar] [CrossRef] [Green Version]
- Muller, J.C.Y. Adapting to climate change and addressing drought–learning from the Red Cross Red Crescent experiences in East Africa. Weather Clim. Extremes 2014, 3, 31–36. [Google Scholar] [CrossRef] [Green Version]
- Viste, E.; Korecha, D.; Sorteberg, A. Recent drought and precipitation tendencies in Ethiopia. Theor. Appl. Climatol. 2013, 112, 535–551. [Google Scholar] [CrossRef] [Green Version]
- AghaKouchak, A. A multivariate approach for persistence-based drought prediction: Application to the 2010–2011 East Africa drought. J. Hydrol. 2015, 526, 127–135. [Google Scholar] [CrossRef]
- World Meteorological Organization (WMO). Drought Tightens Grip in Eastern Africa. 2022. Available online: https://public.wmo.int/en/media/news/drought-tightens-grip-eastern-africa (accessed on 25 September 2022).
- République de Djibouti, Evaluation des Dommages, Pertes et Besoins Suite à la Sécheresse. In Gouvernement de la République de Djibouti/Global Forum for Disaster Risk Reduction; GFDRR, Ministère de l’économie et de Finance: Djibouti City, Djibouti, 2011; p. 105. Available online: https://www.gfdrr.org/sites/default/files/publication/Djibouti_PDNA.pdf (accessed on 1 September 2022).
- Ozer, P.; Mahamoud, A.; Nour, A.M.; Saad, O.; Camberlin, P.; Gemenne, F.; de Longueville, F. Sécheresse, migration et vulnérabilité à Djibouti-Ville. In Proceedings of the Colloque International La Géographie Physique et les Risques Naturels, Liège, Belgium, 29–30 June 2014; p. 26. [Google Scholar]
- Chiré, A.S. Le Nomade et la Ville à Djibouti Stratégies D’Insertion Urbaine et production de Territoire, book Ed; Karthala: Paris, France, 2012; pp. 17–56. [Google Scholar]
- Ozer, P.; Mahamoud, A. Recent extreme precipitation and temperature changes in Djibouti City (1966–2011). J. Climatol. 2013, 2013, 928501. [Google Scholar] [CrossRef]
- Dabar, O.A.; Waberi, M.M.; Camberlin, P.; Pohl, B.; Awaleh, M.O.; Silah-Eddine, S. Spatial and temporal variability of rainfall over the Republic of Djibouti from 1946 to 2017. Int. J. Climatol. 2021, 41, 2729–2748. [Google Scholar] [CrossRef]
- McKee, T.B.; Doesken, N.J.; Kleist, J. The relationship of drought frequency and duration to time scales. In Proceedings of the 8th Conference on Applied Climatology, Boston, MA, USA, 17–22 January 1993; pp. 179–183. [Google Scholar]
- Vicente-Serrano, S.M.; Beguería, S.; López-Moreno, J.I. A Multiscalar Drought Index Sensitive to Global Warming: The Standardized Precipitation Evapotranspiration Index. J. Clim. 2010, 23, 1696–1718. [Google Scholar] [CrossRef] [Green Version]
- Beltrando, G.; Camberlin, P. Interannual variability of rainfall in the eastern horn of Africa and indicators of atmospheric circulation. Int. J. Clim. 1993, 13, 533–546. [Google Scholar] [CrossRef]
- Funk, C.; Harrison, L.; Shukla, S.; Hoell, A.; Korecha, D.; Magadzire, T.; Husak, G.; Galu, G. Assessing the contributions of local and East Pacific warming to the 2015 droughts in Ethiopia and Southern Africa. Bull. Am. Meteorol. Soc. 2016, 96, S75–S80. [Google Scholar] [CrossRef] [Green Version]
- Gissila, T.; Black, E.; Grimes, D.I.F.; Slingo, J.M. Seasonal forecasting of the Ethiopian summer rains. Int. J. Clim. 2004, 24, 1345–1358. [Google Scholar] [CrossRef]
- Liebmann, B.; Hoerling, M.P.; Funk, C.; Bladé, I.; Dole, R.M.; Allured, D.; Quan, X.; Pegion, P.; Eischeid, J.K. Understanding recent Eastern Horn of Africa rainfall variability and change. J. Clim. 2014, 27, 8630–8645. [Google Scholar] [CrossRef]
- Seregina, L.; Ermert, V.; Fink, A.H.; Pinto, J.G. Trends and Variability in East African Rainfall and Temperature Observations. In EGU General Assembly Conference Abstracts; EGU: Munich, Germany, 2014; p. 6088. [Google Scholar]
- Wainwright, C.M.; Marsham, J.H.; Keane, R.J.; Rowell, D.P.; Finney, D.L.; Black, E.; Allan, R.P. Eastern African Paradox rainfall decline due to shorter not less intense Long Rains. NPJ Clim. Atmos. Sci. 2019, 2, 1–9. [Google Scholar] [CrossRef] [Green Version]
- Ahmed, M.M.; Adan, A.I.; Awaleh, M.O.; Rozmaric, M.; Blinova, O.; Ismael, I.S.; Chirdon, M.A. Hg and 210Po in consumed fish of the Tadjoura Gulf (Djibouti): Levels and human health risk assessment. Mar. Pollut. Bull. 2021, 172, 112855. [Google Scholar] [CrossRef]
- Beau, A.; Bourhis, E.; Berges, R. Aperçu de climatologie dynamique du Territoire Français des Afars et des Issas. Météorologie 1976, 6, 63–68. [Google Scholar]
- Dabar, O.A.; Lennart, S.; Awaleh, M.O.; Kirk-Davidoff, D.; Olauson, J.; Awaleh, S.I. Wind resource assessment and economic analysis for electricity generation in three locations of the Republic of Djibouti. Energy 2019, 185, 884–894. [Google Scholar] [CrossRef]
- BGR. Inventaire et mise en valeur des ressources en eau de la République de Djibouti. In Inventaire des Points D’eau: Coopération Hydrogéologique Allemande; BGR (Bundesanstaltfür Geowissenschaftenund Rohstoffe): Hannover, Germany, 1982; Volume IV, p. 157. [Google Scholar]
- Funk, C.; Peterson, P.; Landsfeld, M.; Pedreros, D.; Verdin, J.; Shukla, S.; Husak, G.; Rowland, J.; Harrison, L.; Hoell, A.; et al. The climate hazards infrared precipitation with stations—A new environmental record for monitoring extremes. Sci. Data 2015, 2, 150066. [Google Scholar] [CrossRef] [PubMed]
- Ayugi, B.; Tan, G.; Ullah, W.; Boiyo, R.; Ongoma, V. Inter-comparison of remotely sensed precipitation datasets over Kenya during 1998–2016. Atmos. Res. 2019, 225, 96–109. [Google Scholar] [CrossRef]
- Cattani, E.; Merino, A.; Guijarro, J.A.; Levizzani, V. East Africa rainfall trends and variability 1983–2015 using three long-term satellite products. Remote Sens. 2018, 10, 931. [Google Scholar] [CrossRef] [Green Version]
- Gebrechorkos, S.H.; Hülsmann, S.; Bernhofer, C. Analysis of climate variability and droughts in East Africa using highresolution climate data products. Glob. Planet. Chang. 2020, 186, 103–130. [Google Scholar] [CrossRef]
- Ayugi, B.; Tan, G.; Rouyun, N.; Zeyao, D.; Ojara, M.; Mumo, L.; Babaousmail, H.; Ongoma, V. Evaluation of Meteorological Drought and Flood Scenarios over Kenya, East Africa. Atmosphere 2020, 11, 307. [Google Scholar] [CrossRef] [Green Version]
- Wang, H.; Pan, Y.; Chen, Y. Comparison of three drought indices and their evolutionary characteristics in the arid region of northwestern China. Atmos. Sci. Lett. 2017, 18, 132–139. [Google Scholar] [CrossRef]
- Ntale, H.K.; Gan, T.Y. Drought indices and their application to East Africa. Int. J. Climatol. 2003, 23, 1335–1357. [Google Scholar] [CrossRef]
- Li, W.; Duan, L.; Wang, W.; Wu, Y.; Liu, T.; Quan, Q.; Chen, X.; Yin, H.; Zhou, Q. Spatiotemporal characteristics of drought in a semi-arid grassland over the past 56 years based on the Standardized Precipitation Index. Meteorol. Atmos. Phys. 2021, 133, 41–54. [Google Scholar] [CrossRef]
- Liu, Z.; Wang, Y.; Shao, M.; Jia, X.; Li, X. Spatiotemporal analysis of multiscalar drought characteristics across the Loess Plateau of China. J. Hydrol. 2016, 534, 281–299. [Google Scholar] [CrossRef]
- Anose, F.A.; Feysa, G.L.; Beketie, K.T.; Zeleke, T.T.; Ayal, D.Y.; Haile, B.T. Spatiotemporal analysis of droughts characteristics and drivers in the Omo-Gibe River basin, Ethiopia. Environ. Syst. Res. 2022, 11, 3. [Google Scholar] [CrossRef]
- Hargreaves, G.H.; Samani, Z.A. Reference crop evapotranspiration from temperature. Trans. ASAE 1985, 1, 96–99. [Google Scholar] [CrossRef]
- Federer, C.; Vörösmarty, C.; Fekete, B. Intercomparison of methods for calculating potential evaporation in regional and global water balance models. Water Resour. Res. 1996, 32, 2315–2321. [Google Scholar] [CrossRef]
- Haile, G.G.; Tang, Q.; Hosseini-Moghari, S.; Liu, X.; Gebremicael, T.G.; Leng, G.; Kebede, A.; Xu, X.; Yun, X. Projected Impacts of Climate Change on Drought Patterns Over East Africa. Earth Future 2020, 8, e2020EF001502. [Google Scholar] [CrossRef]
- Wang, Q.; Wu, J.; Lei, T.; He, B.; Wu, Z.; Liu, M.; Mo, X.; Geng, G.; Li, X.; Zhou, H.; et al. Temporal-spatial characteristics of severe drought events and their impact on agriculture on a global scale. Quat. Int. 2014, 349, 10–21. [Google Scholar] [CrossRef]
- Uwimbabazi, J.; Jing, Y.; Iyakaremye, V.; Ullah, I.; Ayugi, B. Observed Changes in Meteorological Drought Events during 1981–2020 over Rwanda. East Afr. Sustain. 2022, 14, 1519. [Google Scholar] [CrossRef]
- Crétat, J.; Richard, Y.; Pohl, B.; Rouault, M.; Reason, C.J.C.; Fauchereau, N. Recurrent daily rainfall patterns over South Africa and associated dynamics during the core of the austral summer. Int. J. Climatol. 2012, 32, 261–273. [Google Scholar] [CrossRef]
- Ward, J.H. Hierarchical grouping to optimize an objective function. J. Am. Stat. Assoc. 1963, 58, 236–244. [Google Scholar] [CrossRef]
- Griffiths, J.F. Climates of Africa. In World Survey of Climatology; Elsevier Publishing: New York, NY, USA, 1978; Volume 10. [Google Scholar]
- Nkunzimana, A.; Shuoben, B.; Guojie, W.; Alriah, M.A.A.; Sarfo, I.; Zhihui, X.; Vuguziga, F.; Ayugi, B.O. Assessment of drought events, their trend and teleconnection factors over Burundi, East Africa. Theor. Appl. Climatol. 2021, 145, 1293–1316. [Google Scholar] [CrossRef]
- Ongoma, V.; Chen, H.; Omony, G.W. Variability of extreme weather events over the equatorial East Africa, a case study of rainfall in Kenya and Uganda. Theor. Appl. Climatol. 2016, 131, 295–308. [Google Scholar] [CrossRef]
- Camberlin, P. Climate of Eastern Africa; Oxford University Press: Cary, NC, USA, 2020. [Google Scholar] [CrossRef]
- Gummadi, S.; Rao, K.P.C.; Seid, J.; Legesse, G.; Kadiyala, M.D.M.; Takele, R.; Amede, T.; Whitbread, A. Spatiotemporal variability and trends of precipitation and extreme rainfall events in Ethiopia in 1980–2010. Theor. Appl. Climatol. 2018, 134, 1315–1328. [Google Scholar] [CrossRef]
- Mpelasoka, F.; Awange, J.L.; Zerihun, A. Influence of coupled ocean-atmosphere phenomena on the Greater Horn of Africa droughts and their implications. Sci. Total Environ. 2018, 610–611, 691–702. [Google Scholar] [CrossRef] [PubMed] [Green Version]
- Haile, G.G.; Tang, Q.; Sun, S.; Huang, Z.; Zhang, X.; Liu, X. Droughts in East Africa: Causes, impacts and resilience. Earth Sci. Rev. 2019, 193, 146–161. [Google Scholar] [CrossRef]
- Lyon, B.; Vigaud, N. Unraveling East Africa’s climate Paradox. In Climate Extremes: Patterns and Mechanisms; Wiley: Hoboken, NJ, USA, 2017; pp. 265–281. [Google Scholar] [CrossRef]
- Lyon, B.; DEWITT, D.G. A recent and abrupt decline in the East African long rains. Geophys. Res. Lett. 2012, 39, L02702. [Google Scholar] [CrossRef] [Green Version]
- Williams, A.P.; Funk, C.; Michaelsen, J.; Rauscher, S.A.; Robertson, I.; Wils, T.H.; Loader, N.J. Recent summer precipitation trends in the Greater Horn of Africa and the emerging role of Indian Ocean sea surface temperature. Clim. Dyn. 2012, 39, 2307–2328. [Google Scholar] [CrossRef] [Green Version]
- Agutu, N.O.; Awange, J.L.; Zerihun, A.; Ndehedehe, C.E.; Kuhn, M.; Fukuda, Y. Assessing multi-satellite remote sensing, reanalysis, and land surface models’ products in characterizing agricultural drought in East Africa. Remote Sens. Environ. 2017, 194, 287–302. [Google Scholar] [CrossRef] [Green Version]
- Teshome, A.; Zhan, J. Increase of Extreme Drought over Ethiopia under Climate Warming. Adv. Meteorol. 2019, 2019, 5235429. [Google Scholar] [CrossRef] [Green Version]
- Brown, M.E.; Funk, C.; Pedreros, D.; Korecha, D.; Lemma, M.; Rowland, J.; Williams, E.; Verdin, J. A climate trend analysis of Ethiopia: Examining sub-seasonal climate impacts on crops and pasture conditions. Clim. Chang. 2017, 142, 169–182. [Google Scholar] [CrossRef]
- Rayner, N.A.; Parker, D.E.; Horton, E.B.; Folland, C.K.; Alexander, L.V.; Rowell, D.P.; Kent, E.C.; Kaplan, A. Global analyses of sea surface temperature, sea ice, and night marine air temperature since the late nineteenth century. J. Geophys. Res. Atmos. 2003, 108, 4407. [Google Scholar] [CrossRef] [Green Version]
- Ogallo, L.J.; Janowiak, J.E. Teleconnection between seasonal rainfall over East Africa and global sea surface temperature anomalies. J. Met. Soc. Jap. Ser. 1988, 66, 807–822. [Google Scholar] [CrossRef]
- Behera, S.K.; Luo, J.J.; Masson, S.; Delecluse, P.; Gualdi, S.; Navarra, A.; Yamagata, T. Paramount impact of the Indian Ocean dipole on the East African short rains: A CGCM study. J. Clim. 2005, 18, 4514–4530. [Google Scholar] [CrossRef] [Green Version]
- Black, E. The relationship between Indian Ocean Sea–surface temperature and East African rainfall. Philosophical Transactions of the Royal Society A: Mathematical. Phys. Eng. Sci. 2005, 363, 43–47. [Google Scholar] [CrossRef]
- Haile, M. Weather patterns, food security and humanitarian response in sub-Saharan Africa. Philos. Trans. R. Soc. B Biol. Sci. 2005, 360, 2169–2182. [Google Scholar] [CrossRef] [PubMed] [Green Version]
- Ummenhofer, C.C.; Gupta, A.S.; England, M.H.; Reason, C.J. Contributions of Indian Ocean sea surface temperatures to enhanced East African rainfall. J. Clim. 2009, 22, 993–1013. [Google Scholar] [CrossRef] [Green Version]
- Williams, A.; Funk, C. A westward extension of the warm pool leads to a westward extension of the Walker circulation, drying eastern Africa. Clim. Dyn. 2011, 37, 2417–2435. [Google Scholar] [CrossRef] [Green Version]
- Hoell, A.; Hoerling, M.; Eischeid, J.; Quan, X.-W.; Liebmann, B. Reconciling theories for human and natural attribution of recent East Africa drying. J. Clim. 2017, 30, 1939–1957. [Google Scholar] [CrossRef]
- Haile, G.G.; Tang, Q.; Leng, G.; Jia, G.; Wang, J.; Cai, D.; Sun, S.; Baniya, B.; Zhang, Q. Long-term spatiotemporal variation of drought patterns over the Greater Horn of Africa. Sci. Total Environ. 2020, 704, 135299. [Google Scholar] [CrossRef]
- Getachew, A.M. Drought and its impacts in Ethiopia. Weather Clim. Extremes 2018, 22, 24–35. [Google Scholar] [CrossRef]


| Sites | Location | Latitude (°N) | Longitude (°E) | Elevation (m) | Average Annual Rainfall (mm) |
|---|---|---|---|---|---|
| S1 | Adaylou | 11.97 | 42.74 | 1130 | 140.7 |
| S2 | Ali-Sabieh | 11.16 | 42.71 | 715 | 130.1 |
| S3 | Arta | 11.52 | 42.84 | 705 | 181.6 |
| S4 | Assamo | 10.99 | 42.83 | 809 | 136.5 |
| S5 | As-Eyla | 11.00 | 42.10 | 350 | 144.7 |
| S6 | Asa Gayla | 12.18 | 42.63 | 615 | 111.7 |
| S7 | Alaili Dadda | 12.42 | 42.90 | 374 | 83.4 |
| S8 | Balho | 12.06 | 42.20 | 340 | 75.6 |
| S9 | Bondara | 11.02 | 42.33 | 488 | 144.9 |
| S10 | Dasbio | 11.25 | 42.80 | 770 | 140.9 |
| S11 | Day | 11.79 | 42.63 | 1456 | 161.0 |
| S12 | Dikhil | 11.11 | 42.37 | 500 | 138.9 |
| S13 | Djibouti Airport | 11.55 | 43.15 | 8 | 146.6 |
| S14 | Djibouti-Serpent | 11.60 | 43.15 | 3 | 117.3 |
| S15 | Dorra | 12.15 | 42.48 | 295 | 101.8 |
| S16 | Doudoub Bolole | 11.25 | 42.67 | 549 | 132.8 |
| S17 | Galafi | 11.60 | 41.80 | 519 | 90.1 |
| S18 | Gourabbous | 11.28 | 42.22 | 310 | 110.2 |
| S19 | Goubetto | 11.42 | 43.00 | 336 | 147.0 |
| S20 | Guelile | 11.08 | 42.69 | 816 | 128.6 |
| S21 | Guisti | 11.02 | 42.96 | 445 | 113.9 |
| S22 | Holl-Holl | 11.31 | 42.93 | 470 | 165.7 |
| S23 | Kabah kabah | 11.25 | 43.08 | 274 | 138.3 |
| S24 | Khor Angar | 12.39 | 43.34 | 7 | 57.6 |
| S25 | Lac Assal | 11.53 | 42.45 | 313 | 113.9 |
| S26 | Loyada | 11.46 | 43.25 | 3 | 88.6 |
| S27 | Medeho | 11.95 | 43.04 | 500 | 123.1 |
| S28 | Mouloud | 11.17 | 42.50 | 3 | 129.0 |
| S29 | Moulouhleh | 12.59 | 43.20 | 3 | 43.9 |
| S30 | Obock | 11.96 | 43.29 | 20 | 70.5 |
| S31 | Omar Jagaa | 11.38 | 42.76 | 571 | 139.4 |
| S32 | Randa | 11.85 | 42.66 | 920 | 221.0 |
| S33 | Tadjourah | 11.79 | 42.88 | 15 | 150.9 |
| S34 | Waddi | 12.10 | 43.05 | 305 | 109.9 |
| S35 | Yoboki | 11.51 | 42.11 | 23 | 132.3 |
| SPI/SPEI Values | Categories |
|---|---|
| ≤−2.0 | Extremely Dry |
| −1.99–−1.5 | Severely Dry |
| −1.49–−1.0 | Moderately Dry |
| −0.99–0.99 | Near-Normal |
| 1.0–1.49 | Moderately Wet |
| 1.5–1.99 | Severely Wet |
| ≥2.0 | Extremely Wet |
| Dry | Wet | |||||
|---|---|---|---|---|---|---|
| Duration | Frequency | Intensity | Duration | Frequency | Intensity | |
| SPI-3 | 2.77 | 24.89 | −1.60 | 2.40 | 18.16 | 1.32 |
| SPI-6 | 3.34 | 20.53 | −1.32 | 3.62 | 20.12 | 1.38 |
| SPI-9 | 4.85 | 22.1 | −1.28 | 5.62 | 20.17 | 1.39 |
| SPI-12 | 6.93 | 21.62 | −1.28 | 8.03 | 20.16 | 1.39 |
| SPI-24 | 20.33 | 26.01 | −1.30 | 12.23 | 23.45 | 1.23 |
| SPEI-3 | 2.40 | 19.04 | −1.39 | 2.94 | 19.73 | 1.45 |
| SPEI-6 | 3.56 | 19.12 | −1.38 | 5.32 | 20.51 | 1.42 |
| SPEI-9 | 4.29 | 18.37 | −1.37 | 7.43 | 21.55 | 1.41 |
| SPEI-12 | 5.63 | 18.72 | −1.34 | 8.72 | 21.78 | 1.41 |
| SPEI-24 | 9.73 | 20.59 | −1.35 | 11.69 | 21.44 | 1.36 |
| 3-Month | 6-Month | 9-Month | 12-Month | 24-Month | ||
|---|---|---|---|---|---|---|
| SPEI-Airport (Observation) | Trend | 0.12 | −0.10 | −0.36 | −0.56 | −1.00 |
| p-Value | 0.73 | 0.79 | 0.4 | 0.04 | 0.03 | |
| SPI-Airport (Observation) | Trend | −0.56 | −0.76 | −1.16 | −1.32 | −1.56 |
| p-Value | 0.04 | 0.03 | 0.01 | 0.00 | 0.00 | |
| SPI-Airport (CHIRPS) | Trend | −0.19 | −0.35 | −0.52 | −0.52 | −1.09 |
| p-Value | 0.49 | 0.3 | 0.21 | 0.23 | 0.03 | |
| SPI-EAST (CHIRPS) | Trend | −0.08 | 0.02 | −0.08 | −0.11 | −0.40 |
| p-Value | 0.75 | 0.96 | 0.85 | 0.80 | 0.45 | |
| SPI-WEST (CHIRPS) | Trend | 0.44 | 0.56 | 0.8 | 0.96 | 1.32 |
| p-Value | 0.11 | 0.11 | 0.04 | 0.02 | 0.01 | |
| JF | MAM | JJAS | OND | ||
|---|---|---|---|---|---|
| SPEI-Airport (Observation) | Trend | −0.72 | −0.76 | 1.32 | 0.31 |
| p-Value | 0.18 | 0.16 | 0.01 | 0.56 | |
| SPI-Airport (Observation) | Trend | −1.96 | −1.51 | 1.02 | −0.37 |
| p-Value | 0.00 | 0.00 | 0.06 | 0.51 | |
| SPI-Airport (CHIRPS) | Trend | −1.37 | −0.74 | 0.47 | 0.19 |
| p-Value | 0.01 | 0.18 | 0.41 | 0.73 | |
| SPI-EAST (CHIRPS) | Trend | −0.85 | −0.72 | 1.44 | 0.32 |
| p-Value | 0.11 | 0.19 | 0.01 | 0.56 | |
| SPI-WEST (CHIRPS) | Trend | −0.56 | −0.65 | 1.72 | 0.60 |
| p-Value | 0.29 | 0.22 | 0.00 | 0.26 | |
| JF | MAM | JJAS | OND | |||
|---|---|---|---|---|---|---|
| SPEI-Airport (Observation) | Nino3.4 | CC (p-Value) | 0.24 (0.11) | 0.040 (0.81) | −0.18 (0.23) | 0.24 (0.12) |
| IOD | CC (p-Value) | −0,14 (0.36) | −0.16 (0.3) | −0.149 (0.32) | 0.44 (0.00) | |
| SPI-Airport (Observation) | Nino3.4 | CC (p-Value) | 0.30 (0.05) | −0.12 (0.43) | −0.27 (0.08) | 0.19 (0.28) |
| IOD | CC (p-Value) | −0.34 (0.03) | −0.33 (0.03) | −0.06 (0.64) | 0.36 (0.02) | |
| SPI-Airport (CHIRPS) | Nino3.4 | CC (p-Value) | 0.46 (0.002) | 0.10 (0.54) | −0.55 (0.00) | 0.22 (0.15) |
| IOD | CC (p-Value) | −0.01 (0.93) | −0.20 (0.21) | 0.06 (0.70) | 0.41 (0.00) | |
| SPI-EAST (CHIRPS) | Nino3.4 | CC (p-Value) | 0.47 (0.02) | 0.16 (0.42) | −0.43 (0.00) | 0.19 (0.09) |
| IOD | CC (p-Value) | 0.08 (0.67) | −0.18 (0.34) | 0.102 (0.52) | 0.40 (0.00) | |
| SPI-WEST (CHIRPS) | Nino3.4 | CC (p-Value) | 0.46 (0.01) | 0.15 (0.25) | −0.43 (0.01) | 0.25 (0.17) |
| IOD | CC (p-Value) | 0.02 (0.42) | −0.15 (0.26) | 0.04 (0.51) | 0.41 (0.01) | |
Publisher’s Note: MDPI stays neutral with regard to jurisdictional claims in published maps and institutional affiliations. |
© 2022 by the authors. Licensee MDPI, Basel, Switzerland. This article is an open access article distributed under the terms and conditions of the Creative Commons Attribution (CC BY) license (https://creativecommons.org/licenses/by/4.0/).
Share and Cite
Dabar, O.A.; Adan, A.-B.I.; Ahmed, M.M.; Awaleh, M.O.; Waberi, M.M.; Camberlin, P.; Pohl, B.; Mohamed, J. Evolution and Trends of Meteorological Drought and Wet Events over the Republic of Djibouti from 1961 to 2021. Climate 2022, 10, 148. https://doi.org/10.3390/cli10100148
Dabar OA, Adan A-BI, Ahmed MM, Awaleh MO, Waberi MM, Camberlin P, Pohl B, Mohamed J. Evolution and Trends of Meteorological Drought and Wet Events over the Republic of Djibouti from 1961 to 2021. Climate. 2022; 10(10):148. https://doi.org/10.3390/cli10100148
Chicago/Turabian StyleDabar, Omar Assowe, Abdi-Basid Ibrahim Adan, Moussa Mahdi Ahmed, Mohamed Osman Awaleh, Moussa Mohamed Waberi, Pierre Camberlin, Benjamin Pohl, and Jalludin Mohamed. 2022. "Evolution and Trends of Meteorological Drought and Wet Events over the Republic of Djibouti from 1961 to 2021" Climate 10, no. 10: 148. https://doi.org/10.3390/cli10100148