
Status of Food Security in East and Southeast Asia and Challenges of Climate Change


1
The Third Research Division, Chung-Hua Institution for Economic Research, Taipei 106220, Taiwan
2
The First Research Division, Chung-Hua Institution for Economic Research, Taipei 106220, Taiwan
*
Author to whom correspondence should be addressed.
Climate 2022, 10(3), 40; https://doi.org/10.3390/cli10030040
Submission received: 22 January 2022
/
Revised: 9 March 2022
/
Accepted: 10 March 2022
/
Published: 14 March 2022
(This article belongs to the Special Issue Climate Change and Variability Impacts on Agriculture and Water Resources Sectors)
Abstract
:This review briefly summarizes the situation regarding food security in East and Southeast Asia. In accordance with the World Food Summit definition and 2009 Declaration of the World Summit on Food Security, the four pillars of food security—food availability, access to food, the stability of food supplies, and food utilization—are closely scrutinized along with the characteristics of food security at the sub-regional level. Historical trends for the agricultural economy and the food trade, such as food imports and exports, production and consumption, and the food price index in the sub-region, are presented and statistically analysed. Additionally, because agricultural industry in this region is vulnerable to climate change, issues about how climate change affects food security in food production systems, agricultural livelihoods, nutrition, and food policy making, which can be linked to the four pillars in different ways, are also discussed.
1. Introduction
Based on the World Food Summit in 1996 [1], the widely accepted definition of food security is “all people, at all times, have social, economic, and physical access to sufficient, safe, and nutritious food that meets their dietary needs and food preferences for an active and healthy life.” Besides, according to the Sustainable Development Goals (SDGs) established by the United Nations, one of the SDGs emphasized the importance of achieving the goal of “End hunger, achieve food security and improved nutrition and promote sustainable agriculture.” Targets in this goal include ending hunger and malnutrition, increasing the income and productivity of small-scale farmers, maintaining genetic diversity, and developing sustainable and resilient agricultural production systems and practices.
Asia is home to more than half of the world’s population. At the same time, the East and Southeast Asian population accounts for 49.7% of the total Asian population [2]. This large number of people indicates that to achieve the goal of a food secure Asia, a comprehensive and integrated scheme must be implemented in policy making, considering the high demographic and geographic diversity in this region.
Therefore, in this review, the current situation in the region will be reviewed and discussed under the food security framework composed of four pillars—food availability, access to food, the stability of food supplies, and food utilization. In addition, climate change has posed a significant threat to food security especially in the most vulnerable regions, and as a result four dimensions in the framework can all be disrupted in complicated patterns. A brief discussion on how climate change affects food security in food production systems, agricultural livelihoods, nutrition, and food policy making, which can be linked to the four pillars in different ways, and the corresponding responses to these impacts will be presented. Considering that rice production plays an important role in food security in East and Southeast Asia, based on the historical data, we investigate the correlations between rice production and some climate indicators, temperature and precipitation included, to figure out the possible impacts of climate change.
2. State of Food Security in East and Southeast Asia
2.1. Food Availability
Food availability is prioritized over other aspects of food security. Goals for other aspects cannot be achieved if sufficient food availability does not exist [3]. Generally speaking, food availability indicates that adequate quantities of essential and proper types of food are available on a regular basis. Food availability can be assessed in two dimensions: food production and food trade.
2.1.1. Food Production
When it comes to cereal production in Asia, rice production is often the first issue to be addressed. Rice production in Asia accounts for about 90% of the global rice supply, and most of the rice is produced in tropical areas with abundant precipitation. Rice is the staple food feeding over half of the world’s population, which is mostly located in Asia. Therefore, rice production is of crucial importance, not only to Asia, but also the world. In 2019, rice production in East and Southeast Asia was estimated to be around 418.56 million tonnes (Table 1), which represents 47.6% of total cereal production in the region and 55.4% of global rice production.
Maize and wheat are two other important staple crops produced in East and Southeast Asia. In 2019, maize production in the region reached 315.58 million tonnes, accounting for 35.9% of total cereal production in the region. China and Indonesia alone produce 92.4% of the maize in this region. China is also the major producer of wheat in this region. In 2019, 133.60 million tonnes of wheat were produced in China, accounting for 98.8% of wheat production in the region.
Typically, meat, seafood, eggs, and dairy products are the major sources of daily protein intake. Regarding animal-based protein production, a large quantity of animal and fishery products are also produced in East and Southeast Asia. In 2018, total animal-based protein production, including aquaculture, capture fishery, milk, meat, and eggs, was estimated to be 352.04 million tonnes (see Table 2). China contributed 70.9% of the overall meat production in this region.
According to the projections in some research, meat and seafood consumption will be about 30% higher in 2030, compared to that in 2017, and the increase will be mainly driven by the demand in China, due to the growing wealth and population. Based on this prediction, the growth rate of current production in this region will not be able to meet the increase in demand of 2.31% in each year. Besides, animal-based protein production will lead to a 35% increase in water usage to meet the needs of a surge in the demand for meat and seafood under a business-as-usual scenario [5].
Undoubtedly, livestock production has placed great stress on a limited supply of natural resources and is now facing multiple challenges such as climate change, land degradation, and deforestation. In the short term, increasing imports of animal and fishery products may be able to fulfil the need; however, in considering the burden that animal farming imposes on the environment, it may not be a feasible long-term solution to deal with the growing demand. On the supply side, a more sustainable livestock production system is required to ‘produce more with less’. On the demand side, an increasing number of people are switching to vegan diets for health or religious reasons, which means that the growth of animal-based protein consumption can slow down. The market for plant-based protein, such as soy protein and pea protein, is expected to grow by 6.1% from 2020 to 2025 in Asia [6].

Table 2.
Animal-based protein production in East and Southeast Asia (million tonnes).
| Year | Aquaculture | Capture Fishery | Milk | Meat | Eggs |
|---|---|---|---|---|---|
| 2015 | 87.18 | 40.56 | 52.66 | 114.04 | 39.44 |
| 2016 | 90.58 | 39.37 | 51.63 | 114.04 | 40.88 |
| 2017 | 93.51 | 39.18 | 51.32 | 115.66 | 48.00 |
| 2018 | 94.38 | 39.17 | 51.74 | 118.16 | 48.59 |
| 2019 | - | - | 53.44 | 107.63 | 50.62 |
2.1.2. Food Trade
For some Asian countries with limited natural resources such as Japan and Singapore, food trade is of great importance to achieving food security when the domestic food production is insufficient to meet the dietary needs of their citizens. Besides, food trade is able to boost the economy by creating job opportunities and reducing poverty. It can also diminish the volatility of the overall food supply [8]. With more exposure to the global market, many Southeast Asian countries can benefit from the reduction in market distortions and improve incomes and welfare [9,10].
Table 3 shows the food commodity exports in East and Southeast Asia from 2005 to 2019. The main food commodities exported are rice, vegetable oil, refined sugar, and seafood. Even though most rice production is supplied to meet the domestic demand in many Asian rice producing countries, these countries have also shown the capacity to export rice in large quantities [11]. According to Table 3 and Table 4, the total quantity and value of rice exported were both double the total quantity and value of rice imported in 2019, or about 18.3 million tonnes and 9119.4 million US dollars, respectively. During 2016–2018, rice exports exhibited an increasing trend in both the quantity and value exported. The demand for rice is expected to grow in the near future due to the growing population, while in the long term it is projected to decrease because of the changes in eating habits [12].
Fishery products are another important food commodity in the regional and global market. In 2019, China, following the European Union, was the second largest exporter of fish and fishery products in the world, while Vietnam and Thailand were the fourth and seventh largest exporters, respectively. In terms of imports of fishery products, China, Japan, South Korea, and Thailand were the third, fourth, fifth and sixth largest importers in the global market, with a combined value of 45.1 billion US dollars [13].
As for meat and live animals, East and Southeast Asia is not the major producer of red meat (especially beef and pork) in the world, although its consumption has been increasing in recent years. To meet the domestic demand, there is a heavy reliance on imports. On the other hand, poultry meat exports of the region account for about 13.27% of the global total, and the quantity and value of poultry meat exported by Southeast Asian countries has increased at a steady pace in the past few years [14]. The trend of this growth is projected to continue, as poultry production is expected to increase in countries such as Indonesia, Malaysia, and Thailand, where poultry meat is preferred to other meat. Imports of livestock feed, particularly soybean meal, are expected to surge in the coming years, as a consequence of the increase in livestock production [15].
2.1.3. Self-Sufficiency Ratio (SSR)
The SSR denotes the share of domestic food production over the total national demand. It reflects the extent to which one country or region can feed its population with its domestic production. According to the FAO, the self-sufficiency ratio (SSR) can be calculated using Equation (1):
In general, a larger SSR means better self-sufficiency. Nevertheless, from the overall perspective of the food situation, it must be noticed that if a large amount of one particular commodity is exported, the country may still need to depend on considerable food imports of other food commodities to meet its domestic demand despite the high SSR [16].
Table 5 shows the SSR in relation to various commodities in the region during the 2017–2019 period. Most economies in the region have a relatively high SSR for total cereals, where rice plays a major role. While wheat is not produced in most Southeast Asian economies due to climate restrictions, rice self-sufficiency has been a long-term objective for many Southeast Asian economies. Thailand and Vietnam are two of the biggest rice exporters in the region and in the world. During the 2017–2019 period, 29.5 and 16.1 million tonnes of rice were exported from Thailand and Vietnam, respectively, accounting for 22% and 12% of global rice exports. The large exports explain the high SSR for rice in these two economies, even though their production is lower than that of some rice net importer economies such as Indonesia and China. What gives rise to this difference can be attributed to factors on both the supply and demand sides. For instance, the shift in dietary patterns (the demand side) or increases in rice production (the supply side) can both improve the rice SSR [17]. Political means such as input subsidies, price intervention, and trade tariffs are designed to ensure domestic food security and encourage exports [18].
2.2. Access to Food
Even if food availability in one country is adequate, there is still a possibility that daily caloric requirements may not be met for a group of people in that country. Food access is the indicator used to examine the ability of people to obtain sufficient food, to fulfil their dietary and nutrition needs. Adequate access to food indicates that all people have appropriate resources to produce or purchase food [19]. It can be assessed in multiple dimensions, and in this section the consumer price index for food and the share of food expenditure in GDP will be discussed.
2.2.1. Consumer Price Index for Food
Changes in the food price can directly affect food affordability. For example, many rural smallholder farmers, particularly in developing countries, are net food buyers rather than suppliers, which means they are unable to produce enough food to feed their household and hence the fluctuations in food prices have a great impact on their livelihoods [20].
The consumer price index (CPI) for food provides an insight into the variations in food retail prices at the country and regional level. According to the FAO, the consumer price index for food evaluates “the change over time in the general level of prices of food and non-alcoholic beverage items that households acquire, use or pay for consumption” [4]. This market-level analysis approach can assess how the market reacts to supply and demand variations, and how domestic food supply can meet the expectations of demand [21]. The FAO Food Price Index (FFPI), as defined by the FAO, is “a measure of the monthly change in international prices of a basket of food commodities.” [22]. The FFPI is the average of food commodities in five markets (cereals, vegetable oils, sugar, meat and dairy products), which account for around 40% of the global total food commodity trade [23]. Unlike the food price index that reflects the inflation in food prices in international markets, the CPI for food reveals the food price fluctuations in the domestic market at the consumer end. The trend in volatility in the food price index does not necessarily match that in the CPI for food, due to public policy, exchange rates, and other reasons [24].
The various values of the CPI for food in East and Southeast Asia during the period from 2016 to 2020 are presented in Table 6. The regional average CPI for food in 2020 in East Asia and Southeast Asia reached 117.1 and 115.4, respectively. The regional average CPI for food in East Asia even rose from 110.2 to 117.1 between 2019 and 2020. Despite this, the impact of the global coronavirus pandemic on food prices remains uncertain, although many projections suggest that the food price will undergo a spike in 2020 due to high production and transportation costs, as well as the disturbances in the supply chain [25].
There has also recently been a significant surge in food prices in some Asian economies, such as China, Mongolia, and Myanmar. Table 6 shows that the average food price in these three economies during January to July 2020 had increased by 24.2%, 31.0% and 34.1%, respectively, since 2015. The price hike may be subject to several domestic and external factors. For instance, as a landlocked country, agricultural production in Mongolia is hugely affected by the climate, which implies that the country is more vulnerable to climate variability. As a result, food prices may increase due to the high production costs and huge losses along the supply chain [26]. In Myanmar, the investments in infrastructure and development schemes since 2015 have led to inflation because of budget deficits, and thus food prices have increased [27]. It is worth noting that the price of rice plays an important role in food price fluctuations in East and Southeast Asia. As most rice produced in the region is consumed by the domestic population, and the major foreign trade market for rice is within the region, volatility in rice production in exporting countries can have a huge impact on regional and global rice markets [28]. Besides, acute increases in the price of rice are harmful to the poor [29]. Many Asian economies have for a long time resorted to political intervention to stabilize the rice price and ensure self-sufficiency. An opening up of trade in rice in these economies has been called for, to reduce the external costs of stabilizing the global rice market [30,31].
In addition to the domestic factors, external factors including the oil price, mining and metal prices, and international food prices can also cause fluctuations in domestic food prices. The volatility in international markets will hit the countries that heavily rely on food imports, especially cereal crops, the hardest.
Table 6.
CPI for food in East and Southeast Asian economies. Base year (2015) = 100.
| 2016 | 2017 | 2018 | 2019 | 2020 | |
|---|---|---|---|---|---|
| Brunei Darussalam | 99.5 | 99.8 | 101.7 | 101.0 | 103.1 |
| Cambodia | 106.4 | 109.9 | 112.6 | 115.2 | 119.2 |
| China | 103.7 | 103.5 | 105.5 | 113.2 | 124.2 |
| Hong Kong | 103.6 | 104.7 | 109.2 | 120.0 | 129.5 |
| Indonesia | 107.3 | 109.3 | 113.8 | 115.4 | 118.7 |
| Japan | 102.1 | 102.8 | 104.5 | 104.7 | 105.6 |
| Laos | 104.3 | 104.2 | 105.5 | 110.4 | 118.3 |
| Macao | 102.9 | 104.5 | 107.3 | 110.6 | 115.6 |
| Malaysia | 103.9 | 108.2 | 109.7 | 111.5 | 112.6 |
| Mongolia | 98.5 | 102.8 | 110.1 | 121.9 | 131.0 |
| Myanmar | 109.4 | 114.2 | 121.8 | 132.7 | 134.1 |
| Philippines | 101.6 | 104.7 | 111.9 | 114.2 | 116.9 |
| Republic of Korea | 102.3 | 105.8 | 108.7 | 108.8 | 111.1 |
| Singapore | 102.3 | 103.6 | 105.0 | 106.2 | 109.0 |
| Taiwan * | 105.2 | 104.8 | 105.9 | 107.9 | 108.6 |
| Thailand | 101.6 | 101.6 | 102.0 | 104.4 | 105.2 |
| Vietnam | 102.4 | 101.3 | 104.5 | 108.8 | 119.5 |
| East Asia | 103.0 | 103.5 | 105.6 | 110.2 | 117.1 |
| Southeast Asia | 104.3 | 106.2 | 109.8 | 112.2 | 115.4 |
| World | 101.9 | 104.1 | 107.1 | 112.0 | 118.0 |
2.2.2. Share of Food Expenditure in GDP
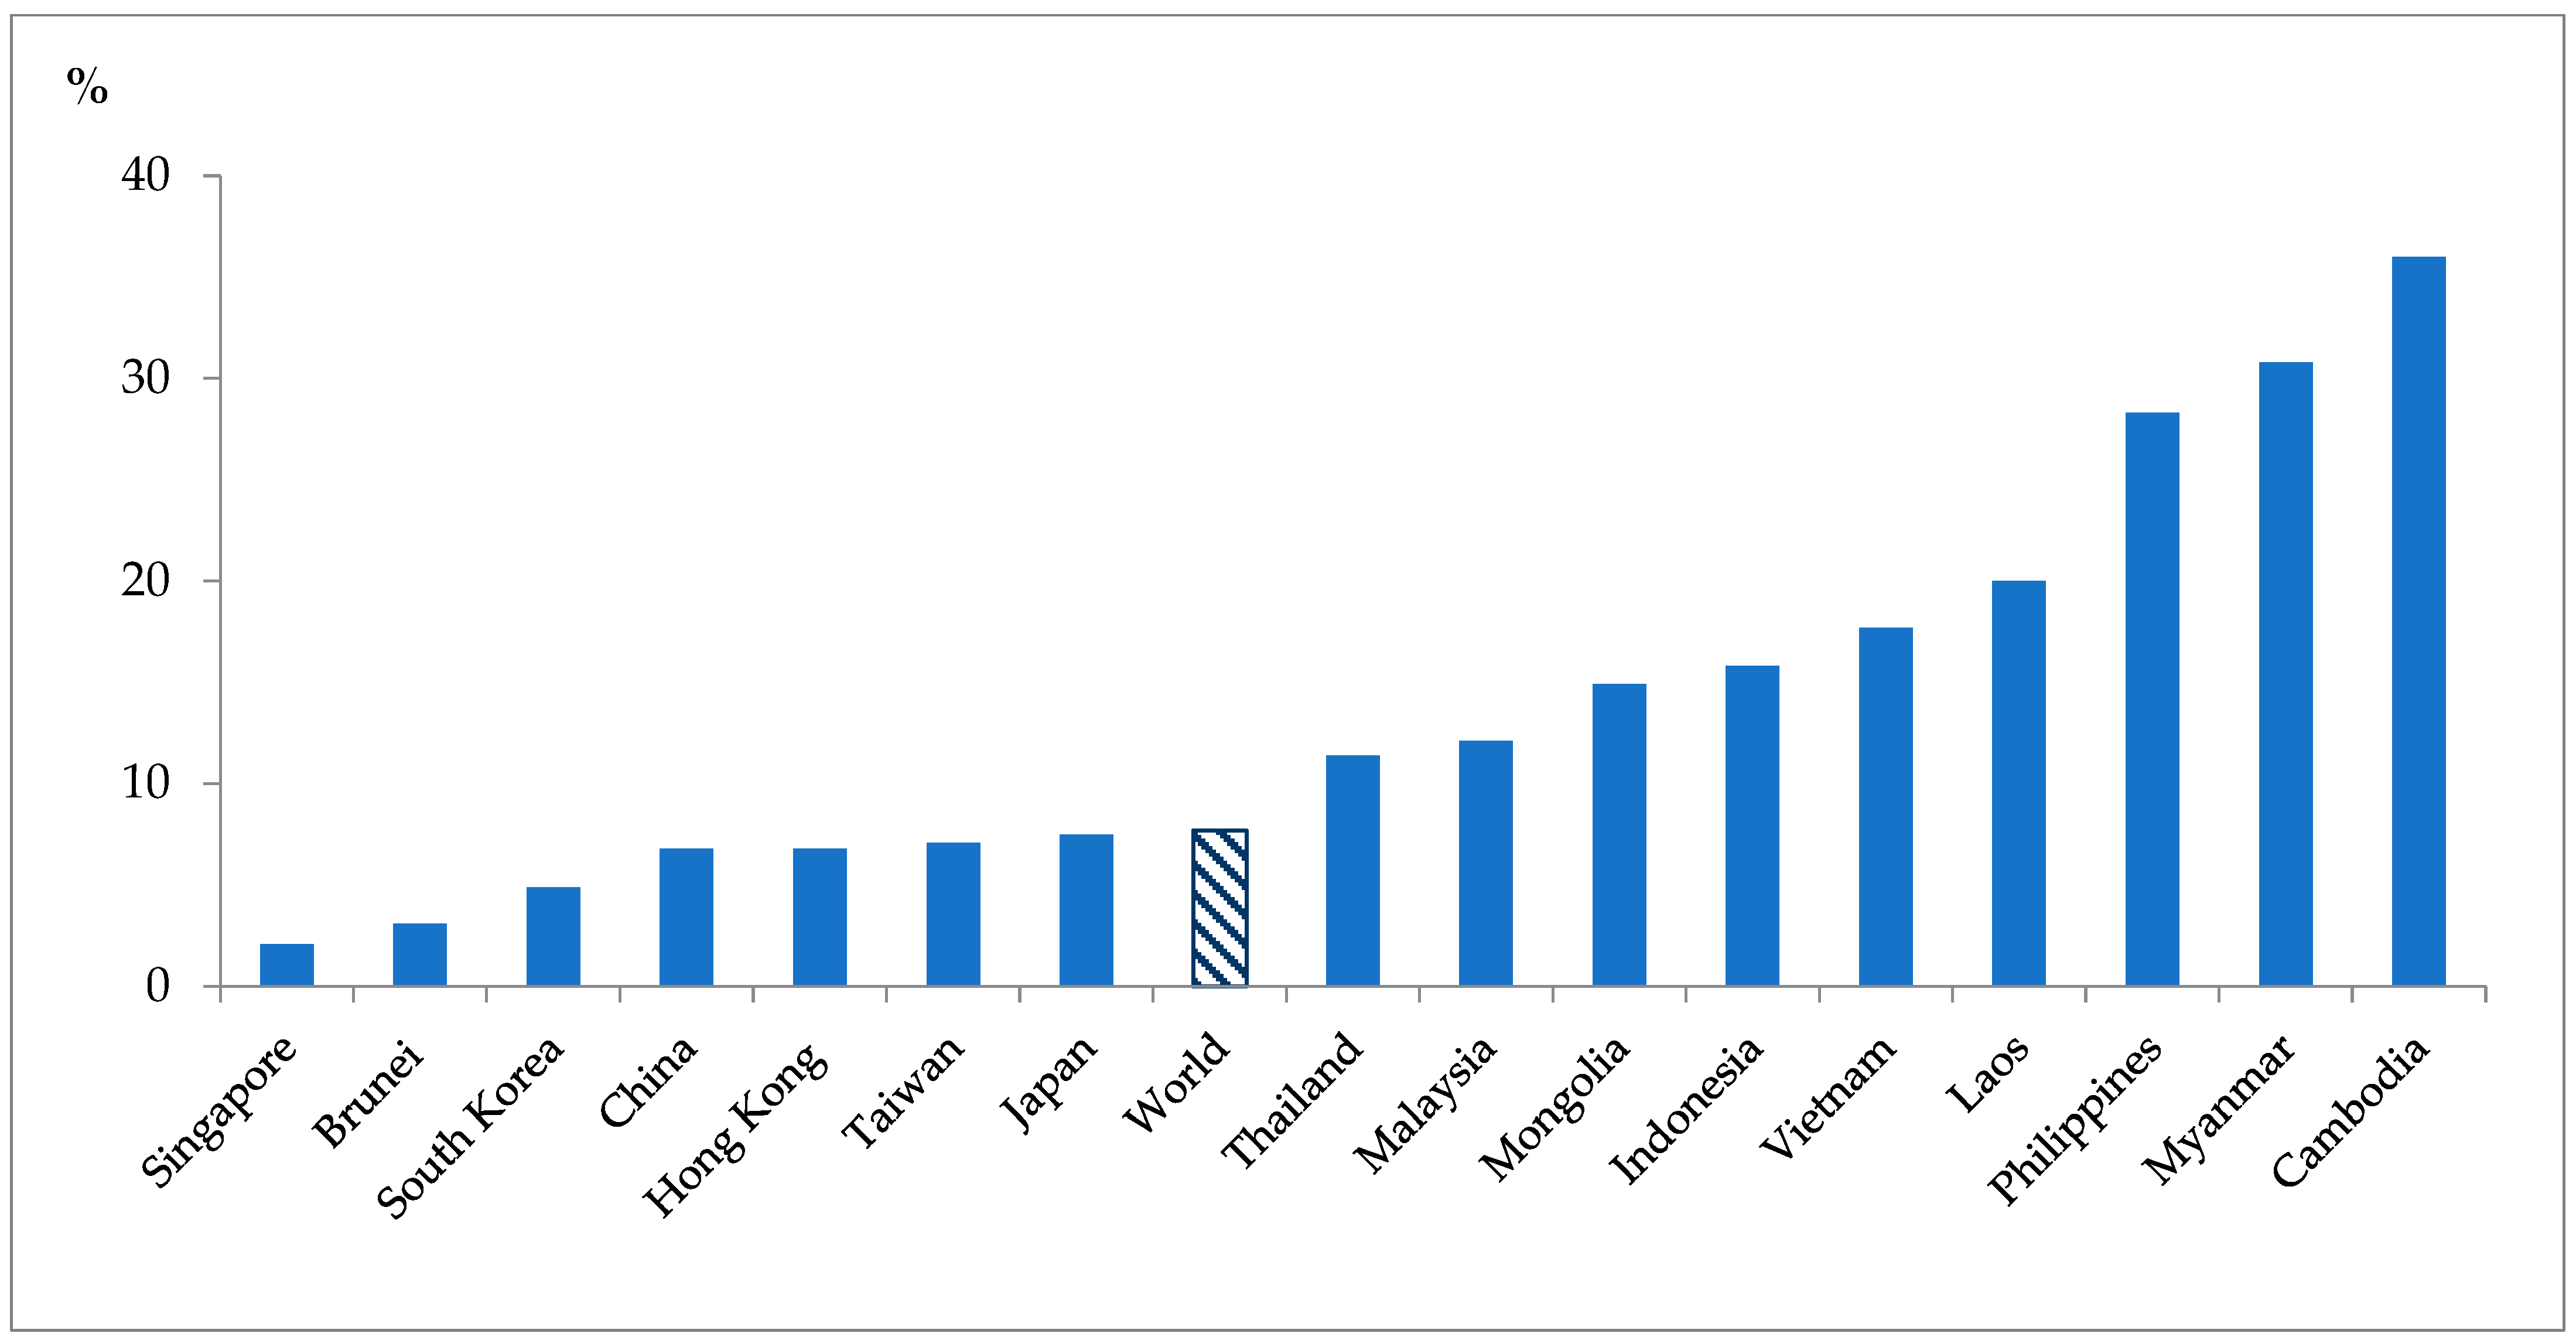
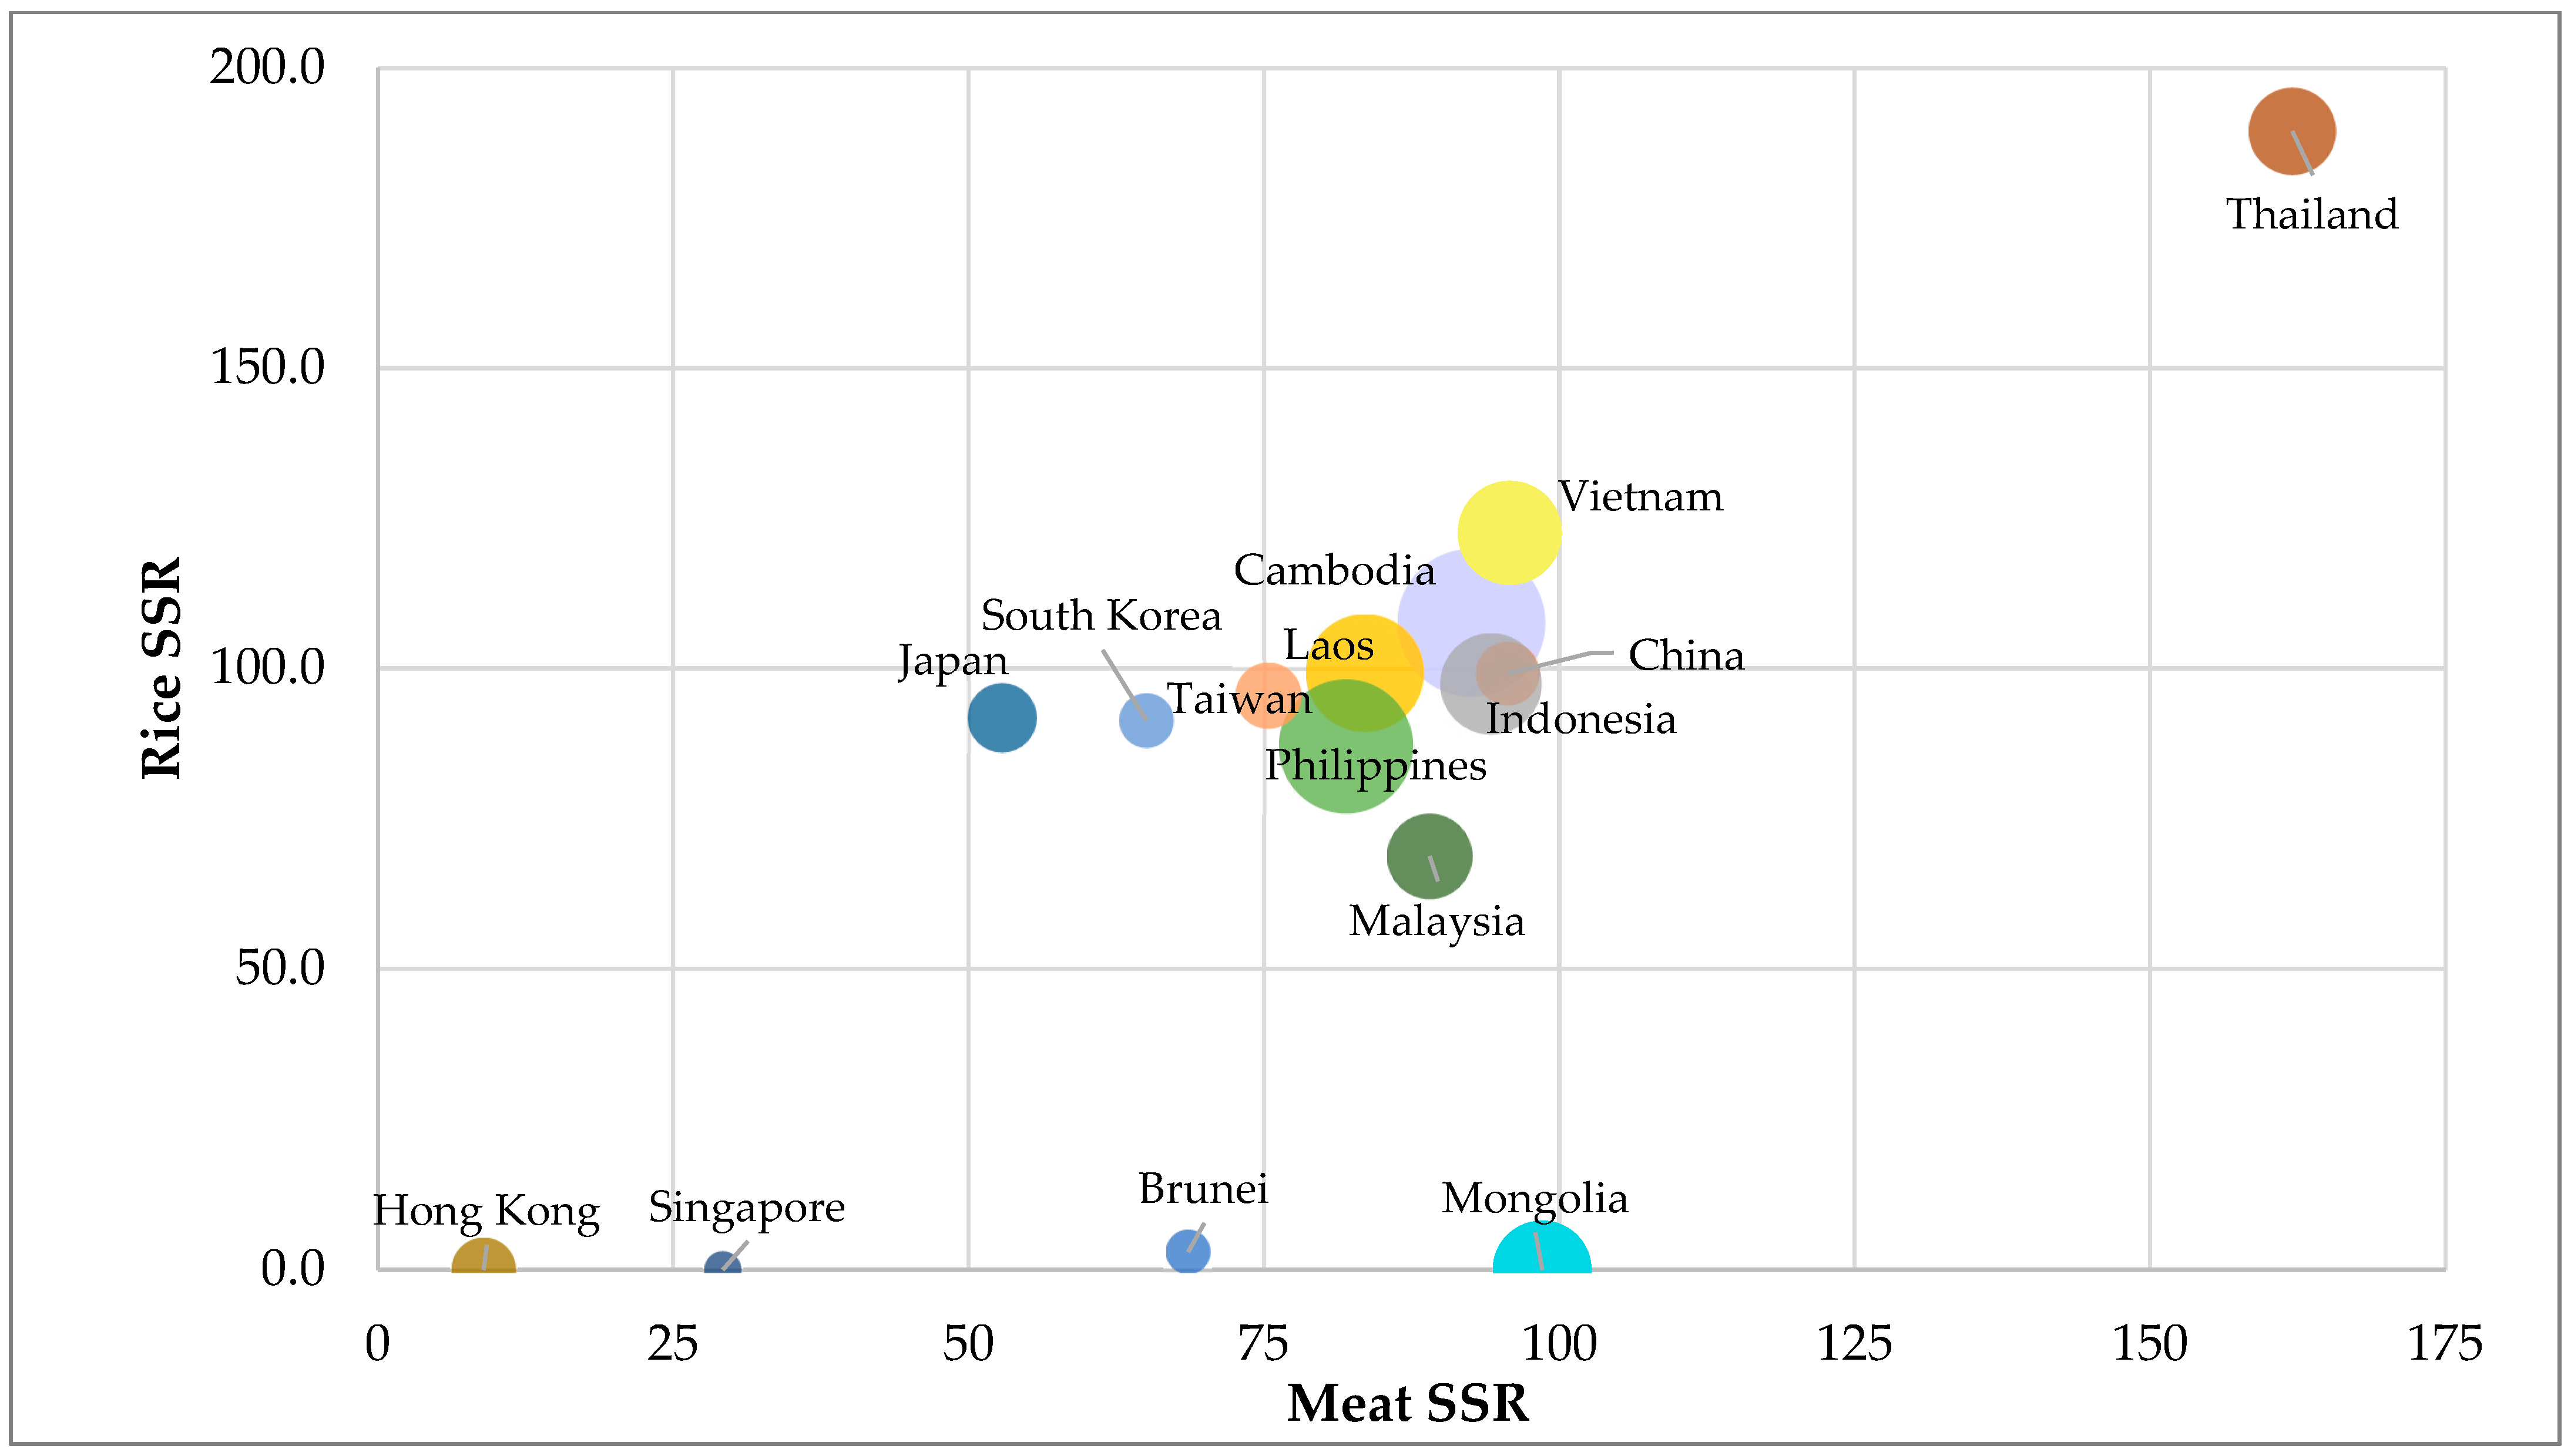
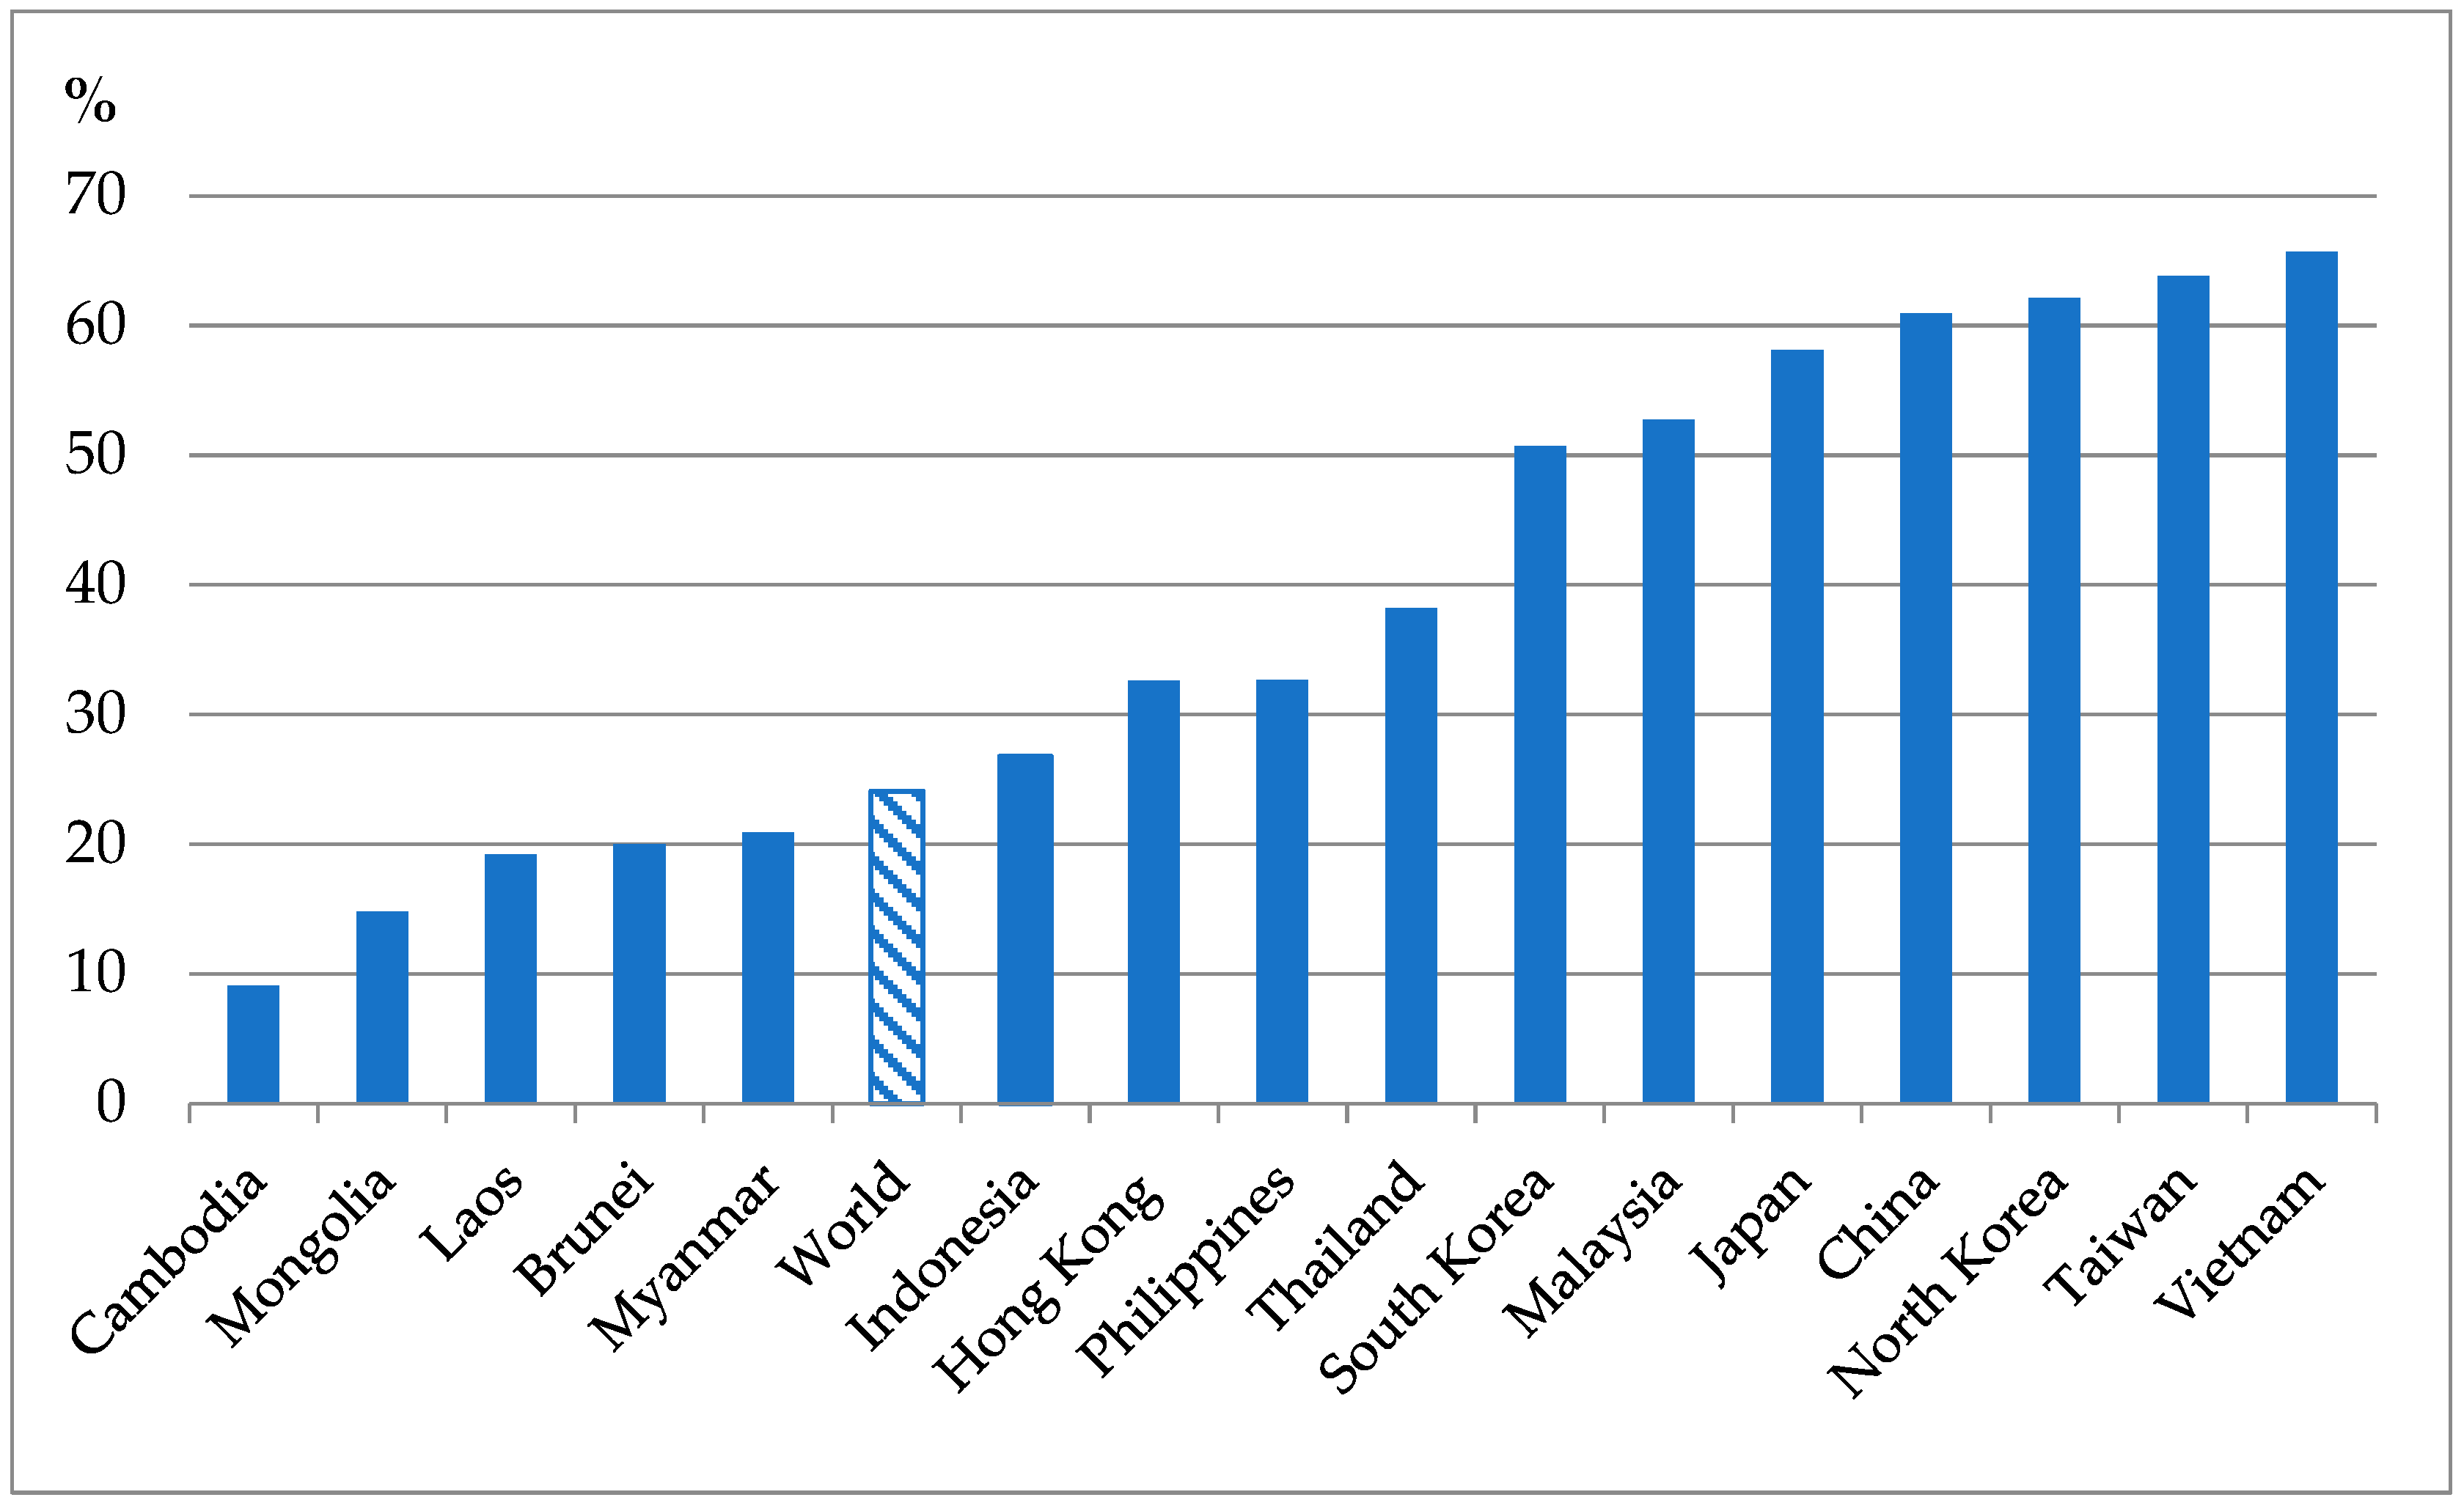
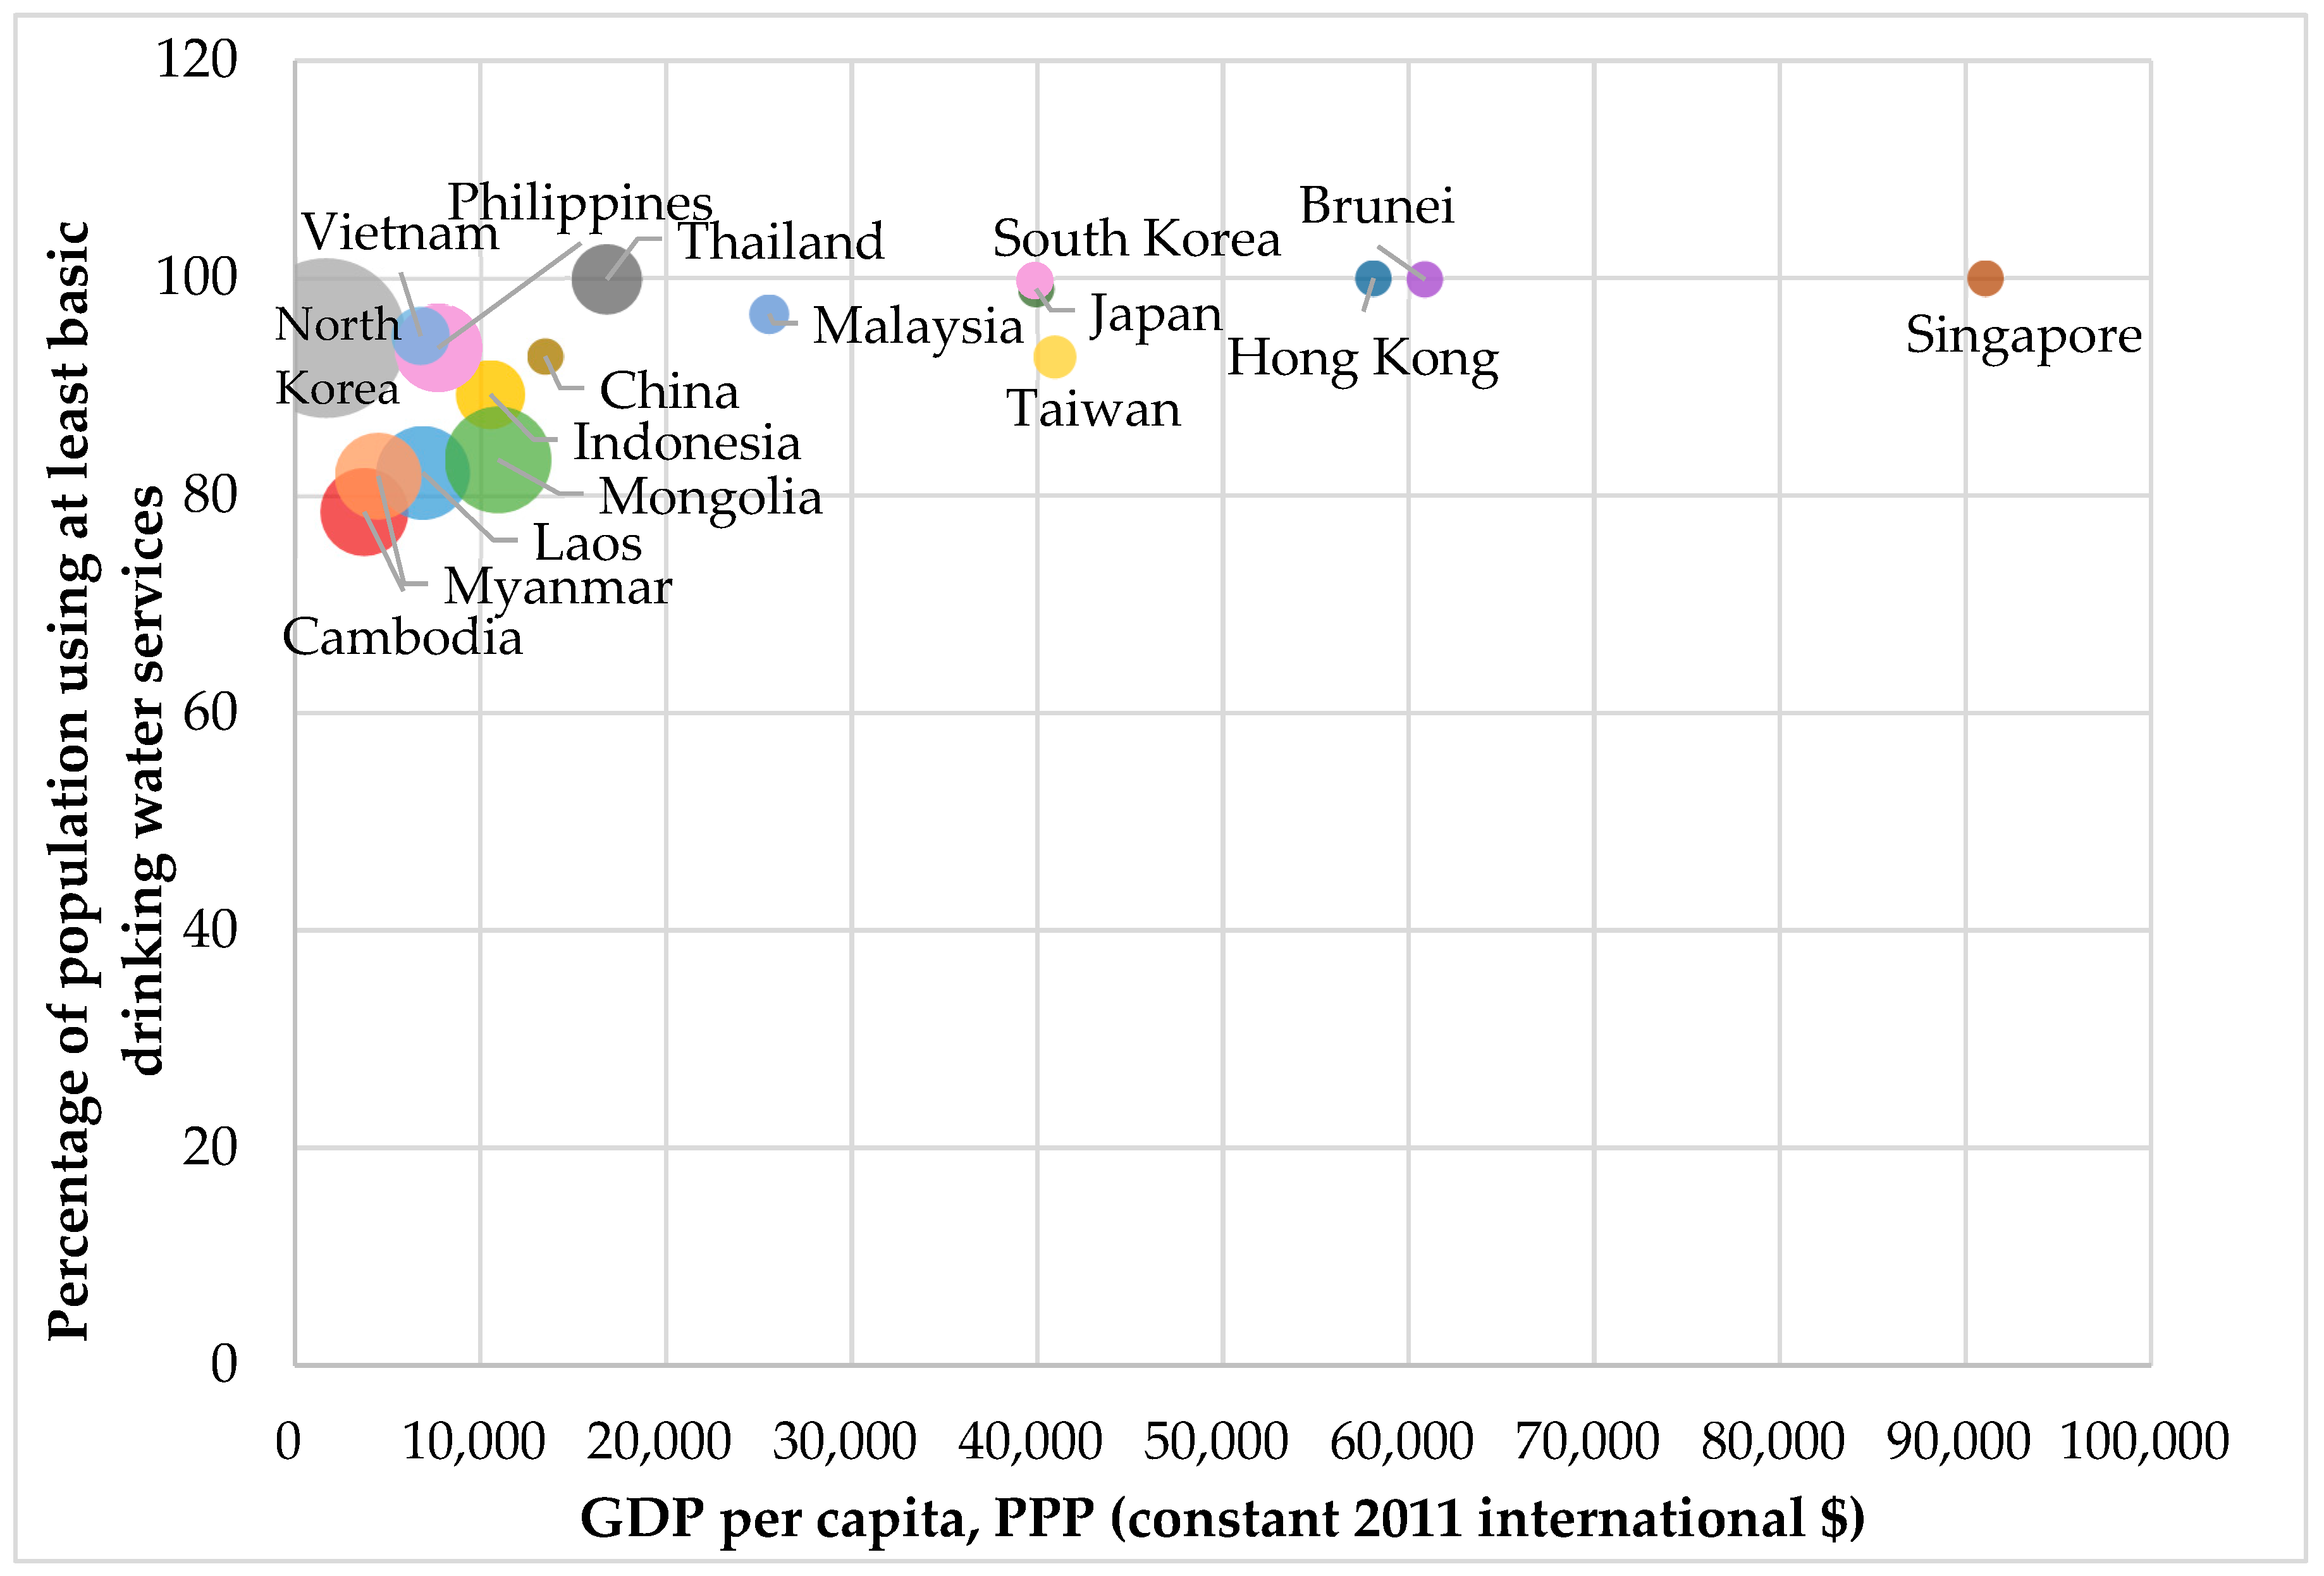
The share of food expenditure in GDP varies across economies and is closely related to the degree of national economic development. Figure 1 shows that, generally speaking, countries with a higher degree of economic development, such as Singapore, Brunei, and South Korea, have a lower share of food expenditure in GDP, while economies with a lower degree of economic development, such as the Philippines, Myanmar, and Cambodia, are in the opposite situation. It is also interesting to see that a higher food self-sufficiency ratio does not necessarily mean that the people can spend less money on food. Take Cambodia as an example. Although the SSR for meat and the SSR for rice in Cambodia were 92.6% and 107.6%, respectively, the share of food expenditure in GDP still reached 37.6% (Figure 2).
2.3. Stability of Food Supplies
In addition to the adequate availability of and access to food, people must always have a stable food supply. People should be able to obtain access to appropriate food on a constant basis. Put simply, stability is a temporal element in the food security framework, and it basically influences all three other elements [34]. In this section, the cereal import dependency ratio and the percentage of arable land equipped for irrigation are discussed.
2.3.1. Cereal Import Dependency Ratio
The cereal import dependency ratio expresses the degree to which one country relies on cereal imports to meet its domestic demand. The higher the import dependency ratio, the more vulnerable the country is to fluctuations in the international market price. A high degree of cereal import dependency may be due to insufficient domestic production, while a low degree of cereal import dependency can somewhat indicate the restrictive trade policy decisions [35].
The cereal import dependency ratio is calculated by the following Equation (2):
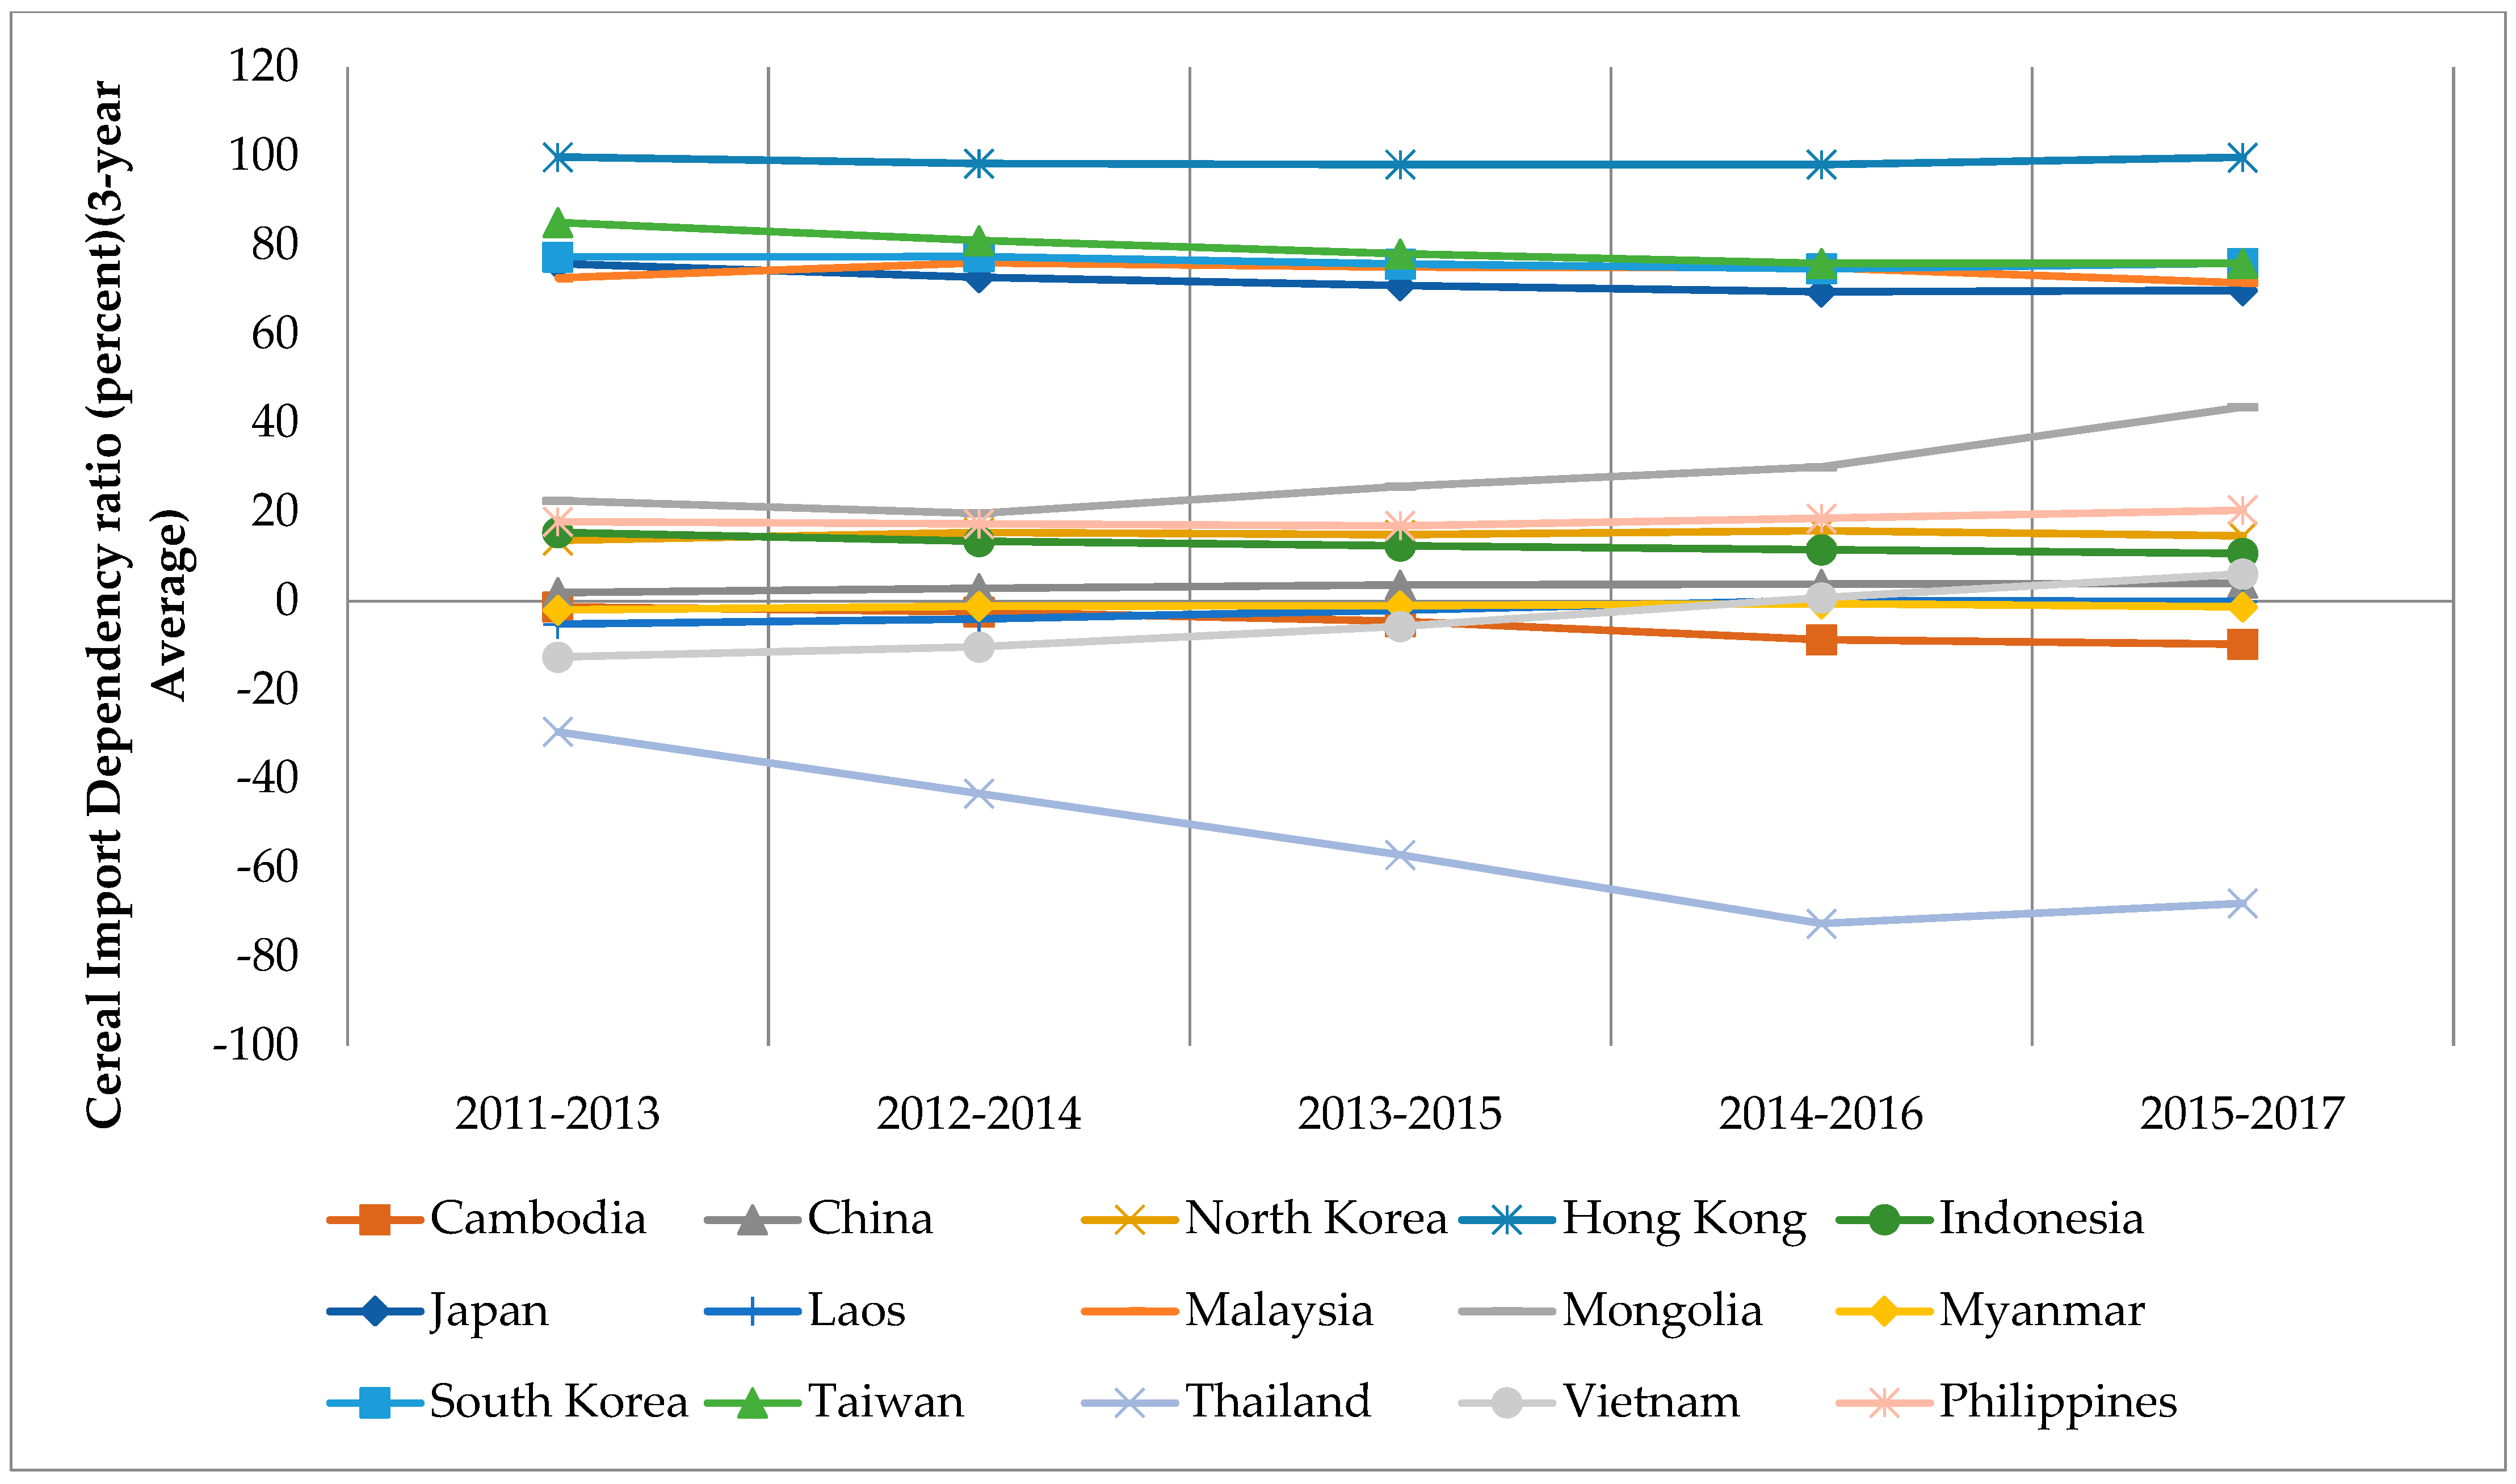
Figure 3 depicts the cereal import dependency ratio in East and Southeast Asian economies. Hong Kong has the highest cereal import dependency ratio, as the result of a lack of natural resources and agricultural inputs. The cereal import dependency ratios for Japan, South Korea, Taiwan, and Malaysia are above 60. This can be attributed to the production insufficiency due to the landscape limitations [17], or the changing dietary patterns [36]. That is, people in these economies also eat other cereal crops not produced domestically, such as wheat. Besides, because of the growth in the demand for meat, these countries need to import more feed to feed their livestock, which may also explain the high degree of dependency on cereal imports.
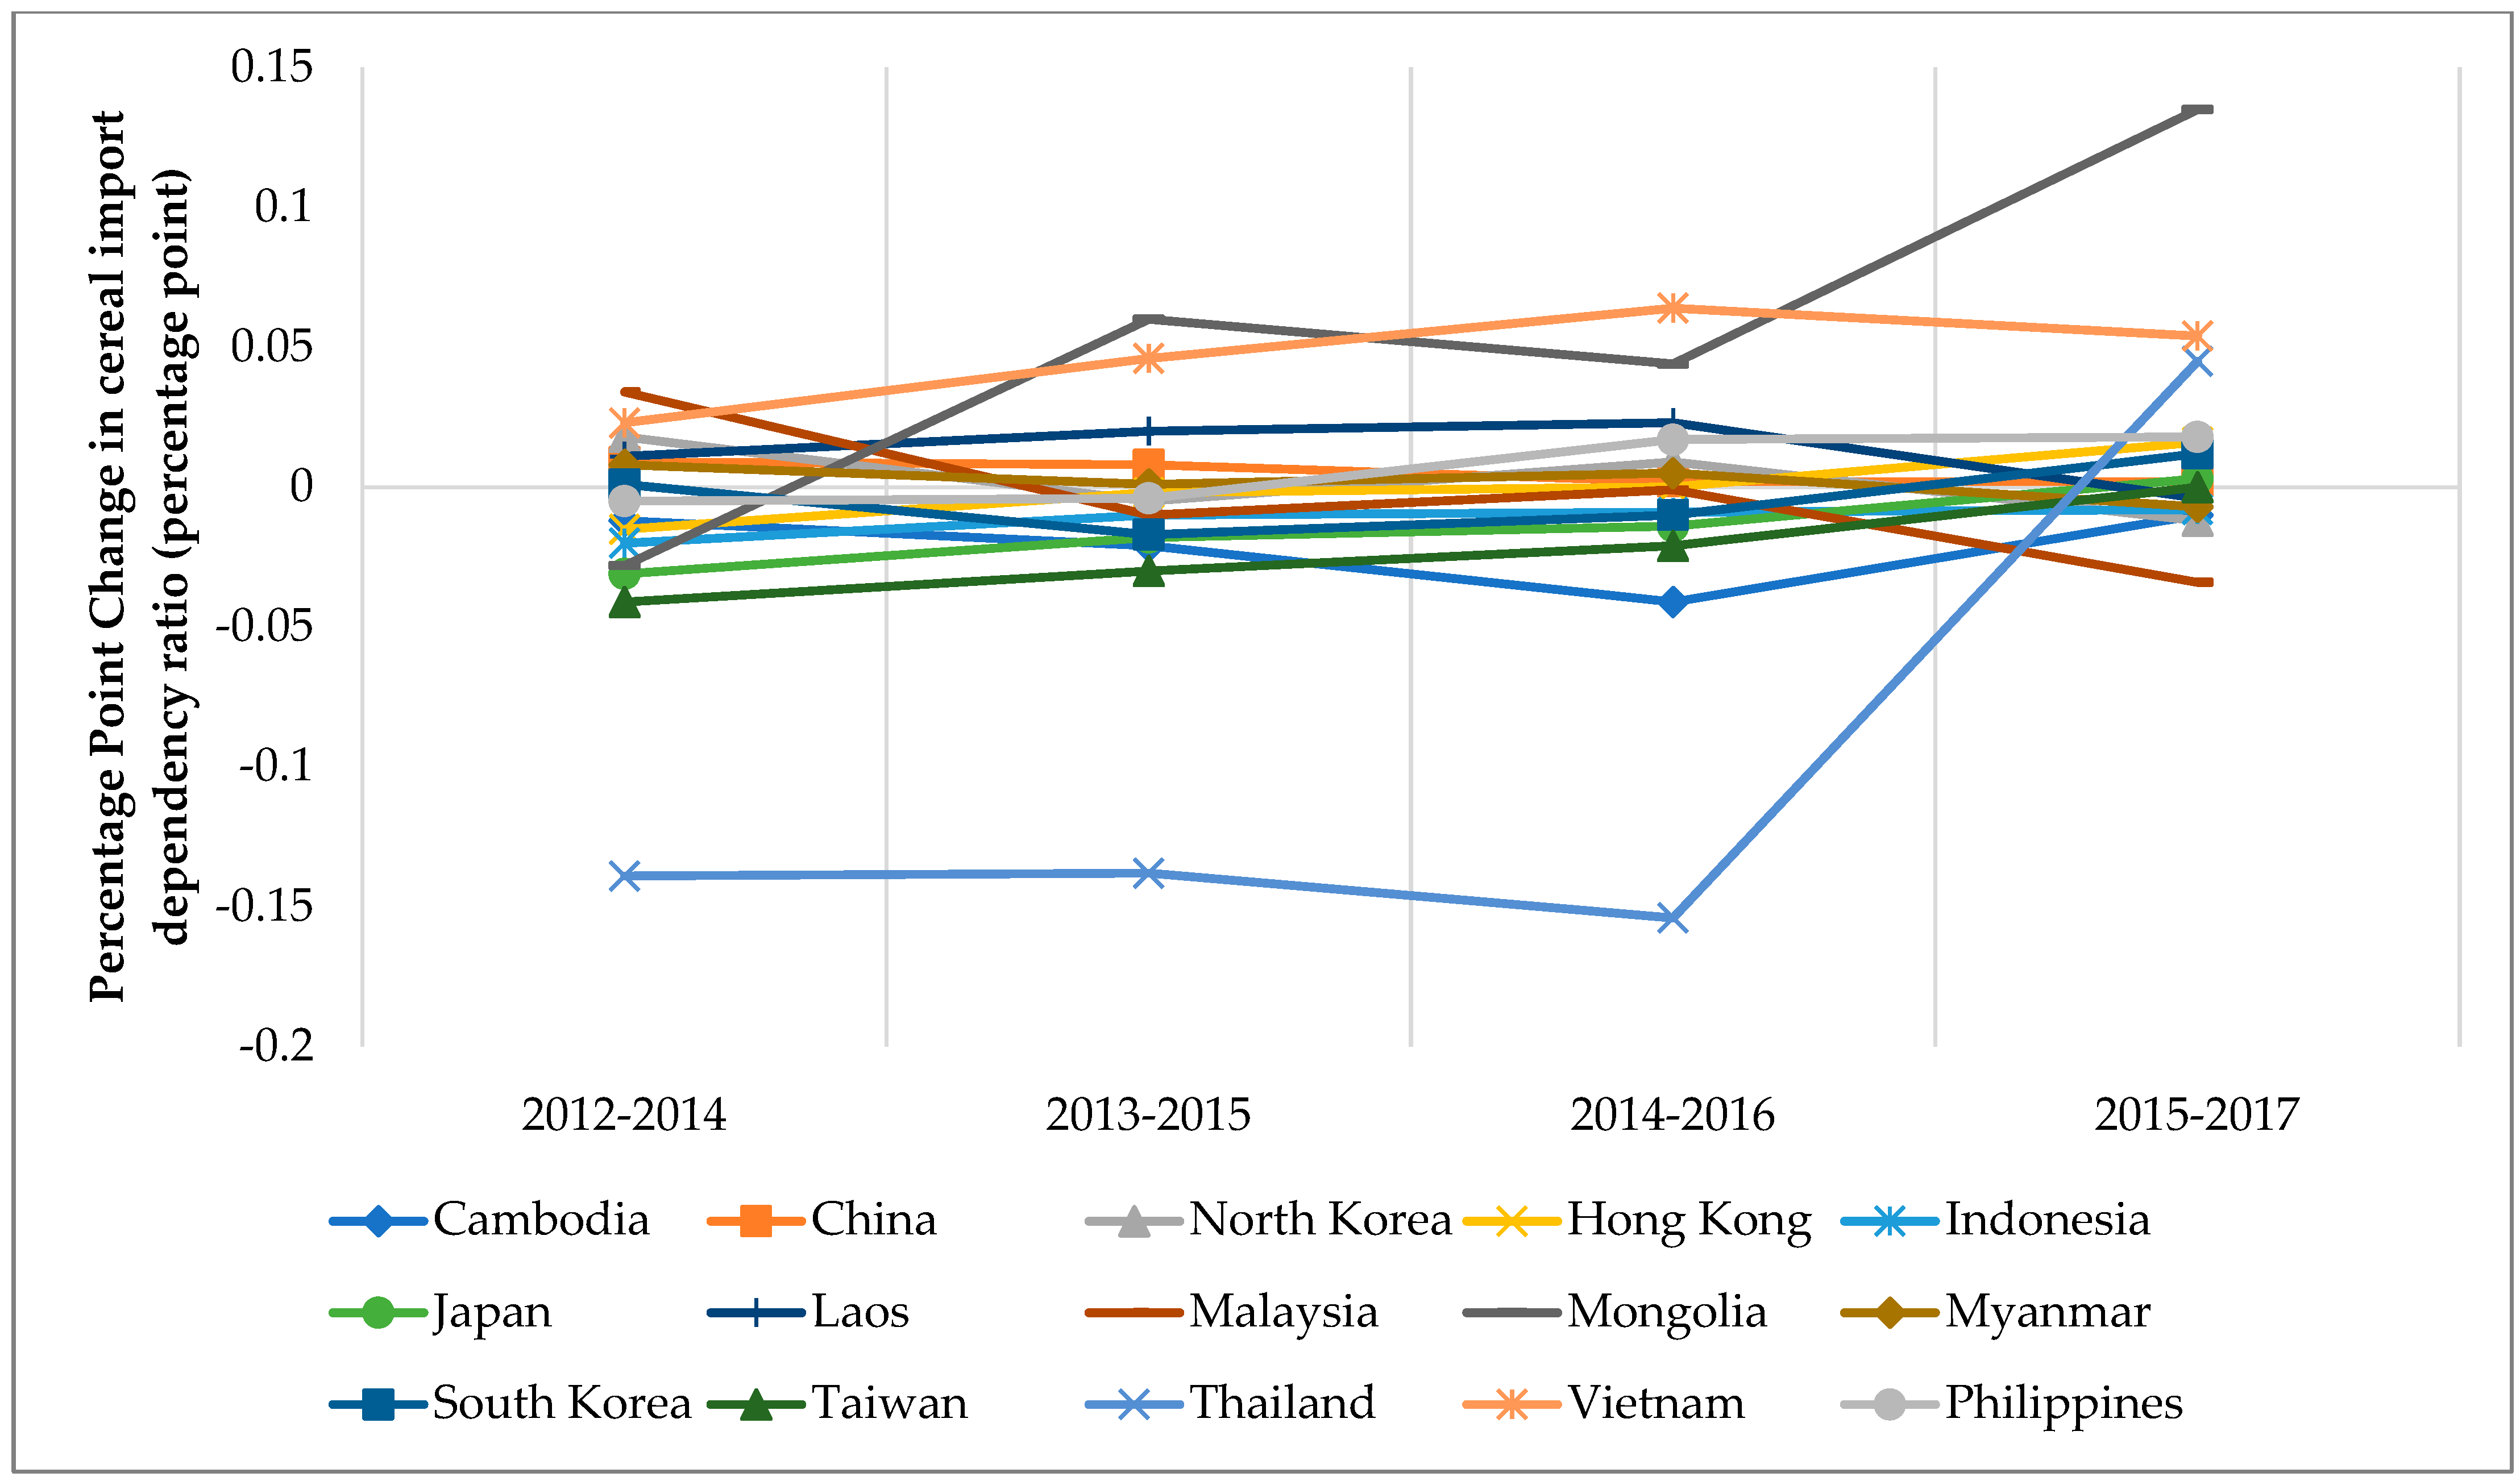
On the other hand, some Southeast Asian economies such as Vietnam and Thailand are net cereal exporters. However, these countries have also experienced larger variations in this indicator (Figure 4). Thailand was a net cereal exporter in the period 2011–2013, and since then, its cereal import dependency ratio exhibited a negative trend until 2014–2016. The ratio then grew by about 20% in 2015–2017 compared to that in 2014–2016 period. This fluctuation can be attributed to the extended drought during the 2015–2016 season. As most rice production in Thailand relies on a rainfed system, which is highly dependent on precipitation with productivity being sensitive to extreme events, the production fell during the drought and exports decreased [37]. Mongolia, however, is a rather different case. Unlike Southeast Asian economies, wheat is the major staple crop produced and traded in Mongolia. The significant increase in wheat imports from 2016 to 2017 can be explained by the massive decline in wheat production during this period. As a landlocked country which is prone to extreme climate events, Mongolia experienced a prolonged drought and unexpectedly high temperatures in 2016 and 2017. The resulting undesirable climate conditions caused great harm to the wheat crops during the crucial growing stages [38].
2.3.2. Percentage of Arable Land Equipped for Irrigation
According to the FAO, the percentage of arable land equipped for irrigation is the “ratio between arable land equipped for irrigation and the total arable land” [4]. This indicator evaluates the reliance on irrigated agriculture and the susceptibility to water stress in each country. Most East and Southeast Asian economies have a higher than world average percentage of irrigated arable land, as Figure 5 shows.
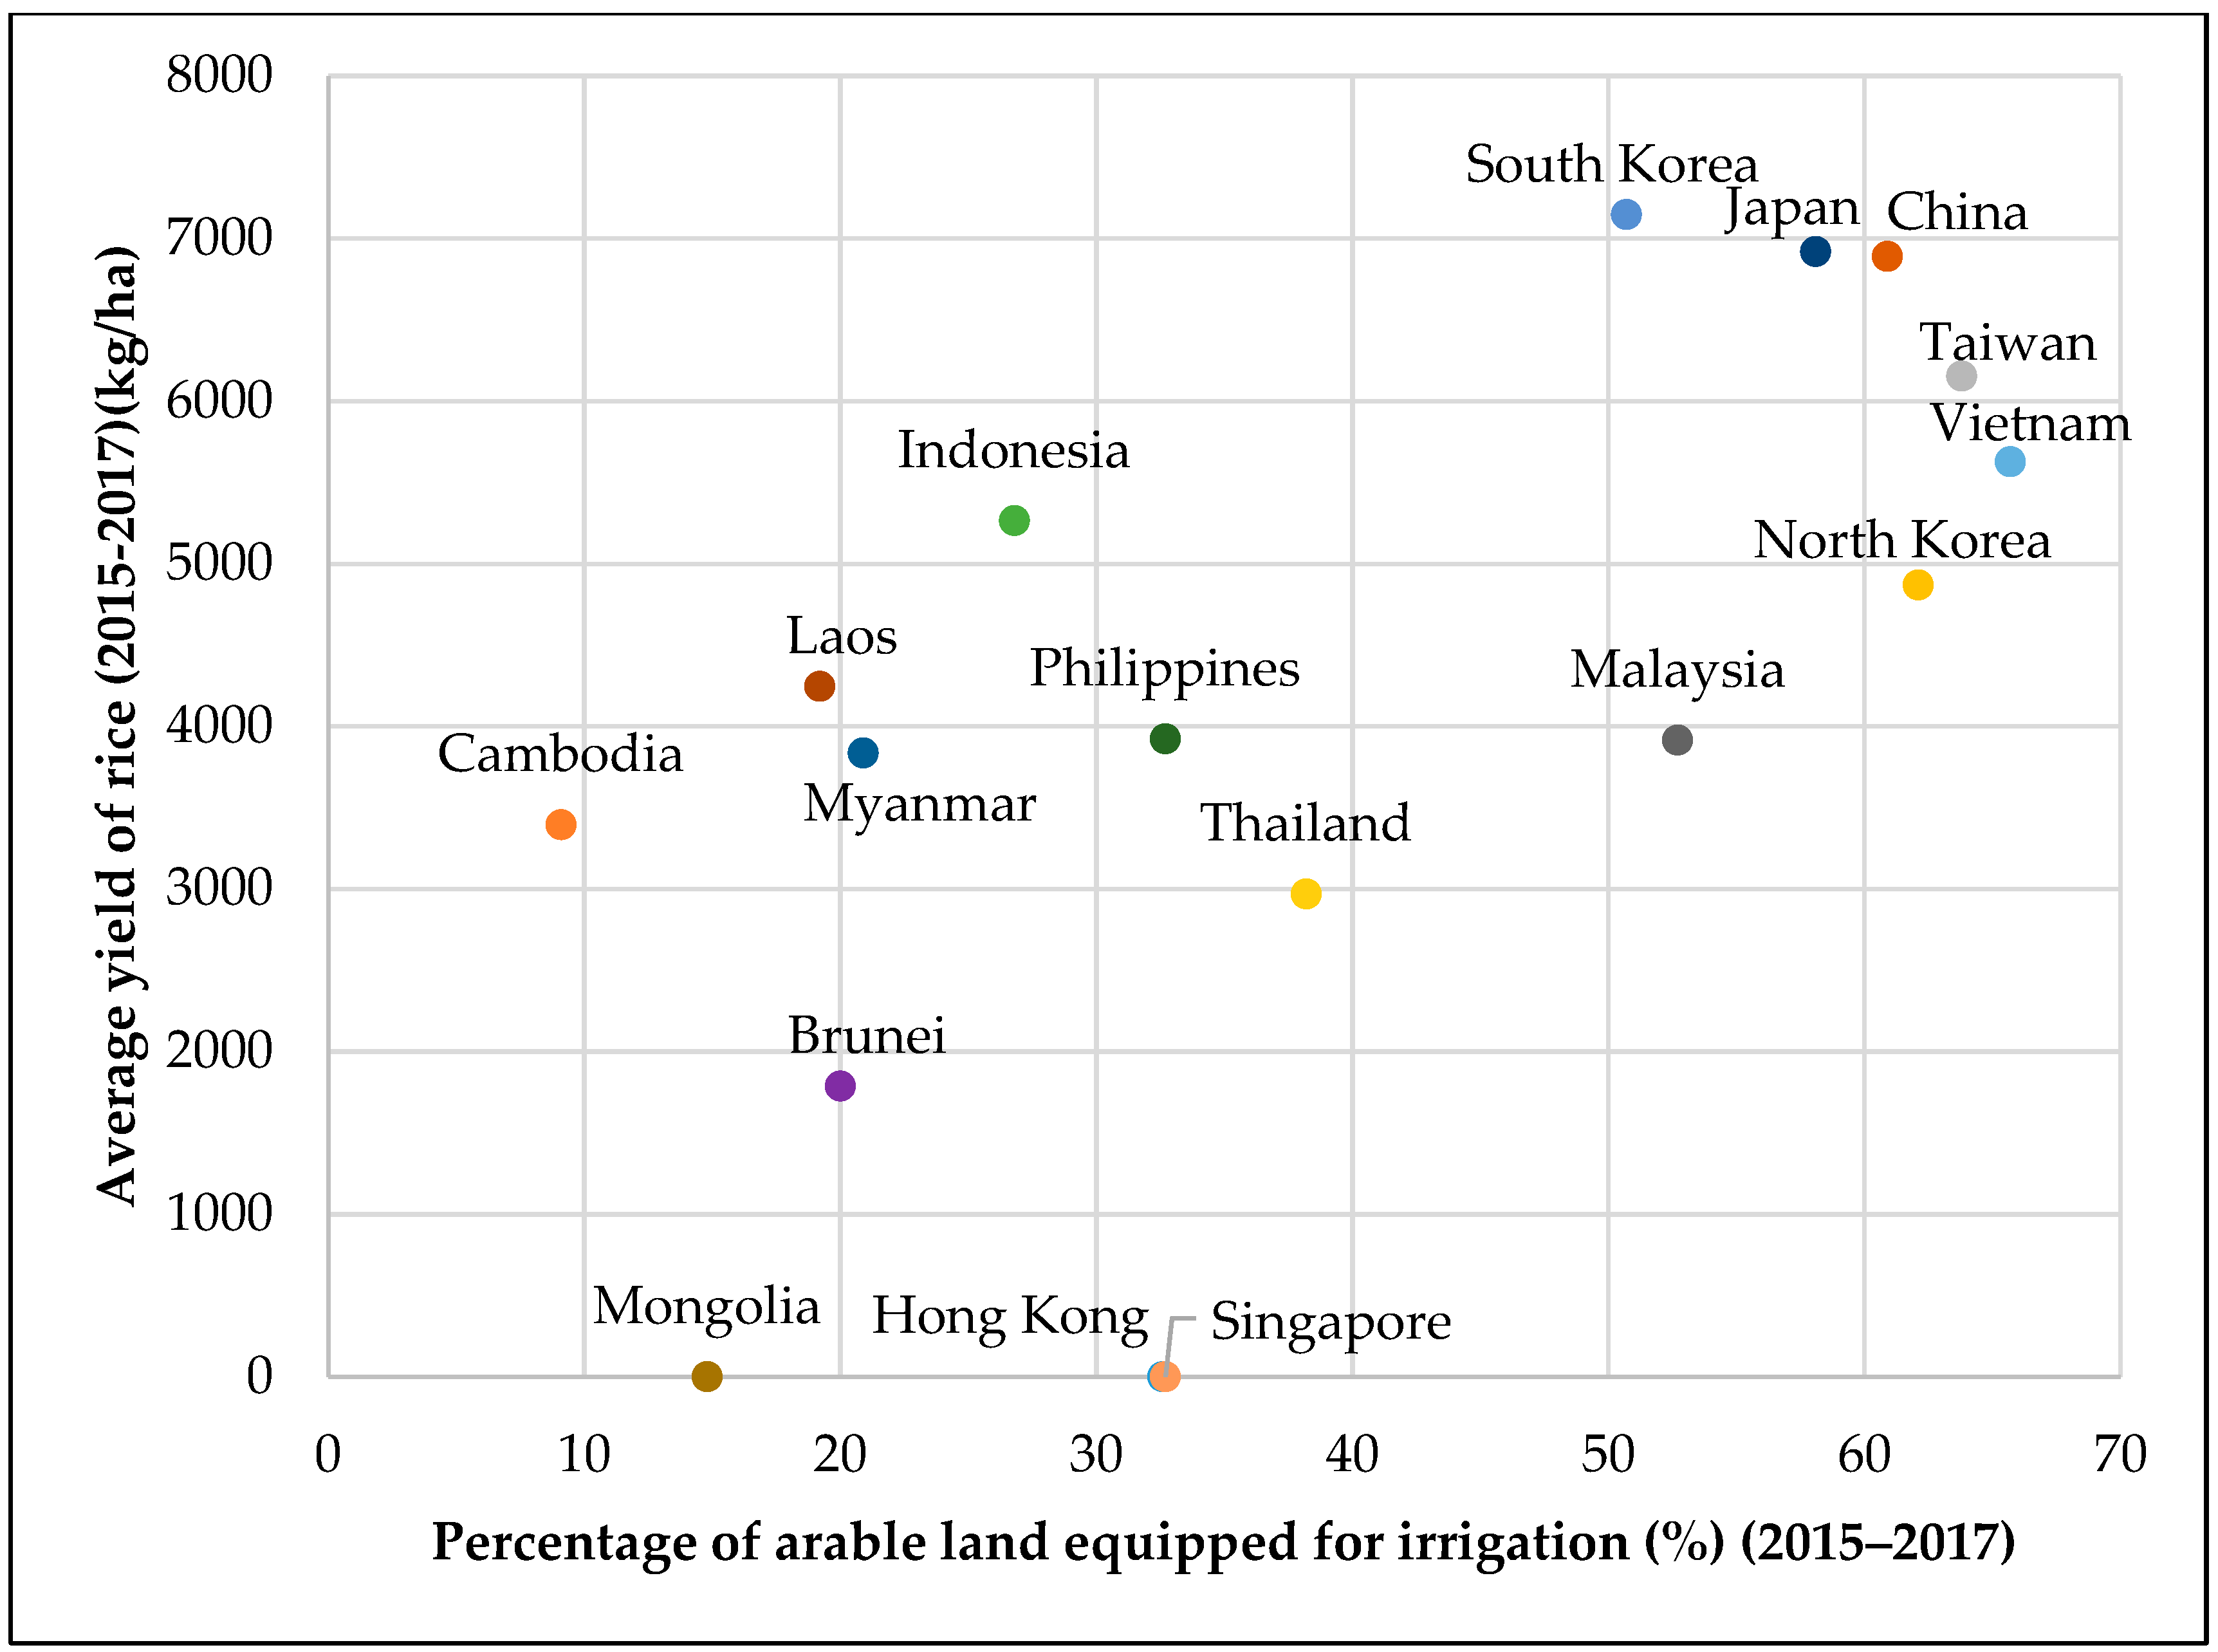
Of all the crops grown in the region, rice uses the most irrigation water and the irrigated rice ecosystem is of great importance in many Asian economies. Irrigated rice production is a high-input agricultural system, which can maintain stable rice supply with its controlled water supply, disease and pest resistant varieties, and the special nutrient cycle in the paddy water. It is a highly intensified production system in that the yields are usually higher than those for other systems, such as rainfed or deep-water rice. Under some humid tropical climates, two or three crops of rice can be harvested in each year with the irrigation system [39]. In Figure 6, we can see a roughly positive relationship between the percentage of arable land equipped for irrigation and the average rice yield. Most East Asian economies, including South Korea, Japan, and Taiwan, where the topography is highly diverse and lacking in large flood plains or river deltas, tend to utilize the irrigation rice production systems, and hence their yields are higher. On the contrary, rainfed and deep-water rice ecosystems dominate in some Southeast Asian economies. For instance, in Thailand the rainfed system is implemented in over 80% of the country’s total rice growing area. As the water supply is uncontrolled, the yield varies and is relatively low because of the intermittent drought and flood conditions [40].
2.4. Food Utilization
With the provision of sufficient, accessible, and stable food, the proper use of food to acquire adequate nutrition to maintain health and wellbeing is also essential in ensuring food security at all levels. This includes the way people physically handle the food with clean water under appropriate sanitary conditions, as well as the knowledge to prepare and consume food. From a broader perspective, social factors in food preparation, such as adaptation to different cultures or equity in intrahousehold food allocation, should also be considered. In this section, access to water and sanitation facilities, the food available for consumption, and the state of hunger and undernourishment will be presented to discuss food utilization in East and Southeast Asia.
2.4.1. Access to Water and Sanitation Facilities
Water is central to food security. Without clean and sufficient water, almost every aspect of food security, human health and wellbeing included, will be affected. Sustainable Development Goal (SDG) 6 “clean water and sanitation” proposed by the United Nations, aimed to ‘ensure availability and sustainable management of water and sanitation for all’ by making improvements in multiple dimensions including drinking water, sanitation, hygiene, wastewater treatment, water quality, and others [41]. Access to safe water and sanitation facilities can eradicate malnutrition directly or indirectly and avoid water-borne diseases that lead to undernourishment. Besides, clean and safe water is also essential for food preparation and processing.
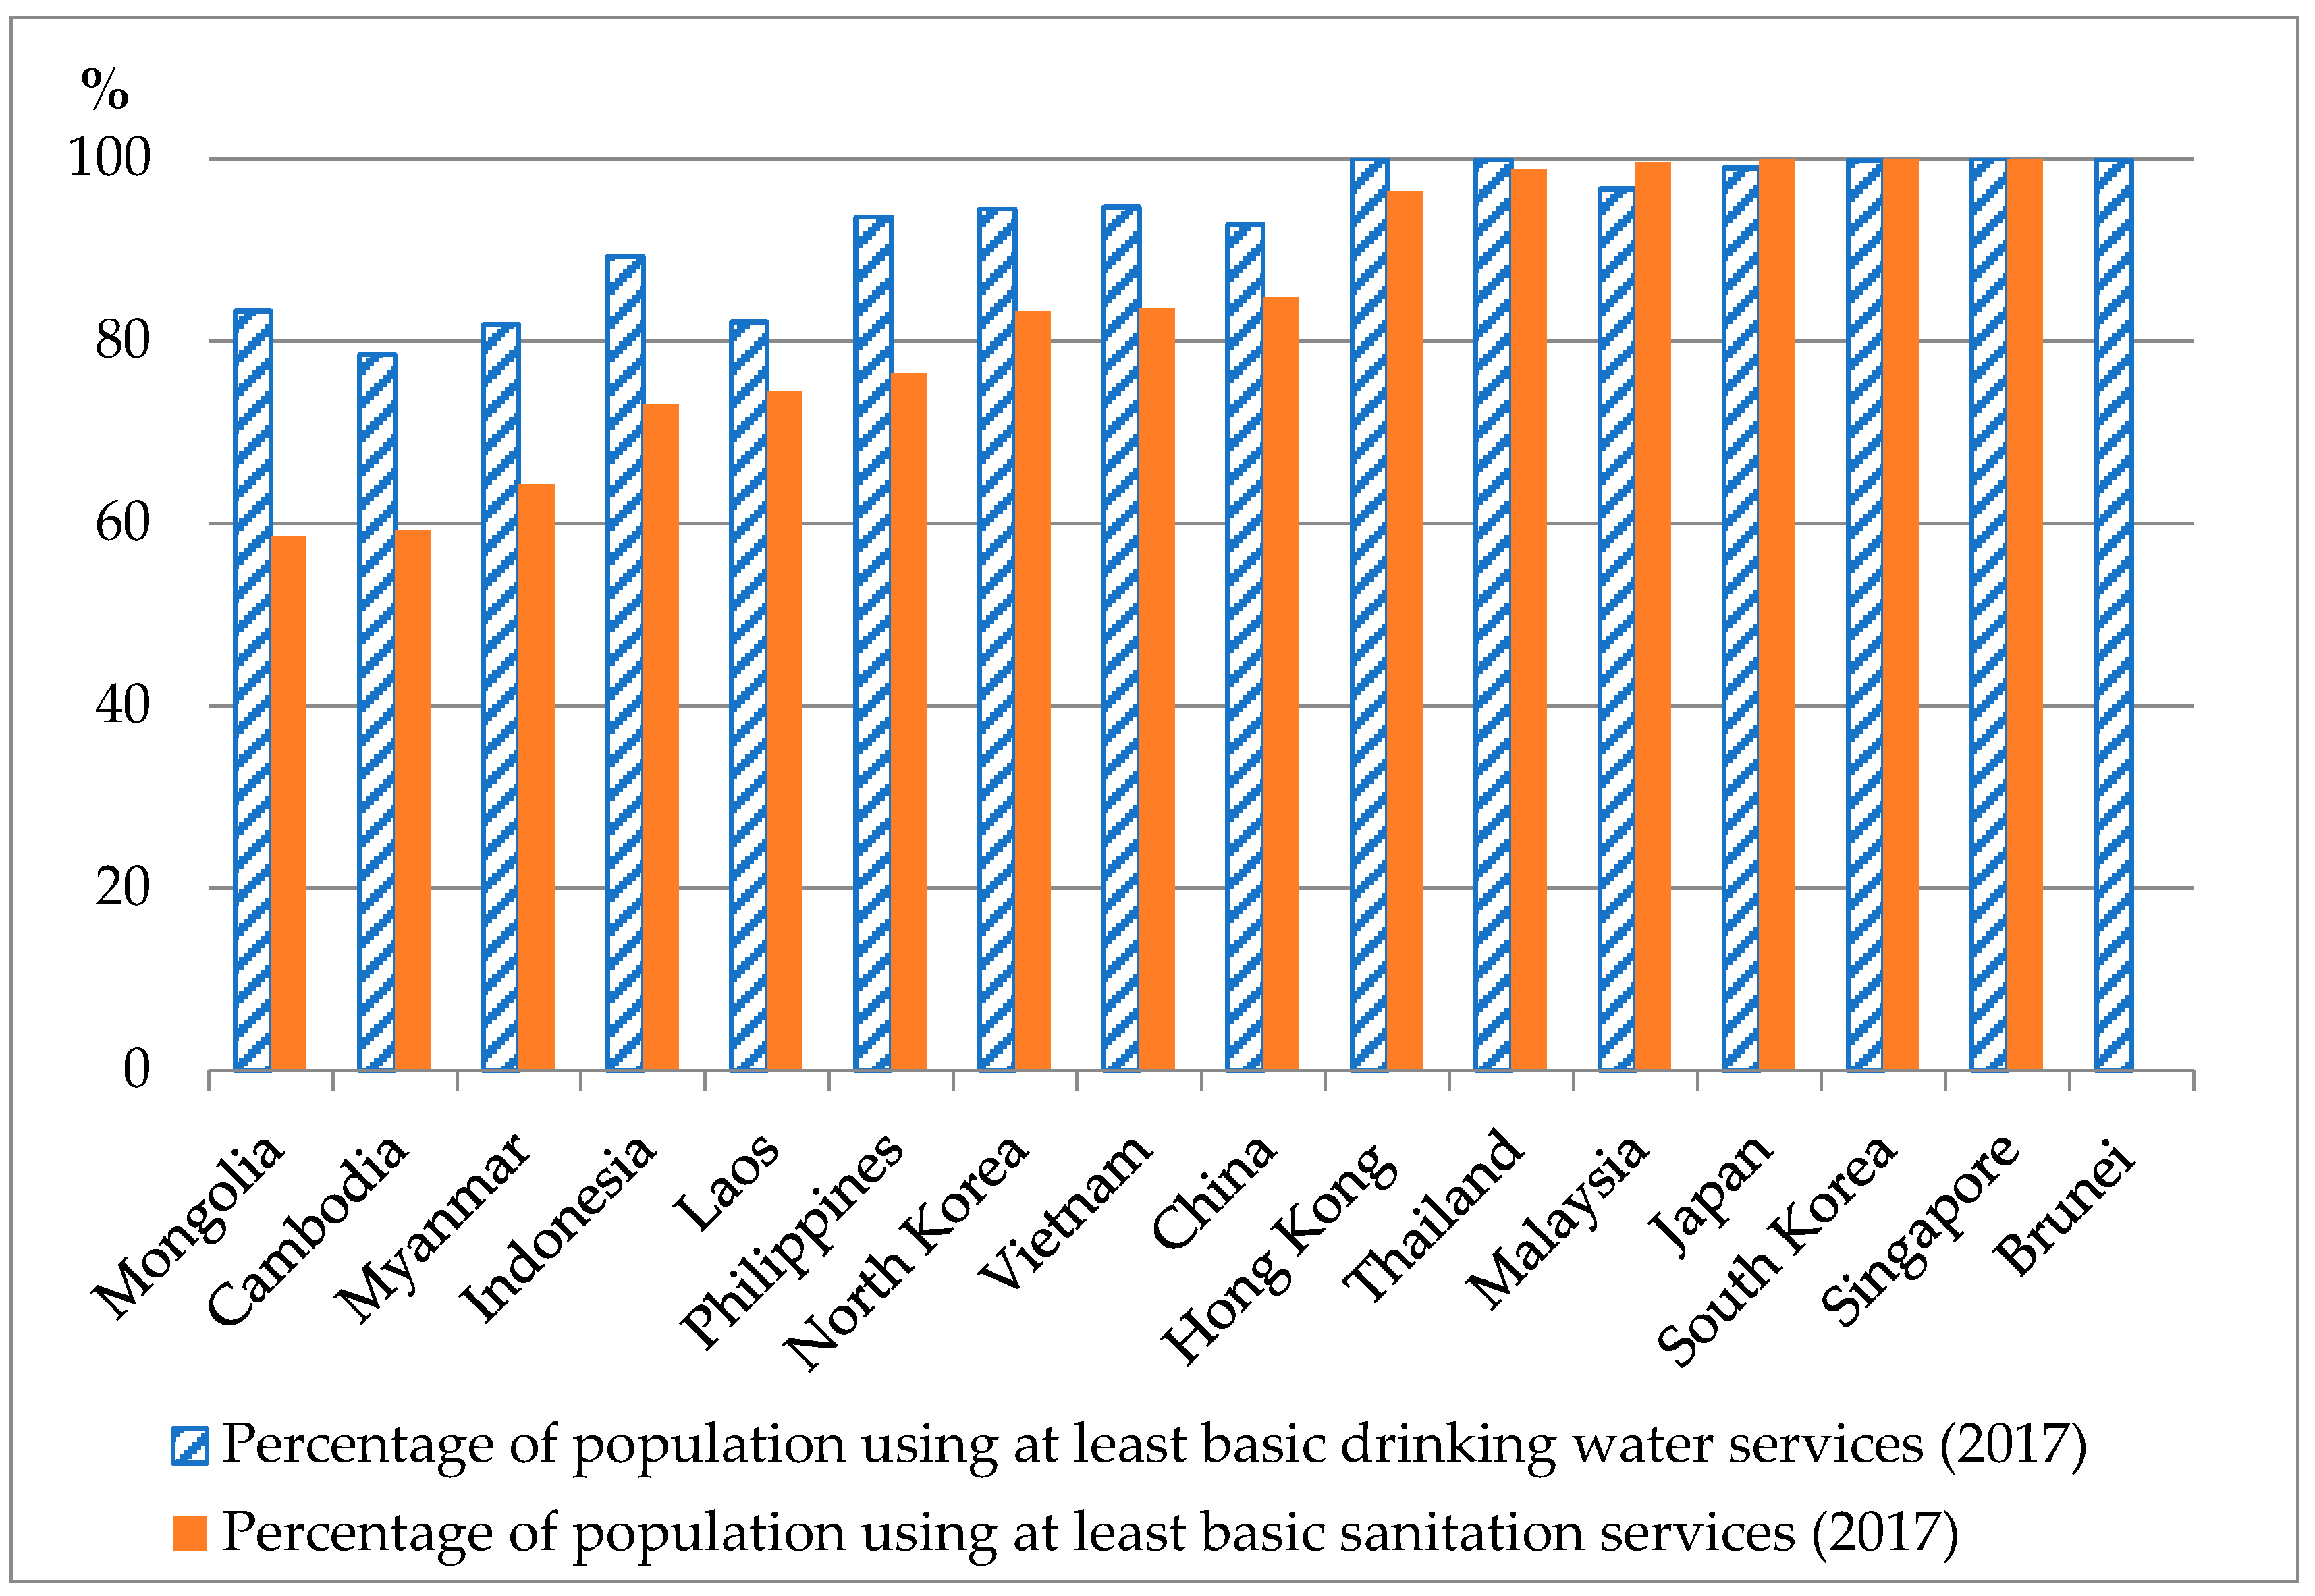
Figure 7 shows the percentage of population using at least basic drinking water and sanitation services in East and Southeast Asian economies in 2017. Most developed economies have almost 100% of basic drinking water and sanitation services, while many developing economies lack sufficient drinking water and sanitation services.
2.4.2. Food Available for Consumption
From a health perspective, it is important to keep track of food consumption patterns to understand the nutrition composition in daily diets and prevent the development of nutrition-related diseases. Dietary energy supply, which can indicate food available for consumption on the food balance sheet drawn up by FAO, can provide a rough picture of the dietary patterns at the country or regional level [42]. It is calculated with several components using the Equation (3) below [43]:
food available for consumption = production + imports + stock withdrawals − exports − industrial use − animal feed − seed − wastage − additions to stock
Table 7 and Table 8 demonstrate the major groups of food available for consumption on a caloric basis in East and Southeast Asia from 2014 to 2018. In East Asia, supplies of cereals increased slightly from 2014 to 2018, and wheat, rice, and maize exhibited a similar growing trend. In Southeast Asia, cereal supplies also increased from 2014 to 2018. However, there was a large increase in wheat and wheat products from 163 to 208 kcal/capita/day, while the rice and rice products supplies decreased slightly from 1244 to 1221 kcal/capita/day. Supplies of vegetables are relatively low in Southeast Asia, compared to that in East Asia. Supplies of meat, eggs, and seafood in both East and Southeast Asia grew steadily from 2014 to 2018 (Table 8). Supplies of milk declined in East Asia, from 62 to 56 kcal/capita/day, whereas in Southeast Asia, they increased from 27 to 31 kcal/capita/day.
2.4.3. State of Hunger and Undernourishment
Table 9 shows the hunger level of East and Southeast Asian countries according to the Global Hunger Index (GHI). The GHI is designed and published by the International Food Policy Research Institute (IFPRI). The GHI provides measurements of a set of component indicators, which are assessed in three dimensions (inadequate food supply, child undernutrition, and child mortality) by aggregating standardized scores of four indicators (undernourishment, child stunting, child wasting, and child mortality). The calculated GHI scores range from 0 to 100, where 0 means zero hunger and 100 means the worst level of hunger. Based on the calculated GHI scores, each country is classified by its degree of severity from low to extremely alarming [44].
In 2020, China was classified as ‘low’ in East and Southeast Asia, with the GHI score falling under 5, and Thailand, Mongolia, Malaysia, Vietnam, the Philippines and Indonesia were classified as ‘moderate’, with the scores falling between 10.0 and 19.9. Cambodia, Myanmar and North Korea were classified as ‘serious’ since their scores were between 20.0 and 34.9, but no country was classified as ‘alarming’, with the score falling between 35.0 and 49.9. Data for some high-income countries, such as Singapore, Japan, and South Korea, were not measured as the prevalence of hunger in these countries is very low [44].
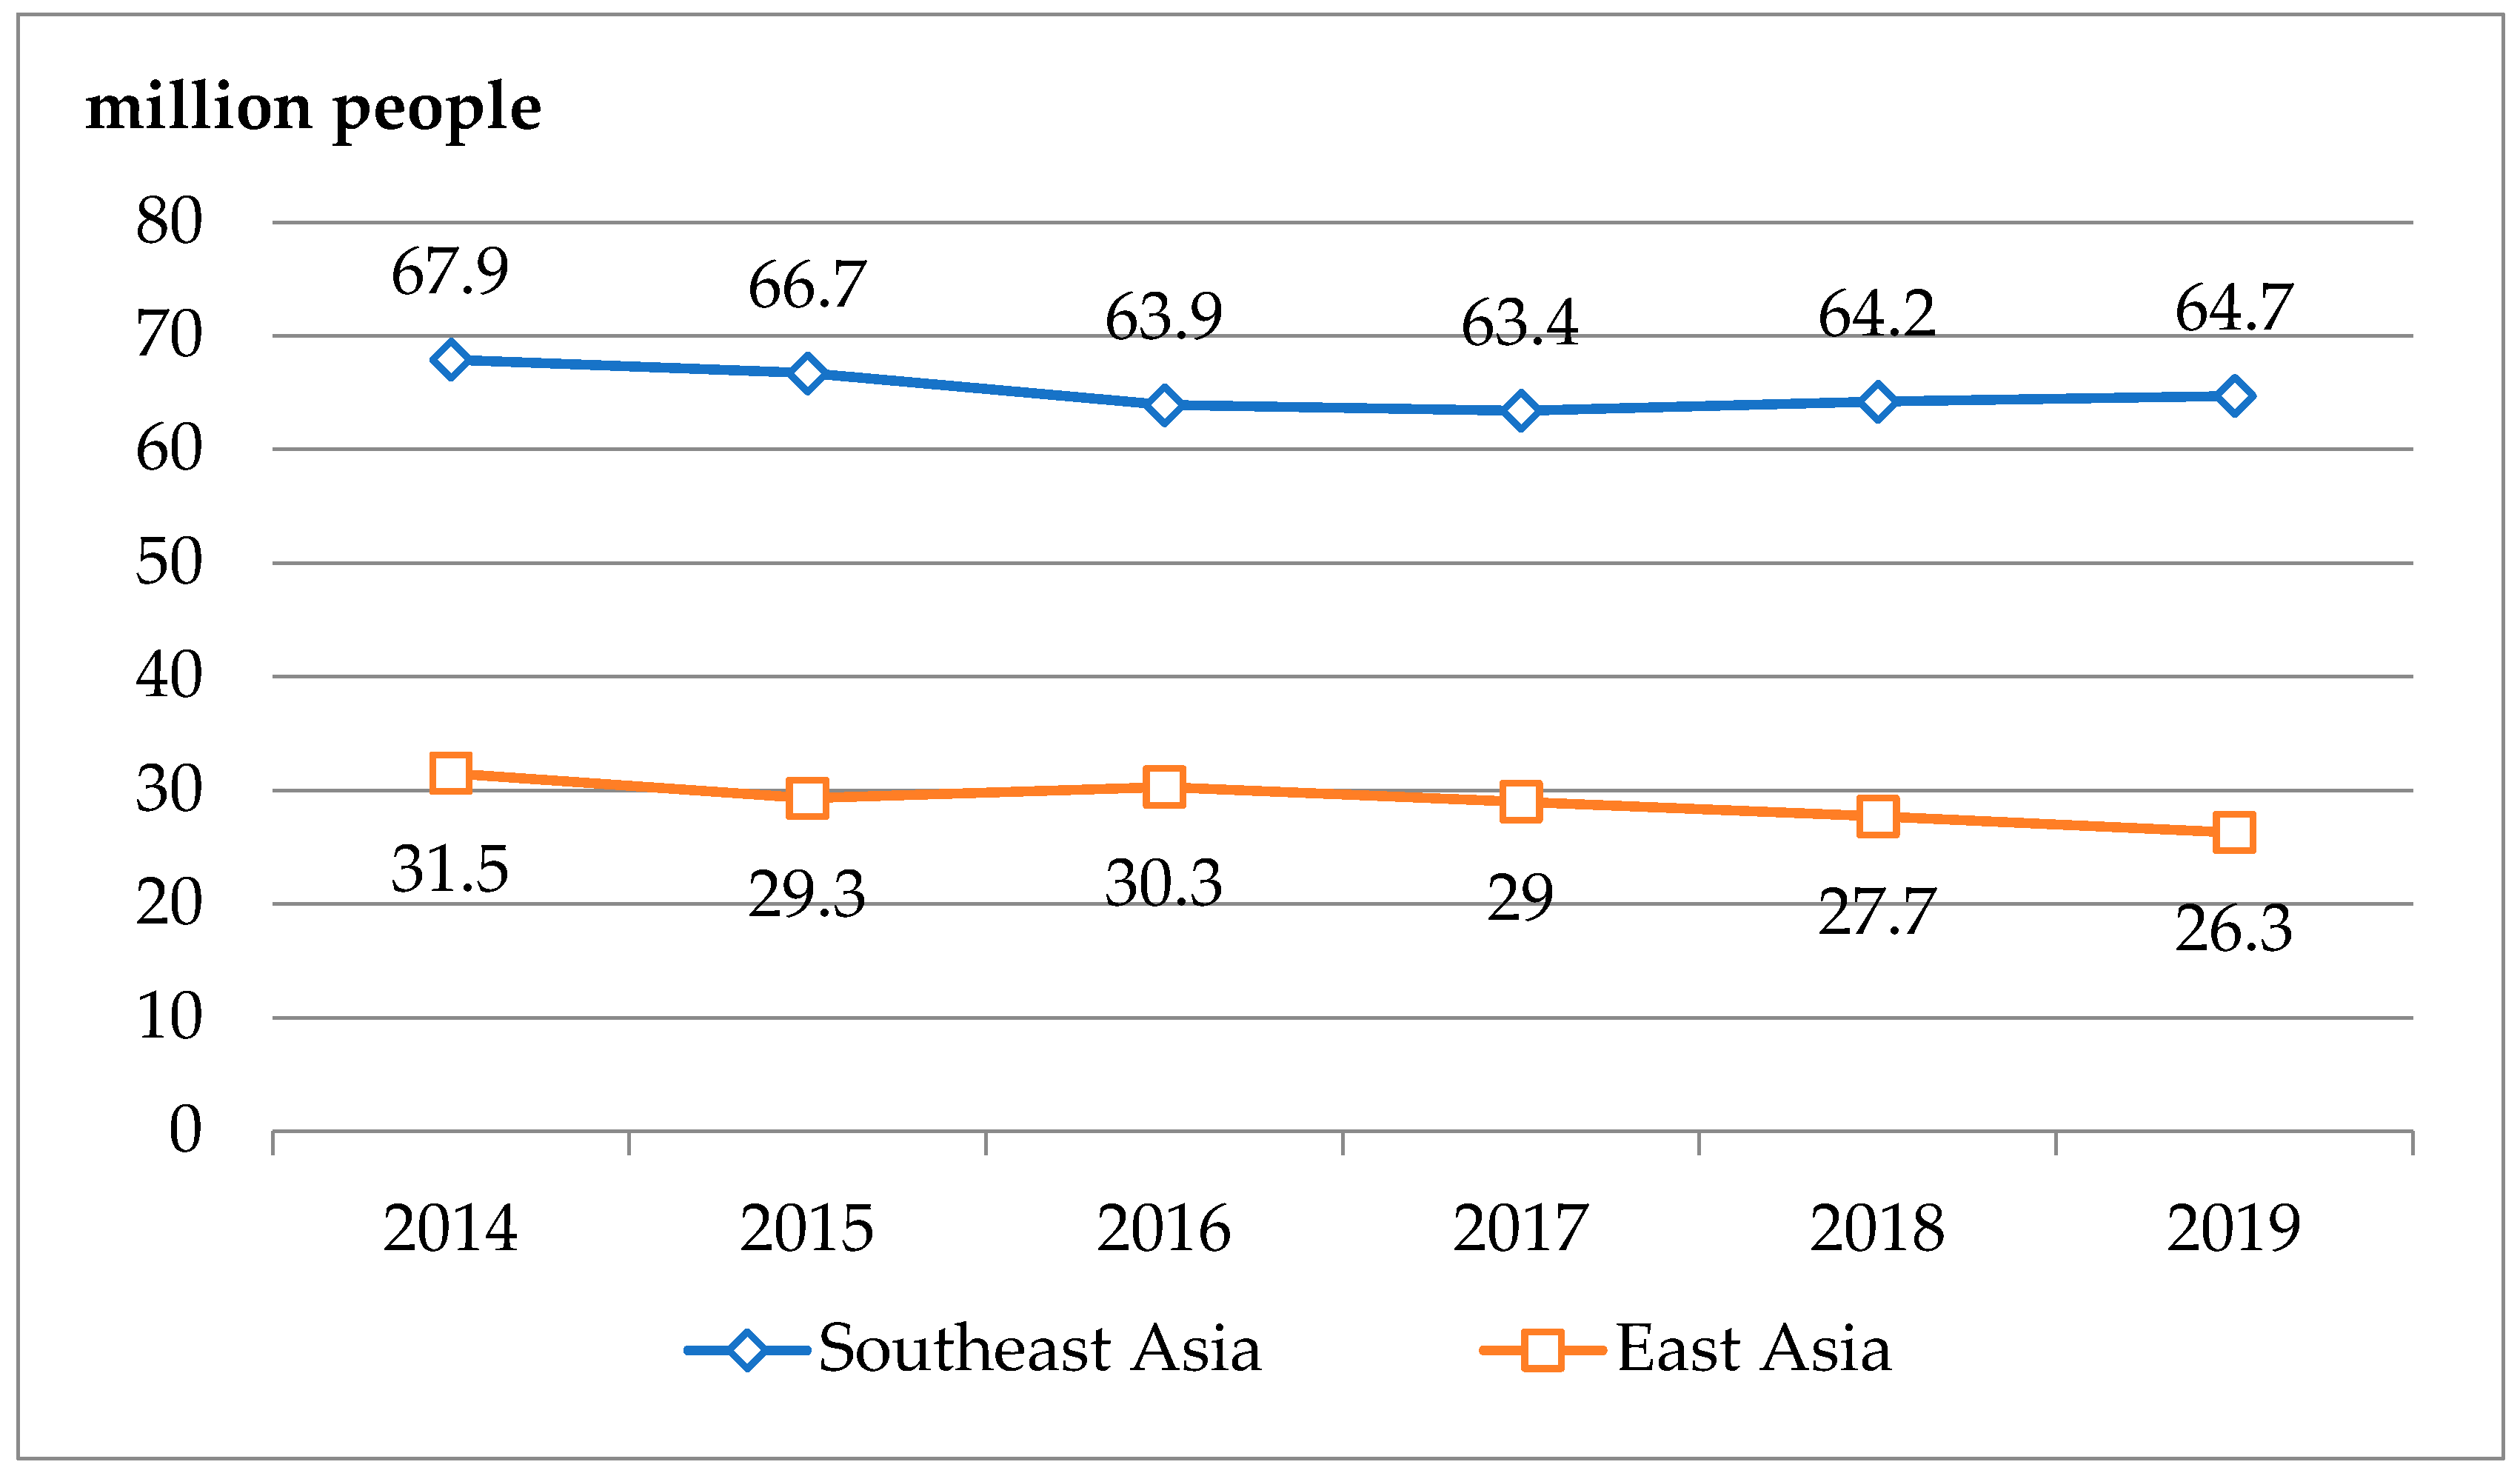
Even though the trend of the hunger index exhibits an improvement in terms of a reduction in hunger in East and Southeast Asia from 2000 to 2020, Asia still has the largest share of people suffering from undernourishment in the world. In 2019, 64.7 million people experienced undernourishment in Southeast Asia, and the number had risen three years in a row, from 63.4 million people in 2017 (Figure 8).
There are multiple reasons for hunger, such as poverty, natural disasters, political unrest, or gender inequity. The harm caused by hunger to society can be significant, including the added pressure on healthcare systems, and a reduction in the productivity. Among the people experiencing undernourishment in this region, those from poor, low-income households account for a large share [45].
The level of economic development of an economy is usually negatively associated with the prevalence of undernourishment. When per capita GDP exceeds a certain amount, people in that economy are unlikely to suffer from undernourishment. From Figure 9, we can even see economies with per capita GDP of more than 40,000 per year (based on constant 2011 international dollars), such as South Korea, Japan, Taiwan, Brunei, Hong Kong, and Singapore, experience a prevalence of undernourishment of under 2.5%.
We would also like to see if the prevalence of undernourishment has something to do with the basic infrastructure in one economy, such as people’s access to clean drinking water. In Figure 9, we can see that there is a roughly negative relationship between the percentage of population using at least basic drinking water and the prevalence of undernourishment if North Korea, the Philippines, and Thailand are not taken into account. Furthermore, among these three economies, Thailand is the most confusing example where it can provide sufficient basic drinking water, produces sufficient food (the SSRs for cereals and meat are both over 100), and yet almost 10% of the people in Thailand still suffer from undernourishment.
It is worth noting that in addition to hunger, many economies in Southeast Asia are facing a crisis of a ‘double burden of malnutrition,’ which refers to the coexistence of over and undernutrition at the individual, household, community, or country level. For example, some children in this region are overweight, whereas other children of the same age are stunted or wasted [46]. This situation has become common in many Southeast Asian economies and can lead to a negative social and economic impact on the overall development of the economy.
3. Challenges from Climate Change
Climate change inevitably has a great impact on food security. As agriculture is a highly weather-dependent industry, the increased frequency of extreme events such as drought, floods, wildfires, and storms can be a great threat to crops, livestock, farming infrastructures, and even lives of farming communities. Among the four pillars we discussed in Section 2, food availability forms the foundation of the food security framework, and food production is central to ensuring food availability. For example, climate change is expected to induce changes in suitable crop varieties, seasonal conditions, extreme weathers (such as high temperature, heavy rainfall, etc.), and atmospheric conditions (such as concentrations of carbon dioxide), all of which may have a considerable impact on the production of food crops. In addition to impacts on crop production, climate variability can also pose a threat to livestock and fishery production. Heat stress, water insecurity, and elevated concentrations of carbon dioxide, to name a few, contribute to the risks to the production systems through development of pathogens, lower survival rates, and shift in distribution of animal species [47].
Because of the reduction in food supply caused by climate change, additional costs are incurred for consumers to buy food, thereby further limiting consumers’ access to food. On the other hand, for farmers and households whose livelihoods rely on agricultural production, their income level may decrease due to low productivity and high production costs [48]. This result is also linked to reduced stability of food supplies, as poor economic conditions indicate that people do not have enough resource to get access to markets, or to always secure stable and sufficient food for the household.
As for the dimension of food utilization, climate variabilities caused by extreme events in recent years are found to be factors contributing to changes of food quality and safety. These changes are transformed into a shift in dietary patterns and eventually give rise to poor nutritional status. For instance, in recent years a growing number of research starts to focus on how rising CO2 level and temperature affect crop yields and their nutritional value. The loss of some critical micronutrients such as zinc, iron, and vitamin A can lead to malnutrition problems. Livestock health, which is correlated with the quality of meat, may also be affected by environmental conditions, including humidity, temperature, biotic components, and water availability [49]. The impacts of climate change will not only reduce the consumed calories, but also hinder the formation of healthy local eating habits [50]. Therefore, understanding the context of these changes and identify the problems is crucial as it is more likely to make effective policy and plans to improve food security at national and regional levels. In this final section, a brief discussion on how climate change affects food security in food production systems, agricultural livelihoods, nutrition, and food policy making concludes this review.
3.1. Impacts on Food Production Systems
The stability of food supplies depends on a well-functioning food production system. Changes in weather patterns such as uneven precipitation and rising temperatures can put pressure on crop yields, fish migration patterns, and livestock productivity [51]. Low productivity negatively affects food production, resulting in food insufficiency and eventually lead to an increase in domestic food price [47], which means food availability and access to food will be undermined. On the other hand, several studies suggest that geographic shift in favourable conditions can possibly create new opportunities for food production in some areas.
According to Global Climate Risk Index 2021 report published by Germanwatch, from 2000 to 2019, many countries in Southeast Asia (such as Myanmar, the Philippines, Thailand, and Vietnam) were exposed to extremely high risks of climate change [52], meaning that climate change is a crucial factor when addressing food security issues in this region. As a matter of fact, at the end of 2019, Southeast Asia had been facing a serious drought problem. According to statistics from the Mekong River Commission, the water level of the Mekong River in 2019 has set the lowest record in nearly 60 years, coupled with the emergence of the El Niño phenomenon, downstream Mekong River countries in Southeast Asian (including Cambodia, Laos, Thailand, and Vietnam) were facing severe drought problems [53], causing export prices for rice to increase in the two major rice exporting countries, Vietnam, and Thailand, in the first quarter of 2020.
Aside from drought issues, rising sea levels, especially around the delta regions, is another critical climate issue not to be overlooked while investigating food security issues in Southeast Asia. Studies have shown that the altitude of the delta areas in Southeast Asia is lower than previously predicted. As the delta region is often populated and cultivated for food, rising sea levels poses as much a threat to local food production as to livelihoods of local population [54]. For instance, rice is mainly grown in the Mekong Delta in Vietnam, and hence rising sea levels might bring risks of underproduction for this major rice exporting country. Furthermore, in recent years China’s policy of building dams on the upper Mekong River has also led to a decrease in water flow into Vietnam, which causes the problems of soil salinization and seawater intrusion, further aggravating rice production in Vietnam [55].
On the other hand, the geographical shift in favourable conditions for crop production may bring possible benefits in some areas [48]. Warming temperatures extend growing seasons in high-latitude regions. Some studies suggest that it can give rise to new opportunities for food production due to higher crop yield and larger diversity of crop varieties [56]. A study focusing on impacts on rice yields in South Korea [57] predicting with integrated modelling approaches reveals an increasing trend of rice yield under the scenario of Representative Concentration Pathway (RCP) 8.5. RCP 8.5, usually being regarded as ‘business as usual’ scenario, is a high greenhouse gas (GHG) emission scenario where climate change policies are absent [58]. A study [59] also revealed that elevated CO2 concentration may improve crop yields and water-use efficiency (WUE) during photosynthesis process. The higher CO2 concentration can inhibit transpiration levels and hence reduce water losses. The yield and WUE growth trends are particularly noticeable on rainfed wheat at higher latitudes. However, despite the potential benefits, the complex interactions between climatic conditions and the agro-ecosystem should also be noticed. Changes in temperatures, carbon dioxide level, and moisture create favourable conditions for the expansion of weeds and pests, which may offset the benefits of climate change in some production areas [48]. To maximize the potential advantages, developments of new varieties, appropriate pest and fertilizer management strategies, and revised irrigation and drainage systems are required to adapt to the environmental changes [56].
3.2. Impacts on Agricultural Livelihoods
The disruption of agricultural production creates direct impacts on agricultural livelihoods. Increased frequency of extreme events as well as long-term changes of climatic conditions lead to lower yields of food [60] and agricultural outputs. As a direct impact of climate crisis, farming households relying on agricultural production may face income losses. For the least developed countries whose agricultural sector accounts for a large portion of their economies, losses of agriculture jobs will lead to a high unemployment rate in rural areas and further push people to migrate to urban areas seeking for opportunities. A study [61] suggests that a 3 °C temperature increase could lower agricultural labour capacity by 30–50% in sub-Saharan Africa and Southeast Asia. According to the Internal Displacement Monitoring Centre [62], in the period of 2008 to 2018, climate related disasters have made 54.5 million people displace across Southeast Asia [63]. In this region, sea level rise is the major push factor of migration for coastal communities. Most people living in coastal areas are reliant on fisheries, aquaculture, and related industries. The loss of biodiversity, inundation, saltwater intrusion, and flooding pose threats to the livelihoods of 77% of total population residing in this region [64]. Furthermore, over 79 million people are predicted to lose their homes due to the flood inundation in Southeast Asia by 2050 [63], which force residents in these areas to flee their home or country. Without sufficient capacity to adapt or transform, regional political instability will deteriorate and potentially provoke conflicts [65]. The U.S. National Intelligence Council [66] pointed out that cross-border migrant workers between countries within Southeast Asian region can bring pressure on domestic employment, resources distribution, as well as conflicts between different ethnic and religious groups.
Meanwhile, from the perspective of consumers, access to food will be diminished because of increasing food prices. As an outcome of balance between food supply and demand, food price rise reflects low productivity and resource scarcity from the supply side, as well as increasing population from the demand side [67]. The economic impacts triggered by food insecurity can be extensive and long-lasting. According to [47], cereal price is projected to rise by 1–29% in 2050 under various Shared Socio-economic Pathways (SSPs), which are the integrated socioeconomic scenarios with varying degrees of mitigation and adaptation challenges. As a result, consumers from underdeveloped countries are projected to be hit hard. The model projections under different SSPs reveal that an additional 1–188 million people will be living on the edge of hunger, in contrast to a no climate change scenario. In some special cases, smallholders may be benefit from increasing food prices if they reach an optimum balance between food sales and purchases. For instance, in Indonesia many poor people rely on agriculture. Additionally, the yield impacts are estimated to be lower than other countries. Increasing food prices due to climate change can thus bring better incomes for farmers and reduce poverty. Other than that, higher food prices caused by weather-related disasters usually exacerbate poverty in farming communities who are net buyers as their incomes are reduced due to low productivity [68].
3.3. Climate Change and Nutrition
In the food security framework, the food utilization dimension encompasses food safety and quality, as well as nutritional status. The latest data from Global Nutrition Report [69] revealed that in the Asia region 21.8% of children under 5 years old suffer from stunting, and 9.1% suffer from wasting. The nutritional status will exacerbate due to low food availability and other external conditions of climate change. People who have restricted access to food are at high risks of undernutrition. Calorie deficiencies will become more prevalent, and on top of that, micronutrient sufficiency is more crucial on improving food security. As we mentioned above, a large proportion of the population relying on agricultural production in developing countries may be faced with income decline due to low productivity. As a result, they are inclined to purchase more cheap staples or processed food, which are more affordable but less nutritive [50], rather than fresh vegetables and fruits. Lack of clean drinking water and sanitation facilities, difficulties in accessing healthcare services, limited diet diversity also deteriorate the nutritional status of these vulnerable groups [60].
A recent study conducted by University of Vermont [70] demonstrated that increasing temperatures had significant negative impacts on diet diversity among children in five out of six studied regions (Asia; Central and South America; North, West, and Southeast Africa). On the other hand, higher precipitation, depending on its pattern, correlated with higher diet diversity, shown by the study. Diet diversity is assessed by the number of different food groups consumed in a specific time. Low diet diversity indicates low diet quality and lack of micronutrients consumption, which will result in malnutrition.
The impacts on food nutritional value of elevated CO2 concentration, due to climate change, is widely discussed over past decades. According to the Special Report published by Intergovernmental Panel on Climate Change (IPCC) [71], despite the growth stimulation effects by elevated CO2 in some cereal crops, decreased protein, micronutrient, and vitamin B content are found in major rice cultivars in Southeast Asia because of high CO2 concentration. A study [72] found that protein contents in rice, wheat, barley, and potato declined by 7.6%, 7.8%, 14.1% and 6.4% respectively under elevated CO2 scenario. As plants are the major sources of protein intake for 76% of the global population, the reduction of protein contents in these staple crops will put an extra 148.4 million people on the edge of protein insufficiency by 2050. Studies also found that zinc and iron deficiencies in C3 cereal crops (rice, wheat, and barley) under an elevated CO2 scenario [73,74]. The IFPRI [75] also found that by 2050 availability of protein, iron, and zinc per capita will be reduced by 19.5%, 14.4%, and 14.6% respectively. The suggested interventions to ensure nutrient adequacy include plant breeding, integrated cropping systems, improved farm management, and the use of microbial inoculants [76].
3.4. Climate Change and Food Policy Making
Impacts on food security of climate change are recognized in the 2015 Paris Agreement, “the fundamental priority of safeguarding food security and ending hunger, and the particular vulnerabilities of food production systems to the adverse impacts of climate change.” It also highlights the importance of adaptation to food production in its Article 2, “Increasing the ability to adapt to the adverse impacts of climate change and foster climate resilience and low greenhouse gas emissions development, in a manner that does not threaten food production.” The Nationally Determined Contributions (NDCs), which are central to the Paris Agreement, guide the participating countries to achieve their goals in GHG emission reductions, as well as adaptation and mitigation measures implementation, whereas the Intended Nationally Determined Contributions (INDCs) are communicated by each member country to inform the international community their intended actions on achieving the goals under the agreement [77].
According to [78], of the 160 parties submitting INDCs, 87 included agriculture and related GHG targets in their mitigation plans, and 7 included non-GHG agriculture-related targets in their plans. A total of 128 parties have referenced climate actions and measures in the land use, land use change and forestry (LULUCF) sector. As for adaptation, agriculture is prioritized by 102 parties out of 113 including adaption plans in INDCs. As food production and LULUCF sector have enormously contributed to the global GHG emissions, many countries have evidently realized the importance and urgency to integrate climate change into food policy making to ensure long-term food security [51].
Food systems connect with other domains in a sophisticated way, which means governance and policy making should be tailored according to their scales, sectors, and properties [79]. Several studies [77,80] have provided suggestions in food system transformation under changing climate. For instance, GHG emissions reduction can be achieved through investments in sustainable livestock, CO2 sequestration by forests and biomass, and tackling deforestation. Besides, empowerment and education of the most vulnerable people can act as a sustainable solution to improve their livelihoods. Natural resource management and genetic diversity are as well critical to improve long-term resilience and avoid risks. Climate finance is expected to support the transformation by making finance more available to smallholders, building an inclusive financial ecosystem to offer technical assistance, and creating mechanisms to facilitate capital into climate-smart agricultural investments [81].
On the other hand, mitigation measures or policies adopted by governments sometimes might exert greater influences on food security than climate change does. A study [82] simulated global land utilization and population suffering from undernourishment in 2050 under various mitigation policy scenarios. This research suggests that, for China and Southeast Asian countries, if the local government adopts strict mitigation measures, the negative impacts of these measures on local undernourishment population is far greater than that of climate change itself, particularly under Representative Concentration Pathway (RCP) 2.6, proposed by IPCC [83]. The RCP 2.6 is the lowest projected level of climate change which can be achieved with ambitious mitigation measures to reduce GHG emissions. To illustrate, food production systems in the developing countries are usually less resource-efficient, with higher greenhouse gas (GHG) emissions and lower yield, as compared to those in the developed countries. Effective climate policies not only reduce GHG emissions but also enhance productivity, and hence increase food availability in terms of food security. However, strict mitigation measures, such as heavy carbon taxation, can reduce access to food through increased food prices, making healthy and balanced diet nearly unattainable for people in the low-income countries. Therefore, when tackling the threats on food production caused by climate change, the potential impacts on local food security from adopting mitigation policies should be thoroughly considered in advance.
3.5. The Relationship between Climate Indicators and Food Production: The Case of Rice Production in East and Southeast Asia
Food availability is fundamental to the food security framework, and food production is the base for securing food availability. To understand the possible connection between climate factors and food production, we would like to investigate the relationship between food production and several climate indicators. As we have mentioned in Section 2.1.1, the rice crop plays a critical role in food security in many East and Southeast Asian countries. In addition, the agricultural industry in this region is predicted to be highly vulnerable to climate change. Therefore, the relationship between rice production and several climate indicators, including annual mean temperature, annual minimum and maximum temperatures, and annual precipitation, will be discussed. The differences in the relationship between these climate and production variables in five selected countries (including Vietnam, Indonesia, Thailand, Japan, and South Korea) spanning different latitudes and climatic zones in East and Southeast Asia are compared in this section. Table 10 summarizes the geographic and climate information of these countries.
To understand the relationship between climate indicators and rice production, we first calculate the correlation coefficients of climate indicators (annual mean, annual minimum, annual maximum air temperature and annual precipitation) and annual rice yield in Table 11. In the five selected countries, the annual rice yield positively correlates with annual mean, annual minimum, and annual maximum temperatures. As for precipitation, the relationship of annual rice yield and annual precipitation in the selected countries differs. In low latitude countries (Vietnam, Indonesia, and Thailand), the annual rice yield weakly positively correlates with annual precipitation, while in high latitude countries (Japan and South Korea) they correlate with each other negatively.
When investigating the impacts on rice crop production of climate change, we would also like know the relationship between area harvested and climate indicators. Area harvested indicates total area where the rice crop is gathered, and therefore the damaged area is deducted. The correlation coefficients of climate indicators and area harvested of rice are presented in Table 12. In Vietnam, Indonesia, and Thailand, temperature related indicators are positively correlated with annual area harvested of rice. In Japan and South Korea, they correlated with each other negatively. On the other hand, annual precipitation is weakly positively correlated with area harvested of rice in Vietnam, Indonesia, and Thailand. In Japan and South Korea, on the contrary, the values of area harvested of rice negatively correlate with annual precipitation, while the correlation is very low.
According to the results from Table 11 and Table 12, we can see the correlation between the climate indicators and rice production, including the rice yield and the harvested area. However, these results fail to explain how the scale of climate change affects rice production. To gain further understanding, we illustrate scatterplots and associated trend lines in Figure 10, Figure 11 and Figure 12 to compare the relationships between changes in climate indicators and changes in rice production in the five selected countries.
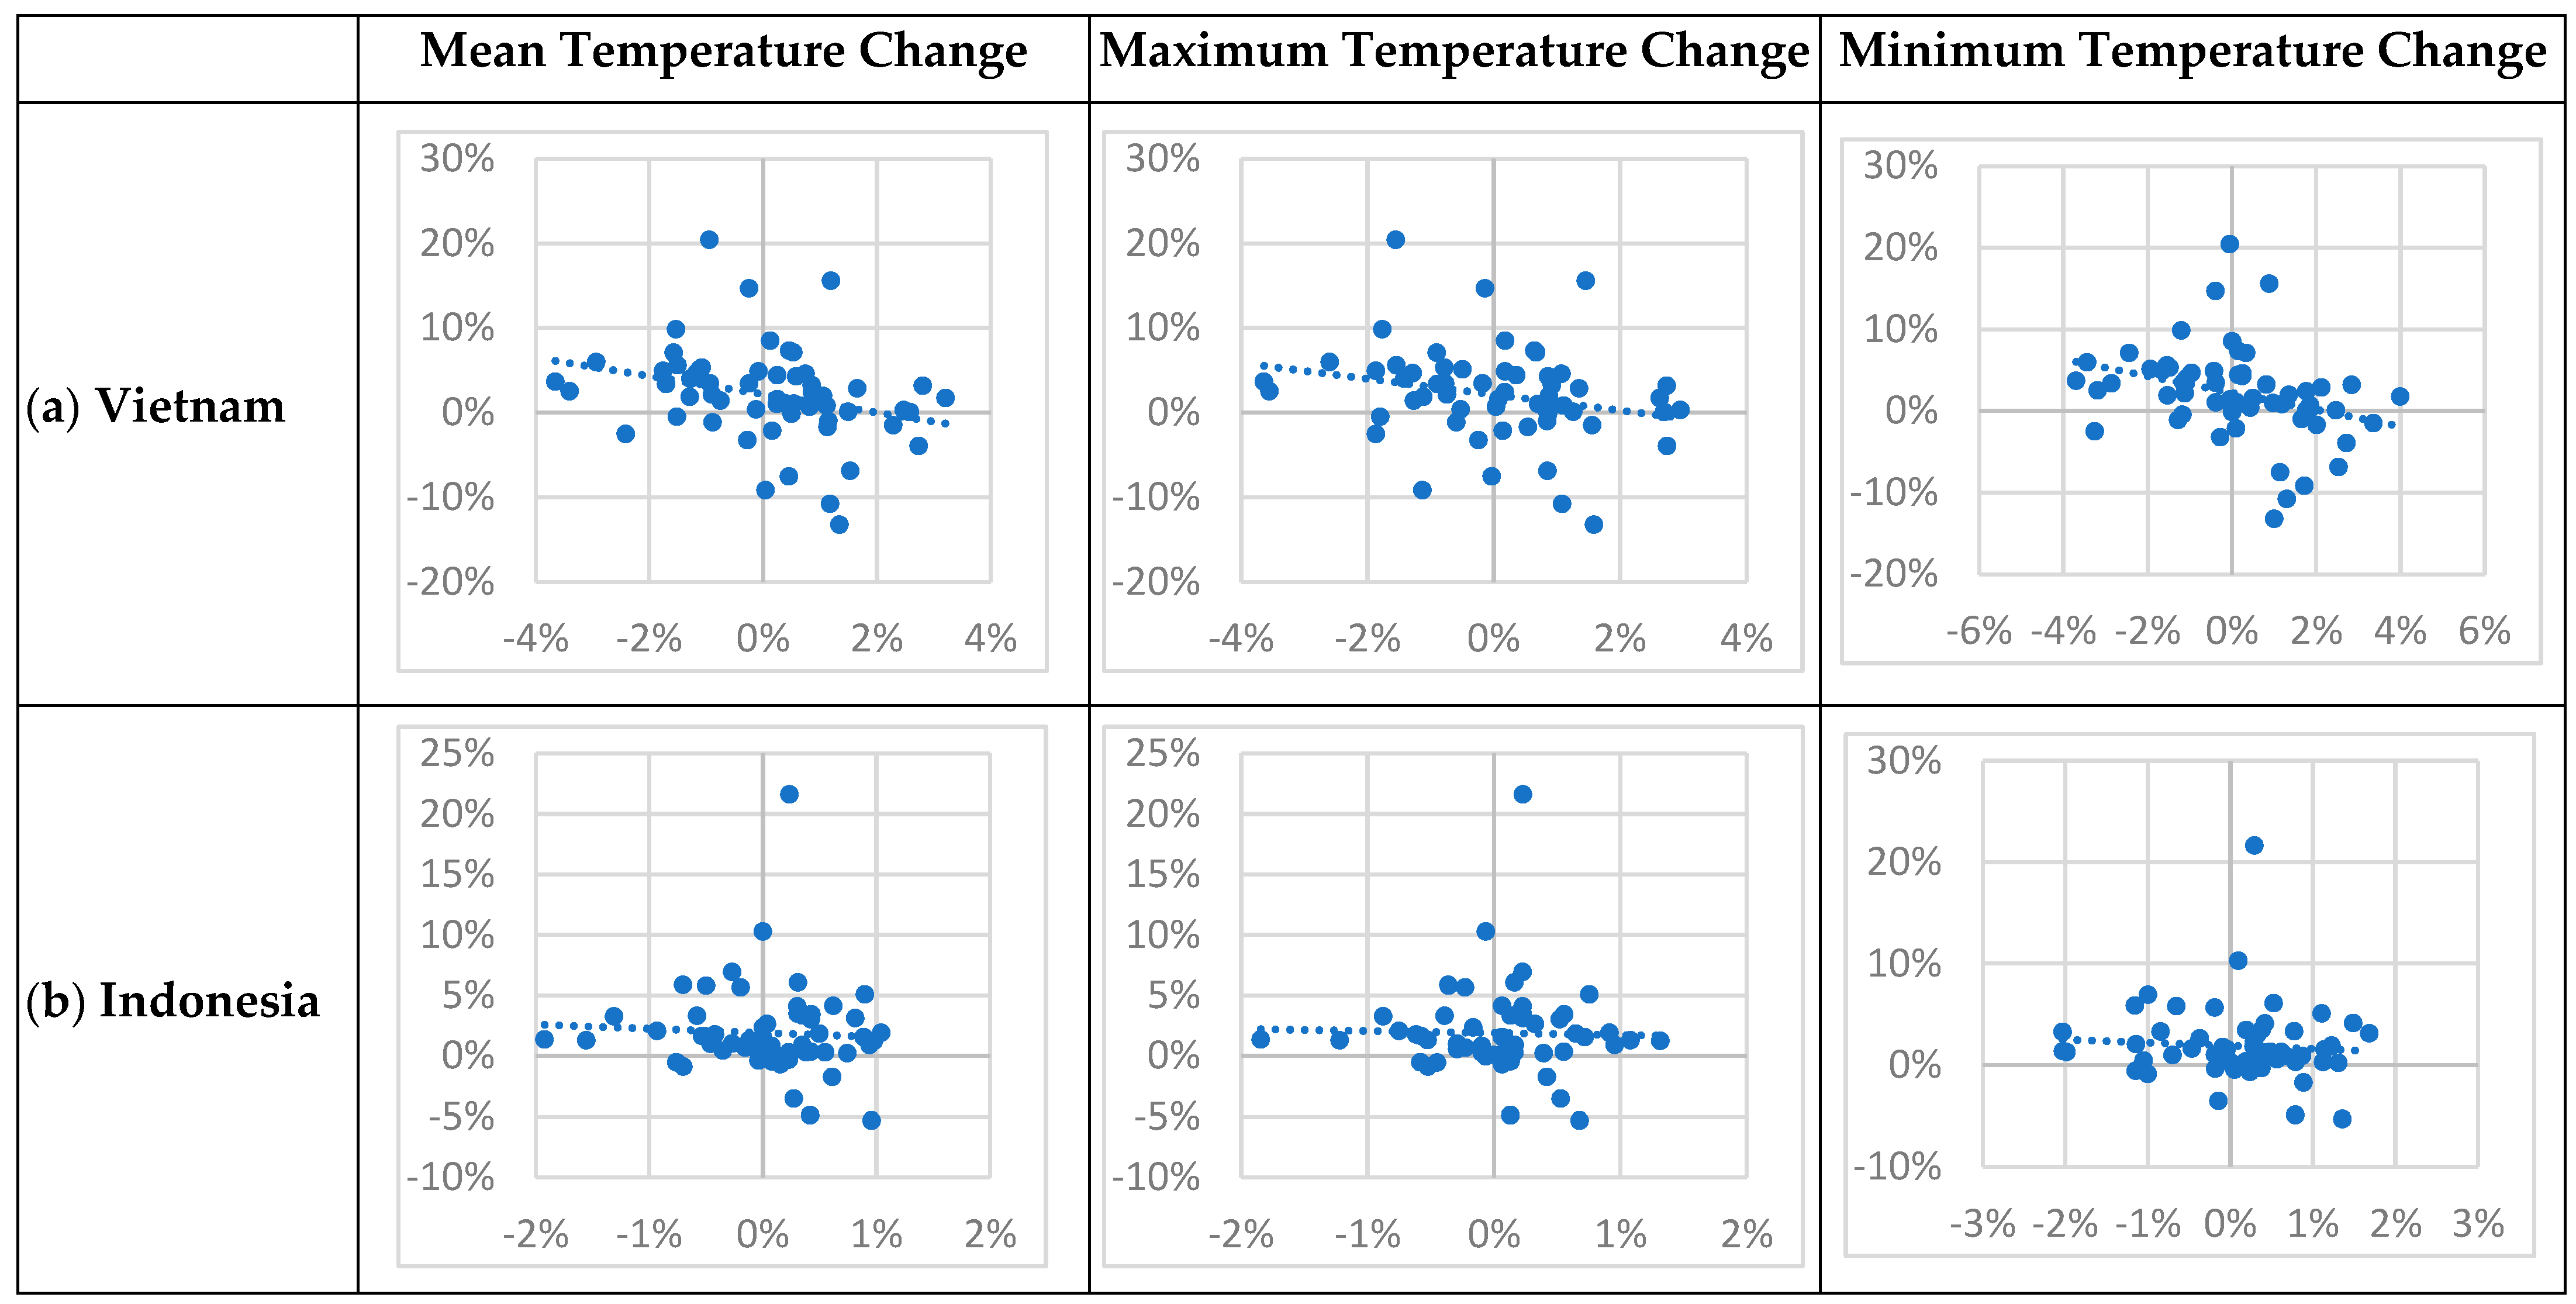
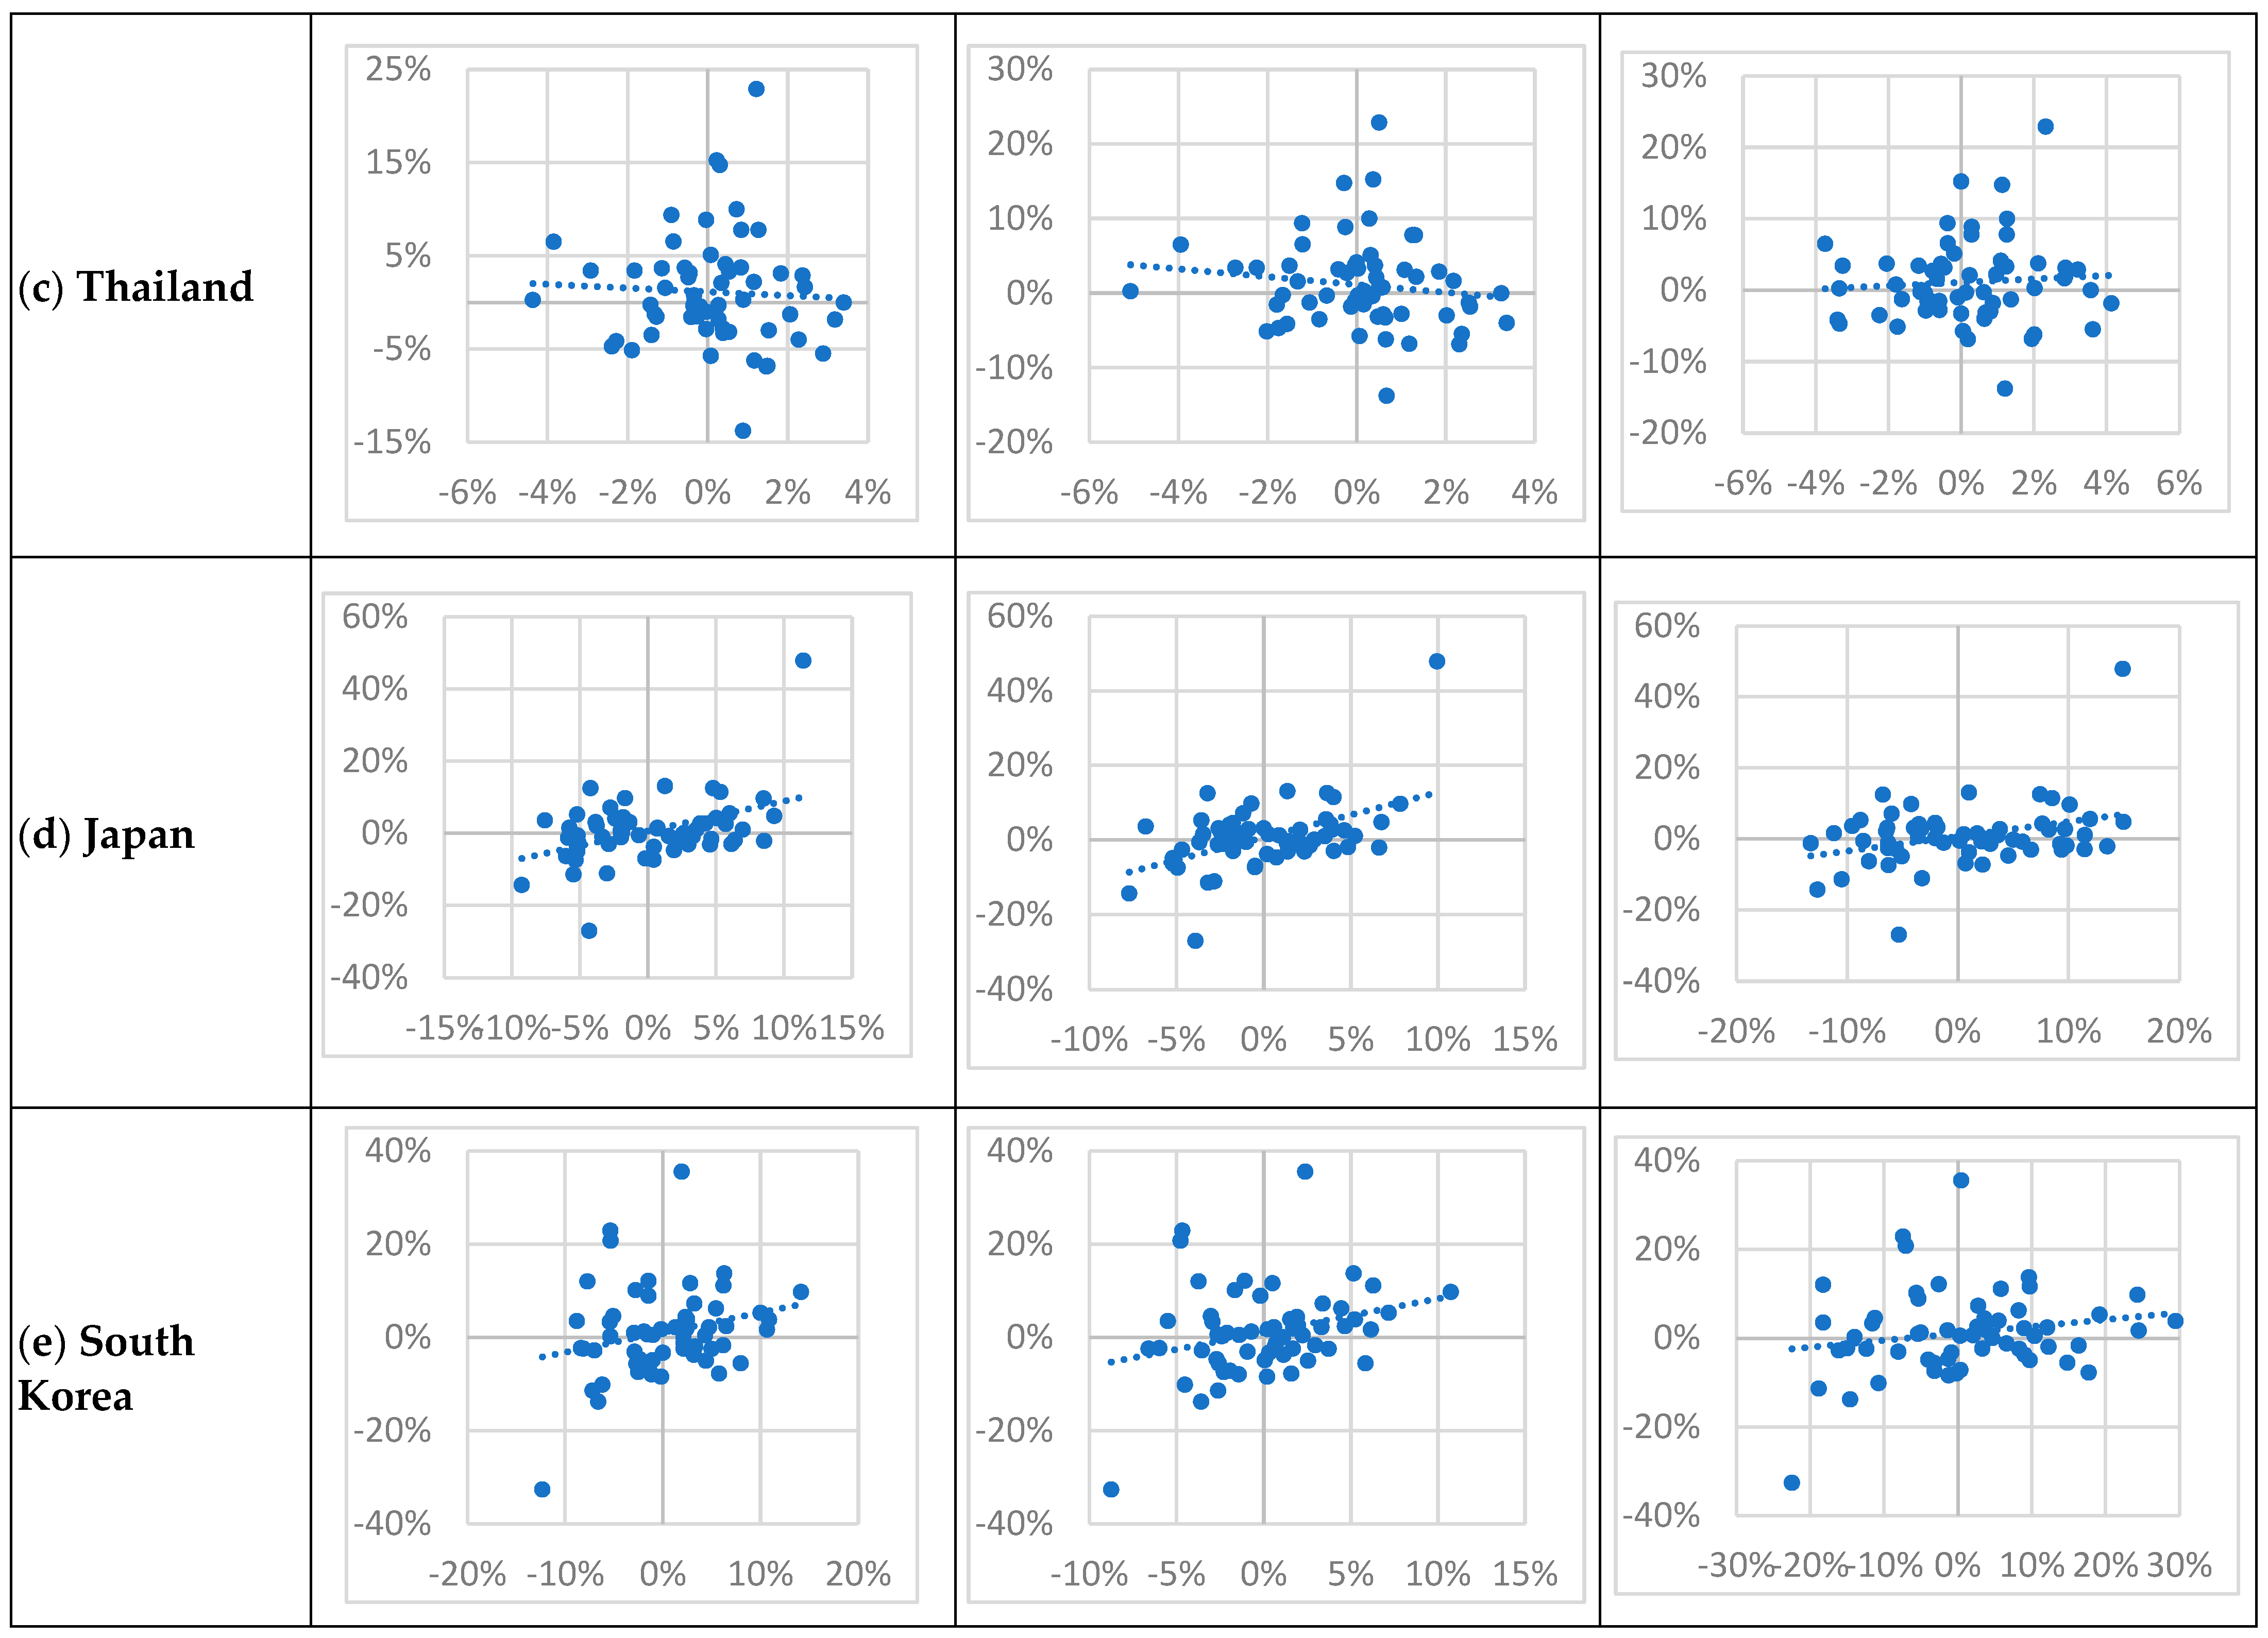
Figure 10 illustrates the relationship between changes in temperature related indicators (annual mean, annual maximum, and annual minimum temperature) and changes in annual rice yield. We also provide trend lines in Figure 10 to help illustrating the results. We can see there is a weak negative linear relationship between changes in annual air temperature and changes in annual rice yield in low latitude countries, especially Vietnam. However, there is a moderate positive relationship between the temperature related indicator and changes in annual rice yield in high latitude countries (Japan and South Korea). It is noteworthy that the linear relationship between annual rice yield change and annual temperature change is stronger in high latitude countries than in low latitude countries. The degree to which these variables correlated with each other varies between different countries.
One should note that the negative relationship shown in Figure 10a–c does not necessarily mean that the increase in temperature has negative impacts on rice production. However, when the change in annual air temperature exceeds a certain level, it may harm the rice production. Take Vietnam as an example. The trend lines in Figure 10a indicates that when the increase in annual mean temperature in Vietnam is smaller than 2%, the corresponding change in rice yield is still positive. However, when the increase in annual mean temperature exceeds 2%, the corresponding change in rice yield (along the trend line) may fall into the negative area. The figures illustrating the relationship between the maximum temperature change, minimum temperature change, and the rice production in Vietnam have similar findings.
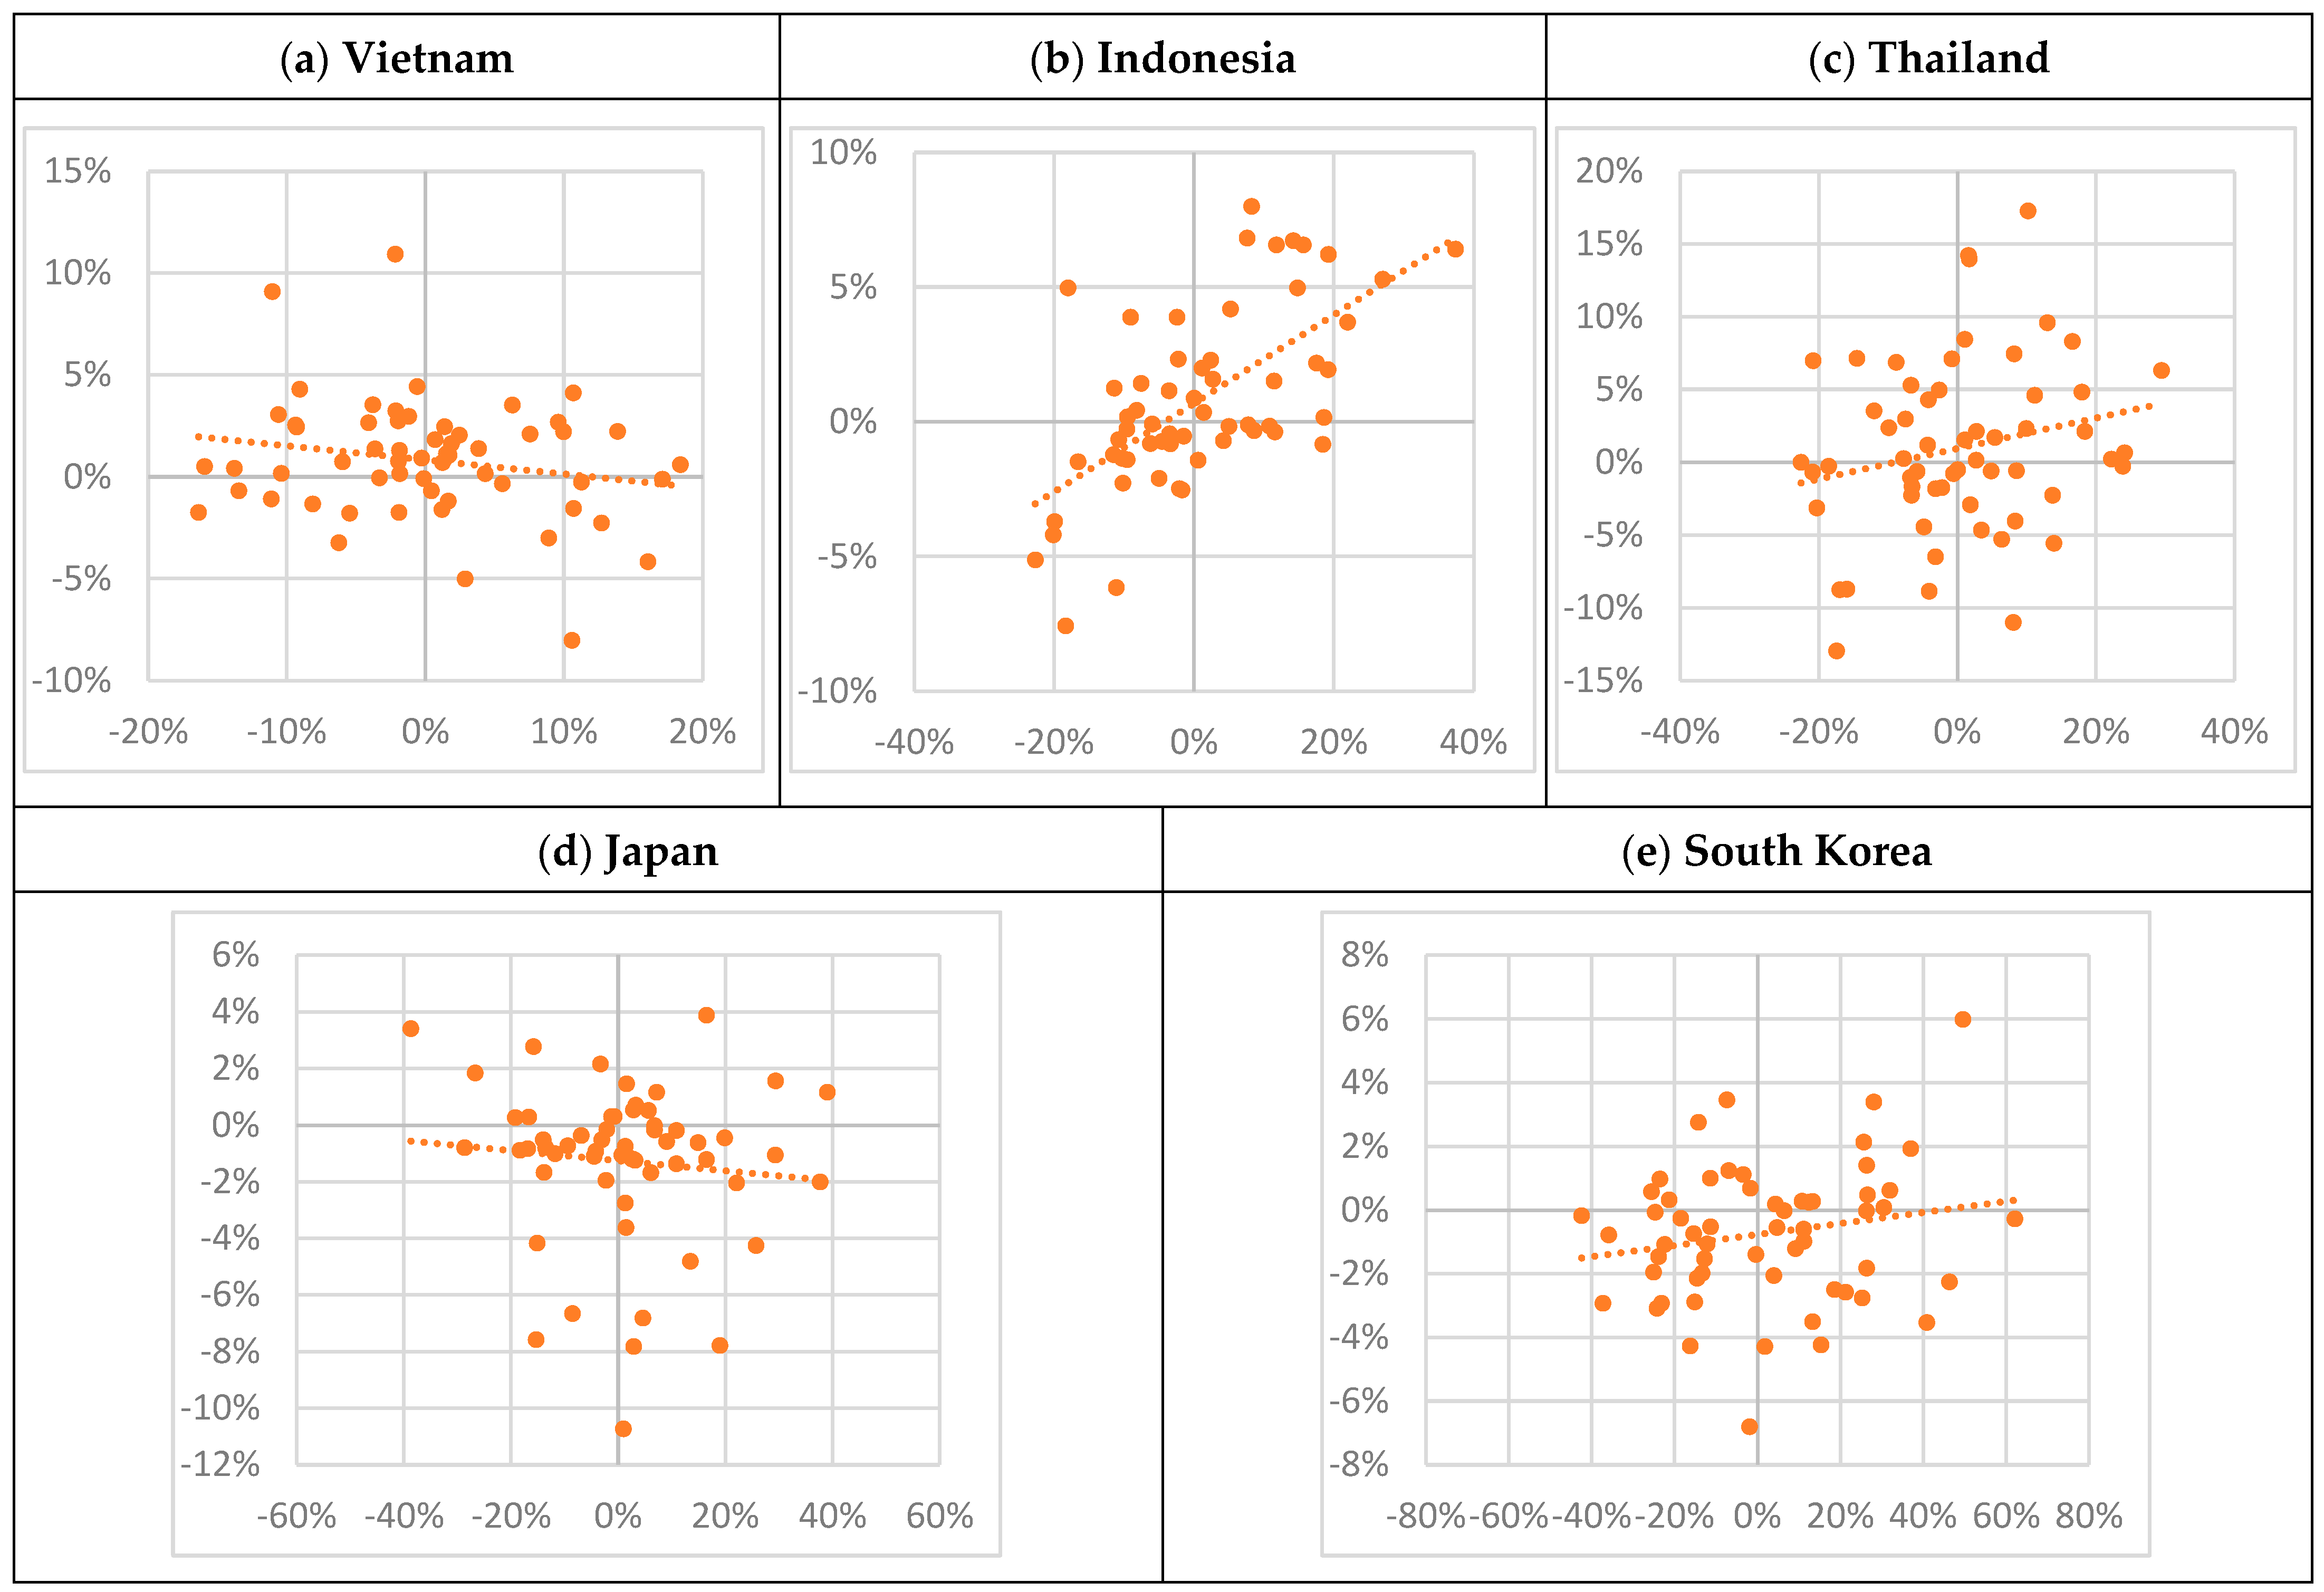
In addition to air temperature, water supply is another important factor that determines rice crop growing. In varying degrees different rice ecosystems are affected by precipitation. Figure 11 compares the relationship between changes in annual precipitation and changes in rice yield in the 1961–2020 period. In Vietnam, Indonesia, and South Korea, there is no clear positive or negative relationship between these two variables. If closely looking into Figure 11a,b, we can see that the trend line is nearly parallel to the X-axis horizontal line. By contrast, Figure 11c,d show different stories in Japan and Thailand. In Japan, these two variables are negatively correlated, whereas in Thailand, annual precipitation change and rice yield change are positively correlated. It is worth noting that, in Japan, when the annual precipitation increases, the annual rice yield decreases based on the results in Table 11. Figure 11d further points out that the larger extent in precipitation increases in Japan, the greater decrease in rice yield exists.
We would also like know the relationship between area harvested and climate indicators. However, as changes in temperature related indicators (annual mean, annual minimum, and annual maximum air temperature) and changes in area harvested of rice do not show a clear positive or negative relationship in the scatter plots, the relationship of temperature change and area harvested change will not be discussed here. Figure 12 compares the relationship between changes in annual precipitation and changes in annual area harvested of rice in the 1961–2020 period. In the scatter plots of Thailand, Japan and South Korea, the data dots are widely spread, so that we cannot see a clear linear relationship between the changes in annual precipitation and changes in annual area harvested of rice. In Indonesia, on the contrary, there is a positive relationship between annual precipitation change and area harvested change of rice, meaning that the larger increase in annual precipitation, the greater increase in area harvested of rice.
In summary, regarding the increase in annual air temperature, it has a negative relationship with changes in annual rice yield in low latitude countries, particularly Vietnam, and in contrast a positive relationship in high latitude countries in East and Southeast Asia. This result indicates the variability of air temperature in high latitude countries, such as Japan and South Korea, has a positive impact on rice yield in these countries. This can echo the findings we mentioned in Section 3.1, which the favourable geographic conditions for crop production may shift due to climate variability. Growing seasons in cold regions might extend because of increasing temperatures. Despite the benefits warming temperature brings, however, it is projected that the rising surface temperature will lead to land degradation, frequent wildfire, lower crop yield in low latitude regions, decline in water availability, and low food stability.
Figure 13 demonstrates anomalies of annual mean temperature in the selected five countries during the 1961–2020 period. The mean temperature anomalies refer to the difference between mean temperature for each calendar year and the average mean annual temperature from 1961 to 2020. According to Figure 13, the increasing trend of annual mean temperature in these countries becomes clear from the 1990s, when the annual mean temperature is above the long-term average. Besides, according to our calculation on the 10-year average of annual mean temperature based on the 1961–2020 data, in low latitude countries (Vietnam, Indonesia, and Thailand), the variations between each decade range from 0.1% to 1.2%, whereas in high latitude countries (Japan and South Korea), the variations between each decade are much higher, ranging from 0.4% to 5.5% (Table 13). If the increasing trend of annual mean temperature continues, even in the first place crop yields in temperate regions can gain advantages from warming temperatures, in the long run crops production in these regions will be faced with the risks from increasing frequency of extreme events or the variability in ecosystems such as thawing of permafrost [89].
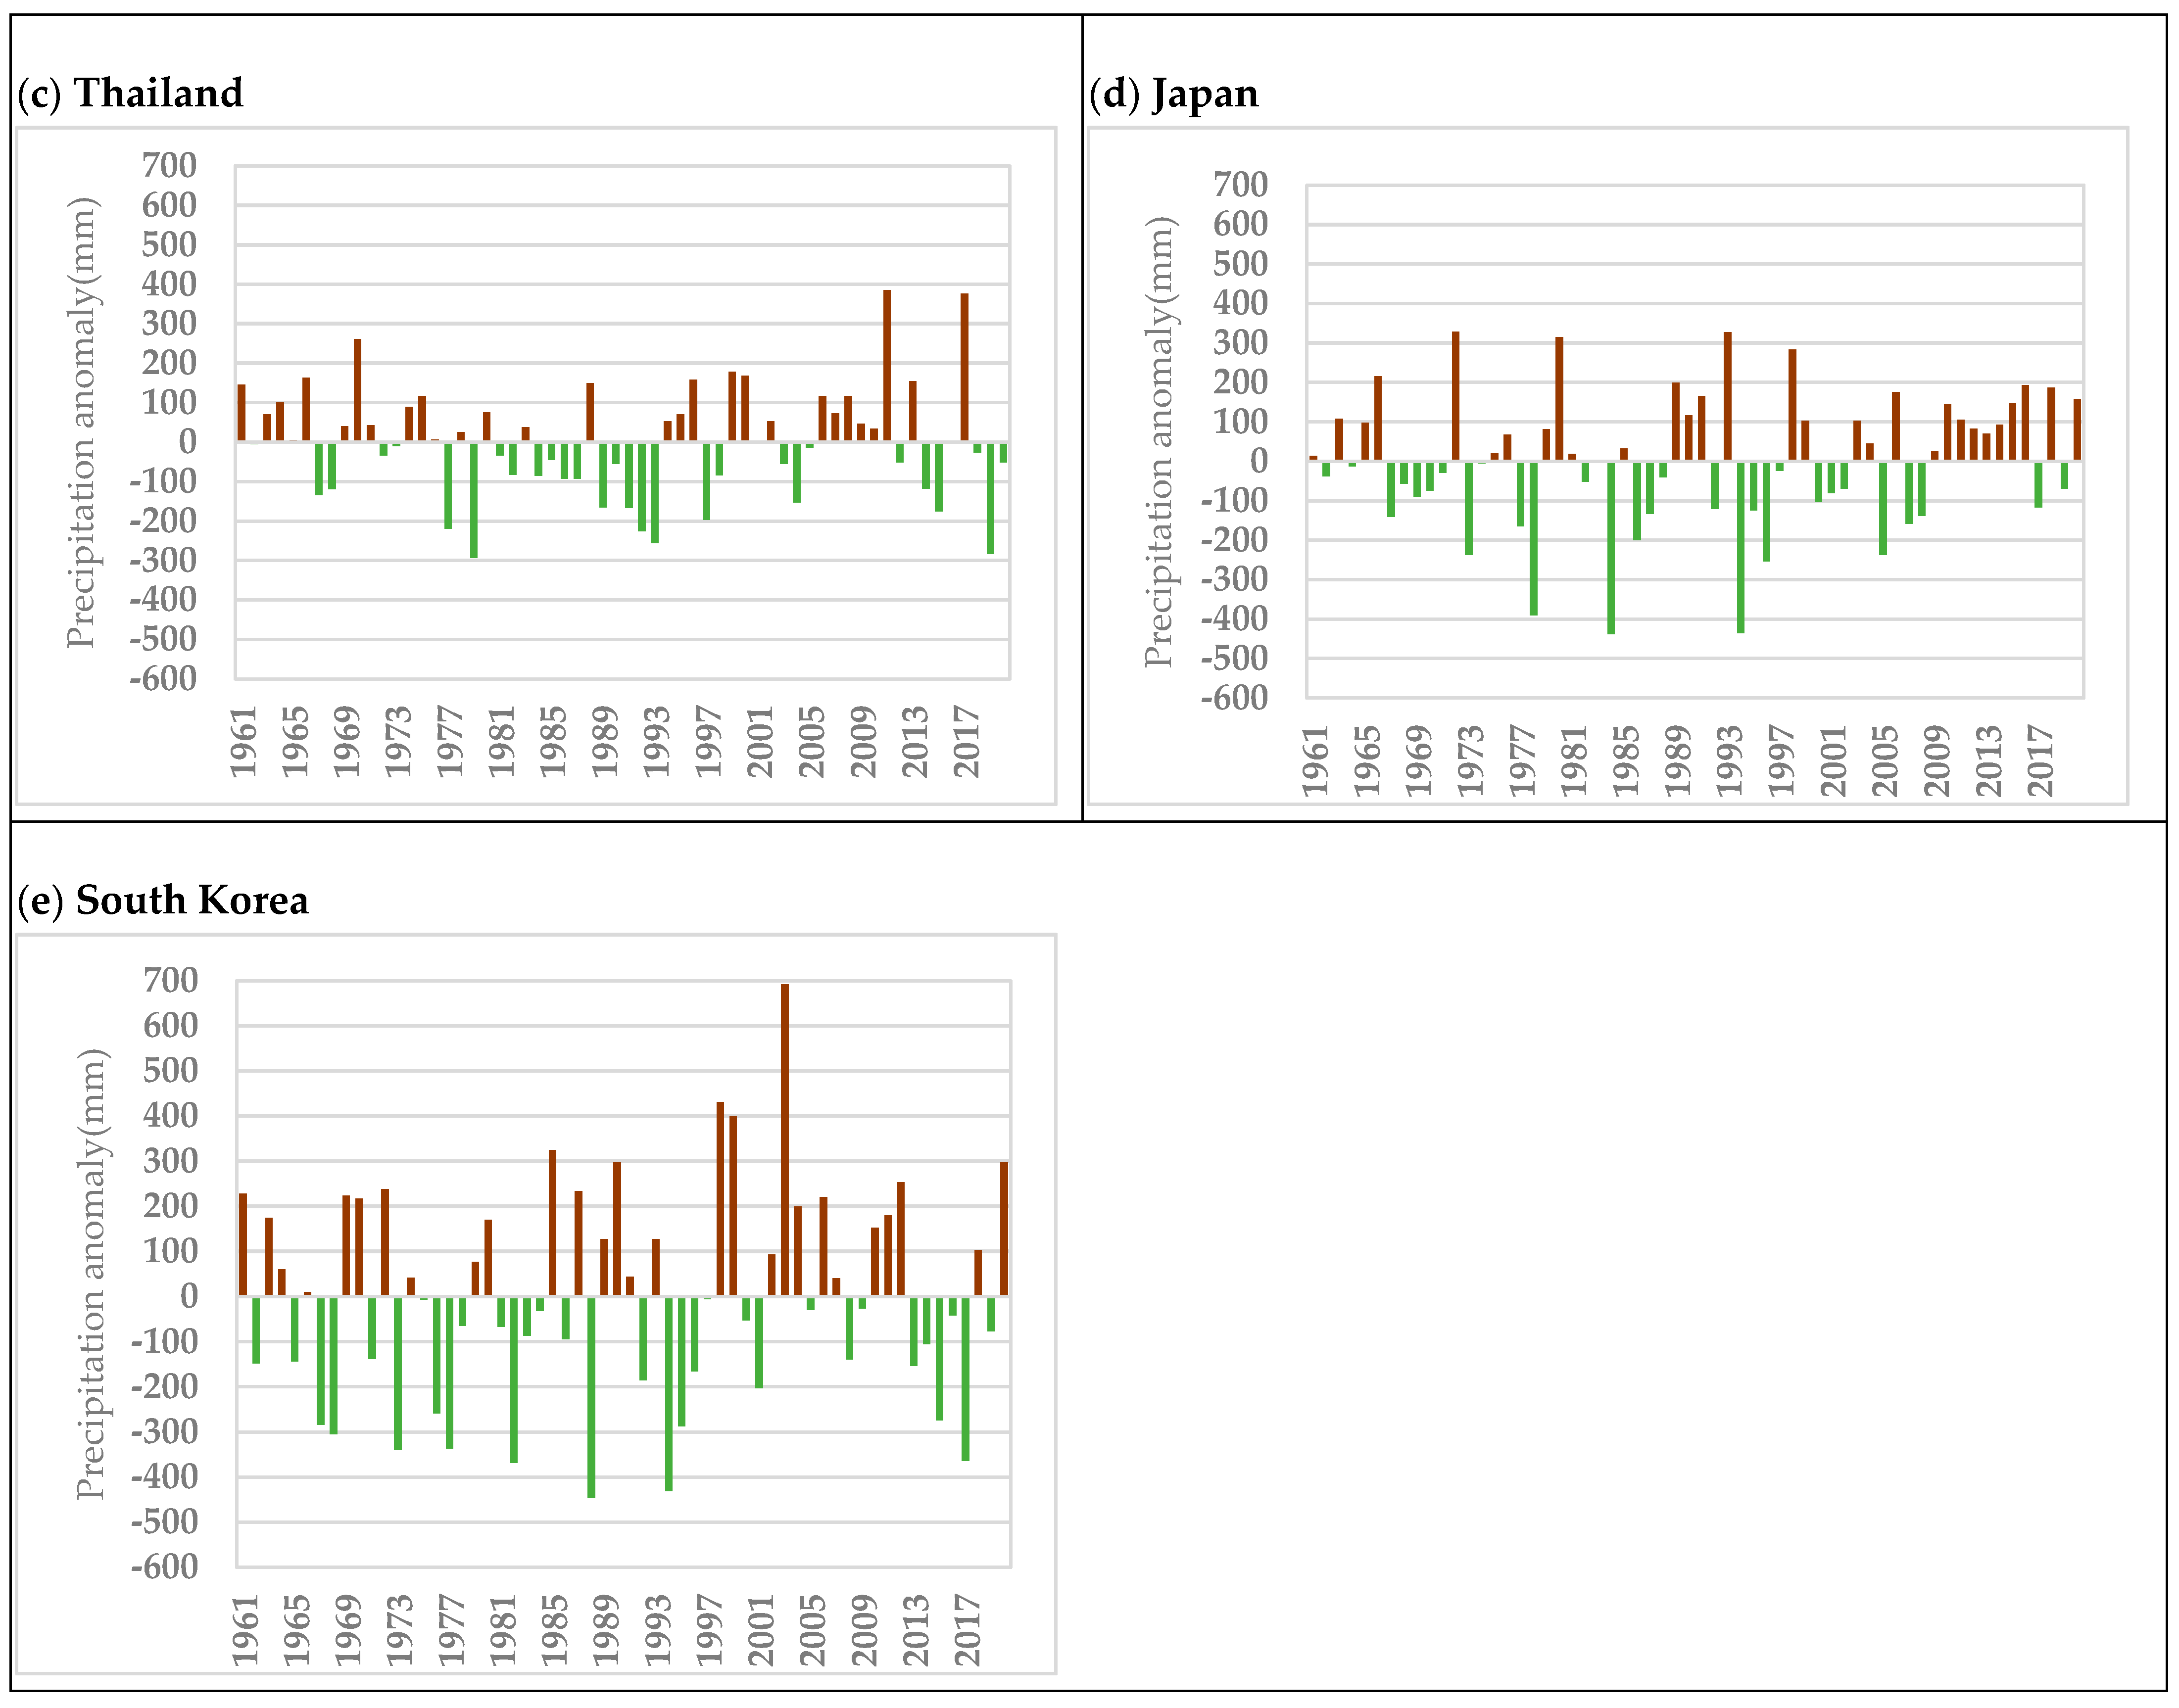
Figure 14 demonstrates average annual precipitation anomalies in the selected countries. No clear increasing or decreasing trend of annual precipitation can be seen from these data. In Vietnam, these values of anomalies are more evenly distributed, where the highest positive value is +190.6 mm and the lowest negative value is −167.7 mm. On the other hand, the distributions of the anomalies in Indonesia, Thailand, Japan, and South Korea give a hint about greater variations in annual precipitation. For example, in Indonesia, there is one positive anomaly value over 500 mm (+541.7 mm) while other positive values are all below +400 mm. There are two negative anomaly values below −500 mm and one below −400 mm, whereas other negative values are less than −400 mm. In South Korea, the extreme positive value is more than +600 mm while other positive values are less than +500 mm. When closely looking into the 10-year average of annual precipitation and variations data in Table 14, a better understanding of these data can be obtained. For example, in South Korea, the variation between 1991–2000 and 2001–2010 is 8.3%, and the variation becomes negative (−8.0%) in the 2001–2010 and 2011–2020 interval. In Vietnam, on the contrary, the variations between each decade are all below 2%, which is relatively low. According to Table 14, the variations between each decade are higher in high latitude countries (Japan and South Korea), ranging from −8.0% to 8.3%, than in low latitude countries (Vietnam, Indonesia, and Thailand), ranging from −4.6% to 4.8%.
Combining the results from our analysis of the relationship between climate indicators and rice production as well as the long-term trend in annual temperature and precipitation in five selected countries, we can see some implications regarding climate change and food security—in terms of rice production.
In Table 11 we can see that annual rice yield and annual precipitation are negatively correlated in Japan while Figure 11 also reveals that its annual precipitation change is negatively correlated with annual yield change of rice. This indicates that in Japan, when the annual precipitation increases, the annual rice yield decreases, and that the larger extent in precipitation increases, the greater decrease in rice yield exists. Japan is usually hit by typhoons during the rice growing season. Though the heavy rainfall brought by typhoons can provide sufficient water for rice production, it can also be destructive to rice paddies. The intensity of typhoon storms is projected to increase by 2–11% on average globally by 2100 because of climate change [90]. While the Japanese rice growing season, especially the most critical yet vulnerable heading stage, is related to the typhoon season, the damage on rice production due to typhoons will increase [91]. Apart from the decrease in yields, the quality of rice might decline due to effects of the saltwater intrusion, low photosynthetic capacity, and so on [92].
As we can also learn from Table 11 and Figure 11, the annual rice yield and annual precipitation are positively correlated in Thailand and Indonesia, and the annual precipitation change is positively correlated with annual yield change of rice in Thailand. In addition, Table 12 and Figure 12 also shows a similar trend in both Indonesia and Thailand, that the annual precipitation has a positive relationship with annual area harvested of rice, and the change of precipitation is positively correlated with area harvested change of rice as well. This indicates that the lack of sufficient rainfall or water supply will harm rice production, and the negative impacts will increase as the satiation of reduced rainfall becomes more severe. Rainfed lowland rice production systems, especially in Northeast Thailand, account for over 80% of rice production in Thailand. One of the characteristics of the rainfed rice production system is low yield, which can be attributed to unstable water supply from rainfall and lack of irrigation water, rendering it vulnerable to extreme weather events such as drought or flood [40]. Some studies [93,94] have pointed out that rice growth is affected by rainfall spatio-temporal distribution and magnitude, on which climate change can have great impacts. For example, the change of rainfall patterns can lead to shift in planting date and fertilizer application date, which may reduce rice yield in rainfed production system. On the other hand, in Indonesia, 84% of rice production area relies on irrigation and the remaining area are rainfed. However, rice production is adversely affected by low rainfall during growing season because of El Niño. Both rainfed and irrigated rice relies on the water supplement from rainfall during wet season, while rainfed rice is more vulnerable to the insufficient and unstable water supply from the precipitation. Therefore, the deficiency in precipitation results in the reduction in rice harvesting area, especially the rainfed rice planting area. As a result, the yield is high due to the decline in lower-yield growing area and most of the rice crop harvested coming from higher-yield irrigated rice growing area [95,96].
4. Conclusions
This review attempts to draw a picture of current food security situation in the East and Southeast Asian region, based on the food security framework composed of four pillars—food availability, access to food, the stability of food supplies, and food utilization. In the food availability dimension, food production and food trade issues are discussed. Rice is the major cereal crop produced and exported in this region. As for animal-based commodities, poultry production is increasing in recent decades as consumption in this region is growing. In the access to food dimension, the share of food expenditure in GDP varies across countries and is closely related to the degree of national economic development. Besides, there has also been a significant surge in food prices in some Asian countries since 2016. In the dimension of stability of food supplies, we can see some Southeast Asian countries, such as Vietnam and Thailand, experienced larger variations due to several internal and external factors such as extreme climate events. We can see a roughly positive relationship between the percentage of arable land equipped for irrigation and the average rice yield, due to stable water supplies from irrigation. In the dimension of food utilization, we found that most developed countries have almost 100% of basic drinking water and sanitation services, while many developing countries are lacking in these services. Besides, there is a roughly negative relationship between the percentage of population using at least basic drinking water and the prevalence of undernourishment, indicating that the construction of basic infrastructures, including water infrastructure, is negatively correlated with hunger.
In addition, since agricultural industry in this region is vulnerable to climate change, we have investigated the potential impacts on food production systems, agricultural livelihoods, nutrition, and policy making, which can be linked to the four pillars in the food security framework. Low agricultural productivity caused by changing climate negatively affects food production, which means food availability and access to food will be undermined. Consequently, consumers must pay more for food, which further limiting their access to food. Food price is an outcome of balance between supply and demand. Thus, food price surge reflects low productivity and resource scarcity from the supply side, and growing population from the demand side. Increasing food prices usually exacerbate poverty in rural farming communities as most of their incomes rely on agricultural activities and their incomes are reduced due to low productivity. Extreme climate events in recent years are found to affect food quality and safety, and eventually give rise to poor nutritional status. For instance, lower protein, micronutrient, and vitamin B content are found in major rice cultivars in Southeast Asia because of high CO2 concentration.
As food production is central to securing food availability, it is imperative to understand the possible connection between climate factors and food production. We would like to investigate the relationship between food production and several climate indicators, including air temperature related variables and annual precipitation. We take rice—one of the most important crops in this region—as an example. Based on the historical climate data, the temperature increasing trend of annual mean temperature in the selected countries become clear from the 1990s, which the annual mean temperature is above the long-term average. Besides, in Japan and South Korea particularly, the annual mean temperature variations between each decade are much higher than other Southeast Asian countries. This may give us some hints on the varying degrees to which rice production are affected by climate change in different countries. The results from our analysis show that in low latitude countries, annual mean temperature is positively correlated with annual rice yield. However, when the increase in annual mean temperature exceeds a certain level, it may harm the rice production. While in high latitude countries, annual mean temperature has positive correlation with annual rice yield, and the positive impact is greater as the change in annual mean temperature increases. As some research suggest, the favourable geographic conditions for crop production may shift due to climate variability, especially clear in the high latitude regions. On the other hand, as for precipitation, both annual rice yield and area harvested are positively correlated with annual precipitation in low latitude countries, including Indonesia and Thailand. The precipitation change has a moderate positive relationship with rice yield change in Thailand, where rainfed rice production systems dominate the country. This also indicates that the lack of sufficient rainfall or water supply will harm rice production, and the negative impacts will increase as the satiation of reduced rainfall becomes more severe. This low yield rainfed rice production system is particularly vulnerable to extreme weather events such as drought and flood, explaining the results. In Indonesia, because of the El Niño occurrence, low rainfall during growing season leads to a reduction in rice harvesting area, especially in rainfed rice systems. Therefore, the larger decrease in annual precipitation, the greater loss in area harvested will be. As for Japan, the annual precipitation is negatively correlated with the annual rice yield, and additionally, the larger extent in annual precipitation increases, the greater decrease in annual rice yield exists. While the Japanese rice growing season is related to the typhoon season, the climatic damage on rice production will increase as the intensity of typhoon storms is projected to increase because of climate change.
As we have mentioned earlier, food security is still a critical issue for some East and Southeast Asian countries. When facing with short-term economic or climate shocks, governments usually adopt production subsidies or export restrictions to secure domestic food supply. However, these policy measures can only solve short-term problems. The governments need to keep investing in agricultural infrastructure and Research and Development, together with governance changing towards food system transformation, so that the agricultural sector can strengthen its capacity to respond to short-term shocks as well as to adapt to long-term climate change.
Author Contributions
Conceptualization, H.-I.L., Y.-Y.Y., F.-I.W. and P.-T.L.; methodology, Y.-Y.Y. and F.-I.W.; software, Y.-Y.Y. and F.-I.W.; validation, H.-I.L., Y.-Y.Y., F.-I.W. and P.-T.L.; formal analysis, Y.-Y.Y. and F.-I.W.; investigation, H.-I.L., Y.-Y.Y., F.-I.W. and P.-T.L.; writing—original draft preparation, Y.-Y.Y. and F.-I.W.; writing—review and editing, H.-I.L., Y.-Y.Y., F.-I.W. and P.-T.L.; visualization, Y.-Y.Y. and F.-I.W.; supervision, H.-I.L.; project administration, H.-I.L. All authors have read and agreed to the published version of the manuscript.
Funding
This research received no external funding.
Data Availability Statement
Data analysed in this study were a re-analysis of existing data, which are openly available at locations cited in the reference section. Further documentation about data processing may be made available on request from the corresponding author.
Conflicts of Interest
The authors declare no conflict of interest.
References
- FAO. Rome Declaration on World Food Security and World Food Summit Plan of Action: World Food Summit; Food and Agriculture Organization (FAO), United Nations: Rome, Italy, 1996. [Google Scholar]
- Population Reference Bureau. Population mid-2020. 2020. Available online: https://www.prb.org/international/indicator/population/snapshot (accessed on 23 December 2020).
- Zhou, Z.Y.; Wan, G. Food Insecurity in Asia: Why Institutions Matter; Asian Development Bank Institute: Tokyo, Japan, 2017. [Google Scholar]
- FAO. FAOSTAT Database. License: CC BY-NC-SA 3.0 IGO. Available online: http://www.fao.org/faostat/en/#data (accessed on 13 January 2021).
- McCarron, B.; Tan, S.; Giunti, A. Charting Asia’s Protein Journey; Asia Research and Engagement: Singapore, 2018; Available online: https://www.admcf.org/wp-content/uploads/2019/11/20180904_Charting-Asias-Protein-Journey_Report.pdf (accessed on 15 January 2021).
- Mordor Intelligence. Asia-Pacific Plant Protein Market—Growth, Trends, COVID-19 Impact, and Forecasts (2021–2026). 2021. Available online: https://www.mordorintelligence.com/industry-reports/asia-pacific-plant-protein-market (accessed on 21 January 2021).
- FAO. FAO Yearbook. Fishery and Aquaculture Statistics 2018; FAO: Rome, Italy, 2020. [Google Scholar] [CrossRef]
- Matthews, A. Regional Integration and Food Security in Developing Countries; FAO: Rome, Italy, 2003; Volume 45, Available online: http://www.fao.org/3/y4793e/y4793e00.htm (accessed on 15 January 2021).
- OECD. Evolving Agricultural Policies and Markets: Implications for Multilateral Trade Reform; OECD Publishing: Paris, France, 2016. [Google Scholar] [CrossRef]
- OECD; FAO. OECD-FAO Agricultural Outlook 2017–2026; OECD Publishing: Paris, France, 2017. [Google Scholar] [CrossRef]
- Bandumula, N. Rice production in Asia: Key to global food security. Proc. Natl. Acad. Sci. India Sect. B Biol. Sci. 2018, 88, 1323–1328. [Google Scholar] [CrossRef]
- Ricepedia. Food Security; International Rice Research Institute (IRRI): Los Baños, Philippines, 2020; Available online: http://ricepedia.org/challenges/food-security (accessed on 28 December 2020).
- Shahbandeh, M. Leading Exporting Countries of Fish and Fishery Products Worldwide in 2019 (In Billion U.S. Dollars). Statista, 2020. Available online: https://www.statista.com/statistics/268269/top-10-exporting-countries-of-fish-and-fishery-products/ (accessed on 20 December 2020).
- Knoema. Trade Statistics—Crops, Livestock Products & Live Animal. 2020. Available online: https://knoema.com/FAOTSJUL2016/trade-statistics-crops-livestock-products-live-animal# (accessed on 20 January 2021).
- Lee, T.; Hansen, J. Southeast Asia’s Growing Meat Demand and Its Implications for Feedstuffs Imports. Amber Waves: The Economics of Food, Farming, Natural Resources, and Rural America; United States Department of Agriculture (USDA), Economic Research Service: Washington, DC, USA, April 2019. [CrossRef]
- FAO. FAO Statistical Pocketbook 2012: World Food and Agriculture; FAO: Rome, Italy, 2012; Available online: http://www.fao.org/3/i2493e/i2493e.pdf (accessed on 20 January 2021).
- Dawe, D. Geographic Determinants of Rice Self-Sufficiency in Southeast Asia; (ESA Working Paper No.13-03); Agricultural Development Economics Division (ESA), FAO: Rome, Italy, 2013. [Google Scholar] [CrossRef]
- Tobias, A.; Molina, I.; Valera, H.G.; Mottaleb, K.A.; Mohanty, S. Handbook on Rice Policy for Asia; International Rice Research Institute (IRRI): Los Baños, Philippines, 2012. [Google Scholar] [CrossRef]
- Market Links. 4.3.3. Overview of Food Access and the Value Chain Approach. 2020. Available online: https://www.marketlinks.org/good-practice-center/value-chain-wiki/overview-food-access-and-value-chain-approach (accessed on 28 December 2020).
- Curtis, M. The Global Food Crisis and Fairtrade: Small Farmers, Big Solutions? Fairtrade Foundation: London, UK, 2009; Available online: https://curtisresearch.org/wp-content/uploads/FoodCrisisReport.pdf.pdf (accessed on 21 January 2021).
- INDDEX Project. Data4Diets: Building Blocks for Diet-related Food Security Analysis; Tufts University: Boston, MA, USA, 2018; Available online: https://inddex.nutrition.tufts.edu/data4diets (accessed on 25 January 2021).
- FAO. FAO Food Price Index; Food and Agriculture Organization (FAO), United Nations: Rome, Italy, 2021; Available online: http://www.fao.org/worldfoodsituation/foodpricesindex/en/#:~:text=The%20FAO%20Food%20Price%20Index,the%20groups%20over%202014%2D2016 (accessed on 21 January 2021).
- FAO. Food Outlook—Biannual Report on Global Food Markets: June 2020. Food Outlook, 1; FAO: Rome, Italy, 2020. [Google Scholar] [CrossRef]
- FAO. Inflation in Consumer Price Index for Food; Food and Agriculture Organization (FAO), United Nations: Rome, Italy, 2021; Available online: http://www.fao.org/economic/ess/ess-economic/cpi#.YAUp4OgzaUk (accessed on 18 January 2021).
- Kim, K.; Kim, S.; Park, C.Y. Food Security in Asia and the Pacific Amid the COVID-19 Pandemic; Asian Development Bank (ADB): Mandaluyong, Philippines, 2020. [Google Scholar] [CrossRef]
- Barnett, S.A.; Bersch, J.; Ojima, Y. Inflation Dynamics in Mongolia: Understanding the Roller Coaster; (IMF Working Paper No. 12/192); IMF: Washington, DC, USA, 2012. [Google Scholar] [CrossRef]
- Win, H.H.H. Main Drivers of Inflation in Myanmar. In Price-Setting Behavior and Inflation Dynamics in SEACEN Member Economies and Their Implications for Inflation; South East Asian Central Banks (SEACEN) Research and Training Centre: Kuala Lumpur, Malaysia, 2019; pp. 159–165. Available online: https://www.seacen.org/publications/RStudies/2019/RP104/6-Myanmar-INFLATION.pdf (accessed on 3 March 2021).
- Redfern, S.K.; Azzu, N.; Binamira, J.S. Rice in Southeast Asia: Facing risks and vulnerabilities to respond to climate change. Build Resil. Adapt. Clim. Chang. Agri Sect. 2012, 23, 1–14. [Google Scholar]
- Timmer, P. Food security and economic growth: An Asian perspective. Asian-Pac. Econ. Lit. 2005, 19, 1–17. [Google Scholar] [CrossRef]
- Timmer, C.P. Food security in Asia and the Pacific: The rapidly changing role of rice. Asia Pac. Policy Stud. 2014, 1, 73–90. [Google Scholar] [CrossRef] [Green Version]
- Clarete, R.L.; Adriano, L.; Esteban, A. Rice trade and price volatility: Implications on ASEAN and global food security. In Asian Development Bank Economics Working Paper Series No. 368; Asian Development Bank (ADB): Mandaluyong, Philippines, 2013. [Google Scholar]
- National Statistics, R.O.C. (Taiwan). Table: Consumer Price Indices by Basic Group—Annual; National Statistics, R.O.C. (Taiwan): Taipei, Taiwan, 2021. Available online: https://reurl.cc/Nr7yd9 (accessed on 15 January 2021).
- The World Bank. Data Bank International Comparison Program (ICP) 2017; The World Bank Group: Washington, DC, USA, 2020; Available online: https://databank.worldbank.org/source/icp-2017 (accessed on 23 December 2020).
- Weingärtner, L. The concept of food and nutrition security. Achiev. Food Nutr. Secur. 2009, 3, 21–52. [Google Scholar]
- Maruyama, E.; Unnevehr, L.J.; Wang, J. Understanding the Context for Agriculture for Nutrition Research: Identifying Country Typologies of Child-Stunting Determinants; International Food Policy Research Institute (IFPRI): Washington, DC, USA, 2014; Volume 1362. [Google Scholar]
- Ricepedia. Asia—Changing Consumption Patterns; International Rice Research Institute (IRRI): Los Baños, Philippines, 2021; Available online: http://ricepedia.org/rice-around-the-world/asia (accessed on 20 January 2021).
- Oxford Business Group. Agriculture remains crucial to Thailand’s economic growth. In The Report: Thailand 2017; Oxford Business Group: London, UK, 2017; Available online: https://oxfordbusinessgroup.com/overview/driving-force-agriculture-remains-integral-economic-growth (accessed on 21 January 2021).
- Uuld, A.; Magda, R. Import Demand Analysis for Wheat in Mongolia; Economics & Working Capital: London, UK, 2019; Available online: http://eworkcapital.com/import-demand-analysis-for-wheat-in-mongolia/ (accessed on 21 January 2021).
- Ricepedia. Where is Rice Grown?—Rice-Growing Environments; International Rice Research Institute (IRRI): Los Baños, Philippines, 2021; Available online: http://ricepedia.org/rice-as-a-crop/where-is-rice-grown (accessed on 20 January 2021).
- Suwanmontri, P.; Kamoshita, A.; Fukai, S. Recent changes in rice production in rainfed lowland and irrigated ecosystems in Thailand. Plant Prod. Sci. 2020, 24, 15–28. [Google Scholar] [CrossRef]
- UN Water. Sustainable Development Goal 6 Synthesis Report on Water and Sanitation; United Nations: New York, NY, USA, 2018; Available online: https://www.unwater.org/publications/highlights-sdg-6-synthesis-report-2018-on-water-and-sanitation-2/ (accessed on 22 December 2020).
- Sheehy, T.; Carey, E.; Sharma, S.; Biadgilign, S. Trends in energy and nutrient supply in Ethiopia: A perspective from FAO food balance sheets. Nutr. J. 2019, 18, 46. [Google Scholar] [CrossRef] [Green Version]
- FAO; IFAD; WFP. The State of Food Insecurity in the World 2013. The Multiple Dimensions of Food Security; FAO: Rome, Italy, 2013. [Google Scholar]
- von Grebmer, K.; Bernstein, J.; Alders, R.; Dar, O.; Kock, R.; Rampa, F.; Wiemers, M.; Acheampong, K.; Hanano, A.; Higgins, B.; et al. 2020 Global Hunger Index: One Decade to Zero Hunger: Linking Health and Sustainable Food Systems; Welthungerhilfe: Bonn, Germany; Concern Worldwide: Dublin, Ireland, 2020. [Google Scholar]
- OECD. Building Food Security and Managing Risk in Southeast Asia; OECD Publishing: Paris, France, 2017. [Google Scholar] [CrossRef]
- WHO. The Double Burden of Malnutrition: Policy Brief; (No. WHO/NMH/NHD/17.3); World Health Organization (WHO): Geneva, Switzerland, 2016; Available online: https://apps.who.int/iris/bitstream/handle/10665/255413/WHO-NMH-NHD-17.3-eng.pdf?ua=1 (accessed on 13 January 2021).
- Mbow, C.; Rosenzweig, C.; Barioni, L.G.; Benton, T.G.; Herrero, M.; Krishnapillai, M.; Xu, Y. Food Security. In Climate Change and Land: An IPCC Special Report on Climate Change, Desertification, Land Degradation, Sustainable Land Management, Food Security, and Greenhouse Gas Fluxes in Terrestrial Ecosystems; Shukla, P.R., Skea, J., Buendia, E.C., Masson-Delmotte, V., Pörtner, H.-O., Roberts, D.C., Zhai, P., Slade, R., Connors, S., van Diemen, R., Eds.; IPCC: Geneva, Switzerland, 2019; pp. 437–550. [Google Scholar]
- Gitz, V.; Meybeck, A.; Lipper, L.; Young, C.D.; Braatz, S. Climate Change and Food Security: Risks and Responses; FAO: Rome, Italy, 2016. [Google Scholar]
- Hidosa, D.; Guyo, M. Climate change effects on livestock feed resources: A review. J. Fish. Livest. Prod. 2017, 5, 259. [Google Scholar]
- Nelson, G.; Bogard, J.; Lividini, K.; Arsenault, J.; Riley, M.; Sulser, T.B.; Mason-D’Croz, D.; Power, B.; Gustafson, D.; Herrero, M.; et al. Income growth and climate change effects on global nutrition security to mid-century. Nat. Sustain. 2018, 1, 773–781. [Google Scholar] [CrossRef]
- OECD. Enhancing Climate Change Mitigation through Agriculture; OECD Publishing: Paris, France, 2019. [Google Scholar] [CrossRef]
- Eckstein, D.; Künzel, V.; Schäfer, L. Global Climate Risk Index 2021: Who Suffers Most from Extreme Weather Events? Weather-Related Loss Events in 2019 and 2000–2019; Germanwatch: Bonn, Germany, 2021; Available online: https://germanwatch.org/sites/germanwatch.org/files/Global%20Climate%20Risk%20Index%202021_1.pdf (accessed on 22 December 2020).
- Mekong River Commission. Mekong River Monitoring. 2021. Available online: https://www.mrcmekong.org/ (accessed on 28 January 2021).
- Lenton, T.M.; Rockström, J.; Gaffney, O.; Rahmstorf, S.; Richardson, K.; Steffen, W.; Schellnhuber, H.J. Climate tipping points—Too risky to bet against. Nature 2019, 575, 592–595. Available online: https://www.nature.com/articles/d41586-019-03595-0 (accessed on 31 January 2021). [CrossRef]
- Chinvanno, S. Climate change in the Mekong River Delta and key concerns on future climate threats. In Environmental Change and Agricultural Sustainability in the Mekong Delta; Springer: Dordrecht, The Netherlands, 2011; pp. 207–217. [Google Scholar]
- Uleberg, E.; Hanssen-Bauer, I.; van Oort, B.; Dalmannsdottir, S. Impact of climate change on agriculture in Northern Norway and potential strategies for adaptation. Clim. Chang. 2014, 122, 27–39. [Google Scholar] [CrossRef]
- Park, J.K.; Das, A.; Park, J.H. Integrated model for predicting rice yield with climate change. Int. Agrophys. 2018, 32, 203–215. [Google Scholar] [CrossRef]
- Riahi, K.; Rao, S.; Krey, V.; Cho, C.; Chirkov, V.; Fischer, G.; Nakicenovic, N.; Rafaj, P. RCP 8.5—A scenario of comparatively high greenhouse gas emissions. Clim. Chang. 2011, 109, 33–57. [Google Scholar] [CrossRef] [Green Version]
- Deryng, D.; Elliott, J.; Folberth, C.; Müller, C.; Pugh, T.A.; Boote, K.J.; Conway, D.; Ruane, A.C.; Gerten, D.; Jones, J.W. Regional disparities in the beneficial effects of rising CO2 concentrations on crop water productivity. Nat. Clim. Chang. 2016, 6, 786–790. [Google Scholar] [CrossRef] [Green Version]
- Krishnamurthy, P.K.; Lewis, K.; Choularton, R.J. A methodological framework for rapidly assessing the impacts of climate risk on national-level food security through a vulnerability index. Glob. Environ. Chang. 2014, 25, 121–132. [Google Scholar] [CrossRef]
- de Lima, C.Z.; Buzan, J.R.; Moore, F.C.; Baldos, U.L.C.; Huber, M.; Hertel, T.W. Heat stress on agricultural workers exacerbates crop impacts of climate change. Environ. Res. Lett. 2021, 16, 044020. [Google Scholar] [CrossRef]
- Internal Displacement Monitoring Centre. 2020 Internal Displacement. 2020. Available online: https://www.internal-displacement.org/database/displacement-data (accessed on 25 October 2021).
- Dennis, D. Southeast Asia’s Coming Climate Crisis; Center for Strategic & International Studies: Washington, DC, USA, 2020; Available online: https://www.csis.org/blogs/new-perspectives-asia/southeast-asias-coming-climate-crisis (accessed on 25 October 2021).
- Global Environment Facility. Joint Ocean Management Transforms Coasts in South East Asia; The Global Environment Facility: Washington, DC, USA, 2017; Available online: https://www.thegef.org/news/joint-ocean-management-transforms-coasts-south-east-asia (accessed on 25 October 2021).
- Hackbarth, A. Climate Change Threatens Agriculture Jobs and May Lead to Political Instability; American Security Project: Washington, DC, USA, 2019; Available online: https://www.americansecurityproject.org/climate-change-threatens-agriculture-jobs-may-lead-to-political-instability/ (accessed on 26 October 2021).
- US National Intelligence Council. Southeast Asia: The Impact of Climate Change to 2030: Geopolitical Implications, CR 2010-0-2; US National Intelligence Council: Washington, DC, USA, 2010.
- Nelson, G.C.; Rosegrant, M.W.; Palazzo, A.; Gray, I.; Ingersoll, C.; Robertson, R.; Tokgoz, S.; Zhu, T.; Sulser, T.B.; Ringler, C.; et al. Food Security, Farming, and Climate Change to 2050: Scenarios, Results, Policy Options; International Food Policy Research Institute (IFPRI): Washington, DC, USA, 2010; Volume 172. [Google Scholar] [CrossRef]
- Vermeulen, S.J. Climate Change, Food Security and Small-Scale Producers: Analysis of Findings of the Fifth Assessment Report (AR5) of the Intergovernmental Panel on Climate Change (IPCC); IPCC: Geneva, Switzerland, 2014. [Google Scholar]
- Micha, R.; Mannar, V.; Afshin, A.; Allemandi, L.; Baker, P.; Battersby, J.; Bhutta, Z.; Chen, K.; Corvalan, C.; Di Cesare, M.; et al. 2020 Global Nutrition Report: Action on Equity to End Malnutrition; Middlesex University Research Repository: London, UK, 2020. [Google Scholar]
- University of Vermont. Climate Change is Hurting Children’s Diets, Global Study Finds: Rising Temperatures Contribute to Child Malnutrition and Reduced Diet Quality. ScienceDaily, 2021. Available online: www.sciencedaily.com/releases/2021/01/210114085436.htm (accessed on 10 August 2021).
- IPCC. Global Warming of 1.5 °C. An IPCC Special Report on the Impacts of Global Warming of 1.5 °C above Pre-Industrial Levels and Related Global Greenhouse Gas Emission Pathways, in the Context of Strengthening the Global Response to the Threat of Climate Change, Sustainable Development, and Efforts to Eradicate Poverty; Masson-Delmotte, V., Zhai, P., Pörtner, H.-O., Roberts, D., Skea, J., Shukla, P.R., Pirani, A., Moufouma-Okia, W., Péan, C., Pidcock, R., Eds.; IPCC: Geneva, Switzerland, 2018. [Google Scholar]
- Medek, D.E.; Schwartz, J.; Myers, S.S. Estimated effects of future atmospheric CO2 concentrations on protein intake and the risk of protein deficiency by country and region. Environ. Health Perspect. 2017, 125, 087002. [Google Scholar] [CrossRef]
- Myers, S.S.; Zanobetti, A.; Kloog, I.; Huybers, P.; Leakey, A.D.; Bloom, A.J.; Carlisle, E.; Dietterich, L.H.; Fitzgerald, G.; Hasegawa, T.; et al. Increasing CO2 threatens human nutrition. Nature 2014, 510, 139–142. [Google Scholar] [CrossRef]
- Smith, M.R.; Golden, C.D.; Myers, S.S. Potential rise in iron deficiency due to future anthropogenic carbon dioxide emissions. GeoHealth 2017, 1, 248–257. [Google Scholar] [CrossRef]
- IFPRI. Rising CO2, Climate Change Projected to Reduce Availability of Nutrients Worldwide: Protein, Iron, Zinc to be 19.5%, 14.4%, and 14.6% Lower, Respectively, than without Climate Change. ScienceDaily, 2019. Available online: www.sciencedaily.com/releases/2019/07/190718085308.htm (accessed on 10 August 2021).
- Soares, J.C.; Santos, C.S.; Carvalho, S.M.; Pintado, M.M.; Vasconcelos, M.W. Preserving the nutritional quality of crop plants under a changing climate: Importance and strategies. Plant Soil 2019, 443, 1–26. [Google Scholar] [CrossRef] [Green Version]
- UNFCCC. Farming and Forests Action Critical to Climate and Sustainability. United Nations Climate Change. 2017. Available online: https://unfccc.int/news/farming-and-forests-action-critical-to-climate-and-sustainability (accessed on 10 August 2021).
- Richards, M.B.; Gregersen, L.; Kuntze, V.; Madsen, S.; Oldvig, M.B.; Campbell, B.M.; Vasileiou, I. Agriculture’s prominence in the INDCs. CCAFS Info Note 2015. [Google Scholar] [CrossRef]
- Dekeyser, K.; Bizotto Molina, P.; D’Alessandro, C.; Tietjen, B. Transforming food systems to combat climate change (Blog post). Eur. Cent. Dev. Policy Manag. 2019. Available online: https://ecdpm.org/talking-points/transforming-food-systems-to-combat-climate-change/ (accessed on 20 January 2021).
- Steiner, A.; Aguilar, G.; Bomba, K.; Bonilla, J.P.; Campbell, A.; Echeverria, R.; Gandhi, R.; Hedegaard, C.; Holdorf, D.; Ishii, N.; et al. Actions to Transform Food Systems under Climate Change; (No. 138-2021-1490); CGIAR Research Program on Climate Change, Agriculture and Food Security (CCAFS): Wageningen, The Netherlands, 2020. [Google Scholar]
- World Bank Group. Making Climate Finance Work in Agriculture; World Bank: Washington, DC, USA, 2016; Available online: https://openknowledge.worldbank.org/handle/10986/25366 (accessed on 3 November 2021).
- Hasegawa, T.; Fujimori, S.; Havlík, P.; Valin, H.; Bodirsky, B.L.; Doelman, J.C.; Fellmann, T.; Kyle, P.; Koopman, J.F.; Lotze-Campen, H.; et al. Risk of increased food insecurity under stringent global climate change mitigation policy. Nat. Clim. Chang. 2018, 8, 699–703. [Google Scholar] [CrossRef] [Green Version]
- IPCC. Climate Change 2014: Synthesis Report. In Contribution of Working Groups I, II and III to the Fifth Assessment Report of the Intergovernmental Panel on Climate Change; Core Writing Team, Pachauri, R.K., Meyer, L.A., Eds.; Intergovernmental Panel on Climate Change (IPCC): Geneva, Switzerland, 2014; p. 151. [Google Scholar]
- World Bank Group. Climate Change Knowledge Portal. 2021. Available online: https://climateknowledgeportal.worldbank.org/ (accessed on 28 December 2021).
- Japan Meteorological Agency. General Information on Climate of Japan. 2021. Available online: https://www.data.jma.go.jp/gmd/cpd/longfcst/en/tourist.html (accessed on 28 December 2021).
- Korea Meteorological Administration. Climate of Korea. 2021. Available online: https://web.kma.go.kr/eng/biz/climate_01.jsp (accessed on 28 December 2021).
- World Bank Group. Agriculture, Forestry, and Fishing, Value Added (% of GDP). 2021. Available online: https://data.worldbank.org/indicator/NV.AGR.TOTL.ZS (accessed on 28 December 2021).
- Wikipedia. Lists of Extreme Points. 2022. Available online: https://en.wikipedia.org/wiki/Lists_of_extreme_points (accessed on 20 January 2022).
- Shukla, P.R.; Skea, J.; Slade, R.; van Diemen, R.; Haughey, E.; Malley, J.; Pathak, M.; Pereira, J.P. (Eds.) Technical Summary. In Climate Change and Land: An IPCC Special Report on Climate Change, Desertification, Land Degradation, Sustainable Land Management, Food Security, and Greenhouse Gas Fluxes in Terrestrial Ecosystems; IPCC: Geneva, Switzerland, 2019. [Google Scholar]
- Knutson, T.R.; McBride, J.L.; Chan, J.; Emanuel, K.; Holland, G.; Landsea, C.; Sugi, M. Tropical cyclones and climate change. Nat. Geosci. 2010, 3, 157–163. [Google Scholar] [CrossRef] [Green Version]
- Masutomi, Y.; Iizumi, T.; Takahashi, K.; Yokozawa, M. Estimation of the damage area due to tropical cyclones using fragility curves for paddy rice in Japan. Environ. Res. Lett. 2012, 7, 014020. [Google Scholar] [CrossRef]
- Yamamoto, H.; Iwaya, K. Influence of typhoon on the paddy rice production in Kyushu and Yamaguchi districts [Japan] in 2004 and salty wind damage of rice caused by typhoon 0418 (SONGDA). Jpn. J. Crop Sci. 2006, 75, 535–541. [Google Scholar] [CrossRef]
- Boonwichai, S.; Shrestha, S.; Pradhan, P.; Babel, M.S.; Datta, A. Adaptation strategies for rainfed rice water management under climate change in Songkhram River Basin, Thailand. J. Water Clim. Chang. 2021, 12, 2181–2198. [Google Scholar] [CrossRef]
- Boonwichai, S.; Shrestha, S.; Babel, M.S.; Weesakul, S.; Datta, A. Evaluation of climate change impacts and adaptation strategies on rainfed rice production in Songkhram River Basin, Thailand. Sci. Total Environ. 2019, 652, 189–201. [Google Scholar] [CrossRef]
- United States Department of Agriculture. INDONESIA: Rice Production Prospects Reduced by El Nino; Office of Global Analysis (OGA), International Production Assessment Division (IPAD): U.S. Department of Agriculture (USDA): Washington, DC, USA, 2016. Available online: https://ipad.fas.usda.gov/highlights/2016/03/Indonesia/Index.htm (accessed on 4 November 2021).
- Ricepedia. Indonesia; International Rice Research Institute (IRRI): Los Baños, Philippines, 2022; Available online: https://ricepedia.org/indonesia (accessed on 12 January 2022).
Figure 1.
Share of expenditure on food in total GDP for East and Southeast Asian economies in 2017 (Percent, GDP = 100%) (Source: data retrieved and adapted from [33]).
Figure 1.
Share of expenditure on food in total GDP for East and Southeast Asian economies in 2017 (Percent, GDP = 100%) (Source: data retrieved and adapted from [33]).

Figure 2.
Relationship between the meat SSR (2017–2019), rice SSR (2017–2019), and share of expenditure on food in total GDP (2017) for East and Southeast Asian economies (Source: data retrieved and adapted from [4]). Note: the area of each bubble signifies the share of expenditure on food in the total GDP of each economy. Data on self-sufficiency for North Korea are not available.

Figure 3.
Cereal import dependency ratio for East and Southeast Asian economies in 2017 (Source: data retrieved and adapted from [4]).
Figure 3.
Cereal import dependency ratio for East and Southeast Asian economies in 2017 (Source: data retrieved and adapted from [4]).

Figure 4.
Percentage point change in cereal import dependency ratio in East and Southeast Asia (Source: data retrieved and adapted from [4]).
Figure 4.
Percentage point change in cereal import dependency ratio in East and Southeast Asia (Source: data retrieved and adapted from [4]).

Figure 5.
Percentage of arable land equipped for irrigation in East and Southeast Asian economies, 2015–2017 (Source: based on data from [4]). Note: data on percentage of arable land equipped for irrigation for Singapore is not available.
Figure 5.
Percentage of arable land equipped for irrigation in East and Southeast Asian economies, 2015–2017 (Source: based on data from [4]). Note: data on percentage of arable land equipped for irrigation for Singapore is not available.

Figure 6.
Relationship between the percentage of arable land equipped for irrigation and average yield of rice (2015–2017) in East and Southeast Asian economies (Source: based on data from [4]).
Figure 6.
Relationship between the percentage of arable land equipped for irrigation and average yield of rice (2015–2017) in East and Southeast Asian economies (Source: based on data from [4]).

Figure 7.
Percentage of population using at least basic drinking water and sanitation services in East and Southeast Asian economies, 2017. (Source: data retrieved from [4]).
Figure 7.
Percentage of population using at least basic drinking water and sanitation services in East and Southeast Asian economies, 2017. (Source: data retrieved from [4]).

Figure 8.
Number of undernourished people in East and Southeast Asia (Source: data retrieved from [4]).
Figure 8.
Number of undernourished people in East and Southeast Asia (Source: data retrieved from [4]).

Figure 9.
Relationship between GDP per capita, the percentage of population using at least basic drinking water services, and prevalence of undernourishment in East and Southeast Asian economies 2017 (The area of each bubble signifies the prevalence of undernourishment in each country). (Source: data retrieved from [4]). Note: according to [4], data on the 2.5% prevalence of undernourishment denotes ‘2.5% and below’.

Figure 10.
Relationship between change in air temperatures (annual mean, annual maximum, annual minimum air temperature), and change in annual rice yield in (a) Vietnam, (b) Indonesia, (c) Thailand, (d) Japan, and (e) South Korea. These data range from 1961 to 2020. The X-axis represents the temperature change (%), and the Y-axis represents the yield change (%). (Source: data retrieved from [4,84]).


Figure 11.
Relationship between changes in annual precipitation and changes in annual rice yield in (a) Vietnam, (b) Indonesia, (c) Thailand, (d) Japan, and (e) South Korea. These data range from 1961 to 2020. The X-axis represents the precipitation change (%), and the Y-axis represents the yield change (%). (Source: data retrieved from [4,84]).

Figure 12.
Relationship between changes in annual precipitation, and changes in annual area harvested of rice in (a) Vietnam, (b) Indonesia, (c) Thailand, (d) Japan, and (e) South Korea. These data range from 1961 to 2020. The X-axis represents the precipitation change (%), and the Y-axis represents the area harvested change (%). (Source: data retrieved from [4,84]).

Figure 13.
Average annual mean temperature anomalies in (a) Vietnam, (b) Indonesia, (c) Thailand, (d) Japan, and (e) South Korea. These data range from 1961 to 2020. (Source: data retrieved from [4,84]).

Figure 14.
Average annual precipitation anomalies in (a) Vietnam, (b) Indonesia, (c) Thailand, (d) Japan, and (e) South Korea. These data range from 1961 to 2020. (Source: data retrieved from [4,84]).


Table 1.
Cereal production in East and Southeast Asia (million tonnes).
| Year | Wheat | Maize | Rice | Barley |
|---|---|---|---|---|
| 2015 | 134.12 | 308.54 | 426.81 | 2.25 |
| 2016 | 134.71 | 310.69 | 426.34 | 1.71 |
| 2017 | 135.59 | 312.3 | 430.99 | 1.51 |
| 2018 | 132.83 | 311.62 | 431.38 | 1.39 |
| 2019 | 135.20 | 315.58 | 418.56 | 1.42 |
Source: data retrieved from [4].
Table 3.
Major food commodity exports in East and Southeast Asia.
| Commodity | 2005–2015 Average | 2016 | 2017 | 2018 | 2019 | |||||
|---|---|---|---|---|---|---|---|---|---|---|
| Quantity (Million Tonnes) | Value (Million US$) | Quantity (Million Tonnes) | Value (Million US$) | Quantity (Million Tonnes) | Value (Million US$) | Quantity (Million Tonnes) | Value (Million US$) | Quantity (Million Tonnes) | Value (Million US$) | |
| Plant-based food commodities | ||||||||||
| Wheat and flour | 1.1 | 391.3 | 0.8 | 347.2 | 0.9 | 396.2 | 1.0 | 428.0 | 1.0 | 466.1 |
| Maize | 2.6 | 534.3 | 1.2 | 489.4 | 1.5 | 607.6 | 1.0 | 549.3 | 1.3 | 402.8 |
| Rice | 16.3 | 7938.8 | 16.6 | 7847.0 | 21.3 | 9872.1 | 20.6 | 10,606.9 | 18.3 | 9119.4 |
| Fruit | 12.2 | 10,455.0 | 14.5 | 18,246.4 | 17.1 | 20,229.5 | 17.0 | 21,474.1 | 15.9 | 24,206.0 |
| Vegetables | 9.1 | 9755.1 | 10.4 | 15,650.0 | 11.2 | 16,358.9 | 11.5 | 16,263.6 | 11.8 | 16,204.7 |
| Refined sugar | 3.4 | 1596.7 | 5.8 | 2666.1 | 5.1 | 2680.3 | 5.6 | 2488.2 | 5.0 | 1827.9 |
| Vegetable Oil | 8.7 | 6469.1 | 43.9 | 31,887.6 | 48.6 | 38,001.3 | 50.2 | 33,578.1 | 48.0 | 29,832.0 |
| Animal-based food commodities | ||||||||||
| Meat | 2.6 | 5914.5 | 3.5 | 8928.4 | 3.7 | 10,100.8 | 3.8 | 10,170.1 | 3.2 | 8908.6 |
| Seafood | 10.2 | 36,835.8 | 11.3 | 45,912.7 | 11.7 | 49,381.1 | 11.79 | 51,559.9 | - | - |
| Eggs | 0.6 | 393.1 | 0.2 | 361.9 | 0.3 | 360.1 | 0.3 | 425.3 | 0.3 | 429.6 |
| Dairy Products | 0.5 | 1207.3 | 0.6 | 1517.3 | 0.6 | 1789.1 | 0.7 | 2094.8 | 0.7 | 2125.1 |
Source: data retrieved from [4].
Table 4.
Major food commodity imports in East and Southeast Asia.
| Commodity | 2005–2015 Average | 2016 | 2017 | 2018 | 2019 | |||||
|---|---|---|---|---|---|---|---|---|---|---|
| Quantity (Million Tonnes) | Value (Million US$) | Quantity (Million Tonnes) | Value (Million US$) | Quantity (Million Tonnes) | Value (Million US$) | Quantity (Million Tonnes) | Value (Million US$) | Quantity (Million Tonnes) | Value (Million US$) | |
| Plant-based food commodities | ||||||||||
| Wheat and flour | 28.0 | 8737.8 | 43.0 | 10,135.2 | 42.8 | 11,652.1 | 41.1 | 11,230.9 | 41.1 | 11,107.6 |
| Maize | 38.3 | 9614.7 | 47.0 | 9414.3 | 44.1 | 9069.1 | 49.4 | 10,763.3 | 54.4 | 11,789.3 |
| Rice | 6.9 | 3734.8 | 8.4 | 4273.3 | 8.2 | 4139.0 | 10.1 | 5450.8 | 9.2 | 4695.9 |
| Fruit | 10.6 | 12,433.9 | 13.1 | 20,053.5 | 14.0 | 21,343.6 | 15.3 | 24,722.3 | 16.7 | 27,650.3 |
| Vegetables | 6.9 | 6455.6 | 8.3 | 8941.9 | 8.7 | 9304.9 | 9.2 | 9927.0 | 8.9 | 9906.0 |
| Refined sugar | 2.4 | 1188.6 | 4.7 | 2467.5 | 4.0 | 2227.8 | 4.5 | 1963.0 | 3.2 | 1276.3 |
| Vegetable Oil | 2.9 | 2663.1 | 14.4 | 12,730.1 | 15.6 | 14,734.5 | 17.0 | 14,687.8 | 20.6 | 15,067.5 |
| Animal-based food commodities | ||||||||||
| Meat | 8.5 | 22,532.4 | 14.4 | 37,993.6 | 14.5 | 40,804.6 | 15.1 | 44,341.4 | 17.0 | 51,402.9 |
| Seafood | 11.8 | 34,459.3 | 12.4 | 40,778.4 | 13.8 | 45,525.2 | 14.2 | 51,431.6 | - | - |
| Eggs | 0.3 | 492.7 | 0.3 | 445.8 | 0.3 | 480.4 | 0.3 | 549.5 | 0.4 | 546.0 |
| Dairy Products | 3.3 | 9745.4 | 5.1 | 11,553.2 | 5.5 | 14,196.5 | 5.8 | 15,332.5 | 6.2 | 16,469.2 |
Source: data retrieved from [4].
Table 5.
Self-sufficiency ratios (SSRs) for major food commodities in East and Southeast Asia, 2017–2019 (%).
Table 5.
Self-sufficiency ratios (SSRs) for major food commodities in East and Southeast Asia, 2017–2019 (%).
| Cereals | Fruits | Vegetables | Meat | Eggs | Dairy Products | ||||
|---|---|---|---|---|---|---|---|---|---|
| Rice | Maize | Wheat | |||||||
| Brunei Darussalam | 3.0 | 3.0 | 0.0 | 0.0 | 15.0 | 20.3 | 68.6 | 89.2 | 2.1 |
| Cambodia | 104.4 | 107.6 | 103.2 | 0.0 | 113.0 | 99.4 | 92.6 | 99.9 | 40.2 |
| Hong Kong SAR | 0.0 | N/A | 0.0 | 0.0 | 0.7 | 3.6 | 9.0 | 0.2 | 0.0 |
| China | 97.0 | 99.2 | 98.6 | 97.5 | 99.9 | 101.7 | 95.6 | 100.3 | 94.0 |
| North Korea | 83.8 | 93.2 | 88.1 | 13.9 | 94.4 | 99.7 | 97.6 | 100.0 | 95.9 |
| Indonesia | 87.8 | 97.5 | 97.9 | 0.0 | 98.1 | 94.6 | 94.2 | 100.0 | 79.4 |
| Japan | 33.6 | 91.8 | 0.0 | 14.0 | 57.5 | 81.7 | 52.8 | 99.7 | 95.3 |
| Laos | 103.7 | 99.3 | 124.3 | 0.0 | 113.9 | 102.3 | 83.5 | 99.7 | 23.0 |
| Malaysia | 30.6 | 68.7 | 1.7 | 0.0 | 71.5 | 56.8 | 89.0 | 117.5 | 56.6 |
| Mongolia | 71.4 | 0.0 | 0.0 | 80.6 | 3.7 | 50.8 | 98.5 | 43.9 | 98.9 |
| Myanmar | 107.3 | 111.6 | 133.6 | 21.4 | 115.4 | 100.3 | 100.0 | 100.0 | 99.0 |
| Philippines | 74.7 | 87.1 | 92.7 | 0.0 | 127.2 | 96.6 | 81.9 | 99.7 | 3.6 |
| South Korea | 26.9 | 91.4 | 0.7 | 0.7 | 75.7 | 89.7 | 65.1 | 99.1 | 92.7 |
| Singapore | 0.0 | 0.0 | 0.0 | 0.0 | 0.0 | 4.9 | 29.2 | 22.0 | 35.2 |
| Taiwan | 25.3 | 95.5 | 3.9 | 0.4 | 90.0 | 88.6 | 75.4 | 100.1 | 67.8 |
| Thailand | 122.6 | 189.4 | 101.2 | 0.0 | 128.9 | 98.1 | 162.0 | 101.7 | 95.3 |
| Vietnam | 86.0 | 122.6 | 34.0 | 0.0 | 113.3 | 100.2 | 95.8 | 100.2 | 82.4 |
| East Asia | 90.8 | 98.3 | 88.4 | 90.2 | 98.1 | 100.8 | 89.5 | 99.7 | 93.5 |
| Southeast Asia | 90.2 | 111.5 | 78.9 | 0.5 | 111.0 | 95.1 | 96.4 | 100.4 | 81.9 |
| World | 100.3 | 99.9 | 100.4 | 100.7 | 100.2 | 100.2 | 101.2 | 100.1 | 99.9 |
Table 7.
Plant-based food available for consumption in East and Southeast Asia (kcal/capita/day).
| East Asia | |||||
| 2014 | 2015 | 2016 | 2017 | 2018 | |
| Cereals * | 1403 | 1421 | 1413 | 1411 | 1421 |
| Wheat and products | 526 | 529 | 529 | 532 | 535 |
| Rice and products | 781 | 781 | 789 | 781 | 794 |
| Maize and products | 64 | 63 | 64 | 64 | 64 |
| Fruits ** | 97 | 98 | 99 | 101 | 103 |
| Vegetables | 211 | 220 | 223 | 225 | 229 |
| Southeast Asia | |||||
| 2014 | 2015 | 2016 | 2017 | 2018 | |
| Cereals * | 1534 | 1546 | 1573 | 1576 | 1574 |
| Wheat and products | 163 | 175 | 208 | 205 | 208 |
| Rice and products | 1244 | 1237 | 1219 | 1226 | 1221 |
| Maize and products | 122 | 128 | 134 | 134 | 140 |
| Fruits ** | 94 | 103 | 96 | 94 | 95 |
| Vegetables | 53 | 53 | 54 | 54 | 56 |
* Cereals excluding beer. ** Fruits excluding wine. Source: [4].
Table 8.
Animal-based food available for consumption in East and Southeast Asia (kcal/capita/day).
| East Asia | |||||
| 2014 | 2015 | 2016 | 2017 | 2018 | |
| Meat | 433 | 438 | 444 | 449 | 453 |
| Eggs | 73 | 76 | 78 | 77 | 78 |
| Milk * | 62 | 57 | 56 | 55 | 56 |
| Seafood | 60 | 62 | 62 | 63 | 63 |
| Southeast Asia | |||||
| 2014 | 2015 | 2016 | 2017 | 2018 | |
| Meat | 186 | 185 | 187 | 188 | 190 |
| Eggs | 25 | 26 | 27 | 28 | 29 |
| Milk * | 27 | 28 | 30 | 30 | 31 |
| Seafood | 68 | 70 | 72 | 75 | 75 |
* Milk excluding butter. Source: [4].
Table 9.
Hunger index in East and Southeast Asian Countries.
| Country | 2000 | 2006 | 2012 | 2020 | Change since 2000 (%) | Severity Classification |
|---|---|---|---|---|---|---|
| China | 13.6 | 9.5 | <5 | <5 | — | low |
| Thailand | 17.8 | 12.3 | 12.7 | 10.2 | −42.7 | moderate |
| Mongolia | 30.1 | 23.1 | 12.7 | 13.1 | −56.5 | moderate |
| Malaysia | 15.5 | 13.3 | 11.8 | 13.3 | −14.2 | moderate |
| Vietnam | 26.3 | 21.9 | 16.5 | 13.6 | −48.3 | moderate |
| Philippines | 25 | 20.4 | 20.4 | 19 | −24 | moderate |
| Indonesia | 26.1 | 29.5 | 23.1 | 19.1 | −26.8 | moderate |
| Cambodia | 41.2 | 27.2 | 24.9 | 20.6 | −50 | serious |
| Myanmar | 39.8 | 31.8 | 23.3 | 20.9 | −47.5 | serious |
| North Korea | 39.5 | 33.1 | 28.2 | 27.5 | −30.4 | serious |
| Laos | — | — | — | — | — | No Data |
Source: [43].
Table 10.
Geographic and climatic information of Vietnam, Indonesia, Thailand, Japan, and South Korea. (Source: data retrieved from [84,85,86,87,88]).
| Country | Climate Information | Extent of Latitude for Each Country | Share of Agriculture in GDP (%) (2020) * |
|---|---|---|---|
| Vietnam | Vietnam has tropical climate in the south and temperate climate in the north, with seasonal monsoon all over the country. Mean annual temperature is 24.66 °C, and mean annual rainfall is 1843.79 mm (1991–2020). | 23°22′ N 08°25′ N | 14.9 |
| Indonesia | Mainly tropical rainforest climate with abundant rainfalls in low-lying plains, and cooler temperatures in the inland mountainous areas. Rainfall variability depends on monsoons, with wet season ranging from November to April and dry season ranging from May to October. Mean annual temperature is 26.14 °C, and mean annual rainfall is 2857.01 mm (1991–2020). | 6°4′ N 11°0′ S | 13.7 |
| Thailand | Mostly tropical monsoon and tropical savannah climate, affected by the southwest and northeast seasonal monsoons. Mean annual temperature is 26.80 °C, and mean annual rainfall is 1549.85 mm (1991–2020). | 20°27′ N 5°37′ N | 8.6 |
| Japan | Climatic conditions in Japan range from subtropical in the south to subarctic in the north. The northwest wind brings heavy snow in winter on the Sea of Japan side, while in summer the Pacific side experiences hot and humid weather, sometimes along with typhoons. Mean annual temperature is 11.31 °C, and mean annual rainfall is 1658.05 mm (1991–2020). | 45°31′ N 20°25′ N | 1.0 |
| South Korea | South Korea is located within the temperate climate zone with four distinct seasons. It has dry and cold winters because of the continental high atmospheric pressure, whereas its summer is hot and humid. The summer monsoons bring most of the annual rainfall, sometimes along with typhoons during late summer. Mean annual temperature is 11.41 °C, and mean annual rainfall is 1394.50 mm (1991–2020). | 38°36′ N 33°6′ N | 1.8 |
* Share of agriculture in GDP for Japan is 2019 data.
Table 11.
Correlation coefficients of climate indicators (annual mean, annual maximum, annual minimum air temperature, and annual precipitation) and annual rice yield in Vietnam, Indonesia, Thailand, Japan, and South Korea. (Source: data retrieved from [4,84]).
| Country | Annual Rice Yield—Annual Mean Temperature | Annual Rice Yield—Annual Minimum Temperature | Annual Rice Yield—Annual Maximum Temperature | Annual Rice Yield—Annual Precipitation |
|---|---|---|---|---|
| Vietnam | 0.658 * | 0.739 * | 0.513 * | 0.029 * |
| Indonesia | 0.852 * | 0.859 * | 0.768 * | 0.172 * |
| Thailand | 0.548 * | 0.681 * | 0.353 * | 0.174 * |
| Japan | 0.677 * | 0.677 * | 0.658 * | −0.221 * |
| South Korea | 0.617 * | 0.507 * | 0.685 * | −0.037 * |
Note 1: * presents that correlation is statistically significant, p-value < 0.01. Note 2: annual mean, annual maximum, and annual minimum temperature refer to the annual mean of daily mean, daily maximum, and daily minimum temperature (°C); annual precipitation refers to the sum of precipitation over a year (mm); and annual rice yield refers to the rice production per hectare (hg/ha).
Table 12.
Correlation coefficients of climate indicators (annual mean, annual maximum, annual minimum air temperature, and annual precipitation) and area harvested of rice in Vietnam, Indonesia, Thailand, Japan, and South Korea. (Source: data retrieved from [4,84]).
| Country | Annual Area Harvested—Annual Mean Temperature | Annual Area Harvested—Annual Minimum Temperature | Annual Area Harvested—Annual Maximum Temperature | Annual Area Harvested—Annual Precipitation |
|---|---|---|---|---|
| Vietnam | 0.663 * | 0.746 * | 0.516 * | 0.048 * |
| Indonesia | 0.822 * | 0.842 * | 0.719 * | 0.228 * |
| Thailand | 0.519 * | 0.662 * | 0.312 * | 0.055 * |
| Japan | −0.687 * | −0.739 * | −0.612 * | −0.088 * |
| South Korea | −0.625 * | −0.660 * | −0.548 * | −0.010 * |
Note 1: * presents that correlation is statistically significant, p-value < 0.01. Note 2: annual mean, annual maximum, and annual minimum temperature refer to the annual mean of daily mean, daily maximum, and daily minimum temperature (°C); annual precipitation refer to the sum of precipitation over a year (mm); and area harvested refer to total area where the rice crop is gathered (ha).
Table 13.
The 10-year average of annual mean temperature and variations between each decade in Vietnam, Indonesia, Thailand, Japan, and South Korea from 1961 to 2020. (Source: data retrieved from [4,84]).
| Year | Vietnam | Indonesia | Thailand | Japan | South Korea | |||||
|---|---|---|---|---|---|---|---|---|---|---|
| (°C) | Variation | (°C) | Variation | (°C) | Variation | (°C) | Variation | (°C) | Variation | |
| 1961–1970 | 24.1 | - | 25.6 | - | 26.3 | - | 10.4 | - | 10.5 | - |
| 1971–1980 | 24.2 | 0.2% | 25.7 | 0.2% | 26.3 | 0.3% | 10.4 | 0.4% | 10.6 | 0.9% |
| 1981–1990 | 24.3 | 0.6% | 25.9 | 0.7% | 26.4 | 0.2% | 10.5 | 0.9% | 10.7 | 1.3% |
| 1991–2000 | 24.6 | 1.0% | 26.0 | 0.7% | 26.7 | 1.2% | 11.1 | 5.5% | 11.3 | 4.9% |
| 2001–2010 | 24.6 | 0.2% | 26.1 | 0.3% | 26.7 | 0.1% | 11.3 | 1.8% | 11.4 | 1.2% |
| 2011–2020 | 24.8 | 0.8% | 26.3 | 0.6% | 27.0 | 1.2% | 11.5 | 1.8% | 11.6 | 1.9% |
Table 14.
The 10-year average of annual precipitation and variations between each decade in Vietnam, Indonesia, Thailand, Japan, and South Korea from 1961 to 2020. (Source: data retrieved from [4,84]).
| Year | Vietnam | Indonesia | Thailand | Japan | South Korea | |||||
|---|---|---|---|---|---|---|---|---|---|---|
| (mm) | Variation | (mm) | Variation | (mm) | Variation | (mm) | Variation | (mm) | Variation | |
| 1961–1970 | 1827.0 | - | 2766.5 | - | 1598.4 | - | 1644.4 | - | 1374.7 | - |
| 1971–1980 | 1857.1 | 1.7% | 2832.1 | 2.4% | 1525.6 | −4.6% | 1640.6 | −0.2% | 1309.6 | −4.7% |
| 1981–1990 | 1832.7 | −1.3% | 2820.7 | −0.4% | 1499.1 | −1.7% | 1592.5 | −2.9% | 1360.1 | 3.9% |
| 1991–2000 | 1837.2 | 0.3% | 2776.0 | −1.6% | 1515.5 | 1.1% | 1624.0 | 2.0% | 1358.8 | −0.1% |
| 2001–2010 | 1836.4 | 0.0% | 2909.3 | 4.8% | 1567.2 | 3.4% | 1623.3 | 0.0% | 1471.5 | 8.3% |
| 2011–2020 | 1857.7 | 1.2% | 2885.7 | −0.8% | 1566.9 | 0.0% | 1726.9 | 6.4% | 1353.2 | −8.0% |
Publisher’s Note: MDPI stays neutral with regard to jurisdictional claims in published maps and institutional affiliations. |
© 2022 by the authors. Licensee MDPI, Basel, Switzerland. This article is an open access article distributed under the terms and conditions of the Creative Commons Attribution (CC BY) license (https://creativecommons.org/licenses/by/4.0/).
Share and Cite
MDPI and ACS Style
Lin, H.-I.; Yu, Y.-Y.; Wen, F.-I.; Liu, P.-T. Status of Food Security in East and Southeast Asia and Challenges of Climate Change. Climate 2022, 10, 40. https://doi.org/10.3390/cli10030040
AMA Style
Lin H-I, Yu Y-Y, Wen F-I, Liu P-T. Status of Food Security in East and Southeast Asia and Challenges of Climate Change. Climate. 2022; 10(3):40. https://doi.org/10.3390/cli10030040
Chicago/Turabian StyleLin, Hen-I, Ya-Yin Yu, Fang-I Wen, and Po-Ting Liu. 2022. "Status of Food Security in East and Southeast Asia and Challenges of Climate Change" Climate 10, no. 3: 40. https://doi.org/10.3390/cli10030040
Note that from the first issue of 2016, this journal uses article numbers instead of page numbers. See further details here.