1. Introduction
Deuterated chloroform, (D
1)chloroform, is a solvent widely used in nuclear magnetic resonance (NMR) spectroscopy, due to its broad usability and comparably low price. A disadvantage is that chloroform (deuterated or undeuterated) readily reacts with oxygen in a radical reaction, accelerated by light and yielding elemental chlorine, the highly toxic phosgene and hydrochloric acid [
1,
2,
3]. In presence of water, phosgene is subsequently hydrolysed to carbon dioxide and hydrochloric acid (Equations (1)–(4)). It can be assumed that the same reactions will happen with (D
1)chloroform. Even a low degree of (D
1)chloroform decomposition could yield considerable amounts of aggressive reactants and lead to pH shifts.
Phospholipids, unsaturated fatty acids, amino acids, or vitamins are common ingredients in food. These substances are labile against acidity or degradation by chlorine, hydrochloric acid or phosgene, a powerful organic reagent [
4,
5]. This is especially problematic if the NMR spectra are intended for non-targeted analysis of samples, where high reproducibility of the data is a prerequisite for a reliable evaluation. Even slight changes in the sample solution can lead to shifts of signals in the spectra, which could severely influence the chemometrical evaluation: typical NMR signals show full widths at half-maximum height of approximately 1.0 ± 0.5 Hz (equalling 0.0025 ± 0.0013 ppm on a 400 MHz spectrometer). To reduce the amount of data from several 10,000 data points to a few thousands, binning of the spectral data is applied before further chemometrical evaluation. With typical bin widths around 4 Hz, solvent-induced signal shifts can lead to deviating results of further data evaluation.
To quench the phosgene formation and therefore to stabilise the chloroform, a minor amount of ethanol or silver tape is usually added to chloroform. Ethanol interferes with the radical chain reaction and converts phosgene to ethyl chloroformate [
6]. In another way, chloroform is stabilised with traces of a hydrocarbon (e.g., cyclohexene, 2-penten, amylene). However, these act more as hydrochloric acid scavengers than as real stabilisers [
6,
7]. Since organic additives would lead to undesirable additional signals in NMR spectra, (D
1)chloroform for NMR usage is often stabilised with silver tape as a halogen radical scavenger.
Due to the reactions of chloroform described above, the possible degradation of (D1)chloroform and the impact on chemometrical evaluation of food samples were investigated in this work. In addition, the aim of this project was to develop a reliable and easy method to purge (D1)chloroform of phosgene and hydrogen chloride, thus preventing sample deterioration and deviant NMR spectra.
2. Materials and Methods
2.1. Chemicals
The following chemicals were commercially available: (D
1)chloroform (99.8% deuterated, density approximately 1.5 g/mL, Carl Roth, Karlsruhe, Germany), tetramethylsilane (TMS, >99.9%, Carl Roth, Karlsruhe, Germany), disodium carbonate (Na
2CO
3, anhydrous, >99.9%, Sigma Aldrich (Merck, Merck, Darmstadt, Germany), Darmstadt, Germany, oven-dried >24 h at 130 °C to 150 °C), disodium carbonate solution (aq.), 10%
m/
v (~1 mol/L), density approximately 1.1 g/mL [
8], aluminium oxide (activated, basic, Brockman I; Sigma Aldrich (Merck), Darmstadt, Germany), (D
4)methanol (>99.8% deuterated, Merck, Darmstadt, Germany).
Potassium carbonate (solution) could also be used instead of sodium carbonate, but phase separation from chloroform is hindered at concentrations >5 mol/L due to similar densities.
2.2. Preparation
The initial volume of (D1)chloroform should allow for a loss of approximately 5% to 10%, this part is not efficiently recoverable after phase separation and drying. Plugs, sleeves for glass joints and seals should be made of PTFE, because chloroform attacks many other polymers.
Approximately seven parts (v/v) of (D1)chloroform are mixed with three parts of the aqueous disodium carbonate solution and stirred or shaken vigorously for 5 to 10 min. The lower phase (the (D1)chloroform) is separated for further processing; the aqueous upper phase should be disposed of as waste containing organic halogen.
To shake out small batches of (D1)chloroform, rather more carbonate solution is needed, ensuring a clearly visible phase boundary. Conical test tubes and a Pasteur pipette facilitate the handling of small batches.
The 10% carbonate solution ensures an excess to completely strip off traces of phosgene and hydrogen chloride. If there is concern that the (D1)chloroform is potentially highly deteriorated (e.g., bubbling of carbon dioxide can be detected), the (D1)chloroform should be shaken out again with fresh carbonate solution.
Afterwards the (D1)chloroform is filled into a tightly closing brown glass bottle with a portion of oven-dried sodium carbonate. Approximately 50 g drying agent per litre (D1)chloroform have proven sufficient to bind residual water. For (D1)chloroform quantities of only a few millilitres, a slightly higher soda ratio is recommended, since a higher portion of tiny water drops cannot be separated beforehand.
The filled and closed bottle should preferably be shaken, and not stirred, for two hours to enhance the removal of water residue. If a magnet bar stirrer is used, PTFE particles might be abraded into the liquid. The (D1)chloroform should be allowed to stand overnight for further drying and to precipitate particles.
Immediately before usage, the mitigated chloroform should be membrane filtered with a PTFE syringe filter to keep any particles out of the NMR sample.
To evaluate the efficacy of this treatment of chloroform, sensitive samples were prepared in replicate with either untreated or with mitigated (D1)chloroform and then analysed with 1H-NMR.
3. Results
3.1. Example 1: Fat Extracts of Hens’ Egg Yolks
The unwanted sample degradation due to deteriorated (D
1)chloroform was first observed when testing hen’s eggs: To verify if the eggs were produced organically or not, a non-targeted method developed by Ackermann et al. [
9] was used: Egg yolk was treated to yield a fatty extract, which was then measured by
1H-NMR. The spectrum was evaluated chemometrically and compared to a database of authentic samples (from both organic and conventional agriculture).
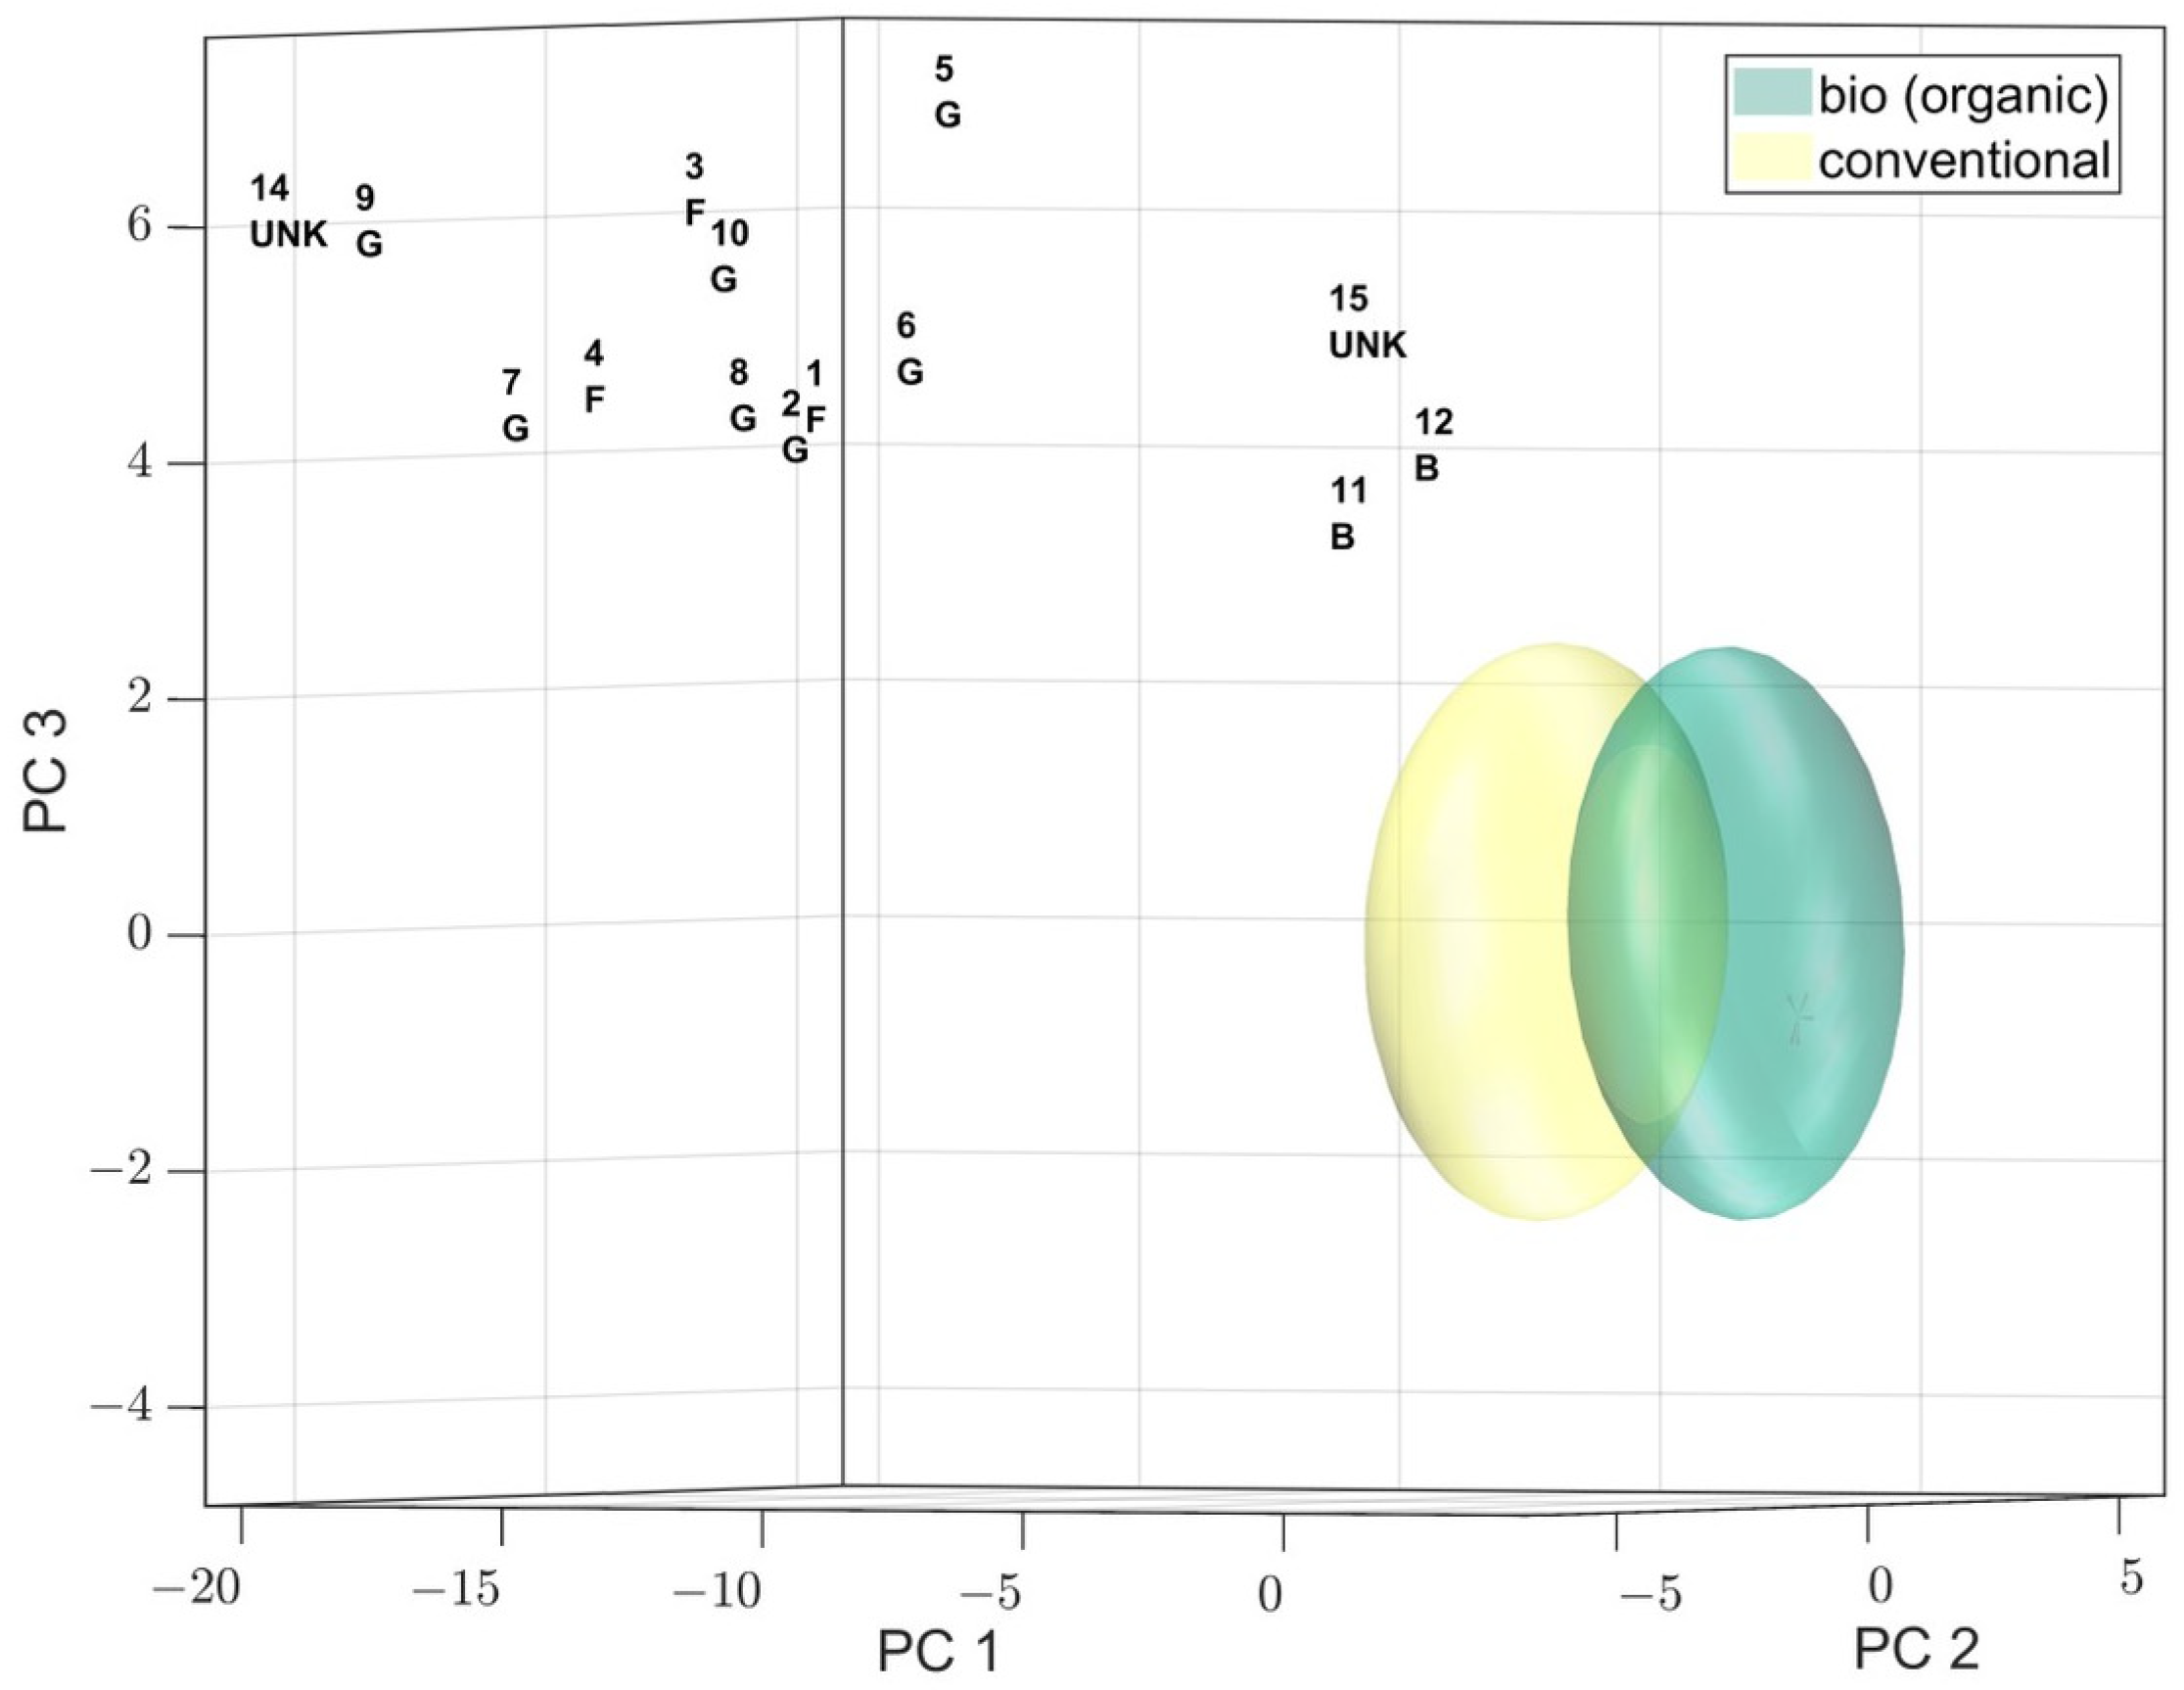
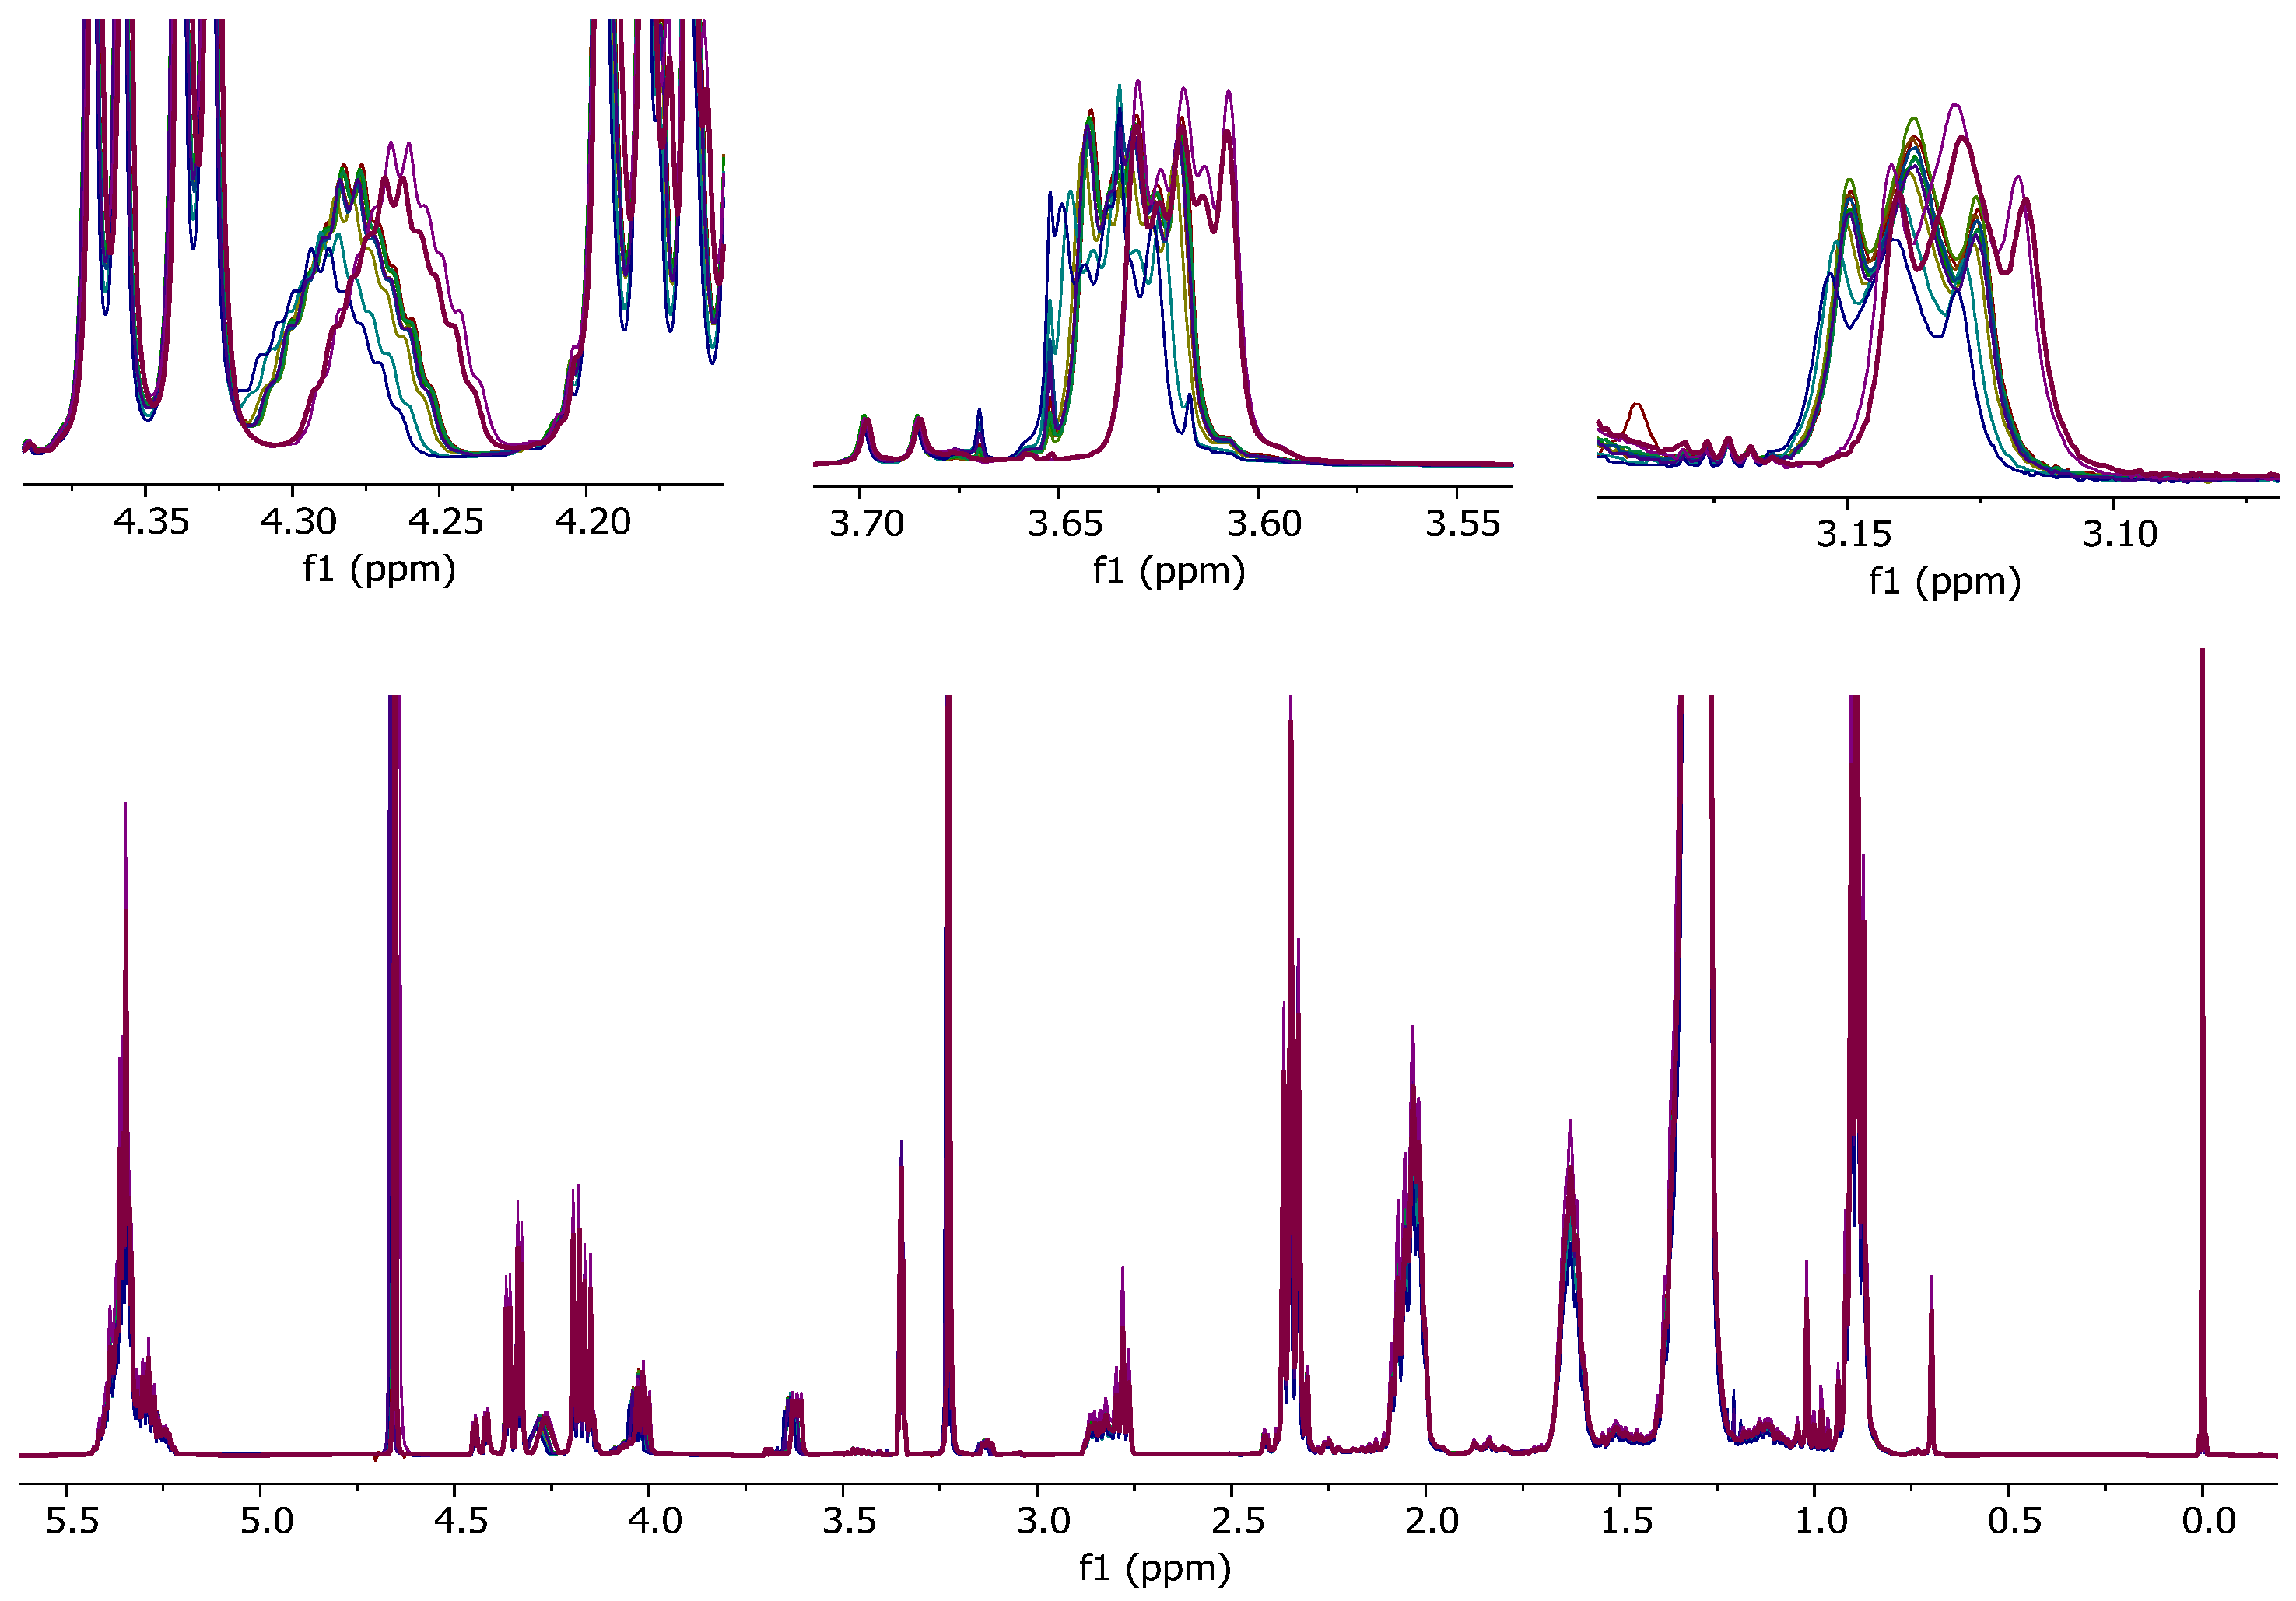
Intermittently, the score plots of whole sample series were unexpectedly far “off model” (
Figure 1), a check of the spectra revealed slight, but systematic shift changes of some signals (
Figure 2). Under chemometrical evaluation, these signals will end up 3 to 10 bins away from their usual position due to the shift differences of approximately 0.01 to 0.03 ppm. Sample preparation using mitigated (D
1)chloroform resulted in a significant improvement of the signal shifts, leading to the assignment of signals to the expected bins (binned data not shown). Subsequently, the samples’ scores were in accordance with the confidence ellipsoids.
3.2. Example 2: Fat Extracts of Fish
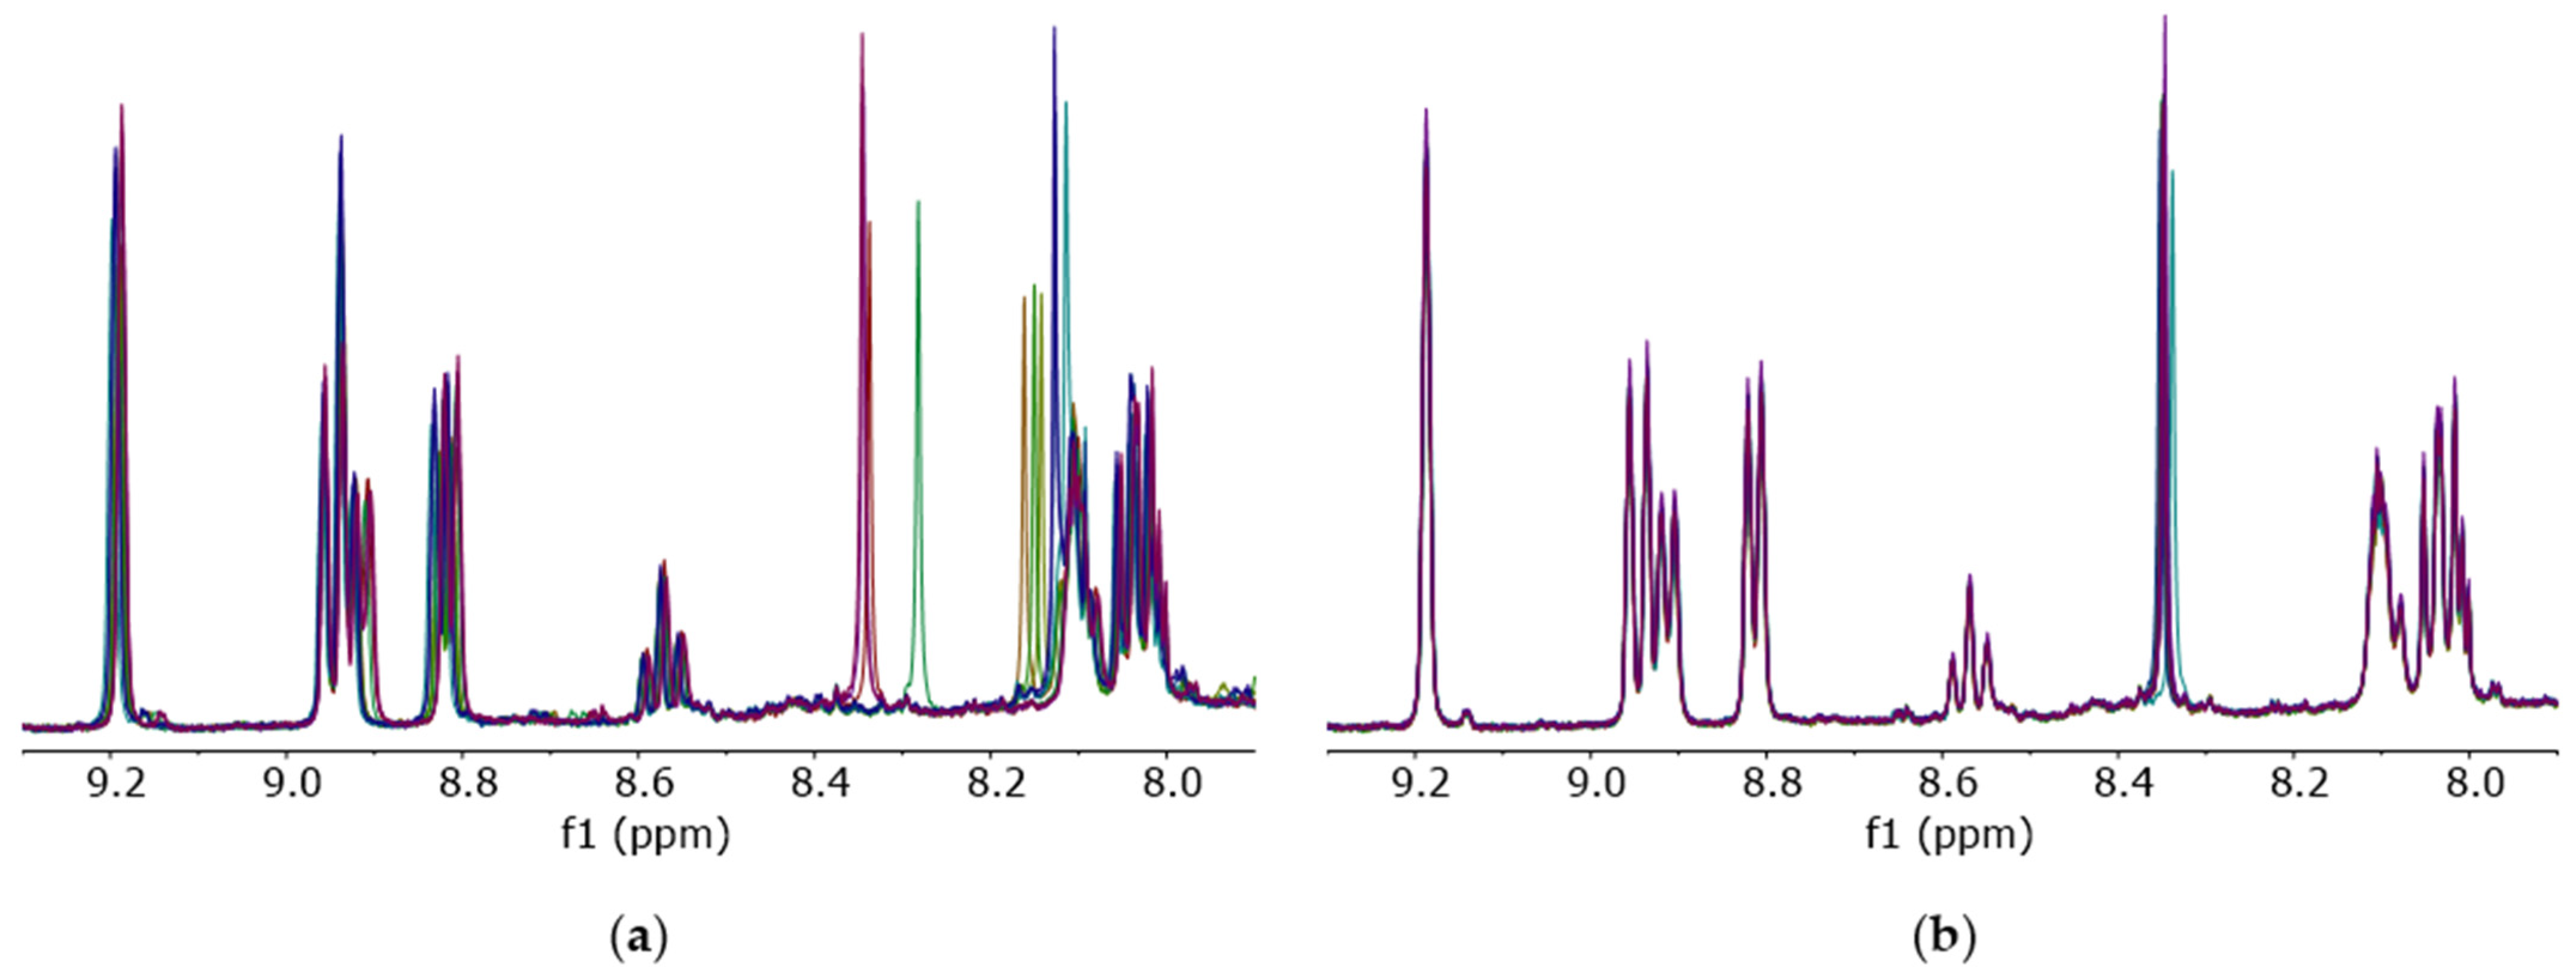
The irregular NMR signal shifts due to untreated (D1)chloroform, which were observed in spectra of hen’s egg samples, raised the question whether other food matrices were also affected.
To classify trout samples, a non-targeted method evaluating NMR spectra of trout fat extracts is currently under development. As mentioned before, unsaturated fatty acids are sensitive to degradation by chlorine radicals. Since fish fat contains a high ratio of unsaturated fatty acids, it was suspected that this matrix might also be affected. Furthermore, residual water and degradation products of untreated (D
1)chloroform could lead to a general signal shift of polar metabolites (e.g., phospholipids) in the
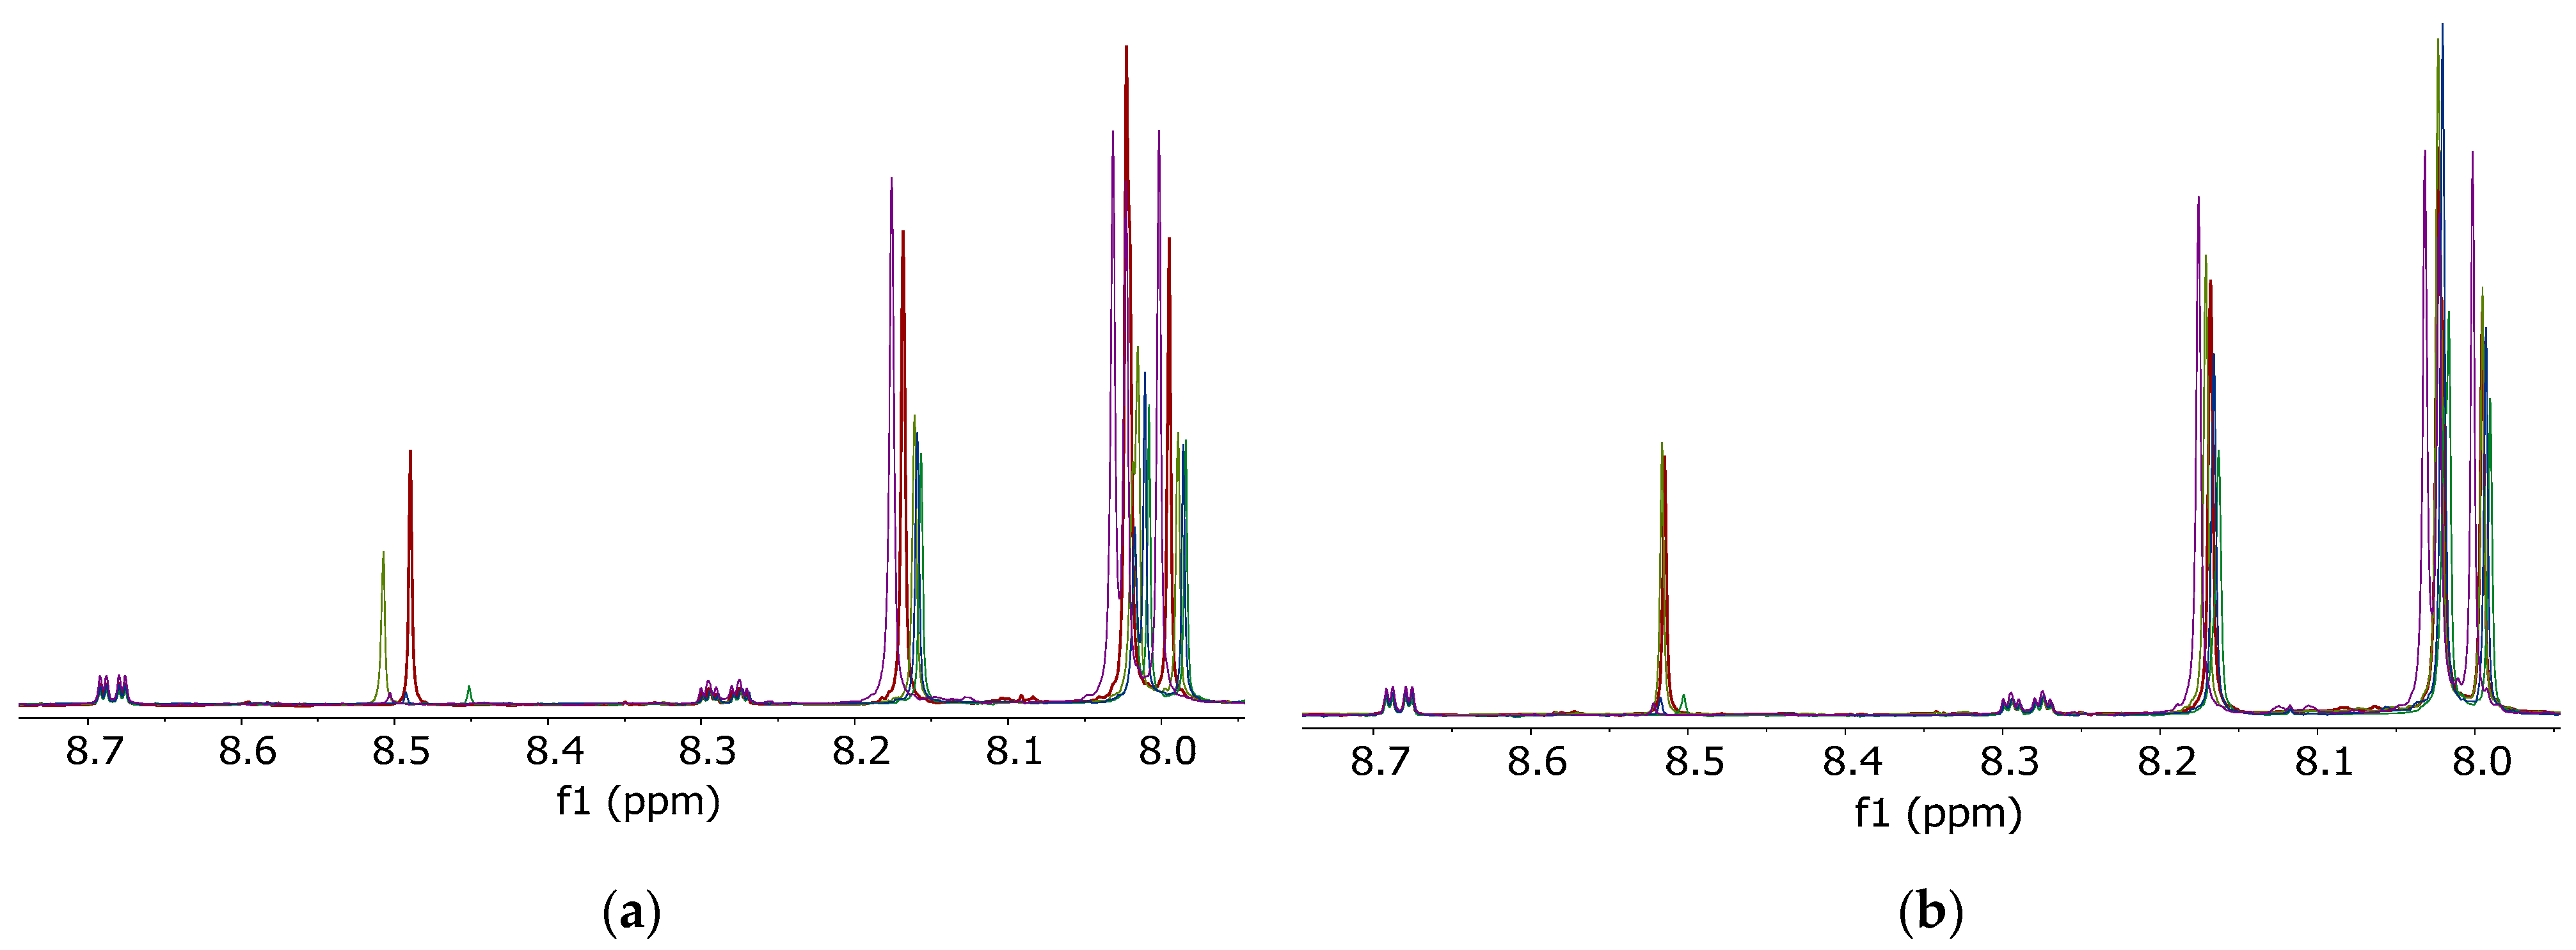
1H-NMR spectrum of fish fat samples. These shifts can lead to degraded separation or even incorrect conclusions in subsequent multivariate data (chemometrical) analysis of the samples. Especially in the range from
δH = 8.0–8.7 ppm, unwanted signal shifts occurred due to the usage of untreated (D
1)chloroform (
Figure 3a). By using the mitigated (D
1)chloroform, these could be significantly reduced to shift variances ≤0.01 ppm of the respective signal (
Figure 3b).
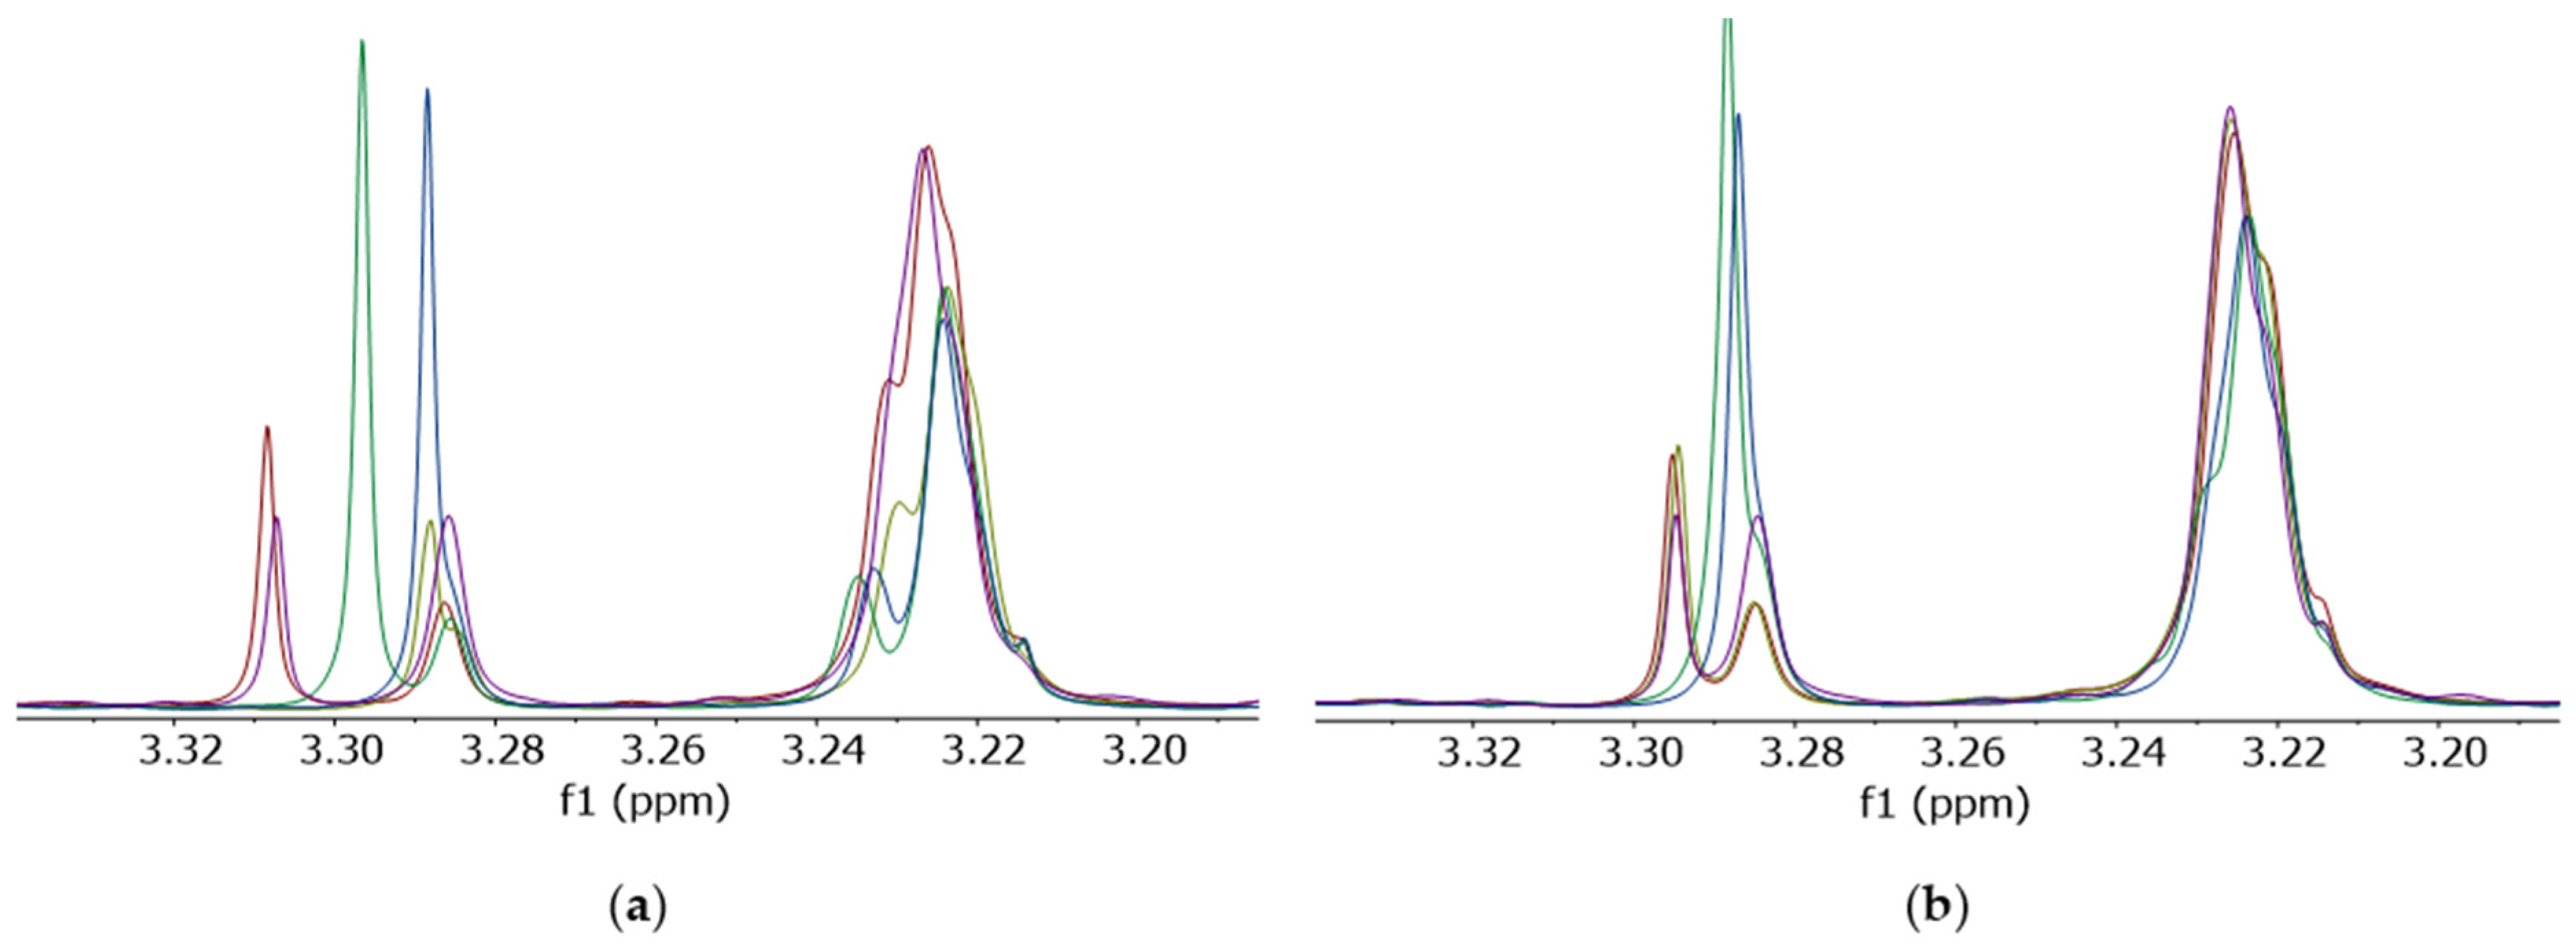
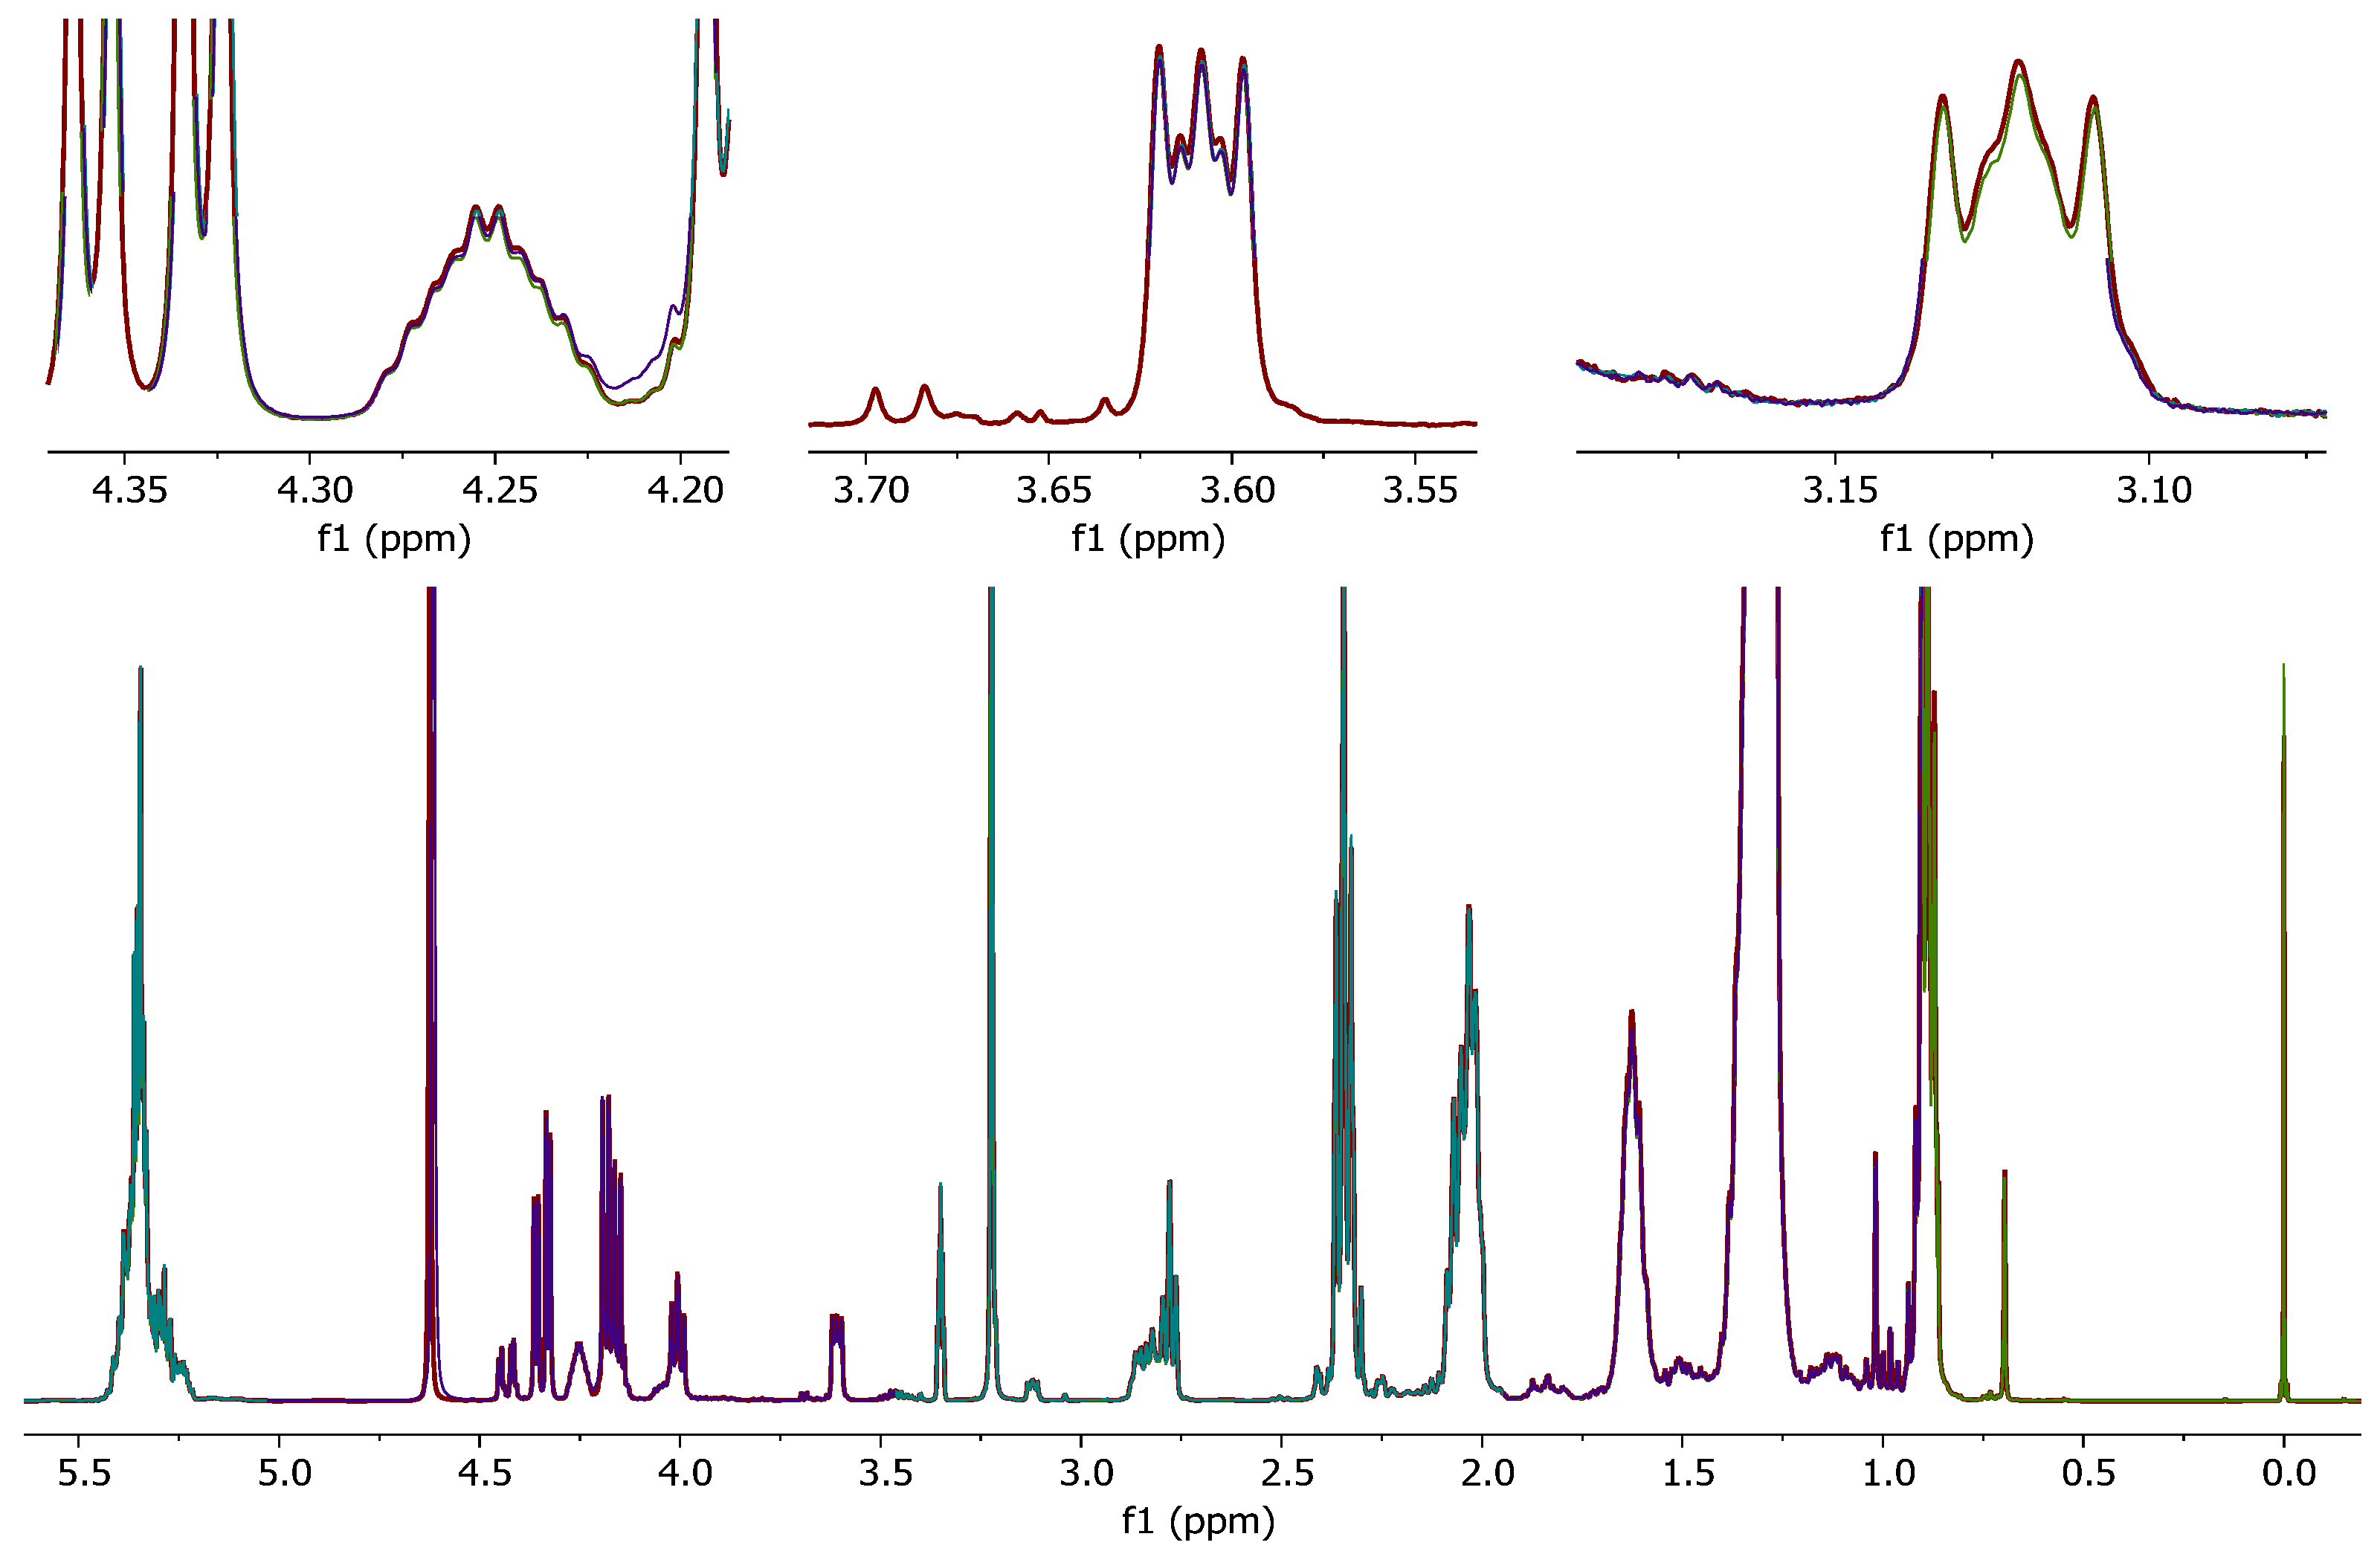
Furthermore, when untreated (D
1)chloroform was used, signal shifts were detected in the spectral region where the signals of the phospholipids appear (
Figure 4a). Similar to the signals in the previously described ppm region (8.0–8.7 ppm) of the spectrum, these shift variances could be reduced by the application of mitigated (D
1)chloroform (
Figure 4b). Moreover, the signal structure of the phosphatidylcholine signal also changed at 3.2 ppm (
Figure 4).
3.3. Example 3: Fat extracts of Coffee
Undesirable signal shifts were also observed in NMR spectra of coffee fat extract. Here, for chemometrical analysis, the lipophilic metabolites of coffee were extracted and measured by
1H-NMR. The irregular signal shifts occurred predominantly in the range of
δH = 8.0–9.2 ppm (
Figure 5a) and could be reduced by the application of mitigated (D
1)chloroform (
Figure 5b). Using (D
1)chloroform treated by the method described above, shifted NMR signals were no longer observed.
3.4. Overview of Chemical Shift Improvements
To supplement the visual impression (see figures) that spectra from samples prepared with mitigated chloroform have a better reproducibility concerning the chemical shifts of sensitive signals, several signals were evaluated by calculating their respective mean chemical shifts and the respective standard deviations.
Table 1 shows that the variance of chemical shift is significantly lower in samples prepared with mitigated chloroform, for some signals approximately by an order of magnitude.
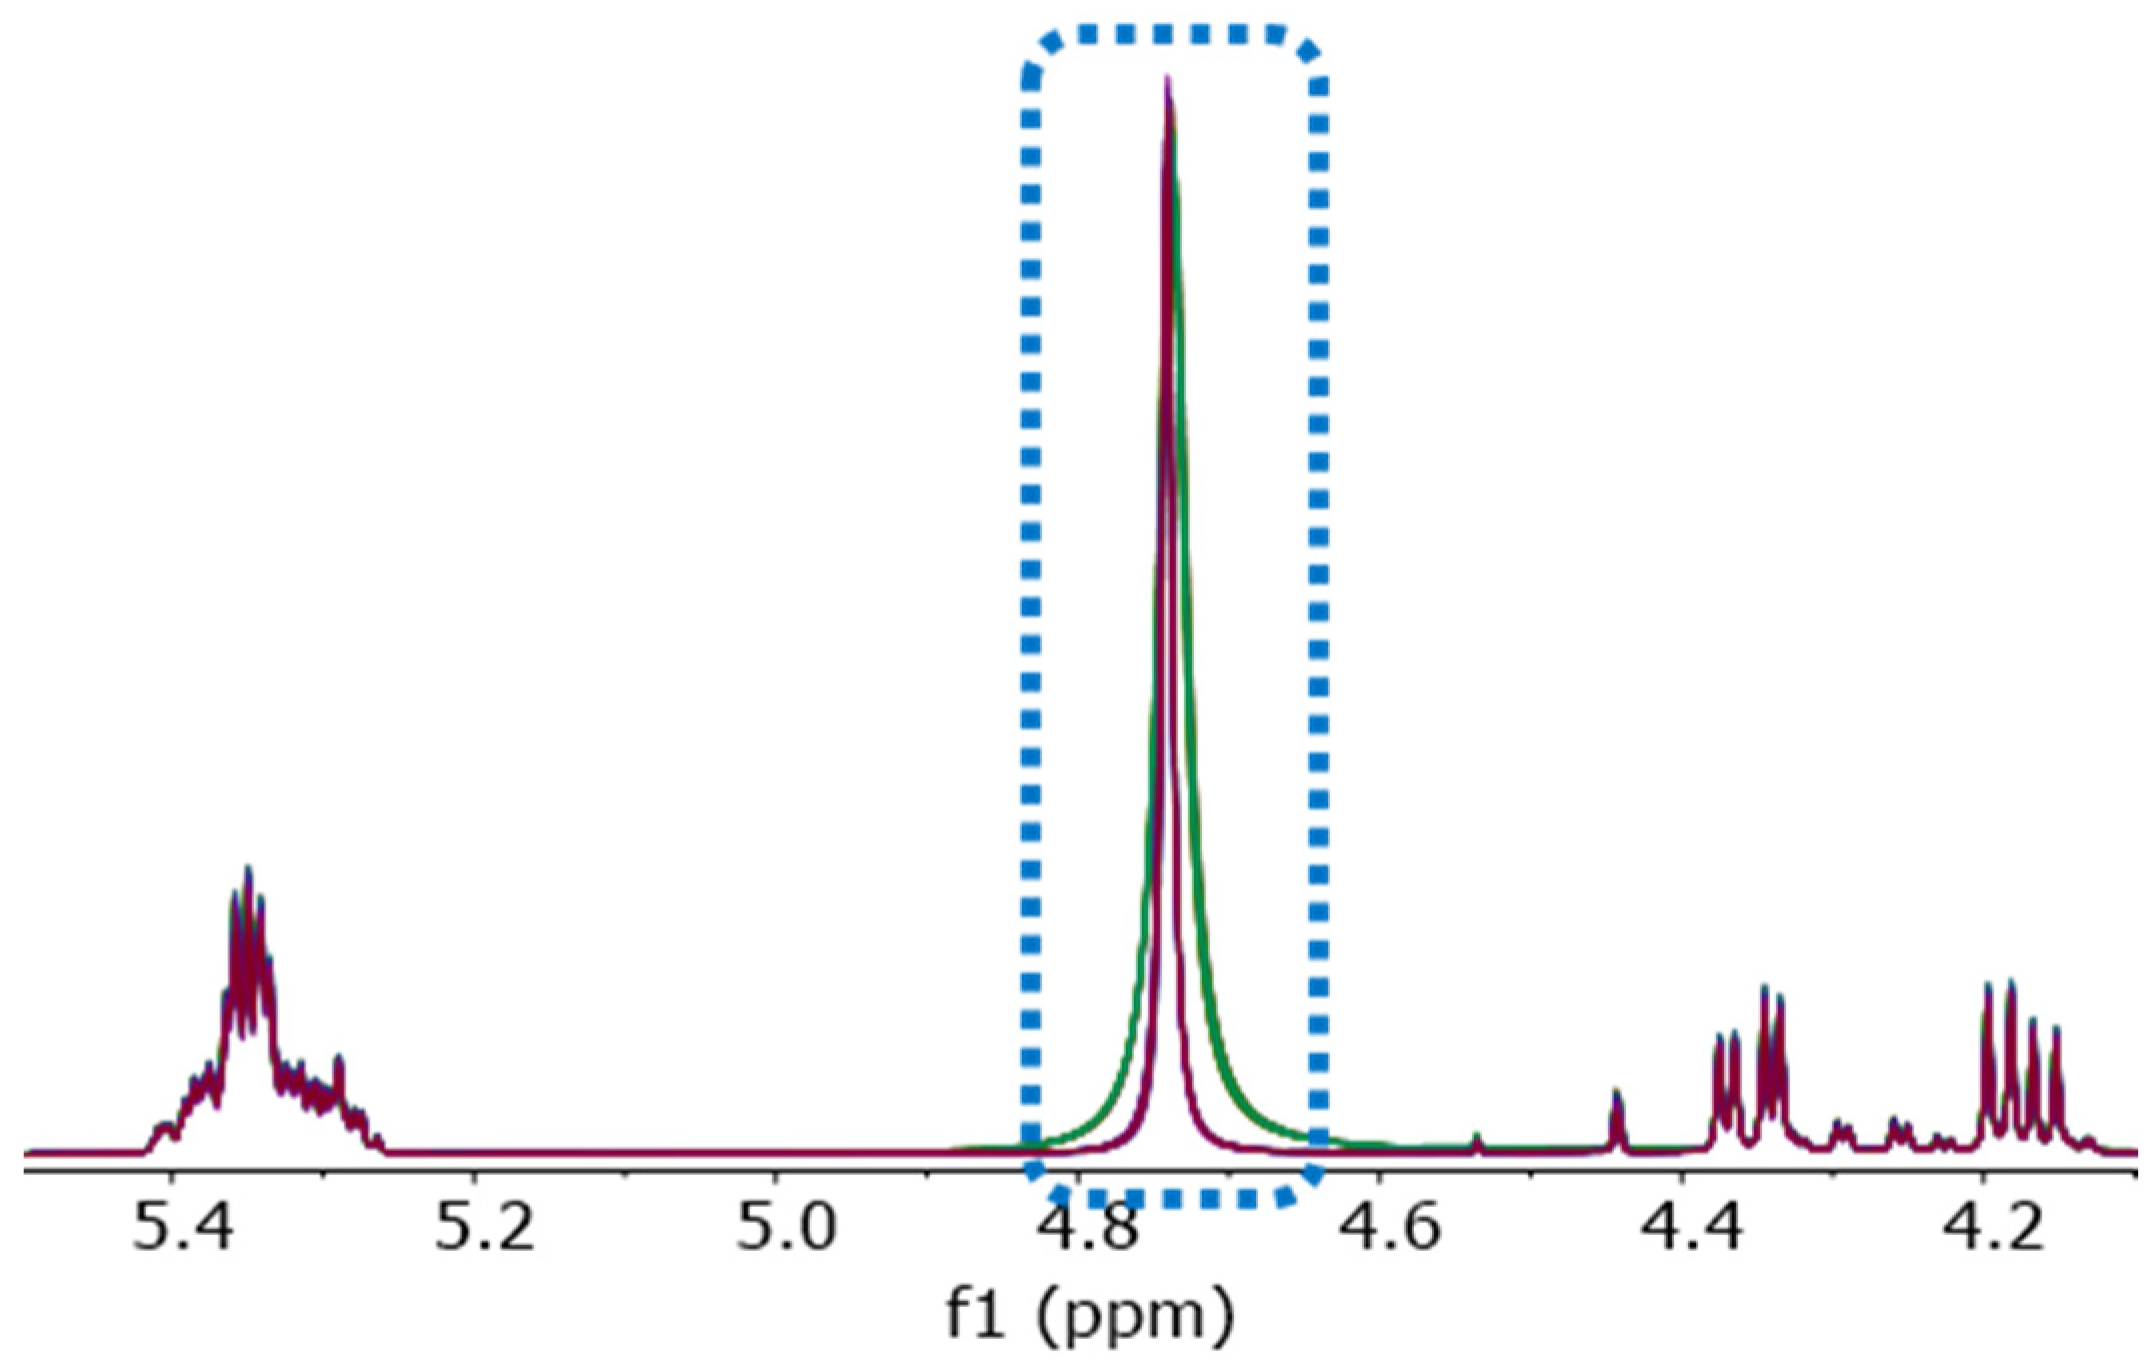
3.5. Removal of Residual Water
Two sets of coffee samples were prepared for NMR analysis: The first using mitigated (D1)chloroform desiccated for 15 min by shaking with oven-dried disodium carbonate; the second using mitigated (D1)chloroform desiccated more thoroughly by shaking with oven-dried sodium carbonate for 2 h and then a rest period overnight before sample preparation.
As shown in
Figure 6, shaking the mitigated chloroform with oven-dried sodium carbonate for 15 min is not sufficient to remove residual water. A more thorough desiccation, as described in the methods above, can further reduce the residual water, resulting in improved
1H-NMR spectra with a smaller and narrower water signal.
Compared to the chemical shifts of HDO in D
2O (4.79 ppm) or in (D
4)methanol (4.87 ppm) published by Fulmer et al. [
10], Gottlieb et al. [
11], and by Hoffman [
12], the signal of residual water (H
2O) at about 4.75 ppm indicates the existence of hydrogen bonds in the sample solution. A higher water content and the formation of clusters of water molecules in the solution can explain this observation. Minor traces of (isolated) water in chloroform will give a signal at 1.56 ppm, as previously described [
10,
11].
A somewhat higher water content in metabolomics NMR samples could result from insufficiently dried deuterated solvent but can also come from the original sample material: thorough drying is often very complex, a potential risk to the sample’s integrity and often not needed.
3.6. Alumina as an Alternative Mitigating Agent
As an exemplary alternative possible option of mitigating chloroform, basic aluminium oxide (alumina) was obtained and added to untreated (D1)chloroform (ratio: 5 g per 100 mL), then the mixture was vortexed for ten minutes. Afterwards, the alumina was separated by filtration and the clean, mitigated (D1)chloroform was used to prepare exemplary samples of egg fat and olive oil for NMR analysis. Each group of replicate spectra was very well aligned.
Figure 7 shows the spectra of egg fat extracts in alumina-treated (D
1)chloroform, for comparison with samples in untreated (D
1)chloroform, see
Figure 1; no deviating chemical shifts are observed (data of olive oil not shown). Under chemometrical evaluation, no erroneous binning is to be expected and further evaluation of the data will not be hindered.
4. Discussion
As shown in the results of examples 1 to 4, signal shifts and changes in signal shape were observed when untreated (D
1)chloroform was used for the NMR measurement. Even recently purchased, unopened bottles did not provide reliable assurance against deterioration and tainted spectra. (D
1)chloroform deterioration seemed the probable cause and online searches yielded only short and general comments on how to quench chloroform (deuterated or undeuterated). To the best of our knowledge, there is no literature reporting NMR signal shifts and changes in NMR signals shape because of decomposition products in (D
1)chloroform. As described before, chloroform can be stabilised in several ways with ethanol being the most efficient way [
13,
14,
15]. However, the usual stabilising agents for chloroform have certain disadvantages if the chloroform is intended as an NMR solvent: they lead to additional unwanted signals in the
1H-NMR spectra (ethanol, amylene) or do not remove all of the aggressive decomposition products (silver foil). As described by Fuhrmann et al. [
14], Verpoorte et al. [
16], and Moody et al. [
17] decomposition products in chloroform can react with components containing a piperazine-ring, phospholipids, or nitrogen-containing compounds. This led to a loss of analyte, artefact formation, and formation of undesired reaction products. The reaction of the decomposition products of (D
1)chloroform with the sample might be the reason for differences in the signal shape of phosphatidylcholine in the fat extracts of fish or for the occurrence of new signals.
Furthermore, Tsujikawa et al. measured an acidic pH value of insufficiently stabilised chloroform [
13]. This could probably lead to the irregular
1H-NMR signal shifts of the polar metabolites in the examples above.
Disodium carbonate is a reagent available in most laboratories, shaking out with aqueous solution will very quickly decompose phosgene traces [
18] and the alkaline environment neutralises hydrogen chloride, subsequent desiccation, and storage over dry disodium carbonate yield (D
1)chloroform of reliable quality.
An exemplary test of (D1)chloroform mitigated with activated, basic aluminium oxide indicated the usefulness of alumina as an alternative to mitigate (D1)chloroform. The general availability and price of disodium carbonate make this reagent somewhat more favourable than alumina, especially for smaller batches of (D1)chloroform; while the mechanical stability of alumina granules and its easy regeneration (at > 180 °C) could potentially be useful for an in-line column system enabling the regular tapping of freshly mitigated (D1)chloroform.
With regard to the main causes for varying NMR signal shifts or artefacts in (D1)chloroform solutions, i.e., acidity and the highly reactive phosgene, a suitable and simple method to remedy both causes was successfully developed and tested. The simple procedure presented has proven so far to reliably remove the problem of degraded or pH shifted (protonated) samples due to chlorine, phosgene, or hydrogen chloride in (D1)chloroform. As the (D1)chloroform is stored over sodium carbonate, the removal of phosgene and hydrogen chloride is ensured for at least a week, presumably much longer. Re-shaking before use may be recommendable after longer storage at rest.
A comprehensive and detailed comparison of other potential methods was beyond the scope of this work. Furthermore, it is hindered by the lack of detailed and reproducible publications of other potential procedures, but then this offers an opportunity for further research.


 ,
, 


