CNT and H2 Production during CH4 Decomposition over Ni/CeZrO2. II. Catalyst Performance and Its Regeneration in a Fluidized Bed


1
Division of Chemistry and Technology of Fuels, Wroclaw University of Science and Technology, Gdanska 7/9, 50-344 Wroclaw, Poland
2
Institute for Chemical Processing of Coal, Zamkowa 1, 41-803 Zabrze, Poland
*
Author to whom correspondence should be addressed.
ChemEngineering 2019, 3(1), 25; https://doi.org/10.3390/chemengineering3010025
Submission received: 18 January 2019
/
Revised: 6 February 2019
/
Accepted: 14 February 2019
/
Published: 5 March 2019
(This article belongs to the Special Issue Synthesis of Carbon Nanomaterials and Carbon Nanomaterial–Metal(Oxide) Composites and Their Applications in Catalysis)
Abstract
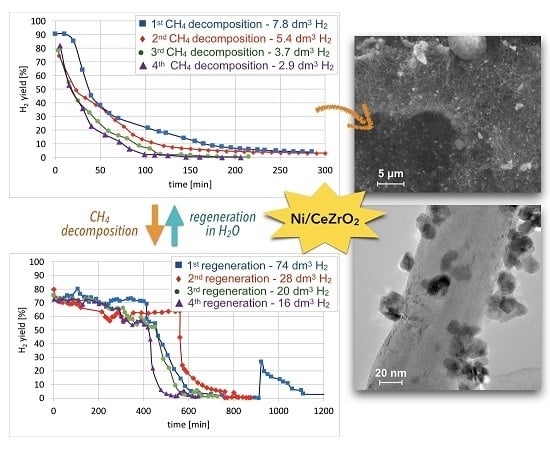
:In this work, a ceria-zirconia supported nickel catalyst (Ni/CeZrO2) was for the first time used in a fluidized bed reactor in order to obtain carbon nanotubes (CNTs) and H2 in the reaction of the decomposition of CH4. The same catalyst was afterward regenerated with H2O, which was accompanied with the production of H2. The impact of catalyst granulation, temperature, and gas hourly space velocity (GHSV) on the amount and type of carbon deposits was determined using thermogravimetric analysis (TGA) and scanning and transmission electron microscopy (SEM and TEM). The presence of randomly oriented and curved CNTs with an outer diameter of up to 64 nm was proved. The Ni/CeZrO2 particles were loosely covered with CNTs, freely dispersed over CNTs, and strongly attached to the external CNT walls. TEM proved the presence of a Ni/CeZrO2@CNT hybrid material that can be further used as catalyst, e.g., in WGS or DRM reactions. The impact of GHSV on hydrogen production during catalyst regeneration was determined. The catalyst was subjected to cyclic tests of CH4 decomposition and regeneration. According to the obtained results, Ni/CeZrO2 can be used in CH4 conversion to CNTs and H2 (instead of CH4 combustion), e.g., in the vicinity of installations that require methane utilization.
1. Introduction
This paper deals with the possibility of CH4 utilization for carbon nanotubes (CNTs) and H2 production in a fluidized bed reactor using a ceria-zirconia supported nickel catalyst (Ni/CeZrO2). Another important aspect of the presented work is the regeneration of the spent catalyst with H2O, which also leads to the formation of H2 Hydrogen, which is a very important energy carrier whereas CNTs, due to their outstanding physical and chemical properties, have attracted considerable attention in many fields, including electronics, engineering materials and catalysis [1,2]. The most promising method for the large-scale production of CNTs is the catalytic chemical vapor deposition (CCVD) [3,4,5,6]. The most popular catalysts utilized in the formation of CNTs via CCVD are Fe, Co, Mo, and Ni supported on MgO, SiO2, Al2O3, CaO, and ZrO2 [7,8,9,10]. Nickel catalysts have been found to be very active and stable, being able to work in a wide range of temperatures [11,12]. The most popular support used in the CVD process is MgO, which can be digested within a mild acid environment without damaging the CNTs [13].
The CCVD process for CNT production can be carried out in a fixed bed, a floating catalyst, and in a fluidized bed [14]. Among these three methods, a fluidized bed is the most promising method because it allows for the obtainment of a higher yield of good quality CNTs. The CCVD process carried out in a fluidized bed provides sufficient growing space for CNTs and proper mass and heat transfer [15]. Many researchers prefer to produce CNTs in a large scale by utilizing fluidized bed reactors [16,17,18,19,20,21,22]. A pilot mass production of agglomerated MWNTs with the yield of 15 kg/h was carried out in a fluidized bed reactor in 2002 [17]. The CNTs formed agglomerates with a size of 10–200 µm. The CCVD was widely used for the production of agglomerated CNTs in fluidized beds [23,24,25]. Some companies have even commercialized the production of CNTs (agglomerated) in fluidized bed reactors [26]. Zhang et al. [22] obtained vertically aligned CNTs in a fluidized bed reactor over the lamellar Fe/Mo/vermiculites with a thickness of 50–100 μm and a diameter of 100–300 µm. The CNT arrays, which had grown among the layers of vermiculites, had good alignment.
Maghsoodi et al. [16] studied the continuous production of CNTs via CCVD of methane over Fe/MgO catalyst in a fluidized bed reactor. They have introduced ferrocene, which has been in situ decomposed to Fe on fluidized MgO particles. Contrary to the common CCVD catalysts, this solution prevented the wasting of the catalyst in the internal porous structure of the catalysts and provided a large surface area for the CNTs growth. The authors obtained multi-wall nanotubes (MWNTs) of about 20 nm size, as well as single wall nanotubes (SWNTs) of 1.0–1.2 nm in diameter. The process was carried out at 900 °C. Corrias et al. [19] proved a high efficiency of the fluidized bed process in order to manufacture CNTs. They obtained a carbon yield of over 95% with a selectivity to CNTs close to 100%. No decrease of fluidization quality was noticed, and an excellent reproducibility of the experiments was acquired. Hsieh et al. [18] investigated the production of high quality CNTs over Fe– and Ni–Al2O3 mixture catalysts in reaction of acetylene decomposition in a fluidized bed reactor at 700–850 °C. Compared to CNTs grown in a fixed bed reactor, the CNTs produced in a fluidized bed reactor showed a higher purity, and HR-TEM observations indicated a perfect graphene layer-by-layer structure. It was observed that fluidization is an important factor in the growth process of well-defined CNTs. Moreover, the activity of Fe–Al2O3 catalyst was found to be greater than that of the Ni–Al2O3 catalyst.
There is no data regarding the production of CNTs in a fluidized bed reactor over a ceria-zirconia supported catalyst. In addition, all CCVD processes disregard H2 formation and concentrate solely on obtaining CNTs and paying attention to their quality and yield. In this work, three important aspects are raised: (i) The possibility of obtaining CNTs on Ni/CeZrO2 in a fluidized bed reactor using CH4 as the source of carbon, (ii) H2 production during that process, and (iii) the possibility of catalyst regeneration in a fluidized bed with the simultaneous production of H2.
In this work, after CH4 decomposition, the carbon deposit was separated from the catalyst and characterized. Purification of CNTs from catalyst particles usually involves treatment in acids in order to remove metal, and heating in order to purify structural carbon from the amorphous one. The CNTs obtained in this work were not subjected to such a treatment, so the product contained both the amorphous carbon and particles of Ni/CeZrO2 (the issue of purification and/or utilization of produced CNTs will be raised in the next paper). Ni/CeZrO2 particles were to some extent attached to the external walls of CNTs forming a hybrid material that can be used as catalyst. So far, the catalytic activity of Ni/CeZrO2@CNTs was reported as active in the water gas shift reaction [27]. The system has also been found to be active in dry methane reforming (supporting file, Figure S1).
2. Materials and Methods
2.1. Preparation of the Formed Ni/CeZrO2 Catalyst
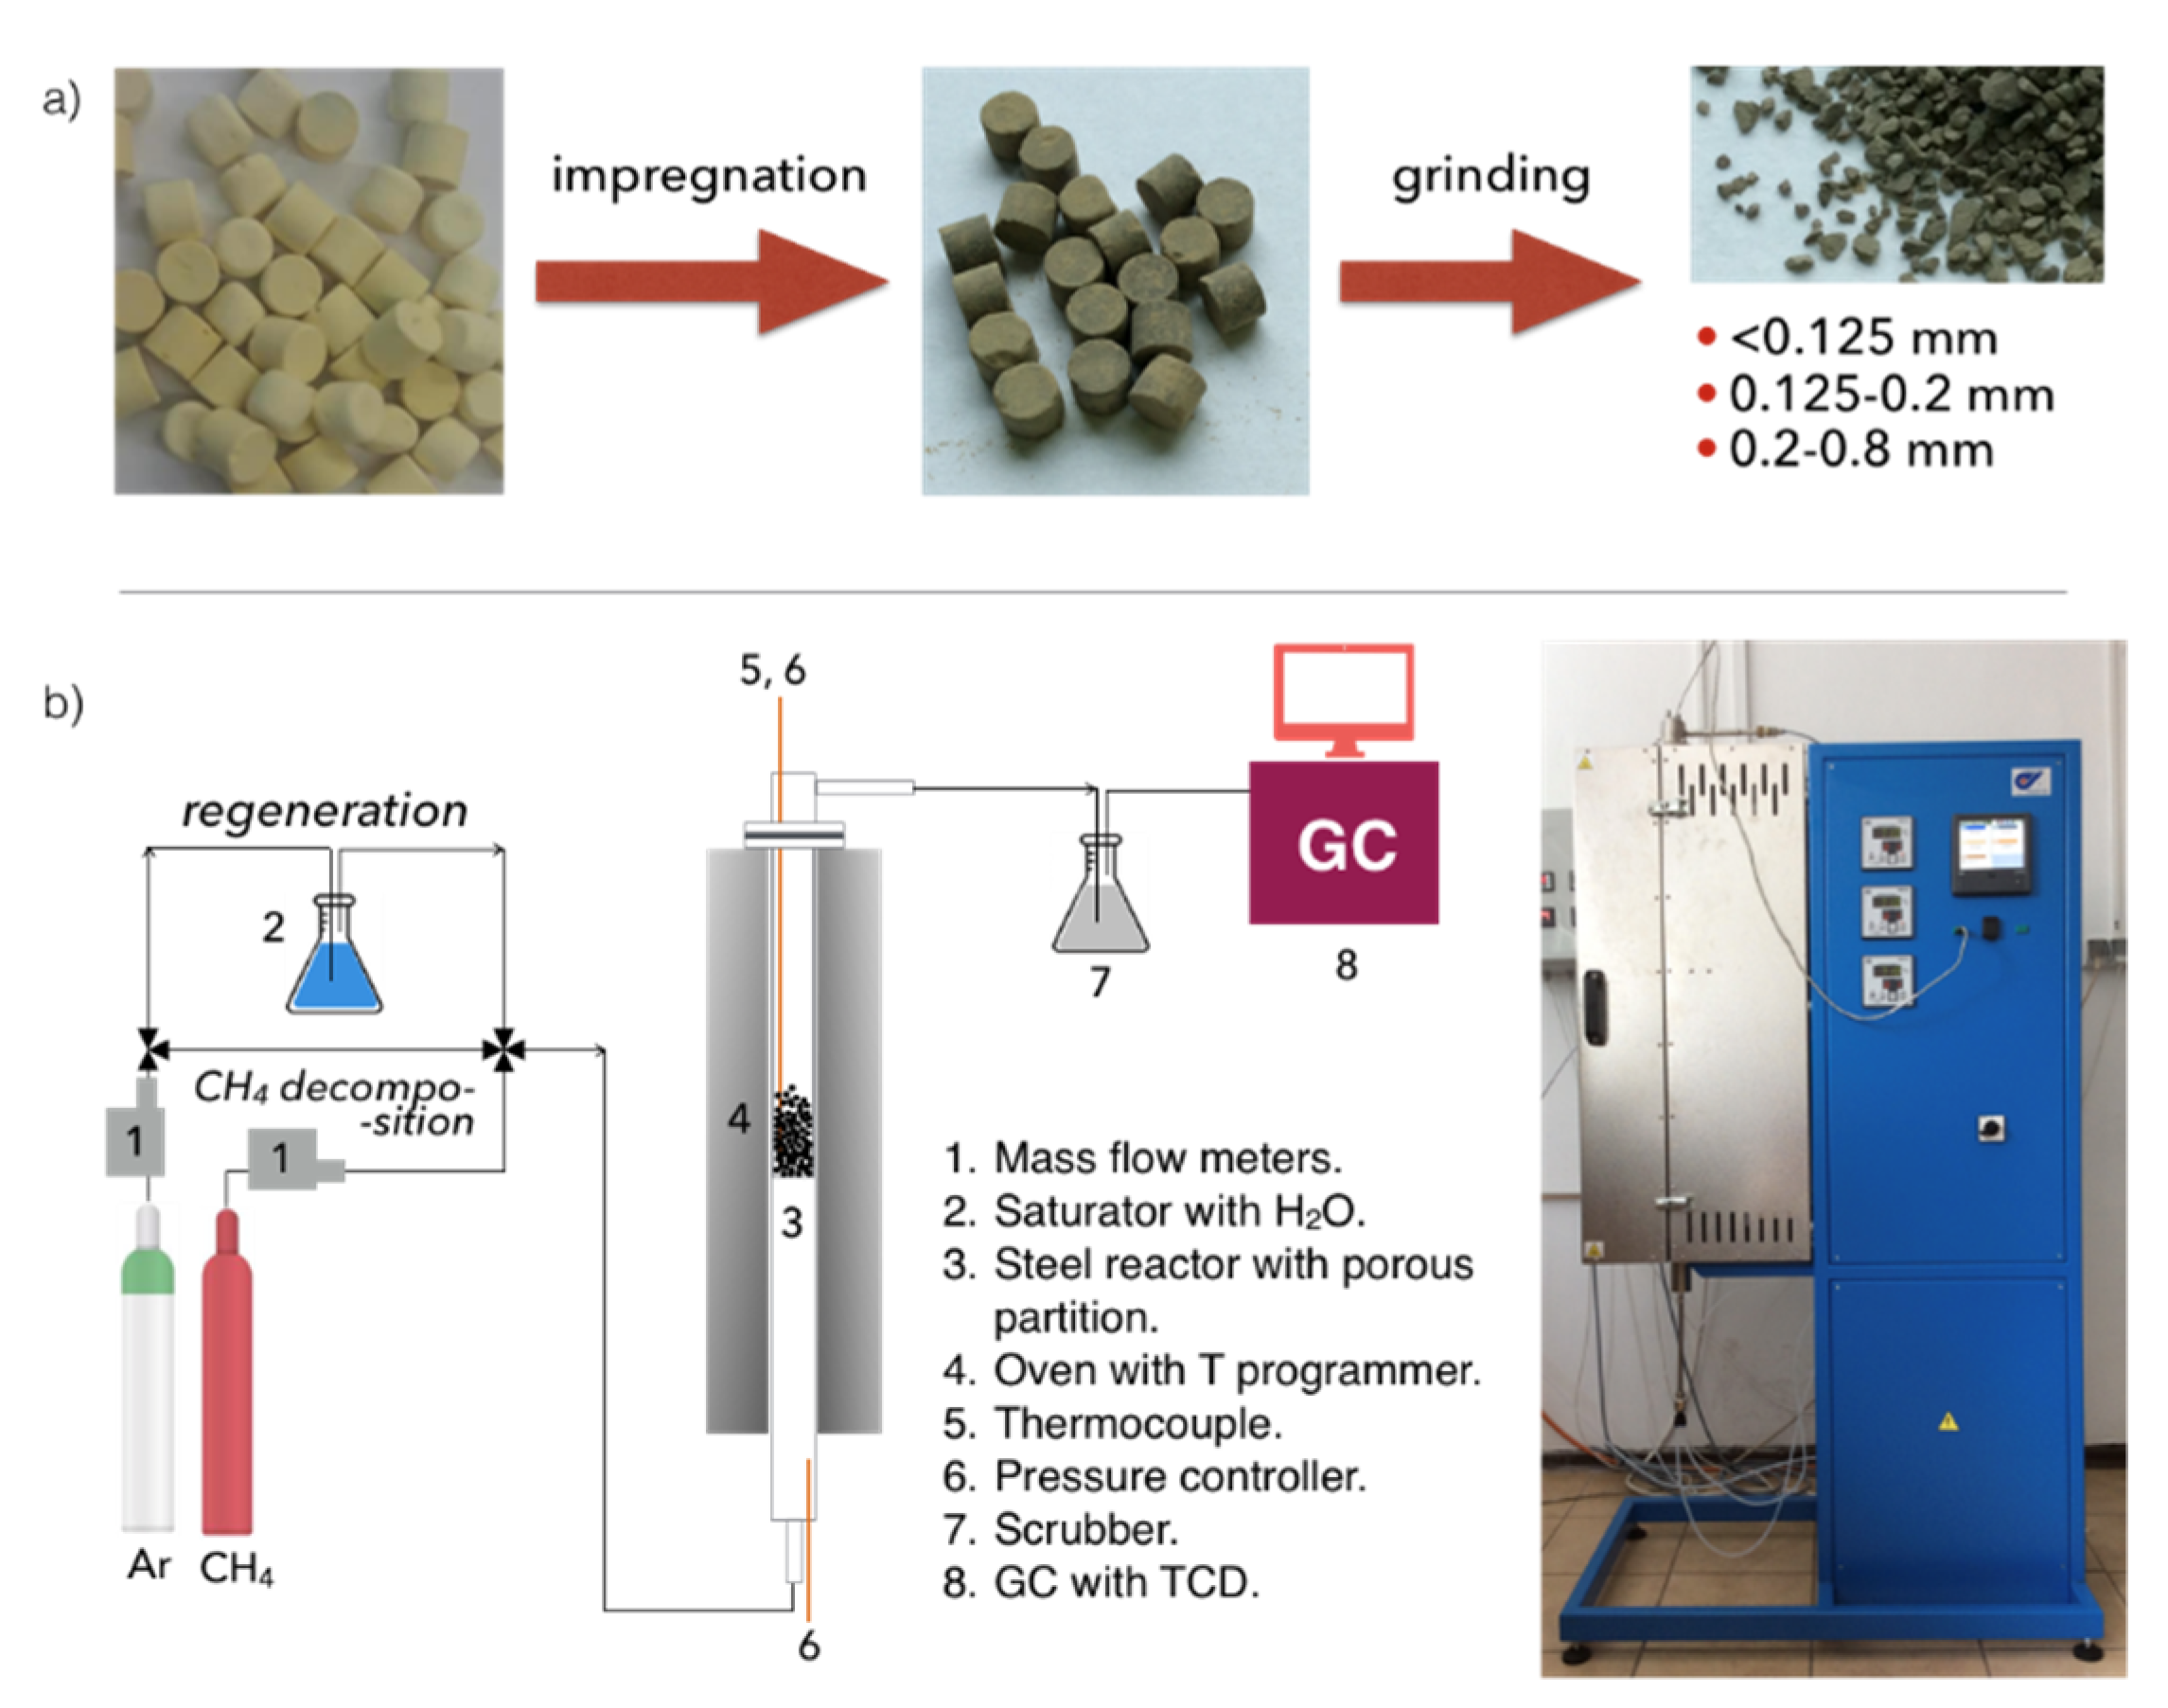
The Ni/CeZrO2 catalyst used in this work was obtained by the impregnation of Ce0.68Zr0.32O2, denoted CeZrO2, (ActalysTM 9330, Rhodia Catalysts, France) previously formed in pellets (W × H = 5 × 4 mm). The nominal Ni loading was 10 wt.%. Yellow CeZrO2 pellets were impregnated using an aqueous solution of Ni(NO3)2. Afterward, impregnation pellets were dried and calcined at 700 °C for 5 h. Next, Ni/CeZrO2 pellets were crushed and sieved into three fractions of particle size: “A” < 0.125 mm, “B” 0.125–0.2 mm, and “C” 0.2–0.8 mm.
The Ni-MgO catalyst (used as the reference catalyst in this work) was obtained via the sol-gel method. Nickel and magnesium nitrates (Ni(NO3)2 × 6H2O and Mg(NO3)2 × 6H2O) were dissolved with citric acid in deionized water, stirred and RT for 24 h. Obtained green sol was heated at 70 °C until it transformed into gel, which was then dried at 120 °C overnight. The resulting green foam was calcined at 700 °C for 5 h to obtain a light brown powder. In the next step, the Ni-MgO solid solution was formed into pills under the pressure of 40 Kp/cm and crushed in a mortar to obtain a fraction of 0.125–0.2 mm. The Ni content in the catalyst was 32 wt.%.
2.2. Tests in the Fluidized Bed Reactor
Tests of CH4 decomposition and catalyst regeneration with H2O were carried out in a fluidized bed reactor of 55 cm length and 3.4 cm dimension (Figure 1). The catalyst was placed on a porous partition that was in the middle of the furnace heating zone. The gas (Ar, CH4/Ar or H2O/Ar) was introduced to the reactor from the bottom and its flow rate was controlled by mass flowmeters. The gas composition on the reactor inlet and outlet was measured by a gas chromatograph with TCD. Tests carried out in flowing Ar showed that bed fluidization can be achieved for a gas flowrate of 2 L/min.
CH4 decomposition: Tests of CH4 decomposition were carried out at 600 and 700 °C in flowing 10 vol.% CH4/Ar for 1, 3, or 5 hours. The applied GHSV was 5000, 10,000, and 20,000 h−1. The heating of the catalyst to the desired temperature and its cooling after the test were carried out in flowing 1 L/min of Ar. The catalyst samples used for tests of CH4 decomposition were not pre-reduced (e.g., in flowing H2). The Ni0 active sites for CH4 adsorption and dehydrogenation were provided at the beginning of each test during the in-situ reduction in flowing CH4/Ar. After the test the catalyst was weighed in order to calculate the mass increase caused by the carbon deposition. The catalyst was also characterized by thermogravimetric analysis (TGA) and scanning electron microscopy with energy dispersive X-ray spectroscopy (SEM/EDS). Carbon deposits were separated from the catalyst grains by sieving and by using the ultrasound bath. After separation, catalyst and carbon fractions were characterized by TGA, SEM, and TEM.
Catalyst regeneration: The spent catalyst was regenerated in flowing 4.15 H2O/Ar, in a micro-reactor in the temperature-programmed conditions from RT to 900 °C with a heating rate of 10 °C/min and at GHSV = 5000 h−1. These tests allowed us to determine the temperature range for catalyst regeneration in a fluidized bed. Catalyst regeneration in a fluidized bed reactor was carried out at 550 °C until there was no H2, CO, or CO2 in the gas phase. Afterward, the temperature was increased to 700 °C to remove residual carbon deposits if still present in the sample. Regeneration in a fluidized bed was carried out at GHSV = 2000, 4000, and 8000 h−1.
2.3. Catalyst Characterization
The crystal structures of fresh and spent catalysts were determined by a Siemens 500D diffractometer employing Cu-Ka radiation (λ = 0.154 nm). The crystallographic structures of the samples and Miller indices (hkl) of diffraction lines were determined using bibliographic data (JCPDS published by the Joint Committee on Powder Diffraction Standards). Thermogravimetric analyses (TGA/DTG) of spent Ni/CeZrO2 and Ni-MgO catalysts were performed using the STA 409 PG Luxx apparatus (Netzsch) in (a) flowing air and (b) 40 vol.% H2O/Ar, which was accompanied by CO2 detection by mass spectrometer and FTIR. Analyses were carried out under temperature increasing from RT to 1000 °C with a heating rate of 10 °C/min. Scanning electron microscopy was performed using the Jeol JSM-6610LVnx microscope. The micrographs were obtained under low vacuum (80 Pa) with an acceleration voltage 10 kV from secondary electrons collected by large-field-detector (LFD). High-resolution transmission electron microscopy (HRTEM) was performed on the JEOL-JEM 2011 HR apparatus associated with a top entry device and operating at 200 kV.
3. Results and Discussion
3.1. Carbon Deposition during Decomposition of CH4
The decomposition of CH4 is a few step dehydrogenation which requires the presence of reduced metal sites. Those Ni0 active sites were formed on both Ni/CeZrO2 and Ni/MgO catalysts at the beginning of each experiment as a result of the in-situ reduction by the flowing CH4. The mechanisms of CH4 decomposition on Ni/CeZrO2 and Ni/MgO were discussed in detail in the first part of this work.
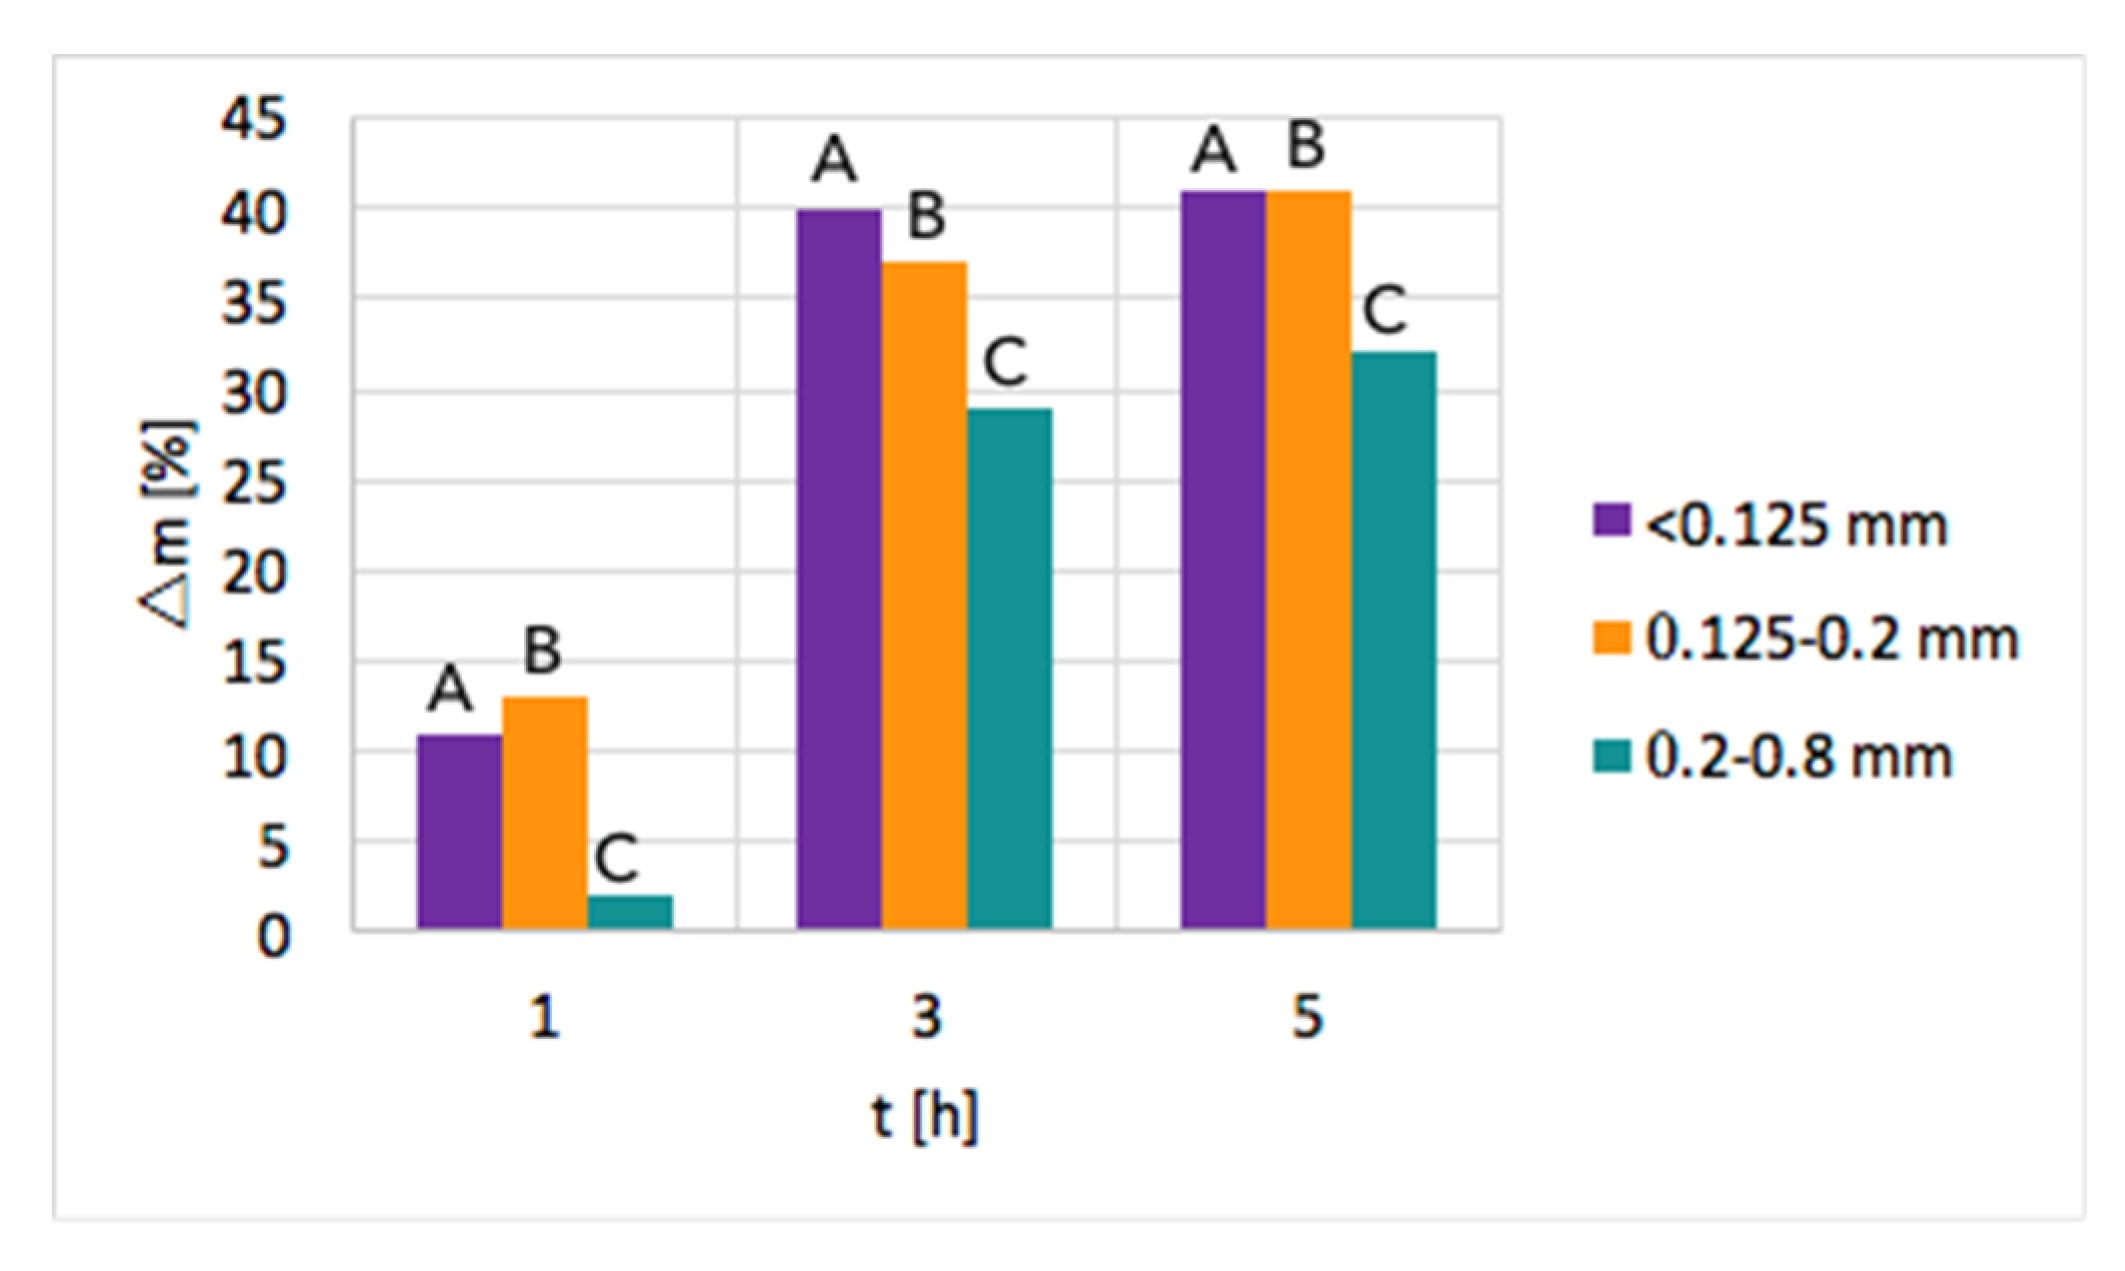
Ni/CeZrO2: The tests of CH4 decomposition were first carried out over three fractions of Ni/CeZrO2, i.e., <0.125 mm, 0.125–0.2 mm, and 0.2–0.8 mm. The influence of time and particle size on the increase of sample mass due to carbon deposition is presented in Figure 2. As can be seen, a significant mass increase was observed when the test duration was increased from 1–3 h. Further extension of the time of CH4 decomposition resulted in a smaller mass gain. Moreover, the highest mass increase of ca. 40% was observed for fractions A (<0.125 mm) and B (0.125–0.2 mm) that have smaller particles; thus, the contact area with CH4 molecules is the biggest. The lowest carbon deposition occurred for fraction C (0.2–0.8 mm).
After the tests, the catalyst bed was cooled down to 200 °C in flowing Ar to avoid oxygen entering the reactor, which at temperatures above 300 °C would cause oxidation of carbon species. After reaching 200 °C, the reactor was unsealed so that some air could enter and passivate the Ni3C that was formed on the catalyst during CH4 decomposition. Ignoring the passivation step resulted in a strongly exothermic oxidation of Ni3C during catalyst tipping at room temperature. Passivation worked well for fractions B and C, whereas it was challenging in the case of fraction A, whose fine grains allowed the highest carbon deposition. Lasting even 24 h, attempts to passivate the carbide in fraction A were unsuccessful, and the catalyst burned in contact with air during tipping. Owing to these problems and the low carbon deposition on fraction C, the next tests of methane decomposition were carried out over fraction B of Ni/CeZrO2, i.e., particles of 0.125–0.2 mm.
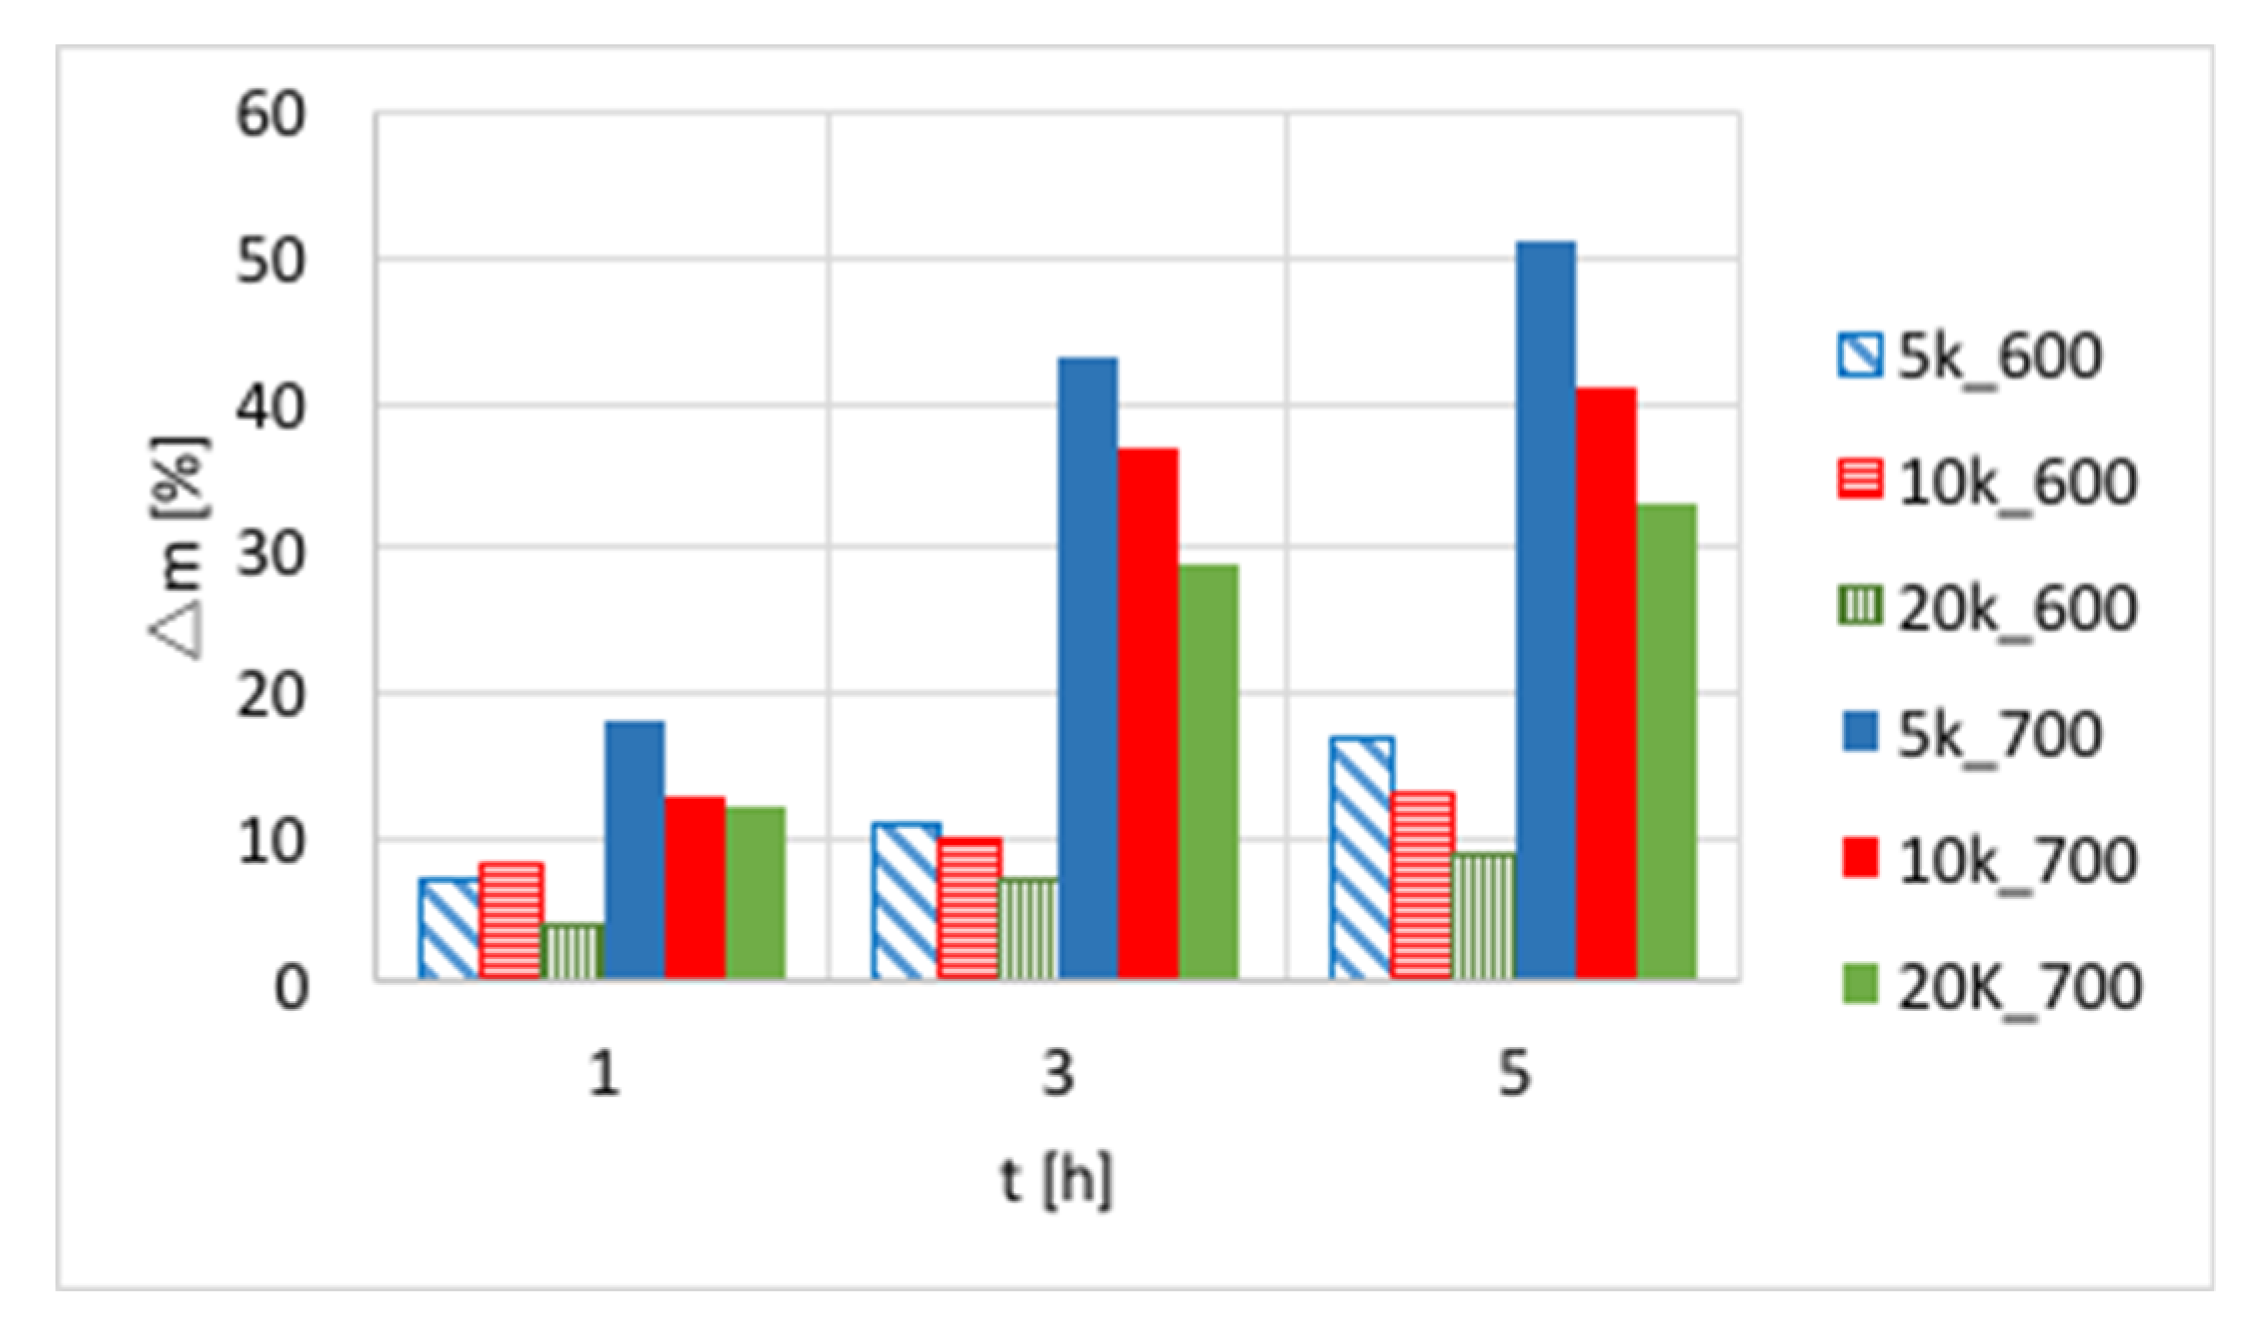
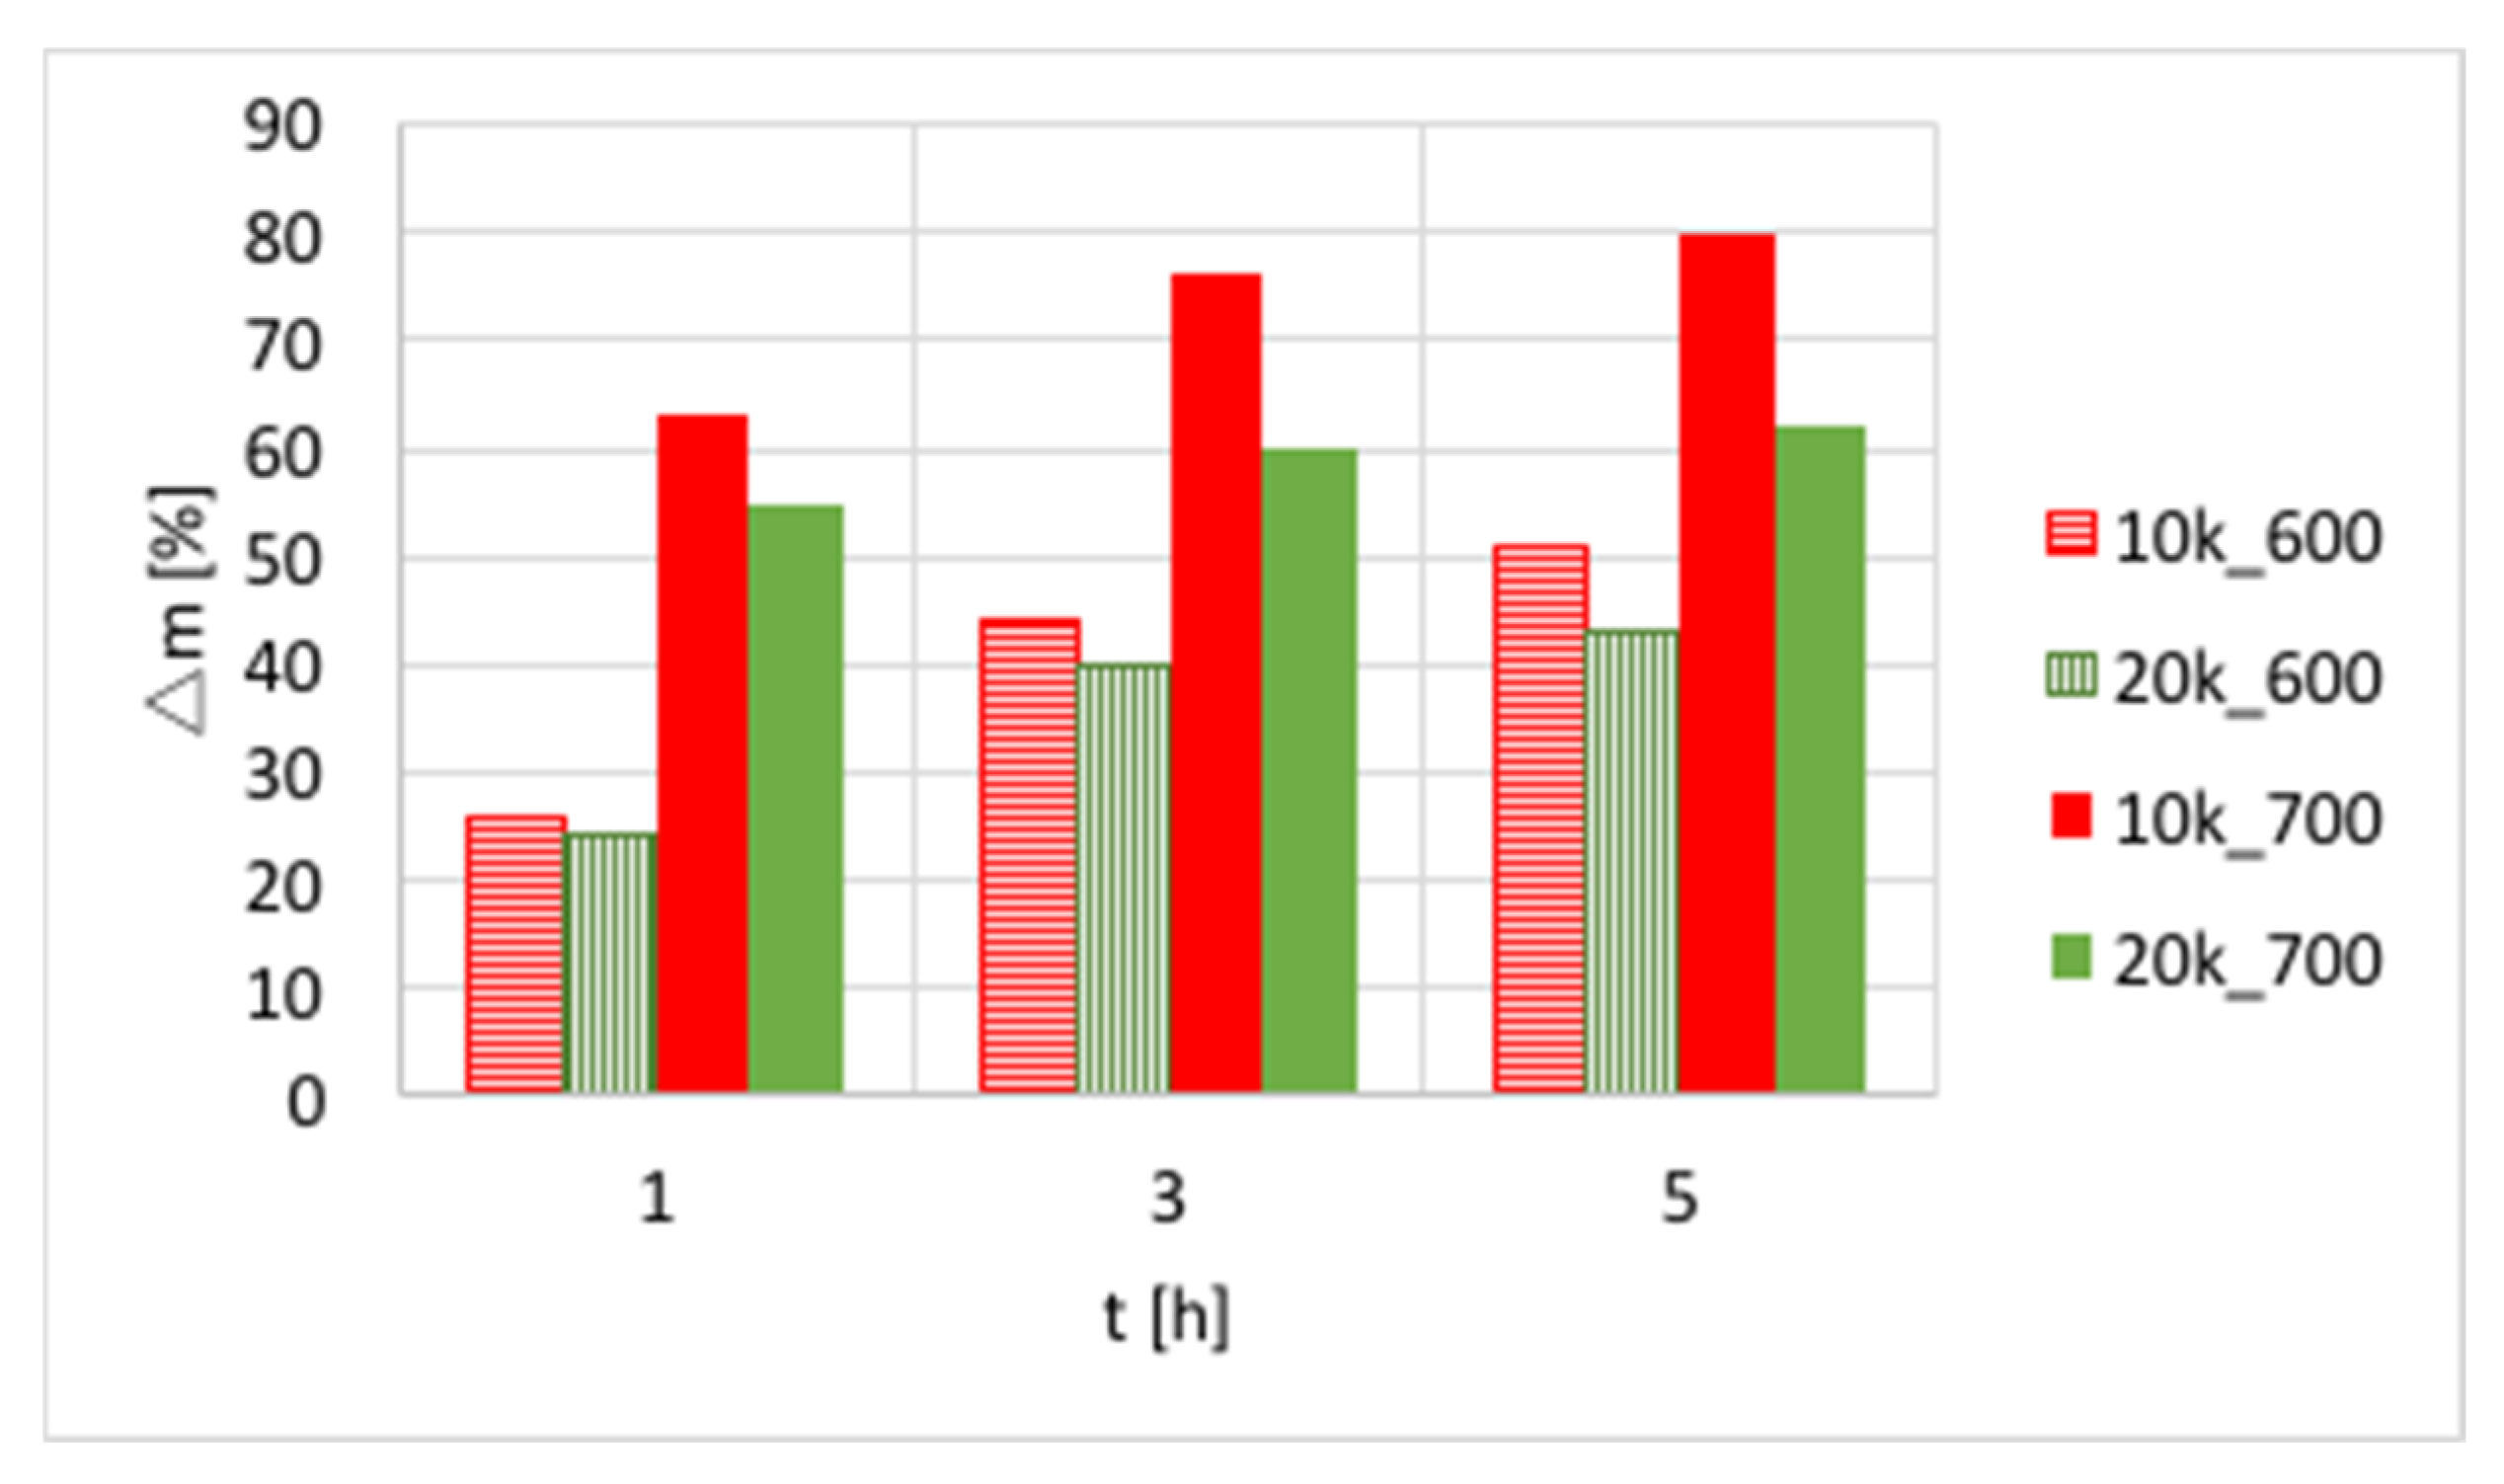
The influences of temperature (600 or 700 °C), test duration (1, 3, and 5 h) and GHSV (5000, 10,000 and 20,000 h−1) on the increase of catalyst mass are presented in Figure 3 and in Table S1. Again, a significant increase of carbon deposition was noticed after test prolongation from 1–3 h, and a less important change was observed when it was extended to 5 h. The amount of carbon deposit on Ni/CeZrO2 at 600 °C was significantly lower than at 700 °C. Moreover, the highest carbon deposition (51%) was observed for low GHSV values. However, low values of GHSV favor the formation of coke.
After the tests, the carbon deposit was separated from the catalyst. Unfortunately, complete separation of carbon deposit from the catalyst is impossible because there will always remain coke on the catalyst surface, whereas removed carbon fraction will contain small particles of the catalyst. The growth of CNTs on Ni particles often causes metal detachment from the support.
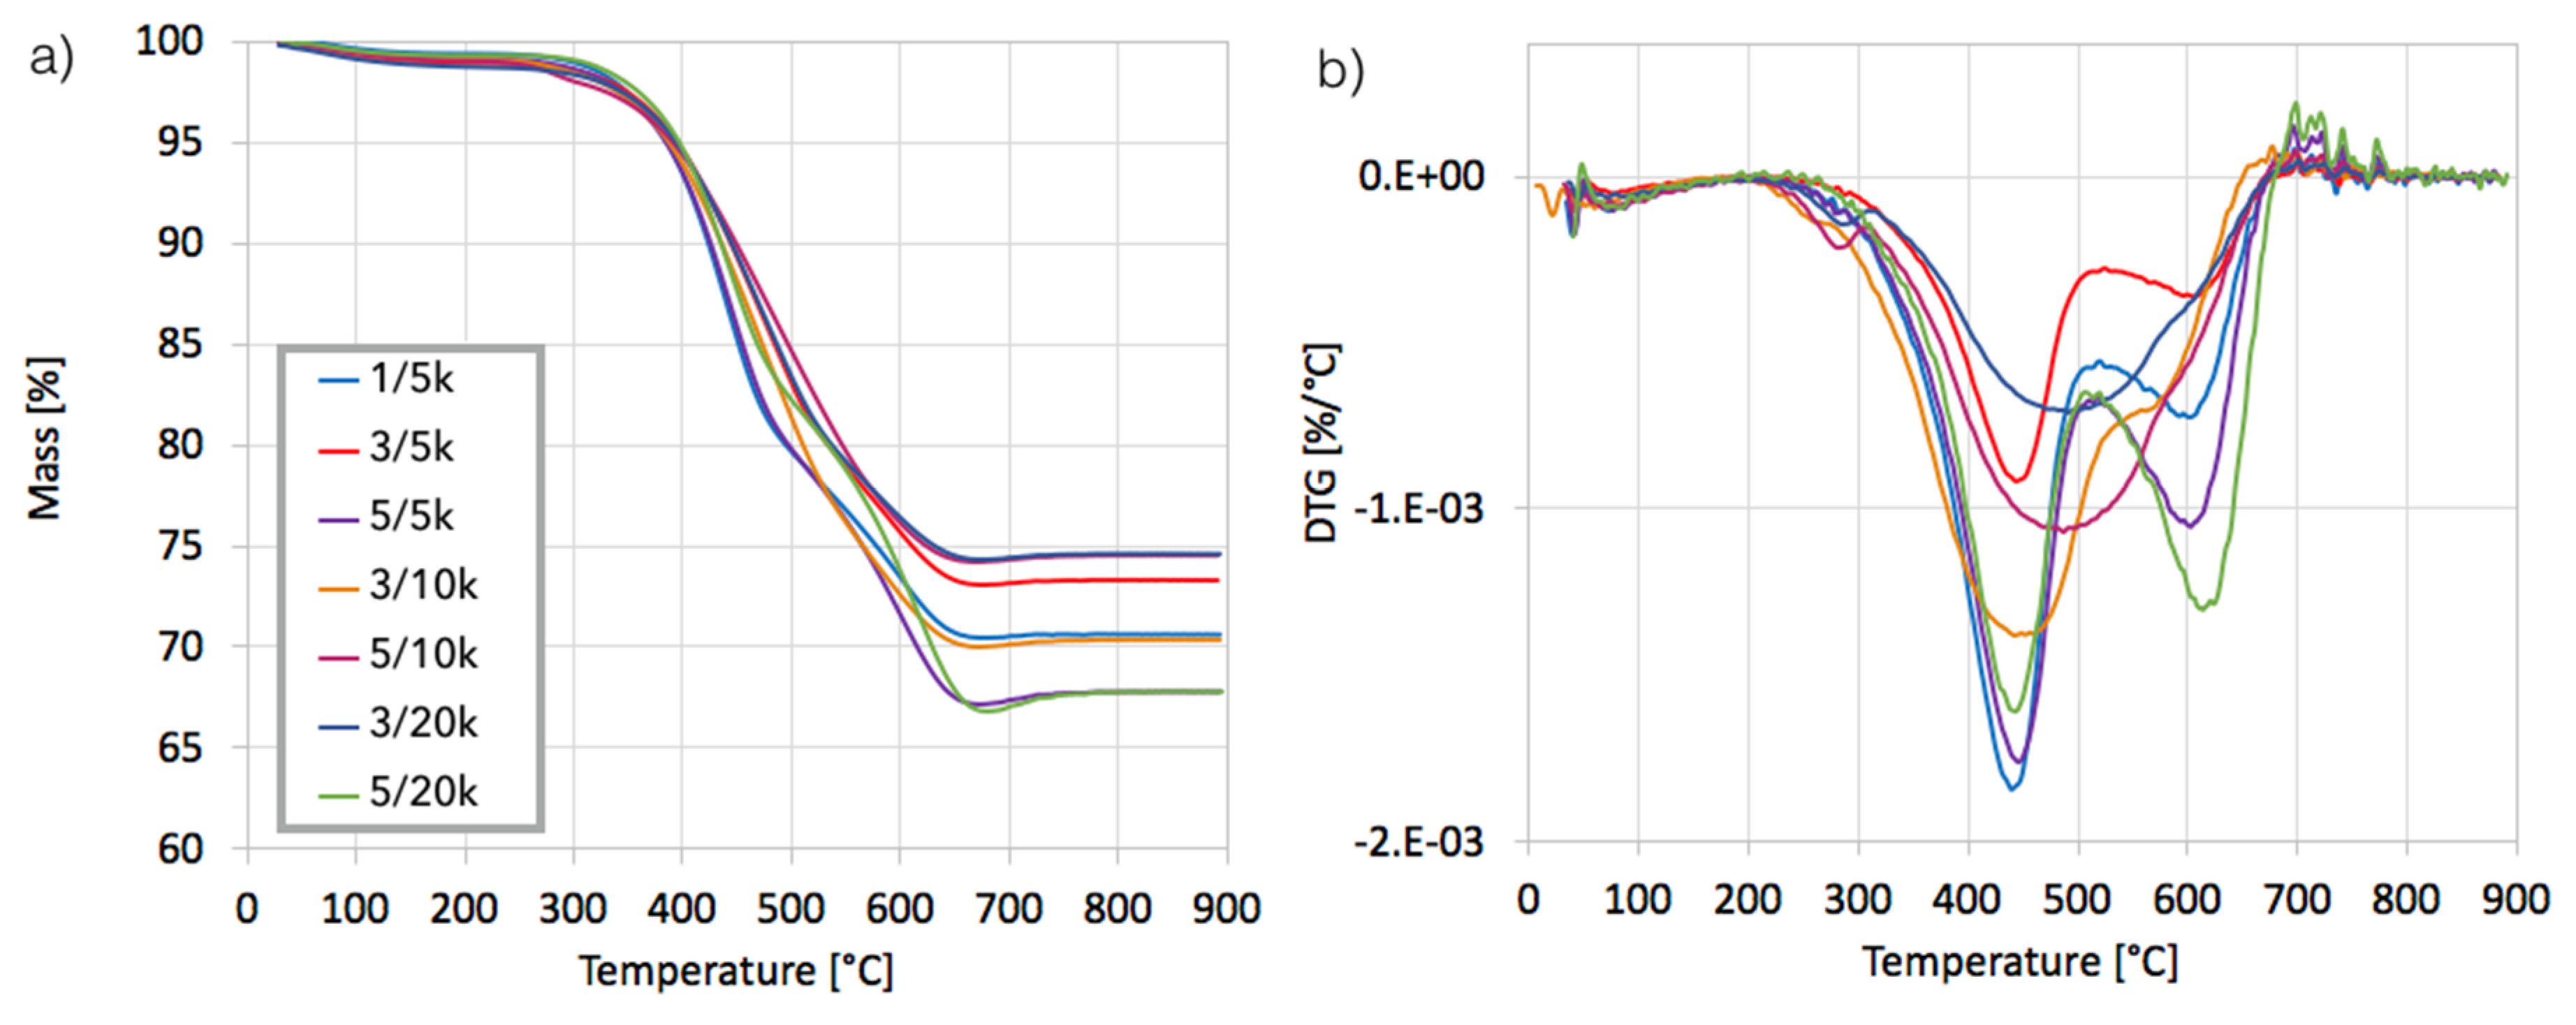
After separation, the catalyst samples were subjected to TGA/DTG in order to determine the amount and the nature of remaining carbon deposit. According to TG plots (Figure 4a), Ni/CeZrO2 still contained from 24–32% of carbon, both the amorphous, which was oxidized with a maximum at 410 °C, and the structural, which was oxidized with a maximum at 580 °C (Figure 4b). It was found that the carbon deposit that was still present in the catalyst sample was composed in levels of 61–85% from the amorphous carbon and in 15–39% from the structural carbon. There was no relationship between the parameters of the CH4 decomposition and the amount of particular carbon type in the sample.
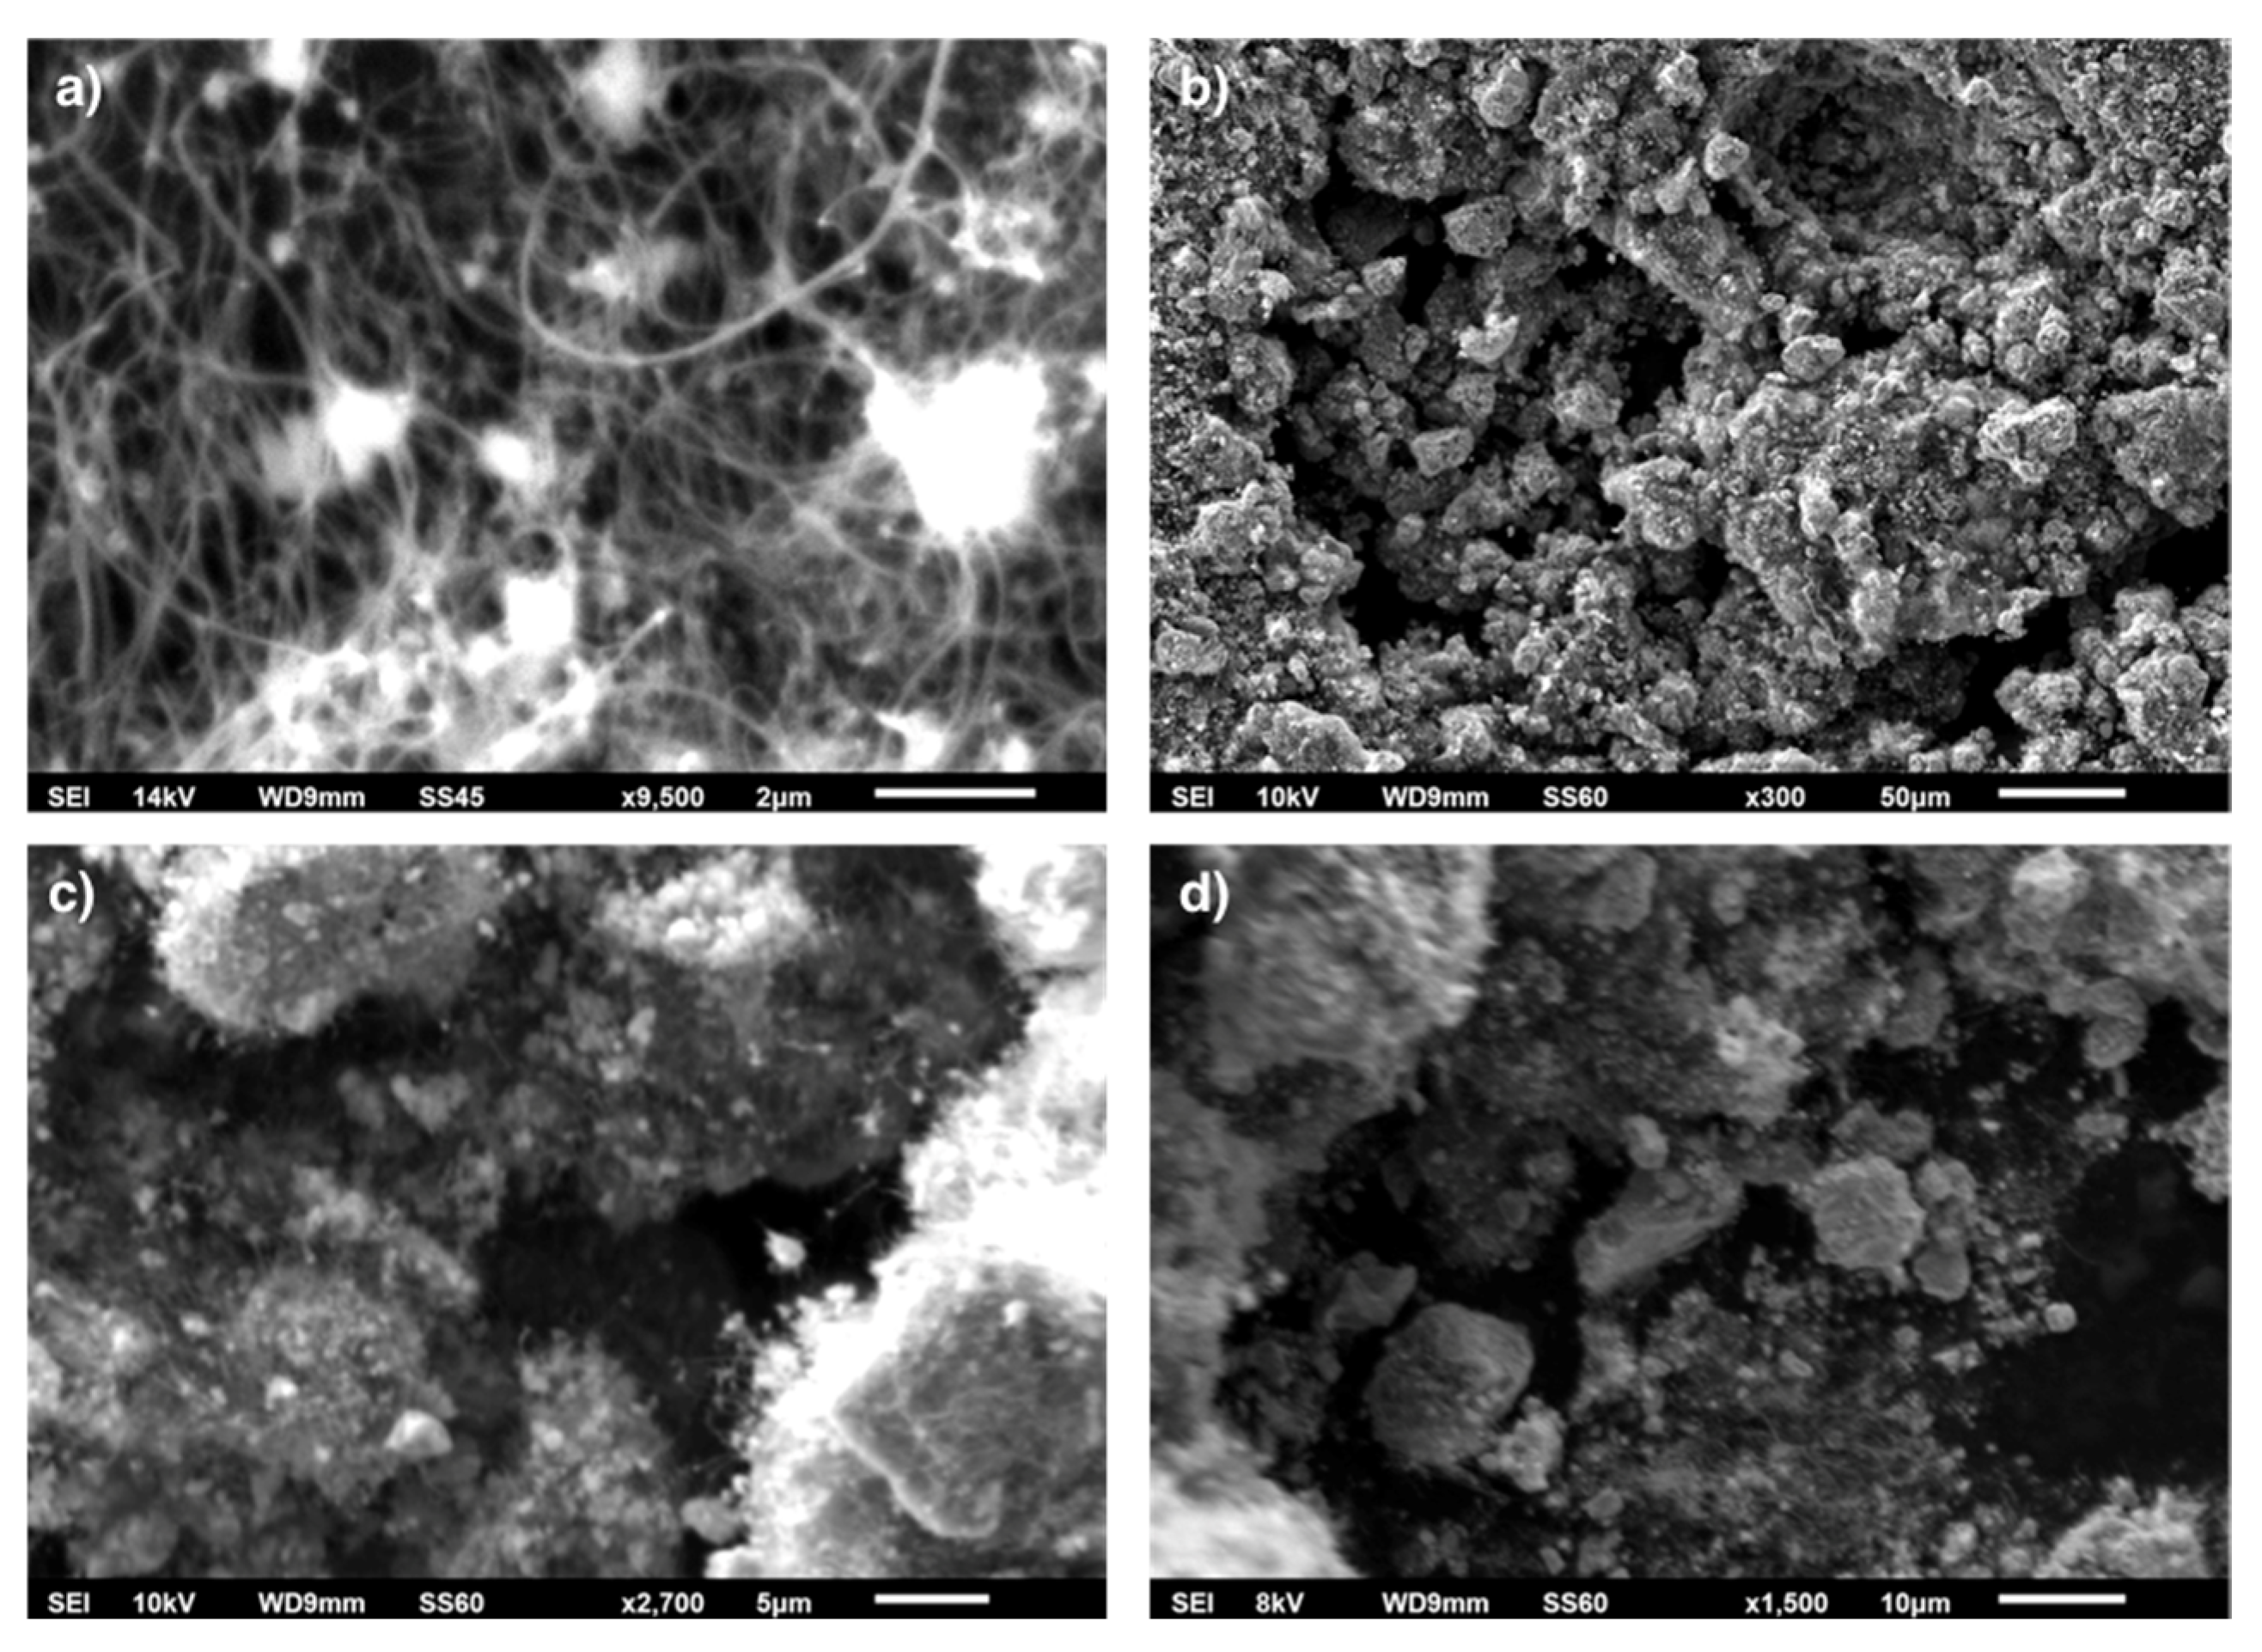
The Ni/CeZrO2 before and after CH4 decomposition was characterized using SEM/EDS. SEM pictures of spent catalyst are presented in Figure 5, whereas EDS analyses and mapping for Ni, Ce, Zr, and O for fresh and spent catalyst samples are shown in Figures S2–S6.
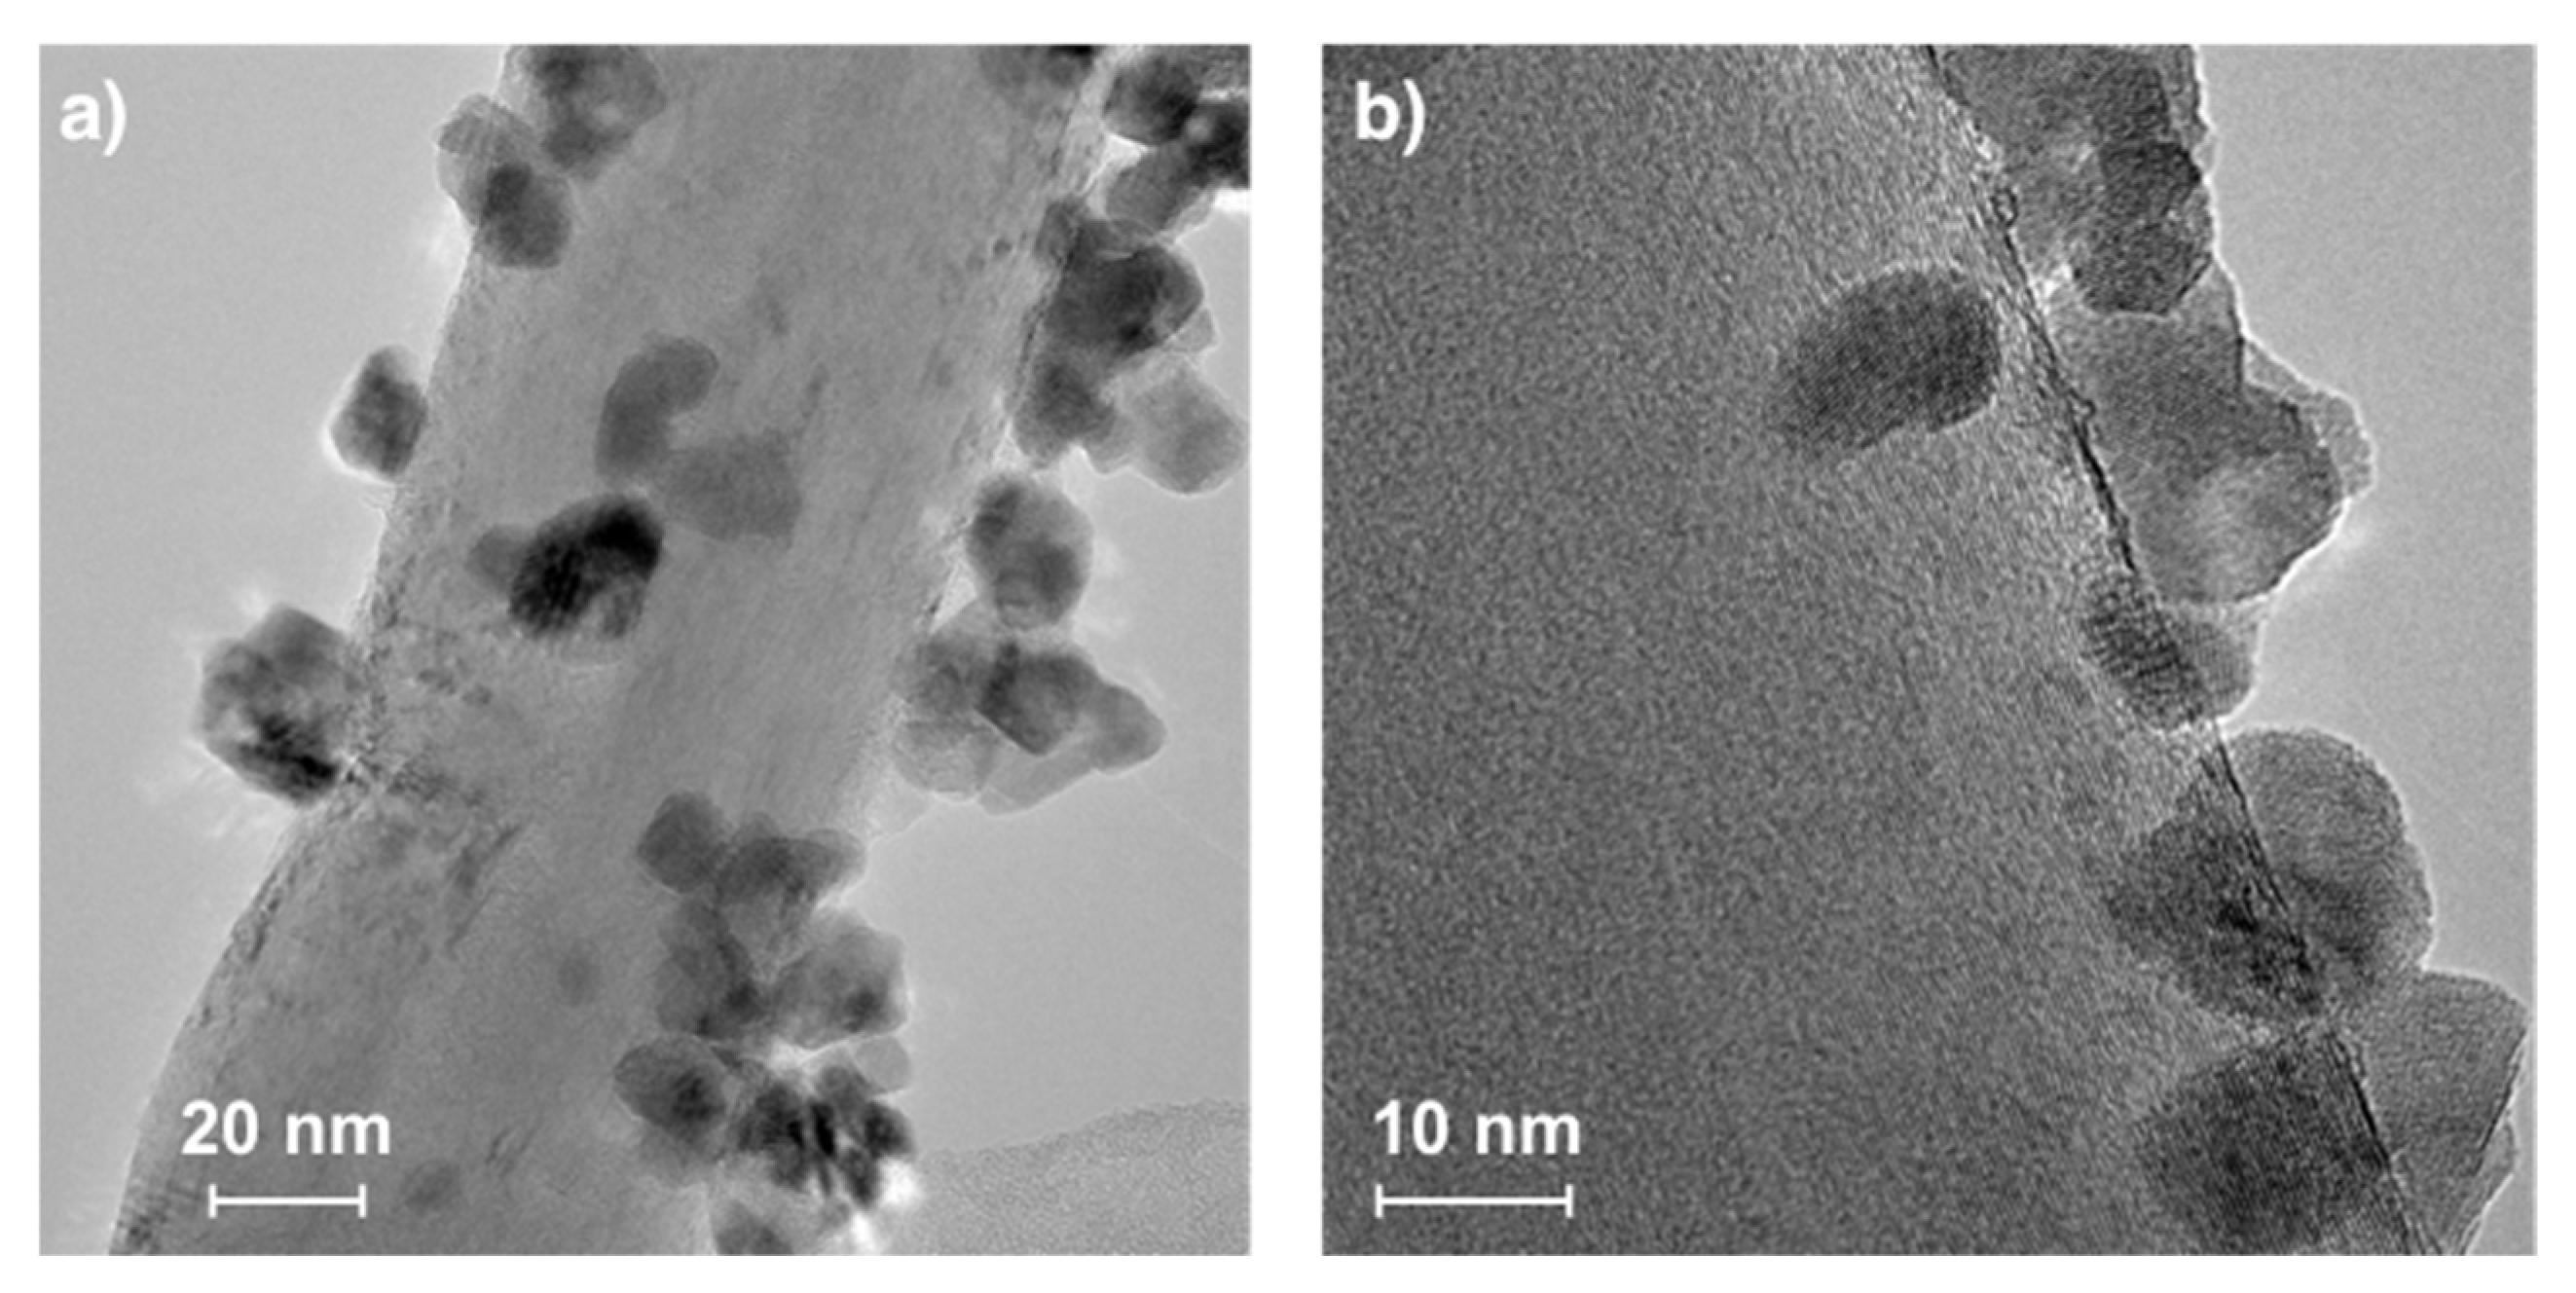
Microscopic observations of spent Ni/CeZrO2 catalyst proved the presence of randomly oriented and curved CNTs (Figure 5a). Presented in Figure 6, CNTs had outer/inner diameters of 64/6.3 (a) and 47/4.4 nm (b). The occurrence of CNTs in the catalyst sample after the separation process has also been noticed (Figure 5b). During formation, CNTs blew up the catalyst grains from the inside and broke them into smaller particles. Some of the catalyst particles, especially those that had attached to CNTs, percolate to the carbon fraction, which can be observed in Figure 5c,d. The EDS analysis (Figure S5) proved the presence of Ce and Zr in that sample, whereas mapping showed a good distribution of Ni, Ce, and Zr (Figure S6). Catalyst particles were not only covered loosely with CNTs or dispersed freely over CNTs, but as was observed by TEM (Figure 6), some of them were also strongly attached to external CNT walls (similarly to Ni/CeZrO2@CNT hybrid material obtained by deposition of Ni/CeZrO2 on functionalized CNTs [27]). The diameters of catalyst particles visible in Figure 6 ranged from 7–19 nm. The process of CH4 decomposition in a fluidized bed reactor leads to formation of such a hybrid material that can be further used as a catalyst, e.g., in WGS [27] or DRM (Figure S1) reactions. The content of Ni/CeZrO2 in the carbon fraction was about 35 wt.%, which was determined by burning the sample in air at 800 °C. From SEM, TEM, and TGA observations, it is obvious, that it is impossible to obtain a pure CNT fraction as a result of CH4 decomposition on Ni/CeZrO2. However, the fraction containing CNTs and the catalyst can be subjected to further processing with acids in order to remove catalyst particles, it or can be used as a catalyst itself, e.g., in the WGS [27] or DRM reaction.
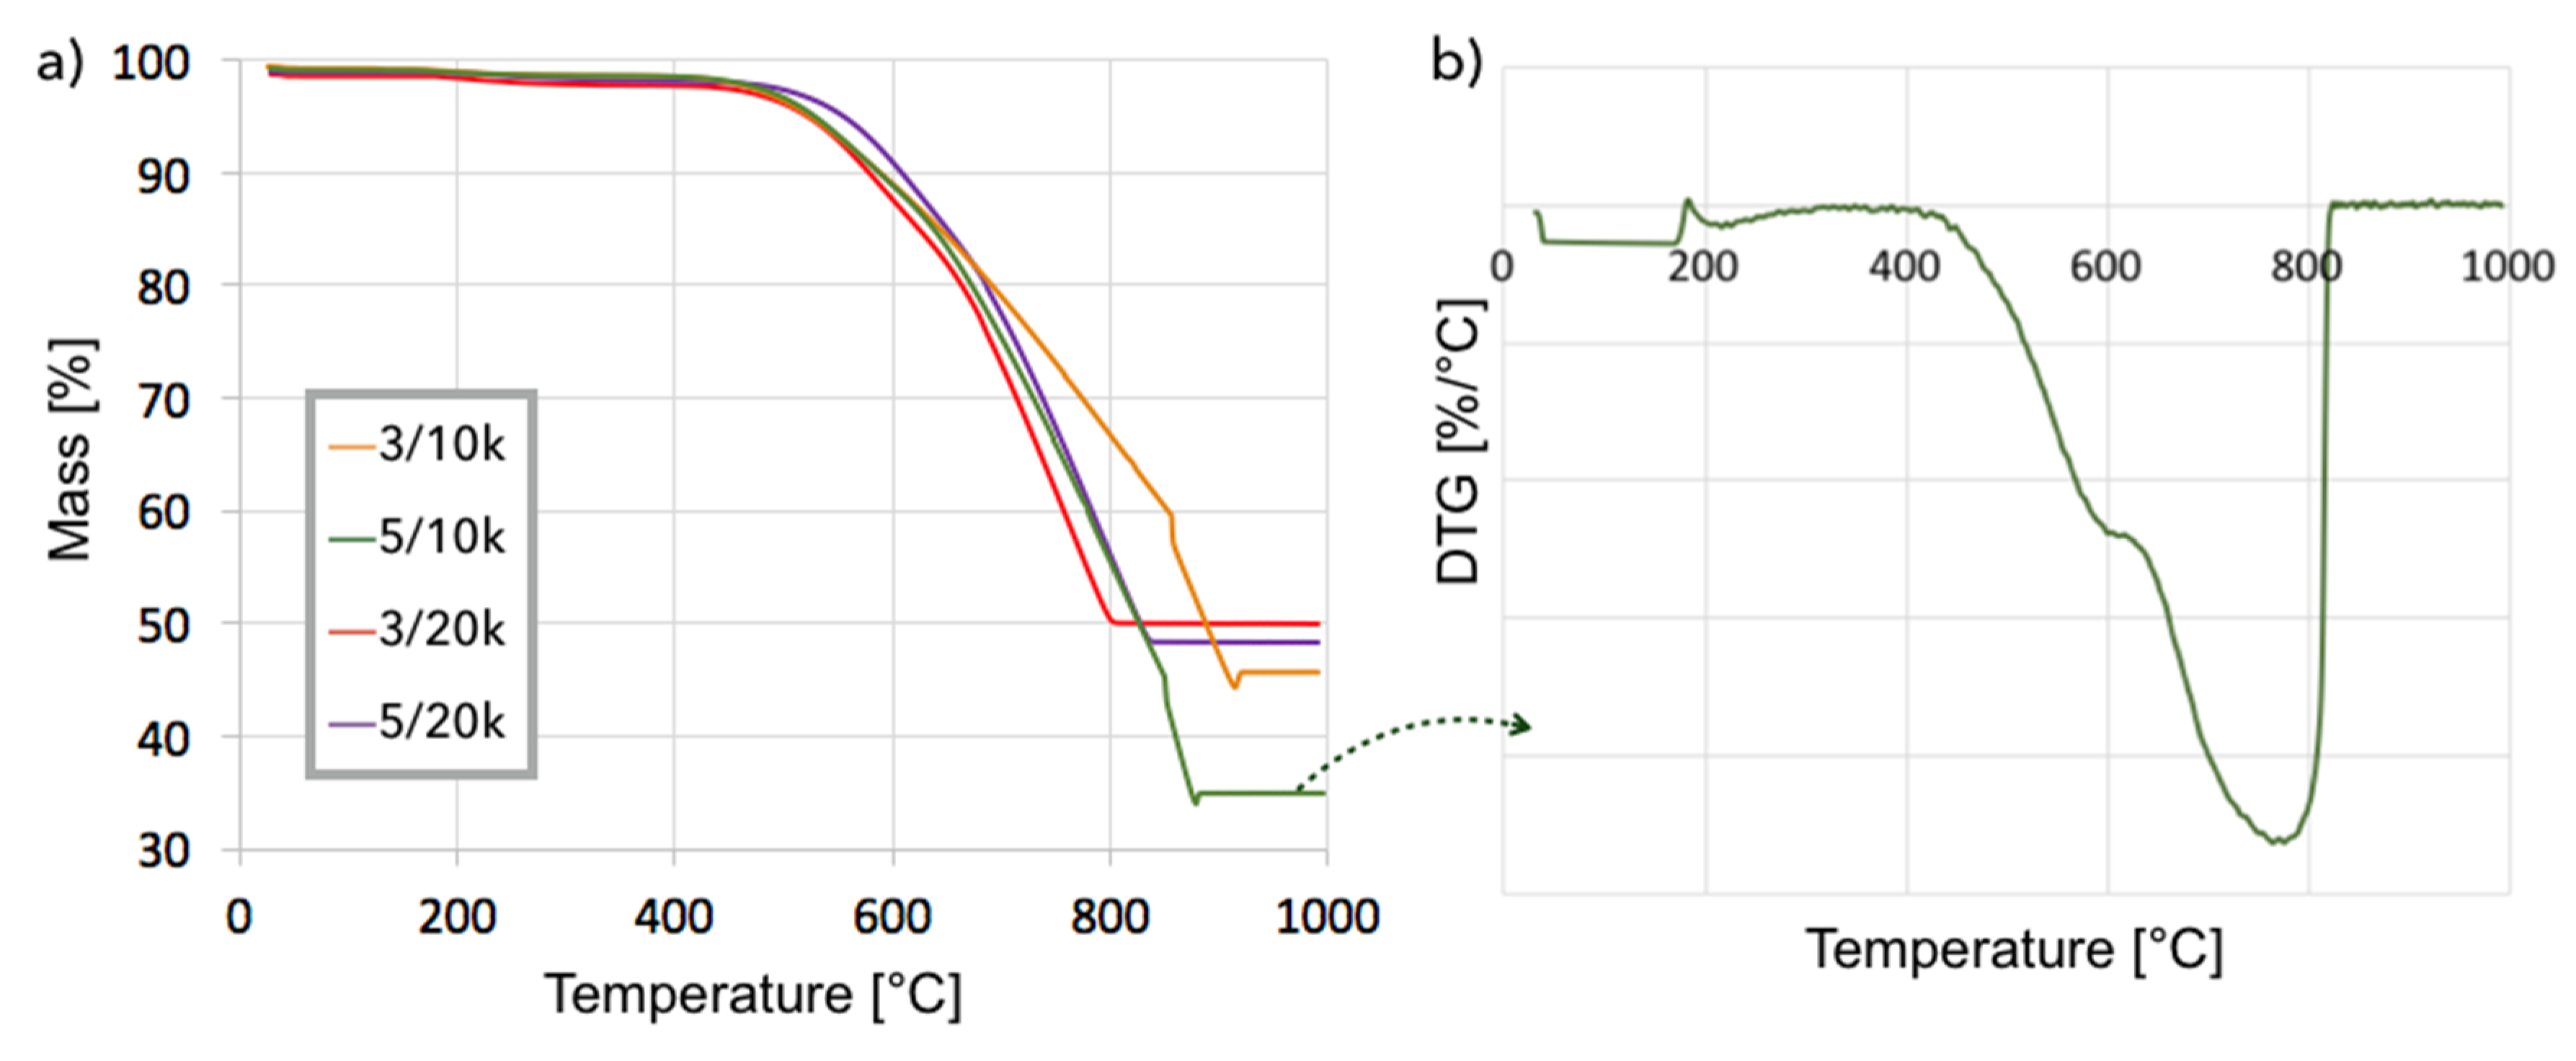
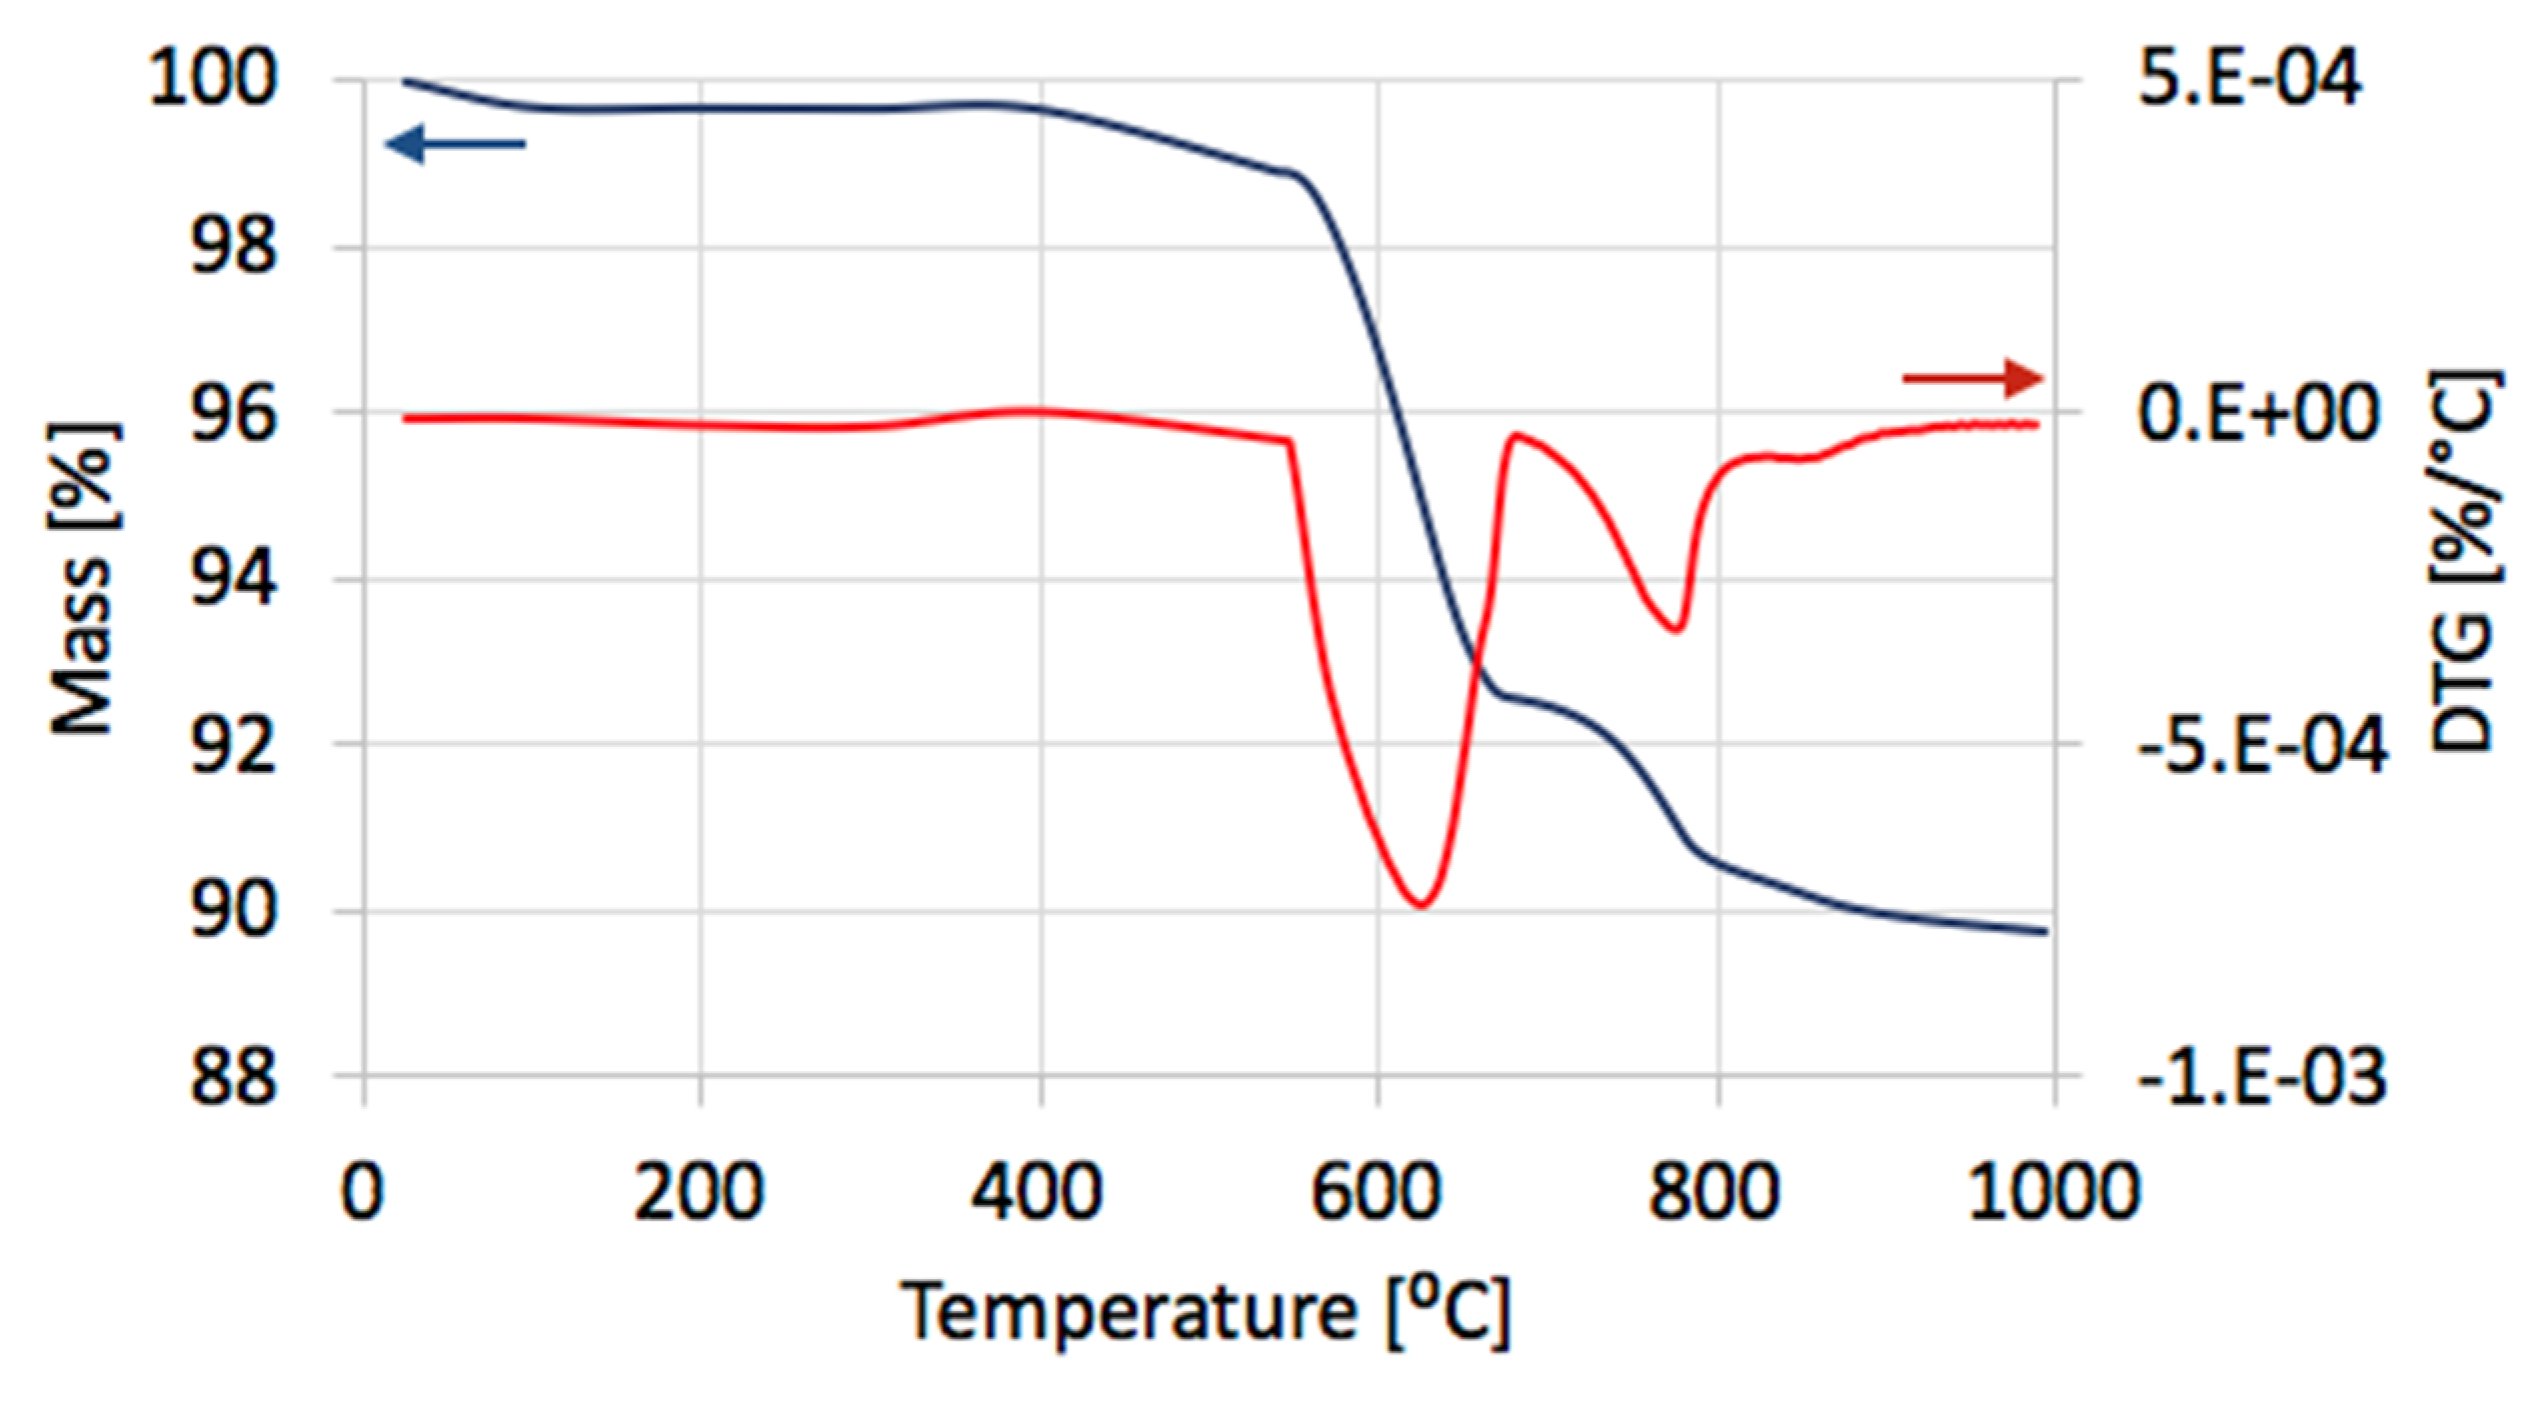
Ni-MgO: Methane decomposition in a fluidized bed reactor was also performed over Ni-MgO (0.125–0.2 mm fraction). The increase of catalyst mass owing to carbon deposition at different T and GHSV is presented in Figure 7 and Table S2. Significantly higher carbon deposition was observed at 700 °C, whereas an increase in GHSV negatively influenced carbon build-up. Similar to Ni/CeZrO2, the fastest increase in carbon deposition was observed during the first 3 h of the test. The TGA analysis for samples obtained at 700 °C (Figure 8a) showed that samples contained from 52–65% carbon, whereas the DTG plot for one of the samples (test: 5 h, GHSV = 10,000 h−1) indicated that it contained mostly structural carbon (negative peak at 770 °C). After the separation of carbon deposits, the Ni-MgO was also subjected to TGA/DTG (Figure 9), which revealed the presence of ca. 10% of carbon deposits, composed in 68% of the amorphous and in 32% of structural carbon. The separation process was significantly easier for Ni-MgO than for the Ni/CeZrO2 catalyst.
3.2. H2 Production during Decomposition of CH4
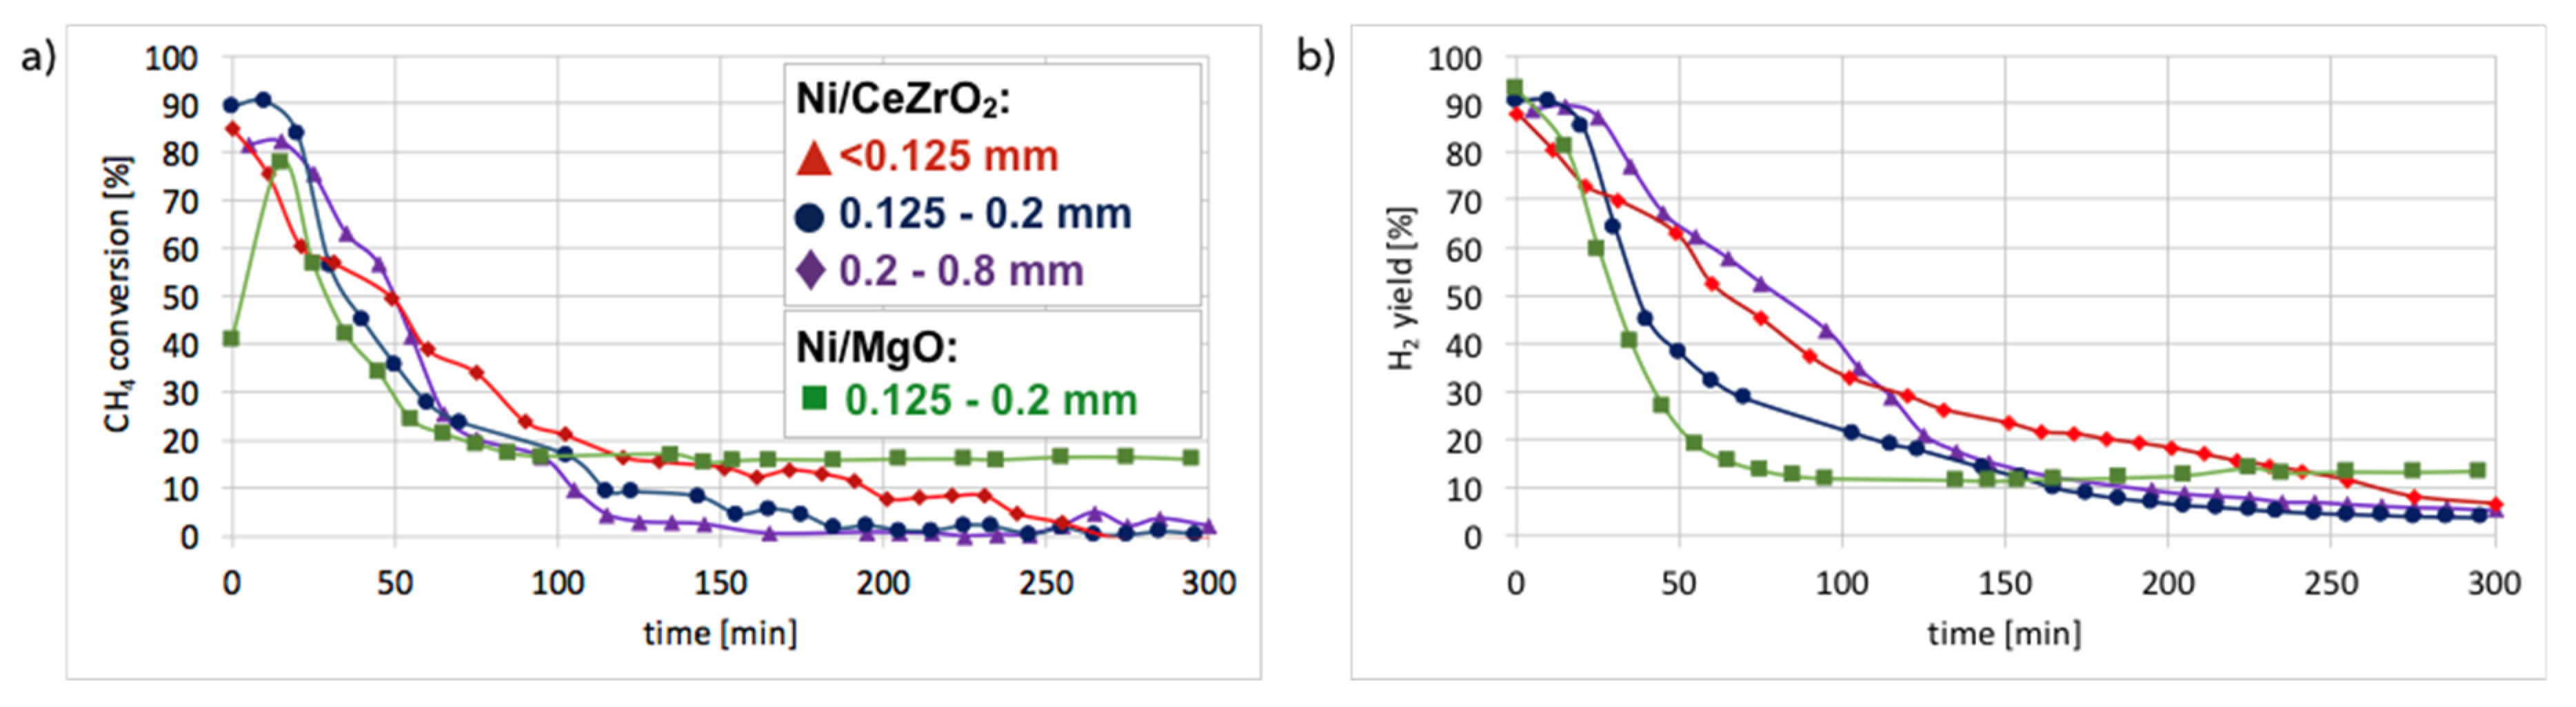
Hydrogen formation during CH4 decomposition in a fluidized bed reactor over Ni/CeZrO2 (three granulations—fractions A, B, and C) and Ni-MgO catalysts was studied during tests carried out at 700 °C for 5 h and at GHSV = 10,000 h−1. Neither CO2 nor CO was detected in the outlet gas during tests in the fluidized bed reactor which indicates that the reduction of catalysts with CH4 was very fast. Conversely, the formation of CO2 and CO was observed during tests carried out in a micro-reactor [28]. The composition of the gas at the outlet of fluidized bed reactor during tests of CH4 decomposition over Ni/CeZrO2 and Ni/MgO catalysts is presented in Figure S7, whereas CH4 conversions and H2 yields are displayed in Figure 10. It can be observed that in all cases, CH4 conversion and H2 yield were the highest in the first 20 minutes of test and then decreased rapidly. The best performance was noticed for fraction A (particle size < 0.125 mm), for which the highest carbon deposition was also observed (Figure 2).
The lowest CH4 conversion and H2 yield occurred for fraction C (0.2–0.8 mm), which also showed the lowest mass increase after the test. CH4 conversion was higher for Ni-MgO, but the H2 yield was higher for Ni/CeZrO2. However, Ni-MgO showed a more stable ratio of H2 yield to CH4 conversion (YH2/CCH4), which oscillated around 0.8 throughout the experiment (Figure S7). For Ni/CeZrO2, this ratio was stable during the first 60 minutes and then varied depending on the catalyst granulation. The lower stability of Ni/CeZrO2 (compared to Ni-MgO) is caused by very good red-ox properties of ceria-zirconia and high oxygen mobility in its lattice. The most stable YH2/CCH4 ratio was observed for fraction A of Ni/CeZrO2 (<0.125 mm), whereas for fraction C (0.2–0.8 mm) H2 yield was much higher than CH4 conversion. The stoichiometric YH2/CCH4 ratio for CH4 decomposition is 2, whereas its value on the Ni/CeZrO2 catalyst was sometimes significantly surpassed. High H2 yield compared to CH4 conversion could be caused by the accumulation of CH4 or products of its partial dehydrogenation (CHx) on the catalyst surface earlier during the experiment, followed by higher H2 release to the gas phase after some time. It seems that the bigger the catalyst grains, the more CH4 (or CHx) was trapped in the first hour of the experiment. The YH2/CCH4 < 2 may be explained by CHx formation on the catalyst surface; thus, the H2 release to the gas phase was lower.
It was calculated that 3.94 dm3 of CH4 was consumed and 7.79 dm3 of H2 was produced during that test over Ni/CeZrO2 (0.125–0.2 mm), so the H2/CH4 ratio was 1.97 (very close to the stoichiometric H2/CH4 ratio of 2). Slightly different CH4 consumption and H2 production were noticed for Ni-MgO (respectively, 4.33 and 7.35 dm3). The Ni-MgO showed higher carbon deposition than Ni/CeZrO2 and more important CH4 consumption, but it also contained more Ni. Table S3 shows the number of CH4 moles consumed and the number of H2 moles produced over 1 Ni mol. It can be observed that the performance of Ni/CeZrO2 is significantly better than Ni-MgO.
3.3. H2 Production during Catalyst Regeneration with H2O
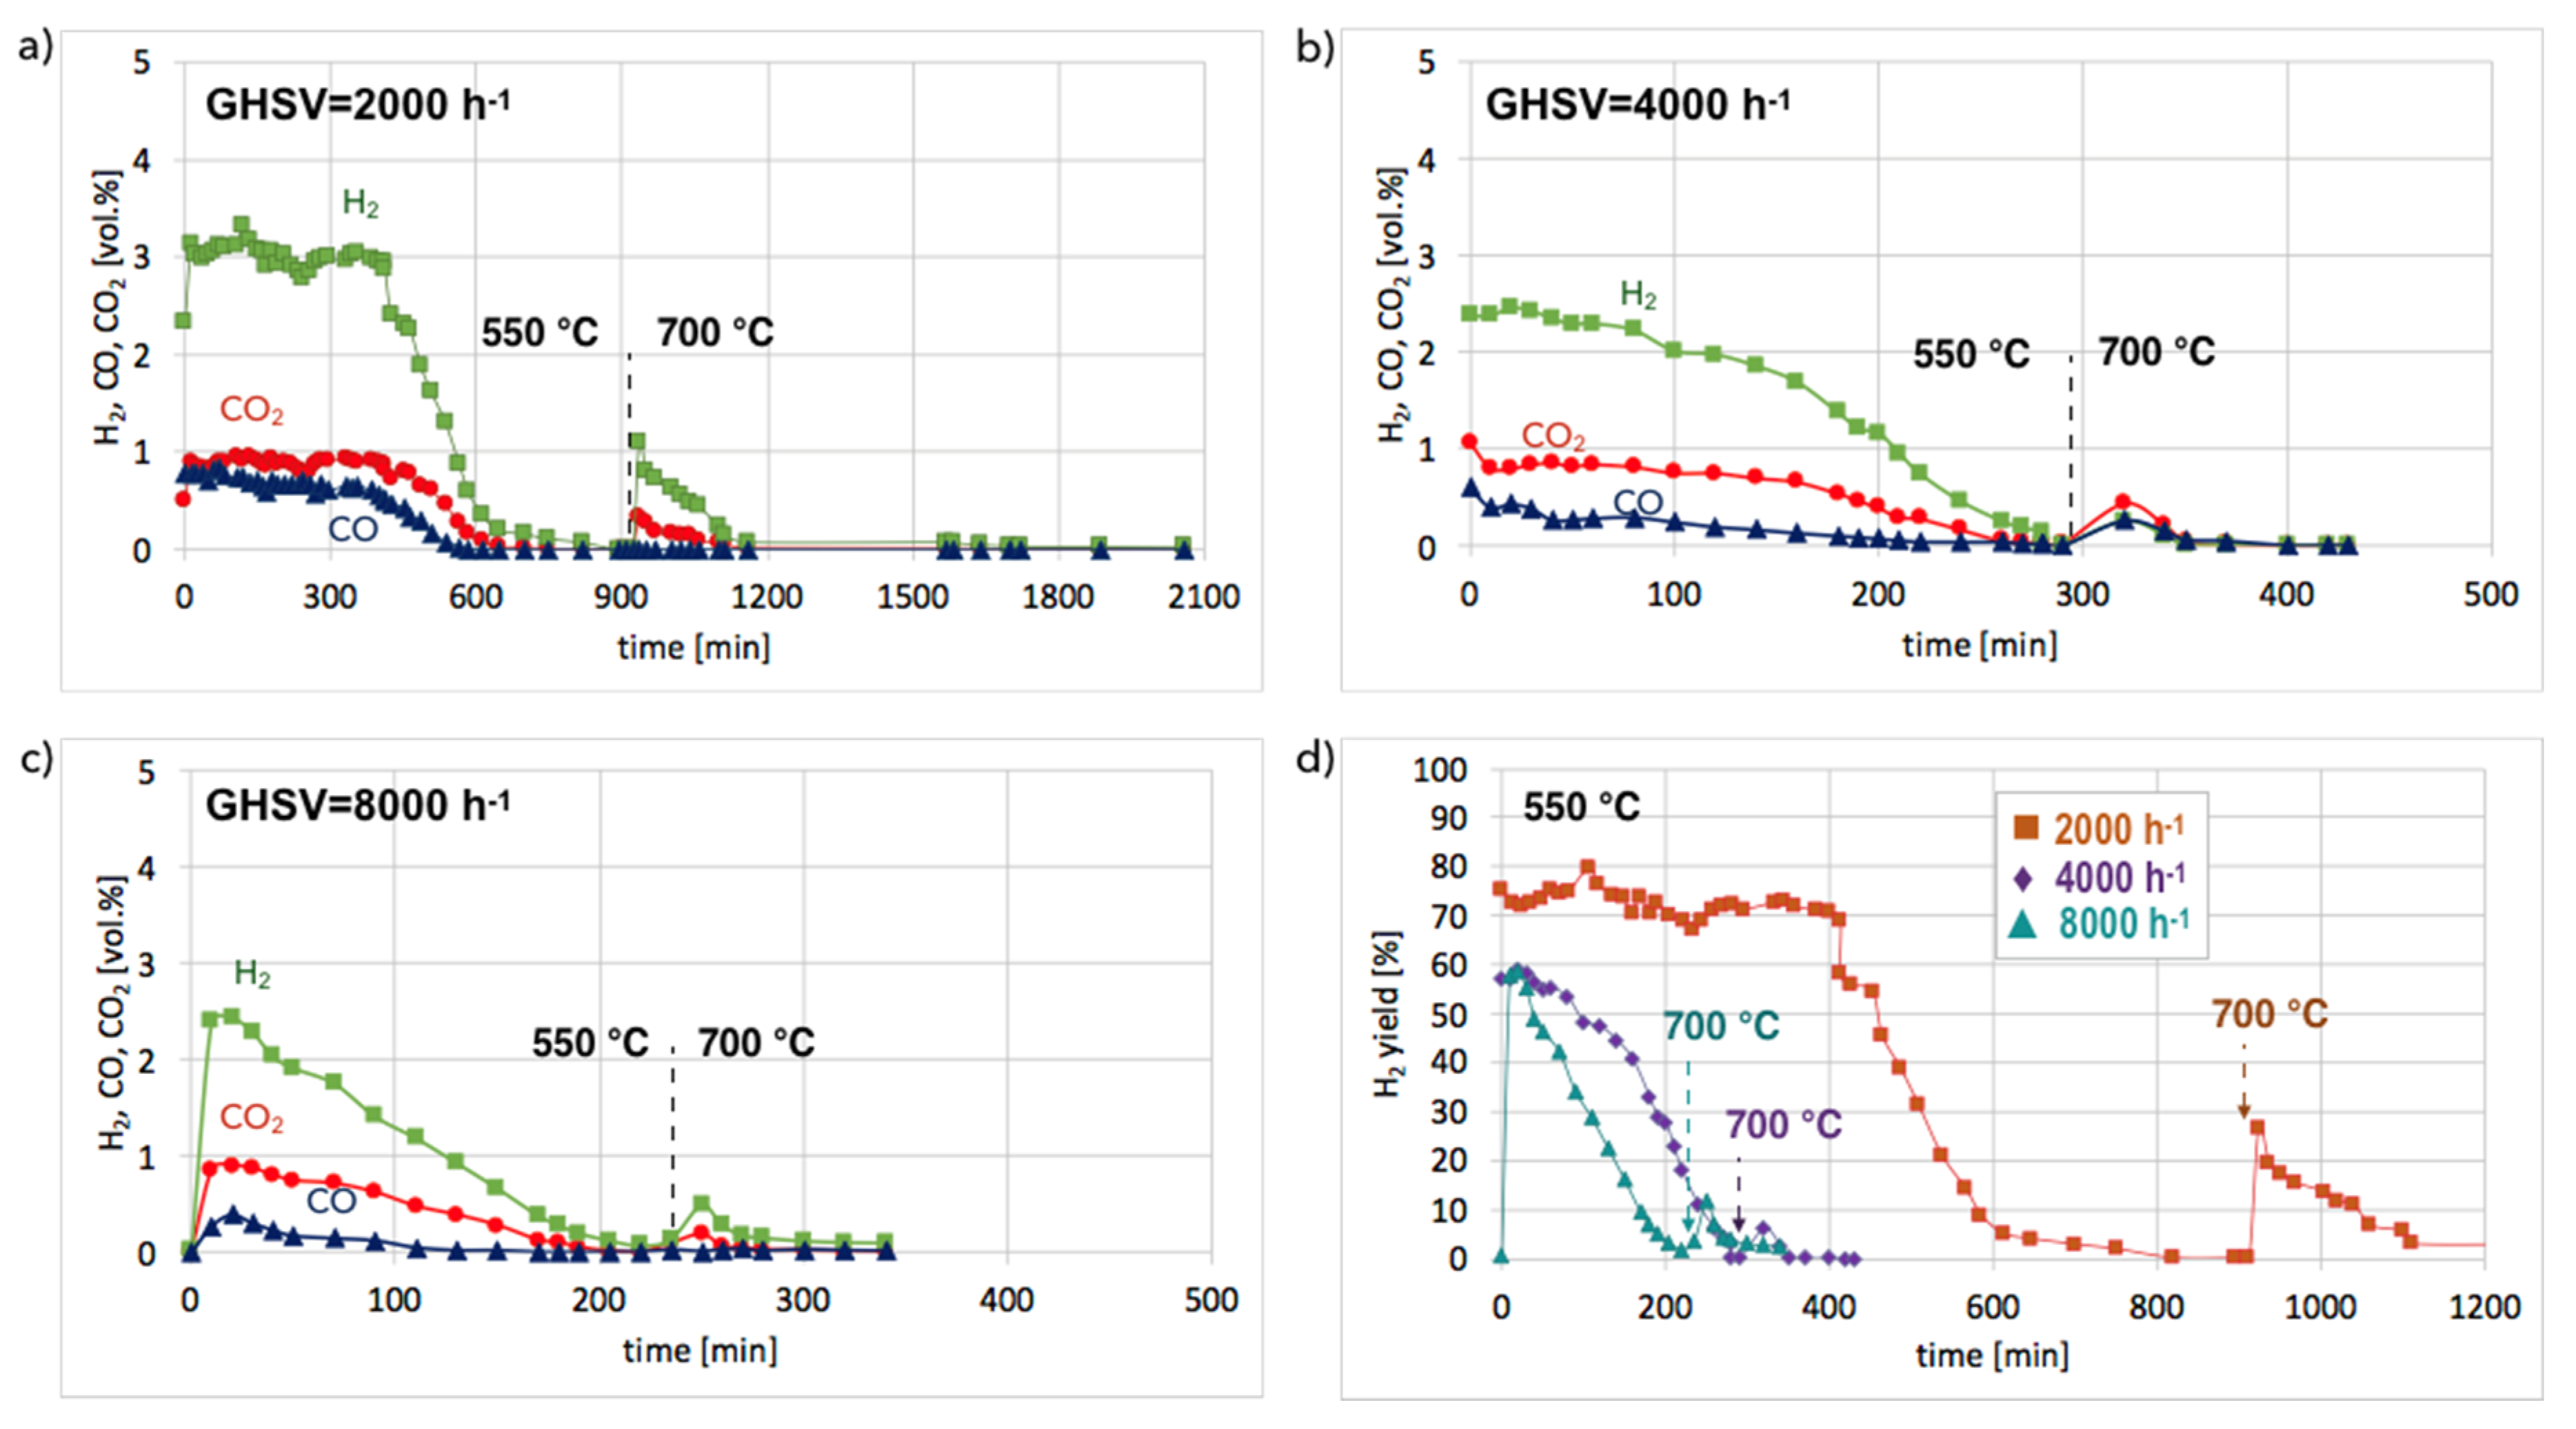
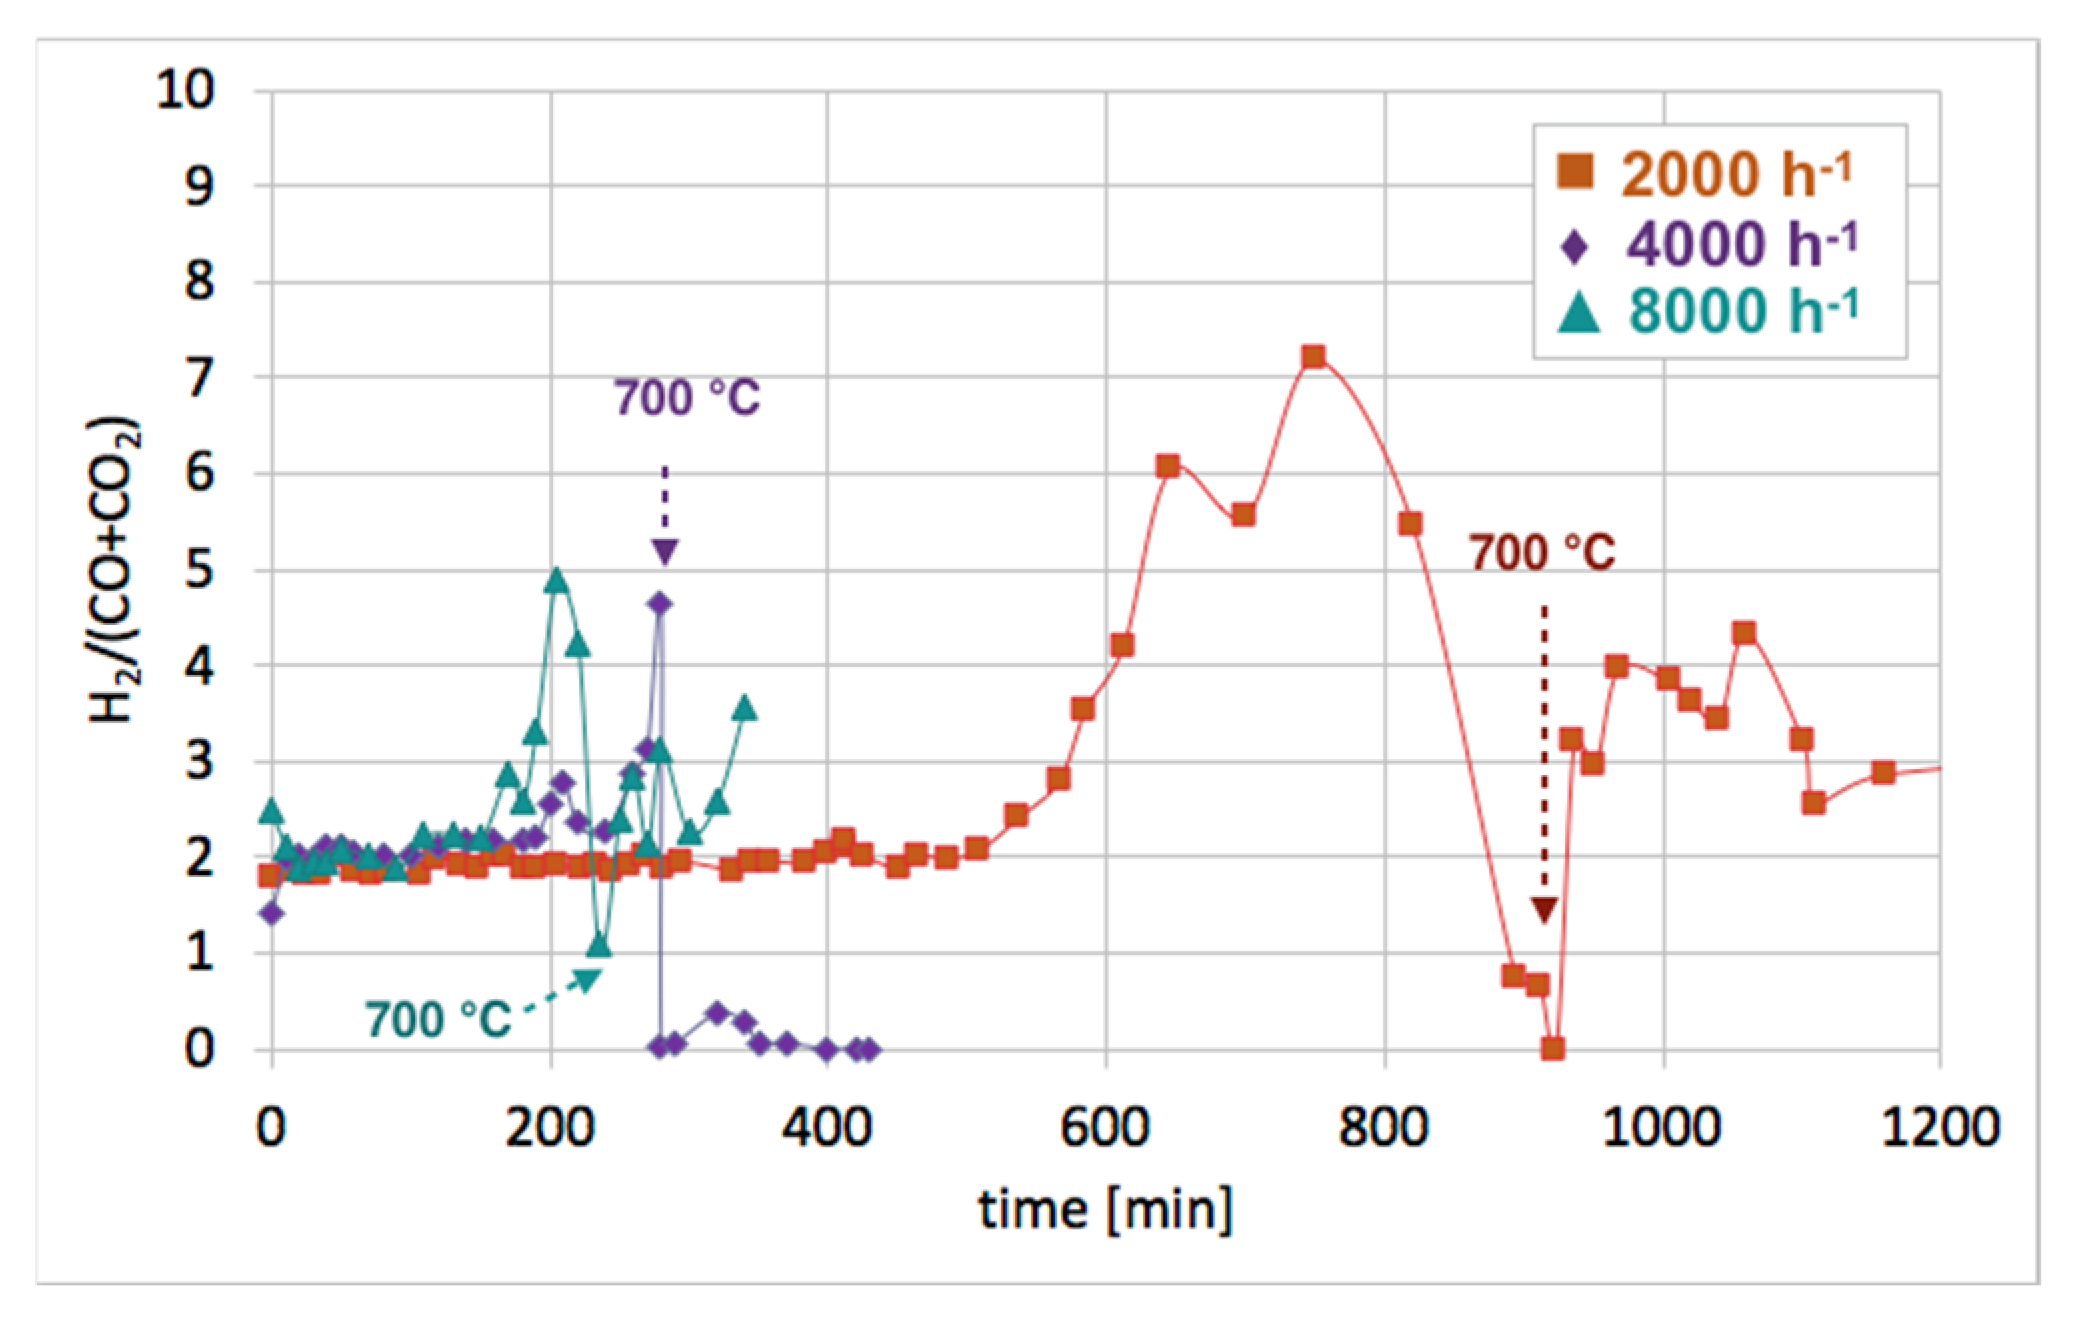
Ni/CeZrO2: The Ni/CeZrO2 catalyst after separation of the carbon deposit was regenerated in flowing 4.15 vol.% H2O/Ar in temperature-programmed conditions in a micro-reactor (discussed in the supporting file, Figures S9 and S10) and in isothermal conditions in a fluidized bed reactor (Figure 11). According to the results of tests carried out in temperature-programmed conditions, the lowest temperature for catalyst regeneration with the highest H2 formation is ca. 550 °C. Hence, the Ni/CeZrO2 after CH4 decomposition (at 700 °C/3 h) and separation of carbon deposits was subjected to regeneration in flowing 4.15 vol.% H2O/Ar at three GHSV values, i.e., 2000, 4000, and 8000 h−1 at 550 °C. When CO and CO2 stopped being formed, the temperature was increased from 550–700 °C in order to oxidize less reactive carbon deposits that could still be present on the catalyst surface. Regeneration of Ni/CeZrO2 was the longest and occurred with the highest H2 formation when the GHSV value was the lowest, i.e., 2000 h−1. Formation of H2, CO, and CO2 were constant for the first 400 minutes (6 h 40 min) of the test. The increase in GHSV to 4000 and 8000 h−1 resulted in shortening the time of H2, CO, and CO2 formation to ca. 1 hour and 20 minutes, respectively. It was also observed that CO formation decreased with the GHSV increase.
No CO formation was observed after 650, 260, and 205 minutes of the test run for GHSVs 2000, 4000, and 8000 h−1, respectively, whereas H2 was still being produced. It can be assumed that after the oxidation of carbon deposits (evidenced by CO and CO2 desorption to the gas phase), H2O dissociated on Ni0 (oxidation of Ni to NiO) and oxygen vacancies in CeZrO2 (oxidation of Ce3+ to Ce4+). At low GHSV values, those reactions occurred at a higher rate, and H2 formation was longer than at GHSV = 4000 and 8000 h−1. The increase of temperature to 700 °C resulted in an immediate increase in H2, CO, and CO2, which was due to oxidation of less reactive carbon deposits, i.e., CNTs, that were still present on the catalyst surface, as was proved by TGA. This phenomenon was more pronounced in the case of the test carried out at GHSV = 2000 h−1, and the catalyst regeneration occurred for another 16 hours. Figure 12 shows the influence of GHSV on the H2/(CO + CO2) ratio during catalyst regeneration. It can be observed that when regeneration was carried out at 550 °C and reactive carbon deposits were being oxidized, this ratio was stable and close to 2, i.e., the stoichiometric value of H2/(CO + CO2), assuming that all CO underwent oxidation to CO2. The increase in this ratio above 2 speaks for H2 overproduction, which can be assigned to H2O dissociation on Ni0 and/or Ce3+. It was calculated that the H2 formation was coming mainly from the oxidation of the carbon deposits into CO2. The participation of this reaction in total H2 production increased with GHSV. For all GHSVs, some part of H2 was produced in reactions other than oxidation of carbon deposits (Equations (S5) and (S6)), i.e., in the H2O dissociation on Ni0 and/or Ce3+ (Equation (S1)). However, the participation of H2O dissociation on Ni0 and Ce3+ active sites decreased with increasing GHSV. For the test carried out at GHSV = 2000 h−1, about 19% of H2 was produced in that way (Table 1). At a low value of GHSV, H2 production increases significantly. As was shown in Table 2, about 74 dm3 of H2 was produced during catalyst regeneration at GHSV = 2000 h−1, whereas the increase of that value to 4000 and 8000 h−1 resulted in a drastic decrease in H2 formation to 3.8 and 1.4 dm3, respectively.
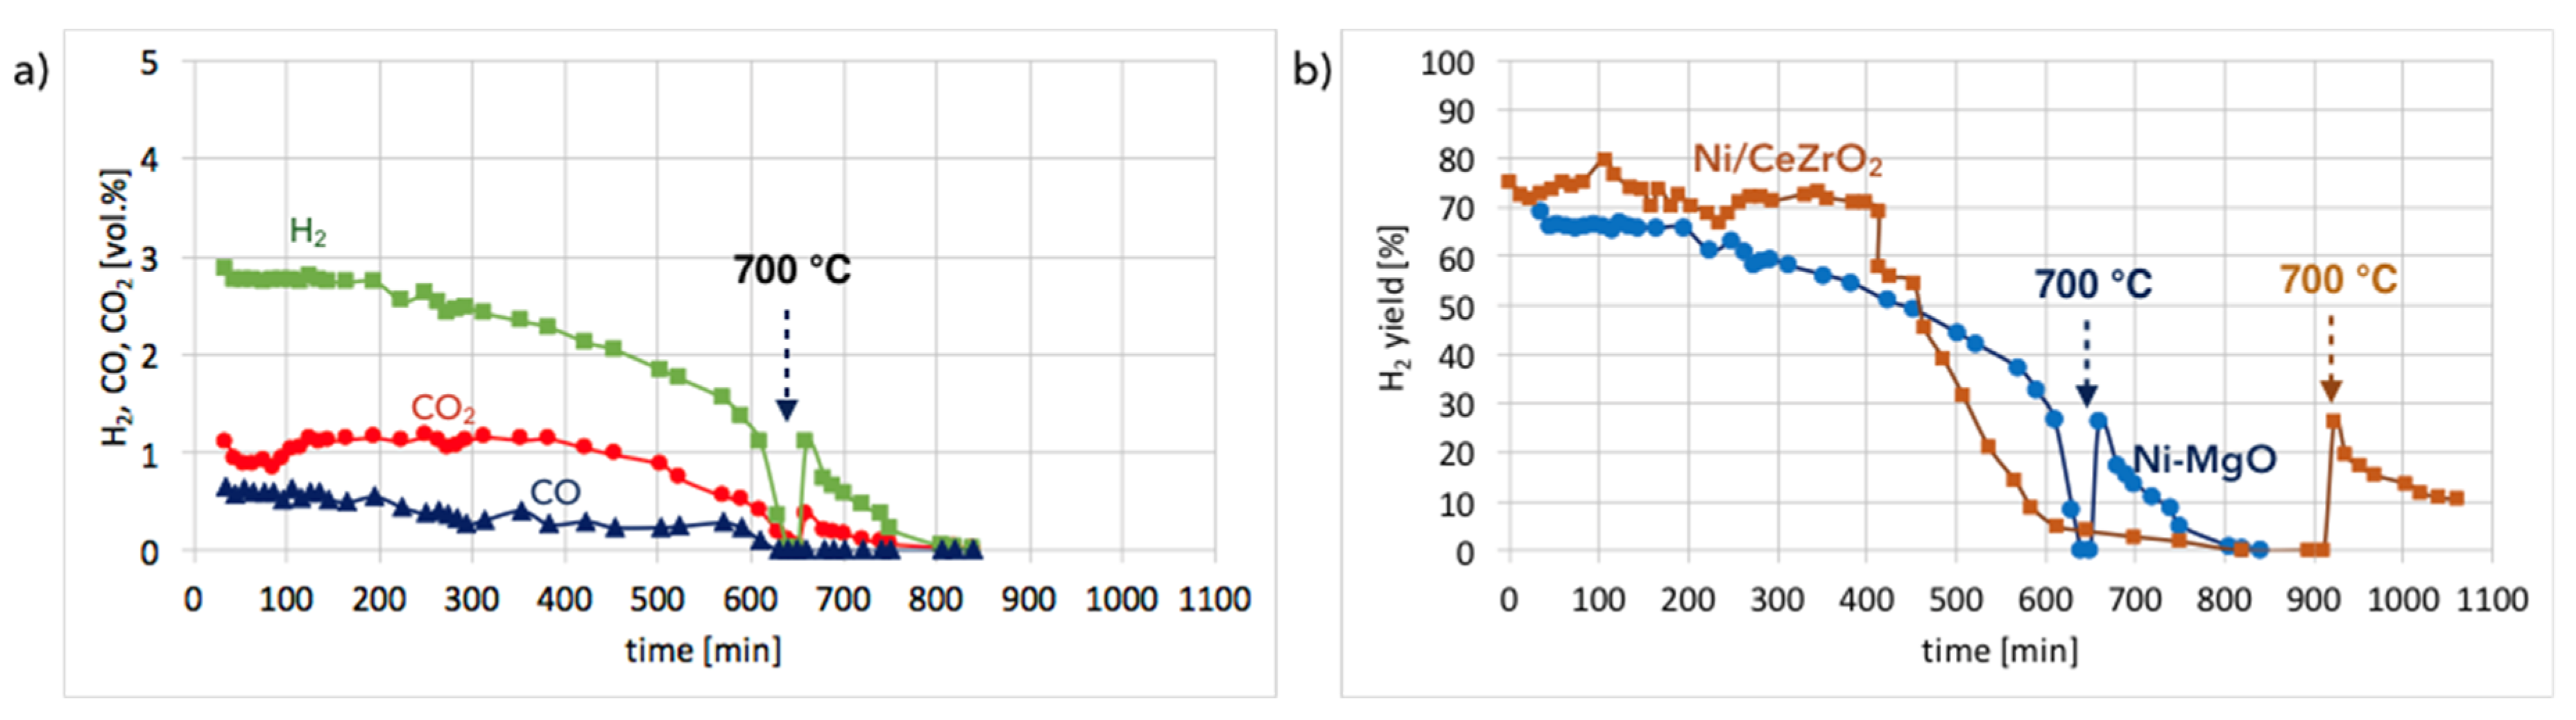
Ni-MgO:Figure 13a shows the gas composition on the reactor outlet during Ni-MgO regeneration. Stable H2 formation was observed during the first 200 minutes of the test run at 550 °C. Next it decreased slowly. After 10 hours, a sharp H2 decrease can be noticed. The temperature increase to 700 °C resulted in a rapid formation of H2, CO, and CO2, indicating that there was still structural carbon in the sample. Comparing H2 formation during the regeneration of Ni/CeZrO2 with Ni-MgO (Figure 13b), it can be observed that this process took longer for Ni/CeZrO2, which was due to the H2O dissociation on Ni0 and Ce3+. In the case of Ni-MgO, only the oxidation of Ni to NiO can take place after the removal of carbon deposits with H2O. However, the rate of that reaction is low at 550 °C. Within the first 200 minutes of the test run, the H2/(CO + CO2) ratio over Ni-MgO was only 1.7; thus, it was lower than for Ni/CeZrO2, which was 2. It was calculated that during the regeneration of Ni-MgO, about 74% of H2 was produced in the reaction of carbon oxidation to CO2, while 21% of H2 was produced in the reaction of CO oxidation. The remaining 5% was a result of H2O dissociation on Ni0 leading to its partial re-oxidation to NiO.
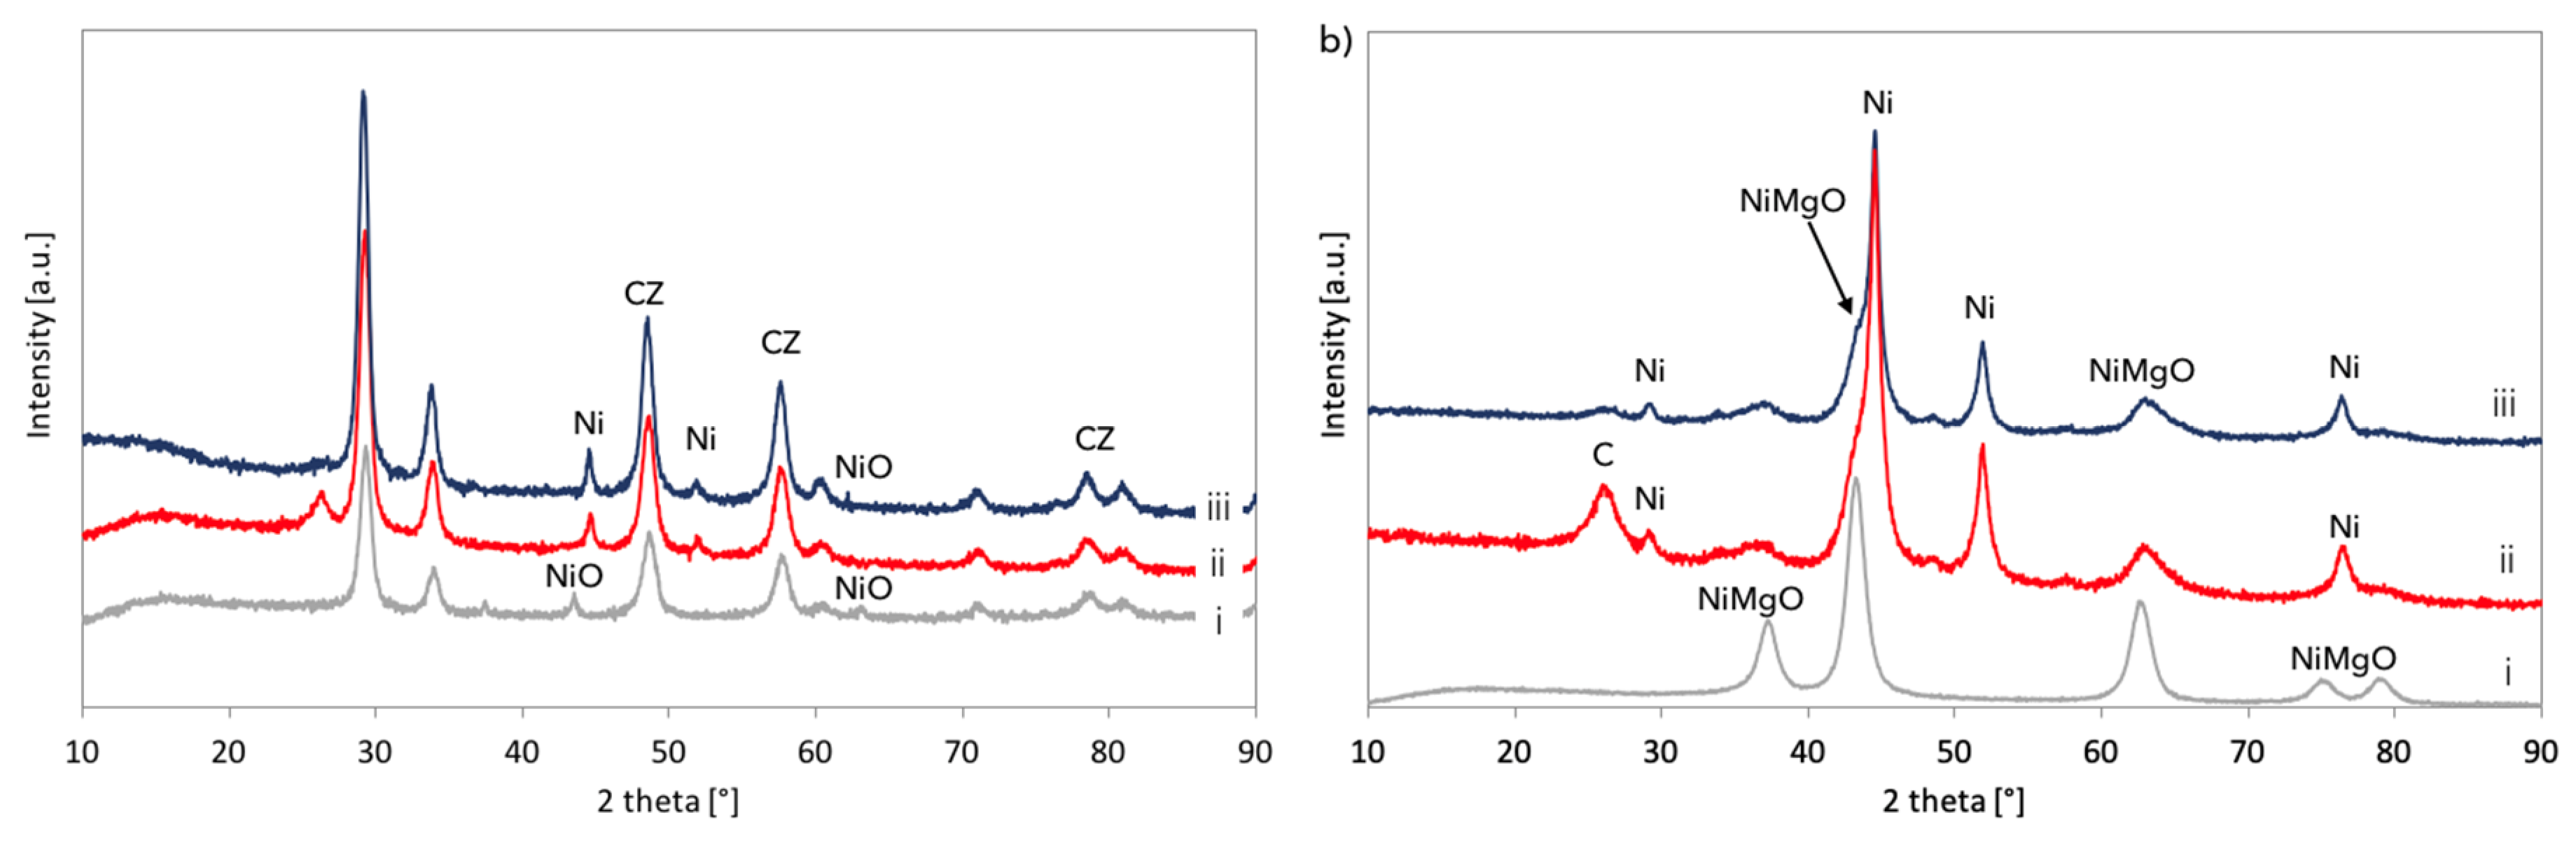
XRD analyses of fresh, spent, and regenerated Ni/CeZrO2 and Ni-MgO are presented in Figure 14. It was confirmed that both catalysts underwent a reduction in flowing CH4, and carbon deposits were formed (diffractograms (ii)). According to the outlet gas composition, regeneration of Ni/CeZrO2 and Ni-MgO was accomplished after over 34 and 14 hours, respectively. However, for both catalysts, a small intensity peak at ca. 26° indicating carbon presence is still observed on diffractograms (iii). Moreover, both catalysts were not re-oxidized after treatment with steam at 700 °C. Extended exposure of Ni/CeZrO2 to steam at high temperatures caused some increase of Ni and CeZrO2 crystallites size (Table 3) that were calculated from the Scherrer equation for reflexions at 44.6° (for Ni) and 29.3° (for CeZrO2). EDS analysis and mapping during SEM observations (Figures S11 and S12) showed a carbon presence in the Ni/CeZrO2 sample. As was measured by samples burning in air at 900 °C, the regenerated Ni/CeZrO2 and Ni-MgO still contained 10 and 23% of carbon, respectively.
3.4. CH4 Decomposition and Catalyst Regeneration with H2O in Cycles
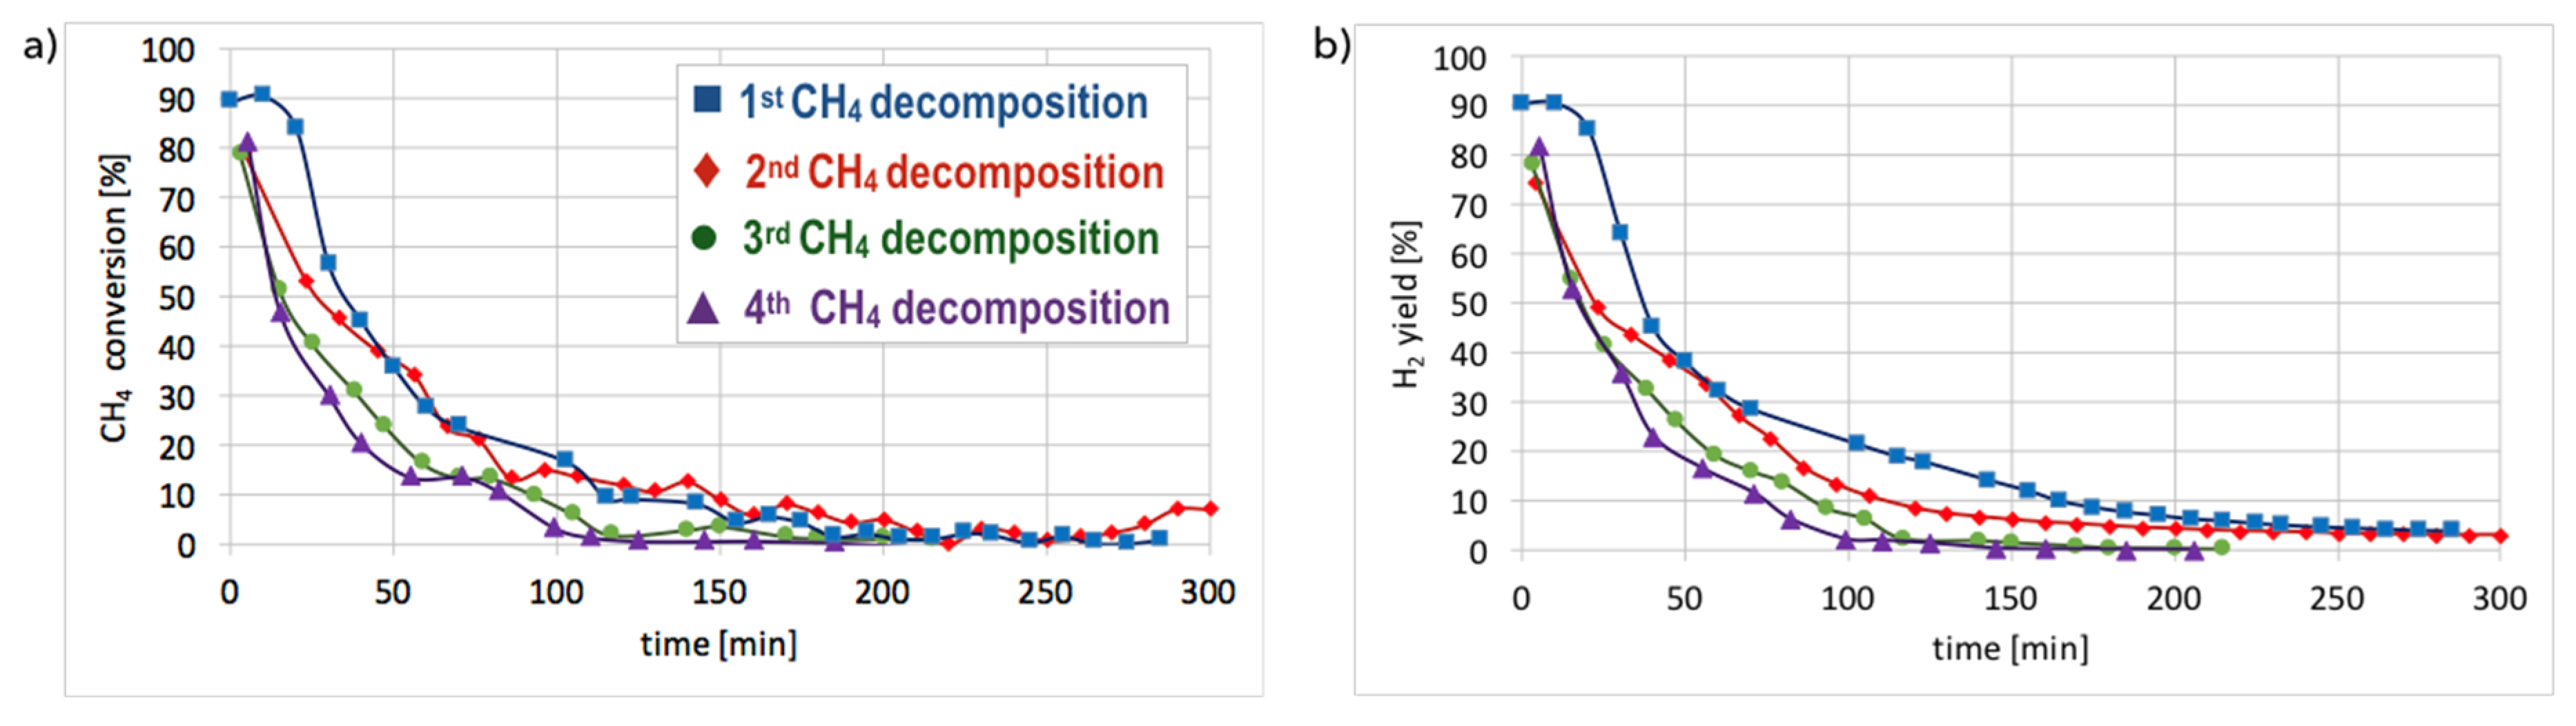
Cyclic tests of CH4 decomposition (at 700 °C for 5 h, GHSV = 10,000 h−1) followed by separation of carbon deposits and catalyst regeneration with H2O (at 550 and 700 °C, GHSV = 2000 h−1) were performed over Ni/CeZrO2 (0.125–0.2 mm). Conversions of CH4 and H2 yields during tests are presented in Figure 15. High H2 yields and CH4 conversions were observed at the beginning of each test, but the time of CH4 decomposition with H2 formation was shorter for each next test. Hence, the Ni/CeZrO2 deactivated faster in consecutive cycles.
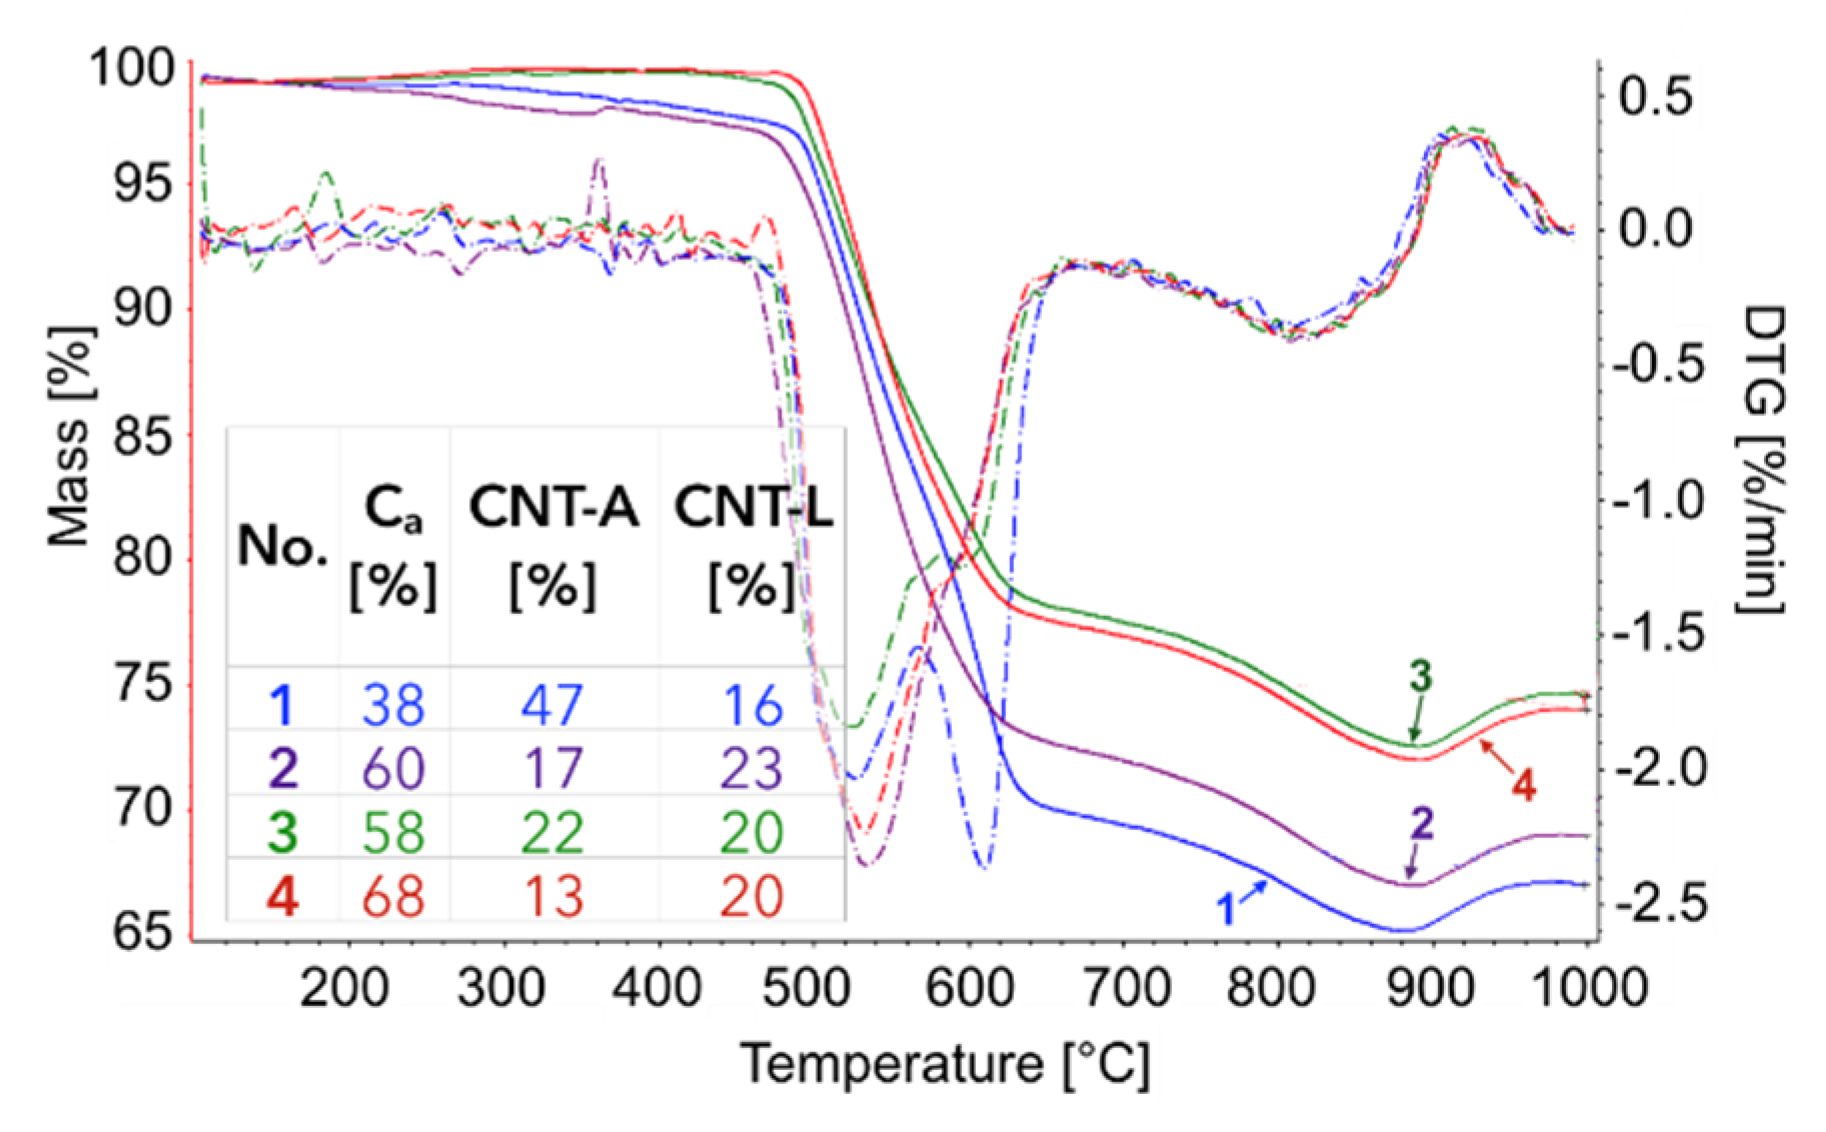
The TGA of the catalyst samples after each test (performed in flowing H2O/Ar, Figure 16) indicated that CH4 decomposition resulted in the deposition of 33, 30, 27.5, and 28% of carbon (for the 1st, 2nd, 3rd, and 4th decomposition test, respectively). Carbon deposits were gasified with H2O at ca. 550, 610, and 800 °C. Oxidation with H2O of the most reactive carbon deposit, i.e., amorphous carbon (Ca), occurred at 550 °C, whereas oxidation of structural carbon was observed at 610 °C (for CNTs being in good contact with catalyst particles (CNT-A)) and at 800 °C (oxidation of CNTs being in loose contact with catalyst (CNT-L)). The most carbon deposits were formed during the 1st CH4 decomposition, and this amount decreased with each next test. Moreover, the content of amorphous carbon in the sample increased with each next test. The decreasing formation of CNTs in each subsequent test could be caused by decreasing the amount of Ni sites accessible for CH4 adsorption and dehydration. The reduction of the number of active Ni sites might be a consequence of (i) detachment of Ni particles from catalyst during CNT formation and their passing to carbon fraction, (ii) incomplete regeneration of the catalyst (described below in the text) and/or (iii) sintering of the catalyst leading to some coverage of Ni with CeZrO2.
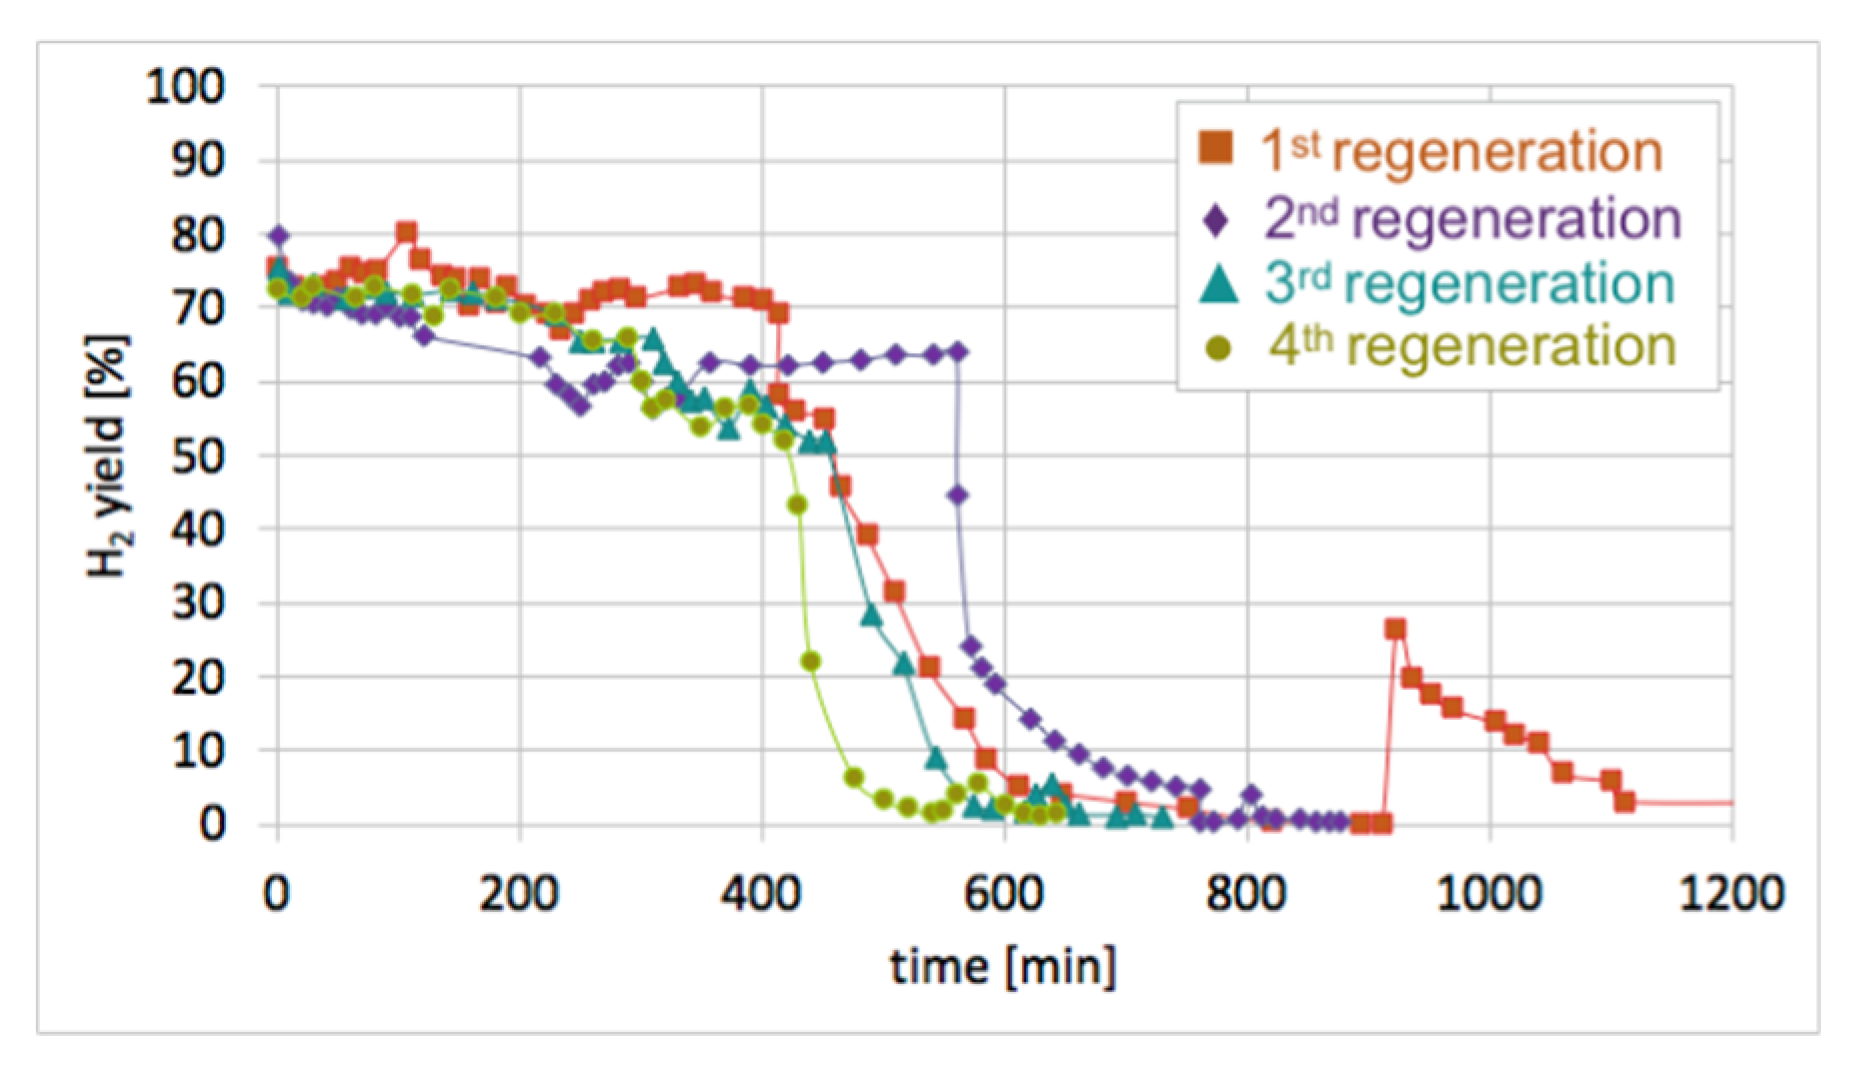
After each test of CH4 decomposition, the carbon deposit was separated, and the catalyst was subjected to regeneration with H2O at 550 and 700 °C. It can be seen in Figure 17 that durations of the catalyst regeneration at 550 °C (i.e., until no more H2, CO, and CO2 were released to the gas phase (Figure S13)), were 910, 790, 590, and 540 minutes for the first, second, third, and fourth regenerations, respectively. The shortening of regeneration time in each subsequent test can be explained by the decreasing amount of carbon deposits, as was demonstrated in Figure 15 and Figure 16.
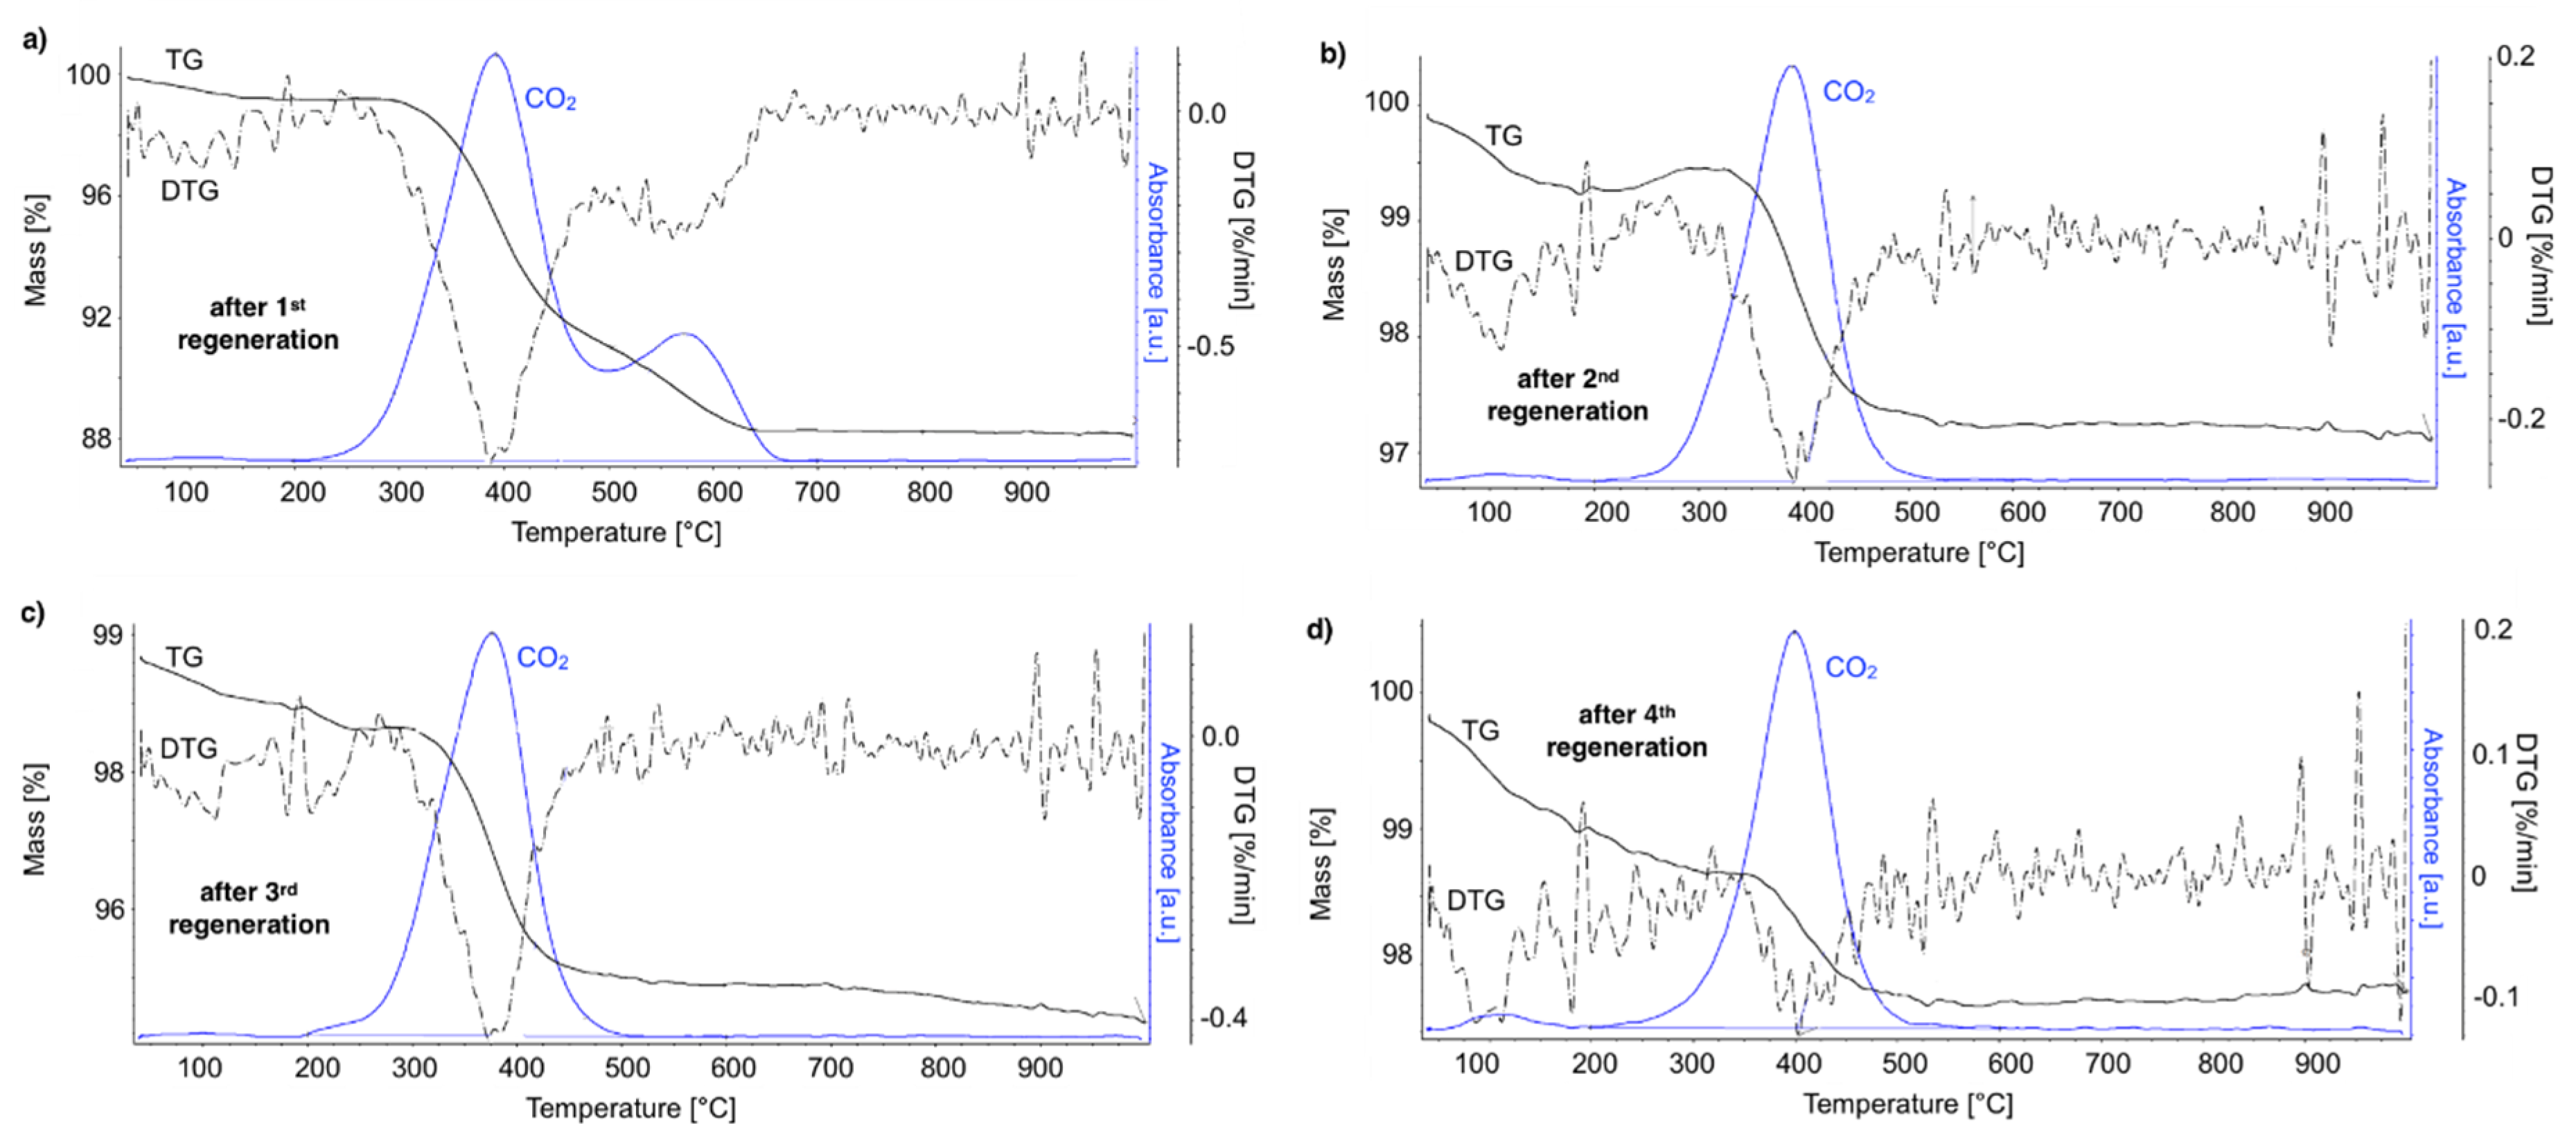
After regeneration, the catalyst samples were subjected to TGA/DTG (performed in air) with CO2 detection using FTIR (Figure 18). Table 4 shows a mass decrease and CO2 production during those analyses. TGA revealed that after the first regeneration with H2O, the catalyst sample still contained 11.9% of the carbon deposits: The amorphous carbon (oxidized at ca. 400 °C) and CTNs (oxidized at ca. 570 °C). Oxidation of both types of carbon deposits resulted in the formation of CO2 during TGA. After further regeneration tests, the catalyst samples contained only the amorphous carbon species. By these observations, one may conclude that catalyst regenerations in a fluidized bed reactor have not been accomplished. The lack of CO2 and CO in the gas phase at the end of the regenerations carried out at 550 and 700 °C (Figure S13) suggested that all carbon deposits were removed. However, the TGA revealed the presence of both the amorphous and structural carbon. This implies that some carbon deposits formed during CH4 decomposition were resistant to oxidation with H2O in a fluidized bed.
Sequential processes of CH4 decomposition followed by catalyst regeneration with H2O in a fluidized bed reactor were found to be less and less efficient in terms of CH4 consumption and H2 production (Table 5). The number of CH4 and H2 moles consumed and produced on 1 Ni mole was decreasing in each next test of methane decomposition (Table S3). The loss of active phase caused decreasing H2 production during CH4 decomposition tests. It determined the amount of H2 produced during the regeneration step (the fewer carbon deposits in the catalyst, the less H2 produced). Moreover, the increase in Ni and CeZrO2 particle size could also contribute to a decrease in catalyst efficiency.
4. Conclusions
The Ni/CeZrO2 catalyst was used for the first time in the CCVD process in a fluidized bed reactor to obtain CNTs and hydrogen from CH4. For comparison, the Ni-MgO catalyst was also tested in CH4 decomposition and then regenerated in a fluidized bed. The impact of temperature, Ni/CeZrO2 particle size, and GHSV on the amount and type of deposited carbon species was determined. The catalyst granulation of 0.125–02 mm, T = 700 °C and GHSV = 10,000 h−1 were found to be the optimal parameters for CH4 decomposition to CNTs and H2.
SEM and TEM after CH4 decomposition proved the presence of randomly oriented and curved CNTs of outer diameters up to 64 nm. The carbon deposit was separated from the catalyst; however, TGA, SEM, and TEM proved that Ni/CeZrO2 still contained from 24–32% of carbon (composed in 61 –85% from the amorphous and in 15–39% from the structural carbon). The carbon fraction contained about 35% of the catalyst. The Ni/CeZrO2 particles were loosely covered with CNTs, freely dispersed over CNTs and strongly attached to external CNT walls. TEM proved the presence of Ni/CeZrO2@CNT hybrid material that can be further used as a catalyst, e.g., in WGS or DRM reactions. Generally, the Ni/CeZrO2 showed lower carbon deposition and lower CNT production than Ni-MgO. However, more CH4 decomposed and more H2 was produced per 1 Ni mole on Ni/CeZRO2 than in the case of Ni-MgO. Moreover, the Ni/CeZrO2 showed significantly higher H2 production during the regeneration process.
A decreasing efficiency of the Ni/CeZrO2 catalyst in subsequent tests of CH4 decomposition–regeneration was observed. Lower carbon deposition in each next test resulted in lower production of H2 during the regeneration cycle. Moreover, as was detected by XRD, SEM, and TGA, the regeneration tests were not successful, and the catalyst still contained some amount of carbon deposits, which were not oxidized in a fluidized bed. The decrease in carbon deposition, especially the formation of CNTs, was observed in each next test of CH4 decomposition. It was caused by decreasing the number of Ni sites in the catalyst. The reduction in Ni concentration was owing to (i) the detachment of Ni particles from the catalyst during CNT formation, (ii) the blockage of Ni sites by carbon deposits that were not removed during the previous regeneration, and/or (iii) the sintering of the catalyst which led either to some coverage of Ni with CeZrO2 or the increase in Ni particle sizes.
This study shows that Ni/CeZrO2 has the potential to be used in the process of CH4 conversion to CNTs and H2. This catalyst could be used for CH4 decomposition instead of CH4 combustion, e.g., in coal mines or in the vicinity of shale gas wells, or anywhere else where methane emissions must be reduced. This study showed that CH4 decomposition in a fluidized bed reactor over Ni/CeZrO2 yielded less CNTs than for Ni-MgO but allowed for the production of more H2. Moreover, the obtained Ni/CeZrO2@CNT hybrid material can be used as a catalyst in WGS or DRM reactions. As a continuation of this work, the carbon deposit obtained over Ni/CeZrO2 in the fluidized bed reactor will be subjected to further processing, e.g., purification from catalyst particles or amorphous carbon. Moreover, the obtained Ni/CeZrO2@CNT will be tested in WGS and DRM in order to compare its performance with materials obtained via coprecipitation of Ni-CeZrO2 over functionalized CNTs.
Supplementary Materials
The following are available online at https://www.mdpi.com/2305-7084/3/1/25/s1, Figure S1: CH4 and CO2 conversion during dry reforming of methane over Ni/CeZrO2@CNT hybrid catalyst, Figure S2: SEM picture, Ni, Ce, Zr and O mapping and composition of Ni/CeZrO2 before CH4 decomposition, Figure S3: SEM picture, Ni, Ce, Zr and O mapping for Ni/CeZrO2 after CH4 decomposition (700 °C/5 h, GHSV = 10,000 h−1), Figure S4: SEM picture, Ni, Ce, Zr and O mapping for Ni/CeZrO2 after separation of carbon deposit, Figure S5: EDS spectra for carbon fraction after separation from Ni/CeZrO2, Figure S6: SEM picture and Ni, Ce, Zr and O mapping for carbon fraction after separation from Ni/CeZrO2, Figure S7: Composition of the outlet gas from fluidized bed reactor during CH4 decomposition on Ni/CeZrO2 and Ni/MgO catalysts (T = 700 °C; GHSV = 10,000 h−1), Figure S8: CH4 conversion to H2 yield (CCH4/YH2) ratio during CH4 decomposition on Ni/CeZrO2 and Ni/MgO catalysts (T = 700 °C; GHSV = 10000 h−1), Figure S9: H2, CO and CO2 formation during regeneration of Ni/CeZrO2 in 4.15 vol.% H2O/Ar after 1, 3 and 5 hours of CH4 deposition at 700 °C and GHSV of 5000 and 20,000 h−1, Figure S10: H2O to H2 conversion during regeneration of Ni/CeZrO2 after 1, 3 and 5 hours of CH4 deposition at 700 °C and GHSV of 5000 and 20,000 h−1, Figure S11: Ni, O, Ce, Zr and C mapping for Ni/CeZrO2 after its 34-hour regeneration in 4.15 vol.% H2O/Ar, Figure S12: EDS for Ni/CeZrO2 after 34-hour regeneration in 4.15 vol.% H2O/Ar, Figure S13: Composition of the gas on reactor outlet during subsequent regeneration tests of Ni/CeZrO2 (4.15 vol.% H2O/Ar, T = 550 and 700 °C, GHSV = 2000 h−1); Table S1: Mass increase of Ni/CeZrO2 (0.125–0.2 mm) after tests of CH4 decomposition at various T, t and GHSV, Table S2: Mass increase of Ni-MgO after tests of CH4 decomposition at various T, t and GHSV, Table S3: CH4 consumption and H2 production per 1 mol of Ni in Ni/CeZrO2 and Ni-MgO during CH4 decomposition tests.
Author Contributions
Conceptualization, research performance and writing the paper—A.Ł.; thermogravimetric analyses—G.Ł.
Funding
Ministerstwo Nauki i Szkolnictwa Wyzszego: IP2014 026273, Ministerstwo Nauki i Szkolnictwa Wyzszego: statutory activity subsidy for the Faculty of Chemistry of Wrocław University of Science and Technology.
Acknowledgments
This work was financed by the Ministry of Science and Higher Education (Iuventus Plus, 2015-2017, IP2014 026273), and statutory activity subsidy for the Faculty of Chemistry of Wrocław University of Science and Technology.
Conflicts of Interest
The authors declare no conflict of interest.
References
- Huczko, A. Nanorurki Węglowe. Czarne Diamenty XXI Wieku. BEL Studio: Poland, 2004. Available online: http://polona.pl/item/4535131 (accessed on 11 April 2018).
- Thompson, B.C.; Moulton, S.A.; Gilmore, K.J.; Higgins, M.J.; Whitten, P.G.; Wallach, G.G. Carbon nanotube biogels. Carbon 2009, 47, 1282–1291. [Google Scholar] [CrossRef]
- Bacs, R.R.; Laurent, C.; Peigney, A.; Bacsa, W.S.; Vaugien, T.; Rousset, A. High specific surface area carbon nanotubes from catalytic chemical vapor deposition process. Chem. Phys. Lett. 2000, 323, 566–571. [Google Scholar] [CrossRef] [Green Version]
- Tran, K.Y.; Heinrichs, B.; Colomer, J.F.; Pirard, J.P.; Lambert, S. Carbon nanotubes synthesis by the ethylene chemical catalytic vapour deposition (CCVD) process on Fe, Co, and Fe–Co/Al2O3 sol–gel catalysts. Appl. Catal. A Gen. 2007, 318, 63–69. [Google Scholar] [CrossRef]
- Zhu, J.; Yudasaka, M.; Iijima, S. A catalytic chemical vapor deposition synthesis of double-walled carbon nanotubes over metal catalysts supported on a mesoporous material. Chem. Phys. Lett. 2003, 380, 496–502. [Google Scholar] [CrossRef]
- Vahlas, C.; Caussat, B.G.; Serp, P.; Angelopoulos, G.N. Principles and Applications of CVD Powder Technology. Mater. Sci. Eng. R Rep. 2006, 53, 1–72. [Google Scholar] [CrossRef]
- Nagaraju, N.; Fonseca, A.; Konya, Z.; Nagy, J.B. Alumina and silica supported metal catalysts for the production of carbon nanotubes. J. Mol. Catal. A Chem. 2002, 181, 57–62. [Google Scholar] [CrossRef]
- Li, Q.; Yan, H.; Cheng, Y.; Zhang, J.; Liu, Z. A scalable CVD synthesis of high-purity single-walled carbon nanotubes with porous MgO as support material. J. Mater. Chem. 2002, 12, 1179–1183. [Google Scholar] [CrossRef]
- Park, J.B.; Choi, G.S.; Cho, Y.S.; Hong, S.Y.; Kim, D.; Choi, S.Y.; Lee, J.H.; Cho, K.I. Characterization of Fe-catalyzed carbon nanotubes grown by thermal chemical vapor deposition. J. Cryst. Growth 2002, 244, 211–217. [Google Scholar] [CrossRef]
- Emmenegger, C.; Bonard, J.M.; Mauron, P.; Sudan, P.; Lepora, A.; Grobety, B.; Zuttel, A.; Schlapbach, L. Synthesis of carbon nanotubes over Fe catalyst on aluminium and suggested growth mechanism. Carbon 2003, 41, 539–547. [Google Scholar] [CrossRef]
- Pinheiro, J.P.; Schouler, M.C.; Gadelle, P. Nanotubes and nanofilaments from carbon monoxide disproportionation over Co/MgO catalysts: I. Growth versus catalyst state. Carbon 2003, 41, 2949–2959. [Google Scholar] [CrossRef]
- Takenaka, S.; Kobayashi, S.; Ogihara, H.; Otsuka, K. Catalytic deuteration of cyclohexanone and allied reactions over platinum metals. J. Catal. 2003, 217, 79–87. [Google Scholar] [CrossRef]
- Flahaut, E.; Peigney, A.; Laurent, C.; Rousset, A. Synthesis of single-walled carbon nanotube–Co–MgO composite powders and extraction of the nanotubes. J. Mater. Chem. 2000, 10, 249–252. [Google Scholar] [CrossRef] [Green Version]
- Li, Y.L.; Kinloch, I.A.; Shaffer, M.S.P.; Geng, J.; Johnson, B.; Windle, A.H. Synthesis of single-walled carbon nanotubes by a fluidized-bed method. Chem. Phys. Lett. 2004, 384, 98–102. [Google Scholar] [CrossRef]
- Yu, H.; Zhang, Q.; Wei, F.; Qian, W.; Luo, G. Agglomerated CNTs synthesized in a fluidized bed reactor: Agglomerate structure and formation mechanism. Carbon 2003, 41, 2855–2863. [Google Scholar] [CrossRef]
- Maghsoodi, S.; Khodadadi, A.; Mortazavi, Y. A novel continuous process for synthesis of carbon nanotubes using iron floating catalyst and MgO particles for CVD of methane in a fluidized bed reactor. Appl. Surf. Sci. 2010, 256, 2769–2774. [Google Scholar] [CrossRef]
- Wang, Y.; Wei, F.; Luo, G.; Yu, H.; Gu, G. The large-scale production of carbon nanotubes in a nano-agglomerate fluidized-bed reactor. Chem. Phys. Lett. 2002, 364, 568–572. [Google Scholar] [CrossRef]
- Hsieh, C.T.; Lin, Y.T.; Chen, W.Y.; Wei, J.L. Parameter setting on growth of carbon nanotubes over transition metal/alumina catalysts in a fluidized bed reactor. Powder Technol. 2009, 192, 16–22. [Google Scholar] [CrossRef]
- Corrias, M.; Caussat, B.; Ayral, A.; Durand, J.; Kihn, Y.; Alck, P.; Serp, P. Carbon nanotubes produced by fluidized bed catalytic CVD: First approach of the process. Chem. Eng. Sci. 2003, 58, 4475–4482. [Google Scholar] [CrossRef]
- Qian, W.; Liu, T.; Wang, Z.; Wei, F.; Li, Z.; Luo, G.; Li, Y. Production of hydrogen and carbon nanotubes from methane decomposition in a two-stage fluidized bed reactor. Appl. Catal. A Gen. 2004, 260, 223–228. [Google Scholar] [CrossRef]
- Wang, Y.; Wei, F.; Gu, G.; Yu, H. Agglomerated carbon nanotubes and its mass production in a fluidized-bed reactor. Physica B 2002, 323, 327–329. [Google Scholar] [CrossRef]
- Zhang, Q.; Zhao, M.Q.; Huang, J.Q.; Liu, Y.; Wang, Y.; Qian, W.Z.; Wei, F. Vertically aligned carbon nanotube arrays grown on a lamellar catalyst by fluidized bed catalytic chemical vapor deposition. Carbon 2009, 47, 2600–2610. [Google Scholar] [CrossRef]
- See, C.H.; Dunens, O.M.; MacKenzie, K.J.; Harris, A.T. Process Parameter Interaction Effects during Carbon Nanotube Synthesis in Fluidized Beds. Ind. Eng. Chem. Res. 2008, 47, 7686–7692. [Google Scholar] [CrossRef]
- Son, S.Y.; Lee, Y.; Won, S.; Lee, D.H.; Kim, S.D.; Sung, S.W. High-Quality Multiwalled Carbon Nanotubes from Catalytic Decomposition of Carboneous Materials in Gas−Solid Fluidized Beds. Ind. Eng. Chem. Res. 2008, 47, 2166–2175. [Google Scholar] [CrossRef]
- Liu, X.B.; Sun, H.; Chen, Y.; Lau, R.; Yang, Y.H. Preparation of large particle MCM-41 and investigation on its fluidization behavior and application in single-walled carbon nanotube production in a fluidized-bed reactor. Chem. Eng. J. 2008, 142, 331–336. [Google Scholar] [CrossRef]
- Global Carbon Nanotubes Market—Industry Beckons. Available online: http://www.nanowerk.com/spotlight/spotid=23118.php (accessed on 28 April 2018).
- Łamacz, A.; Matus, K.; Liszka, B.; Silvestre-Albero, J.; Lafjah, M.; Dintzer, T.; Janowska, I. The impact of synthesis method of CNT supported CeZrO2 and Ni-CeZrO2 on catalytic activity in WGS reaction. Catal. Today 2018, 301, 172–182. [Google Scholar] [CrossRef]
- Łamacz, A. CNT and H2 production during CH4 decomposition over Ni/CeZrO2 and catalyst regeneration with H2O. I. A mechanistic study. ChemEng. (accepted).
Figure 1.
The scheme of the catalyst preparation (a) and installation used for tests (b).

Figure 2.
The mass increase of Ni/CeZrO2 (fractions A, B and C) during CH4 decomposition as a function of test duration (T = 700 °C, GHSV = 10,000 h−1).
Figure 2.
The mass increase of Ni/CeZrO2 (fractions A, B and C) during CH4 decomposition as a function of test duration (T = 700 °C, GHSV = 10,000 h−1).

Figure 3.
The influence of T, t, and gas hourly space velocity (GHSV) on the mass increase of Ni/CeZrO2 (0.125–0.2 mm) during CH4 decomposition (5k_600 stands for GHSV = 5000 h−1 and T = 600 °C).
Figure 3.
The influence of T, t, and gas hourly space velocity (GHSV) on the mass increase of Ni/CeZrO2 (0.125–0.2 mm) during CH4 decomposition (5k_600 stands for GHSV = 5000 h−1 and T = 600 °C).

Figure 4.
The thermogravimetric analysis (TGA) (a) and DTG (b) for the Ni/CeZrO2 after CH4 decomposition (with different test duration and GHSV) and separation of the carbon deposit. The 1/5k stands for the sample after testing carried out for 1 h at GHSV = 5000 h−1.
Figure 4.
The thermogravimetric analysis (TGA) (a) and DTG (b) for the Ni/CeZrO2 after CH4 decomposition (with different test duration and GHSV) and separation of the carbon deposit. The 1/5k stands for the sample after testing carried out for 1 h at GHSV = 5000 h−1.

Figure 5.
SEM of Ni/CeZrO2 after CH4 decomposition (700 °C/5 h, GHSV = 10,000 h−1) (a) and after separation of carbon deposit (b). SEM results of the carbon fraction separated from Ni/CeZrO2 are shown in (c,d).
Figure 5.
SEM of Ni/CeZrO2 after CH4 decomposition (700 °C/5 h, GHSV = 10,000 h−1) (a) and after separation of carbon deposit (b). SEM results of the carbon fraction separated from Ni/CeZrO2 are shown in (c,d).

Figure 6.
Transmission electron microscopy (TEM) pictures of carbon nanotubes (CNTs) formed on Ni/CeZrO2 after CH4 decomposition (700 °C/5 h, GHSV = 10,000 h−1).
Figure 6.
Transmission electron microscopy (TEM) pictures of carbon nanotubes (CNTs) formed on Ni/CeZrO2 after CH4 decomposition (700 °C/5 h, GHSV = 10,000 h−1).

Figure 7.
The influence of T, t, and GHSV on the mass increase of Ni-MgO (0.125–0.2 mm) during CH4 decomposition (10k_600 stands for test carried out at GHSV = 10,000 h−1 and T = 600 °C).
Figure 7.
The influence of T, t, and GHSV on the mass increase of Ni-MgO (0.125–0.2 mm) during CH4 decomposition (10k_600 stands for test carried out at GHSV = 10,000 h−1 and T = 600 °C).

Figure 8.
TGA (a) for Ni-MgO after CH4 decomposition at 700 °C (3/10k stands for the sample after test carried out for 3 h at GHSV = 10,000 h−1). DTG (b) for Ni-MgO after CH4 decomposition for 5 h at GHSV = 10,000 h−1.
Figure 8.
TGA (a) for Ni-MgO after CH4 decomposition at 700 °C (3/10k stands for the sample after test carried out for 3 h at GHSV = 10,000 h−1). DTG (b) for Ni-MgO after CH4 decomposition for 5 h at GHSV = 10,000 h−1.

Figure 9.
TGA/DTG for Ni-MgO after CH4 decomposition (700 °C/5 h, GHSV = 10,000 h−1) and separation of carbon deposit.
Figure 9.
TGA/DTG for Ni-MgO after CH4 decomposition (700 °C/5 h, GHSV = 10,000 h−1) and separation of carbon deposit.

Figure 10.
The CH4 conversion (a) and H2 yield (b) during the tests of CH4 decomposition on Ni/CeZrO2 and Ni/MgO catalysts of different particle sizes (T = 700 °C; GHSV = 10,000 h−1).
Figure 10.
The CH4 conversion (a) and H2 yield (b) during the tests of CH4 decomposition on Ni/CeZrO2 and Ni/MgO catalysts of different particle sizes (T = 700 °C; GHSV = 10,000 h−1).

Figure 11.
The gas composition on the reactor outlet during regeneration of Ni/CeZrO2 (0.125–0.2 mm) at 550 and 700 °C at GHSV: 2000 h−1 (a), 4000 h−1 (b) and 8000 h−1 (c). H2 yield vs. time during regeneration at different GHSV is shown in (d).
Figure 11.
The gas composition on the reactor outlet during regeneration of Ni/CeZrO2 (0.125–0.2 mm) at 550 and 700 °C at GHSV: 2000 h−1 (a), 4000 h−1 (b) and 8000 h−1 (c). H2 yield vs. time during regeneration at different GHSV is shown in (d).

Figure 12.
The impact of GHSV on the H2/(CO + CO2) ratio during the Ni/CeZrO2 regeneration in H2O.

Figure 13.
Gas composition on the reactor outlet during the regeneration of Ni-MgO (0.125–0.2 mm) at 550 and 700 °C, and at GHSV = 2000 h−1 (a). H2 yield vs. time is shown in (b).
Figure 13.
Gas composition on the reactor outlet during the regeneration of Ni-MgO (0.125–0.2 mm) at 550 and 700 °C, and at GHSV = 2000 h−1 (a). H2 yield vs. time is shown in (b).

Figure 14.
The XRD of Ni/CeZrO2 (a) and Ni-MgO (b): Fresh (i), after CH4 decomposition (ii), and after the regeneration (iii) in a fluidized bed reactor.
Figure 14.
The XRD of Ni/CeZrO2 (a) and Ni-MgO (b): Fresh (i), after CH4 decomposition (ii), and after the regeneration (iii) in a fluidized bed reactor.

Figure 15.
Conversion of CH4 (a) and H2 yield (b) during four repetitive tests of CH4 decomposition in the fluidized bed reactor over Ni/CeZrO2 (0.125–0.2 mm) (T = 700 °C/ 5 h; GHSV = 10,000 h−1).
Figure 15.
Conversion of CH4 (a) and H2 yield (b) during four repetitive tests of CH4 decomposition in the fluidized bed reactor over Ni/CeZrO2 (0.125–0.2 mm) (T = 700 °C/ 5 h; GHSV = 10,000 h−1).

Figure 16.
TGA/DTG of Ni/CeZrO2 after the 1st, 2nd, 3rd, and 4th CH4 decomposition. The distribution of particular types of carbon deposits in the samples are shown. (Ca—amorphous carbon; CNT-A—CNTs attached to the catalyst; CNT-L—loose CNTs).
Figure 16.
TGA/DTG of Ni/CeZrO2 after the 1st, 2nd, 3rd, and 4th CH4 decomposition. The distribution of particular types of carbon deposits in the samples are shown. (Ca—amorphous carbon; CNT-A—CNTs attached to the catalyst; CNT-L—loose CNTs).

Figure 17.
H2 yield during four subsequent cycles of Ni/CeZrO2 regeneration (at T = 550 and 700 °C; GHSV = 2000 h−1).
Figure 17.
H2 yield during four subsequent cycles of Ni/CeZrO2 regeneration (at T = 550 and 700 °C; GHSV = 2000 h−1).

Figure 18.
The TGA/DTG in air for regenerated Ni/CeZrO2.


Table 1.
Distribution of H2 formation during the regeneration of Ni/CeZrO2.
| GHSV (h−1) | H2 Distribution (%) | ||
|---|---|---|---|
| Oxidation of C to CO2 | Oxidation of C to CO | Dissociation of H2O to H2 | |
| C + 2H2O = CO2 + 2H2 | C + H2O = CO + H2 | H2O + * = *O + H2 | |
| 2000 | 56 | 25 | 19 |
| 4000 | 70 | 14 | 16 |
| 8000 | 77 | 12 | 11 |
Table 2.
H2 production during the Ni/CeZrO2 regeneration at different GHSVs.
| GHSV (h−1) | H2 Produced at 550 °C (dm3) | H2 Produced at 550 and 700 °C (dm3) |
|---|---|---|
| 2000 | 29.29 | 74.19 |
| 4000 | 2.55 | 3.85 |
| 8000 | 1.11 | 1.88 |
Table 3.
Ni and CeZrO2 crystallites size for fresh, spent, and regenerated Ni/CeZrO2.
| Ni/CeZrO2 | Crystallite Size (nm) | |
|---|---|---|
| Ni (1 1 1) | CeZrO2 (1 1 1) | |
| fresh | - | 1.3 |
| after CH4 decomposition | 3.4 | 1.5 |
| after regeneration in H2O | 3.5 | 1.7 |
Table 4.
Mass decrease and the amount of CO2 produced during regeneration tests.
| Test No | Mass Decrease (%) | CO2 Produced (mmol) |
|---|---|---|
| 1 | 11.9 | 0.091 |
| 2 | 2.9 | 0.026 |
| 3 | 5.6 | 0.035 |
| 4 | 2.2 | 0.012 |
Table 5.
The CH4 consumption and the H2 production during cyclic decomposition-regeneration tests over Ni/CeZrO2.
Table 5.
The CH4 consumption and the H2 production during cyclic decomposition-regeneration tests over Ni/CeZrO2.
| CH4 Decomposition | Regeneration | ||||
|---|---|---|---|---|---|
| CH4 consumed (dm3) | H2 produced (dm3) | H2 produced at 550 °C (dm3) | H2 produced at 700 °C (dm3) | H2 produced at 550 and 700 °C (dm3) | |
| Ni/CeZrO2: | |||||
| 1st | 3.94 | 7.79 | 29.29 | 44.90 | 74.19 |
| 2nd | 3.08 | 5.41 | 24.15 | 3.72 | 27.87 |
| 3rd | 2.57 | 3.66 | 15.97 | 3.91 | 19.88 |
| 4th | 1.65 | 2.88 | 13.07 | 2.61 | 15.68 |
| NiMgO | 4.33 | 7.35 | 17.34 | 6.16 | 23.50 |
© 2019 by the authors. Licensee MDPI, Basel, Switzerland. This article is an open access article distributed under the terms and conditions of the Creative Commons Attribution (CC BY) license (http://creativecommons.org/licenses/by/4.0/).
Share and Cite
MDPI and ACS Style
Łamacz, A.; Łabojko, G. CNT and H2 Production during CH4 Decomposition over Ni/CeZrO2. II. Catalyst Performance and Its Regeneration in a Fluidized Bed. ChemEngineering 2019, 3, 25. https://doi.org/10.3390/chemengineering3010025
AMA Style
Łamacz A, Łabojko G. CNT and H2 Production during CH4 Decomposition over Ni/CeZrO2. II. Catalyst Performance and Its Regeneration in a Fluidized Bed. ChemEngineering. 2019; 3(1):25. https://doi.org/10.3390/chemengineering3010025
Chicago/Turabian StyleŁamacz, Agata, and Grzegorz Łabojko. 2019. "CNT and H2 Production during CH4 Decomposition over Ni/CeZrO2. II. Catalyst Performance and Its Regeneration in a Fluidized Bed" ChemEngineering 3, no. 1: 25. https://doi.org/10.3390/chemengineering3010025