The Distribution of Circulating Tumor Cells Is Different in Metastatic Lobular Compared to Ductal Carcinoma of the Breast—Long-Term Prognostic Significance

 ,
,
Abstract
:1. Introduction
2. Materials and Methods
2.1. Patients and Study Design
2.2. Detection of CTCs and CTC Clusters
2.3. CA 15-3
2.4. Monitoring Procedure of CTCs and CA15-3 for Detection of Early Progression in MBC
2.5. Statistics
2.6. PAM 50 Subtyping
3. Results
3.1. Patient Outcome
3.2. CTC, CTC Cluster, and CA 15-3 Analyses
3.2.1. Descriptive Data
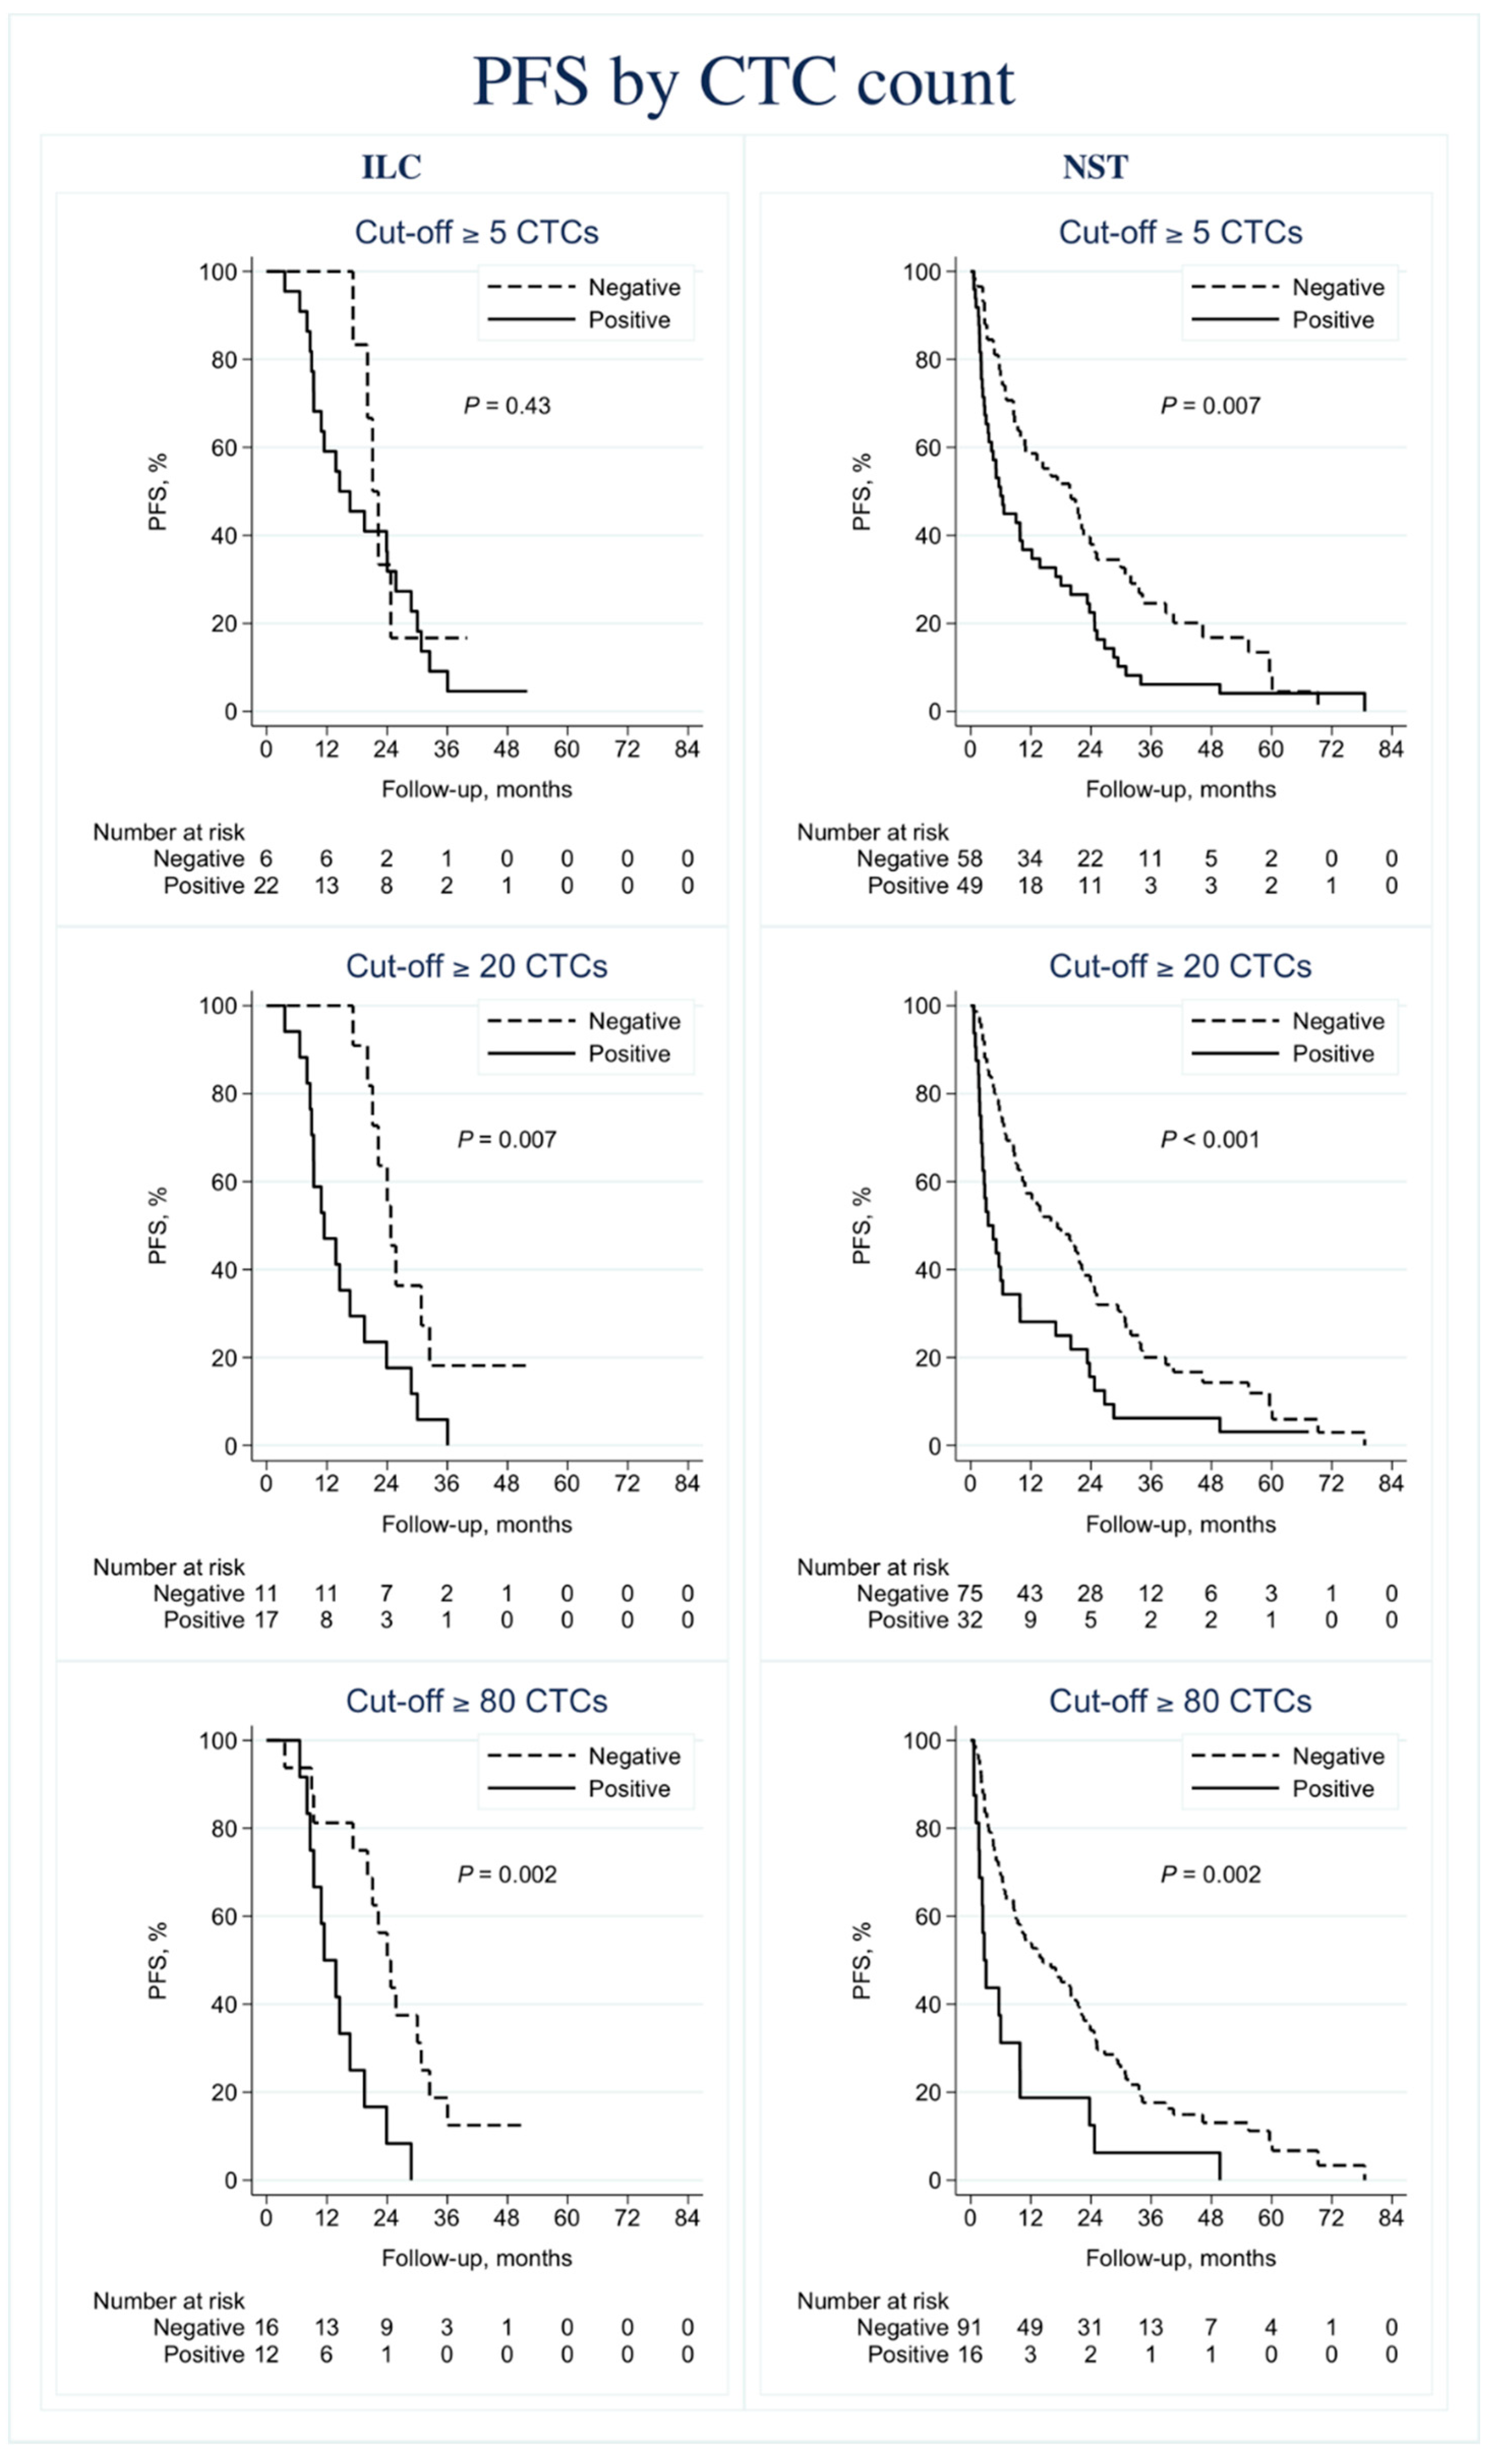
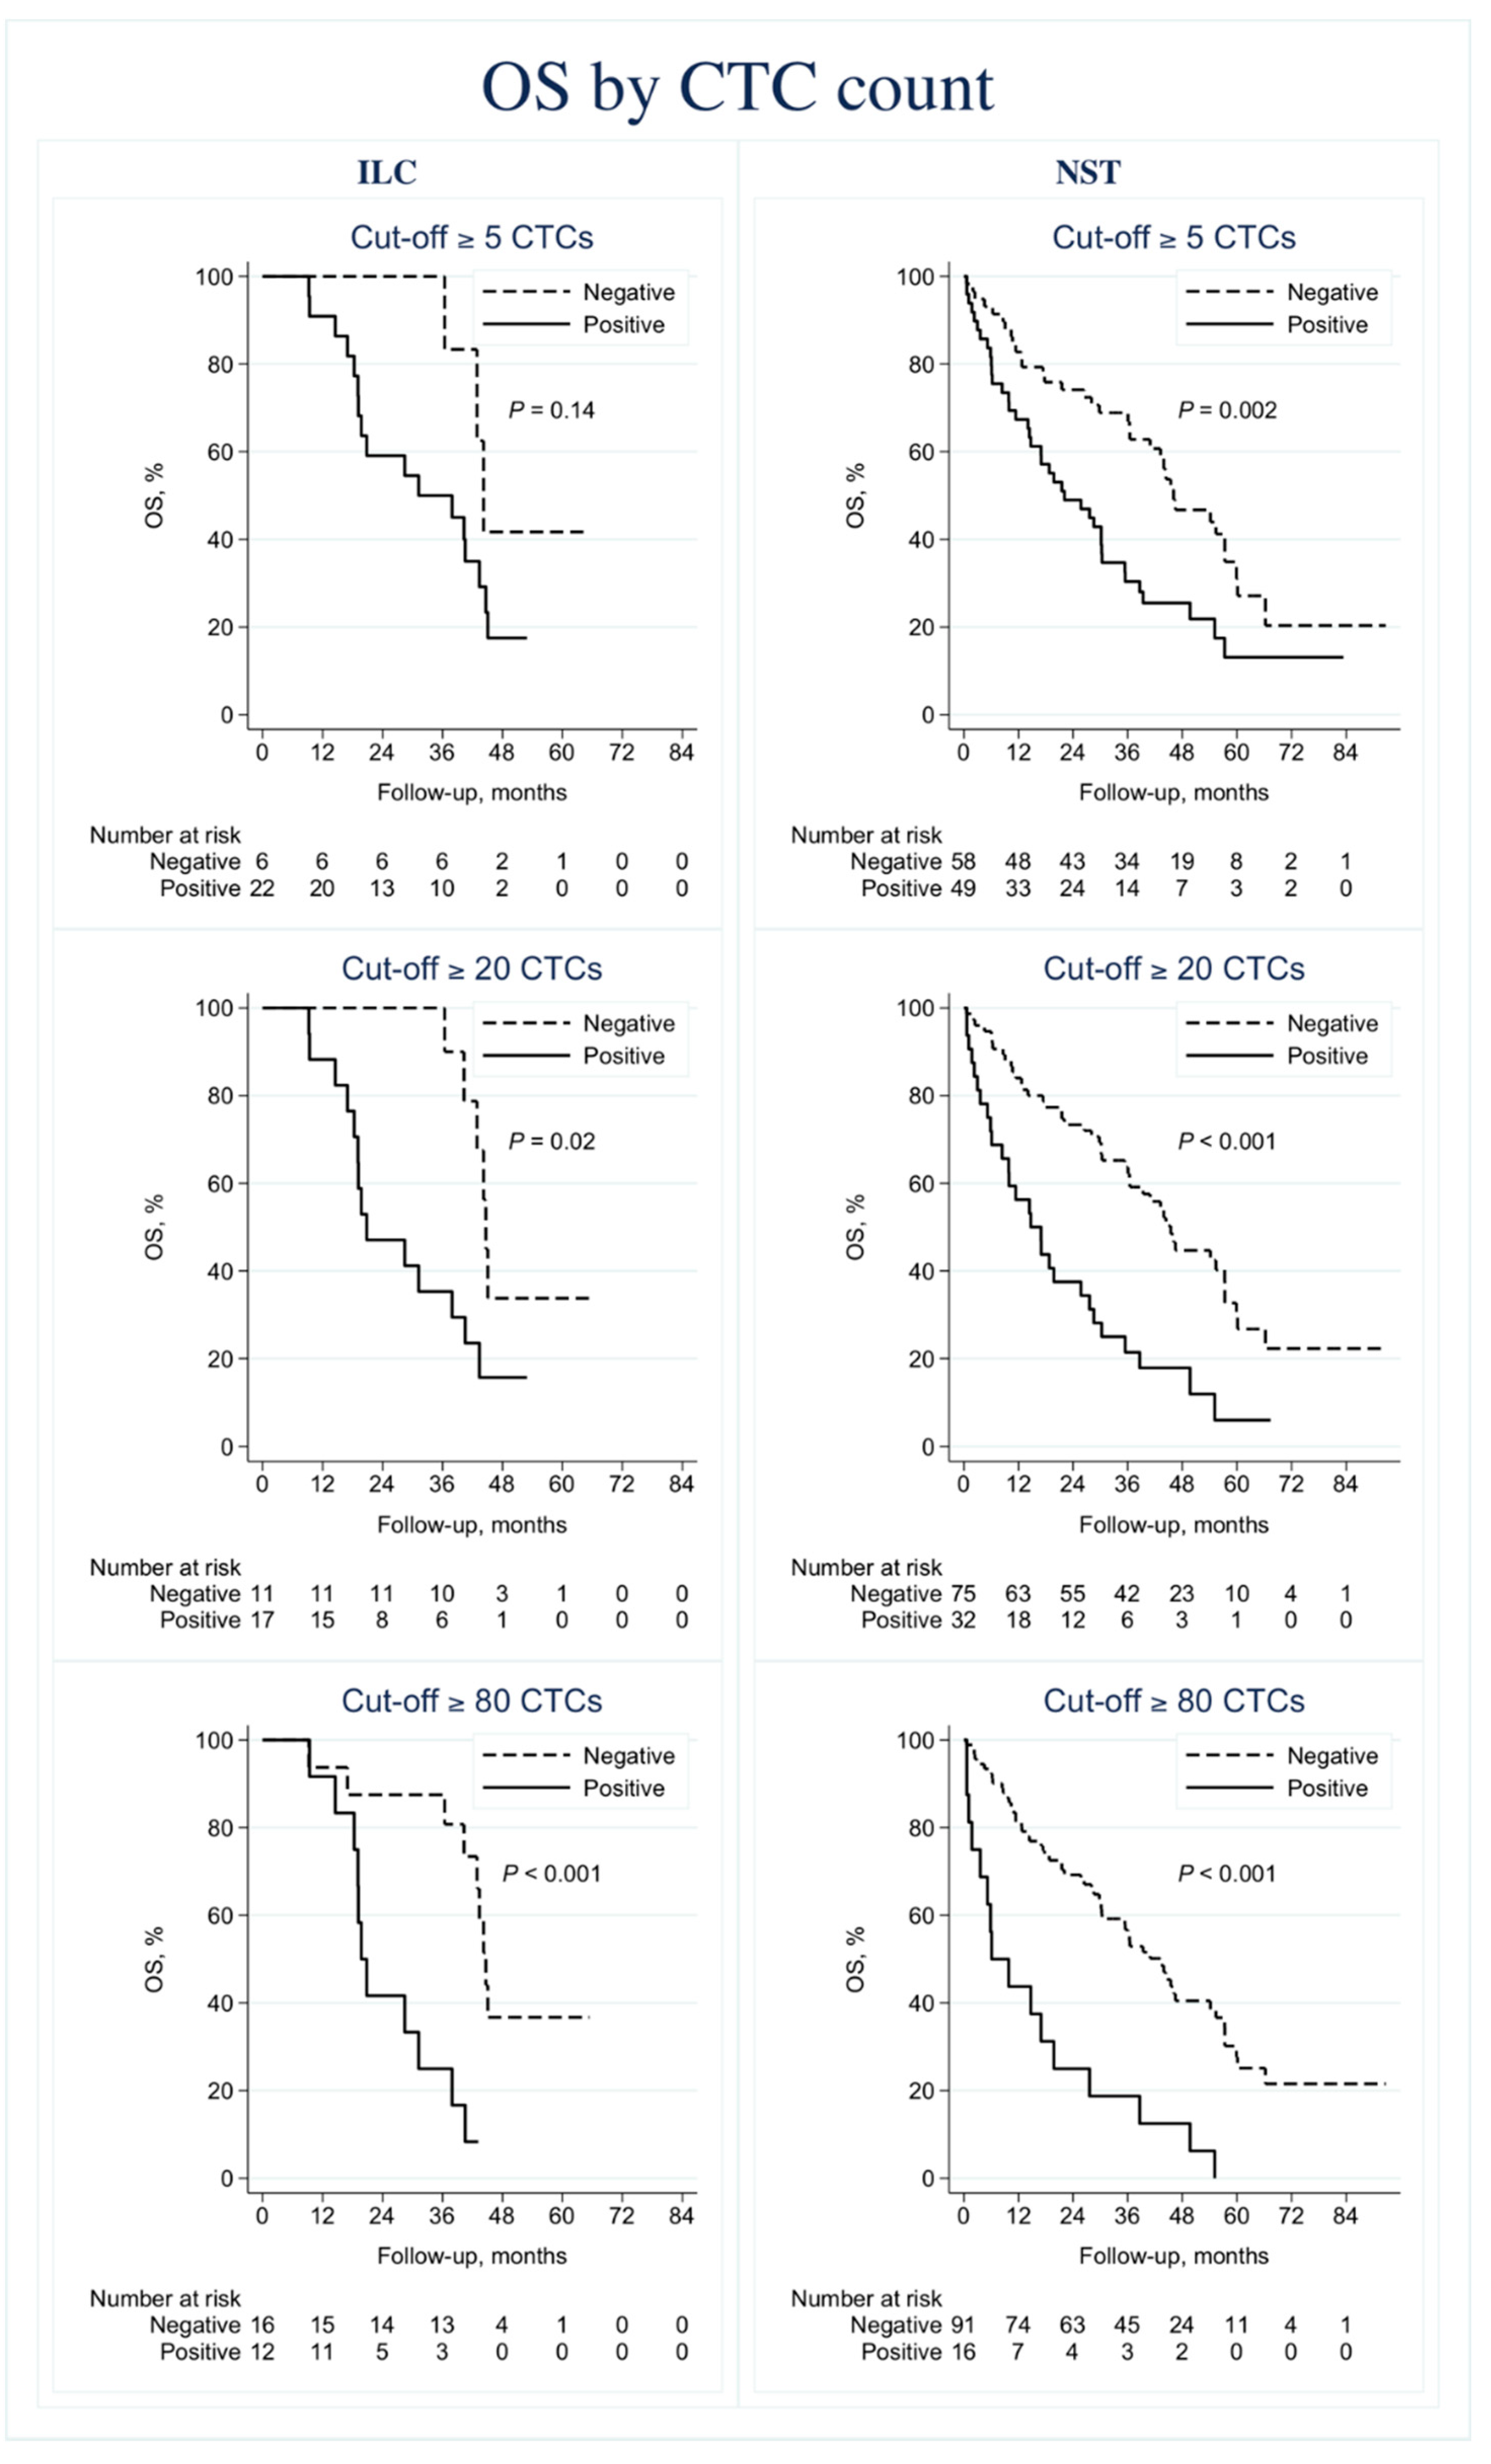
3.2.2. Prognostic Information
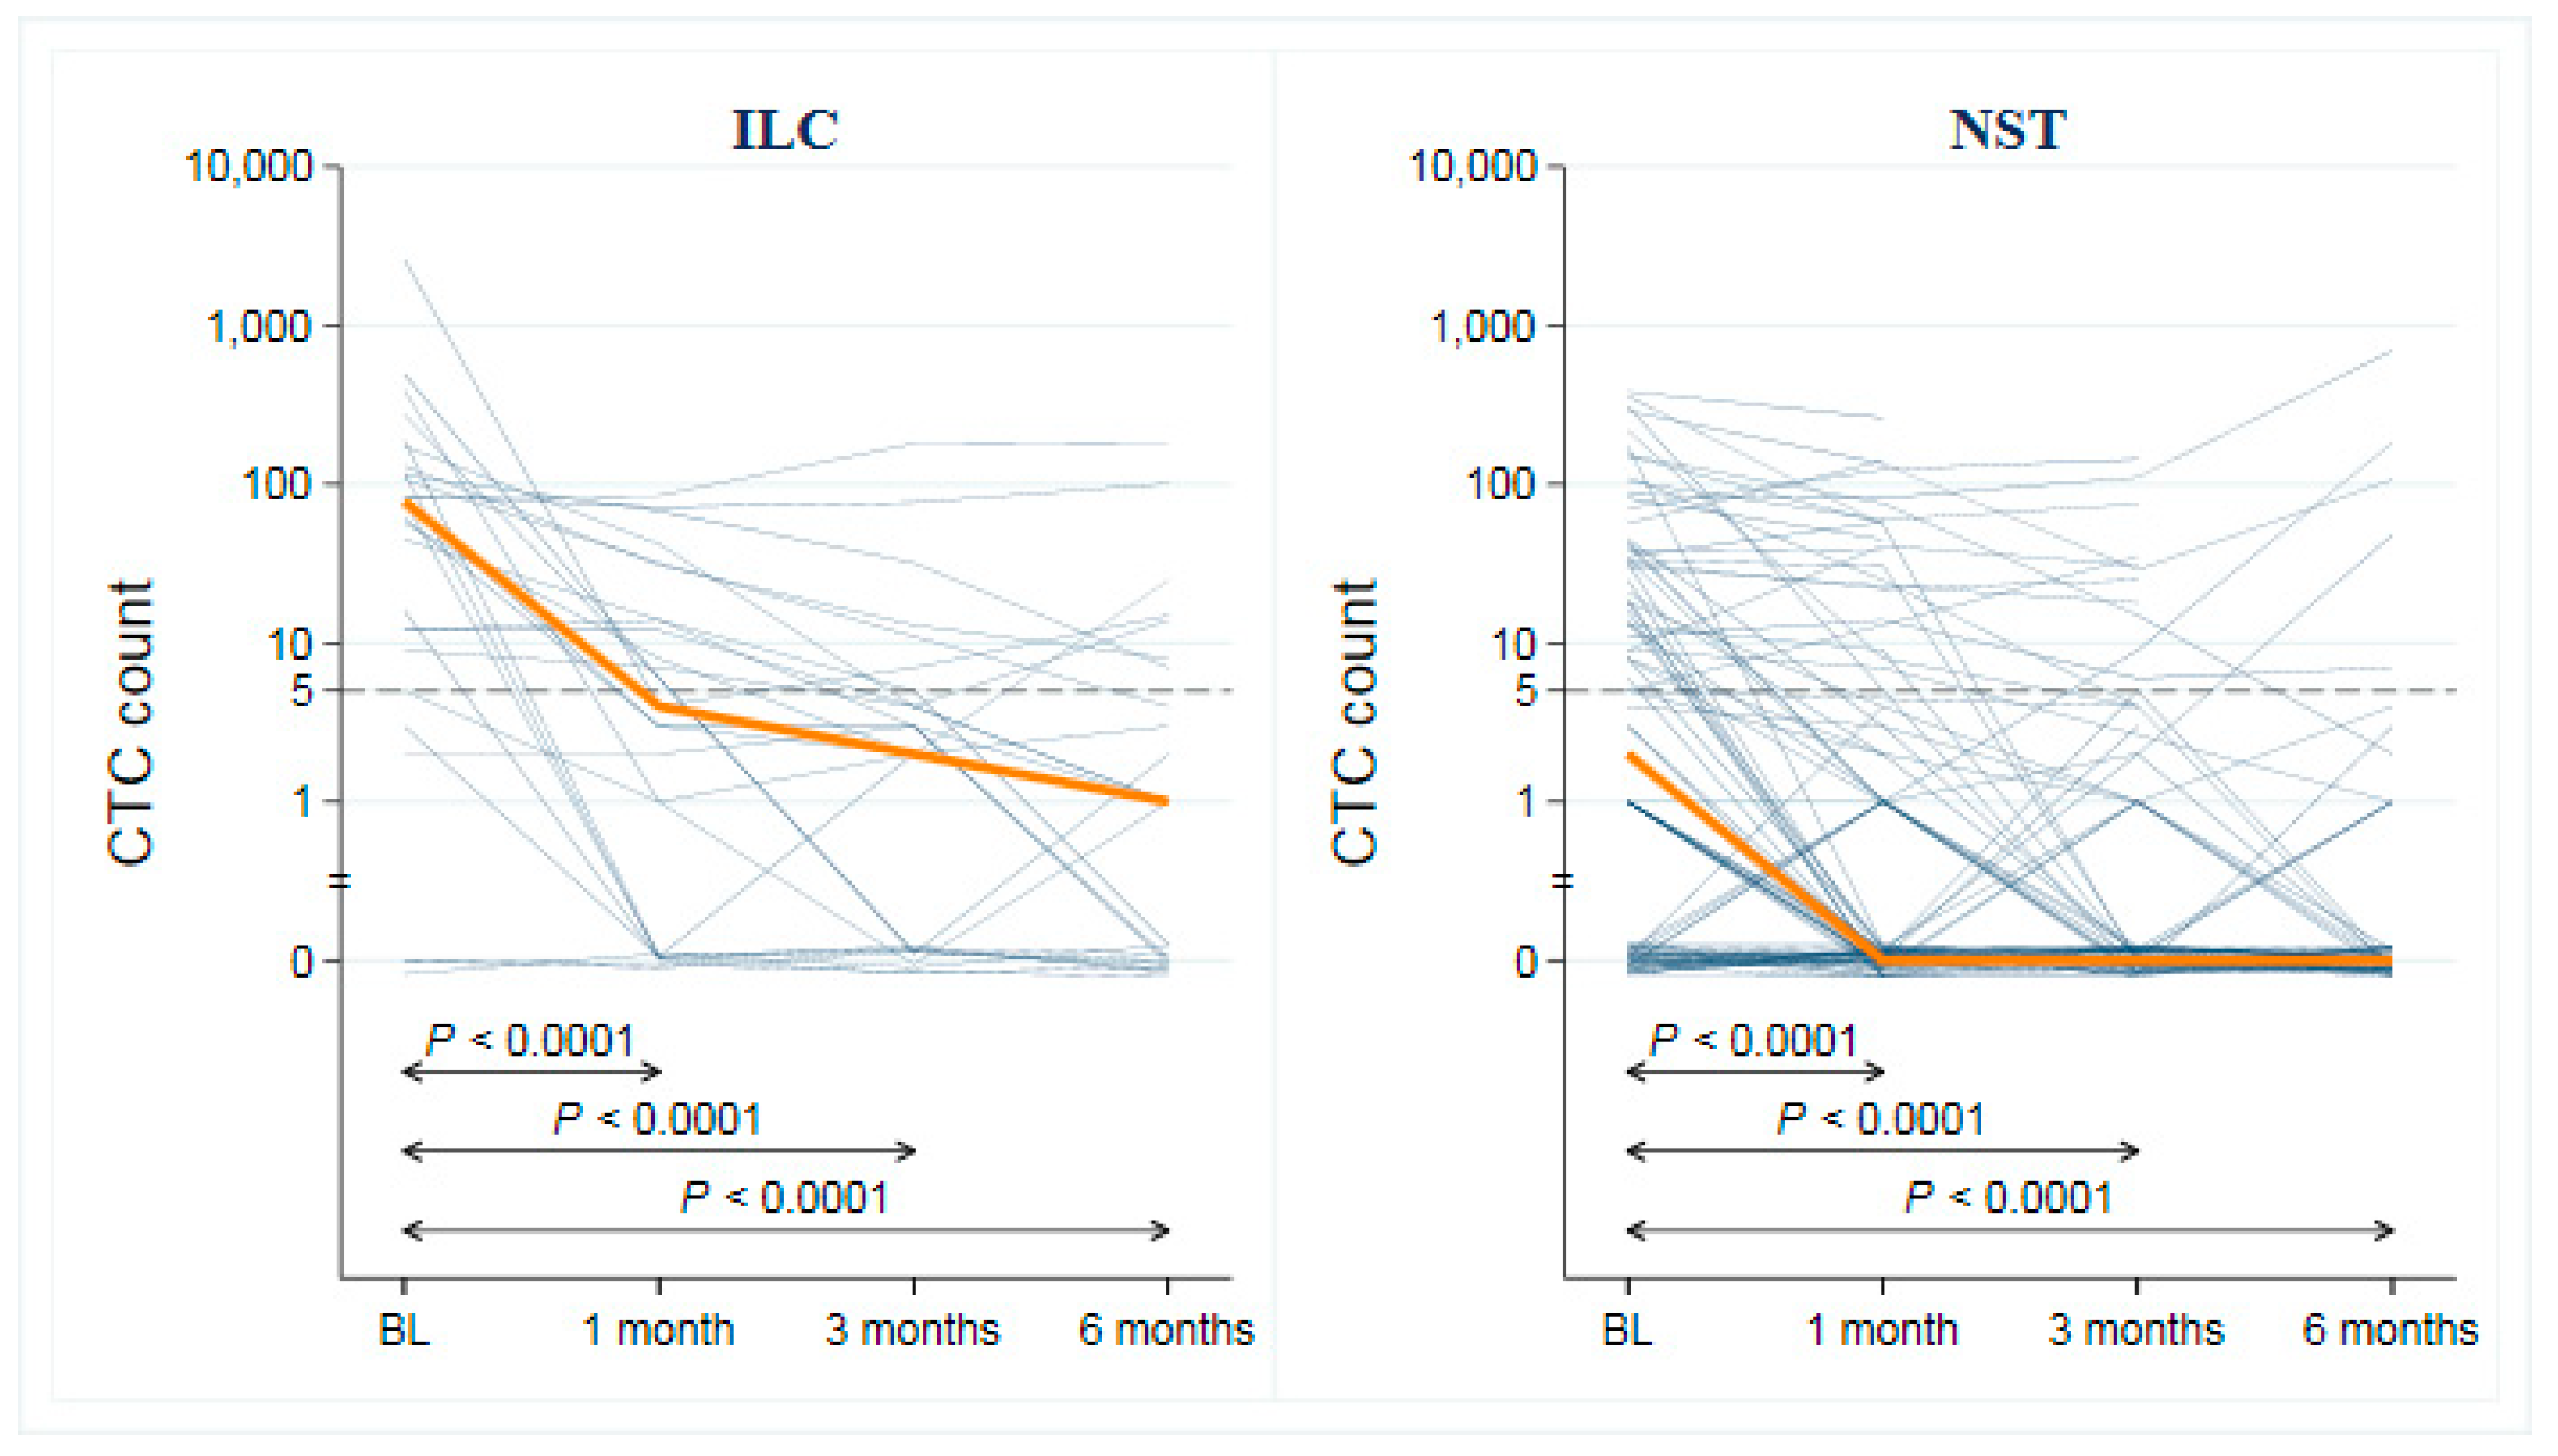
3.3. CTC and CA 15-3 as Monitoring Tools for Early Progression
4. Discussion
5. Conclusions
Supplementary Materials
Author Contributions
Funding
Acknowledgments
Conflicts of Interest
References
- Global Burden of Disease Cancer, C.; Fitzmaurice, C.; Allen, C.; Barber, R.M.; Barregard, L.; Bhutta, Z.A.; Brenner, H.; Dicker, D.J.; Chimed-Orchir, O.; Dandona, R.; et al. Global, Regional, and National Cancer Incidence, Mortality, Years of Life Lost, Years Lived With Disability, and Disability-Adjusted Life-years for 32 Cancer Groups, 1990 to 2015: A Systematic Analysis for the Global Burden of Disease Study. JAMA Oncol. 2017, 3, 524–548. [Google Scholar] [CrossRef] [PubMed]
- Eisenhauer, E.A.; Therasse, P.; Bogaerts, J.; Schwartz, L.H.; Sargent, D.; Ford, R.; Dancey, J.; Arbuck, S.; Gwyther, S.; Mooney, M.; et al. New response evaluation criteria in solid tumours: Revised RECIST guideline. (version 1.1). Eur. J. Cancer 2009, 45, 228–247. [Google Scholar] [CrossRef]
- Woolf, D.K.; Padhani, A.R.; Makris, A. Assessing response to treatment of bone metastases from breast cancer: What should be the standard of care? Ann. Oncol. 2015, 26, 1048–1057. [Google Scholar] [CrossRef] [PubMed]
- Suzuki, C.; Jacobsson, H.; Hatschek, T.; Torkzad, M.R.; Boden, K.; Eriksson-Alm, Y.; Berg, E.; Fujii, H.; Kubo, A.; Blomqvist, L. Radiologic measurements of tumor response to treatment: Practical approaches and limitations. Radiographics 2008, 28, 329–344. [Google Scholar] [CrossRef] [Green Version]
- Van Poznak, C.; Somerfield, M.R.; Bast, R.C.; Cristofanilli, M.; Goetz, M.P.; Gonzalez-Angulo, A.M.; Hicks, D.G.; Hill, E.G.; Liu, M.C.; Lucas, W.; et al. Use of Biomarkers to Guide Decisions on Systemic Therapy for Women With Metastatic Breast Cancer: American Society of Clinical Oncology Clinical Practice Guideline. J. Clin. Oncol. 2015, 33, 2695–2704. [Google Scholar] [CrossRef] [PubMed]
- Duffy, M.J.; Evoy, D.; McDermott, E.W. CA 15-3: Uses and limitation as a biomarker for breast cancer. Clin. Chim. Acta 2010, 411, 1869–1874. [Google Scholar] [CrossRef]
- Bidard, F.C.; Peeters, D.J.; Fehm, T.; Nole, F.; Gisbert-Criado, R.; Mavroudis, D.; Grisanti, S.; Generali, D.; Garcia-Saenz, J.A.; Stebbing, J.; et al. Clinical validity of circulating tumour cells in patients with metastatic breast cancer: A pooled analysis of individual patient data. Lancet Oncol. 2014, 15, 406–414. [Google Scholar] [CrossRef]
- Cristofanilli, M.; Pierga, J.Y.; Reuben, J.; Rademaker, A.; Davis, A.A.; Peeters, D.J.; Fehm, T.; Nole, F.; Gisbert-Criado, R.; Mavroudis, D.; et al. The clinical use of circulating tumor cells (CTCs) enumeration for staging of metastatic breast cancer (MBC): International expert consensus paper. Crit. Rev. Oncol. Hematol. 2019, 134, 39–45. [Google Scholar] [CrossRef]
- Yan, W.T.; Cui, X.; Chen, Q.; Li, Y.F.; Cui, Y.H.; Wang, Y.; Jiang, J. Circulating tumor cell status monitors the treatment responses in breast cancer patients: A meta-analysis. Sci. Rep. 2017, 7, 43464. [Google Scholar] [CrossRef] [Green Version]
- Cristofanilli, M.; Budd, G.T.; Ellis, M.J.; Stopeck, A.; Matera, J.; Miller, M.C.; Reuben, J.M.; Doyle, G.V.; Allard, W.J.; Terstappen, L.W.; et al. Circulating tumor cells, disease progression, and survival in metastatic breast cancer. N. Engl. J. Med. 2004, 351, 781–791. [Google Scholar] [CrossRef] [PubMed] [Green Version]
- Pierga, J.Y.; Hajage, D.; Bachelot, T.; Delaloge, S.; Brain, E.; Campone, M.; Dieras, V.; Rolland, E.; Mignot, L.; Mathiot, C.; et al. High independent prognostic and predictive value of circulating tumor cells compared with serum tumor markers in a large prospective trial in first-line chemotherapy for metastatic breast cancer patients. Ann. Oncol. 2012, 23, 618–624. [Google Scholar] [CrossRef] [PubMed]
- Aceto, N.; Bardia, A.; Miyamoto, D.T.; Donaldson, M.C.; Wittner, B.S.; Spencer, J.A.; Yu, M.; Pely, A.; Engstrom, A.; Zhu, H.; et al. Circulating tumor cell clusters are oligoclonal precursors of breast cancer metastasis. Cell 2014, 158, 1110–1122. [Google Scholar] [CrossRef] [PubMed] [Green Version]
- Mu, Z.; Wang, C.; Ye, Z.; Austin, L.; Civan, J.; Hyslop, T.; Palazzo, J.P.; Jaslow, R.; Li, B.; Myers, R.E.; et al. Prospective assessment of the prognostic value of circulating tumor cells and their clusters in patients with advanced-stage breast cancer. Breast Cancer Res. Treat. 2015, 154, 563–571. [Google Scholar] [CrossRef]
- Larsson, A.M.; Jansson, S.; Bendahl, P.O.; Levin Tykjaer Jorgensen, C.; Loman, N.; Graffman, C.; Lundgren, L.; Aaltonen, K.; Ryden, L. Longitudinal enumeration and cluster evaluation of circulating tumor cells improve prognostication for patients with newly diagnosed metastatic breast cancer in a prospective observational trial. Breast Cancer Res. 2018, 20, 48. [Google Scholar] [CrossRef] [PubMed]
- Alunni-Fabbroni, M.; Muller, V.; Fehm, T.; Janni, W.; Rack, B. Monitoring in metastatic breast cancer: Is imaging outdated in the era of circulating tumor cells? Breast Care (Basel) 2014, 9, 16–21. [Google Scholar] [CrossRef] [PubMed] [Green Version]
- Liu, M.C.; Shields, P.G.; Warren, R.D.; Cohen, P.; Wilkinson, M.; Ottaviano, Y.L.; Rao, S.B.; Eng-Wong, J.; Seillier-Moiseiwitsch, F.; Noone, A.M.; et al. Circulating tumor cells: A useful predictor of treatment efficacy in metastatic breast cancer. J. Clin. Oncol 2009, 27, 5153–5159. [Google Scholar] [CrossRef] [Green Version]
- World Health Organisation. Classification of Tumours of the Breast, 4th ed.; Lakhani, S.R., Ellis, I.O., Schnitt, S.J., Tan, P.H., van de Vijver, M.J., Eds.; WHO Press: Geneva, Switzerland, 2012; p. 240. [Google Scholar]
- Martinez, V.; Azzopardi, J.G. Invasive lobular carcinoma of the breast: Incidence and variants. Histopathology 1979, 3, 467–488. [Google Scholar] [CrossRef]
- Acs, G.; Lawton, T.J.; Rebbeck, T.R.; LiVolsi, V.A.; Zhang, P.J. Differential expression of E-cadherin in lobular and ductal neoplasms of the breast and its biologic and diagnostic implications. Am. J. Clin. Pathol. 2001, 115, 85–98. [Google Scholar] [CrossRef] [Green Version]
- Arpino, G.; Bardou, V.J.; Clark, G.M.; Elledge, R.M. Infiltrating lobular carcinoma of the breast: Tumor characteristics and clinical outcome. Breast Cancer Res. 2004, 6, R149. [Google Scholar] [CrossRef] [Green Version]
- Wasif, N.; Maggard, M.A.; Ko, C.Y.; Giuliano, A.E. Invasive lobular vs. ductal breast cancer: A stage-matched comparison of outcomes. Ann. Surg. Oncol. 2010, 17, 1862–1869. [Google Scholar] [CrossRef]
- Christgen, M.; Steinemann, D.; Kuhnle, E.; Langer, F.; Gluz, O.; Harbeck, N.; Kreipe, H. Lobular breast cancer: Clinical, molecular and morphological characteristics. Pathol. Res. Pr. 2016, 212, 583–597. [Google Scholar] [CrossRef]
- Barroso-Sousa, R.; Metzger-Filho, O. Differences between invasive lobular and invasive ductal carcinoma of the breast: Results and therapeutic implications. Adv. Med. Oncol. 2016, 8, 261–266. [Google Scholar] [CrossRef] [PubMed] [Green Version]
- Ciriello, G.; Gatza, M.L.; Beck, A.H.; Wilkerson, M.D.; Rhie, S.K.; Pastore, A.; Zhang, H.; McLellan, M.; Yau, C.; Kandoth, C.; et al. Comprehensive Molecular Portraits of Invasive Lobular Breast Cancer. Cell 2015, 163, 506–519. [Google Scholar] [CrossRef] [Green Version]
- Desmedt, C.; Zoppoli, G.; Sotiriou, C.; Salgado, R. Transcriptomic and genomic features of invasive lobular breast cancer. Semin. Cancer Biol. 2017, 44, 98–105. [Google Scholar] [CrossRef] [PubMed]
- Rakha, E.A.; Ellis, I.O. Lobular breast carcinoma and its variants. Semin. Diagn. Pathol. 2010, 27, 49–61. [Google Scholar] [CrossRef] [PubMed]
- El-Hage, A.; Ruel, C.; Afif, W.; Wissanji, H.; Hogue, J.C.; Desbiens, C.; Leblanc, G.; Poirier, E. Metastatic pattern of invasive lobular carcinoma of the breast-Emphasis on gastric metastases. J. Surg. Oncol. 2016, 114, 543–547. [Google Scholar] [CrossRef]
- Lv, Q.; Gong, L.; Zhang, T.; Ye, J.; Chai, L.; Ni, C.; Mao, Y. Prognostic value of circulating tumor cells in metastatic breast cancer: A systemic review and meta-analysis. Clin. Transl. Oncol. 2016, 18, 322–330. [Google Scholar] [CrossRef] [PubMed]
- Peeters, D.J.; van Dam, P.J.; Van den Eynden, G.G.; Rutten, A.; Wuyts, H.; Pouillon, L.; Peeters, M.; Pauwels, P.; Van Laere, S.J.; van Dam, P.A.; et al. Detection and prognostic significance of circulating tumour cells in patients with metastatic breast cancer according to immunohistochemical subtypes. Br. J. Cancer 2014, 110, 375–383. [Google Scholar] [CrossRef] [PubMed] [Green Version]
- De Gregorio, A.; Friedl, T.W.P.; Huober, J.; Scholz, C.; De Gregorio, N.; Rack, B.; Trapp, E.; Alunni-Fabbroni, M.; Riethdorf, S.; Mueller, V.; et al. Discordance in Human Epidermal Growth Factor Receptor 2 (HER2) Phenotype Between Primary Tumor and Circulating Tumor Cells in Women With HER2-Negative Metastatic Breast Cancer. JCO Precis. Oncol. 2017, 1, 1–12. [Google Scholar] [CrossRef]
- Jansson, S.; Bendahl, P.O.; Larsson, A.M.; Aaltonen, K.E.; Ryden, L. Prognostic impact of circulating tumor cell apoptosis and clusters in serial blood samples from patients with metastatic breast cancer in a prospective observational cohort. BMC Cancer 2016, 16, 433. [Google Scholar] [CrossRef] [PubMed] [Green Version]
- Allard, W.J.; Matera, J.; Miller, M.C.; Repollet, M.; Connelly, M.C.; Rao, C.; Tibbe, A.G.; Uhr, J.W.; Terstappen, L.W. Tumor cells circulate in the peripheral blood of all major carcinomas but not in healthy subjects or patients with nonmalignant diseases. Clin. Cancer Res. 2004, 10, 6897–6904. [Google Scholar] [CrossRef] [PubMed] [Green Version]
- Botteri, E.; Sandri, M.T.; Bagnardi, V.; Munzone, E.; Zorzino, L.; Rotmensz, N.; Casadio, C.; Cassatella, M.C.; Esposito, A.; Curigliano, G.; et al. Modeling the relationship between circulating tumour cells number and prognosis of metastatic breast cancer. Breast Cancer Res. Treat. 2010, 122, 211–217. [Google Scholar] [CrossRef] [PubMed] [Green Version]
- Duffy, M.J. Serum tumor markers in breast cancer: Are they of clinical value? Clin. Chem. 2006, 52, 345–351. [Google Scholar] [CrossRef] [PubMed] [Green Version]
- McShane, L.M.; Altman, D.G.; Sauerbrei, W.; Taube, S.E.; Gion, M.; Clark, G.M.; Statistics Subcommittee of the NCI-EORTC Working Group on Cancer Diagnostics. Reporting recommendations for tumor MARKer prognostic studies (REMARK). Nat. Clin. Pr. Urol. 2005, 2, 416–422. [Google Scholar]
- Parker, J.S.; Mullins, M.; Cheang, M.C.; Leung, S.; Voduc, D.; Vickery, T.; Davies, S.; Fauron, C.; He, X.; Hu, Z.; et al. Supervised risk predictor of breast cancer based on intrinsic subtypes. J. Clin. Oncol. 2009, 27, 1160–1167. [Google Scholar] [CrossRef]
- Goldhirsch, A.; Wood, W.C.; Coates, A.S.; Gelber, R.D.; Thurlimann, B.; Senn, H.J. Strategies for subtypes--dealing with the diversity of breast cancer: Highlights of the St. Gallen International Expert Consensus on the Primary Therapy of Early Breast Cancer 2011. Ann. Oncol. J. Eur. Soc. Med. Oncol. 2011, 22, 1736–1747. [Google Scholar] [CrossRef]
- Chia, S.K.; Bramwell, V.H.; Tu, D.; Shepherd, L.E.; Jiang, S.; Vickery, T.; Mardis, E.; Leung, S.; Ung, K.; Pritchard, K.I.; et al. A 50-gene intrinsic subtype classifier for prognosis and prediction of benefit from adjuvant tamoxifen. Clin. Cancer Res. 2012, 18, 4465–4472. [Google Scholar] [CrossRef] [Green Version]
- Janni, W.J.; Rack, B.; Terstappen, L.W.; Pierga, J.Y.; Taran, F.A.; Fehm, T.; Hall, C.; de Groot, M.R.; Bidard, F.C.; Friedl, T.W.; et al. Pooled Analysis of the Prognostic Relevance of Circulating Tumor Cells in Primary Breast Cancer. Clin. Cancer Res. 2016, 22, 2583–2593. [Google Scholar] [CrossRef] [Green Version]
- Goldstein, N.S. Does the level of E-cadherin expression correlate with the primary breast carcinoma infiltration pattern and type of systemic metastases? Am. J. Clin. Pathol. 2002, 118, 425–434. [Google Scholar] [CrossRef] [Green Version]
- Soysal, S.D.; Muenst, S.; Barbie, T.; Fleming, T.; Gao, F.; Spizzo, G.; Oertli, D.; Viehl, C.T.; Obermann, E.C.; Gillanders, W.E. EpCAM expression varies significantly and is differentially associated with prognosis in the luminal B HER2(+), basal-like, and HER2 intrinsic subtypes of breast cancer. Br. J. Cancer 2013, 108, 1480–1487. [Google Scholar] [CrossRef]
- Giordano, A.; Giuliano, M.; De Laurentiis, M.; Eleuteri, A.; Iorio, F.; Tagliaferri, R.; Hortobagyi, G.N.; Pusztai, L.; De Placido, S.; Hess, K.; et al. Artificial neural network analysis of circulating tumor cells in metastatic breast cancer patients. Breast Cancer Res. Treat. 2011, 129, 451–458. [Google Scholar] [CrossRef] [PubMed]
- Giuliano, M.; Shaikh, A.; Lo, H.C.; Arpino, G.; De Placido, S.; Zhang, X.H.; Cristofanilli, M.; Schiff, R.; Trivedi, M.V. Perspective on Circulating Tumor Cell Clusters: Why It Takes a Village to Metastasize. Cancer Res. 2018, 78, 845–852. [Google Scholar] [CrossRef] [PubMed] [Green Version]
- Gkountela, S.; Castro-Giner, F.; Szczerba, B.M.; Vetter, M.; Landin, J.; Scherrer, R.; Krol, I.; Scheidmann, M.C.; Beisel, C.; Stirnimann, C.U.; et al. Circulating Tumor Cell Clustering Shapes DNA Methylation to Enable Metastasis Seeding. Cell 2019, 176, 98–112.e14. [Google Scholar] [CrossRef] [PubMed] [Green Version]
- Szczerba, B.M.; Castro-Giner, F.; Vetter, M.; Krol, I.; Gkountela, S.; Landin, J.; Scheidmann, M.C.; Donato, C.; Scherrer, R.; Singer, J.; et al. Neutrophils escort circulating tumour cells to enable cell cycle progression. Nature 2019, 566, 553–557. [Google Scholar] [CrossRef] [PubMed]


| Variables | ILC (n = 28) (%) | NST (n = 111) (%) | ILC vs. NST p-Value |
|---|---|---|---|
| Age at MBC Diagnosis, (years) Median | 67 (range 47–82) | 65 (range 40–90) | 0.36 f |
| Baseline Performance Status (ECOG) | |||
| 0 | 19 (68) | 56 (53) | 0.17 g |
| 1 | 6 (21) | 30 (29) | |
| 2 | 3 (11) | 19 (18) | |
| Unknown | 0 | 6 | |
| NHGa | |||
| I | 1 (5) | 9 (10) | 0.006g |
| II | 21 (95) | 40 (44) | |
| III | 0 (0) | 42 (46) | |
| Unknown | 6 | 20 | |
| Tumor SizeA | |||
| T1 | 7 (33) | 42 (40) | 0.79 g |
| T2 | 13 (62) | 36 (34) | |
| T3 | 4 (19) | 12 (11) | |
| T4 | 1 (5) | 16 (15) | |
| Unknown | 3 | 5 | |
| Axillary Node StatusA | |||
| Negative | 2 (8) | 35 (36) | 0.008g |
| Positive | 22 (92) | 62 (64) | |
| Unknown | 4 | 14 | |
| N0 | 2 (8) | 35 (36) | 0.002h |
| N1 (1–3) | 10 (42) | 32 (33) | |
| N2 (4–9) | 4 (17) | 22 (23) | |
| N3 (>9) | 8 (33) | 8 (8) | |
| IHC Phenotypeb | |||
| HR+ HER2– | 23 (82) | 71 (66) | 0.27 g |
| HER2+ | 2 (7) | 15 (14) | |
| HR– HER2– | 3 (11) | 21 (20) | |
| Unknown | 0 | 4 | |
| PAM50 Subtypec | |||
| Luminal A | 15 (71) | 28 (31) | 0.006h |
| Luminal B | 4 (19) | 36 (40) | |
| HER2-enriched | 2 (10) | 13 (14) | |
| Basal-like | 0 (0) | 13 (14) | |
| Unknown | 7 | 21 | |
| Distant Recurrence Free Interval (Years) | |||
| Median (range) | 5.3 (0–36) | 4.7 (0–24) | 0.41 f |
| 0 | 6 (21) | 21 (19) | 0.81 g |
| >0–3 | 3 (11) | 22 (20) | |
| >3 | 19 (68) | 68 (61) | |
| MBC at Primary Diagnosis | |||
| Yes | 6 (21) | 21 (19) | 0.76 g |
| No | 22 (79) | 90 (81) | |
| No. of Metastatic Sites | |||
| <3 | 24 (86) | 76 (68) | 0.07 g |
| ≥3 | 4 (14) | 35 (32) | |
| Site of Metastasis | |||
| Visceral d | 8 (29) | 72 (65) | 0.001g |
| Non-visceral | 20 (71) | 39 (35) | |
| Bone only | 11 (39) | 24 (22) | 0.05 g |
| Not bone only | 17 (61) | 87 (78) | |
| 1st Line Treatment for MBCe | |||
| Endocrine | 13 (46) | 43 (39) | 0.90 h |
| Chemotherapy only | 13 (46) | 57 (52) | |
| HER2-targeted + Chemotherapy | 2 (7) | 9 (8) | |
| Unknown | 0 | 2 | |
| Progression-Free | |||
| Yes | 2 (7) | 10 (9) | N/A i |
| No | 26 (93) | 101 (91) | |
| Alive | |||
| Yes | 8 (29) | 34 (31) | N/A i |
| No | 20 (71) | 77 (69) |
| Baseline CTC Status a (No. Per 7.5 mL Blood) | ILC (n = 28) (%) | NST (n = 111) (%) | ILC vs. NST p-Value |
|---|---|---|---|
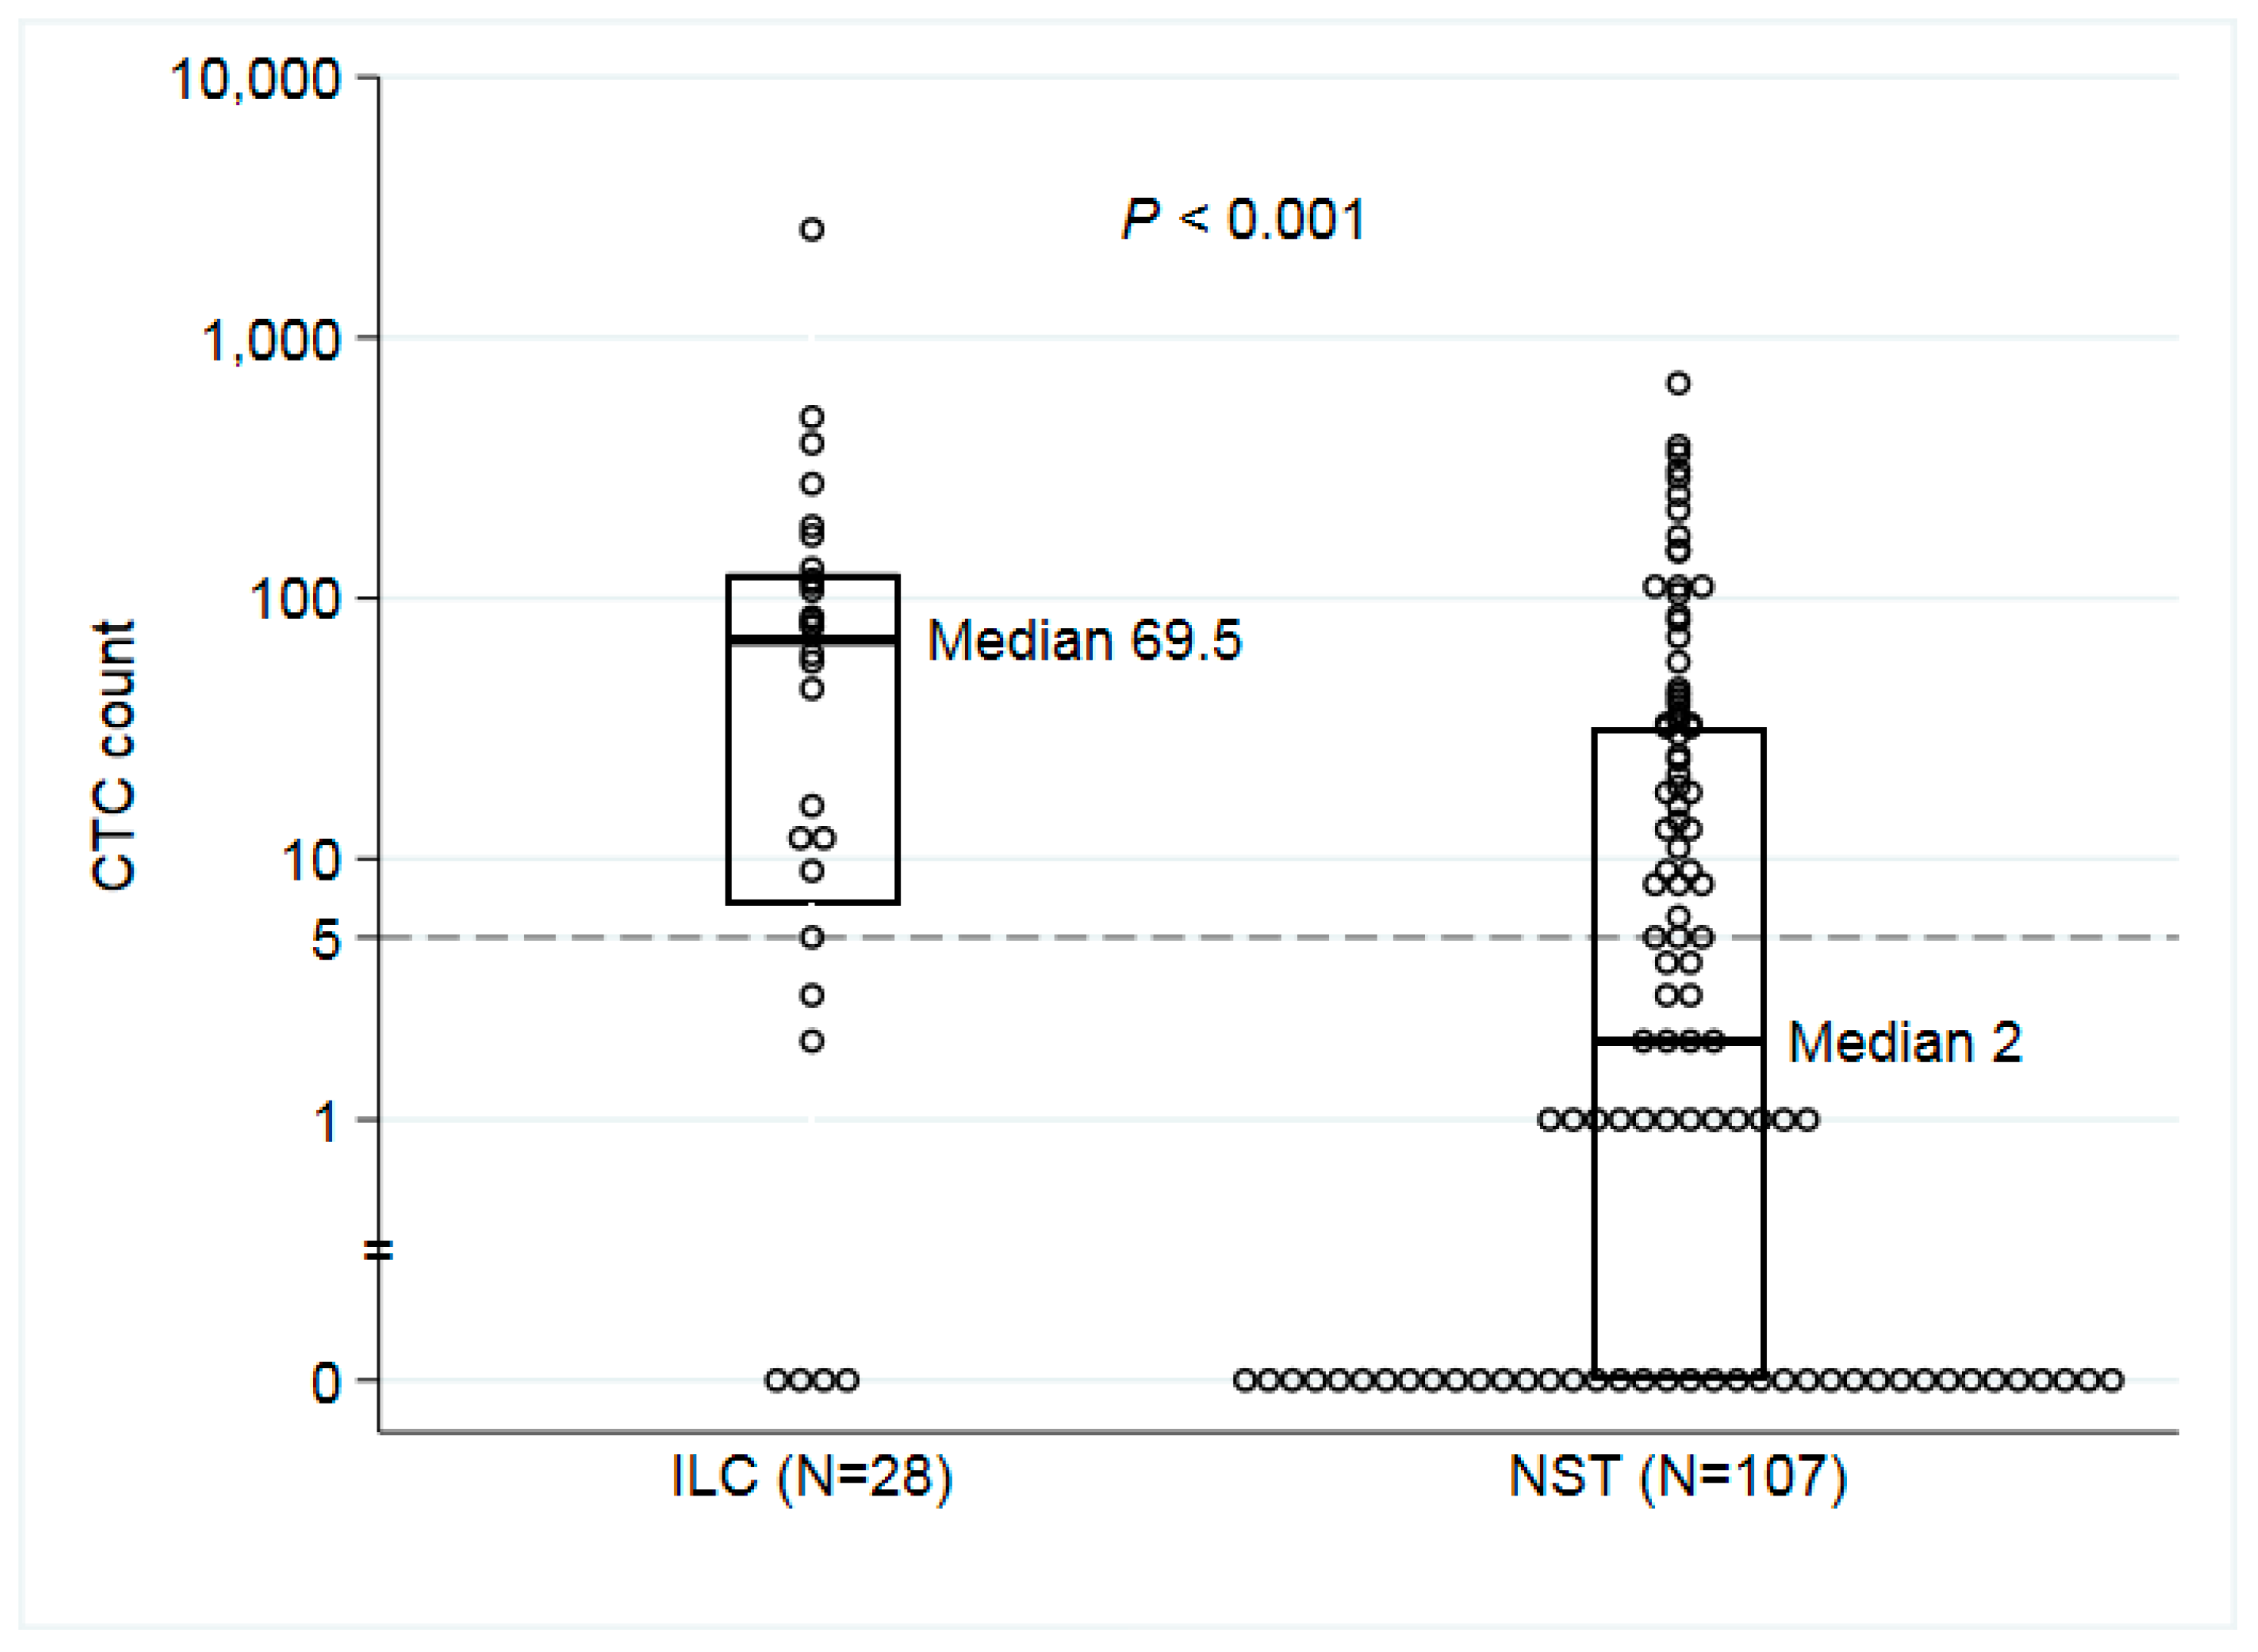
| CTC Median (Range) | 70 (0–2598) | 2 (0–668) | <0.001c |
| CTC < 5 | 6 (21) | 58 (54) | |
| CTC ≥ 5 | 22 (79) | 49 (46) | 0.003d |
| CTC < 20 | 11 (39) | 75 (70) | |
| CTC ≥ 20 | 17 (61) | 32 (30) | 0.004d |
| CTC < 80 | 11 (39) | 91 (85) | |
| CTC ≥ 80 | 17 (61) | 16 (15) | 0.003d |
| CTC clusters absent | 18 (64) | 88 (82) | |
| CTC clusters ≥ 1 | 10 (36) | 19 (18) | 0.07 d |
| Unknown | 0 | 4 | |
| Baseline CA 15-3 valueb (U/mL) | |||
| CA15-3 Median (Range) | 392 (17–2999) | 91 (6–2999) | 0.004c |
| CA 15-3 < 30 | 4 (15) | 25 (24) | |
| CA 15-3 ≥ 30 | 23 (85) | 79 (76) | 0.30 d |
| CA 15-3 < 100 | 8 (30) | 56 (54) | |
| CA 15-3 ≥ 100 | 19 (70) | 48 (46) | 0.03d |
| CA 15-3 < 200 | 11 (41) | 73 (70) | |
| CA 15-3 ≥ 200 | 16 (59) | 31 (30) | 0.004d |
| CA 15-3 < 400 | 14 (52) | 84 (81) | |
| CA 15-3 ≥ 400 | 13 (48) | 20 (19) | 0.002d |
| Unknown | 1 | 7 |
© 2020 by the authors. Licensee MDPI, Basel, Switzerland. This article is an open access article distributed under the terms and conditions of the Creative Commons Attribution (CC BY) license (http://creativecommons.org/licenses/by/4.0/).
Share and Cite
Narbe, U.; Bendahl, P.-O.; Aaltonen, K.; Fernö, M.; Forsare, C.; Jørgensen, C.L.T.; Larsson, A.-M.; Rydén, L. The Distribution of Circulating Tumor Cells Is Different in Metastatic Lobular Compared to Ductal Carcinoma of the Breast—Long-Term Prognostic Significance. Cells 2020, 9, 1718. https://doi.org/10.3390/cells9071718
Narbe U, Bendahl P-O, Aaltonen K, Fernö M, Forsare C, Jørgensen CLT, Larsson A-M, Rydén L. The Distribution of Circulating Tumor Cells Is Different in Metastatic Lobular Compared to Ductal Carcinoma of the Breast—Long-Term Prognostic Significance. Cells. 2020; 9(7):1718. https://doi.org/10.3390/cells9071718
Chicago/Turabian StyleNarbe, Ulrik, Pär-Ola Bendahl, Kristina Aaltonen, Mårten Fernö, Carina Forsare, Charlotte Levin Tykjær Jørgensen, Anna-Maria Larsson, and Lisa Rydén. 2020. "The Distribution of Circulating Tumor Cells Is Different in Metastatic Lobular Compared to Ductal Carcinoma of the Breast—Long-Term Prognostic Significance" Cells 9, no. 7: 1718. https://doi.org/10.3390/cells9071718