Expression of Annexin A2 Promotes Cancer Progression in Estrogen Receptor Negative Breast Cancers

 , , and
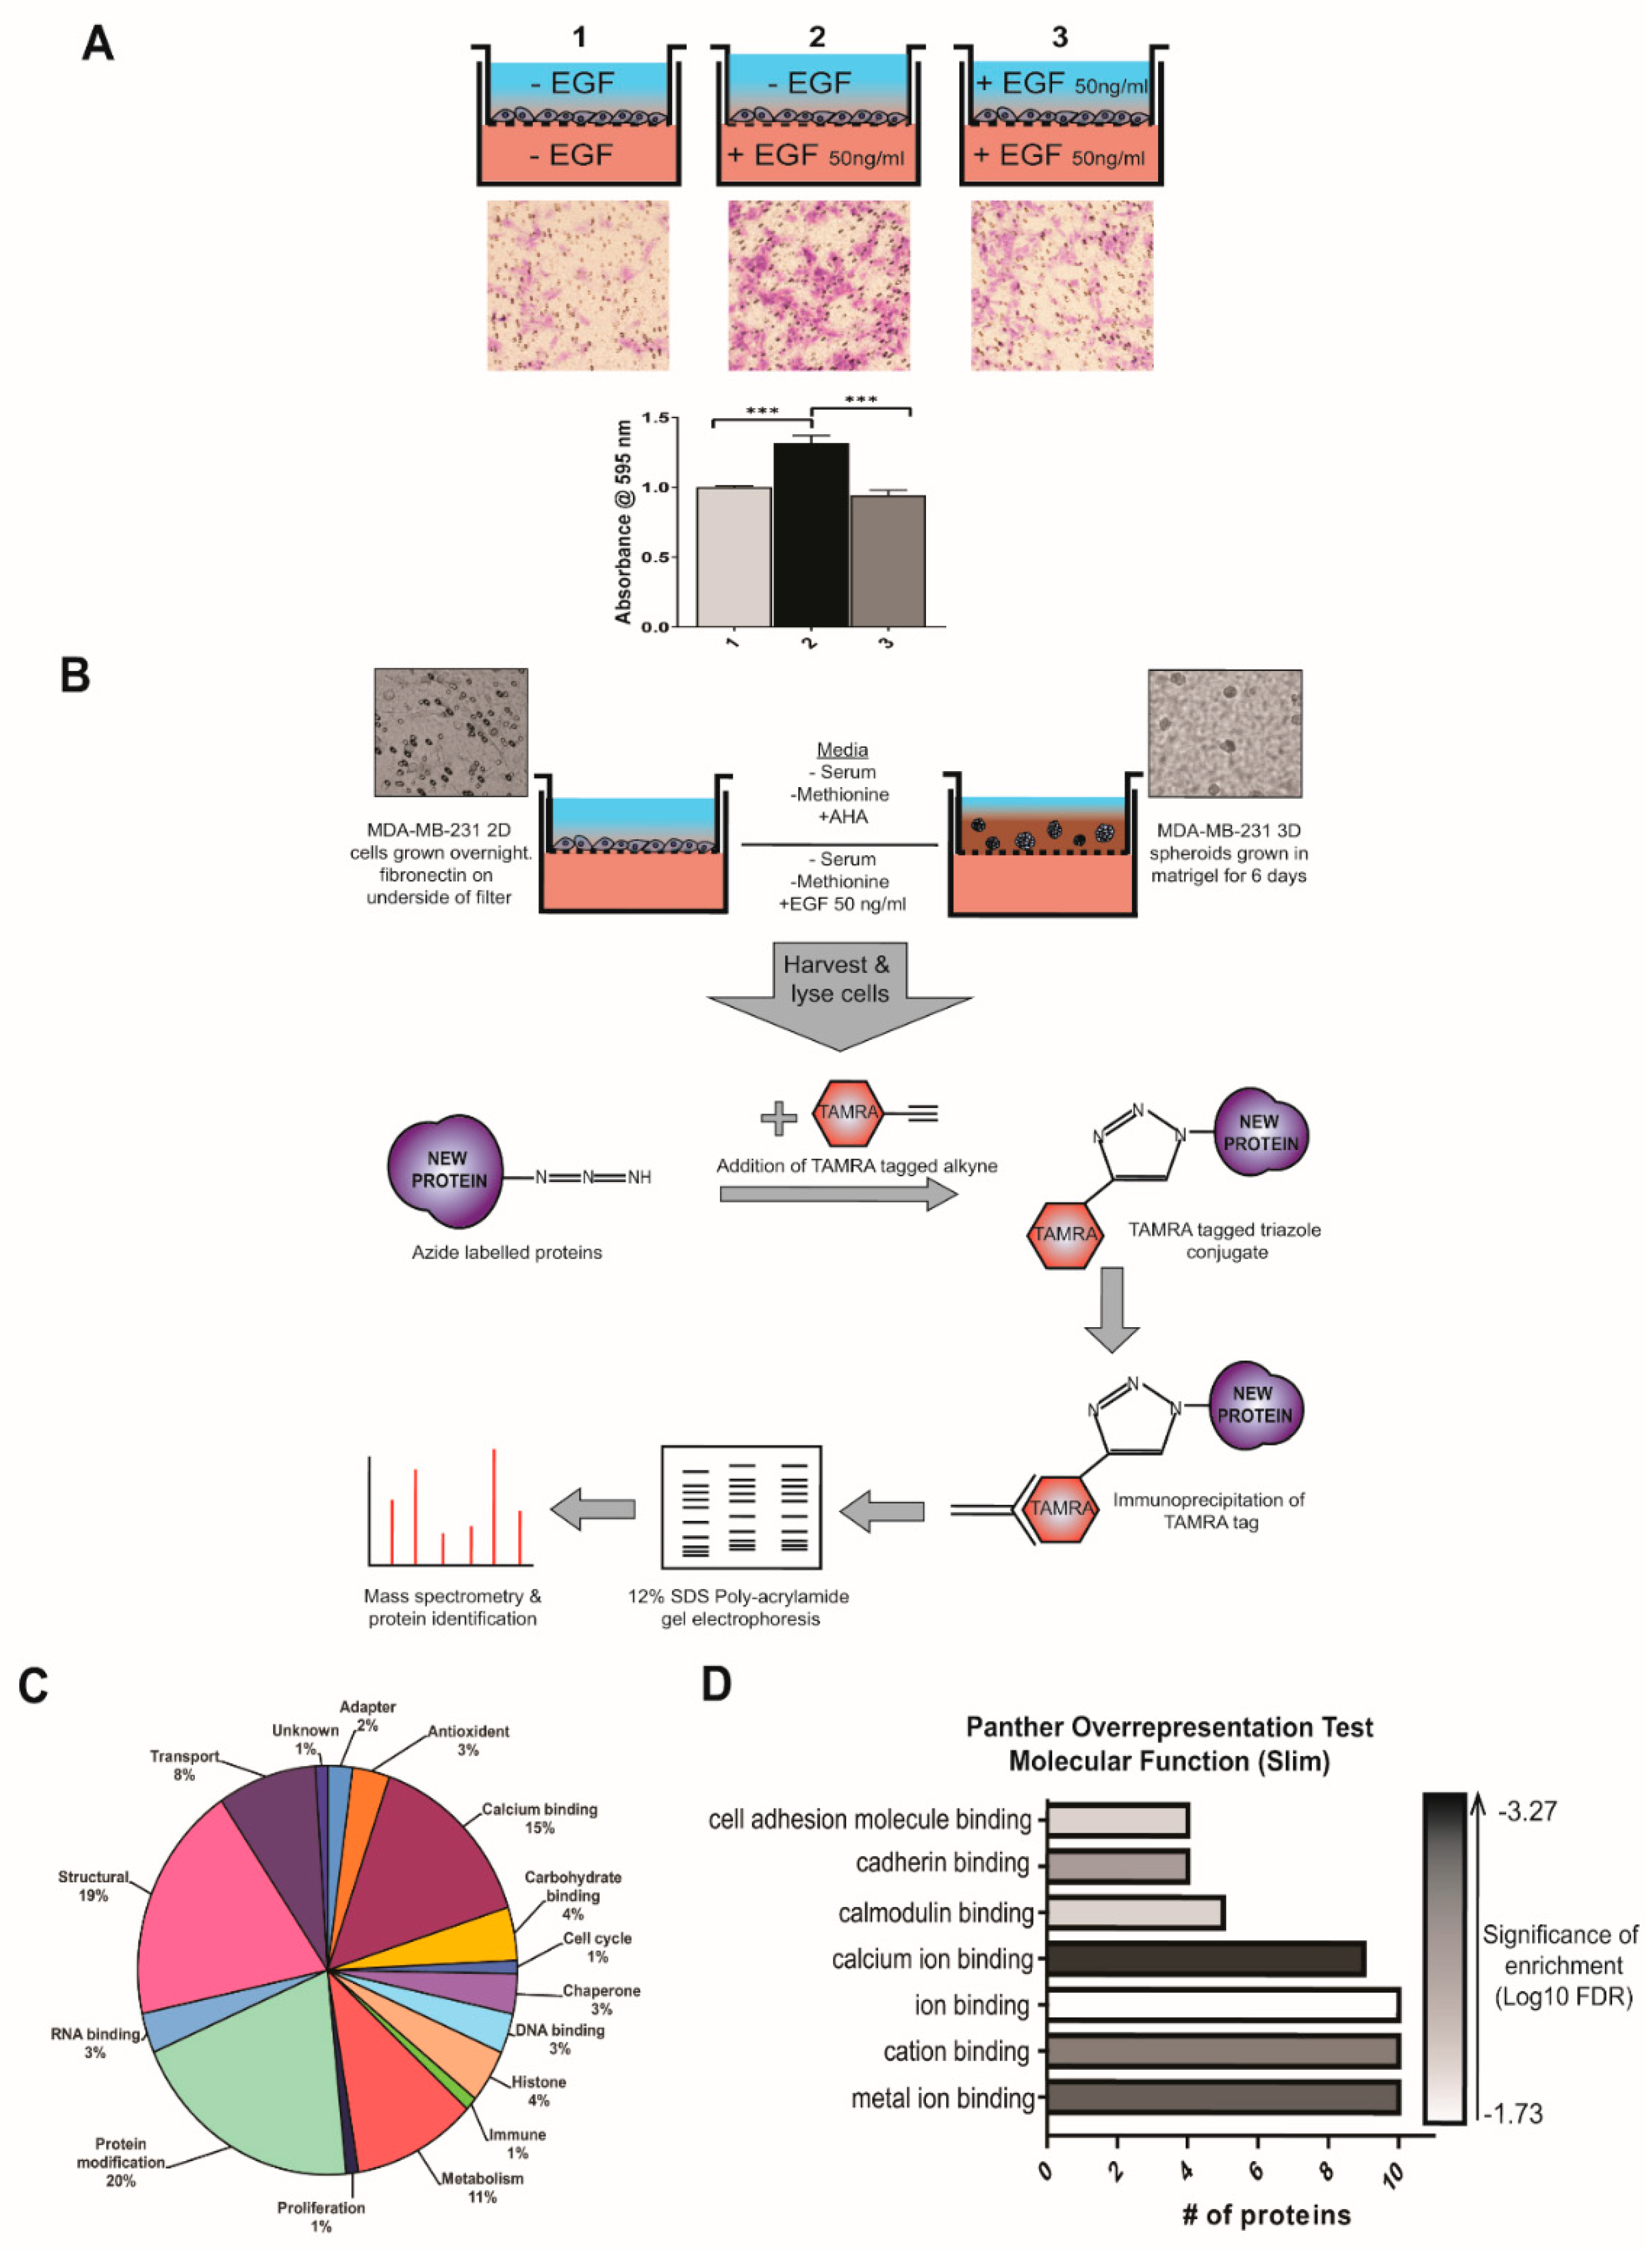
Abstract
:1. Introduction
2. Materials and Methods
2.1. Cell Culture
2.2. Click-iT Reaction
2.3. Immunoprecipitation
2.4. Mass Spectrometry and Data Analysis
2.5. Cell Lysis, SDS PAGE and Western Blotting
2.6. siRNA Transfection
2.7. Tissue Collection
2.8. RNA Extraction
2.9. RT-qPCR
2.10. Cell Migration Assays
2.11. Real-Time Proliferation Assay
2.12. Use of Publicly Available Gene & Protein Expression Datasets
2.13. Statistical Analysis
3. Results
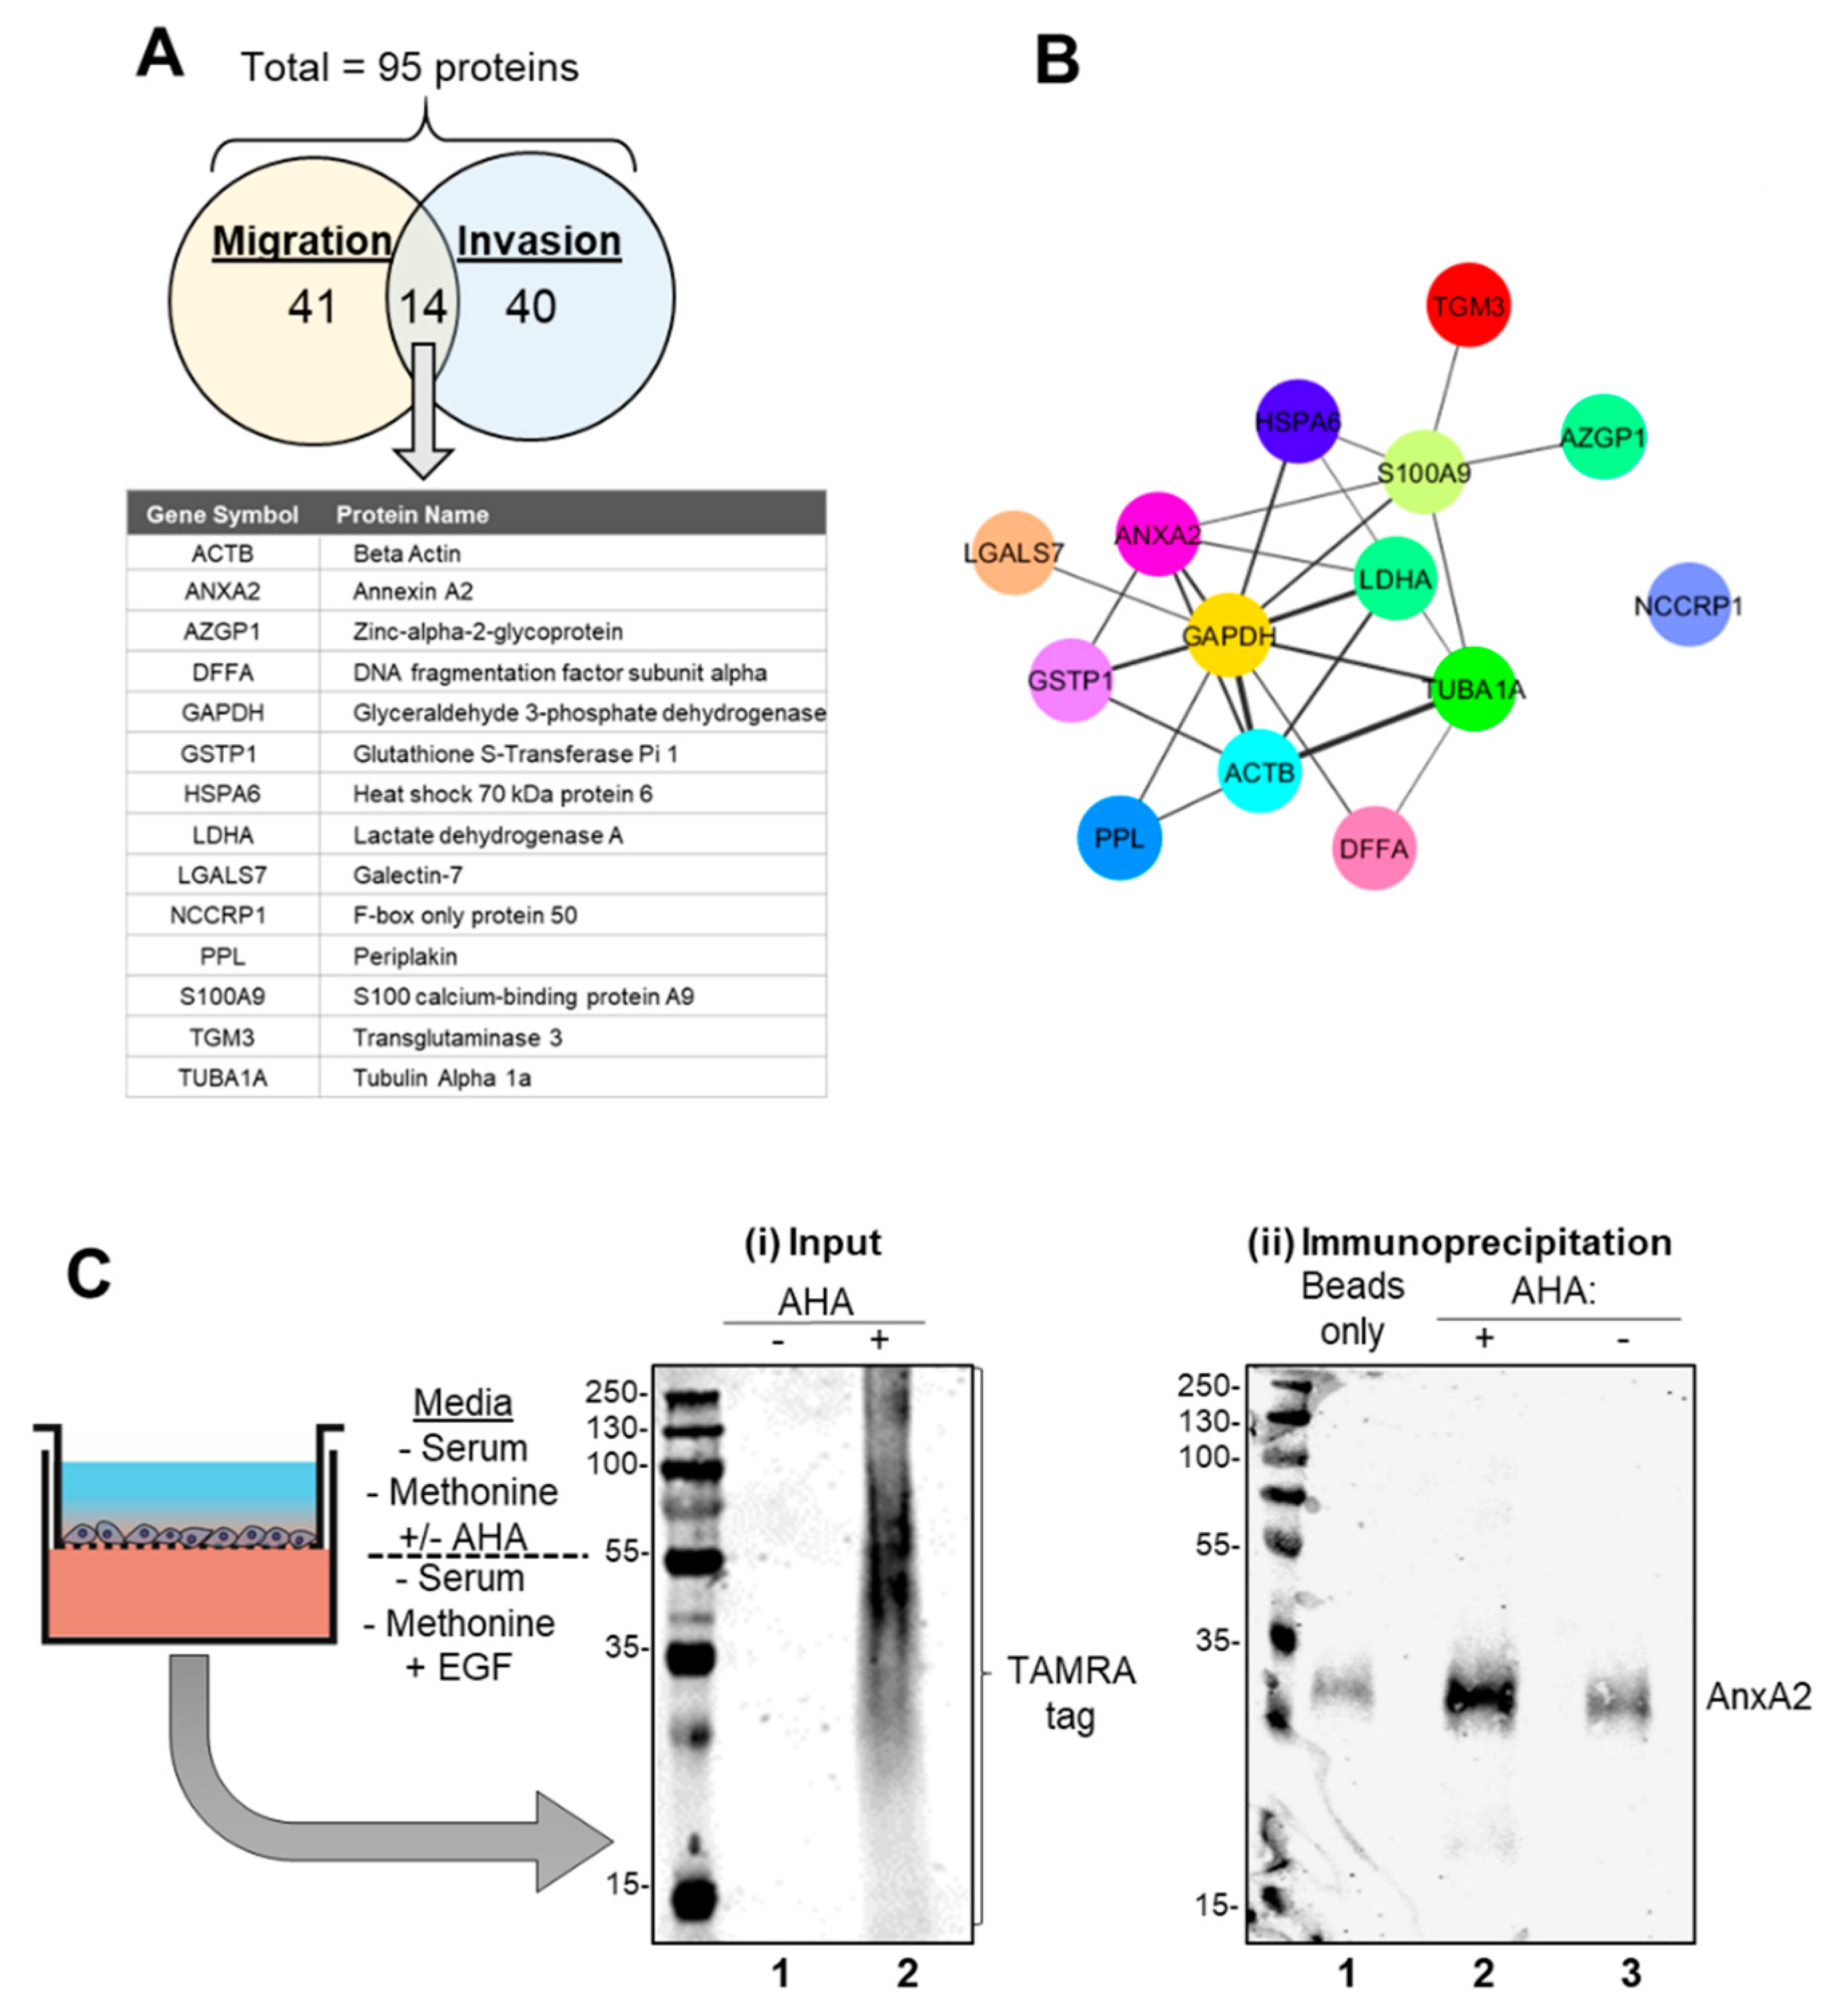
3.1. Isolation and Identification of Newly Synthesised Proteins Involved in Breast Cancer Cell Metastasis
3.2. Identification and Verification of Annexin A2 as A Newly Synthesized Protein in EGF Stimulated Migration and Invasion
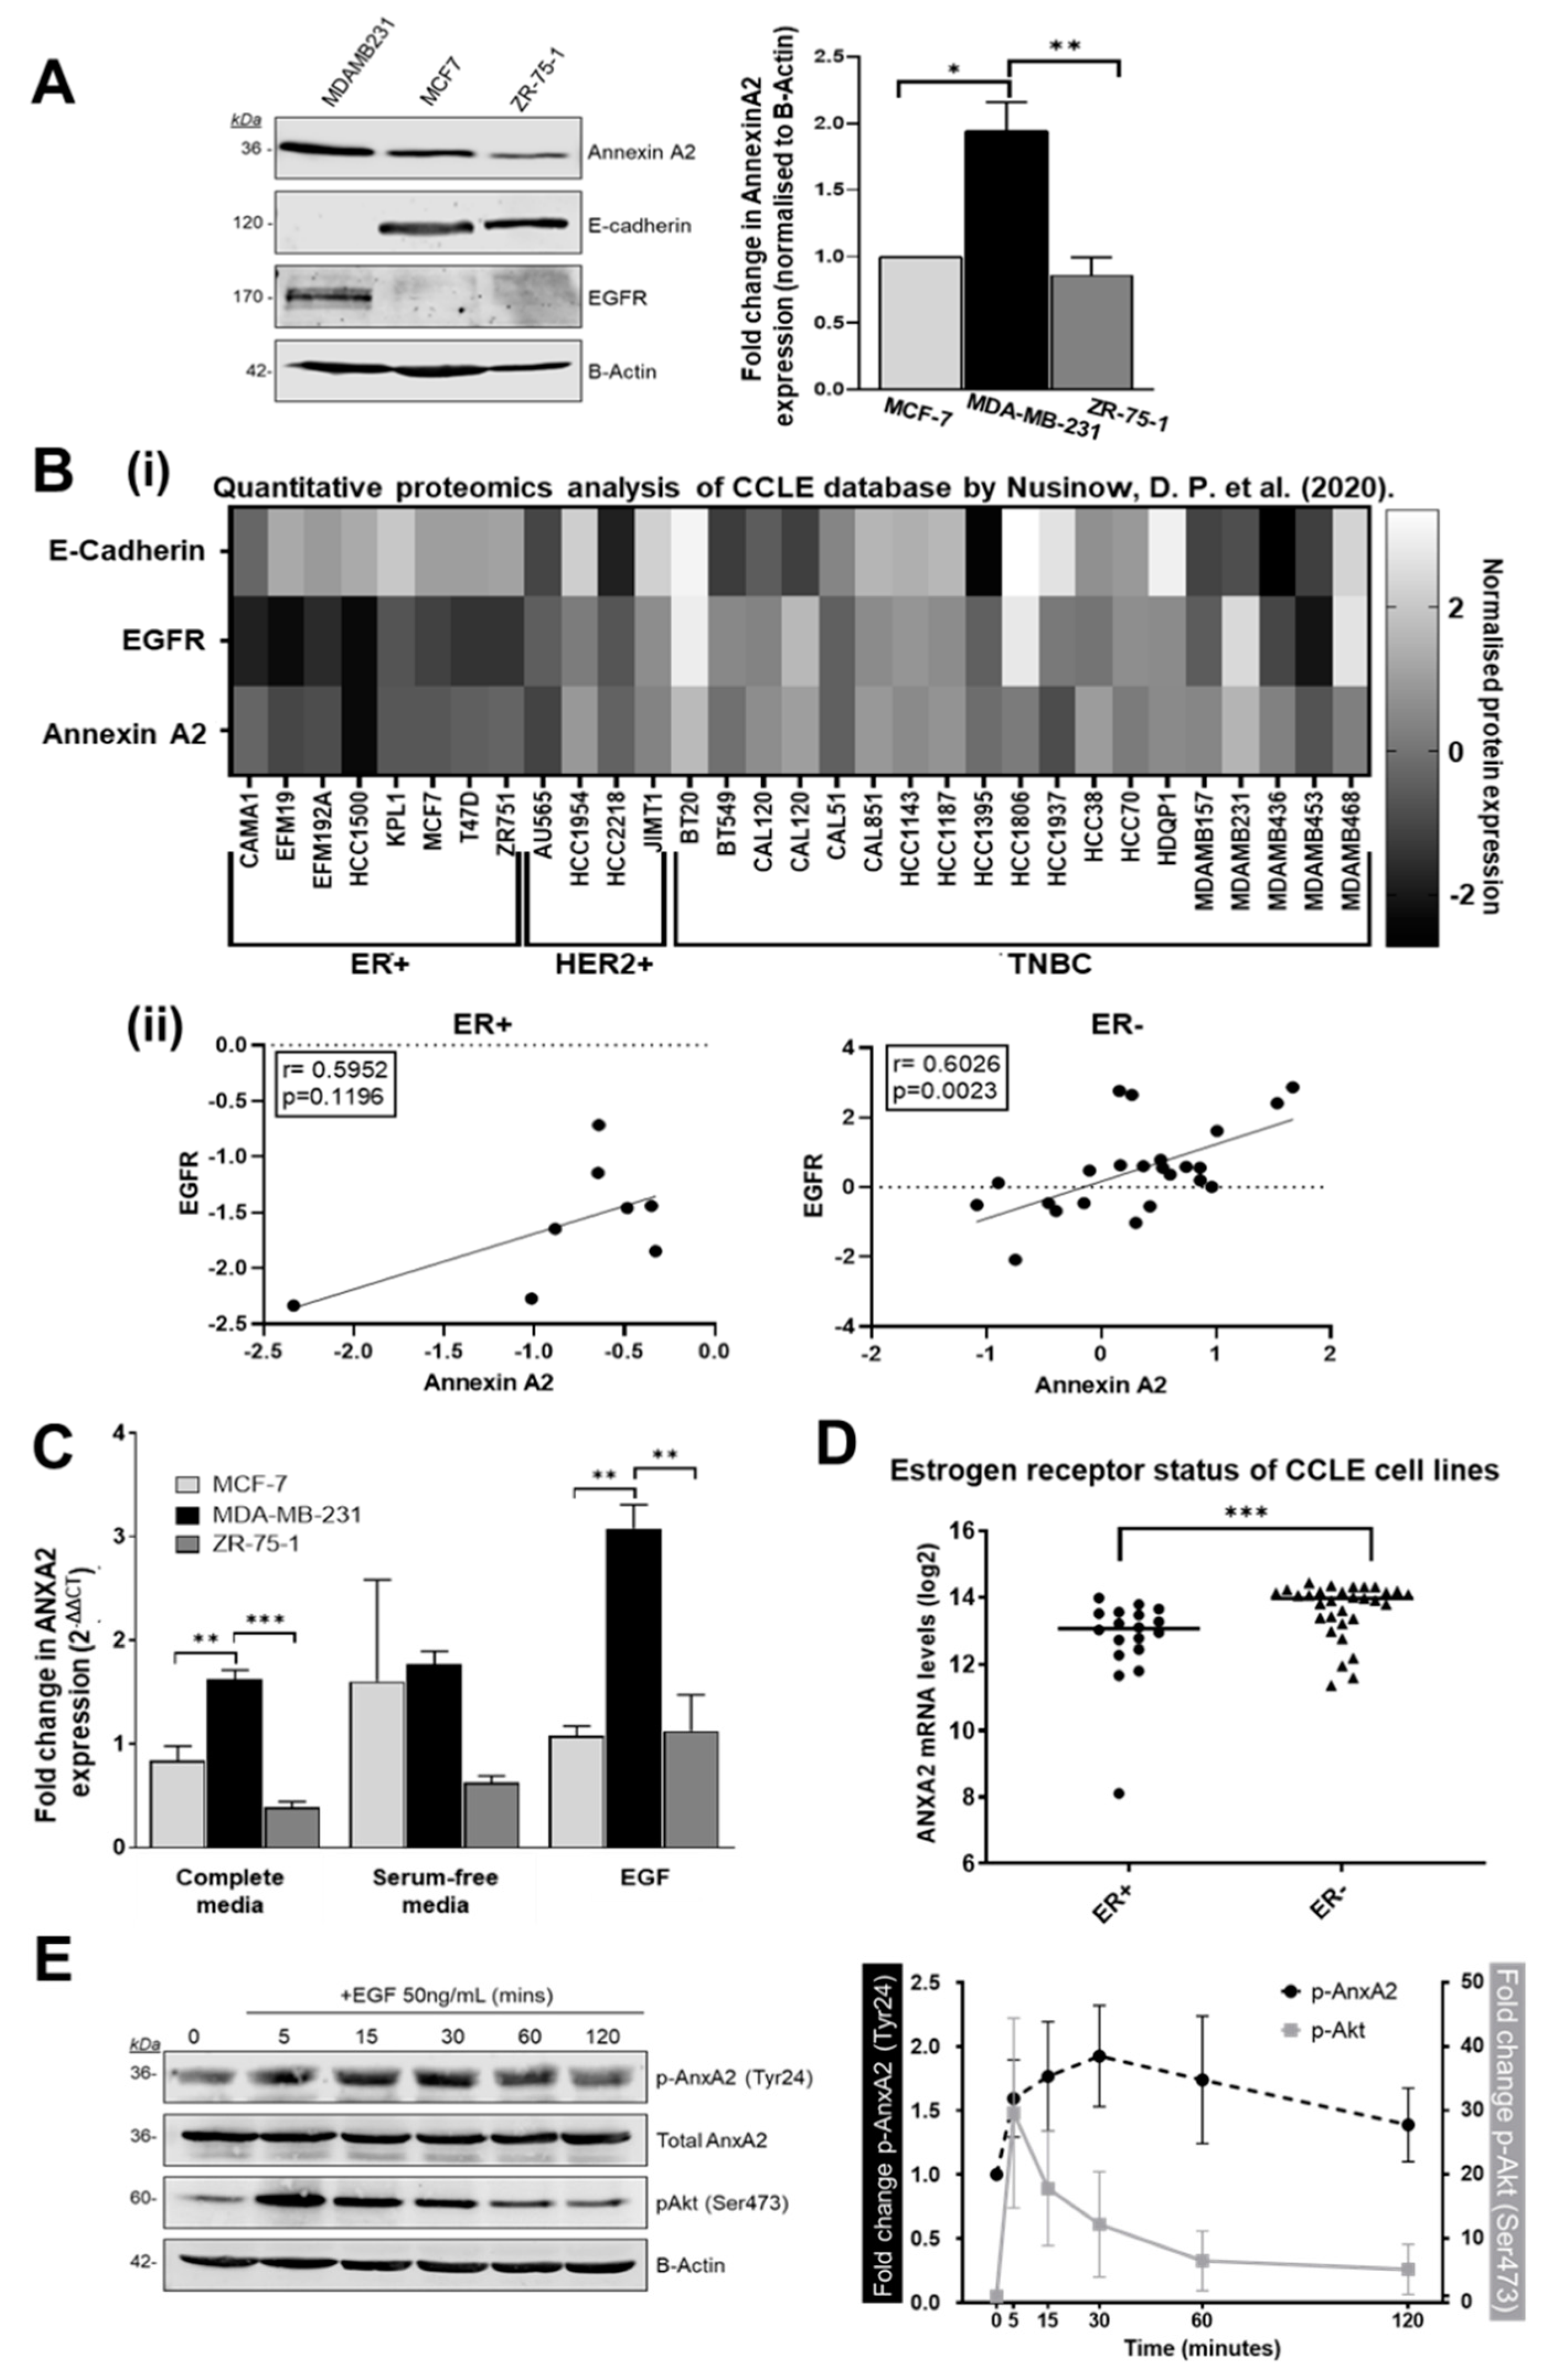
3.3. Annexin A2 Expression is Increased in Estrogen Receptor Negative Breast Cancer Cells
3.4. Annexin A2 is Required for Cell Proliferation, Wound Healing and EGF Directed Cell Migration of ER Negative Breast Cancer Cells
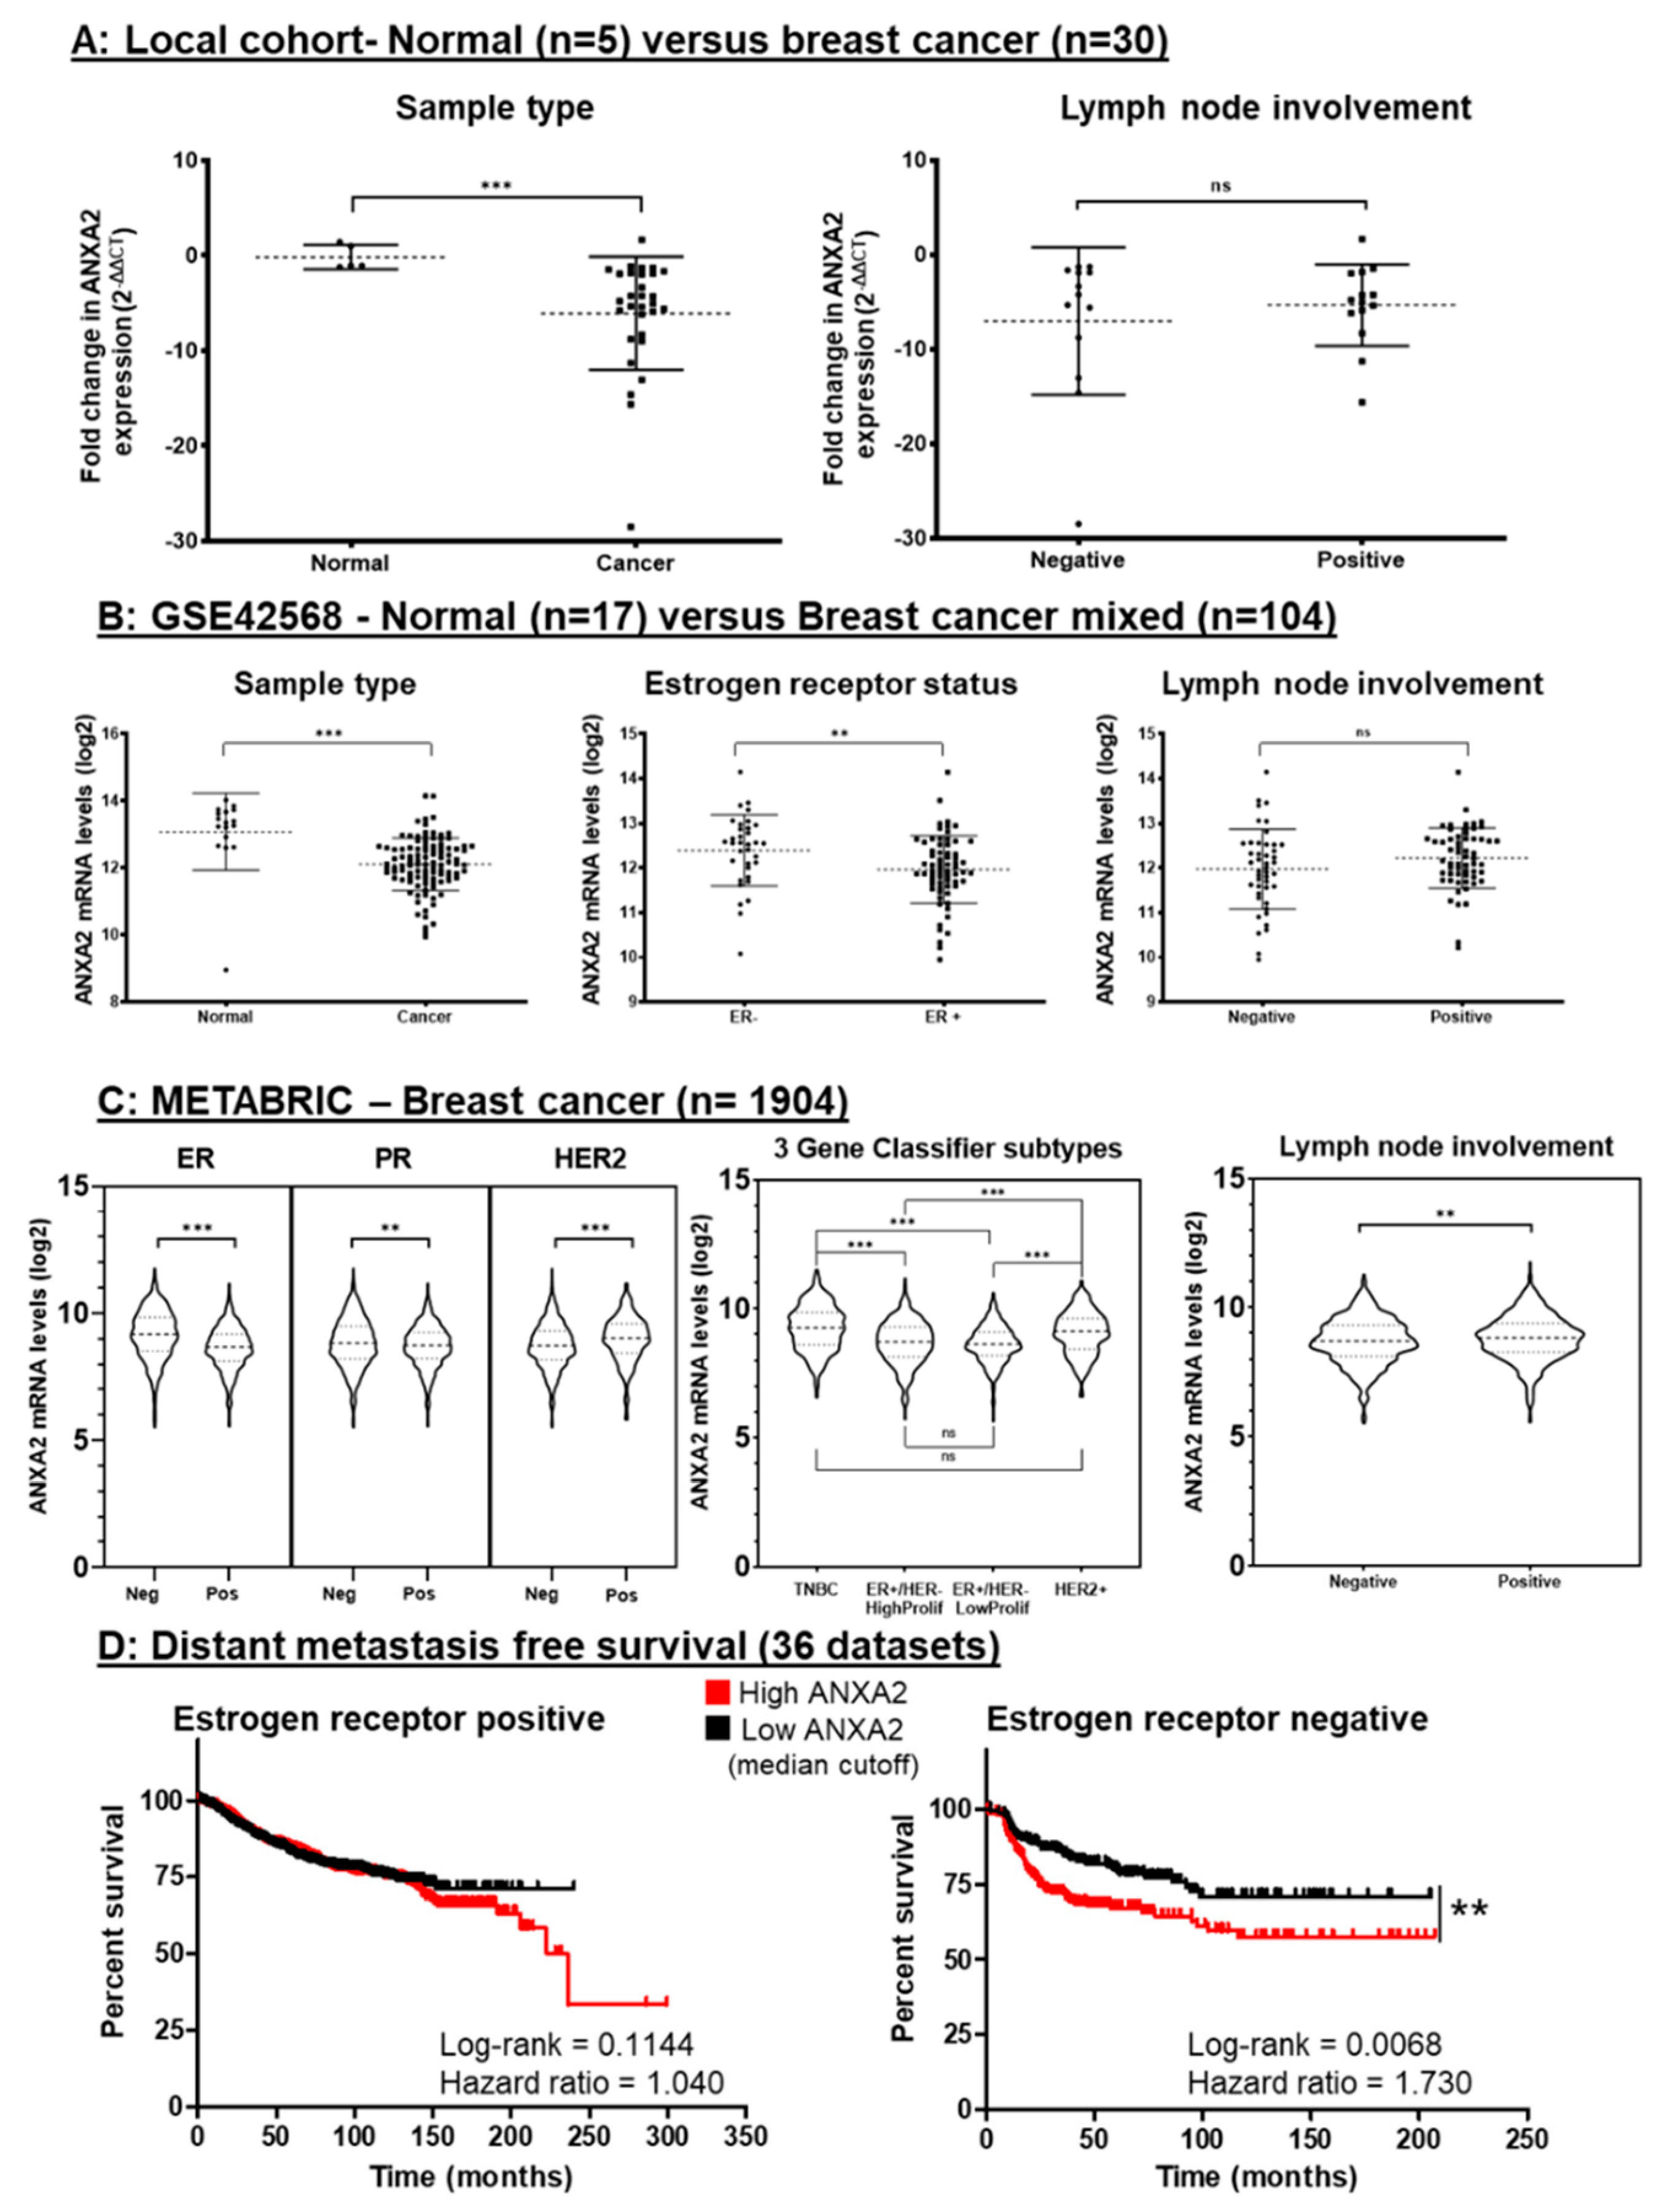
3.5. Gene Expression Analysis of Breast Cancer Tissue Shows ANXA2 is Specifically Upregulated in ER Negative Breast Cancer and Correlates with Rates of Metastasis
4. Discussion
5. Conclusions
Supplementary Materials
Author Contributions
Funding
Acknowledgments
Conflicts of Interest
References
- Balkwill, F.R.; Capasso, M.; Hagemann, T. The tumor microenvironment at a glance. J. Cell Sci. 2012, 125, 5591–5596. [Google Scholar] [CrossRef] [Green Version]
- Sahai, E. Illuminating the metastatic process. Nat. Rev. Cancer 2007, 7, 737–749. [Google Scholar] [CrossRef] [PubMed]
- Chambers, A.F.; Groom, A.C.; MacDonald, I.C. Dissemination and growth of cancer cells in metastatic sites. Nat. Rev. Cancer 2002, 2, 563–572. [Google Scholar] [CrossRef] [PubMed]
- Stuelten, C.H.; Parent, C.A.; Montell, D.J. Cell motility in cancer invasion and metastasis: Insights from simple model organisms. Nat. Rev. Cancer 2018, 18, 296–312. [Google Scholar] [CrossRef] [PubMed]
- Welch, D.R.; Hurst, D.R. Defining the Hallmarks of Metastasis. Cancer Res. 2019, 79, 3011–3027. [Google Scholar] [CrossRef] [PubMed]
- Albini, A.; Benelli, R.; Noonan, D.M.; Brigati, C. The “chemoinvasion assay”: A tool to study tumor and endothelial cell invasion of basement membranes. Int. J. Dev. Biol. 2004, 48, 563–571. [Google Scholar] [CrossRef] [Green Version]
- Harbeck, N.; Penault-Llorca, F.; Cortes, J.; Gnant, M.; Houssami, N.; Poortmans, P.; Ruddy, K.; Tsang, J.; Cardoso, F. Breast cancer. Nat. Rev. Dis. Primers 2019, 5, 66. [Google Scholar] [CrossRef]
- Kennecke, H.; Yerushalmi, R.; Woods, R.; Cheang, M.C.; Voduc, D.; Speers, C.H.; Nielsen, T.O.; Gelmon, K. Metastatic behavior of breast cancer subtypes. J. Clin. Oncol. 2010, 28, 3271–3277. [Google Scholar] [CrossRef]
- Dieterich, D.C.; Link, A.J.; Graumann, J.; Tirrell, D.A.; Schuman, E.M. Selective identification of newly synthesized proteins in mammalian cells using bioorthogonal noncanonical amino acid tagging (BONCAT). Proc. Natl. Acad. Sci. USA 2006, 103, 9482–9487. [Google Scholar] [CrossRef] [Green Version]
- Schwanhausser, B.; Busse, D.; Li, N.; Dittmar, G.; Schuchhardt, J.; Wolf, J.; Chen, W.; Selbach, M. Global quantification of mammalian gene expression control. Nature 2011, 473, 337–342. [Google Scholar] [CrossRef] [Green Version]
- Geiger, T.; Madden, S.F.; Gallagher, W.M.; Cox, J.; Mann, M. Proteomic portrait of human breast cancer progression identifies novel prognostic markers. Cancer Res. 2012, 72, 2428–2439. [Google Scholar] [CrossRef] [PubMed] [Green Version]
- Yanovich, G.; Agmon, H.; Harel, M.; Sonnenblick, A.; Peretz, T.; Geiger, T. Clinical Proteomics of Breast Cancer Reveals a Novel Layer of Breast Cancer Classification. Cancer Res. 2018, 78, 6001–6010. [Google Scholar] [CrossRef] [PubMed] [Green Version]
- Al-Wajeeh, A.S.; Salhimi, S.M.; Al-Mansoub, M.A.; Khalid, I.A.; Harvey, T.M.; Latiff, A.; Ismail, M.N. Comparative proteomic analysis of different stages of breast cancer tissues using ultra high performance liquid chromatography tandem mass spectrometer. PLoS ONE 2020, 15, e0227404. [Google Scholar] [CrossRef] [PubMed] [Green Version]
- Chakraborty, S.; Hosen, M.I.; Ahmed, M.; Shekhar, H.U. Onco-Multi-OMICS Approach: A New Frontier in Cancer Research. Biomed. Res. Int. 2018, 2018, 9836256. [Google Scholar] [CrossRef] [PubMed] [Green Version]
- Mi, H.; Muruganujan, A.; Ebert, D.; Huang, X.; Thomas, P.D. PANTHER version 14: More genomes, a new PANTHER GO-slim and improvements in enrichment analysis tools. Nucleic Acids Res. 2019, 47, D419–D426. [Google Scholar] [CrossRef]
- Szklarczyk, D.; Gable, A.L.; Lyon, D.; Junge, A.; Wyder, S.; Huerta-Cepas, J.; Simonovic, M.; Doncheva, N.T.; Morris, J.H.; Bork, P.; et al. STRING v11: Protein-protein association networks with increased coverage, supporting functional discovery in genome-wide experimental datasets. Nucleic Acids Res. 2019, 47, D607–D613. [Google Scholar] [CrossRef] [Green Version]
- Doncheva, N.T.; Morris, J.H.; Gorodkin, J.; Jensen, L.J. Cytoscape StringApp: Network Analysis and Visualization of Proteomics Data. J. Proteome Res. 2019, 18, 623–632. [Google Scholar] [CrossRef]
- Dowling, C.M.; Walsh, D.; Coffey, J.C.; Kiely, P.A. The importance of selecting the appropriate reference genes for quantitative real time PCR as illustrated using colon cancer cells and tissue. F1000Research 2016, 5, 99. [Google Scholar] [CrossRef] [Green Version]
- Nusinow, D.P.; Szpyt, J.; Ghandi, M.; Rose, C.M.; McDonald, E.R.; Kalocsay, M.; Jane-Valbuena, J.; Gelfand, E.; Schweppe, D.K.; Jedrychowski, M.; et al. Quantitative Proteomics of the Cancer Cell Line Encyclopedia. Cell 2020, 180, 387–402.e16. [Google Scholar] [CrossRef]
- Nusinow, D.P.; Gygi, S.P. A Guide to the Quantitative Proteomic Profiles of the Cancer Cell Line Encyclopedia. bioRxiv 2020. [Google Scholar] [CrossRef] [Green Version]
- Barretina, J.; Caponigro, G.; Stransky, N.; Venkatesan, K.; Margolin, A.A.; Kim, S.; Wilson, C.J.; Lehar, J.; Kryukov, G.V.; Sonkin, D.; et al. The Cancer Cell Line Encyclopedia enables predictive modelling of anticancer drug sensitivity. Nature 2012, 483, 603–607. [Google Scholar] [CrossRef] [PubMed]
- Smith, S.E.; Mellor, P.; Ward, A.K.; Kendall, S.; McDonald, M.; Vizeacoumar, F.S.; Vizeacoumar, F.J.; Napper, S.; Anderson, D.H. Molecular characterization of breast cancer cell lines through multiple omic approaches. Breast Cancer Res. 2017, 19, 65. [Google Scholar] [CrossRef] [Green Version]
- Dai, X.; Cheng, H.; Bai, Z.; Li, J. Breast Cancer Cell Line Classification and Its Relevance with Breast Tumor Subtyping. J. Cancer 2017, 8, 3131–3141. [Google Scholar] [CrossRef] [PubMed] [Green Version]
- Clarke, C.; Madden, S.F.; Doolan, P.; Aherne, S.T.; Joyce, H.; O’Driscoll, L.; Gallagher, W.M.; Hennessy, B.T.; Moriarty, M.; Crown, J.; et al. Correlating transcriptional networks to breast cancer survival: A large-scale coexpression analysis. Carcinogenesis 2013, 34, 2300–2308. [Google Scholar] [CrossRef] [PubMed]
- Tyanova, S.; Albrechtsen, R.; Kronqvist, P.; Cox, J.; Mann, M.; Geiger, T. Proteomic maps of breast cancer subtypes. Nat. Commun. 2016, 7, 10259. [Google Scholar] [CrossRef] [PubMed] [Green Version]
- Gyorffy, B.; Lanczky, A.; Eklund, A.C.; Denkert, C.; Budczies, J.; Li, Q.; Szallasi, Z. An online survival analysis tool to rapidly assess the effect of 22,277 genes on breast cancer prognosis using microarray data of 1809 patients. Breast Cancer Res. Treat. 2010, 123, 725–731. [Google Scholar] [CrossRef] [PubMed] [Green Version]
- Price, J.T.; Tiganis, T.; Agarwal, A.; Djakiew, D.; Thompson, E.W. Epidermal growth factor promotes MDA-MB-231 breast cancer cell migration through a phosphatidylinositol 3′-kinase and phospholipase C-dependent mechanism. Cancer Res. 1999, 59, 5475–5478. [Google Scholar]
- Wang, S.J.; Saadi, W.; Lin, F.; Minh-Canh Nguyen, C.; Li Jeon, N. Differential effects of EGF gradient profiles on MDA-MB-231 breast cancer cell chemotaxis. Exp. Cell Res. 2004, 300, 180–189. [Google Scholar] [CrossRef]
- Lu, Z.; Jiang, G.; Blume-Jensen, P.; Hunter, T. Epidermal growth factor-induced tumor cell invasion and metastasis initiated by dephosphorylation and downregulation of focal adhesion kinase. Mol. Cell. Biol. 2001, 21, 4016–4031. [Google Scholar] [CrossRef] [Green Version]
- Biswenger, V.; Baumann, N.; Jurschick, J.; Hackl, M.; Battle, C.; Schwarz, J.; Horn, E.; Zantl, R. Characterization of EGF-guided MDA-MB-231 cell chemotaxis in vitro using a physiological and highly sensitive assay system. PLoS ONE 2018, 13, e0203040. [Google Scholar] [CrossRef]
- Sayers, E.W.; Agarwala, R.; Bolton, E.E.; Brister, J.R.; Canese, K.; Clark, K.; Connor, R.; Fiorini, N.; Funk, K.; Hefferon, T.; et al. Database resources of the National Center for Biotechnology Information. Nucleic Acids Res. 2019, 47, D23–D28. [Google Scholar] [CrossRef] [PubMed] [Green Version]
- Gerke, V.; Moss, S.E. Annexins: From structure to function. Physiol. Rev. 2002, 82, 331–371. [Google Scholar] [CrossRef] [PubMed]
- Boye, T.L.; Nylandsted, J. Annexins in plasma membrane repair. Biol. Chem. 2016, 397, 961–969. [Google Scholar] [CrossRef]
- Hajjar, K.A. The Biology of Annexin A2: From Vascular Fibrinolysis to Innate Immunity. Trans. Am. Clin. Clim. Assoc. 2015, 126, 144–155. [Google Scholar]
- Grieve, A.G.; Moss, S.E.; Hayes, M.J. Annexin A2 at the interface of actin and membrane dynamics: A focus on its roles in endocytosis and cell polarization. Int. J. Cell Biol. 2012, 2012, 852430. [Google Scholar] [CrossRef] [PubMed] [Green Version]
- Xiao, L.; Jin, H.; Duan, W.; Hou, Y. Roles of N-terminal Annexin A2 phosphorylation sites and miR-206 in colonic adenocarcinoma. Life Sci. 2020, 253, 117740. [Google Scholar] [CrossRef]
- Morel, E.; Parton, R.G.; Gruenberg, J. Annexin A2-dependent polymerization of actin mediates endosome biogenesis. Dev. Cell 2009, 16, 445–457. [Google Scholar] [CrossRef]
- Rescher, U.; Ludwig, C.; Konietzko, V.; Kharitonenkov, A.; Gerke, V. Tyrosine phosphorylation of annexin A2 regulates Rho-mediated actin rearrangement and cell adhesion. J. Cell Sci. 2008, 121, 2177–2185. [Google Scholar] [CrossRef] [Green Version]
- de Graauw, M.; Tijdens, I.; Smeets, M.B.; Hensbergen, P.J.; Deelder, A.M.; van de Water, B. Annexin A2 phosphorylation mediates cell scattering and branching morphogenesis via cofilin Activation. Mol. Cell. Biol. 2008, 28, 1029–1040. [Google Scholar] [CrossRef] [Green Version]
- Bunnell, T.M.; Burbach, B.J.; Shimizu, Y.; Ervasti, J.M. beta-Actin specifically controls cell growth, migration, and the G-actin pool. Mol. Biol. Cell 2011, 22, 4047–4058. [Google Scholar] [CrossRef]
- Grewal, T.; Wason, S.J.; Enrich, C.; Rentero, C. Annexins—Insights from knockout mice. Biol. Chem. 2016, 397, 1031–1053. [Google Scholar] [CrossRef] [PubMed]
- Christensen, M.V.; Hogdall, C.K.; Jochumsen, K.M.; Hogdall, E.V.S. Annexin A2 and cancer: A systematic review. Int. J. Oncol. 2018, 52, 5–18. [Google Scholar] [CrossRef] [PubMed]
- Zhao, W.Q.; Chen, G.H.; Chen, H.; Pascale, A.; Ravindranath, L.; Quon, M.J.; Alkon, D.L. Secretion of Annexin II via activation of insulin receptor and insulin-like growth factor receptor. J. Biol. Chem. 2003, 278, 4205–4215. [Google Scholar] [CrossRef] [Green Version]
- Shetty, P.K.; Thamake, S.I.; Biswas, S.; Johansson, S.L.; Vishwanatha, J.K. Reciprocal regulation of annexin A2 and EGFR with Her-2 in Her-2 negative and herceptin-resistant breast cancer. PLoS ONE 2012, 7, e44299. [Google Scholar] [CrossRef]
- de Graauw, M.; Cao, L.; Winkel, L.; van Miltenburg, M.H.; le Devedec, S.E.; Klop, M.; Yan, K.; Pont, C.; Rogkoti, V.M.; Tijsma, A.; et al. Annexin A2 depletion delays EGFR endocytic trafficking via cofilin activation and enhances EGFR signaling and metastasis formation. Oncogene 2014, 33, 2610–2619. [Google Scholar] [CrossRef] [PubMed] [Green Version]
- Frohlich, M.; Motte, P.; Galvin, K.; Takahashi, H.; Wands, J.; Ozturk, M. Enhanced expression of the protein kinase substrate p36 in human hepatocellular carcinoma. Mol. Cell. Biol. 1990, 10, 3216–3223. [Google Scholar] [CrossRef] [PubMed] [Green Version]
- Hanahan, D.; Weinberg, R.A. Hallmarks of cancer: The next generation. Cell 2011, 144, 646–674. [Google Scholar] [CrossRef] [Green Version]
- Fendt, S.M. Metabolic vulnerabilities of metastasizing cancer cells. BMC Biol. 2019, 17, 54. [Google Scholar] [CrossRef]
- Sorlie, T.; Perou, C.M.; Tibshirani, R.; Aas, T.; Geisler, S.; Johnsen, H.; Hastie, T.; Eisen, M.B.; van de Rijn, M.; Jeffrey, S.S.; et al. Gene expression patterns of breast carcinomas distinguish tumor subclasses with clinical implications. Proc. Natl. Acad. Sci. USA 2001, 98, 10869–10874. [Google Scholar] [CrossRef] [Green Version]
- Grindheim, A.K.; Saraste, J.; Vedeler, A. Protein phosphorylation and its role in the regulation of Annexin A2 function. Biochim. Biophys. Acta Gen. Subj. 2017, 1861, 2515–2529. [Google Scholar] [CrossRef]
- Bharadwaj, A.; Bydoun, M.; Holloway, R.; Waisman, D. Annexin A2 heterotetramer: Structure and function. Int. J. Mol. Sci. 2013, 14, 6259–6305. [Google Scholar] [CrossRef] [Green Version]
- Lokman, N.A.; Ween, M.P.; Oehler, M.K.; Ricciardelli, C. The role of annexin A2 in tumorigenesis and cancer progression. Cancer Microenviron. 2011, 4, 199–208. [Google Scholar] [CrossRef] [PubMed] [Green Version]
- Fan, Y.; Si, W.; Ji, W.; Wang, Z.; Gao, Z.; Tian, R.; Song, W.; Zhang, H.; Niu, R.; Zhang, F. Rack1 mediates tyrosine phosphorylation of Anxa2 by Src and promotes invasion and metastasis in drug-resistant breast cancer cells. Breast Cancer Res. 2019, 21, 66. [Google Scholar] [CrossRef] [PubMed] [Green Version]
- Zheng, L.; Foley, K.; Huang, L.; Leubner, A.; Mo, G.; Olino, K.; Edil, B.H.; Mizuma, M.; Sharma, R.; Le, D.T.; et al. Tyrosine 23 phosphorylation-dependent cell-surface localization of annexin A2 is required for invasion and metastases of pancreatic cancer. PLoS ONE 2011, 6, e19390. [Google Scholar] [CrossRef] [PubMed] [Green Version]
- Cui, L.; Song, J.; Wu, L.; Cheng, L.; Chen, A.; Wang, Y.; Huang, Y.; Huang, L. Role of Annexin A2 in the EGF-induced epithelial-mesenchymal transition in human CaSki cells. Oncol. Lett. 2017, 13, 377–383. [Google Scholar] [CrossRef] [PubMed] [Green Version]
- Rocha, M.R.; Barcellos-de-Souza, P.; Sousa-Squiavinato, A.C.M.; Fernandes, P.V.; de Oliveira, I.M.; Boroni, M.; Morgado-Diaz, J.A. Annexin A2 overexpression associates with colorectal cancer invasiveness and TGF-ss induced epithelial mesenchymal transition via Src/ANXA2/STAT3. Sci. Rep. 2018, 8, 11285. [Google Scholar] [CrossRef] [Green Version]
- Wu, M.; Sun, Y.; Xu, F.; Liang, Y.; Liu, H.; Yi, Y. Annexin A2 Silencing Inhibits Proliferation and Epithelial-to-mesenchymal Transition through p53-Dependent Pathway in NSCLCs. J. Cancer 2019, 10, 1077–1085. [Google Scholar] [CrossRef]
- Sharma, M.R.; Koltowski, L.; Ownbey, R.T.; Tuszynski, G.P.; Sharma, M.C. Angiogenesis-associated protein annexin II in breast cancer: Selective expression in invasive breast cancer and contribution to tumor invasion and progression. Exp. Mol. Pathol. 2006, 81, 146–156. [Google Scholar] [CrossRef]
- Wang, C.Y.; Lin, C.F. Annexin A2: Its molecular regulation and cellular expression in cancer development. Dis. Markers 2014, 2014, 308976. [Google Scholar] [CrossRef] [Green Version]
- Xu, X.H.; Pan, W.; Kang, L.H.; Feng, H.; Song, Y.Q. Association of annexin A2 with cancer development (Review). Oncol. Rep. 2015, 33, 2121–2128. [Google Scholar] [CrossRef] [Green Version]
- Pereira, B.; Chin, S.F.; Rueda, O.M.; Vollan, H.K.; Provenzano, E.; Bardwell, H.A.; Pugh, M.; Jones, L.; Russell, R.; Sammut, S.J.; et al. The somatic mutation profiles of 2,433 breast cancers refines their genomic and transcriptomic landscapes. Nat. Commun. 2016, 7, 11479. [Google Scholar] [CrossRef] [PubMed] [Green Version]
- Haibe-Kains, B.; Desmedt, C.; Loi, S.; Culhane, A.C.; Bontempi, G.; Quackenbush, J.; Sotiriou, C. A three-gene model to robustly identify breast cancer molecular subtypes. J. Natl. Cancer Inst. 2012, 104, 311–325. [Google Scholar] [CrossRef] [PubMed] [Green Version]
- Prevarskaya, N.; Skryma, R.; Shuba, Y. Calcium in tumour metastasis: New roles for known actors. Nat. Rev. Cancer 2011, 11, 609–618. [Google Scholar] [CrossRef]
- Azimi, I.; Roberts-Thomson, S.J.; Monteith, G.R. Calcium influx pathways in breast cancer: Opportunities for pharmacological intervention. Br. J. Pharm. 2014, 171, 945–960. [Google Scholar] [CrossRef] [PubMed] [Green Version]
- VanHouten, J.; Sullivan, C.; Bazinet, C.; Ryoo, T.; Camp, R.; Rimm, D.L.; Chung, G.; Wysolmerski, J. PMCA2 regulates apoptosis during mammary gland involution and predicts outcome in breast cancer. Proc. Natl. Acad. Sci. USA 2010, 107, 11405–11410. [Google Scholar] [CrossRef] [Green Version]
- Ikebuchi, N.W.; Waisman, D.M. Calcium-dependent regulation of actin filament bundling by lipocortin-85. J. Biol. Chem. 1990, 265, 3392–3400. [Google Scholar]
- Grill, D.; Matos, A.L.L.; de Vries, W.C.; Kudruk, S.; Heflik, M.; Dorner, W.; Mootz, H.D.; Jan Ravoo, B.; Galla, H.J.; Gerke, V. Bridging of membrane surfaces by annexin A2. Sci. Rep. 2018, 8, 14662. [Google Scholar] [CrossRef] [Green Version]
- Bresnick, A.R.; Weber, D.J.; Zimmer, D.B. S100 proteins in cancer. Nat. Rev. Cancer 2015, 15, 96–109. [Google Scholar] [CrossRef] [Green Version]
- Cancemi, P.; Buttacavoli, M.; Di Cara, G.; Albanese, N.N.; Bivona, S.; Pucci-Minafra, I.; Feo, S. A multiomics analysis of S100 protein family in breast cancer. Oncotarget 2018, 9, 29064–29081. [Google Scholar] [CrossRef] [Green Version]
- Ranson, M.; Andronicos, N.M. Plasminogen binding and cancer: Promises and pitfalls. Front. Biosci. 2003, 8, s294–s304. [Google Scholar] [CrossRef] [Green Version]
- Hajjar, K.A.; Krishnan, S. Annexin II: A mediator of the plasmin/plasminogen activator system. Trends Cardiovasc. Med. 1999, 9, 128–138. [Google Scholar] [CrossRef]
- Sharma, M.C. Annexin A2 (ANX A2): An emerging biomarker and potential therapeutic target for aggressive cancers. Int. J. Cancer 2019, 144, 2074–2081. [Google Scholar] [CrossRef] [PubMed]
- Jaiswal, J.K.; Nylandsted, J. S100 and annexin proteins identify cell membrane damage as the Achilles heel of metastatic cancer cells. Cell Cycle 2015, 14, 502–509. [Google Scholar] [CrossRef] [PubMed] [Green Version]
- Shen, D.; Xu, B.; Liang, K.; Tang, R.; Sudlow, G.P.; Egbulefu, C.; Guo, K.; Som, A.; Gilson, R.; Maji, D.; et al. Selective imaging of solid tumours via the calcium-dependent high-affinity binding of a cyclic octapeptide to phosphorylated Annexin A2. Nat. Biomed. Eng. 2020, 4, 298–313. [Google Scholar] [CrossRef]
- Yeatman, T.J.; Updyke, T.V.; Kaetzel, M.A.; Dedman, J.R.; Nicolson, G.L. Expression of annexins on the surfaces of non-metastatic and metastatic human and rodent tumor cells. Clin. Exp. Metastasis 1993, 11, 37–44. [Google Scholar] [CrossRef]
- Benaud, C.; Le Dez, G.; Mironov, S.; Galli, F.; Reboutier, D.; Prigent, C. Annexin A2 is required for the early steps of cytokinesis. EMBO Rep. 2015, 16, 481–489. [Google Scholar] [CrossRef] [Green Version]
- Vishwanatha, J.K.; Kumble, S. Involvement of annexin II in DNA replication: Evidence from cell-free extracts of Xenopus eggs. J. Cell Sci. 1993, 105 Pt 2, 533–540. [Google Scholar]
- Yang, S.F.; Hsu, H.L.; Chao, T.K.; Hsiao, C.J.; Lin, Y.F.; Cheng, C.W. Annexin A2 in renal cell carcinoma: Expression, function, and prognostic significance. Urol. Oncol. 2015, 33, 22.e11–22.e21. [Google Scholar] [CrossRef]
- Zhao, P.; Zhang, W.; Wang, S.J.; Yu, X.L.; Tang, J.; Huang, W.; Li, Y.; Cui, H.Y.; Guo, Y.S.; Tavernier, J.; et al. HAb18G/CD147 promotes cell motility by regulating annexin II-activated RhoA and Rac1 signaling pathways in hepatocellular carcinoma cells. Hepatology 2011, 54, 2012–2024. [Google Scholar] [CrossRef]
- Sharma, M.; Ownbey, R.T.; Sharma, M.C. Breast cancer cell surface annexin II induces cell migration and neoangiogenesis via tPA dependent plasmin generation. Exp. Mol. Pathol. 2010, 88, 278–286. [Google Scholar] [CrossRef]
- Wang, T.; Yuan, J.; Zhang, J.; Tian, R.; Ji, W.; Zhou, Y.; Yang, Y.; Song, W.; Zhang, F.; Niu, R. Anxa2 binds to STAT3 and promotes epithelial to mesenchymal transition in breast cancer cells. Oncotarget 2015, 6, 30975–30992. [Google Scholar] [CrossRef] [PubMed] [Green Version]
- Chaudhary, P.; Gibbs, L.D.; Maji, S.; Lewis, C.M.; Suzuki, S.; Vishwanatha, J.K. Serum exosomal-annexin A2 is associated with African-American triple-negative breast cancer and promotes angiogenesis. Breast Cancer Res. 2020, 22, 11. [Google Scholar] [CrossRef]
- Sharma, M.C.; Tuszynski, G.P.; Blackman, M.R.; Sharma, M. Long-term efficacy and downstream mechanism of anti-annexinA2 monoclonal antibody (anti-ANX A2 mAb) in a pre-clinical model of aggressive human breast cancer. Cancer Lett. 2016, 373, 27–35. [Google Scholar] [CrossRef] [PubMed] [Green Version]
- Kijewska, M.; Viski, C.; Turrell, F.; Fitzpatrick, A.; van Weverwijk, A.; Gao, Q.; Iravani, M.; Isacke, C.M. Using an in-vivo syngeneic spontaneous metastasis model identifies ID2 as a promoter of breast cancer colonisation in the brain. Breast Cancer Res. 2019, 21, 4. [Google Scholar] [CrossRef] [PubMed] [Green Version]
- Sawyer, S.T.; Cohen, S. Epidermal growth factor stimulates the phosphorylation of the calcium-dependent 35,000-dalton substrate in intact A-431 cells. J. Biol. Chem. 1985, 260, 8233–8236. [Google Scholar] [PubMed]
- Valapala, M.; Maji, S.; Borejdo, J.; Vishwanatha, J.K. Cell surface translocation of annexin A2 facilitates glutamate-induced extracellular proteolysis. J. Biol. Chem. 2014, 289, 15915–15926. [Google Scholar] [CrossRef] [PubMed] [Green Version]
- Maji, S.; Chaudhary, P.; Akopova, I.; Nguyen, P.M.; Hare, R.J.; Gryczynski, I.; Vishwanatha, J.K. Exosomal Annexin II Promotes Angiogenesis and Breast Cancer Metastasis. Mol. Cancer Res. 2017, 15, 93–105. [Google Scholar] [CrossRef] [Green Version]
- Yuan, J.; Yang, Y.; Gao, Z.; Wang, Z.; Ji, W.; Song, W.; Zhang, F.; Niu, R. Tyr23 phosphorylation of Anxa2 enhances STAT3 activation and promotes proliferation and invasion of breast cancer cells. Breast Cancer Res. Treat. 2017, 164, 327–340. [Google Scholar] [CrossRef]
- Rescher, U.; Gerke, V. Annexins—Unique membrane binding proteins with diverse functions. J. Cell Sci. 2004, 117, 2631–2639. [Google Scholar] [CrossRef] [Green Version]
- Cuervo, A.M.; Gomes, A.V.; Barnes, J.A.; Dice, J.F. Selective degradation of annexins by chaperone-mediated autophagy. J. Biol. Chem. 2000, 275, 33329–33335. [Google Scholar] [CrossRef] [Green Version]
- Aukrust, I.; Rosenberg, L.A.; Ankerud, M.M.; Bertelsen, V.; Hollas, H.; Saraste, J.; Grindheim, A.K.; Vedeler, A. Post-translational modifications of Annexin A2 are linked to its association with perinuclear nonpolysomal mRNP complexes. FEBS Open Bio 2017, 7, 160–173. [Google Scholar] [CrossRef] [PubMed] [Green Version]
- Jeon, Y.R.; Kim, S.Y.; Lee, E.J.; Kim, Y.N.; Noh, D.Y.; Park, S.Y.; Moon, A. Identification of annexin II as a novel secretory biomarker for breast cancer. Proteomics 2013, 13, 3145–3156. [Google Scholar] [CrossRef] [PubMed]
- Rimawi, M.F.; Shetty, P.B.; Weiss, H.L.; Schiff, R.; Osborne, C.K.; Chamness, G.C.; Elledge, R.M. Epidermal growth factor receptor expression in breast cancer association with biologic phenotype and clinical outcomes. Cancer 2010, 116, 1234–1242. [Google Scholar] [CrossRef] [PubMed] [Green Version]
- Putti, T.C.; El-Rehim, D.M.; Rakha, E.A.; Paish, C.E.; Lee, A.H.; Pinder, S.E.; Ellis, I.O. Estrogen receptor-negative breast carcinomas: A review of morphology and immunophenotypical analysis. Mod. Pathol. 2005, 18, 26–35. [Google Scholar] [CrossRef]
- Pinto, A.C.; Ades, F.; de Azambuja, E.; Piccart-Gebhart, M. Trastuzumab for patients with HER2 positive breast cancer: Delivery, duration and combination therapies. Breast 2013, 22 (Suppl 2), S152–S155. [Google Scholar] [CrossRef]
- Derakhshani, A.; Rezaei, Z.; Safarpour, H.; Sabri, M.; Mir, A.; Sanati, M.A.; Vahidian, F.; Gholamiyan Moghadam, A.; Aghadoukht, A.; Hajiasgharzadeh, K.; et al. Overcoming trastuzumab resistance in HER2-positive breast cancer using combination therapy. J. Cell Physiol. 2020, 235, 3142–3156. [Google Scholar] [CrossRef]
- Speers, C.; Tsimelzon, A.; Sexton, K.; Herrick, A.M.; Gutierrez, C.; Culhane, A.; Quackenbush, J.; Hilsenbeck, S.; Chang, J.; Brown, P. Identification of novel kinase targets for the treatment of estrogen receptor-negative breast cancer. Clin. Cancer Res. 2009, 15, 6327–6340. [Google Scholar] [CrossRef] [Green Version]
- Verheuvel, N.C.; Ooms, H.W.; Tjan-Heijnen, V.C.; Roumen, R.M.; Voogd, A.C. Predictors for extensive nodal involvement in breast cancer patients with axillary lymph node metastases. Breast 2016, 27, 175–181. [Google Scholar] [CrossRef]
- Amin, M.B.; Greene, F.L.; Edge, S.B.; Compton, C.C.; Gershenwald, J.E.; Brookland, R.K.; Meyer, L.; Gress, D.M.; Byrd, D.R.; Winchester, D.P. The Eighth Edition AJCC Cancer Staging Manual: Continuing to build a bridge from a population-based to a more “personalized” approach to cancer staging. CA Cancer J. Clin. 2017, 67, 93–99. [Google Scholar] [CrossRef]


© 2020 by the authors. Licensee MDPI, Basel, Switzerland. This article is an open access article distributed under the terms and conditions of the Creative Commons Attribution (CC BY) license (http://creativecommons.org/licenses/by/4.0/).
Share and Cite
Mahdi, A.F.; Malacrida, B.; Nolan, J.; McCumiskey, M.E.; Merrigan, A.B.; Lal, A.; Tormey, S.; Lowery, A.J.; McGourty, K.; Kiely, P.A. Expression of Annexin A2 Promotes Cancer Progression in Estrogen Receptor Negative Breast Cancers. Cells 2020, 9, 1582. https://doi.org/10.3390/cells9071582
Mahdi AF, Malacrida B, Nolan J, McCumiskey ME, Merrigan AB, Lal A, Tormey S, Lowery AJ, McGourty K, Kiely PA. Expression of Annexin A2 Promotes Cancer Progression in Estrogen Receptor Negative Breast Cancers. Cells. 2020; 9(7):1582. https://doi.org/10.3390/cells9071582
Chicago/Turabian StyleMahdi, Amira F., Beatrice Malacrida, Joanne Nolan, Mary E. McCumiskey, Anne B. Merrigan, Ashish Lal, Shona Tormey, Aoife J. Lowery, Kieran McGourty, and Patrick A. Kiely. 2020. "Expression of Annexin A2 Promotes Cancer Progression in Estrogen Receptor Negative Breast Cancers" Cells 9, no. 7: 1582. https://doi.org/10.3390/cells9071582