


Enhancement of Sulfur Oxide Capture Capacity by Deposition of Iron Oxide Particles on Graphene Oxide
by

Tanushree Sankar Sanyal
1,2, 
Amanda Ineza Mugisha
1,2,
Andrew Sowinski
1 and
Clémence Fauteux-Lefebvre
1,2,* 1
Department of Chemical and Biological Engineering, University of Ottawa, 161 Louis-Pasteur, Ottawa, ON K1N 6N5, Canada
2
Centre for Catalysis Research and Innovation (CCRI), University of Ottawa, 30 Marie-Curie, Ottawa, ON K1N 6N5, Canada
*
Author to whom correspondence should be addressed.
Catalysts 2023, 13(12), 1469; https://doi.org/10.3390/catal13121469
Submission received: 9 August 2023
/
Revised: 13 October 2023
/
Accepted: 31 October 2023
/
Published: 24 November 2023
(This article belongs to the Special Issue Designing Catalytic Desulfurization Processes to Prepare Clean Fuels)
Abstract
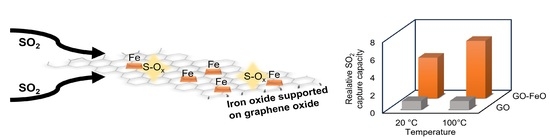
:Sulfur dioxide (SO2) is a known pollutant that must be captured from gas streams. Dry desulfurization processes are investigated due to their lower energy requirement and potentially high capture efficiency. Carbon materials and metal oxides have been shown to have an affinity with SO2. The aim of this study was to combine iron oxide and graphene oxide (GO) as a composite material for SO2 capture for low-concentration streams. Iron oxide particles were prepared using a polyol method in which the precursor was dispersed in ethylene glycol, heated under reflux and then deposited on GO, a two-dimensional, single-layer material with a surface area of 400 m2/g. The synthesized material was tested for continuous desulfurization in a flow-through capture system with a stream of gas containing 25 ppm SO2 entering at 20 °C and 100 °C. Under all conditions tested, the breakthrough times, evaluated when the SO2 started to be detected at the outlet with a concentration of 1 ppm, as well as the capture capacities, were significantly higher for the iron oxide GO composite than for the pristine GO alone. The presence of sulfur compounds as well as the composite composition were confirmed by energy-dispersive X-ray spectroscopy (EDXS) and X-ray photoelectron spectroscopy (XPS). The breakthrough experiment results at various temperatures also suggest that the capture was not governed only by pure physical adsorption with the presence of iron oxide. Addition of iron oxide particles positively influences SO2 affinity with the synthesized material as shown by the increase in breakthrough time and capture capacity.
1. Introduction
It is well known that sulfur dioxide (SO2) has serious effects on human health and on the environment [1,2]. In the atmosphere, SO2 forms sulfuric acid in the presence of water [1], which is one of the main components of acid rain that contributes to soil deterioration, formation of acid fog and destabilization of aquatic ecosystems [2]. Moreover, dry acid deposits, also formed by SO2, cause the degradation of building materials, stone and statues and consequently increase maintenance costs [2].
There are many regulatory initiatives worldwide to decrease SO2 emissions [3,4,5]. As such, the emissions of SO2 in Canada decreased by 79% from 1990 to 2021 [6]. Knowing that approximately 87% of anthropogenic atmospheric sulfur oxides (SO2 and sulfur trioxide—SO3) are emitted from fossil fuel-fired plants [7], these emissions are the main target. Currently, the most used technology for SO2 removal is wet flue-gas desulfurization (FGD) [8], in which up to nearly 99% SO2 removal can be achieved [8,9]. However, wet FGD has high capital and operating costs due to its reliance on water and heat. This process also produces waste sludge that requires intensive wastewater treatment. Moreover, the absorber column unit requires construction materials that can resist corrosion and abrasion [9,10]. New technologies that could be less energy intensive and could achieve higher removal efficiency have therefore been investigated [7].
Dry adsorption is widely studied as an alternative approach for SO2 removal because of its simplicity and relatively low costs [7,11,12,13,14]. It has the advantages of lower capital, operational and management costs and potential regenerability of the sorbents. It also mitigates the wastewater treatment problem encountered with wet desulfurization as less or no water is used during the process [11,14]. Moreover, physical adsorption usually operates at low temperature (near room temperature), which reduces its energy demand [14]. Typical sorbents studied for SO2 removal are carbon-based materials, zeolites, metal oxides and metal organic frameworks [15,16]. Due to their higher stability against moisture and corrosive gases [16], carbon materials, namely activated carbon [17], carbon nanotubes [18] and graphene oxide [18,19], are one of the most studied adsorbent classes for SO2 removal [16,20].
Nevertheless, large-scale SO2 adsorption on activated carbon application is still limited due to the relatively high flue gas temperatures and the low SO2 concentrations [21], which create capacity and selectivity challenges [15,22,23,24,25]. However, the capture capacity of activated carbon can be improved by surface modification. Liu Xiao-Li et al. showed that a nitric acid treatment of activated carbon led to an increase in the sorption capacity of the material, explained by an increase in the concentration of C=O bonds that acted as Bronsted basic sites for SO2 oxidation [26]. The SO2 removal efficiency of activated carbon was also shown to be further increased using iron oxide-decorated (Fe3O4) activated carbon and even further increased using iron oxide-decorated activated carbon treated with nitric acid, which led to the conclusion that the presence of Fe3O4 promotes the transformation of SO2 into other more stable forms or compounds with different oxidation states [26]. During the adsorption of SO2, in the presence of O2 and water, SO2 can then be oxidized to SO3 and further react with the adsorbed water molecules to form H2SO4 [26]. Fe3O4 can react with the generated H2SO4 and form Fe2(SO4)3 [26,27,28].
Carbon nanotubes (CNTs) have also been explored as a potential material for SO2 adsorption [29,30,31,32,33,34]. As for activated carbon, the adsorption capacity of CNTs can be improved by functionalizing them with oxygen groups, by metal doping or by creating vacancy defects [30]. Using theoretical calculations and experimental results, Zhang et al. showed that hydroxyl-modified carbon nanotubes had a better sensitivity to SO2 than non-modified carbon nanotubes [31]. Metals such as platinum, gold, nickel and iron have been investigated by modeling using the first principles method, and the results have shown an increase in the potential adsorption capacity of carbon nanotubes [32,33,34]. Libao et al. showed that when doping carbon nanotubes with Fe, the adsorption energy and the charge transfer between SO2 and the Fe-doped carbon nanotubes increased, leading to a more stable chemical adsorption [32].
Due to its large surface area, thermal and chemical stability, low preparation cost, recyclability and non-corrosive properties, graphene oxide (GO), a two-dimensional, single-layer material, has received interest in many applications such as electronic sensors [35,36], gas and energy storage [19,35] and catalytic reactions [37,38]. Moreover, GO has epoxy, hydroxyl, carbonyl and carboxylic groups present on its surface [35]; it therefore provides an alternative to having oxygenated functional groups on the surface of carbonaceous materials. Nevertheless, when it comes to SO2 removal, only a few studies have investigated the adsorption capacity of GO toward SO2. Ying Long et al. showed that upon adsorption of SO2 by foam GO or by GO suspensions at room temperature, the material acted as an oxidant and as a catalyst to form SO3 [38]. GO was found to adsorb SO2 through H-bonding interactions between its hydroxyl groups and SO2. These hydroxyl groups also promoted the oxidation of SO2 by the epoxy groups by reducing the oxidation barrier [39]. It was also shown that the S–C covalent interaction of SO3 with the GO surface was higher than that of SO2 [39].
Graphene–oxide–metal nanocomposites have, however, been used as heterogeneous catalysts or adsorbents in multiple organic reactions such as oxidation, reduction and cross-coupling reactions [40,41,42,43,44]. The use of GO as a support facilitates the accessibility to active metal catalytic sites, allowing for a better adsorption of the substrate on the active sites. Additionally, GO modified with iron oxide was found to have nine times higher of a CO2 adsorption capacity than pristine GO at a pressure of 20 bars [40].
Metal oxides themselves have also been studied since the 20th century as an alternative sorbent for SO2 removal [45,46,47,48,49,50]. Transition metal oxides are frequently used for SO2 removal due to their low production cost, selective action and easy generation [15]. The presence of active oxygen species on metal oxides was found to enhance the reactivity of the solid surface with SO2 gas [48,49]. Metal oxide-supported sorbents have therefore been investigated in an effort to improve their stability [47]. Various metallic oxides supported on alumina were evaluated for the elimination of SO2, and oxides of Ni, Mn, Fe, Co and Zn were generally proposed as the most suitable sorbents [50]. The adsorption performance of SO2 over zinc aluminate (ZnAl2O4) was studied by Ling Zhao et al., who proposed that the adsorption process is a combination of physisorption and chemisorption, where the capacity is, respectively, related to the surface area and to the oxides’ surface basicity sites, which consisted of the surface hydroxides or superoxide [48]. This interaction resulted in the formation of adsorbed SO32− and SO42− [48]. Although the various materials currently being investigated are promising, there are still challenges for industrial applications, such as having a sufficient capture capacity, being regenerable and being stable while in use [51,52,53].
In this study, we synthetized a new capture material combining properties of the graphene oxide and iron oxide aiming to increase the capture capacity of the material. We propose to modify the surface of GO with iron oxide particles and use it as a capture material for SO2 removal. The objective was to improve the capture capacity of the material by enhancing interaction with SO2, through dry adsorption. Metal oxide particles were synthesized by the polyol method [54] and deposited on the surface of graphene oxide through dispersion of the particles and support material in water, acting as the solvent. The synthesized material was tested for the capture of SO2 at a concentration of 25 ppm in argon, with the inlet gas hourly space velocity varying between 6,000 and 18,000 mL/h/gsample and temperatures varying between 20 °C and 100 °C. This work confirms that the deposition of iron oxide particles on GO increases the capture capacity of SO2.
2. Results and Discussion
2.1. Iron Oxide/Graphene Oxide Composite Characterization
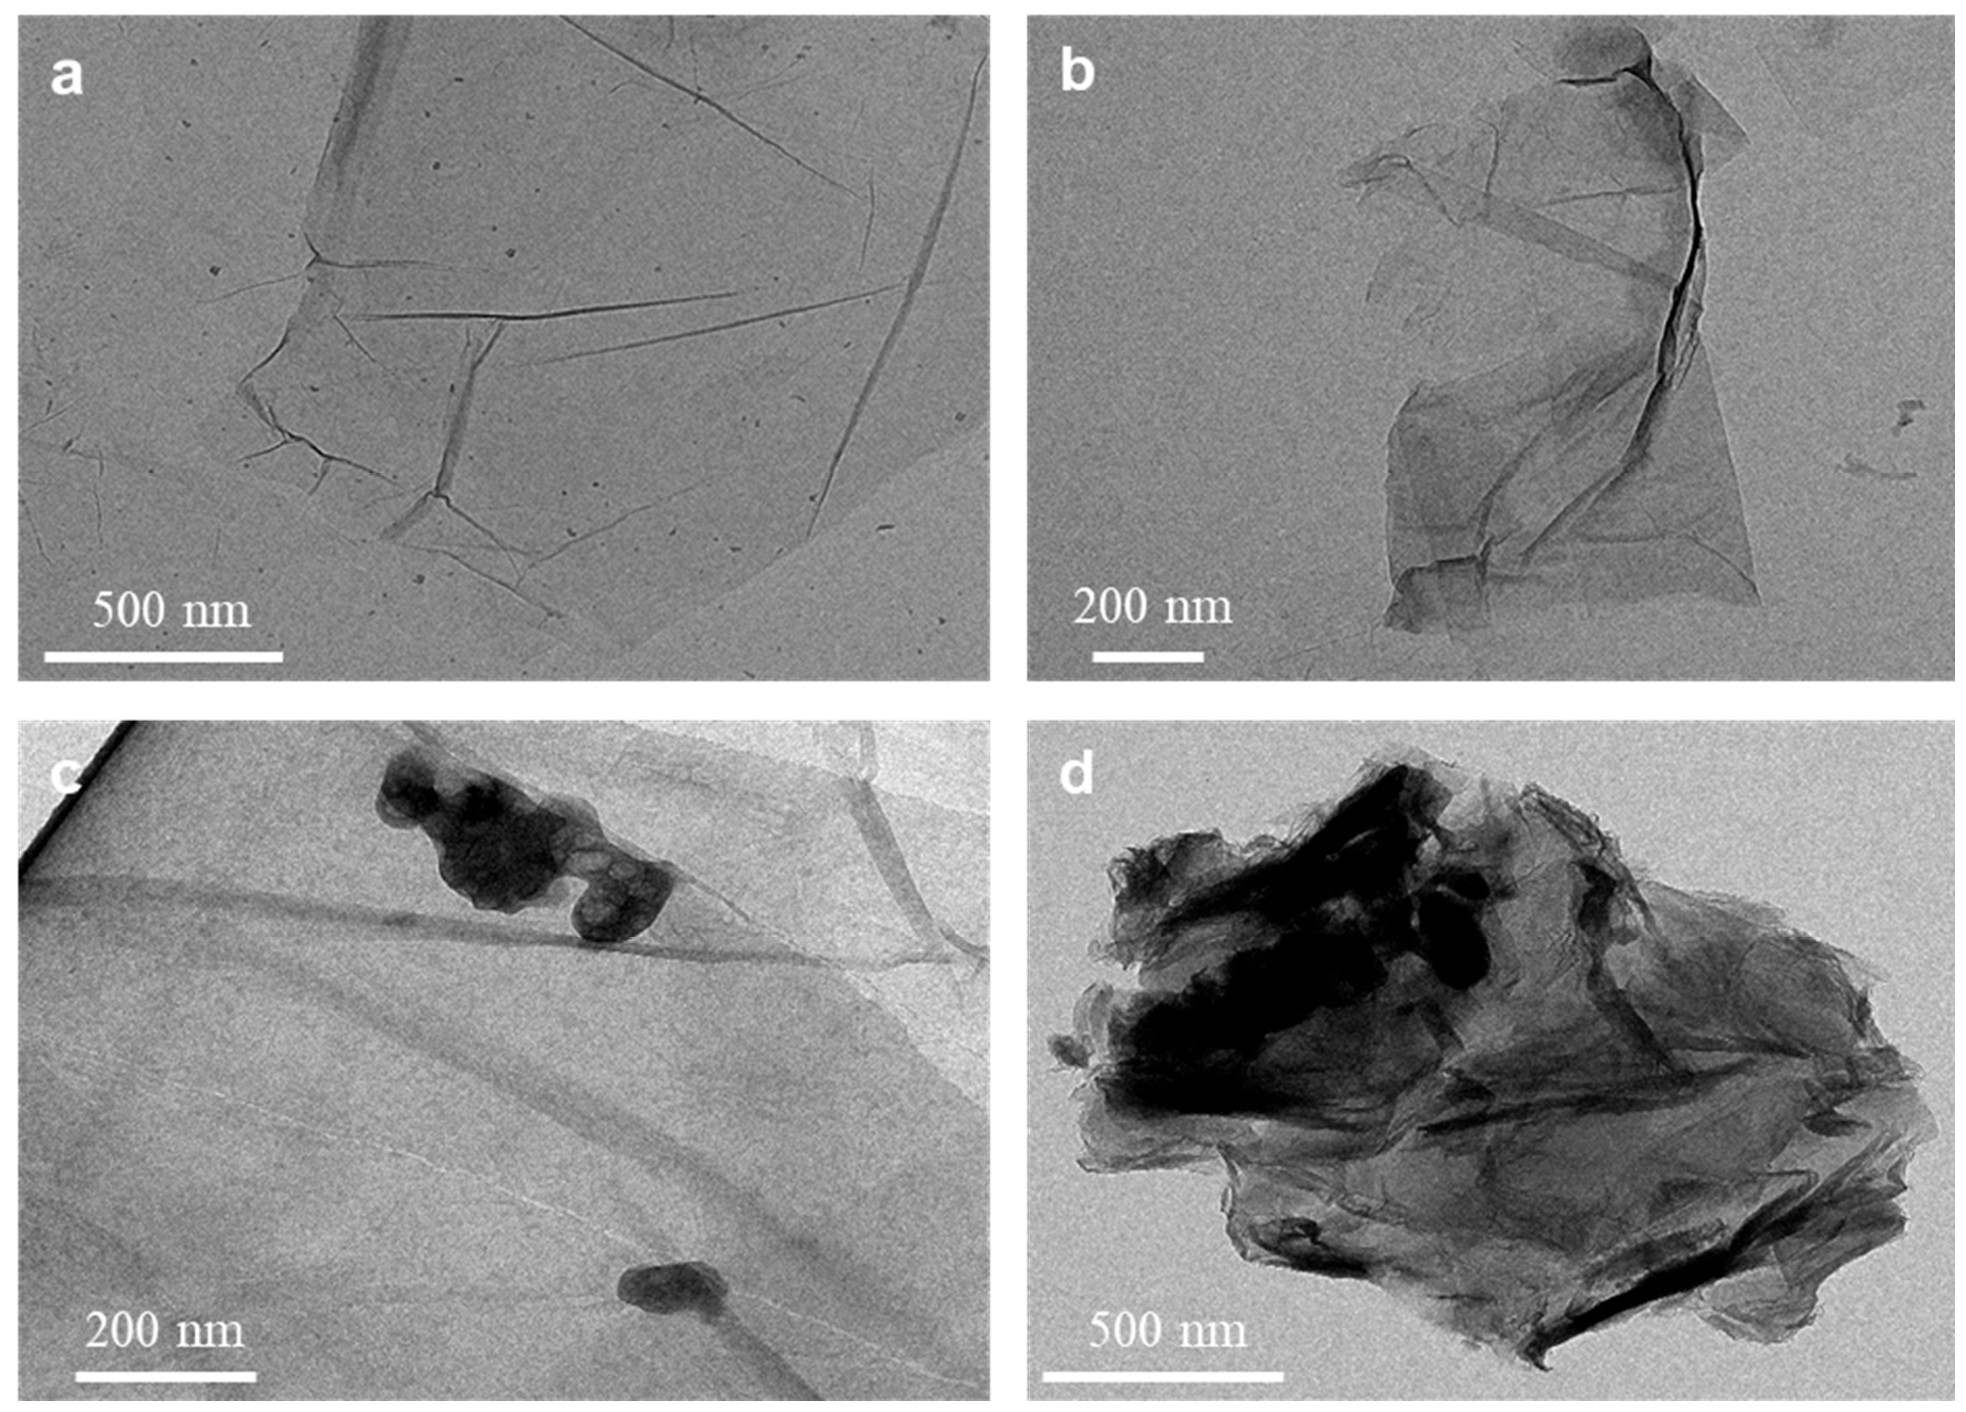
To assess the changes in the morphology after iron oxide particle addition as well as after the SO2 capture studies, transmission electron microscopy (TEM) analyses were conducted. Figure 1a,b show the TEM images of the pristine GO and GO–FeO (before use for capture). It can be observed that the morphology of pristine GO is a thin paper-like layered structure corresponding to GO’s expected structure [35]. This structure provides a high external surface area for particle deposition and SO2 capture. After the deposition of the iron oxide, it can be observed that the GO conserved its layered structure with darkened edges. The morphology of the iron oxide particles was not directly characterized, but their presence was confirmed through the EDXS (Figure S1) and further investigated by XPS analysis (See Section 2.3). The targeted content of iron after deposition was of 5 wt% in order to be able to study the impact of adding metal, without covering a major part of the surface of the graphene oxide, which was confirmed with the TEM analyses.
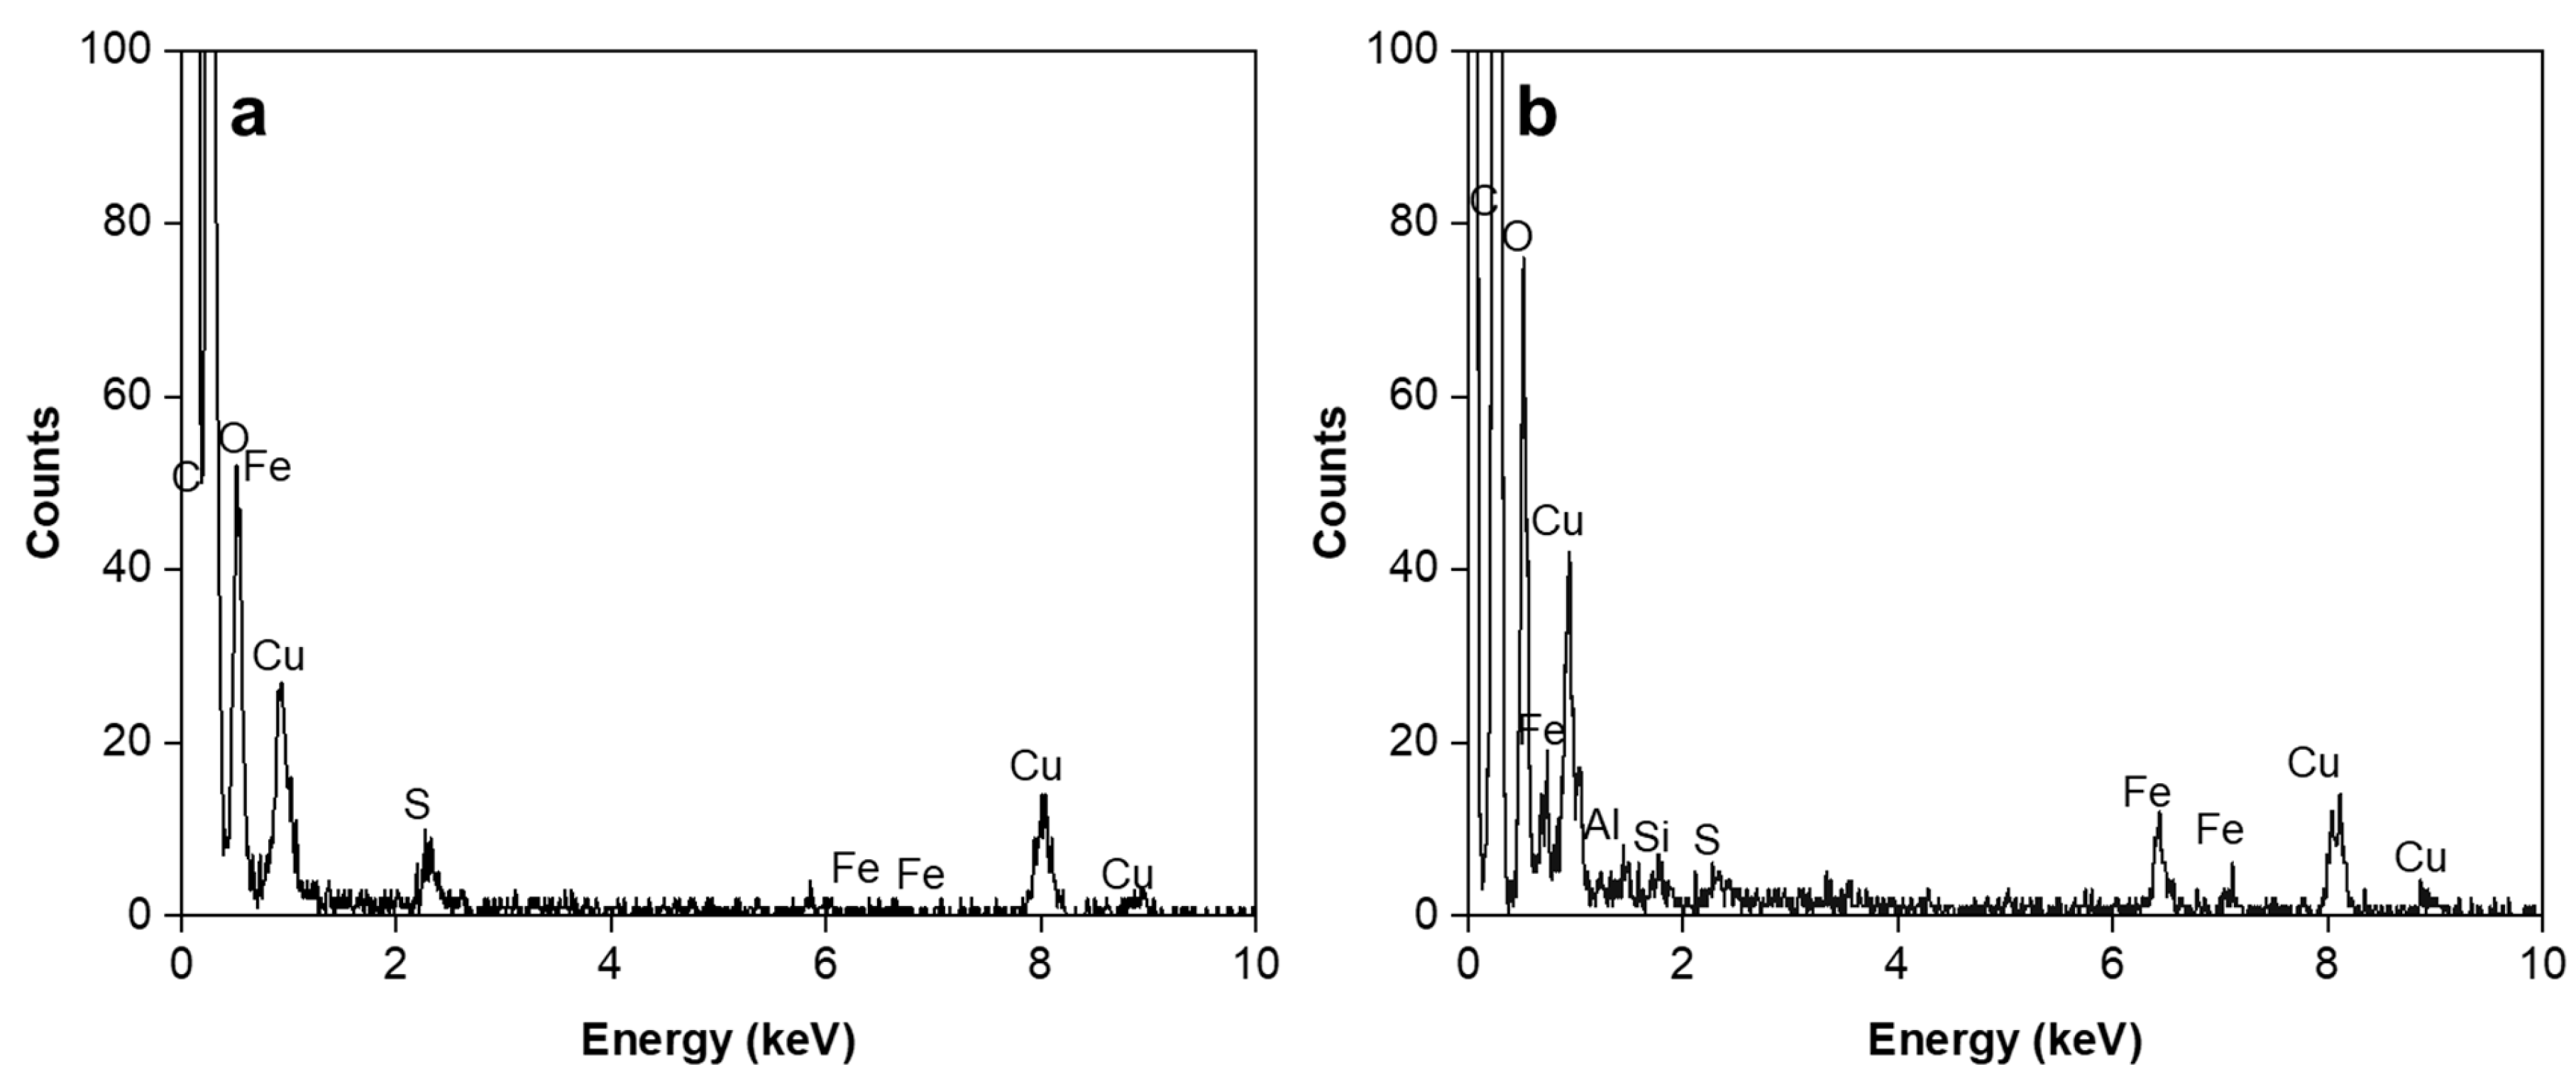
The TEM analyses of samples saturated with SO2 are shown in Figure 1c,d (at 15 mL/min and 20 °C). Darker zones appear on the surface of the GO after the SO2 capture, indicating modification of the structure in the presence of SO2. These areas are distributed rather unevenly on the surface, indicating a non-uniform capture of SO2 over the surface of the GO. For the GO–FeO sample, more black zones are visible on the surface of the material and are not uniformly distributed. Figure 2 shows the EDXS analysis of the samples after the SO2 capture testing (GO and GO–FeO at 15 mL/min and 20 °C). The analyses were performed in the darker areas and showed the presence of sulfur, coherent with SO2 capture, and are also indicative of stronger interaction than solely pure physical adsorption, as the analysis was performed under a vacuum. The intensity of the sulfur peak was lower for the analyses performed on lighter gray zones (relatively to the carbon peak), indicating that the sulfur was concentrated in the dark spot, as expected from the TEM image. Moreover, the presence of an Fe peak confirms the successful addition of iron on GO.
2.2. SO2 Capture Studies
2.2.1. Breakthrough Curves
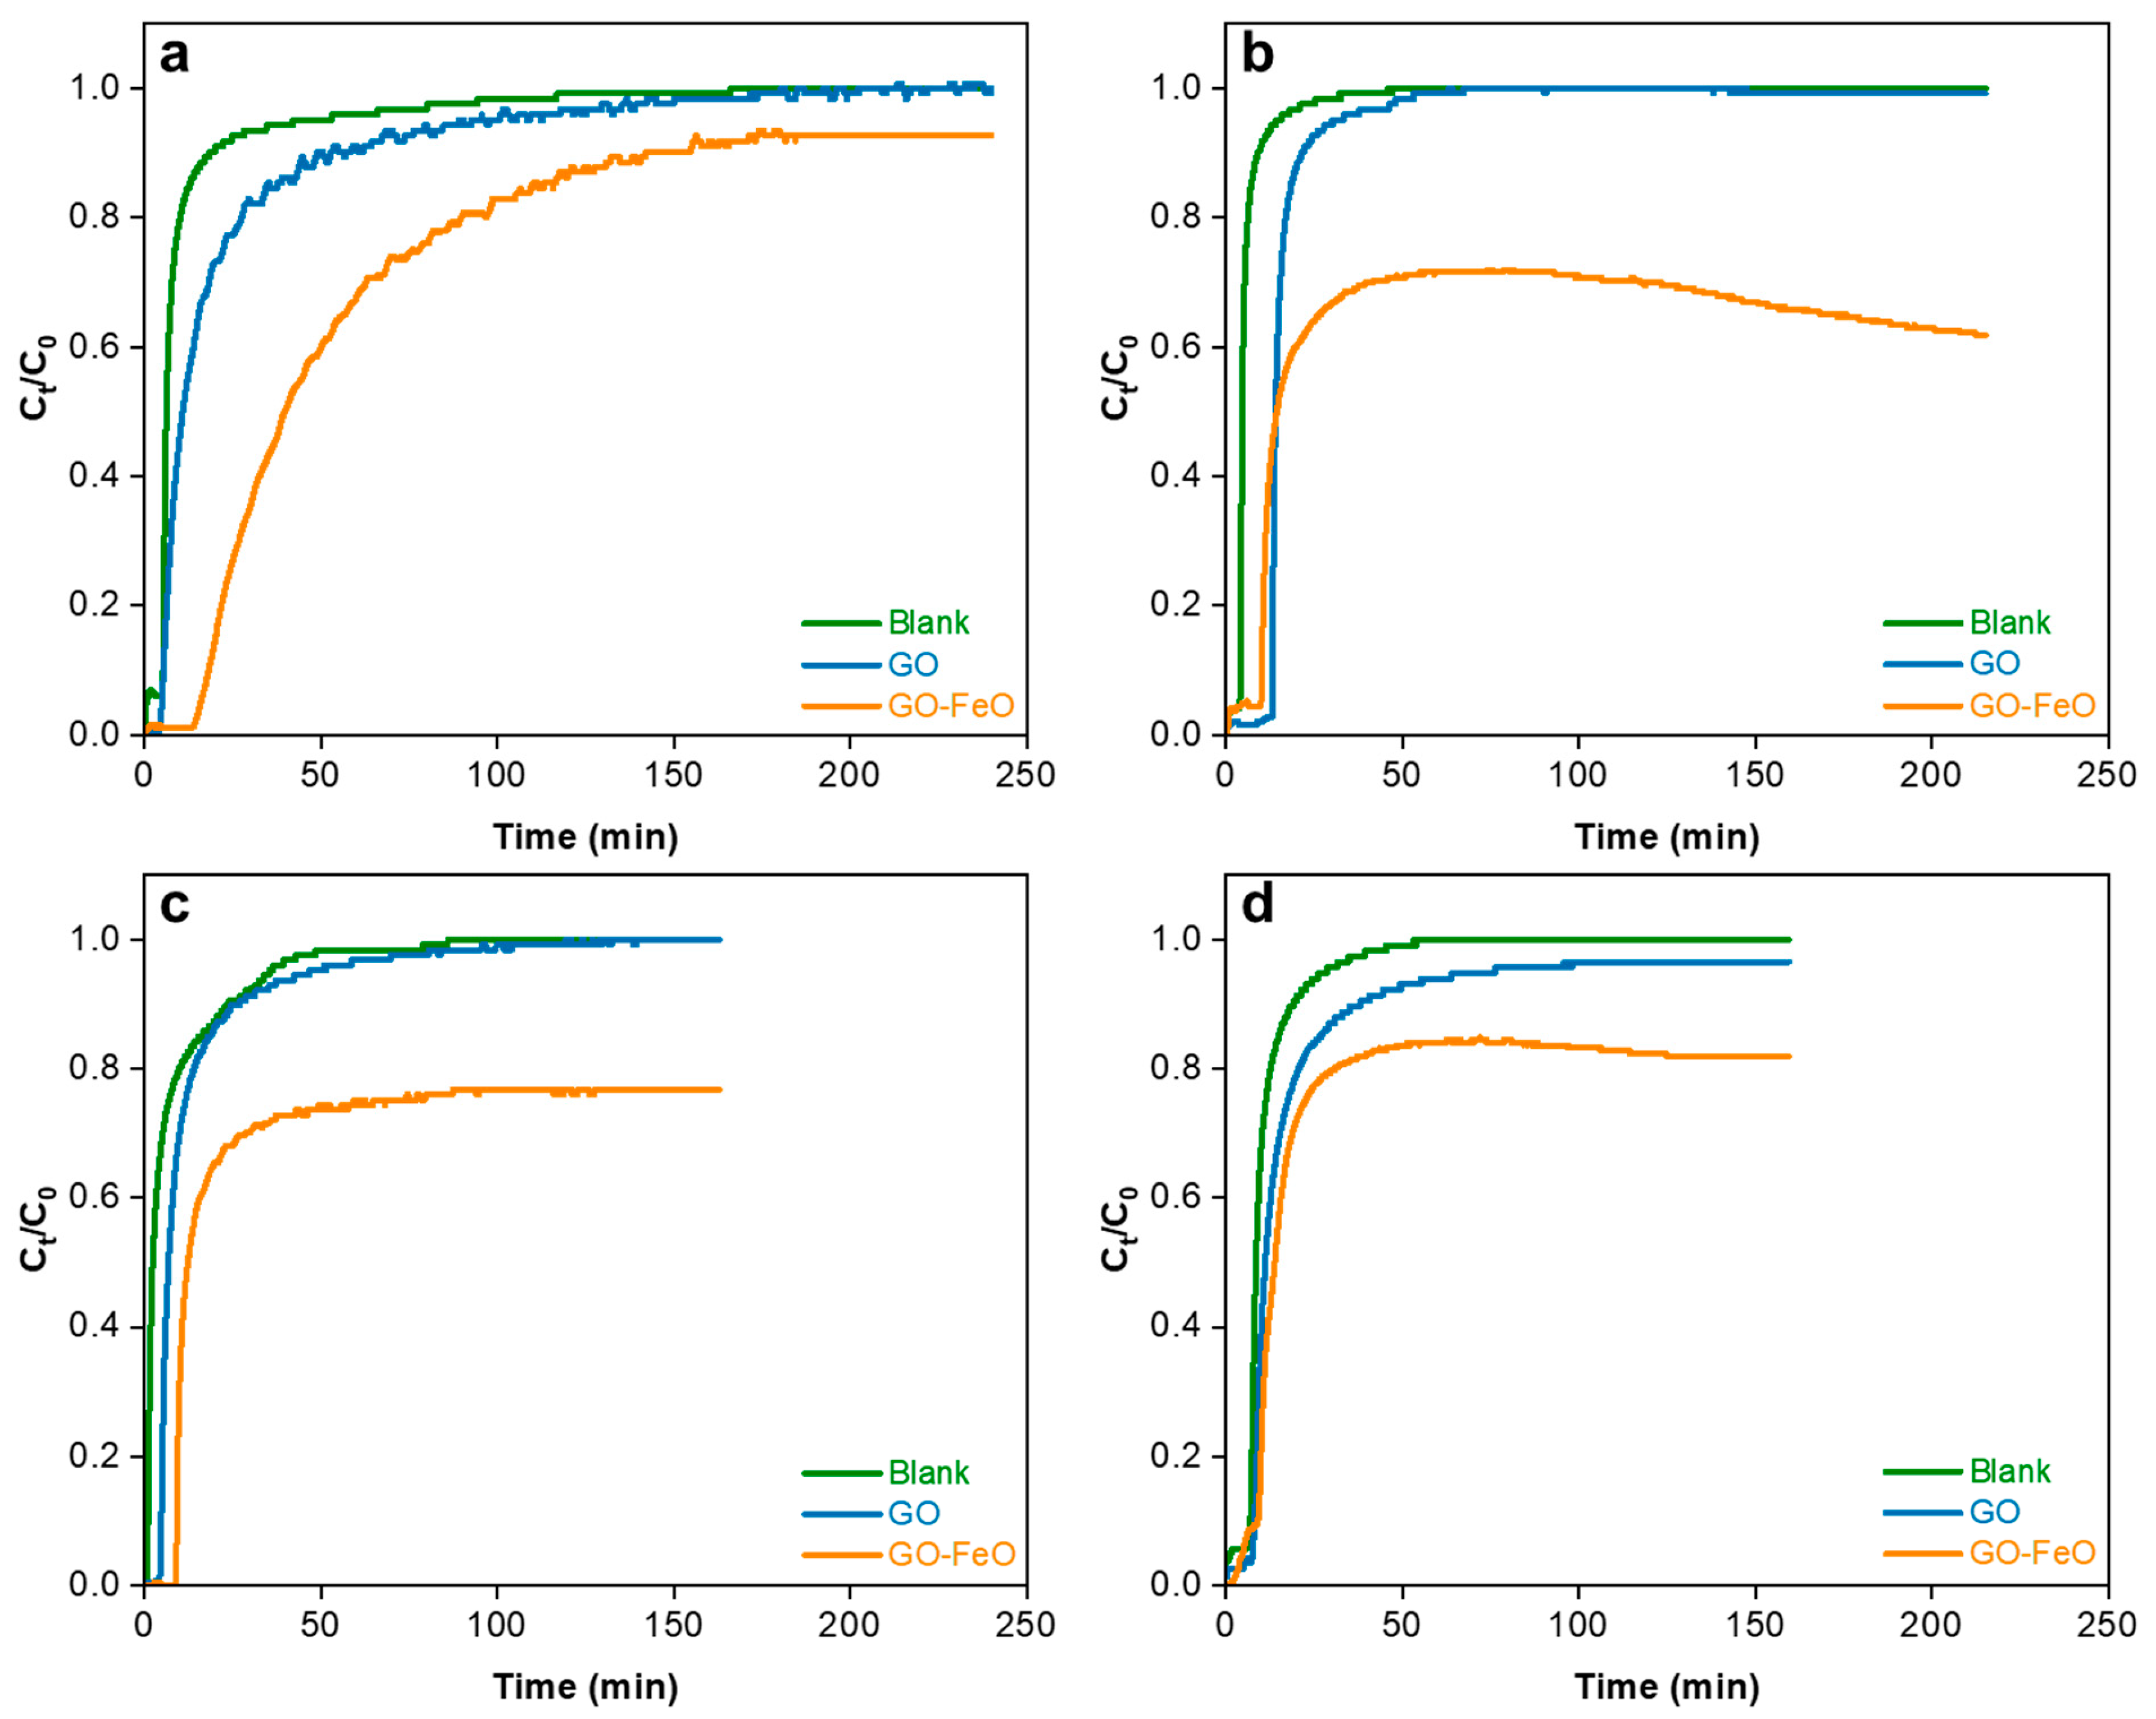
The experiments for SO2 capture were conducted at temperatures of 20 °C to 100 °C with flow rates of inlet gas of 5 mL/min (100 °C only) to 15 mL/min, containing 25 ppm of SO2. Center point conditions of 60 °C and 10 mL/min were also tested. Figure 3 represents the breakthrough curves obtained from the capture studies of SO2 with the pristine GO and GO–FeO samples. For the blank runs (without samples), a steep change from a concentration of 0 to the maximum after a short delay was observed, coherent with the absence of the sample and showing the delay time in the system. For the GO and GO–FeO samples, the breakthrough time was generally a little higher. The main difference was, however, the longer time to reach saturation.
In the case of the GO–FeO samples, the outlet concentration did not reach the inlet concentration value over the time of the experiments, ranging from 0.6 to 0.8 of the inlet concentration at temperatures of 60 °C and 100 °C, while it reached 0.9 at 20 °C. This indicates that the presence of the iron oxide influenced the capture phenomena. At 20 °C, the difference between the GO and GO–FeO breakthrough curves is less noticeable than at higher temperatures of 60 °C and 100 °C. This suggests that chemisorption or surface reaction played a more important role in the presence of the iron oxide. As physical adsorption is exothermic, the chemisorption would predominate at a higher temperature and could also be kinetically favored. The impact of the flow rate was not significant enough reach conclusions about mass transfer limitation impacts.
2.2.2. Capacity for SO2
The absolute capture capacity values at saturation are presented in Table S1. Since the length of experiments varied for the experiments and the samples with iron oxide saturated at a lower value than the inlet concentration, the absolute capacity values cannot be easily compared. However, the ratios between the mass of SO2 adsorbed on GO–FeO and the mass of SO2 adsorbed on GO under the same operating conditions after the same time on stream allow for a more direct comparison. Table 1 shows the calculated capture capacity ratios between GO–FeO and GO for each set of operating conditions. In every case, the capture capacity ratio is significantly greater than one, indicating that the addition of iron oxide particles clearly enhanced the SO2 capture. These capacities were calculated considering that the SO2 was not measured by the detector, corresponding to the SO2 that was captured and converted.
2.3. Interaction of the Materials with Sulfur
Samples of GO and GO–FexOy were analyzed using XPS before and after they were used for sulfur capture to investigate the impact of the addition of iron. Table 2 presents the atomic and mass percentages of each element (C, O, Fe and S) from the XPS survey scans of four representative samples: the pristine GO and synthesized GO–FeO, before and after their use for SO2 capture (at 20 °C with a 15 mL/min flow rate). This information represents the detected atomic and mass concentrations of the species on the surface of the material.
It can be observed that there was residual sulfur on the GO from its production of pristine GO, as it was synthesized using the classic modified Hummers’ method in which sulfuric acid was used [55]. In the process of depositing the iron oxide particles, with the subsequent washing, the residual sulfur was removed. This explains why there was no sulfur detected on the surface for the GO–FeO sample before its use for SO2 capture. Therefore, even if the concentration of sulfur detected for the samples after the capture is higher for GO than for the GO–FeO, this is attributable mainly to the initial amount of sulfur already present before the capture (residual from GO production). Effectively, the increase in the mass percentage after the capture test was of 0.07% (which represents 5% of the final sulfur content) for the pristine GO while it was of 0.34% for the GO–FeO (which represents 100% of final sulfur content), in accordance with the ratio obtained from the capacity calculated from the breakthrough curves. The mass percentage of sulfur after capture does not correspond exactly to the calculated capacity, which was expected since the XPS analysis is a surface analysis and not a bulk analysis.
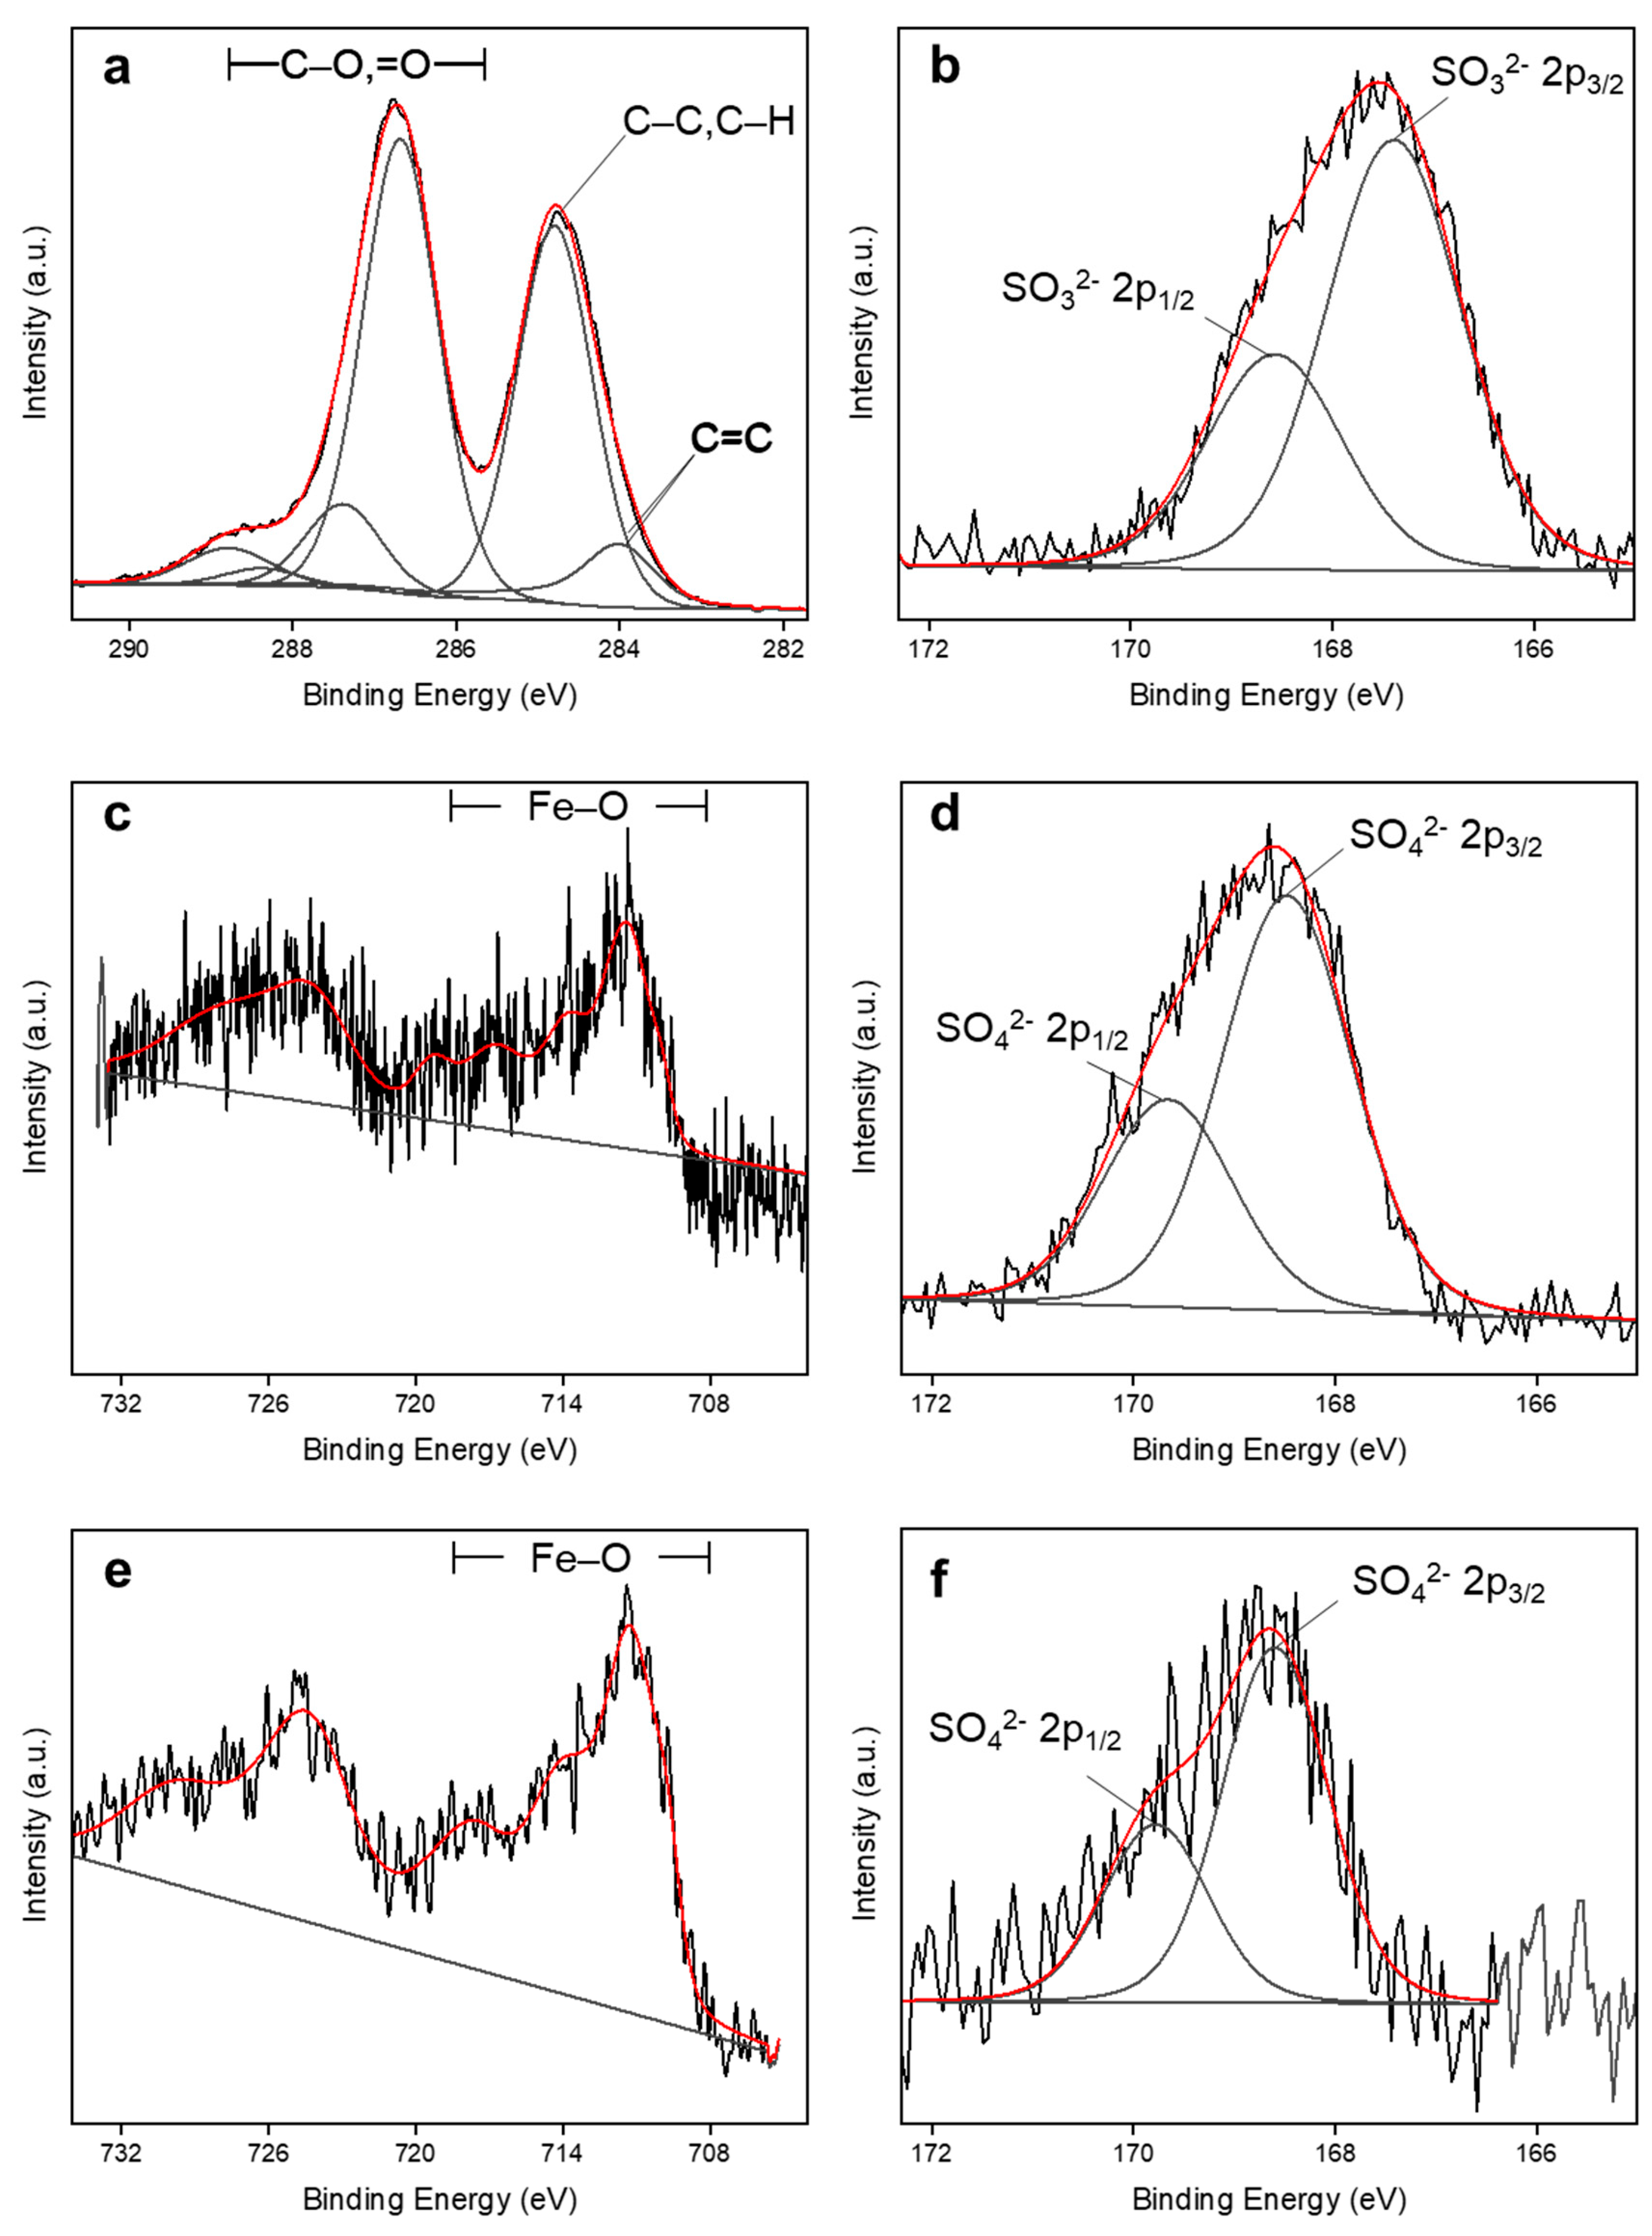
High-resolution spectra with deconvolution are shown in Figure 4. The typical features of GO can be seen in the carbon 1s spectra for GO (Figure 4a). The sp2 and sp3 carbon hybridization peaks of graphene oxide were identified at 284.0 eV and 284.8 eV [56], respectively, with the second one used for calibration. They represent 48 at% with a ratio of 3:10 between sp2 and sp3. The carbon–oxygen species were identified at 286.7 eV and higher, representing the remaining 52 at%.
The iron 2p spectra for the GO–FeO before and after SO2 capture are shown in Figure 4c,e. Even if the valency of iron was not specifically determined (between Fe2+ and Fe3+), the XPS analysis confirmed that the iron was in an oxidized state as expected [54], with no metallic iron detected, which would have been at 707 eV and a lower binding energy [57]. Since the samples were synthesized and used in an oxidizing environment, the XPS analysis would not have caused further oxidation. However, it could have potentially been caused by partial reduction of the sample, and then a change in the ratio between Fe2+ and Fe3+.
No observable change in the iron spectra was observed after the sulfur capture. The presence of a sulfate species, which would likely be at around 713 eV [58], could not be distinguished from the iron oxides in the obtained spectra. Nevertheless, no iron sulfide species (around 707 eV [59]) were identified. Finally, the sulfur spectra are shown in Figure 4b,d,f for GO, GO after SO2 capture and GO–FeO after SO2 capture, respectively. In the three cases, the position of the sulfur species corresponds to sulfur oxides. For the pristine GO, it corresponds to sulfite (SO32−) with 2p3/2 at 167.4 eV [58,59], while for both the materials, it could rather be attributable to sulfate (SO42−) after the SO2 capture, with a single 2p3/2 peak position between 168.5 and 169.0 eV [58,59]. The sulfur interaction with iron or carbon could not be fully assessed because of the relatively low amount of sulfur. Nevertheless, the presence of sulfur was confirmed after the capture. In addition, no sulfide species (such as Fe–S) or S0 sulfur were detected, as the BE 2p3/2 would have been between 162 and 164 eV [59,60].
The material characterization analysis was consistent with the results of the breakthrough experiments. The characterization analyses confirmed the deposition of iron oxide particles on the graphene oxide and the presence of sulfur after the capture experiments. The breakthrough experiments demonstrated a substantial increase in capture capacity with the addition of iron oxide particles, which was also confirmed with the XPS analysis. An influence of the temperature was also observed. In comparison with other adsorbents (Table 3), the proposed iron oxide/graphene oxide composite material is promising, even if direct comparison is not trivial, as their capture capacities are dependent on operating conditions. The main advantage of this material is in allowing a concentration of 0 ppm (with a detection limit of <1 ppm) to be reached, therefore offering a virtually total sulfur removal possibility.
3. Materials and Methods
3.1. Materials
High-surface area graphene oxide prepared by the modified Hummers’ method was purchased from ACS Materials, Pasadena, CA, USA (type B GO), with a reported measured BET specific surface area of 400 m2/g. Iron nitrate nonahydrate (FeNO3∙9H2O, precursor salt), ethylene glycol (99%) and sodium hydroxide (NaOH) pellets were obtained from ThermoFisher Scientific, Ottawa, ON, Canada.
3.2. Iron Oxide Graphene Oxide Preparation
For the preparation of the iron oxide particles, the precursor salt was dissolved in ethylene glycol, in a round-bottom flask. A 0.12 M solution of sodium hydroxide in ethylene glycol was added dropwise to obtain a pH of around 12 to control the size of the particles. The round-bottom flask was heated up to 160 °C under reflux using a silicone oil bath, thus completing the polyol process [54].
For the deposition of the prepared particles on GO, a volume of 2.63 mL of the solution was then mixed with GO (100 mg) and distilled water to target a 5 wt% loading of iron. The stirring was continued for a duration of 48 to 72 h, to ensure proper deposition of the particles on the surface of the GO. After stirring, the solution was centrifuged, air-dried and ground to obtain the iron oxide GO composite material (referred to as GO–FeO).
3.3. SO2 Capture Studies
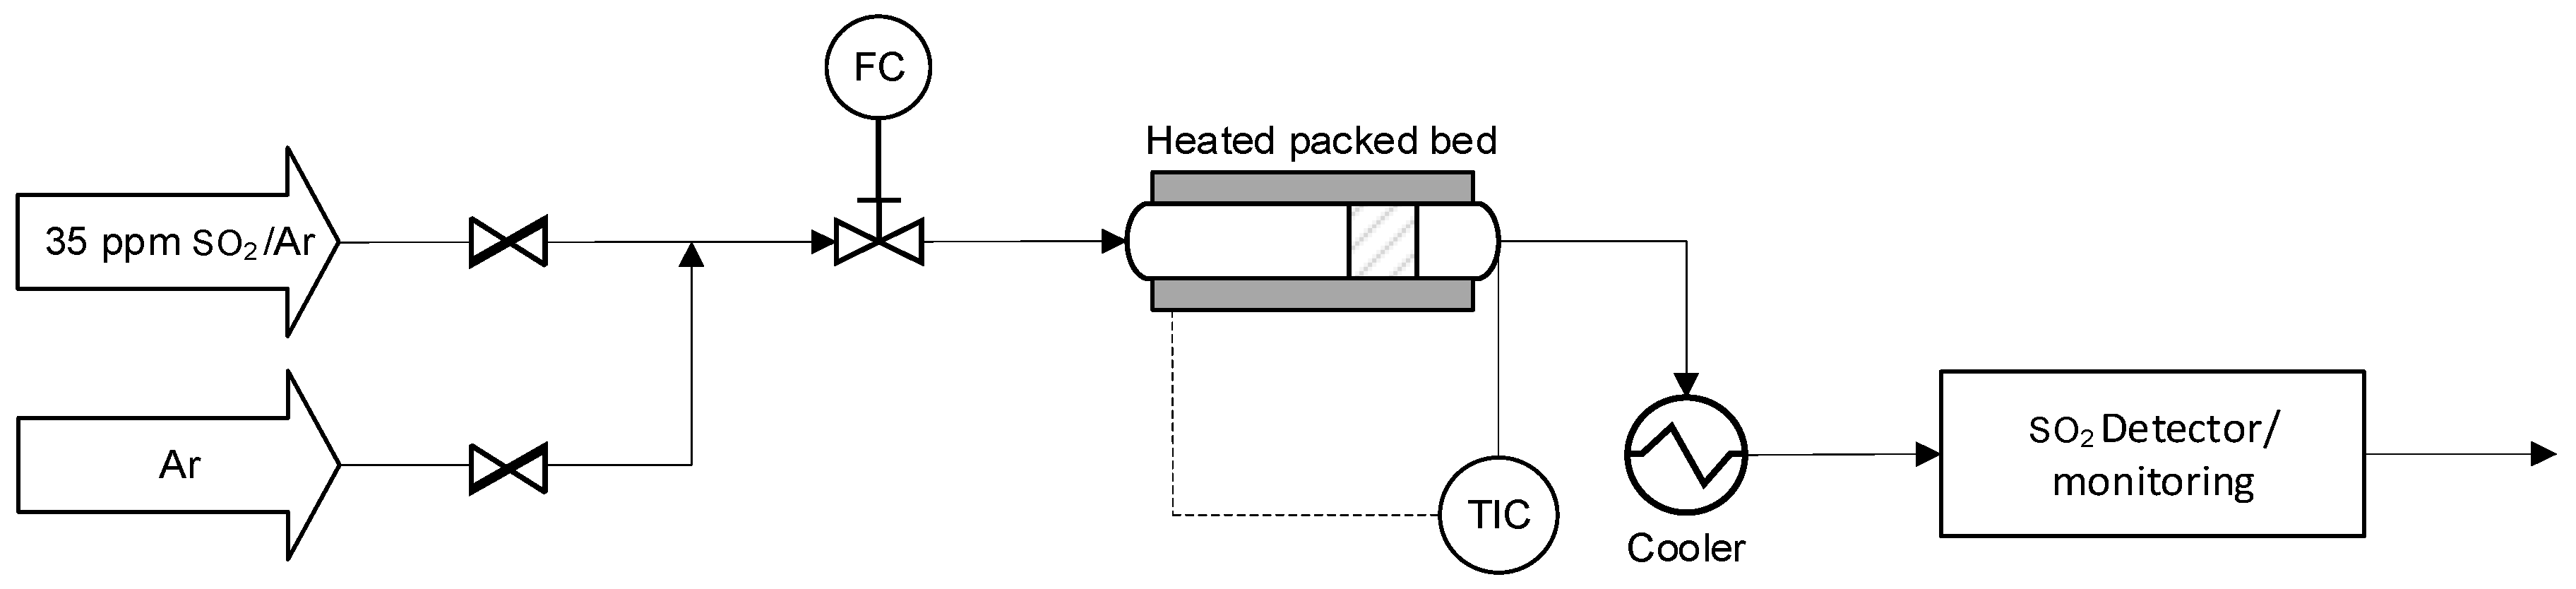
The SO2 capture studies were performed using a heated tubular horizontal quartz tube containing the material to study (pristine GO or GO–FeO) sandwiched between quartz wool to form a short-length packed bed (Figure 5). The inlet flow rate was controlled using a rotameter (indicated as FC in Figure 5) connected to the system. To provide uniform heating, the quartz tube was inserted in a steel tube wrapped with a heating tape around it. A thermocouple (indicated as TIC in Figure 5) was connected to the outlet end of the reactor and placed near the material to measure the temperature in the vicinity of the material. The sample material was positioned in the last quarter of the tube to ensure the gas heated up to the desired testing temperature. The outlet stream was analyzed using an SO2 detector (Dräeger X-am 2500 Detector from Drägerwerk AG & Co. KGaA, Lübeck, Germany) to measure its concentration in the outlet stream. When operated at a temperature higher than room temperature, the outlet stream, prior to SO2 analysis, was cooled by passing it through a coil in an iced bath, to ensure accurate measurement. The entire setup was placed in a fume hood.
Each capture study was performed using 50 mg of the sample and until steady-state outlet concentration was reached. Prior to the capture test, the sample was purged with N2 gas at room temperature for 20 min. For the capture studies, a standard mixture of 25 ppm of SO2 in argon (standard mix obtained from Messer Canada, Mississauga, ON, Canada) was used for the inlet gas stream. The following operating parameters (temperature and flow rate) were investigated (Table 4).
3.4. Calculation of Capture Capacities
Breakthrough curves were used to calculate the capture capacities of the samples after the time on stream, as explained in previous work [64]. The system was considered to have reached saturation when the outlet concentration was constant. The outlet concentration measured and obtained for the blank experiments was 25 ppm, which differed from the supplier-provided information of 35 ppm. The concentration of 25 ppm was then considered and used for the calculation of saturation capacities to allow for a proper comparison between samples and because it avoided any overestimation of the capture capacity. The SO2 capture capacity at saturation was then calculated using Equation (1):
where Q is the capture capacity (mg SO2/g adsorbent), and are the concentrations of SO2 at the inlet and outlet, respectively, and t is time. Finally, the blank experiments showed that the reactor system was inert in adsorbing gas, given that the concentration of SO2 in the outlet gas steam quickly reached 25 ppm and was then stable.
3.5. Material Characterization
Surface morphology investigations were performed using a JEOL JEM-2100F field-emission TEM in brightfield mode (JEOL CANADA, St-Hubert, QC, Canada). Energy-dispersive X-ray spectroscopy (EDXS) analyses for elemental composition were conducted using the JEOL JSM-7500F field-emission SEM/STEM mode (JEOL CANADA, St-Hubert, QC, Canada). The samples for TEM and SEM were prepared by dispersing the material in ethanol using an ultrasonic bath and adding one drop on the grid or on the support.
X-ray photoelectron spectroscopy (XPS) analysis was conducted using an Axis Ultra DLD from Kratos Analytical Ltd (Manchester, UK) with Al Ka monochromatic X-ray source at 225 W, using the Kratos charge neutralizer. Survey scans were acquired at a 160 eV pass energy and high-resolution scans, at a 20 eV pass energy. The charging effect was corrected with the binding energy (BE) of sp3 carbon hybridization (BE = 284.8 eV [56,65]). A doublet separation value of 1.18 eV was used for sulfur 2p, and 13 eV was used for iron 2p [58]. Data treatment was performed using CasaXPS software (Version 2.3.23).
4. Conclusions
In this work, particles of iron oxides were deposited on graphene oxide. Pristine GO and composite (GO–FeO) materials were tested for SO2 capture at relatively low temperatures and from a stream containing 25 ppm of the pollutant gas. The TEM analysis of the samples showed that the GO structure was conserved, while the EDXS analysis confirmed the presence of iron species on the surface through elemental analysis. The XPS analysis of the prepared samples indicated that these deposited iron particles were in an oxidized state with no metallic iron on the surface.
The capture experiments showed that both the GO and GO–FeO could capture SO2, but that the capture capacity was higher when iron oxide particles were added. The mass of SO2 captured on GO–FeO samples was 2.8 to 8.1 times higher than on GO, depending on the conditions. The presence of sulfur on the surface after the capture experiment was confirmed by both EDXS and XPS analysis of the used samples. The XPS analysis performed on samples used for capture at 20 °C with a 15 mL/min flow rate indicated that a higher sulfur mass was found on the surface for the GO–FeO (+0.34 wt%) sample than for the pristine GO (+0.07 wt%), consistent with the increase in capture capacity measured using the breakthrough experiments. Temperature seems to influence capture phenomena by impacting the saturation point and capacity, suggesting that it does not purely involve physical adsorption, but rather chemisorption or a combination of phenomena, especially in the presence of iron oxide. These results indicate that the addition of iron oxide enhances the SO2 capture properties of GO.
Supplementary Materials
The following supporting information can be downloaded at: https://www.mdpi.com/article/10.3390/catal13121469/s1, Figure S1: EDXS analysis of a. pristine GO and b. synthesize GO-FeO composite; Table S1: Calculated SO2 capture capacities of GO and GO-FeO.
Author Contributions
Conceptualization, T.S.S. and C.F.-L.; methodology, T.S.S., A.S. and C.F.-L.; analysis, T.S.S., A.I.M., A.S. and C.F.-L.; investigation, T.S.S. and C.F.-L.; writing—original draft preparation, T.S.S. and A.I.M.; writing—review and editing, A.S. and C.F.-L.; supervision, A.S. and C.F.-L.; funding acquisition, C.F.-L. All authors have read and agreed to the published version of the manuscript.
Funding
This research project was funded by the Natural Sciences and Engineering Research Council of Canada (NSERC), RGPIN-2020-07019.
Data Availability Statement
Data available on request.
Acknowledgments
The authors thank the Material Characterization Core Facility—University of Ottawa for the TEM and EDXS analyses as well as the Plateforme de recherche et d’analyse des matériaux—University of Ottawa for the XPS analysis. The authors also gratefully acknowledge the financial support of the Natural Sciences and Engineering Research Council (NSERC) of Canada and University of Ottawa.
Conflicts of Interest
The authors declare no conflict of interest.
References
- Jain, R.K.; Cui, Z.; Domen, J.K. (Eds.) Chapter 4—Environmental Impacts of Mining. In Environmental Impact of Mining and Mineral Processing; Butterworth-Heinemann: Boston, MA, USA, 2016; pp. 53–157. ISBN 978-0-12-804040-9. [Google Scholar]
- USEPA. Effects of Acid Rain. Available online: https://www.epa.gov/acidrain/effects-acid-rain (accessed on 1 July 2023).
- Reducing Sulphur Dioxide Emissions from Ontario’s Petroleum Facilities|Environmental Registry of Ontario. Available online: https://ero.ontario.ca/notice/019-3443 (accessed on 5 June 2023).
- USEPA. Applying or Implementing Sulfur Dioxide Standards. Available online: https://www.epa.gov/so2-pollution/applying-or-implementing-sulfur-dioxide-standards (accessed on 5 June 2023).
- Liu, X.; Lin, B.; Zhang, Y. Sulfur Dioxide Emission Reduction of Power Plants in China: Current Policies and Implications. J. Clean. Prod. 2016, 113, 133–143. [Google Scholar] [CrossRef]
- Environment and Climate Change Canada. Canadian Environmental Sustainability Indicators: Air Pollutant Emissions; Environment and Climate Change Canada: Ottawa, ON, Canada, 2021. [Google Scholar]
- Rezaei, F.; Rownaghi, A.A.; Monjezi, S.; Lively, R.P.; Jones, C.W. SOx/NOx Removal from Flue Gas Streams by Solid Adsorbents: A Review of Current Challenges and Future Directions. Energy Fuels 2015, 29, 5467–5486. [Google Scholar] [CrossRef]
- Srivastava, R.K.; Jozewicz, W. Flue Gas Desulfurization: The State of the Art. J. Air Waste Manag. Assoc. 2001, 51, 1676–1688. [Google Scholar] [CrossRef] [PubMed]
- Poullikkas, A. Review of Design, Operating, and Financial Considerations in Flue Gas Desulfurization Systems. Energy Technol. Policy 2015, 2, 92–103. [Google Scholar] [CrossRef]
- Zhao, Y.; Hu, G.; Sun, Z.; Yang, J. Simultaneous Removal of SO2 and NO2 on α-Al2O3 Absorbents Loaded with Sodium Humate and Ammonia Water. Energy Fuels 2011, 25, 2927–2931. [Google Scholar] [CrossRef]
- Alver, B.E. A Comparative Adsorption Study of C2H4 and SO2 on Clinoptilolite-Rich Tuff: Effect of Acid Treatment. J. Hazard. Mater. 2013, 262, 627–633. [Google Scholar] [CrossRef] [PubMed]
- Savage, M.; Cheng, Y.; Easun, T.L.; Eyley, J.E.; Argent, S.P.; Warren, M.R.; Lewis, W.; Murray, C.; Tang, C.C.; Frogley, M.D.; et al. Selective Adsorption of Sulfur Dioxide in a Robust Metal–Organic Framework Material. Adv. Mater. 2016, 28, 8705–8711. [Google Scholar] [CrossRef] [PubMed]
- Kopaç, T. Non-Isobaric Adsorption Analysis of SO2 on Molecular Sieve 13X and Activated Carbon by Dynamic Technique. Chem. Eng. Process. Process Intensif. 1999, 38, 45–53. [Google Scholar] [CrossRef]
- Meimand, M.M.; Jafari, A.J.; Nasiri, A.; Malakootian, M. Sulfur Dioxide Adsorption by Iron Oxide Nanoparticles@clinoptilolite/HCl. J. Air Pollut. Health 2020, 5, 107–120. [Google Scholar] [CrossRef]
- Hanif, M.A.; Ibrahim, N.; Abdul Jalil, A. Sulfur Dioxide Removal: An Overview of Regenerative Flue Gas Desulfurization and Factors Affecting Desulfurization Capacity and Sorbent Regeneration. Environ. Sci. Pollut. Res. 2020, 27, 27515–27540. [Google Scholar] [CrossRef]
- Babu, D.J.; Puthusseri, D.; Kühl, F.G.; Okeil, S.; Bruns, M.; Hampe, M.; Schneider, J.J. SO2 Gas Adsorption on Carbon Nanomaterials: A Comparative Study. Beilstein J. Nanotechnol. 2018, 9, 1782–1792. [Google Scholar] [CrossRef] [PubMed]
- Bae, Y.-S.; Lee, C.-H. Sorption Kinetics of Eight Gases on a Carbon Molecular Sieve at Elevated Pressure. Carbon 2005, 43, 95–107. [Google Scholar] [CrossRef]
- Kühl, F.G.; Kazdal, T.J.; Lang, S.; Hampe, M.J. Adsorption of Sulfur Dioxide and Mixtures with Nitrogen at Carbon Nanotubes and Graphene: Molecular Dynamics Simulation and Gravimetric Adsorption Experiments. Adsorption 2017, 23, 293–301. [Google Scholar] [CrossRef]
- Babu, D.J.; Kühl, F.G.; Yadav, S.; Markert, D.; Bruns, M.; Hampe, M.J.; Schneider, J.J. Adsorption of Pure SO2 on Nanoscaled Graphene Oxide. RSC Adv. 2016, 6, 36834–36839. [Google Scholar] [CrossRef]
- Stirling, D. The Sulfur Problem; The Royal Society of Chemistry: London, UK, 2000; ISBN 978-0-85404-541-9. [Google Scholar]
- Otsuka, N. Fireside Corrosion. In Shreir’s Corrosion; Cottis, B., Graham, M., Lindsay, R., Lyon, S., Richardson, T., Scantlebury, D., Stott, H., Eds.; Elsevier: Cham, Swizterland, 2010; Volume 1, ISBN 978-0-444-52787-5. [Google Scholar]
- Li, B.; Ma, C. Study on the Mechanism of SO2 Removal by Activated Carbon. Energy Procedia 2018, 153, 471–477. [Google Scholar] [CrossRef]
- Zhang, L.; Cui, L.; Li, B.; Wang, W.; Ma, C. Experimental Study of SO2 Removal by Powder Activated Carbon in Fluidized Bed Reactor. In Proceedings of the 2010 Asia-Pacific Power and Energy Engineering Conference, Chengdu, China, 28–31 March 2010; pp. 591–594. [Google Scholar]
- Lizzio, A.A.; DeBarr, J.A. Mechanism of SO2 Removal by Carbon. Energy Fuels 1997, 11, 284–291. [Google Scholar] [CrossRef]
- Gaur, V.; Asthana, R.; Verma, N. Removal of SO2 by Activated Carbon Fibers in the Presence of O2 and H2O. Carbon 2006, 44, 46–60. [Google Scholar] [CrossRef]
- Liu, X.-L.; Guo, J.-X.; Chu, Y.-H.; Luo, D.-M.; Yin, H.-Q.; Sun, M.-C.; Yavuz, R. Desulfurization Performance of Iron Supported on Activated Carbon. Fuel 2014, 123, 93–100. [Google Scholar] [CrossRef]
- Davini, P. The Effect of Certain Metallic Derivatives on the Adsorption of Sulphur Dioxide on Active Carbon. Carbon 2001, 39, 419–424. [Google Scholar] [CrossRef]
- Fu, H.; Wang, X.; Wu, H.; Yin, Y.; Chen, J. Heterogeneous Uptake and Oxidation of SO2 on Iron Oxides. J. Phys. Chem. C 2007, 111, 6077–6085. [Google Scholar] [CrossRef]
- Sun, F.; Gao, J.; Zhu, Y.; Chen, G.; Wu, S.; Qin, Y. Adsorption of SO2 by Typical Carbonaceous Material: A Comparative Study of Carbon Nanotubes and Activated Carbons. Adsorption 2013, 19, 959–966. [Google Scholar] [CrossRef]
- Mechanism and Application of Carbon Nanotube Sensors in SF6 Decomposed Production Detection: A Review|Nanoscale Research Letters|Full Text. Available online: https://nanoscalereslett.springeropen.com/articles/10.1186/s11671-017-1945-8 (accessed on 19 April 2022).
- Zhang, X.; Meng, F.; Yang, B. Use of Hydroxyl-Modified Carbon Nanotubes for Detecting SF6 Decomposition Products under Partial Discharge in Gas Insulated Switchgear. IEEE Trans. Dielectr. Electr. Insul. 2013, 20, 2246–2253. [Google Scholar] [CrossRef]
- An, L.; Jia, X.; Liu, Y. Adsorption of SO2 Molecules on Fe-Doped Carbon Nanotubes: The First Principles Study. Adsorption 2019, 25, 217–224. [Google Scholar] [CrossRef]
- Li, W.; Ma, J.-J.; Liu, P.; Pan, Z.-L.; He, Q.-Y. First-Principles Study of the Adsorption Sensitivity of Ni-Doped Single-Walled Zigzag (n,0)CNTs (N=4,5,6) toward SO2 Molecules. Appl. Surf. Sci. 2015, 335, 17–22. [Google Scholar] [CrossRef]
- Yoosefian, M.; Zahedi, M.; Mola, A.; Naserian, S. A DFT Comparative Study of Single and Double SO2 Adsorption on Pt-Doped and Au-Doped Single-Walled Carbon Nanotube. Appl. Surf. Sci. 2015, 349, 864–869. [Google Scholar] [CrossRef]
- Dreyer, D.R.; Park, S.; Bielawski, C.W.; Ruoff, R.S. The Chemistry of Graphene Oxide. Chem. Soc. Rev. 2009, 39, 228–240. [Google Scholar] [CrossRef] [PubMed]
- Zhu, Y.; Murali, S.; Cai, W.; Li, X.; Suk, J.W.; Potts, J.R.; Ruoff, R.S. Graphene and Graphene Oxide: Synthesis, Properties, and Applications. Adv. Mater. 2010, 22, 3906–3924. [Google Scholar] [CrossRef] [PubMed]
- Sachdeva, H. Recent Advances in the Catalytic Applications of GO/rGO for Green Organic Synthesis. Green Process. Synth. 2020, 9, 515–537. [Google Scholar] [CrossRef]
- Long, Y.; Zhang, C.; Wang, X.; Gao, J.; Wang, W.; Liu, Y. Oxidation of SO2 to SO3 Catalyzed by Graphene Oxide Foams. J. Mater. Chem. 2011, 21, 13934–13941. [Google Scholar] [CrossRef]
- Zhang, H.; Cen, W.; Liu, J.; Guo, J.; Yin, H.; Ning, P. Adsorption and Oxidation of SO2 by Graphene Oxides: A van Der Waals Density Functional Theory Study. Appl. Surf. Sci. 2015, 324, 61–67. [Google Scholar] [CrossRef]
- Shabestari, M.E.; Martín, O.; Díaz-García, D.; Gómez-Ruiz, S.; Gonzalez, V.J.; Baselga, J. Facile and Rapid Decoration of Graphene Oxide with Copper Double Salt, Oxides and Metallic Copper as Catalysts in Oxidation and Coupling Reactions. Carbon 2020, 161, 7–16. [Google Scholar] [CrossRef]
- Rodríguez-García, S.; Santiago, R.; López-Díaz, D.; Merchán, M.D.; Velázquez, M.M.; Fierro, J.L.G.; Palomar, J. Role of the Structure of Graphene Oxide Sheets on the CO2 Adsorption Properties of Nanocomposites Based on Graphene Oxide and Polyaniline or Fe3O4-Nanoparticles. ACS Sustain. Chem. Eng. 2019, 7, 12464–12473. [Google Scholar] [CrossRef]
- Soni, J.; Sethiya, A.; Sahiba, N.; Agarwal, S. Recent Advancements in Organic Synthesis Catalyzed by Graphene Oxide Metal Composites as Heterogeneous Nanocatalysts. Appl. Organomet. Chem. 2021, 35, e6162. [Google Scholar] [CrossRef]
- Rodríguez, C.; Tapia, C.; Leiva-Aravena, E.; Leiva, E. Graphene Oxide–ZnO Nanocomposites for Removal of Aluminum and Copper Ions from Acid Mine Drainage Wastewater. Int. J. Environ. Res. Public Health 2020, 17, 6911. [Google Scholar] [CrossRef] [PubMed]
- Su, H.; Ye, Z.; Hmidi, N. High-Performance Iron Oxide-Graphene Oxide Nanocomposite Adsorbents for Arsenic Removal. Colloids Surf. A Physicochem. Eng. Asp. 2017, 522, 161–172. [Google Scholar] [CrossRef]
- Lowell, P.S.; Schwitzgebel, K.; Parsons, T.B.; Sladek, K.J. Selection of Metal Oxides for Removing SO2 from Flue Gas. Ind. Eng. Chem. Proc. Des. Dev. 1971, 10, 384–390. [Google Scholar] [CrossRef]
- Deberry, D.W.; Sladek, K.J. Rates of Reaction of SO2 with Metal Oxides. Can. J. Chem. Eng. 1971, 49, 781–785. [Google Scholar] [CrossRef]
- Gavaskar, V.S.; Abbasian, J. Dry Regenerable Metal Oxide Sorbents for SO2 Removal from Flue Gases. 1. Development and Evaluation of Copper Oxide Sorbents. Ind. Eng. Chem. Res. 2006, 45, 5859–5869. [Google Scholar] [CrossRef]
- Zhao, L.; Bi, S.; Pei, J.; Li, X.; Yu, R.; Zhao, J.; Martyniuk, C.J. Adsorption Performance of SO2 over ZnAl2O4 Nanospheres. J. Ind. Eng. Chem. 2016, 41, 151–157. [Google Scholar] [CrossRef]
- Zhao, L.; Li, X.; Qu, Z.; Zhao, Q.; Liu, S.; Hu, X. The NiAl Mixed Oxides: The Relation between Basicity and SO2 Removal Capacity. Sep. Purif. Technol. 2011, 80, 345–350. [Google Scholar] [CrossRef]
- Koballa, T.E.; Dudukovic, M.P. Sulfur Dioxide Adsorption on Metal Oxides Supported on Alumina. AIChE Symp. Ser. 1977, 73, 199–228. [Google Scholar]
- Brandt, P.; Nuhnen, A.; Lange, M.; Möllmer, J.; Weingart, O.; Janiak, C. Metal–Organic Frameworks with Potential Application for SO2 Separation and Flue Gas Desulfurization. ACS Appl. Mater. Interfaces 2019, 11, 17350–17358. [Google Scholar] [CrossRef] [PubMed]
- DeCoste, J.B.; Peterson, G.W.; Jasuja, H.; Glover, T.G.; Huang, Y.-G.; Walton, K.S. Stability and Degradation Mechanisms of Metal–Organic Frameworks Containing the Zr6O4(OH)4 Secondary Building Unit. J. Mater. Chem. A 2013, 1, 5642–5650. [Google Scholar] [CrossRef]
- Li, L.; da Silva, I.; Kolokolov, D.I.; Han, X.; Li, J.; Smith, G.; Cheng, Y.; Daemen, L.L.; Morris, C.G.; Godfrey, H.G.W.; et al. Post-Synthetic Modulation of the Charge Distribution in a Metal–Organic Framework for Optimal Binding of Carbon Dioxide and Sulfur Dioxide. Chem. Sci. 2019, 10, 1472–1482. [Google Scholar] [CrossRef] [PubMed]
- Panaritis, C.; Zgheib, J.; Ebrahim, S.A.H.; Couillard, M.; Baranova, E.A. Electrochemical In-Situ Activation of Fe-Oxide Nanowires for the Reverse Water Gas Shift Reaction. Appl. Catal. B Environ. 2020, 269, 118826. [Google Scholar] [CrossRef]
- Kaur, M.; Kaur, H.; Kukkar, D. Synthesis and Characterization of Graphene Oxide Using Modified Hummer’s Method. AIP Conf. Proc. 2018, 1953, 030180. [Google Scholar] [CrossRef]
- Dave, K.; Park, K.H.; Dhayal, M. Two-Step Process for Programmable Removal of Oxygen Functionalities of Graphene Oxide: Functional, Structural and Electrical Characteristics. RSC Adv. 2015, 5, 95657–95665. [Google Scholar] [CrossRef]
- Biesinger, M.C.; Payne, B.P.; Grosvenor, A.P.; Lau, L.W.M.; Gerson, A.R.; Smart, R.S.C. Resolving Surface Chemical States in XPS Analysis of First Row Transition Metals, Oxides and Hydroxides: Cr, Mn, Fe, Co and Ni. Appl. Surf. Sci. 2011, 257, 2717–2730. [Google Scholar] [CrossRef]
- Naumkin, A.V.; Kraut-Vass, A.; Gaarenstroom, S.W.; Powell, C.J. X-ray Photoelectron Spectroscopy Database XPS, NIST Standard Reference Database. 2012. Available online: https://srdata.nist.gov/xps/ (accessed on 1 March 2023).
- Descostes, M.; Mercier, F.; Thromat, N.; Beaucaire, C.; Gautier-Soyer, M. Use of XPS in the Determination of Chemical Environment and Oxidation State of Iron and Sulfur Samples: Constitution of a Data Basis in Binding Energies for Fe and S Reference Compounds and Applications to the Evidence of Surface Species of an Oxidized Pyrite in a Carbonate Medium. Appl. Surf. Sci. 2000, 165, 288–302. [Google Scholar] [CrossRef]
- Hollinger, G.; Kumurdjian, P.; Mackowski, J.M.; Pertosa, P.; Porte, L.; Duc, T.M. ESCA Study of Molecular GeS3−x Tex As2 Glasses. J. Electron. Spectrosc. Relat. Phenom. 1974, 5, 237–245. [Google Scholar] [CrossRef]
- Chiu, C.-H.; Lin, H.-P.; Kuo, T.-H.; Chen, S.-S.; Chang, T.-C.; Su, K.-H.; Hsi, H.-C. Simultaneous Control of Elemental Mercury/Sulfur Dioxide/Nitrogen Monoxide from Coal-Fired Flue Gases with Metal Oxide-Impregnated Activated Carbon. Aerosol Air Qual. Res. 2015, 15, 2094–2103. [Google Scholar] [CrossRef]
- Gupta, N.K.; Kim, E.J.; Baek, S.; Bae, J.; Kim, K.S. Ternary Metal Oxide Nanocomposite for Room Temperature H2S and SO2 Gas Removal in Wet Conditions. Sci. Rep. 2022, 12, 15387. [Google Scholar] [CrossRef] [PubMed]
- Nieto-Márquez, A.; Atanes, E.; Morena, J.; Fernández-Martínez, F.; Valverde, J.L. Upgrading Waste Tires by Chemical Activation for the Capture of SO2. Fuel Process. Technol. 2016, 144, 274–281. [Google Scholar] [CrossRef]
- Zafari, R.; Mendonça, F.G.; Tom Baker, R.; Fauteux-Lefebvre, C. Efficient SO2 Capture Using an Amine-Functionalized, Nanocrystalline Cellulose-Based Adsorbent. Sep. Purif. Technol. 2023, 308, 122917. [Google Scholar] [CrossRef]
- Sitko, R.; Turek, E.; Zawisza, B.; Malicka, E.; Talik, E.; Heimann, J.; Gagor, A.; Feist, B.; Wrzalik, R. Adsorption of Divalent Metal Ions from Aqueous Solutions Using Graphene Oxide. Dalton Trans. 2013, 42, 5682–5689. [Google Scholar] [CrossRef]
Figure 1.
TEM of (a) pristine GO; (b) prepared GO–FeO; (c) GO used for SO2 capture (at 15 mL/min and 20 °C) and; (d) GO–FeO used for SO2 capture (at 15 mL/min and 20 °C).
Figure 1.
TEM of (a) pristine GO; (b) prepared GO–FeO; (c) GO used for SO2 capture (at 15 mL/min and 20 °C) and; (d) GO–FeO used for SO2 capture (at 15 mL/min and 20 °C).

Figure 2.
EDXS analysis of (a) GO and (b) GO–FeO after SO2 capture (20 °C and 15 mL/min).

Figure 3.
Breakthrough curves of pristine GO and GO–FeO samples used for SO2 capture under various operating conditions: (a) 20 °C and 15 mL/min, (b) 100 °C and 15 mL/min, (c) 60 °C and 10 mL/min, (d) 100 °C and 5 mL/min, with the inlet concentration (C0) at 25 ppm.
Figure 3.
Breakthrough curves of pristine GO and GO–FeO samples used for SO2 capture under various operating conditions: (a) 20 °C and 15 mL/min, (b) 100 °C and 15 mL/min, (c) 60 °C and 10 mL/min, (d) 100 °C and 5 mL/min, with the inlet concentration (C0) at 25 ppm.

Figure 4.
XPS high-resolution spectra: (a) C 1s spectra of pristine GO, (b) S 2p spectra of pristine GO, (c) Fe 2p spectra of GO–FeO, (d) S 2p spectra of GO used for SO2 capture (15 mL/min, 20 °C), (e) Fe 2p spectra of GO–FeO used for SO2 capture (15 mL/min, 20 °C), and (f) S 2p spectra of GO–FeO used for SO2 capture (15 mL/min, 20 °C). The black line indicates the original spectra, while the red curve indicates the resulting curve fitting from the deconvolution.

Figure 5.
Schematic of the SO2 capture setup.


Table 1.
SO2 capture capacity ratios of GO–FeO:GO at the end of the experiment.
| Operating Conditions | Capacity Ratio for SO2 (mgSO2 on GO–FeO/mgSO2 on GO) |
|---|---|
| 20 °C and 15 mL/min | 4.6 |
| 60 °C and 10 mL/min | 8.1 |
| 100 °C and 15 mL/min | 6.5 |
| 100 °C and 5 mL/min | 2.8 |
Table 2.
XPS quantitative elemental analysis of surface compounds.
| Sample | C (At%/Mass%) | O (At%/Mass%) | Fe (At%/Mass%) | S (At%/Mass%) | Change in S Amount after Capture (Mass%) |
|---|---|---|---|---|---|
| GO | 71.46/64.86 | 28.02/33.88 | 0.00 | 0.52/1.26 | – |
| GO–FeO | 73.05/66.75 | 26.79/32.61 | 0.15/0.64 | 0.00 | – |
| GO/SO2 | 70.47/63.75 | 28.98/34.92 | 0.00 | 0.55/1.33 | 0.07 |
| GO–FeO/SO2 | 74.11/67.65 | 25.52/31.03 | 0.23/0.98 | 0.14/0.34 | 0.34 |
Table 3.
Comparison of sorbents used for SO2 capture.
| Material Description | Inlet SO2 Concentration (ppm) | Temperature (K) | Capture Capacity (mg SO2/g sorbent) | Reference |
|---|---|---|---|---|
| Modified coconut shell | 200 | 298 | 0.4–0.8 | [61] |
| Mn–Zn–Fe metal oxide nanocomposite | 100 | 298 | 31 | [62] |
| Fly ash/ KOH | 40 | 298 | 7.0 | [63] |
| Modified nanocellulose | 25 | 298 | 2.0 | [64] |
| This study | 25 | 293–393 | 0.6–1.5 | N/A |
Table 4.
SO2 capture experiment operating conditions.
| Sample Type | Temperature (°C) | Inlet Flow Rate 2 (mL/min) | Inlet Gas Hourly Space Velocity 2 (mL/h/gsample) |
|---|---|---|---|
| None 1 | 20/60/100 | 5/10/15 | 6000/12,000/18,000 |
| GO | 20 | 15 | 18,000 |
| GO | 100 | 5 | 6000 |
| GO | 100 | 15 | 18,000 |
| GO | 60 | 10 | 12,000 |
| GO–FeO | 20 | 15 | 18,000 |
| GO–FeO | 100 | 5 | 6000 |
| GO–FeO | 100 | 15 | 18,000 |
| GO–FeO | 60 | 10 | 12,000 |
1 Blank experiments (empty tube) were conducted for each combination of operating conditions. 2 Controlled at 20 °C and atmospheric pressure.
Disclaimer/Publisher’s Note: The statements, opinions and data contained in all publications are solely those of the individual author(s) and contributor(s) and not of MDPI and/or the editor(s). MDPI and/or the editor(s) disclaim responsibility for any injury to people or property resulting from any ideas, methods, instructions or products referred to in the content. |
© 2023 by the authors. Licensee MDPI, Basel, Switzerland. This article is an open access article distributed under the terms and conditions of the Creative Commons Attribution (CC BY) license (https://creativecommons.org/licenses/by/4.0/).
Share and Cite
MDPI and ACS Style
Sanyal, T.S.; Mugisha, A.I.; Sowinski, A.; Fauteux-Lefebvre, C. Enhancement of Sulfur Oxide Capture Capacity by Deposition of Iron Oxide Particles on Graphene Oxide. Catalysts 2023, 13, 1469. https://doi.org/10.3390/catal13121469
AMA Style
Sanyal TS, Mugisha AI, Sowinski A, Fauteux-Lefebvre C. Enhancement of Sulfur Oxide Capture Capacity by Deposition of Iron Oxide Particles on Graphene Oxide. Catalysts. 2023; 13(12):1469. https://doi.org/10.3390/catal13121469
Chicago/Turabian StyleSanyal, Tanushree Sankar, Amanda Ineza Mugisha, Andrew Sowinski, and Clémence Fauteux-Lefebvre. 2023. "Enhancement of Sulfur Oxide Capture Capacity by Deposition of Iron Oxide Particles on Graphene Oxide" Catalysts 13, no. 12: 1469. https://doi.org/10.3390/catal13121469
Note that from the first issue of 2016, this journal uses article numbers instead of page numbers. See further details here.