1. Introduction
The continuous contamination of water bodies by effluents from wastewater treatment plants (WWTPs), hospitals, municipal sewage systems, industries, run-off water from agricultural land and other sources poses a great threat to both human and aquatic health [
1,
2]. Heterogeneous photocatalysis, specifically TiO
2, has been widely used in micropollutant removal in water due to its good performance to light irradiation, relatively high activity, non-toxicity and cost-effective synthesis process. It can exist in three crystalline forms, namely anatase, rutile and brookite. Among them, anatase has been reported to exhibit higher photocatalytic efficiency [
3,
4,
5]. Similarly, the membrane separation process [
6,
7] has emerged as a promising technique for applications such as water treatment. However, when applied individually, these technologies might not achieve target efficiencies and therefore additional treatment processes are needed [
1]. Thus, a combining of membrane separation and the photocatalytic mechanism in a single reactor configuration not only can couple the advantages of the constituent treatment process but also eliminate the challenges of one another [
8].
Photocatalytic nanoparticles, when combined with a membrane matrix, form a photocatalytic membrane reactor (PMR). These reactors can be operated either by suspending the photocatalytic nanoparticles in the feed solution (slurry type) or by immobilizing the photocatalytic nanoparticles into or onto the membrane [
9]. In a slurry-type reactor, the photocatalyst particles are suspended in the reactor and therefore a large specific surface area of nanometer-scale particles is attained [
10]. In this design, mass transfer limitations can be reduced through effective mixing adjustment of the photocatalyst concentration which results in higher photocatalytic efficiency [
11]. However, additional membrane fouling may be caused by the cake formed by the catalyst nanoparticles [
1]. Similarly, high turbidity in the solution mixture results from increasing the nanoparticle dosage (to enhance the photocatalytic activity). This can decrease the penetration depth of the UV light which also lowers the photocatalytic reaction efficiency [
12].
The aforementioned limitations can be overcome by immobilizing the nanoparticles in the membrane substrate. Among the different methods for immobilization, the sol–gel-based dip-coating technique has been widely used as it is a simple process where the number of deposited nanoparticles can be controlled by regulating the prepared sol and subsequent gelation process [
13]. In this method, the membrane can be used as a support for the photocatalyst. The immobilization of nanoparticles on such porous membrane support has numerous advantages, namely: (1) no need for a post-treatment unit for photocatalyst separation from the treated water, (2) minimized photocatalyst loss and (3) acting as a barrier for larger microorganisms and molecules such as bacteria or organic matter [
14,
15,
16]. Although catalytic recovery, reuse and regeneration in successive catalytic runs can be achieved using nanoparticles immobilized into a membrane matrix, the active surface area of the photocatalyst is limited [
17,
18]. In this design, the photocatalytic activity is determined by the mass transfer of pollutants from the fluid current across the photocatalytic membrane boundary layer and to the photocatalyst surface. This mass transfer can take place either by diffusion or convection depending on the PMR design [
19]. Such limitations can be repressed by a suitable design of the reactor. Features such as reactor geometry, dimensions and direction of feed solution flow in the reactor have a direct influence on reactor performance [
20,
21]. The miniaturization of reactor devices (e.g., bulk to microreactors/nanoreactors) is an alternative to reduce the diffusion distance and, consequently, enhance the mass transfer [
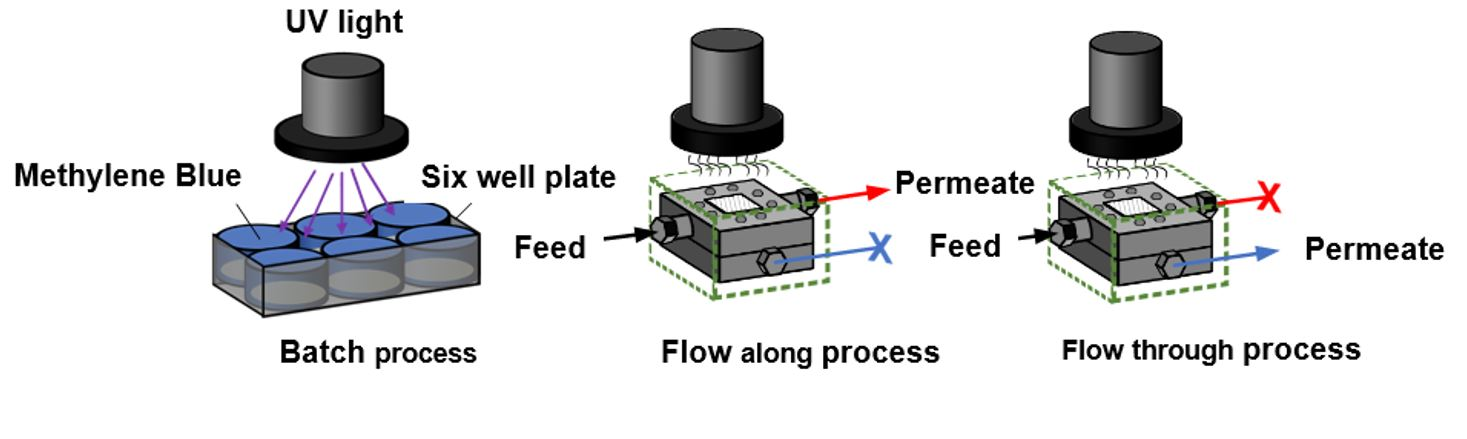
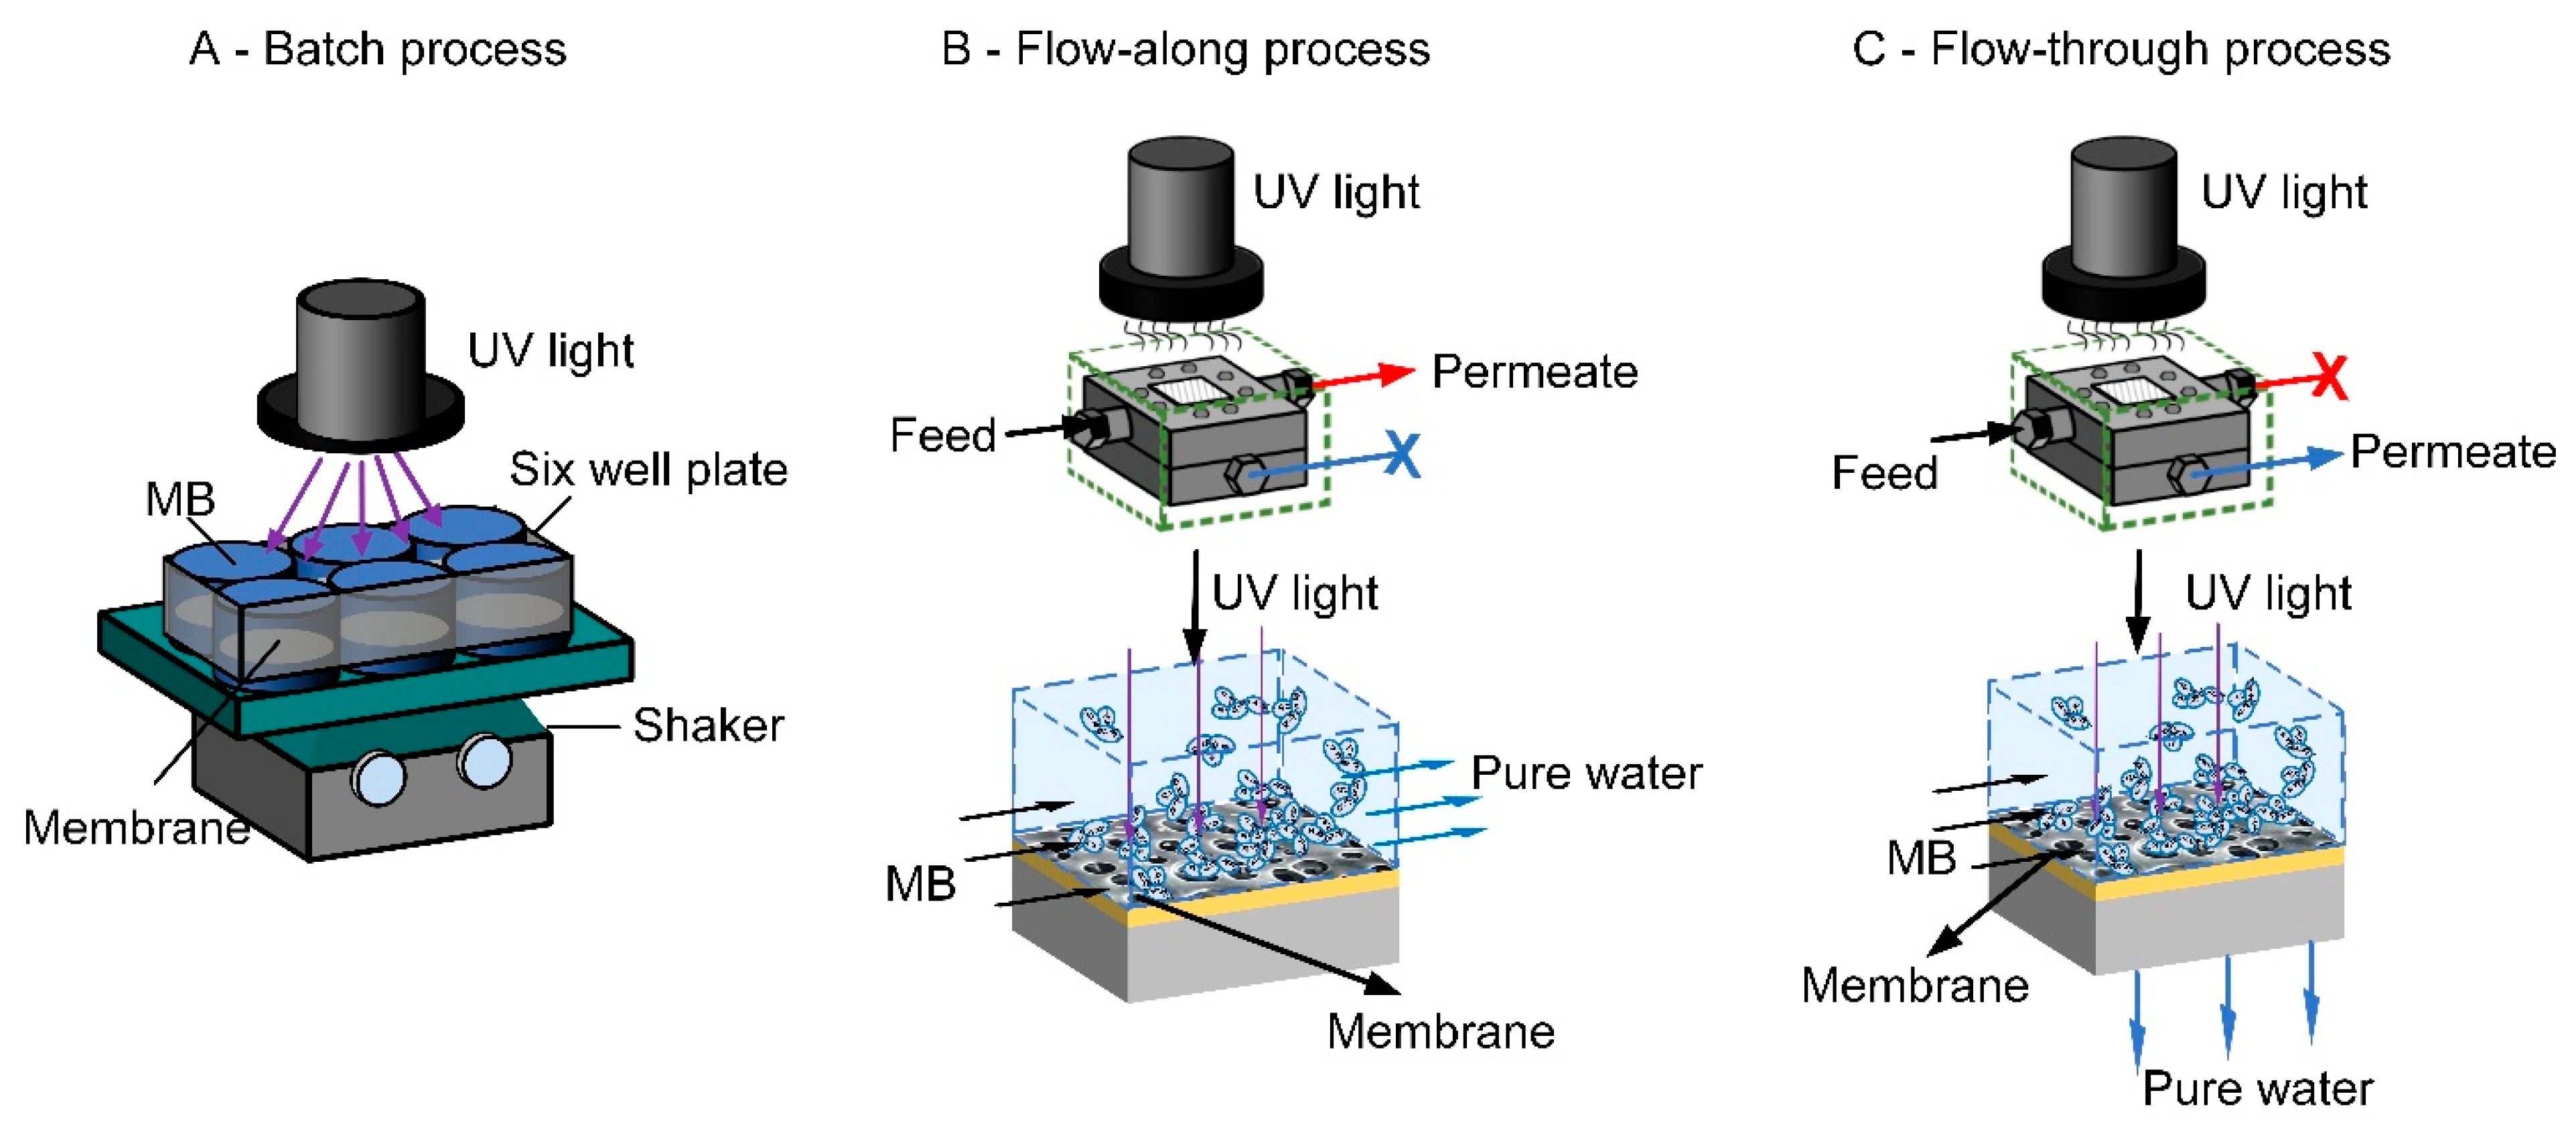
22]. In this context, the immobilized photocatalytic membrane can be used in different reactor configurations: batch/static, flow-along and flow-through reactors [
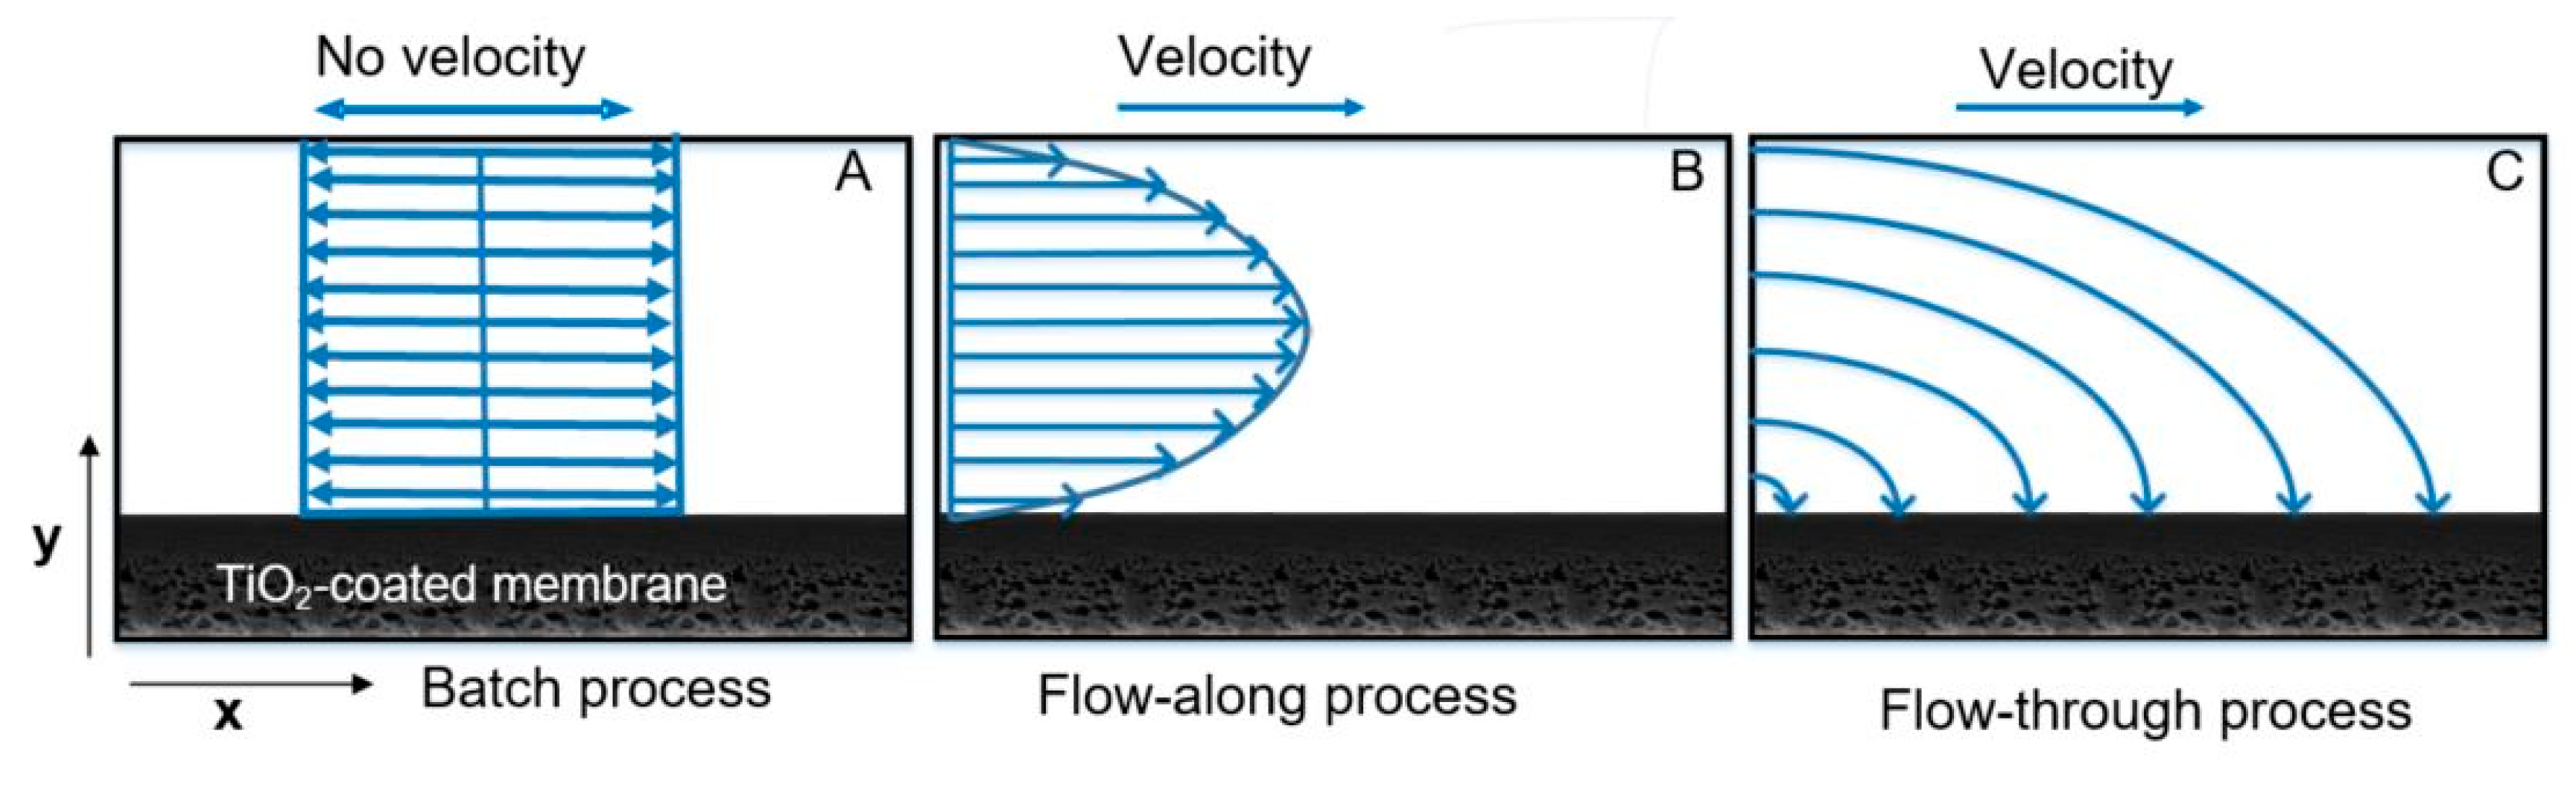
23]. In the batch process (
Figure 1A), the solution to be treated and the photocatalytic membrane are kept in the reactor. In the flow-along process (
Figure 1B), the solution is guided along the surface of the membrane, whereas in the flow-through process (
Figure 1C), the solution passes through the membrane pores.
A batch (static) reactor can be made of a simple container with different configurations with a membrane placed inside the reactor and the light source located at the top, immersed inside the solution or fixed on the side of the reactor [
24]. Here, a nanoparticles (say TiO
2)-coated membrane is placed in the reactor containing feed water at time zero, and the reaction takes place until the light is turned off (end of reaction). Consequently, the residence time in such a reactor can be considered as the total reaction time [
25]. In such a system, a fixed volume of the feed solution is kept in the reactor with/without shaking. Since the photocatalytic membrane is at the reactor bottom, contact between all solute molecules and photocatalyst cannot be achieved [
15].
Small channels with dimensions below 1 mm are the common feature of microchannel reactor designs [
22]. Typical features of such a reactor are a parabolic velocity profile and quite homogeneous light distribution across the surface of the reactor [
23]. Photocatalytic efficiency is mainly determined by photon transfer (i.e., activation of the catalyst by incident light) and mass transfer (i.e., solute molecule contact with catalyst surface, followed by its diffusion on it) efficiency which are dependent on, amongst many factors (e.g., illumination system, flow regime), the catalytic surface area per unit volume [
26]. Thus, the microreactor, which possesses as an advantage a large photocatalytic surface-to-volume ratio and short molecular diffusion length, could be able to overcome mass transfer limitations as the pollutant-to-photocatalyst contact is facilitated [
27,
28]. The main drawback is its relatively small throughput [
29,
30]. Likewise, only solute molecules at the membrane surface undergo degradation, whereas a large fraction of molecules pass by unaffected, causing a low removal efficiency [
31,
32].
A reactor which carries out chemical reactions in a limited nanometer to sub-micrometer scale space of porous materials (e.g., carbon materials or membrane pores) is considered a nanoreactor [
33,
34]. In such a reactor, the solute is subjected to the reaction in a manner so that most of the reaction is completed in a nanoconfined space [
34]. The mass transfer limitation in such a reactor is minimized due to the reduced molecular diffusion distance which promotes a high probability of collision between reactive oxygen species and solute molecules in the photocatalytic process [
5,
35,
36,
37]. An intensification of the transport phenomena is attained since the contact between molecules and catalyst is facilitated by the large available catalyst area due to the high surface-to-volume ratio [
37,
38]. Besides the improvement of mass transfer, the miniaturization of the reactor to the nanometer scale allows a short light path and effective catalyst exposure to irradiation [
35], thus increasing the absorbed photon flux density [
39]. This strongly improves the reaction rate in photocatalytic processes.
Although several designs of photocatalytic reactors for water treatment have been investigated in the past decades, there is still a lack of methodology to perform a fair and precise comparison between reactors due to their specific characteristics (e.g., throughput capacity, illuminated volume, light source and flow mode) [
29]. Thus, to compare photocatalytic reactors’ performance, the most meaningful parameters need to be identified. In this sense, the main contributing factors that should be accounted for are throughput, energy efficiency and photocatalytic activity [
40]. Throughput is determined by the reactor volume and reaction time in a batch reactor, while in a continuous flow reactor, this is given by the flow rate. Even though this is an important parameter for reactor performance, meaningful figures-of-merit to evaluate reactor throughput are lacking [
41,
42]. Similarly, energy efficiency is determined by variables such as light source, wavelength, emittance angle and pumping energy. Specific energy consumption (SEC), which is defined as the power required to treat a volume of water, could be used to evaluate reactor performance regarding energy efficiency [
43,
44]. Furthermore, photocatalytic activity is a commonly investigated parameter of semiconductor nanoparticles and points out their ability to enhance a photoreaction. It is especially dependent on the synergism between the catalyst bandgap and light wavelength [
5]. Regarding the photocatalytic activity of systems, degradation rates are often used as an indicator [
45]; however, a meaningful comparison is not possible using degradation rates, as the absorbed photon flux (number of the photon absorbed at a given wavelength per time per volume) for different reactors/systems may be different due to differences in the amount of scattered and reflected light [
46].
In this framework, a figure-of-merit that encompasses the above-mentioned parameters must be applied for a fair comparison. Van Gerven et al. first used the space-time yield (STY) and photocatalytic space-time yield (PSTY) as an indicator to compare the efficiency of different reactors [
41,
47]. The STY was proposed as the amount of pollutant degraded per reactor volume per day, and PSTY as the ratio of STY to the normalized light power (NLP). PSTY depicts the water volume treated per time and power consumption [
41,
47]. Thus, PSTY is a suitable model that can be applied to give a clearer view of reactor performance considering throughput, energy consumption and photocatalytic activity [
48]. To have a more accurate comparison of reactor designs, in the current study, STY and PSTY were adapted by considering reactor volume, membrane surface area and catalyst weight-dependent STYs and light power-specific PSTYs.
Although some research has focused on assessing the efficiency of different reactors towards the removal of target molecules, an approach of a fair comparison taking into account reactor design is lacking. Therefore, in the current work, three research reactor configurations were evaluated by using suitable figures-of-merit that were adjusted to take into account design and operational variables. This way, the main objectives of the present work are as follows: (1) to study the effect of different reactor designs (batch, microreactor and nanoreactor) with different flow processes (static, flow-along and flow-through) on the photocatalytic removal of methylene blue (MB); and (2) to compare the process efficiency of these reactors.
2. Results and Discussion
Before comparing the efficiency of the different photocatalytic membrane reactors, key physicochemical properties that directly influence the removal behavior need to be evaluated.
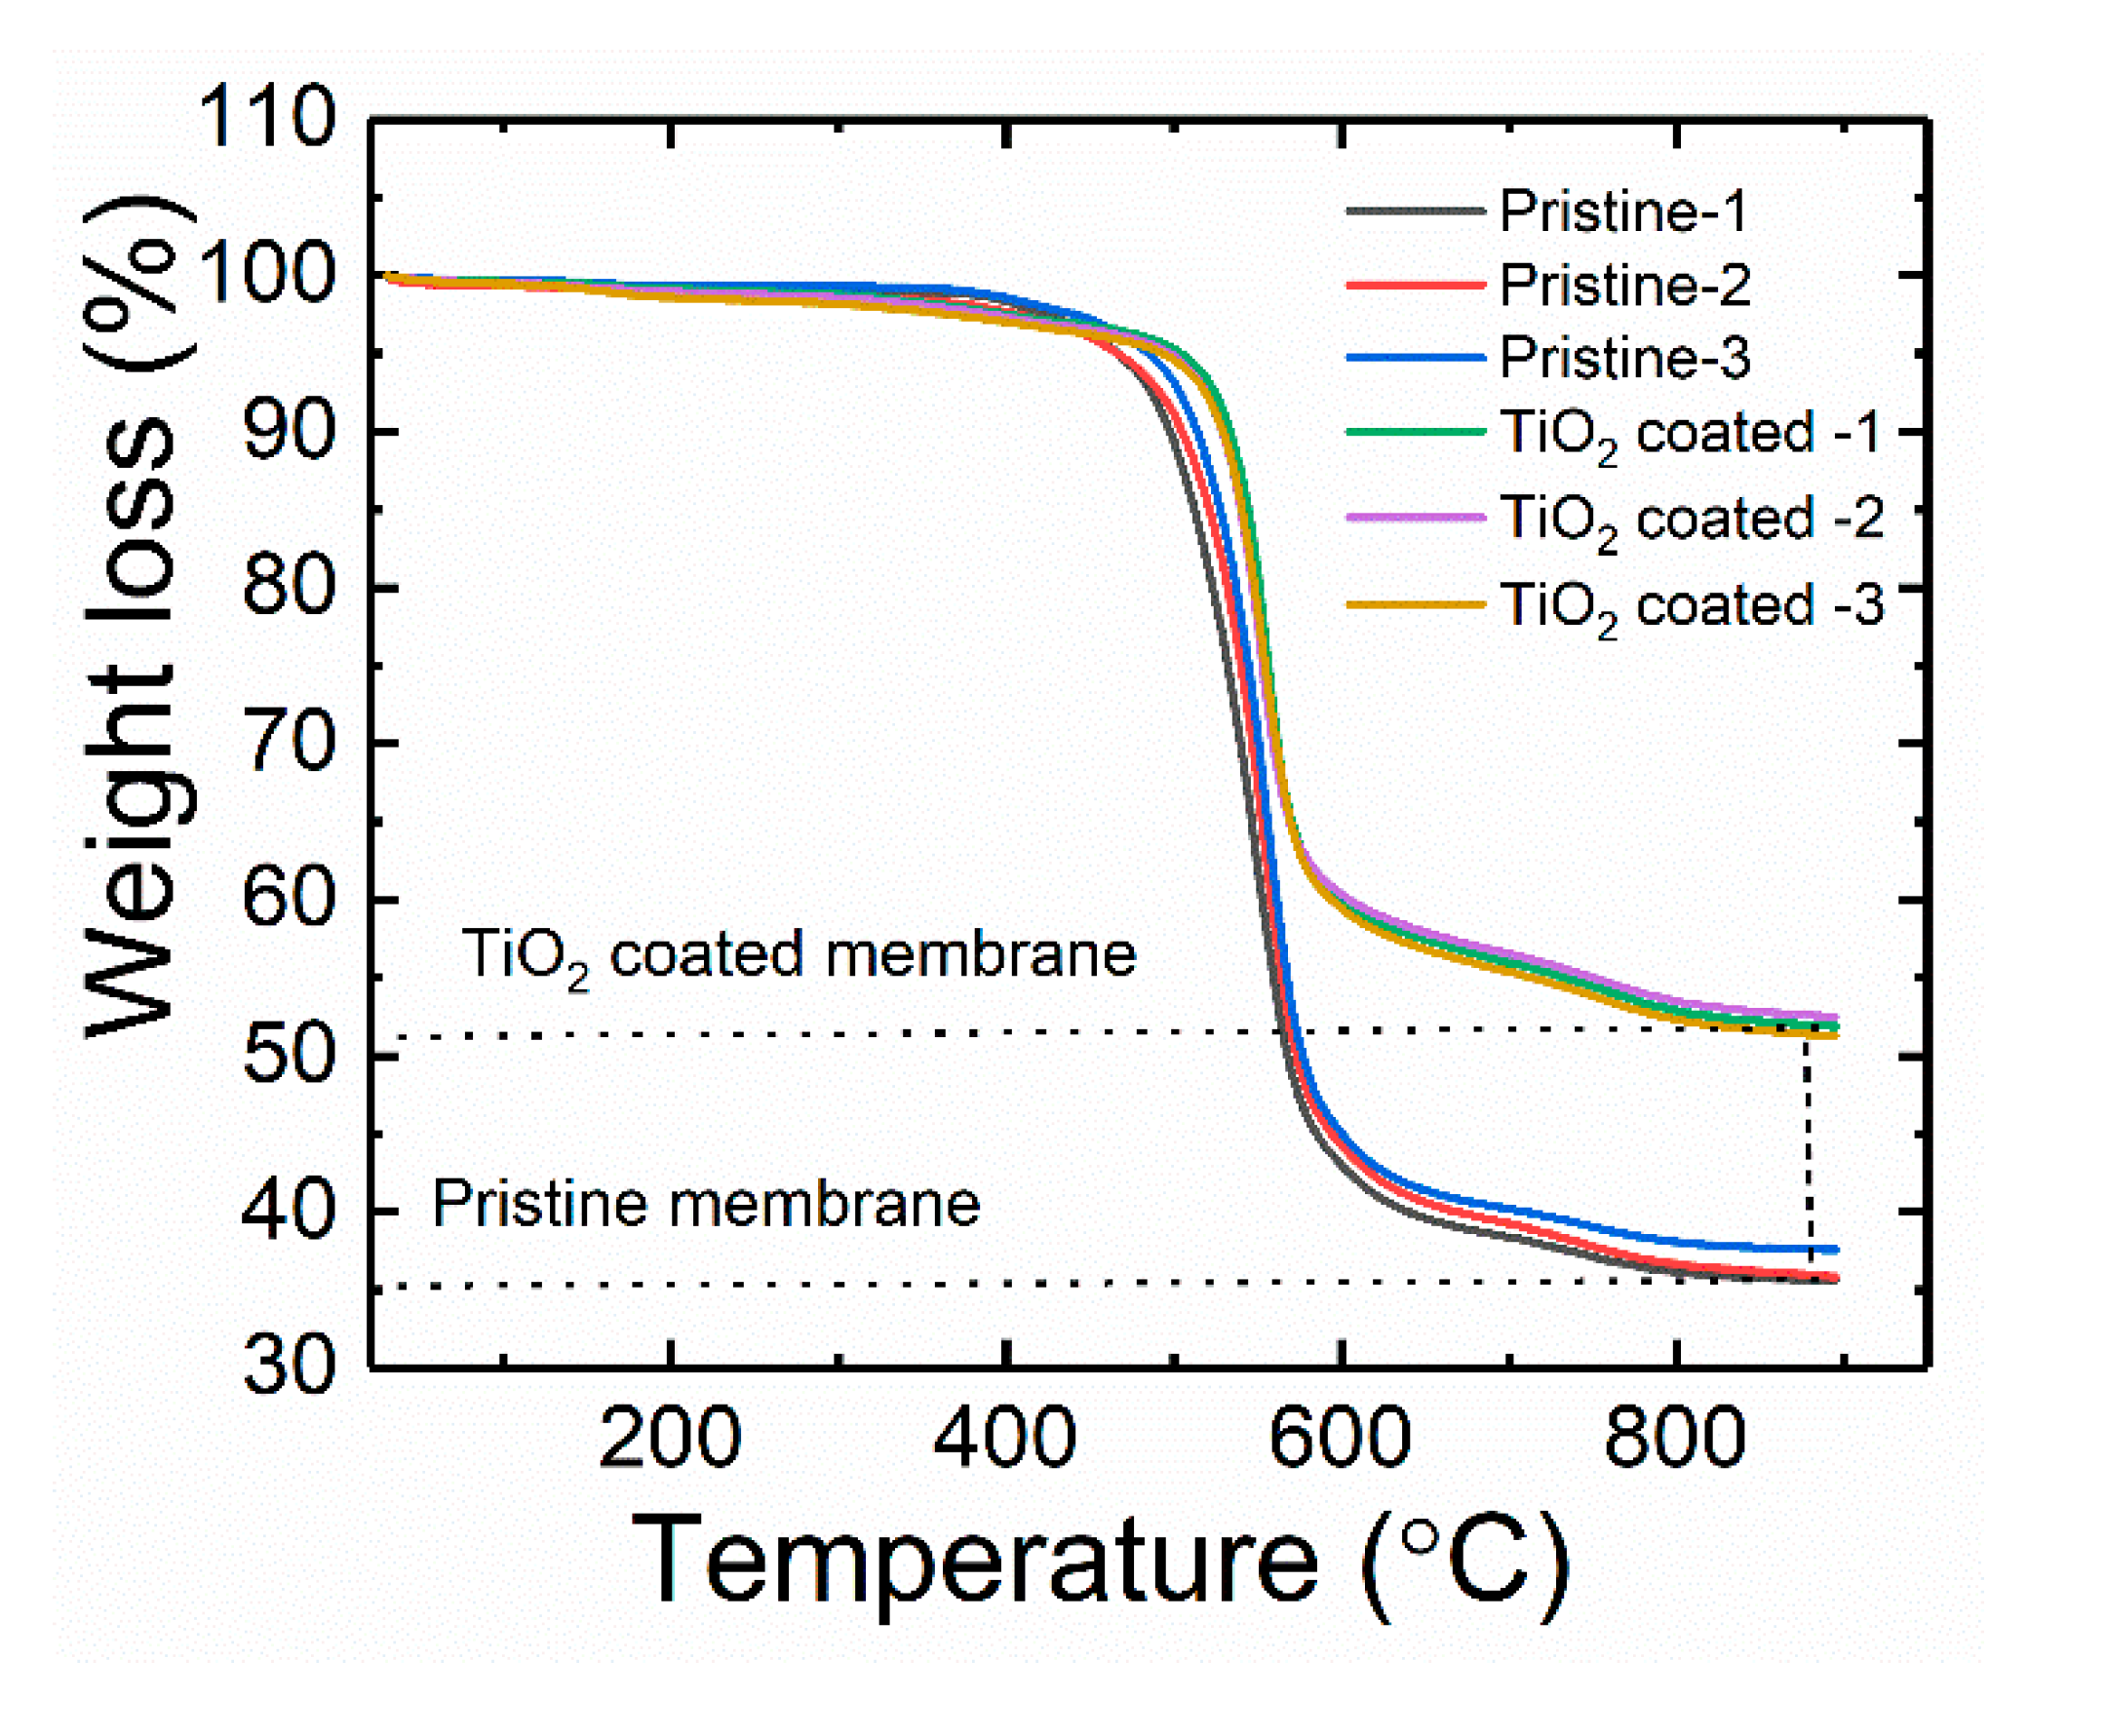
2.1. Thermogravimetric Analysis (TGA)
A microfiltration polyethersulfone (PES) membrane with a pore size of 220 nm was dip-coated with the TiO
2 dispersion prepared by the sol–gel process [
49] and was used in different reactors. The TGA measurement was performed to quantify the amount of TiO
2 nanoparticles deposited per surface area on the membrane for the best comparison of the reactor designs. Membrane samples with an equal area were selected randomly from three different locations of the membrane sheet and TGA was carried out.
The amount of TiO
2 per unit area is simply the difference between the weight of the TiO
2-coated membrane and the pristine membrane, as depicted in
Figure 2. Using the information in
Table 1, the amount of TiO
2 present was calculated and found to be 0.98 ± 0.11 mg/cm
2 (i.e., 2.80 ± 0.07 mg/cm
2 minus 1.83 ± 0.08 mg/cm
2). In this study, the amount of immobilized TiO
2 in the continuous flow processes was 1.96 mg (2 cm
2 membrane area), while it was 4.02 mg in the batch process (4.1 cm
2 membrane area). Similarly, the total number of immobilized TiO
2 nanoparticles in the membrane used in the continuous flow process and batch process was calculated to be 4.72 × 10
10 and 9.68 × 10
10, respectively (
Table S1). The higher the number of TiO
2 nanoparticles, the more reactive oxygen species are formed, and the higher the possibility of MB degradation. However, in the immobilized system, the accessibility of the light to nanoparticles, the rate of diffusion and mass transfer of the solute to the photocatalyst surface limit the removal efficiency.
2.2. TiO2 Distribution and Pore Size Evaluation
To assess the differences in the accessibility of the photocatalytic TiO2 nanoparticles at the membrane surface and the pores, scanning electron microscopy (SEM) coupled with energy-dispersive X-ray spectroscopy (EDX) measurements was performed. The thickness of the membrane measured by the thickness gauge is 170 ± 10 µm. Similarly, the effective membrane pore size provided by the supplier (Merck Millipore, USA) is 220 nm, and the measured porosity is 60%. Considering the uniform porosity, the total open volume of the membrane per cm2 was thus calculated to be 1.02 × 10⁻⁸ m3 (total membrane volume × porosity).
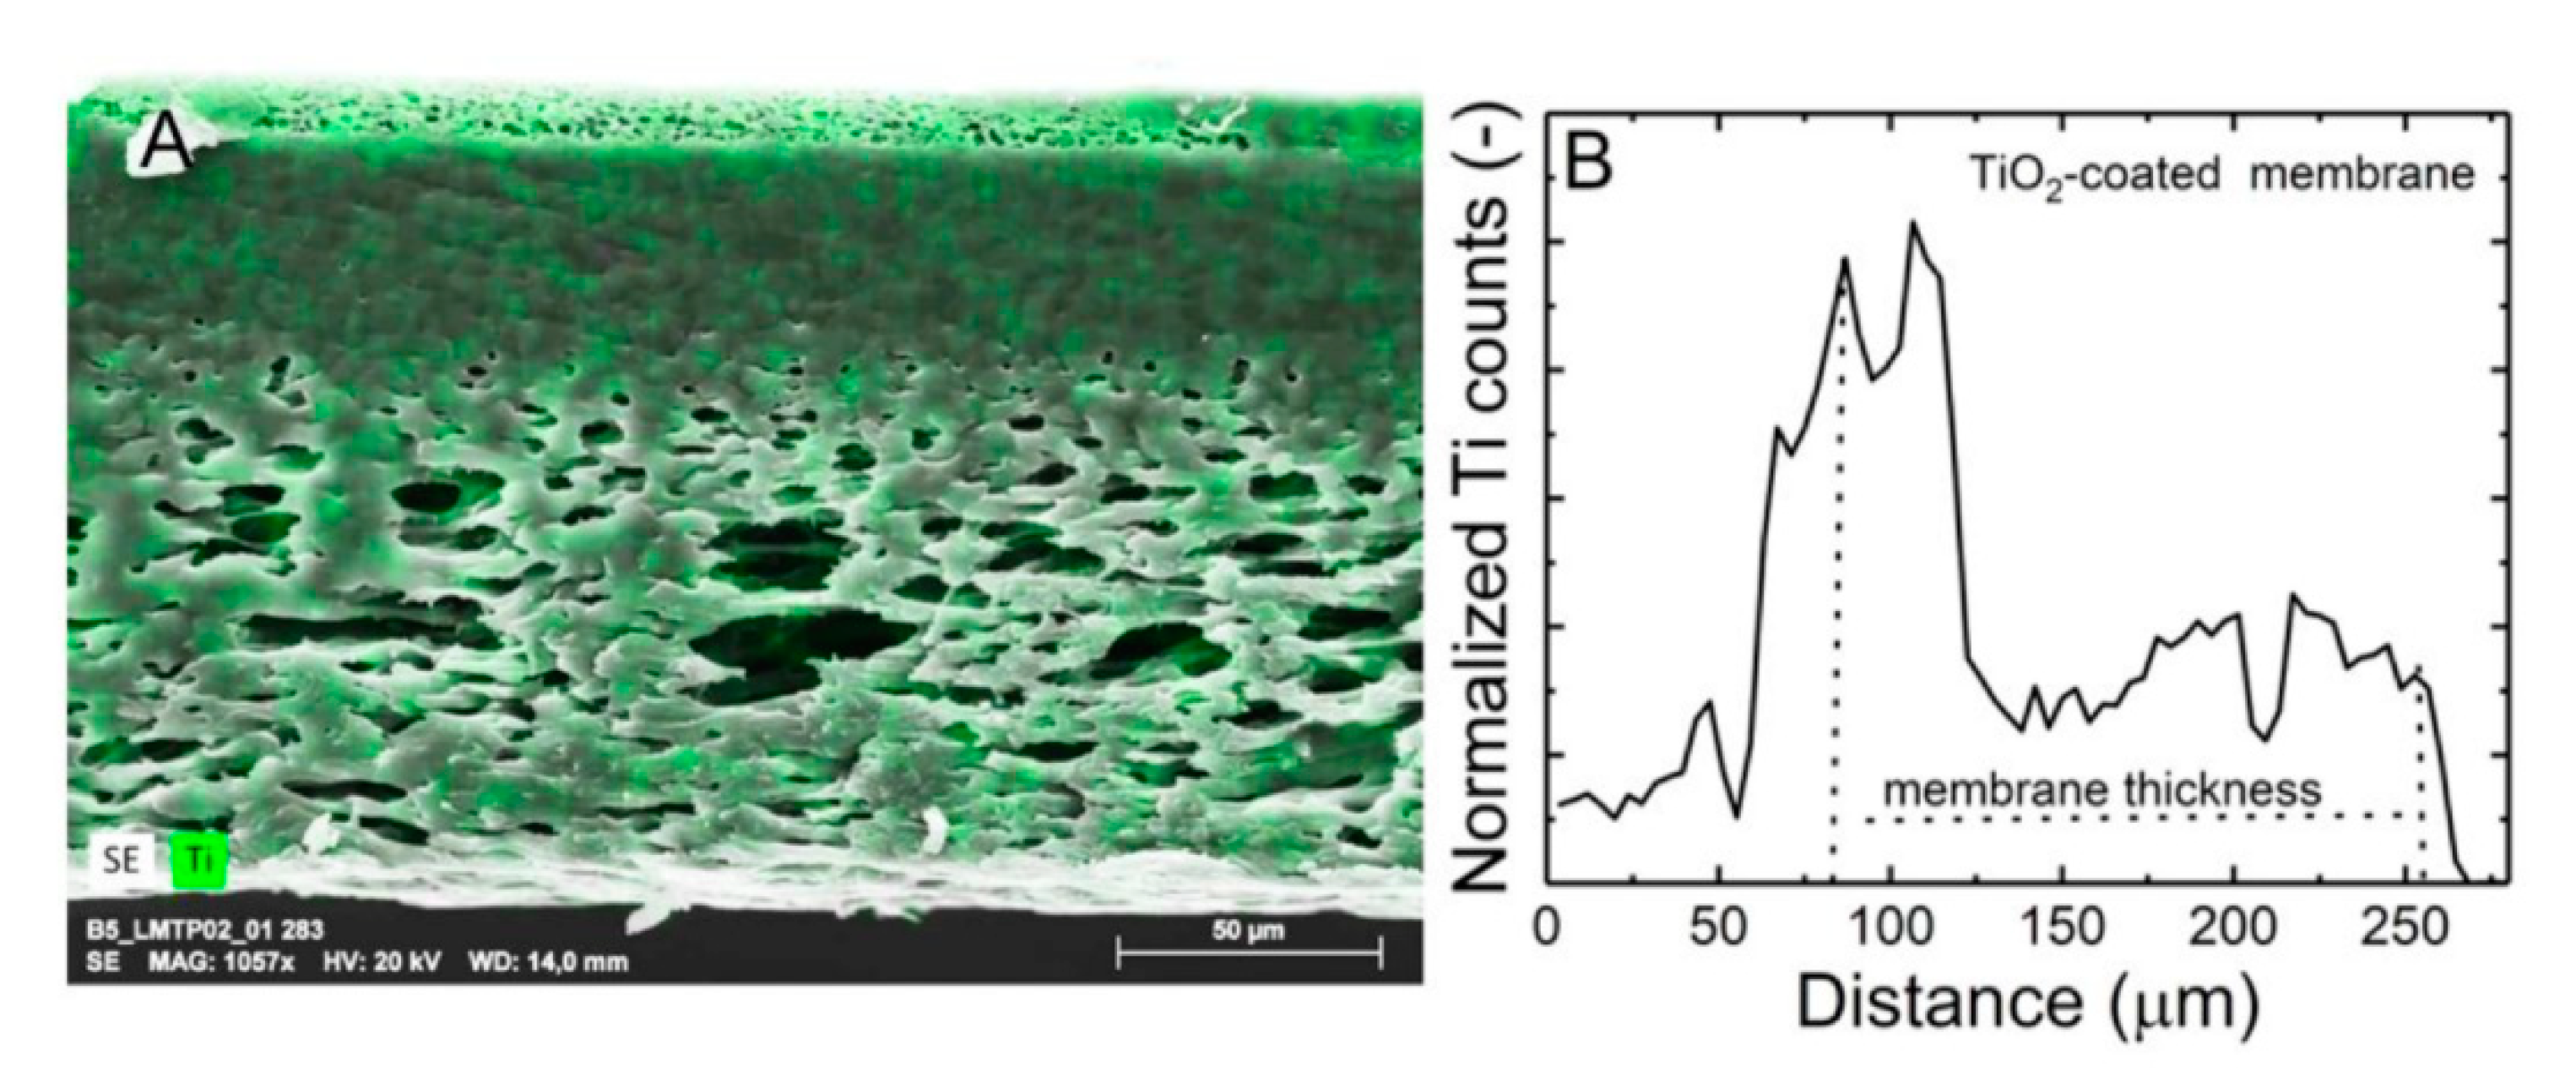
Elemental mapping (
Figure 3A) shows that TiO
2 is distributed unevenly throughout the membrane. Corresponding line scanning spectra within the membrane thickness (
Figure 3B) show that the density of the TiO
2 nanoparticles is higher at the top surface as compared with the middle and the bottom portion of the membrane. This could be due to the asymmetric nature of the membrane. In the batch and flow-along reactors, only the TiO
2 nanoparticles at the top section of the membrane are involved in the photocatalytic reaction. In these processes, it is expected that due to the slow exchange of the solution inside the pores, the contribution of photocatalytic activity is negligible. On the other hand, in the flow-through reactor, solute molecules have access to a higher amount of active TiO
2 nanoparticles which are deposited through the depth of the membrane by a forced flow through the pores, and this accessibility could result in higher removal efficiency.
The crystallinity of the synthesized TiO
2 dispersion was further confirmed by the appearance of the sharp peaks in the X-ray diffraction spectra (
Figure S1). Mixed phases of TiO
2 (anatase, rutile and brookite) were formed. Similarly, to show the dispersion of the TiO
2 nanoparticles on the membrane, SEM images were taken (
Figure S2), which show that TiO
2 nanoparticles are incorporated throughout the membrane.
2.3. Evaluation of Light Absorption Capacity of the Membrane
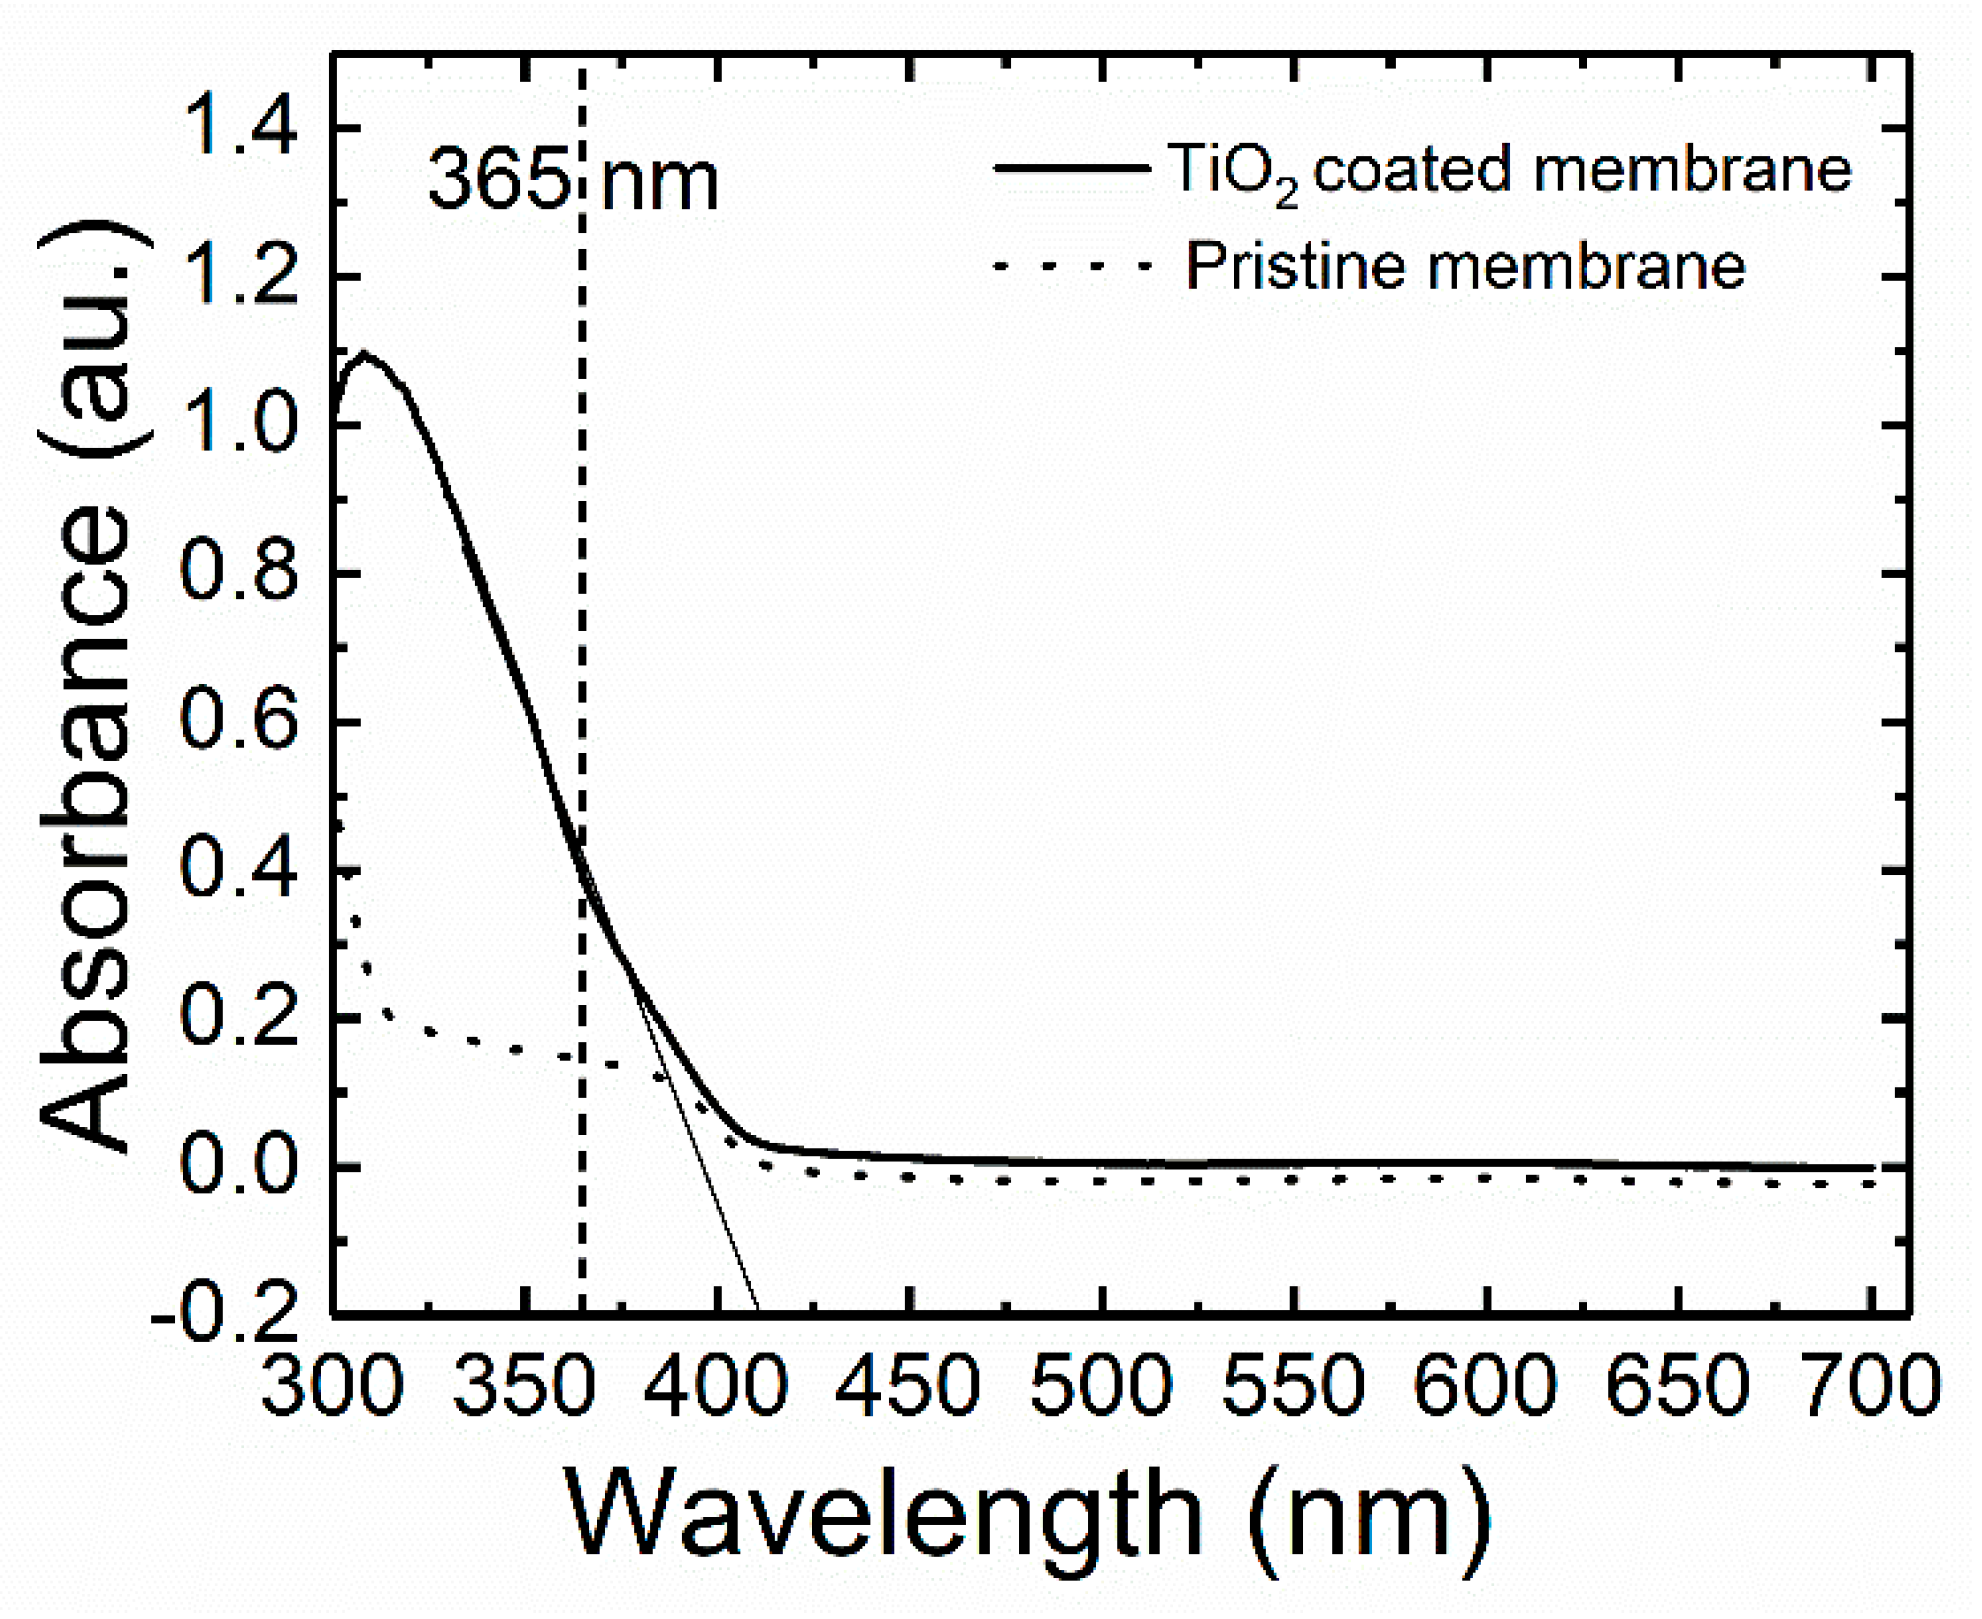
The optical absorption measurement of the pristine and coated membrane in water was performed at a wavelength of 365 nm to assess the relationship between the absorbance and TiO
2 coating. The threshold value of the wavelength corresponds to the bandgap energy of the photocatalyst [
50]. The bandgap energy of the TiO
2 nanoparticles was thus calculated from the absorption spectra (
Figure 4) by using the relation of the energy of photons and its corresponding wavelength in Equation (7). The extrapolated absorbance corresponds to the wavelength of 410 nm and the bandgap energy calculated is 3.02 eV. A similar band gap value (3.02 eV) was obtained from the diffuse reflectance spectra (DRS) measurement (
Section 3,
Figure S3). Hence, the 365 nm wavelength of UV light is sufficient for the excitation of TiO
2 nanoparticles to generate reactive species during the photocatalytic operation.
The absorbance of the pristine membrane (before TiO
2 coating) measured at the wavelength of 365 nm is less than 0.2, which indicates a low light absorption by the pristine membrane. The absorbance of the TiO
2-coated membrane is 0.4 which corresponds to 60% of light absorption according to Equations (5) and (6) in the calculation section. Apart from the light absorbed by the coated TiO
2 on the surface of the membrane, the absorption could also be attributed to the multiple light scattering effects of the incoming light penetrating the pores within the membrane [
51]. This scattered light will enhance more TiO
2 activation inside the pores. The solute molecules in the flow-through reactor can also come in contact with this activated TiO
2, leading to a higher removal rate.
2.4. Determination of Residence Time
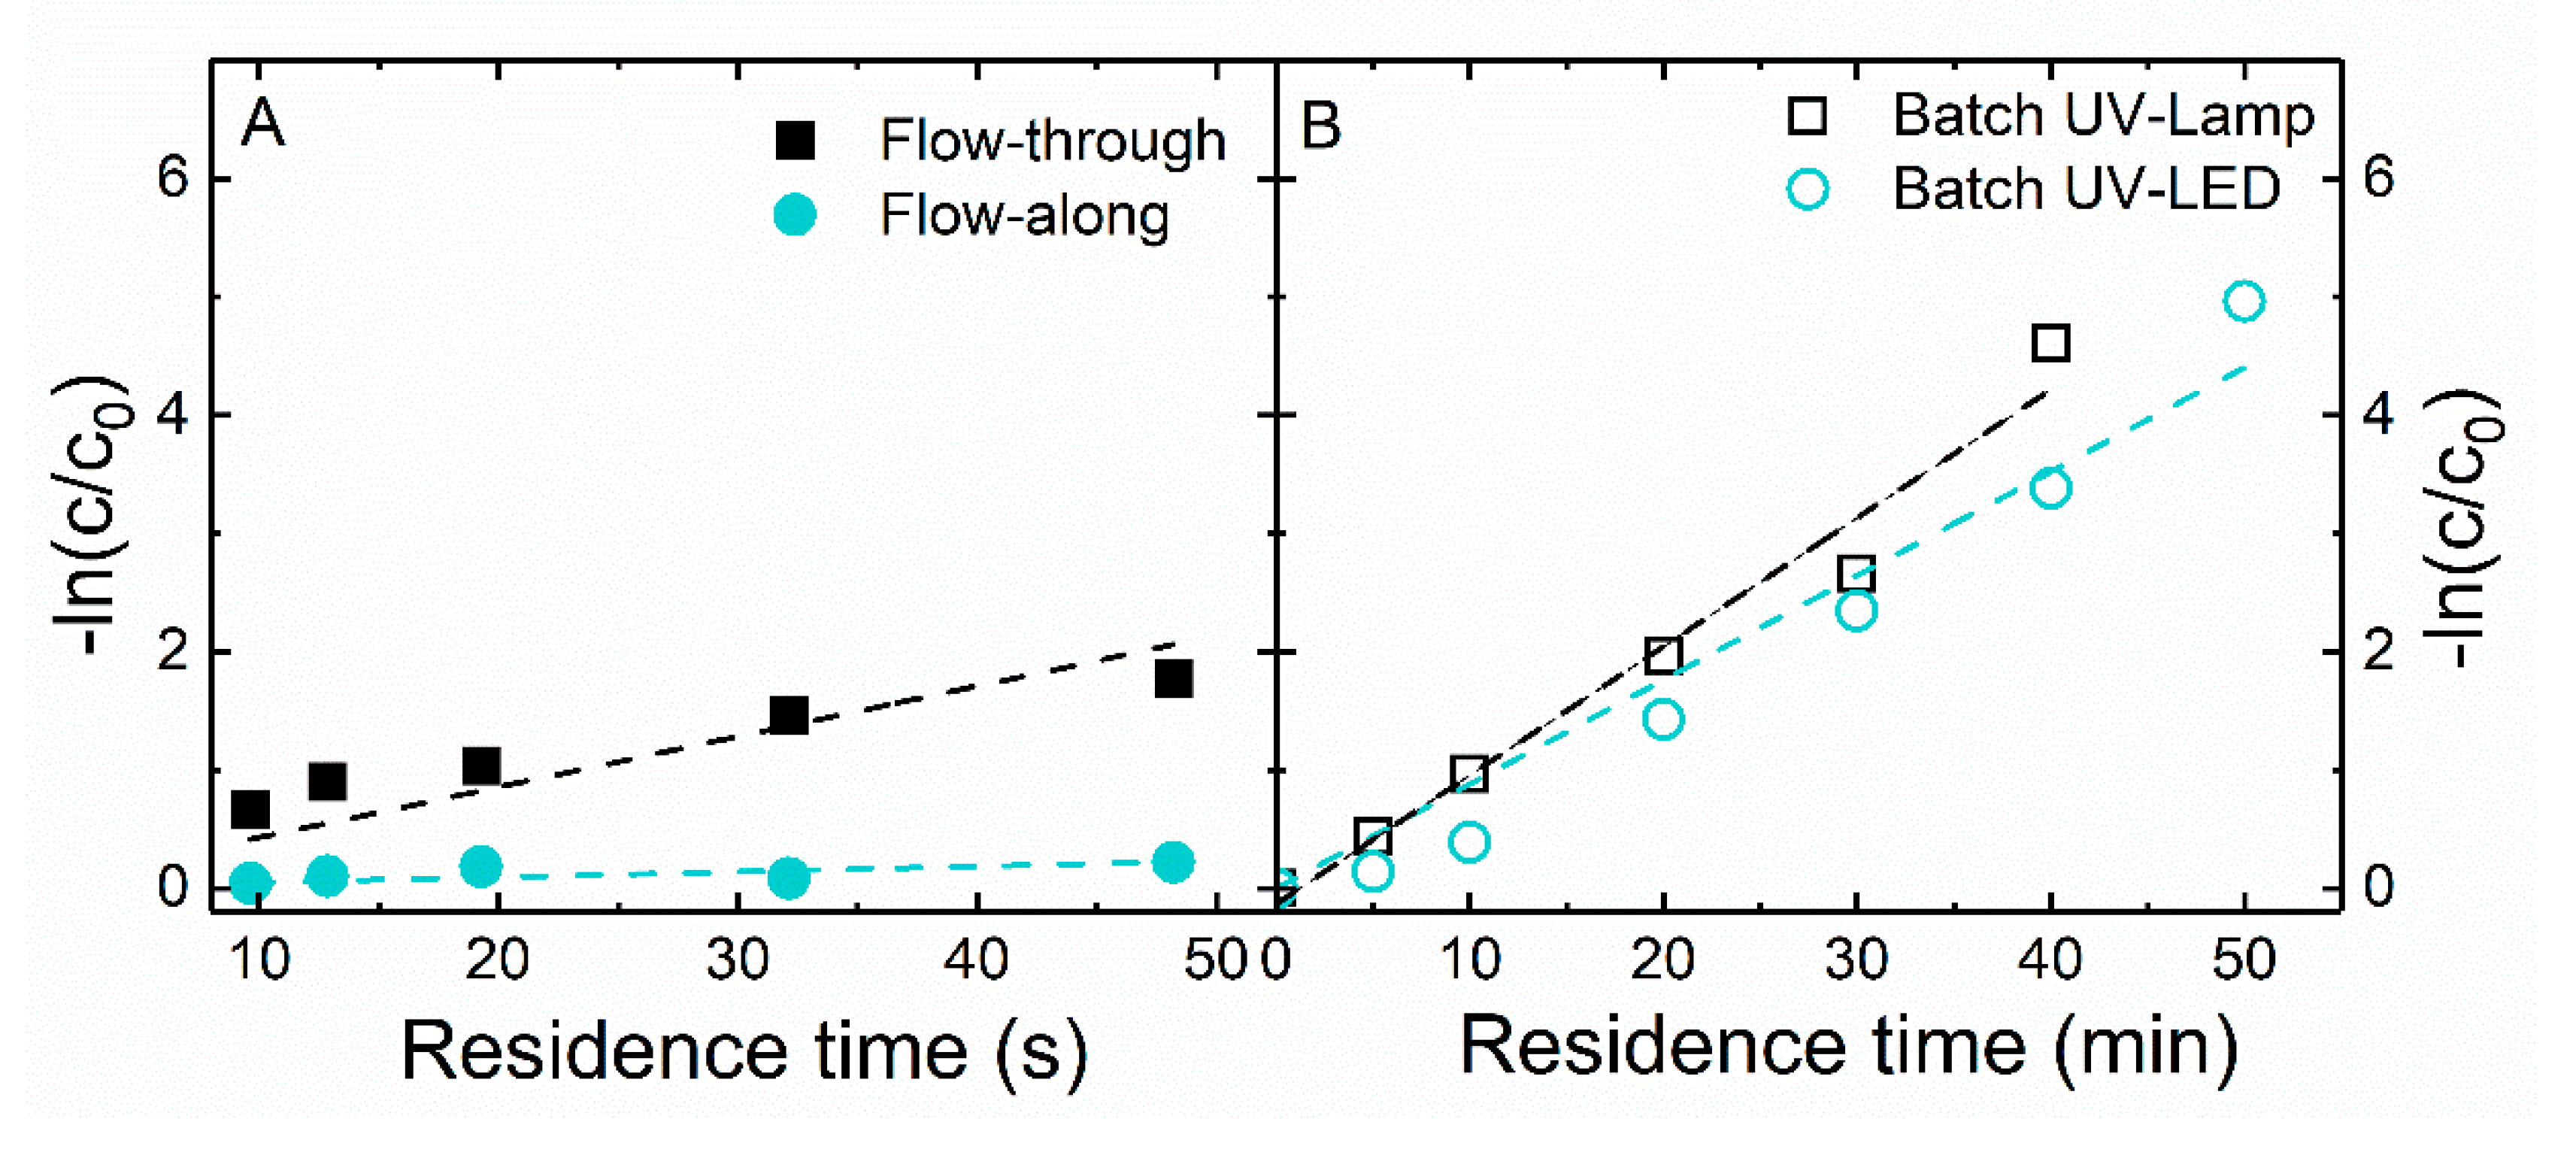
The residence time of the organic molecule in the reactor plays an important role when comparing the photocatalytic efficiency. Usually, longer residence means more time for reaction which results in a higher removal rate and thus a lower pollutant concentration. In the batch reactor, the residence time is the total reaction time of the solute (MB) molecules, which is the time when the light is switched on until the light is switched off. In this work, the residence time in the batch reactor is 2400 s for the experiment conducted using a UV lamp and 3000 s for the one with a UV LED. For a continuous flow process, the residence time is the time spent by the given solute in the active reactor zone. Therefore, the following adapted relation [
52] was used to calculate the residence time.
where
is the mean residence time (s);
V is the volume of the reaction zone (cm
3) (it is the sum of channel volume and membrane volume (determined as the product of membrane area, thickness and porosity);
flow rate (cm
3/s);
Amembrane is the filtration area (cm
2);
is the membrane thickness (cm) and
is the porosity of the membrane (%). The detailed values for the residence time calculation can be found in
Table 2.
Within the comparison, the flow rate as well as the cell and membrane dimensions are constant. A comparison of residence times between the operating conditions thus only considers the reaction volume. The three different residence times defined with the flow rate of 1 mL/min are namely: (1) channel (
, corresponds to the flow-along reactor; (2) membrane pores (
; and (3) total (
, corresponds to the flow-through reactor. In the latter case, the solute experiences both the channel and the membrane residence time, so it is thus the sum of the residence time in the channel and membrane pores. The calculations of the three residence times applied in this work are described by the following equations:
The reaction in the flow-along reactor happens mostly on the surface of the membrane. In this flow mode, no convective flow inside the membrane pores takes place (i.e., no filtration), and a residence time inside the membrane () is not defined. The residence time in the channel describes the time available for the reaction and was calculated to be 8.4 s, while only inside the membrane pores, it was calculated to be 1.2 s. In the flow-through reactor, the reaction occurs on the membrane surface as well as inside the pores. Hence, the total residence time, which is the sum of the residence time in the channel and inside the pores, describes the time available for the reaction. The residence time of the solute (MB) was hence about 9.6 s.
2.5. Velocity Profile of Solution in Different Reactors
The next parameter that should be considered is the velocity profile of a solution in different reactors. The three reactors differ significantly in their hydrodynamic characteristics, as described in the Introduction and Materials and Methods section, which strongly affects the photocatalytic reaction efficiency.
The solution motion in the batch reactor produced by simple shaking has no defined direction (
Figure 5A), hence mass transport in the y-direction is limited to diffusion. A boundary layer is formed close to the membrane surface. This boundary condition results in no velocity at the surface [
53]. Thus, although the residence time is higher, the large boundary condition will keep the solute (MB) from reaching the active site. In the batch process, mass transfer mainly occurs through the solute diffusion process which is slower than the convective process [
54], thus the mass transfer can be limited due to: (1) the absence of a flow that reduces the boundary layers at the membrane surface [
55,
56], and (2) its low surface-to-volume ratio [
57,
58]. However, the boundary layer thickness at the membrane surface can be reduced by increasing the stirring/shaking speed [
55]. Similarly, in the flow-along process, with laminar flow (Reynolds number 4,
Section 5 SI), the feed solution containing MB flows in the parallel layers and the flow direction is solely in the x-direction. Hence, all mass transport in the y-direction is limited to axial dispersion and diffusion across the parallel layers. The velocity profile in the fully developed region is parabolic (
Figure 5B). The velocity at the wall is much lower than the velocity in the center of the channel [
38], which can increase the contact time of molecules and catalysts. However, considering the limited residence time in this process, solute (MB) molecules in the solution flowing along the membrane surface with an axial velocity profile may not have sufficient time to diffuse across the liquid layer. The external diffusion is thus limited, and as a result, only the molecules close to the catalyst nanoparticles (top surface of membrane) can be degraded [
31,
32]. In the flow-through reactor, the velocity has x-direction followed by y-direction (
Figure 5C). The mass transport of the solute (MB) is dominated by orders of magnitude faster forced convection, whereby diffusion is negligible [
59]. This convective flow eliminates the concentration gradient in the boundary layer at the membrane surface and inside the membrane by bringing reactants from the bulk solution into a reactive membrane surface, thus overcoming mass transfer limitations [
60]. Similarly, due to the forced flow of the solution through the pores, a fast contact time between the photocatalytic particles and solute is achieved. This promotes an enhanced mass transfer of pollutants to the catalytic sites as well as the detachment of the degraded product away from the catalytic sites [
17], hence enhancing the removal efficiency.
2.6. Evaluation of Photocatalytic MB Removal
To account for any possible phenomena (photolysis and/or adsorption) that could simultaneously induce a decrease in the initial concentration of the MB molecules, different experiments in the dark and in light with/without the membrane matrix were performed before starting the photocatalytic removal experiment. This was necessary for the actual photocatalytic degradation efficiency analysis. In the batch process, the non-catalytic photolysis experiment (without a membrane) with 1 mg/L MB was determined as shown in
Figure S4A. No decrease in the MB concentration was observed during the test period, instead, a slight increase in concentration was noticed. This could be due to the evaporation of water. A (12 ± 2%) decrease in MB concentration was observed when the photolysis experiment with 13 mg/L MB was performed. This decrease in MB concentration due to photolysis was subtracted during the removal percentage calculation. The MB concentration profile during an experiment in a flow-through reactor is shown in
Figure S4B. During the experiment in the dark using a coated membrane (1 mg/L MB), the membrane attained the adsorption equilibrium after 100 mL of MB solution flowing through it. After reaching the equilibrium, no decrease in MB concentration was observed throughout the remaining experimental volume of 250 mL. The mass of MB absorbed in the membrane was quantified using a mass balance equation (
Section 7 SI). The amount of MB adsorbed per unit membrane surface area was calculated to be 0.005 mg/cm
2, which was typically less than 3% of the total mass. Similarly, the pristine membrane showed no degradation even in the presence of light. In experiments with a TiO
2-coated membrane, the MB concentration decreased and reached a steady-state of almost 50% removal after a certain time of irradiation. After reaching the steady-state in the light phase, the degradation profile leveled out throughout the remaining experimental volume (250 mL) as shown in
Figure S4B. Thus, from these experiments, it can be concluded that light is necessary to generate reactive species and the removal of MB is solely reached by reactive species generated by immobilized TiO
2 nanoparticles on/into the membrane.
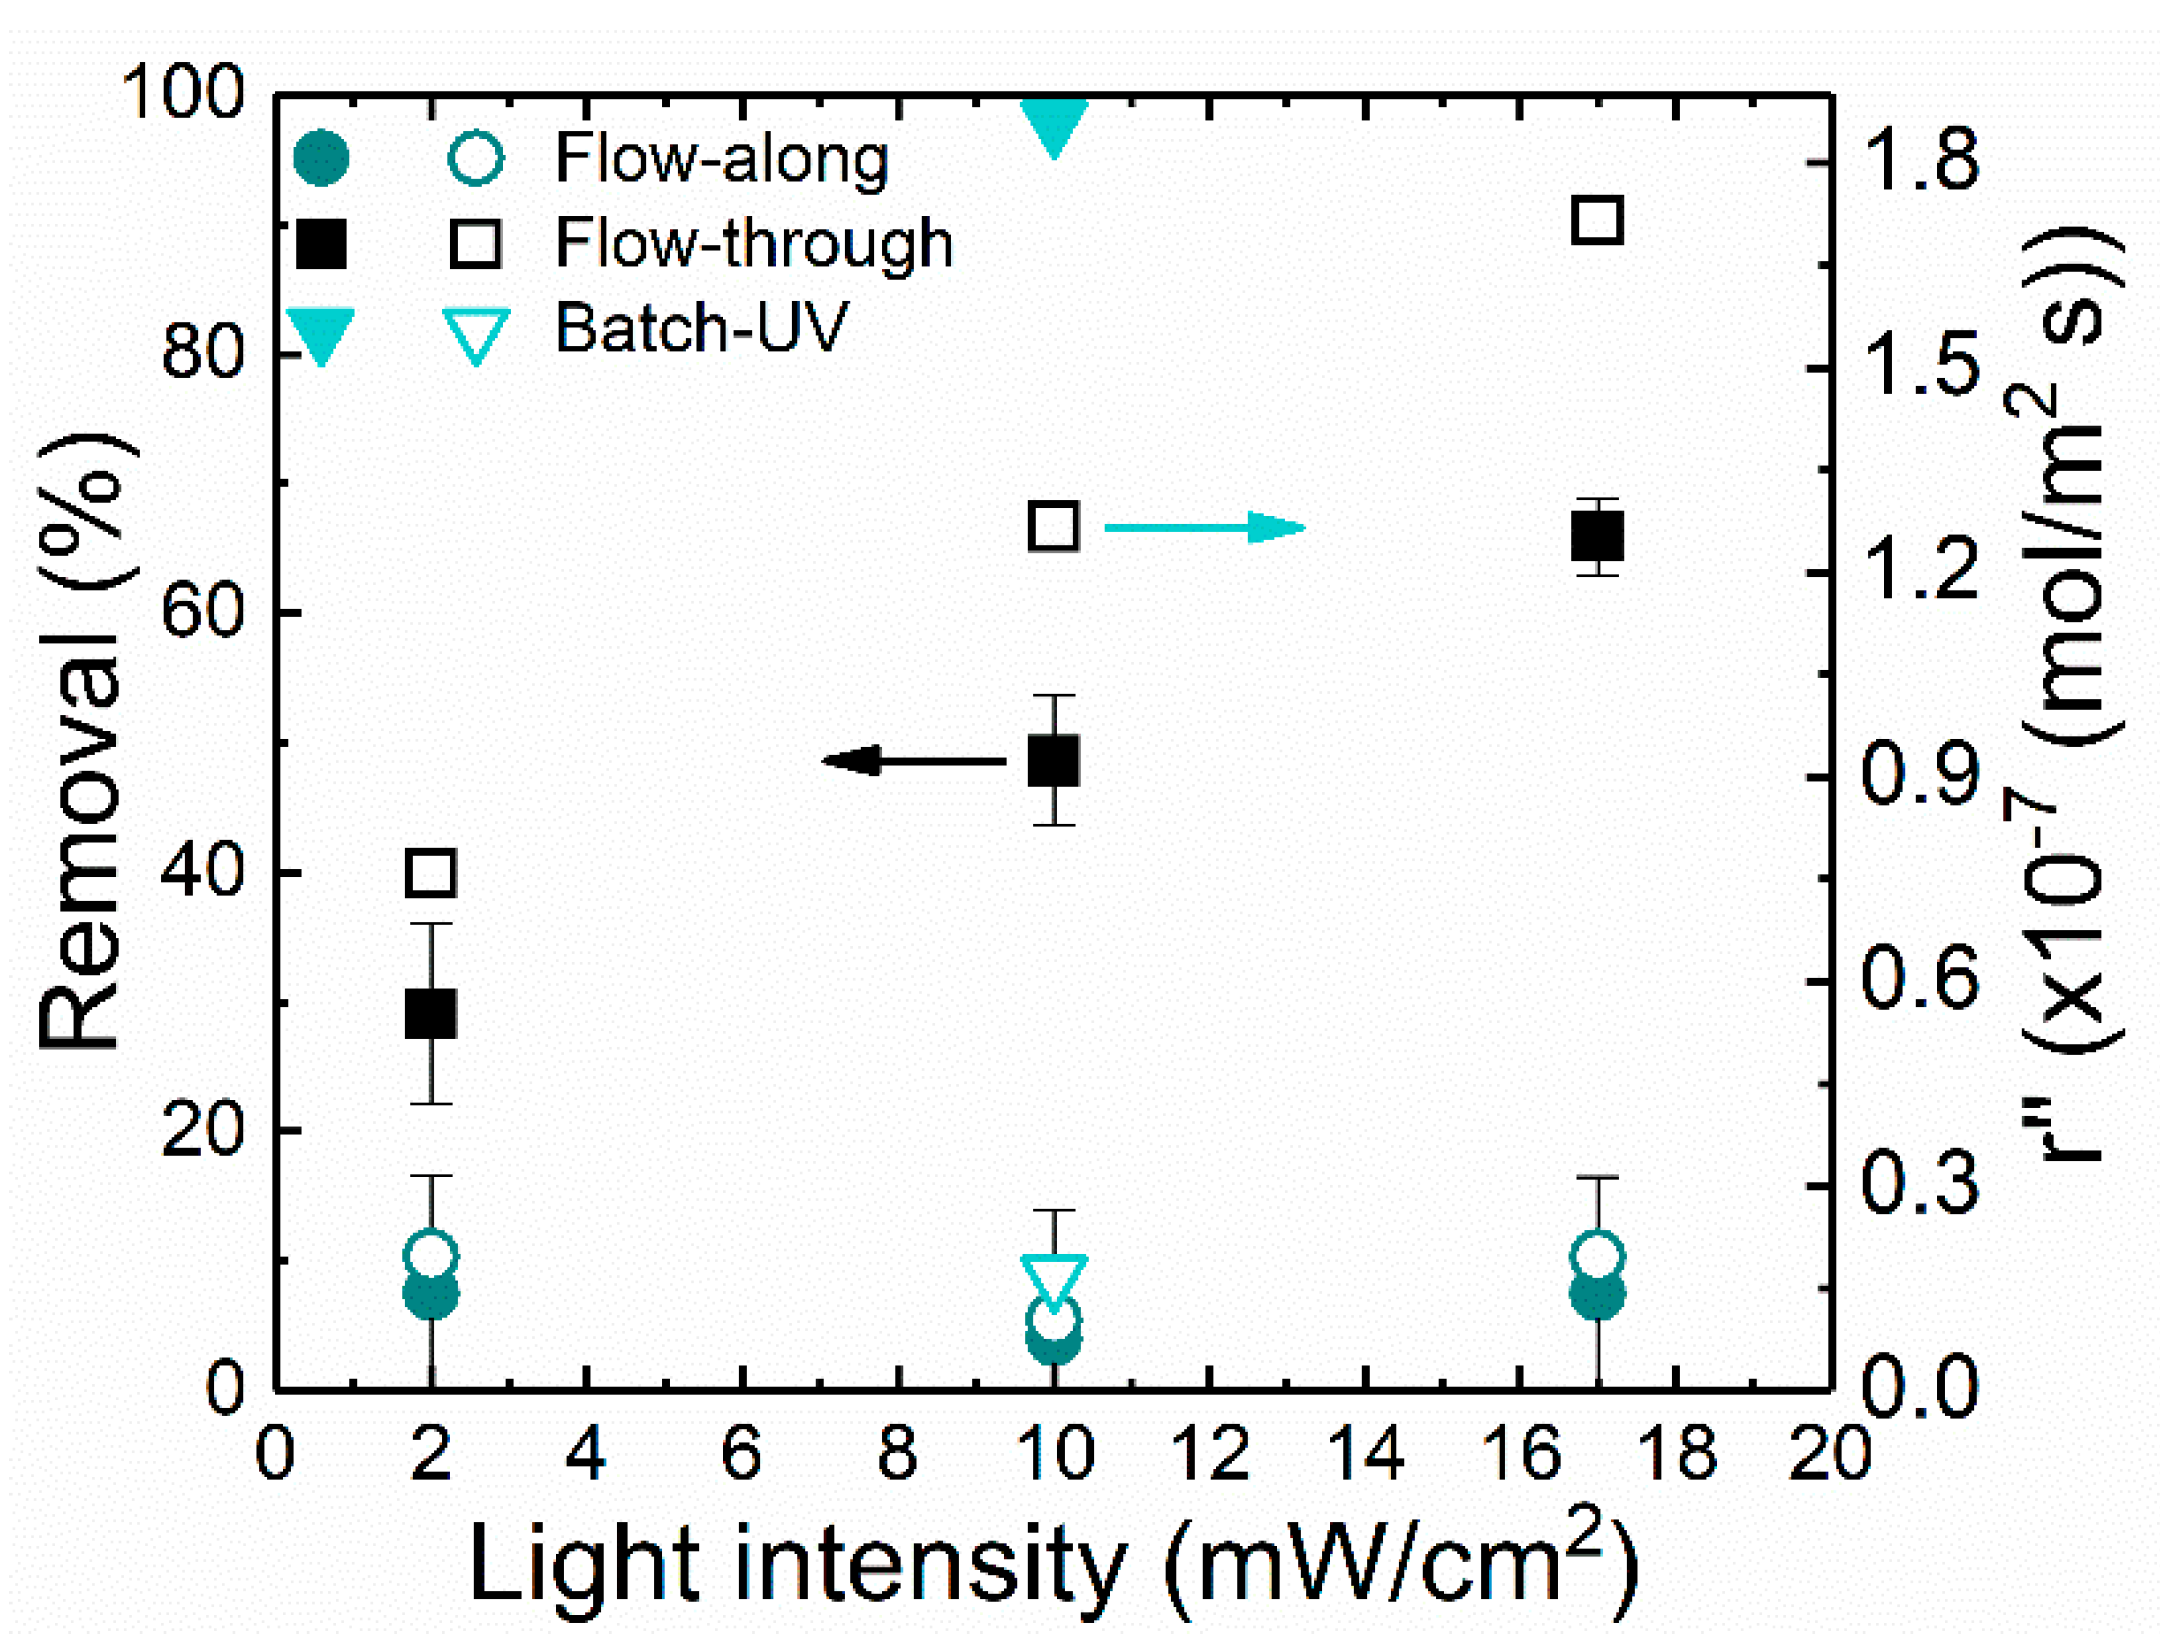
After the photolysis/dark adsorption experiment, the photocatalytic removal efficiency of the different reactors was evaluated considering the light intensity and flow rate as the major influencing factors. For this, in every experiment, the same the membrane material was used. Thus, the light absorption capacity is similar. However, by varying the light intensity applied in different processes, the number of absorbed photons influencing the solute (MB) degradation might be affected, as shown in
Figure 6.
The batch reactor achieved higher degradation efficiency (>98%) for 1 mg/L MB operated at 11.3 ± 1.3 mW/cm
2. This was attributed to higher residence time (2400 s) and the larger surface area (4.1 cm
2) with a larger number of TiO
2 nanoparticles available. However, the total volume of the solution used was low (4 mL), and the rate of disappearance (r″) was calculated to be lower than the flow-through reactor. MB removal in the flow-through reactor increased from 28 to 60% with an increase in light intensity from 2 to 17 mW/cm
2. This can be related to the higher light intensity that ensures the supply of more photon energy on each active site of the photocatalytic nanoparticles generating more active radicals [
61]. It can be expected that at higher light intensities, the light irradiates deeper into the membrane and thus more TiO
2 nanoparticles incorporated inside the membrane pores would be active. Although a homogeneous light intensity across the surface of the reactor was assumed [
23], in the flow-along reactor, the increment in MB degradation was from 4 to 10% only. This can be explained by the mass transfer limitation in this configuration as explained in
Section 2.5. Although presenting a higher throughput compared with batch, relatively low degradation was achieved since the active surface area was lower (2 cm
2). As the flow was laminar, a larger area was required to attain a high degradation efficiency [
62]. In the flow-through reactor, the light intensity seems to be limiting and removal efficiency can still be enhanced; on the other hand, the light intensity was not limiting in the flow-along reactor. At 10 mW/cm
2, a 12-fold increase in the reaction rate was attained in the flow-through reactor when compared with the flow-along reactor. Likewise, the rate of disappearance of MB also increased with an increase in the light intensity. The concentration profile of the MB removal at different light intensities in the different flow processes is displayed in
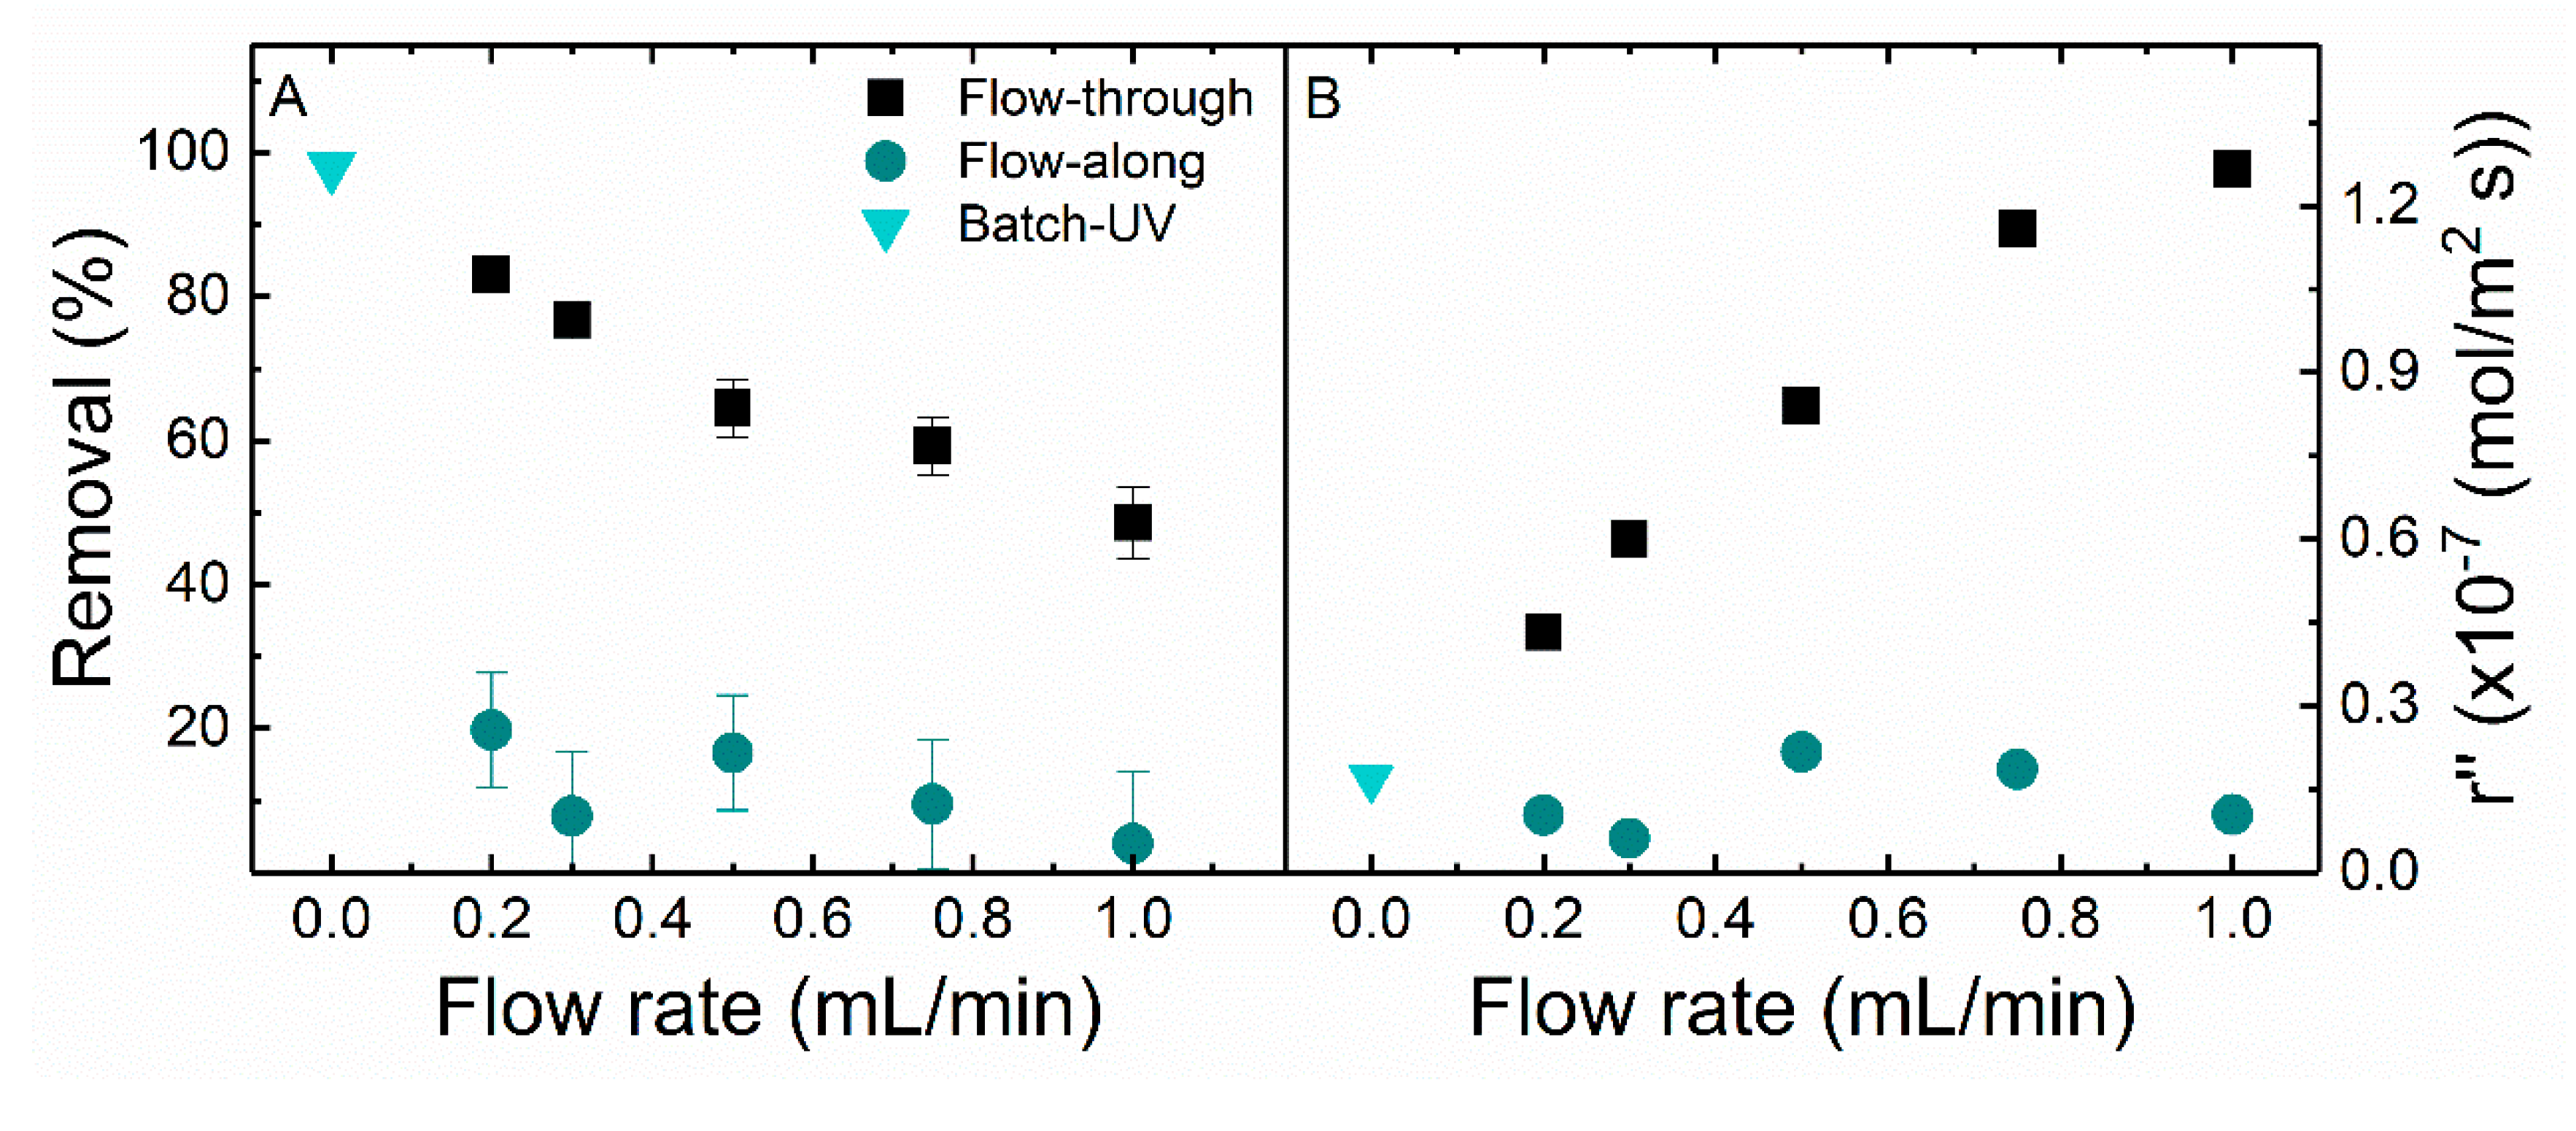
Figure S6. Similarly, the photocatalytic removal efficiency of MB was strongly affected by the contact time of the reactant with the photocatalytic nanoparticles. The flow rate not only affects the contact time of MB molecules with the photocatalytic membrane surface but also the mass transport through the membrane which ultimately determines the removal efficiency.
Figure 7 shows the MB removal and removal rate for different flow processes. In the batch reactor, the whole volume of MB solution is kept in the wells of the plate, thus there is no flow. In this case, a high degradation efficiency (>98%) was achieved. MB removal decreased from 20 to 4% in the flow-along reactor and from 83 to 50% in the flow-through reactor with an increasing flow rate. The removal efficiency of the flow-through reactor is 12-fold higher than the flow-along reactor at 1 mL/min with 10 mW/cm
2 light intensity. The concentration profile of the MB removal at a different flow rate in the different flow processes is displayed in
Figure S7. The rate of disappearance of MB increases with an increase in flow rate in the flow-through reactor, but the changes are not remarkable in the flow-along reactor. An increase in the rate of reaction with an increase in flow rate is due to more solute (MB) molecules coming in contact with the active catalytic surface per unit time. With an increase in flow rate, the residence time decreases, and the molecules will pass unaffected, resulting in a decrease in removal efficiency.
At the operated conditions (MB concentration = 1 mg/L, flow rate = 1mL/min, light intensity = 10 mW/cm
2), MB removal in the flow-along reactor was 4%, whereas in flow-through, it was 50%, which is 12-fold higher, so the membrane pores contribute to the majority (46 of 50%) of the removal. The high photocatalytic removal efficiency in the flow-through reactor as compared with the flow-along reactor was attributed to the effective convective mass transfer in the membrane pores with a negligible diffusion limitation. The radial diffusion time of the MB and hydroxyl radicals (assuming that a hydroxyl radical is produced during the photocatalytic advance oxidation process) from the pore volume to the surface of the pores is calculated (
Section 10 SI). The calculated diffusion times for MB and hydroxyl radicals are 1.58 × 10
−5 s and 0.45 × 10
−5 s, respectively. As this diffusion time is shorter than the residence time (1.2 s), the diffusion limitation is negligible in such a narrow confined space. In the batch and the flow-along reactors, the contribution of the pores is negligible. The MB solution in the flow-along reactor passes the membrane surface, thus the contact time and probability to reach inside the membrane pores are even more reduced; hence, less removal was achieved. In the batch reactor, the solution is not forced to penetrate into the pores, while the reaction is limited by the slow diffusion step.
The decrease in the absorption intensity of MB does not always mean complete mineralization. Destruction of the chromophore group, rearrangement of the conjugate bonds or the breakdown of the MB molecules to CO
2 and H
2O, either by a catalytic or non-catalytic reaction, could result in a decrease in the absorption intensity [
63]. In the first two cases, the total organic carbon (TOC) content could remain stable, whereas in the latter case, the TOC value decreases. The UV–vis spectrophotometer analysis thus represents the pseudo-catalytic efficiency [
64]. TOC measurement is an important tool to evaluate not only the photocatalytic efficiency towards MB degradation but also the mineralization efficiency of by-products to CO
2 and H
2O. While this TOC analysis was performed in this work (data not shown), the results were inconclusive due to an increase in TOC in the system which may have various reasons from contamination in the system through to degradation of the polymeric membrane. The intention of this work is to identify a suitable method for a qualitative and quantitative comparison of different photocatalytic reactors using only MB removal as a parameter to assess the reactors’ performance. In consequence it should be noted that the term removal does not indicate complete mineralization. Instead, this term summarizes the removal of MB by the photobleaching [
65], sensitization [
66] and/or photodegradation effects [
65] as a whole.
2.7. Figures-of-Merit for Reactors’ Performance Comparison
To compare the performance of different photocatalytic membrane reactors, several figures-of-merit, namely adapted STY and PSTY (as explained in the literature and Calculations section), SEC and degradation rate constants, were used and summarized in
Table 3.
SEC proved to be an interesting parameter to compare reactors, taking into account both water productivity and light power consumption. In fact, due to the mentioned unique characteristics of the flow-through reactor coupled with a more efficient illumination system (i.e., LED light source), less energy is required to treat a specific volume of water. Additionally, the batch system using UV lamps as the energy source presented the higher SEC, up to two orders of magnitude higher than the systems using LEDs. This is attributed to the fact that LEDs are more efficient in the conversion of electric power to light, whereas conventional lamps are highly energy-consuming [
67]. Additionally, the use of LEDs enhances the photon transfer to the reaction medium, also minimizing the light energy requirement. However, it is worth mentioning that the use of the SEC does not give clear information about the reactor efficiency on solute removal, and the size of the reactors affects the results.
Similarly, although degradation rate constants quantify the rate (in time) of the photocatalytic reaction precisely, these are limited by not considering the energy requirement. In consequence, reaction rates may not be the most meaningful method to evaluate reactor performance. In summary, the degradation rate constant is higher for a faster reaction. Within the evaluated systems, the flow-through reactor presented the higher degradation rate constant, while the flow-along system attained the lowest value. However, important parameters influencing this constant are neglected (e.g., light energy, catalyst amount). Therefore, misleading conclusions might be drawn if only this figure-of-merit was used to evaluate the reactors’ performance. Indeed, as described, when applying SEC as an indicator, the worst reactor performance (higher SEC) is attributed to the batch system with UV lamps, whereas when using the degradation rate constant, it is attributed to the flow-along system.
On the other hand, the adapted figures-of-merit introduced in this current work, STY and PSTY, showed to be a great approach to compare reactors. STY essentially reflects the effect of reaction mass and photon transfer rates on reactor productivity. The flow-through system presented the highest STY values due to two main factors: high reaction rate constant and plug flow behavior. The photocatalytic reaction is improved by the increased “surface-to-volume” ratio inherent of this reactor, thus increasing the STY value. Nevertheless, PSTY is simply the ratio of STY to either the standardized electricity consumption of the lamp/LED (PSTY
1) or the power intensity received by the reactor (PSTY
2). Thus, PSTY considers light utilization efficiency [
48]. Besides, PSTY has the advantage of encompassing the main contributing factors for reactor performance: photocatalytic activity, energy efficiency and throughput. Similar productivity considering the power intensity received (i.e., similar PSTY
2) was observed when evaluating the illumination system in experiments conducted with the batch reactor. PSTY
2 was found to be 1.2 × 10
10 and 1.0 × 10
10 mol/(W s) for the systems using five UV lamps and six LEDs, respectively. However, the batch system composed of six LEDs showed a higher performance than the one with five UV lamps when considering the power energy consumption (16.4-fold higher PSTY
1 value) due to the previously explained advantages inherent in LED illumination.
Regarding the results obtained with the systems under LED irradiation, it is worth pointing out that batch and flow-along processes presented similar performance (i.e., similar PSTY values). This confirms that mass transfer limitations occurred in both systems. Indeed, although the flow-along system is a microreactor, its geometry allows that only the molecules nearby to the top surface of the photocatalytic membrane undergo degradation as well as in the batch system, which may explain their similar performance. Comparing the three configurations, the flow-through process proved to be the most efficient one on MB removal as PSTY1/PSTY2 values were about 10 times higher than both the batch and flow-along process. The greater reactor performance of the flow-through system was attributed to an enhancement in mass transfer obtained by the forced convective flow inside the membrane pores, promoting supplementary contact between the solute and catalyst active sites. The additional reaction within the membrane pores contributed to a further increase in MB removal of 12 × 1010 mol/(Ws).
3. Materials and Methods
3.1. Chemicals and Solution Chemistry
MB (Sigma-Aldrich, Schnelldorf, Germany, dye content 99.0%) was used as a model molecule in the flow-along and flow-through reactors’ comparison. A stock solution of 1 g/L was prepared in MilliQ water (MilliQ A+ system, Millipore, Darmstadt, Germany). For each experiment in the continuous flow process, the fresh feed solution (1 mg/L) was prepared in a background solution (1 mM NaHCO3 and 10 mM NaCl). The background solution was prepared from stock solutions of 100 mM NaHCO3 (Bernd Kraft, Duisburg, Germany, 99.7% purity) and 1000 mM NaCl (VWR Chemicals, Darmstadt, Germany, 99.9% purity). For the batch rector, MB (Acros Organics, Fischer Scientific, Waltham, MA, USA, 96+% purity) stock solution of 1 g/L was prepared in MilliQ water (MilliQ integral system, EMD Millipore, Burlington, MA, USA). The required concentration (1 mg/L) was then prepared by diluting it in MilliQ water. No background electrolyte was used in the batch process.
3.2. Membrane Preparation and Characterization
Microfiltration PES membrane with a pore size of 220 nm (Express
®PLUS membrane GPWP02500, Merck Millipore, Burlington, MA, USA) was used for TiO
2 coating. The mixture of Milli-Q water, hydrochloric acid (0.1 M), and 4 mL titanium tetraisopropoxide in a closed beaker was heated in an oven for 20 h at 210 °C. The TiO
2 dispersion was then cooled for 2 h. The membrane was dip-coated for 5 min into a solution of TiO
2 nanoparticles prepared by sol–gel synthesis and washed with water (3 × 30 min) subsequently. These operational parameters were selected based on the previous optimized conditions to attain a membrane with high performance. The detailed procedure for TiO
2 coating can be found elsewhere [
49]. The UV light absorption property of the TiO
2-coated membranes was measured by placing the membrane in a water-filled fused silica fluorescence cuvette with a 10 mm light path (Starna Scientific, Spectrosil quartz, Wallsend, UK), mounted in the center of an integrating sphere connected to a UV–Vis-NIR spectrophotometer (PerkinElmer Lambda 950, Waltham, MA, USA). The absorption measurement was performed inside the integrating sphere in water to approach the real operating conditions in our photocatalytic system where light propagates as such: air (n
0 = 1) → quartz (n
1 = 1.4–1.55) → water (n
2 = 1.333) → membrane (n
3 =1.55 for PES) [
68], where the refractive index differs with the medium. The measurement in air would have a different light propagation behaviour that is not relevant for this work: air (n
0 = 1) → (n
2= 1.333), and the difference in refractive indexes (n
3 − n
0) is 0.55.
Field emission gun environmental scanning electron microscope (FEG-ESEM, FEI Philips XL 30, Chatsworth, CA, USA), and energy dispersive X-ray fluorescence spectroscopic (EDX, Vega 3, Tescan, Brno, the Czech Republic with XFlash 610 detector, Bruker, Billerica, MA, USA) measurements were carried out in order to understand membrane morphology and elemental distribution. To avoid charging, all samples were coated with a thin layer of conductive gold/palladium film. Specimens were imaged under high vacuum conditions (10−5 Pa) using acceleration voltages between 5 and 20 kV. The cross-section of the membrane for ESEM evaluation was prepared using a cryostat (Leica-CM-1860UV, Wetzlar, Germany) mounted with a microtome for sectioning. Before sectioning, the membrane sample was frozen into a tissue freezing medium (Leica, Ref-4020108926, lot-03814835) at −30 °C. The sample was then cut with a low-profile microtome blade (Leica DB80LX, Wetzlar, Germany). The porosity was measured using a mercury porosimeter with the high pressure set at the pressure of 30000 psi (2068.43 bar) (PoreMaster 30, Quantachrome Instruments, Odelzhausen, Germany). For this measurement, a membrane disc with a diameter of 47 mm was used. The amount of TiO2 deposited in the membrane was determined by the TGA (TG 209 F1 Libra, Netsch, Selb, Germany). TGA measurements were carried out under nitrogen atmosphere, and the samples were heated from 30 to 900 °C at a constant heating rate of 10 °C/min. For TGA analysis, a membrane from three different positions was selected randomly from the membrane sheet with the equal area (2.66 cm2).
3.3. Reactor Design and Protocol
The experimental procedure for photocatalytic degradation in the batch process was explained in detail elsewhere [
69,
70]. For general understanding, a schematic of the process is displayed in
Figure 1A. In this work, the batch reactor consists of a six-well plate where 4 mL MB solution (1 mg/L) to be treated is kept in the well along with the photocatalytic membrane (diameter of 2.5 cm and a hole of 1 cm at the center of each membrane) at the bottom. The solute has access to both sides of the membrane while light shines through the bulk volume (from top) and the reaction occurs at the surface exposed to light. The mixture was shaken continuously using a shaker (200 rpm) throughout the experiment in the dark as well as during irradiation. To measure the photocatalytic activity, the samples were subsequently irradiated with a sunlamp (Heraus Original Hanau Suncare tanning tube 21/25 slim, 280–400 nm, 11.3 ± 1.3 mW/cm
2) or a UV-LED (6 UV-LED arranged in a circle, 365 nm, 10 mW/cm
2, LZ1-00U600, LedEngin Inc., Parkway San Jose, CA, USA) for different time scales. All measurements were carried out with a Tecan Infinite M200 multimode microplate reader at a wavelength of
λ = 660 nm.
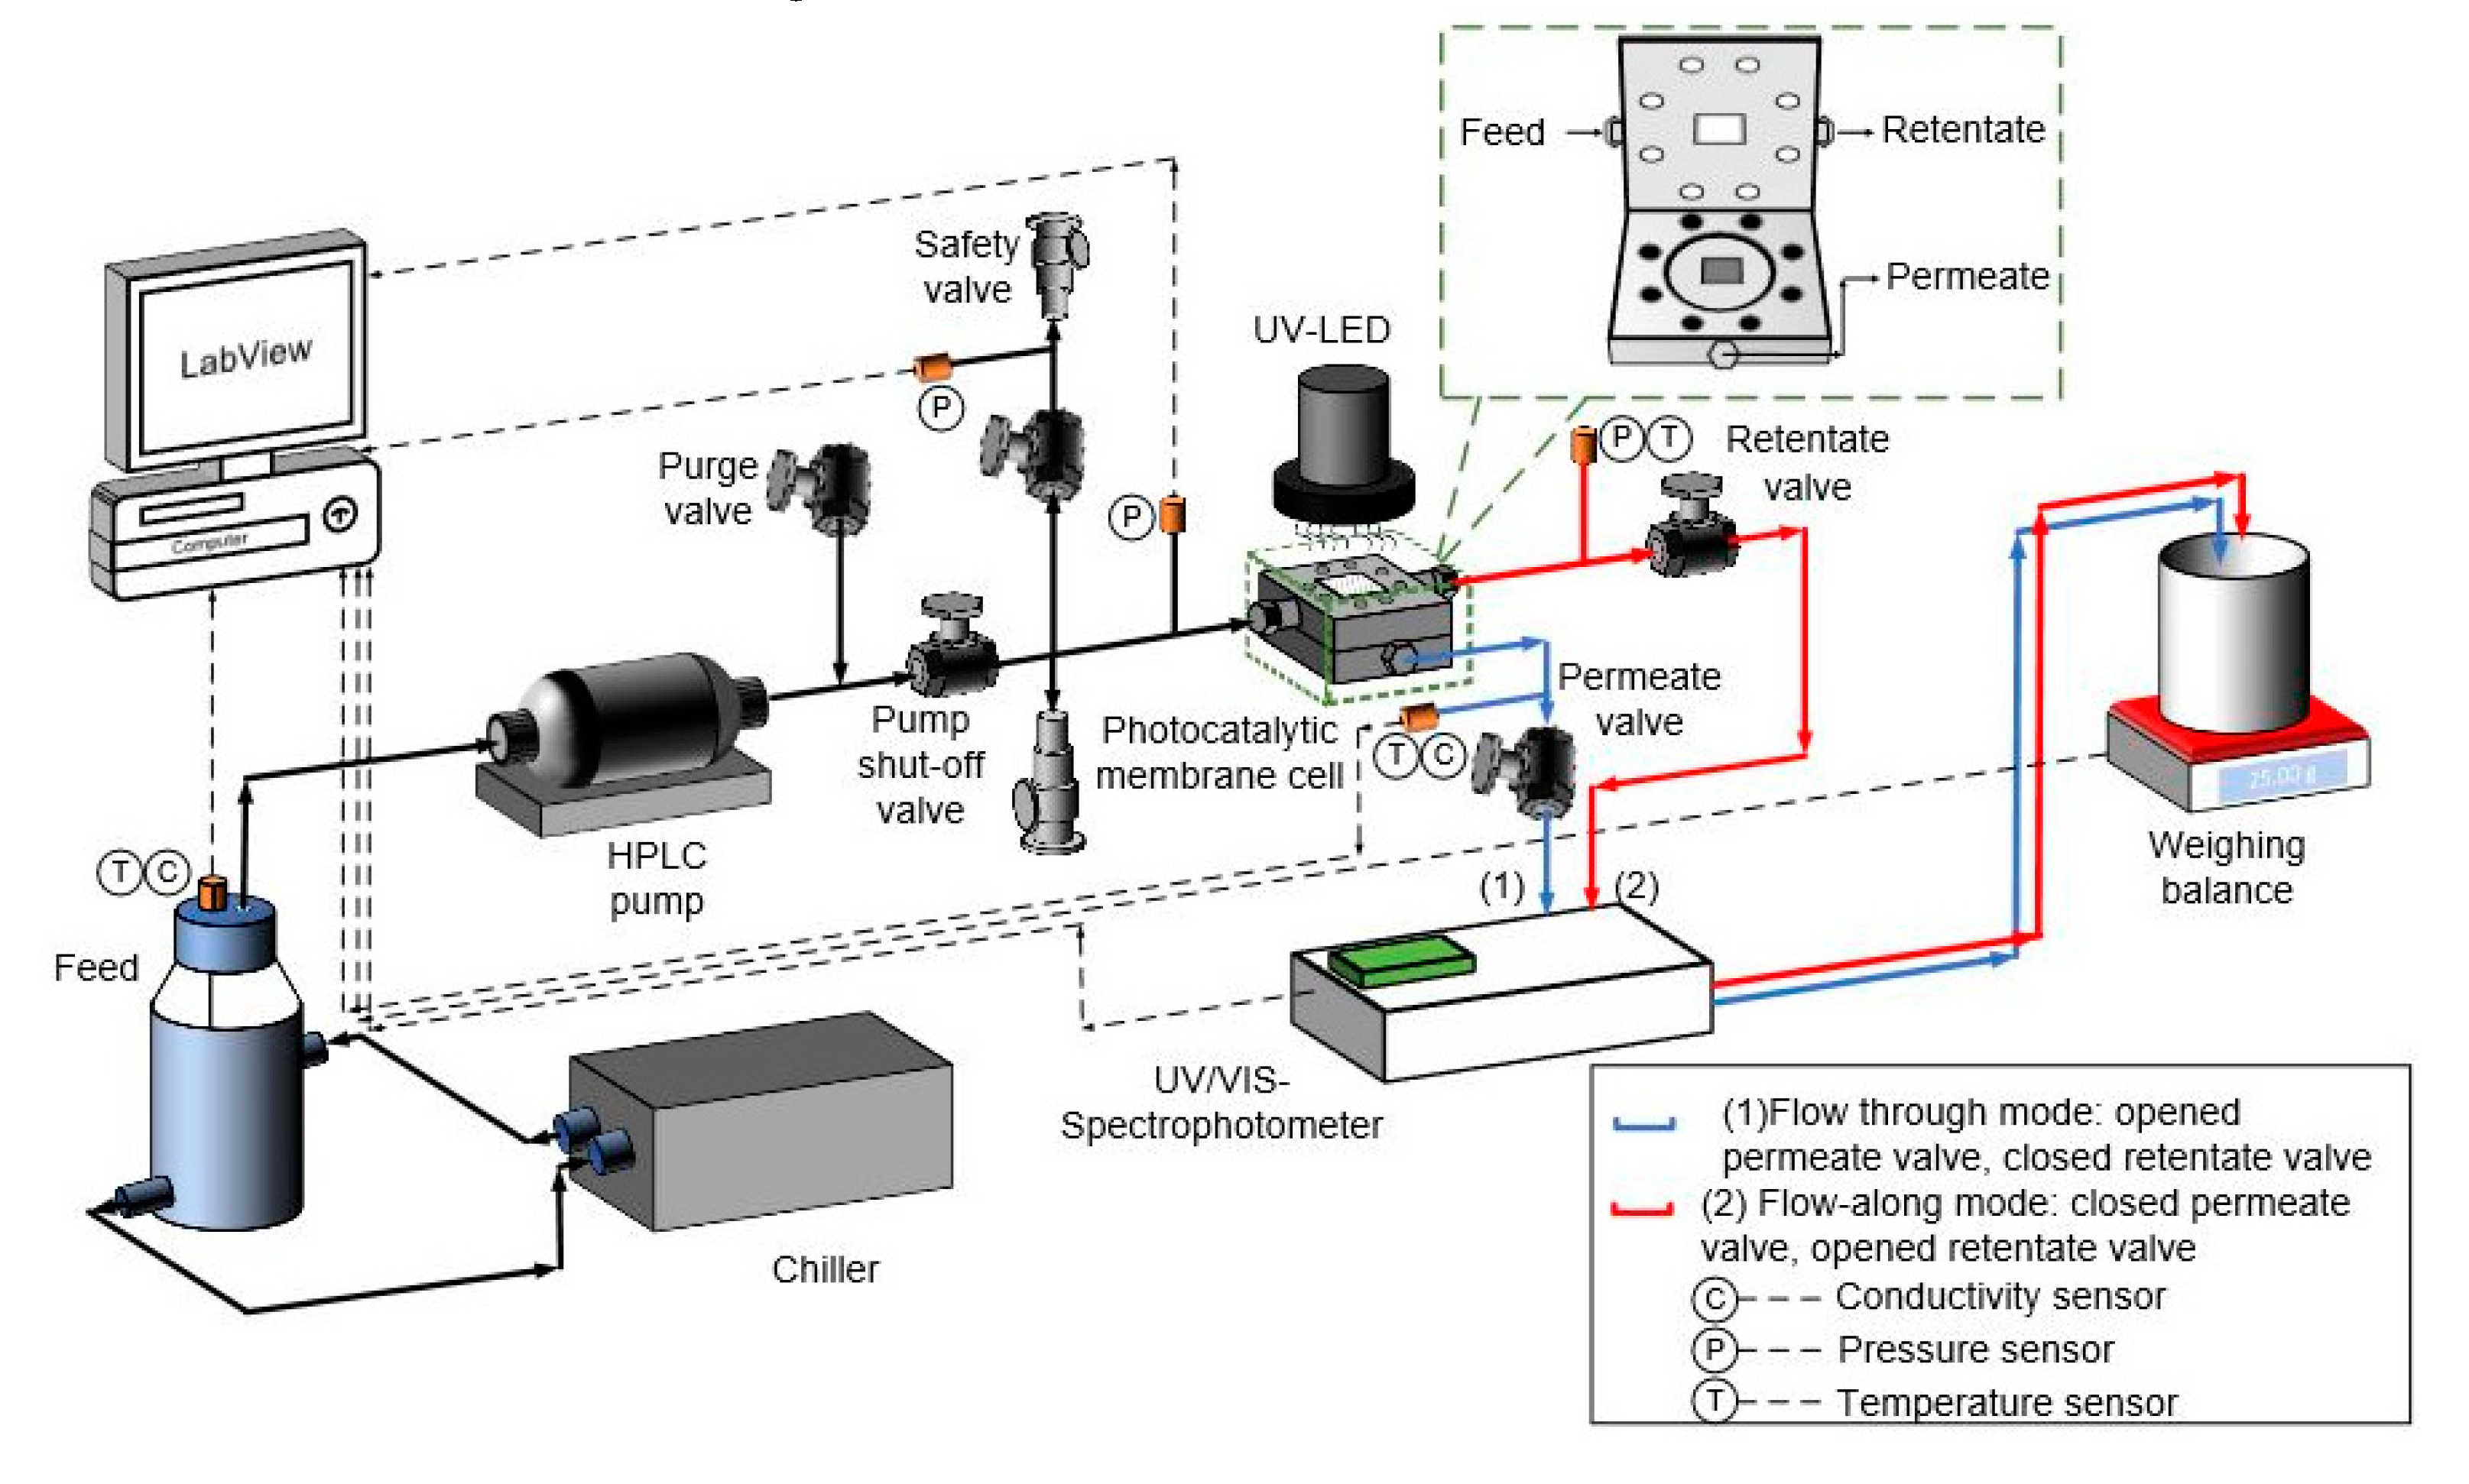
The photocatalytic system used for the flow-along and flow-through reactors (
Figure 8) is the modified version of the custom-built micro cross-flow cell characterized by Imbrogno et al. [
71] and adapted for photocatalysis by Lyubimenko et al. [
72]. The photocatalytic membrane cell was fabricated in-house using “316 stainless steel” with a quartz window (Zell Quarzglas, Schleswig-Holstein, Germany) on its top side coupled with a sealing system. Due to its geometry, only a portion of the membrane (active area of 2 cm
2) is illuminated from above. The protocol for the photocatalytic experiment is adapted from Berger et al. [
73]. In the flow-along reactor, the feed solution only flows only at the TiO
2-immobilized membrane catalytic surface rather than permeating through it and is referred to as a planar microreactor. The dimension of such a reactor in the current work is 20 × 10 × 0.7 mm. During the photocatalytic experiment in such a mode, the permeate valve (1) was closed and all the MB solution (350 mL) passes along the surface of the membrane at a specified flow rate, shown by the red line. In this case, the retentate was connected to the cuvette in the UV–vis (PerkinElmer Lambda 365, Waltham, MA, USA) to measure the decrease in absorbance during the experiment at a wavelength of 664 nm. In the flow-through reactor, where the flow of the bulk solution is vertical to the membrane surface and directed through the membrane pores of about 220 nm, the system can be referred to as a nanoreactor [
74]. During the photocatalytic experiment in such a mode, the retentate valve (2) was closed and the MB solution (350 mL) flow forced through the membrane in the “dead-end” mode, shown by the blue line. The feed concentration was constant throughout the experiment, due to the single-pass mode with no permeate recirculation. The dimensions of the cell, window, channel and well for the reactors is shown in
Figure S9.

 ,
, 


