
Image-Based Identification and Genomic Analysis of Single Circulating Tumor Cells in High Grade Serous Ovarian Cancer Patients

 , ,
, ,
Abstract
:Simple Summary
Abstract
1. Introduction
2. Materials and Methods
2.1. Cell Culture and Spike-In Experiments
2.2. Characterization of Study Patients
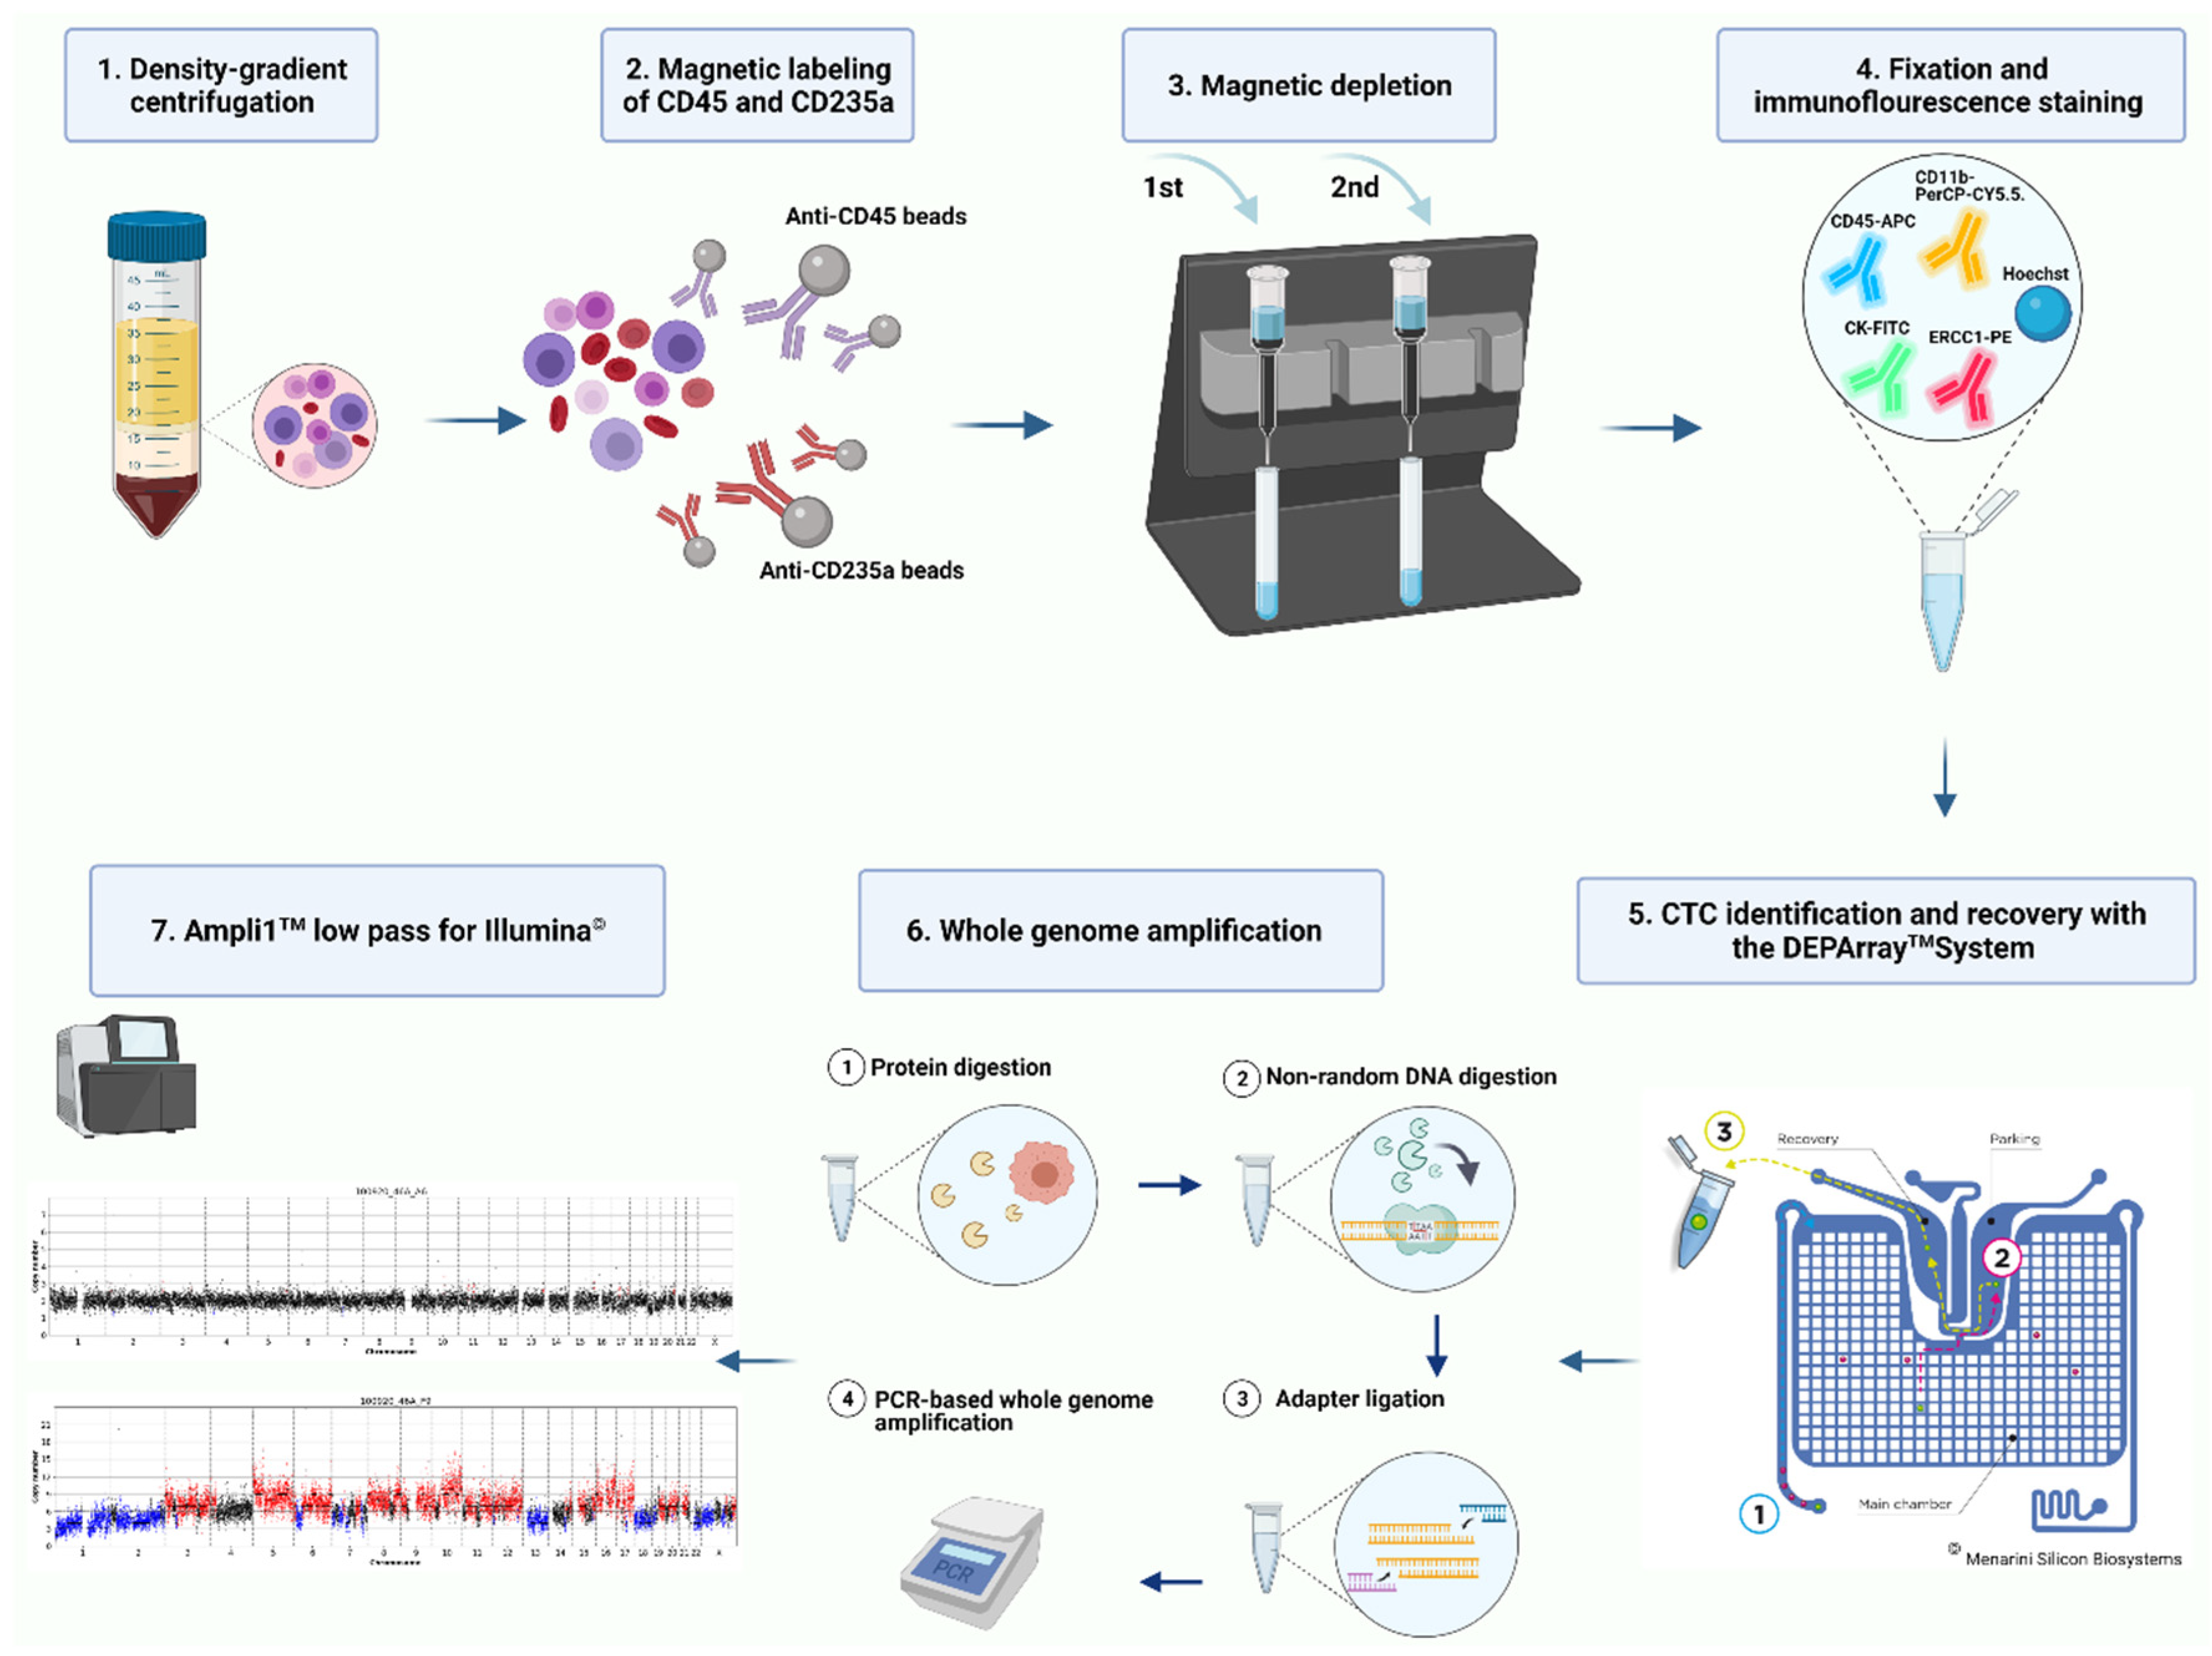
2.3. CTC Enrichment
2.4. Immunofluorescence Staining and Single Cell Recovery with DEPArray™ NxT
2.5. Whole Genome Amplification and Molecular Characterization of Isolated Single Cells
2.6. Data Analysis
3. Results
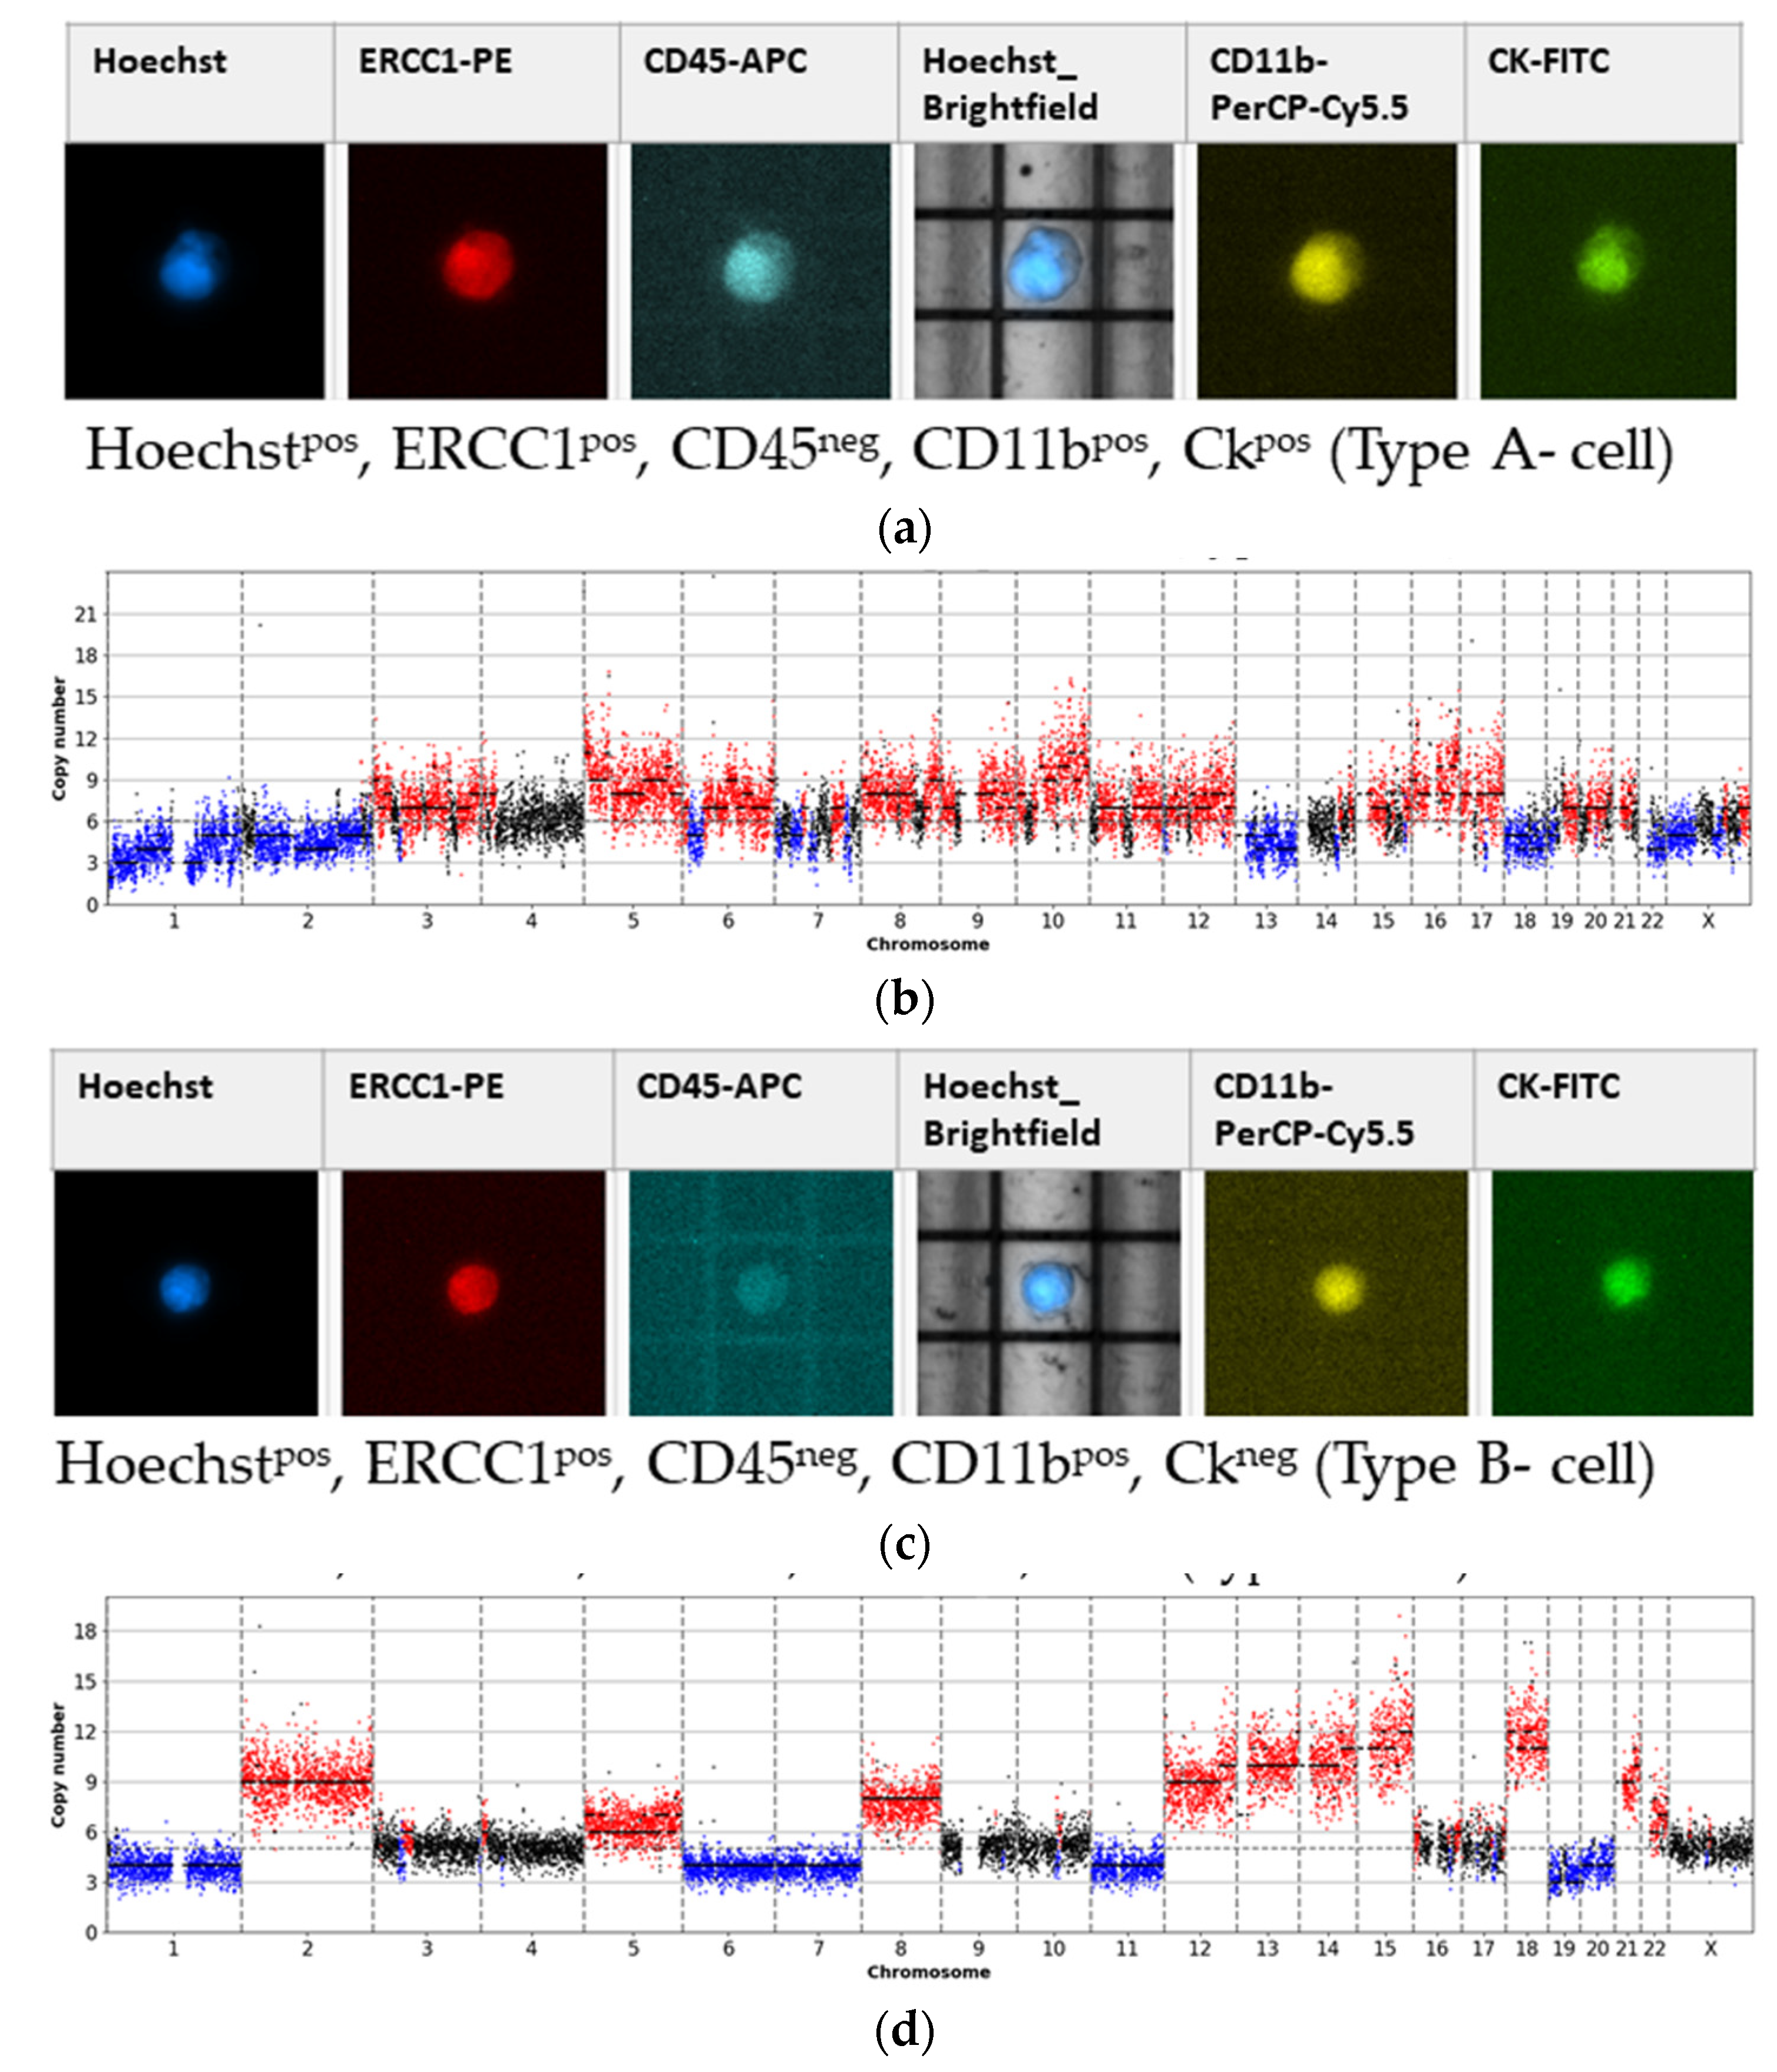
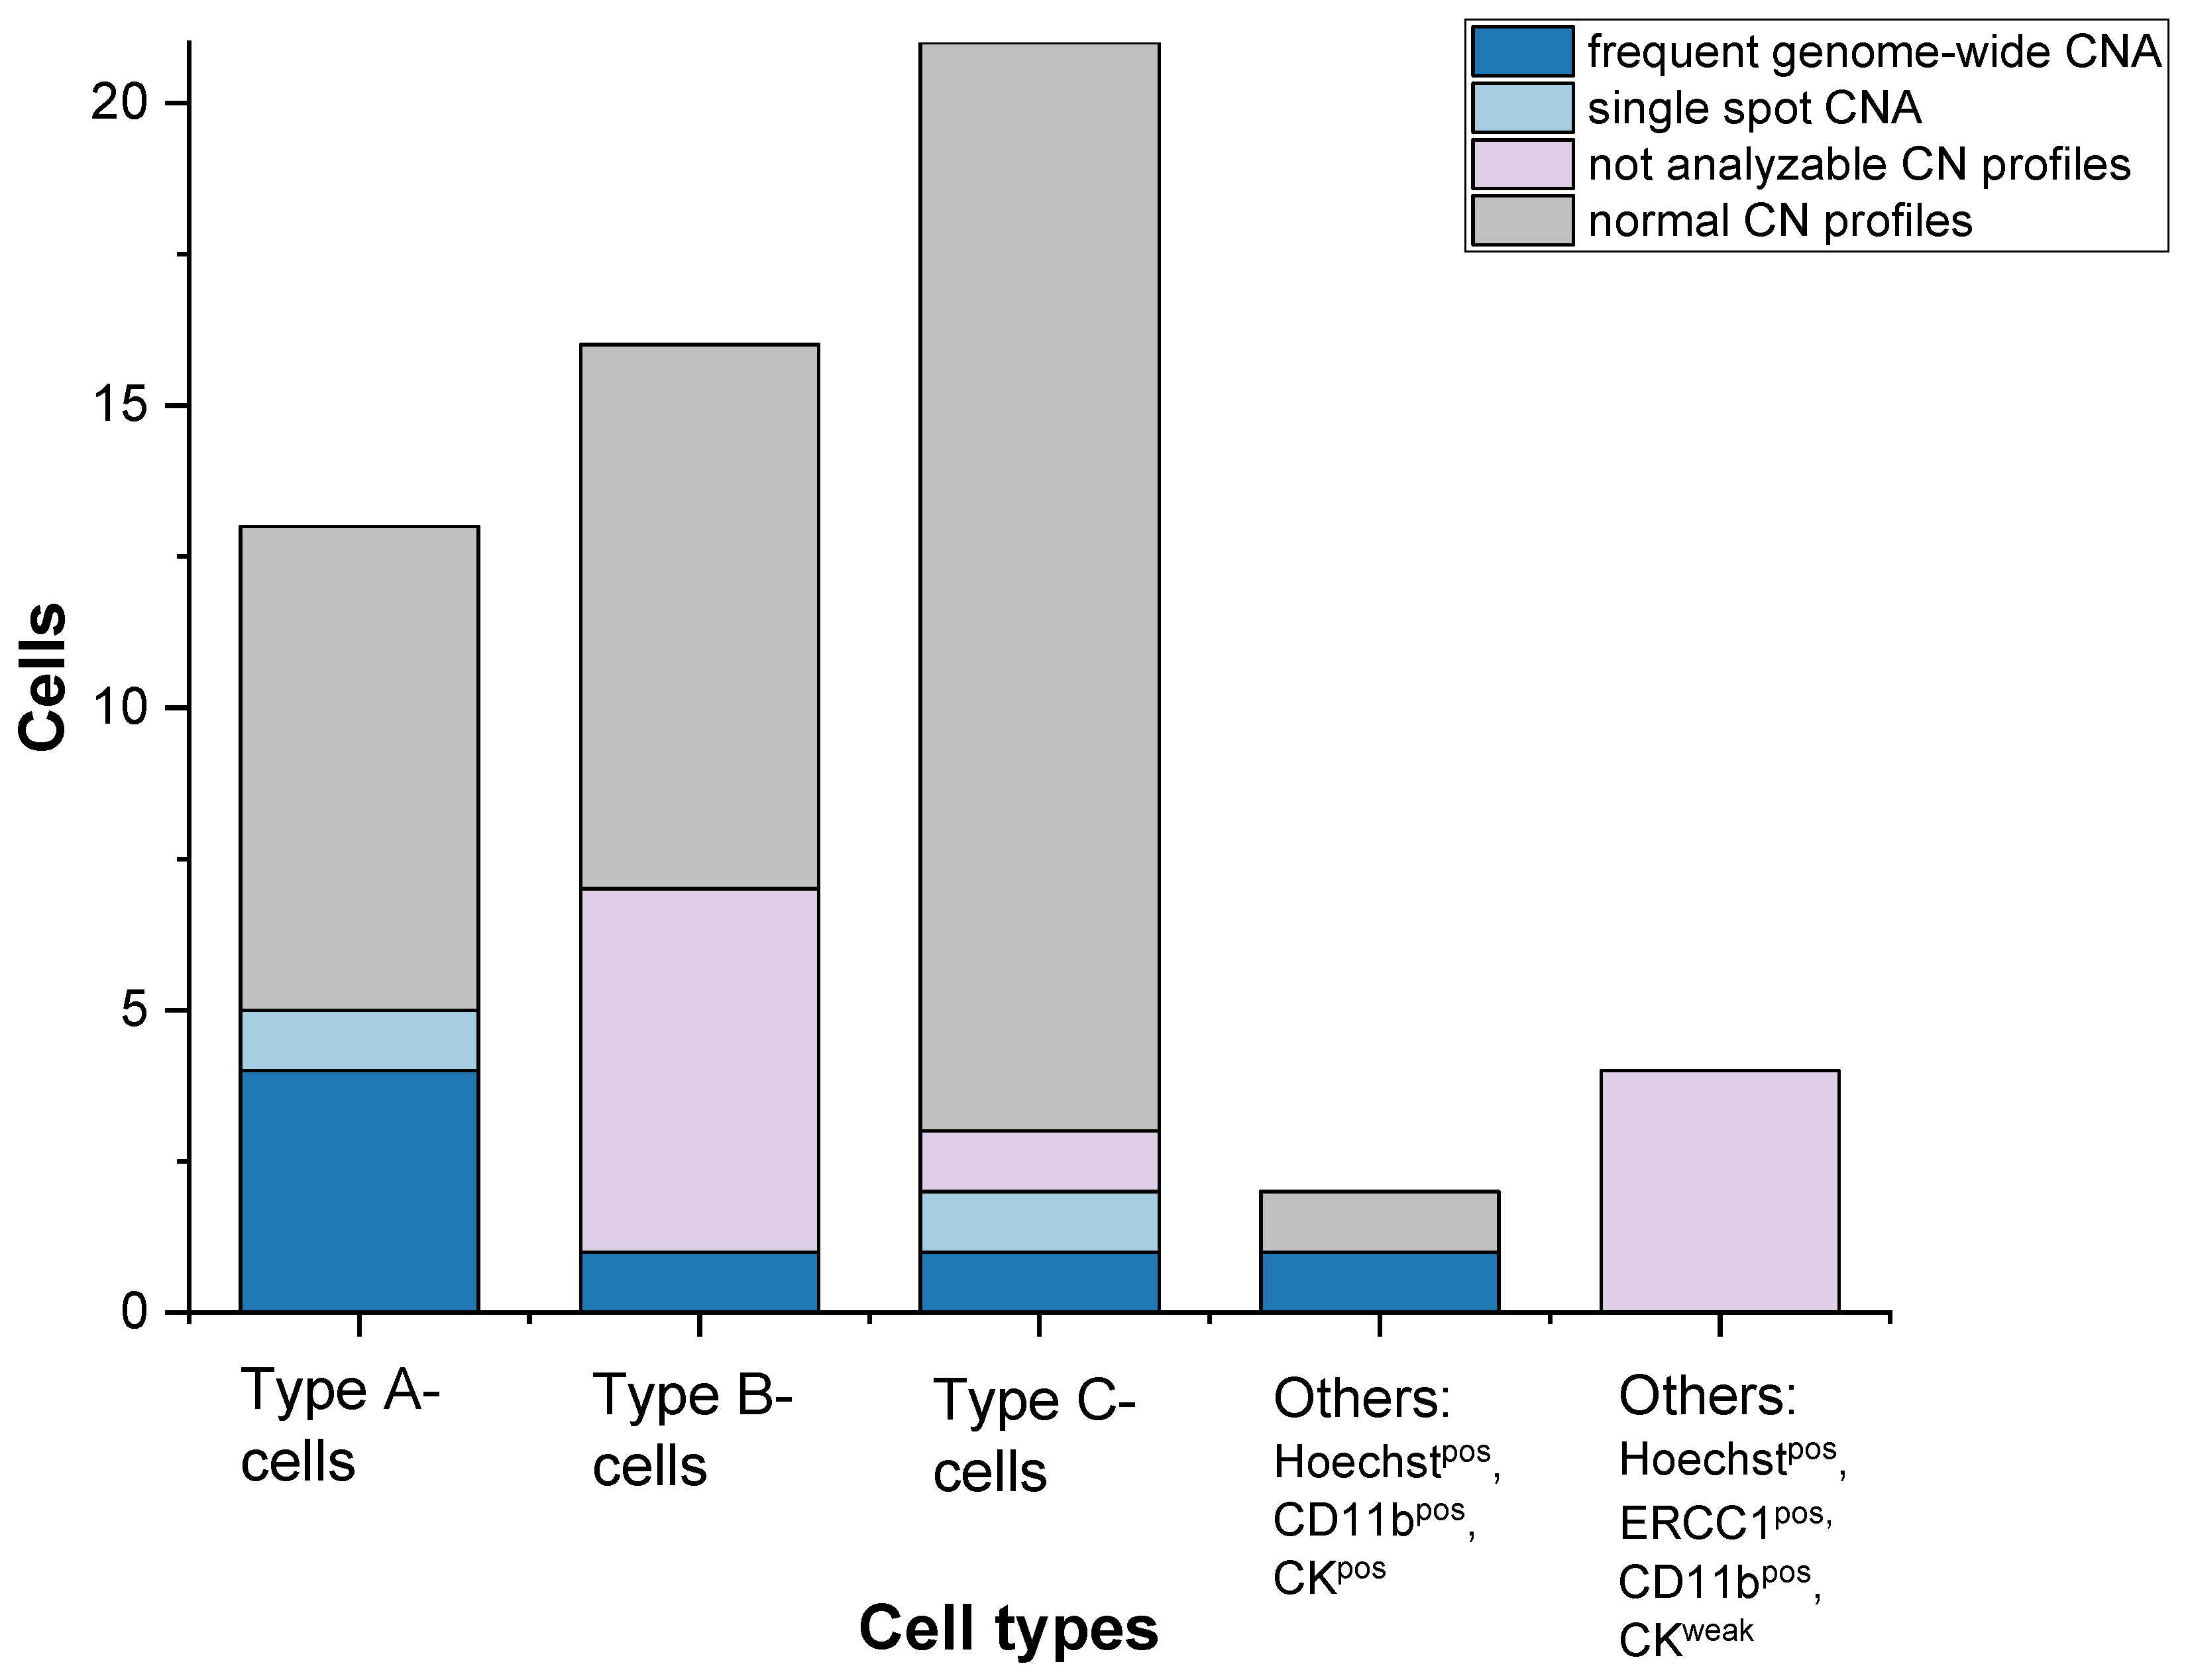
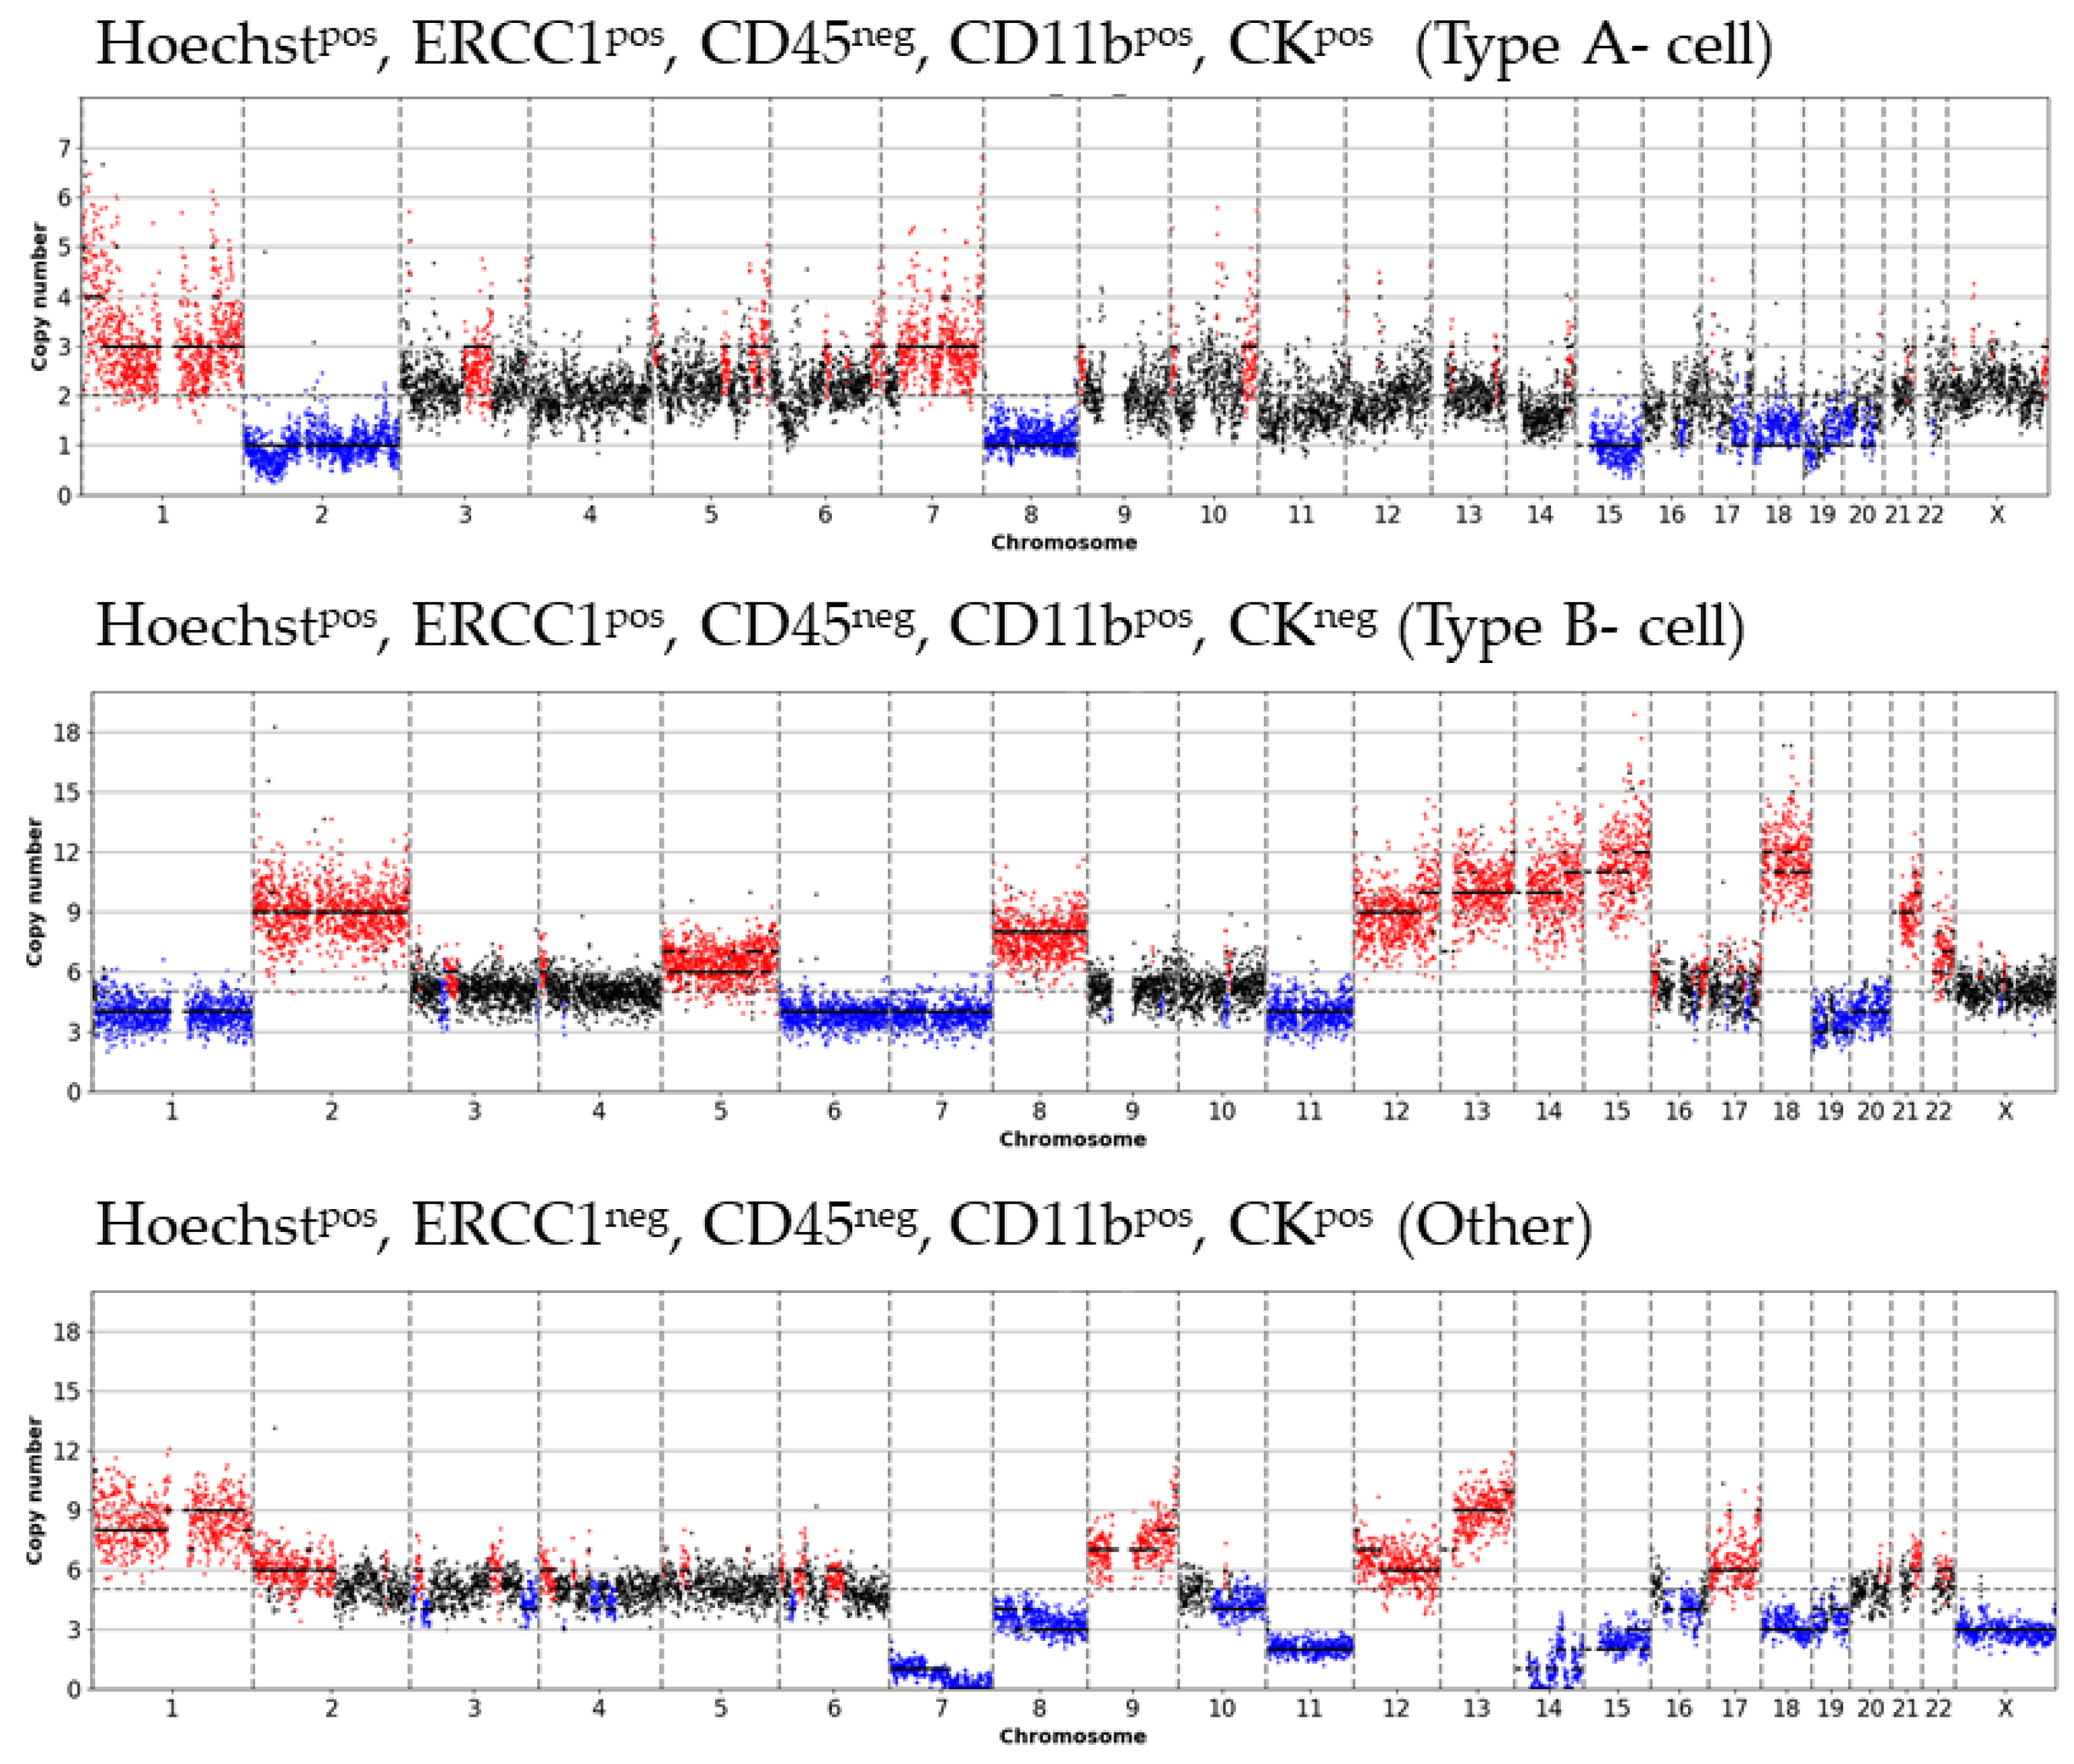
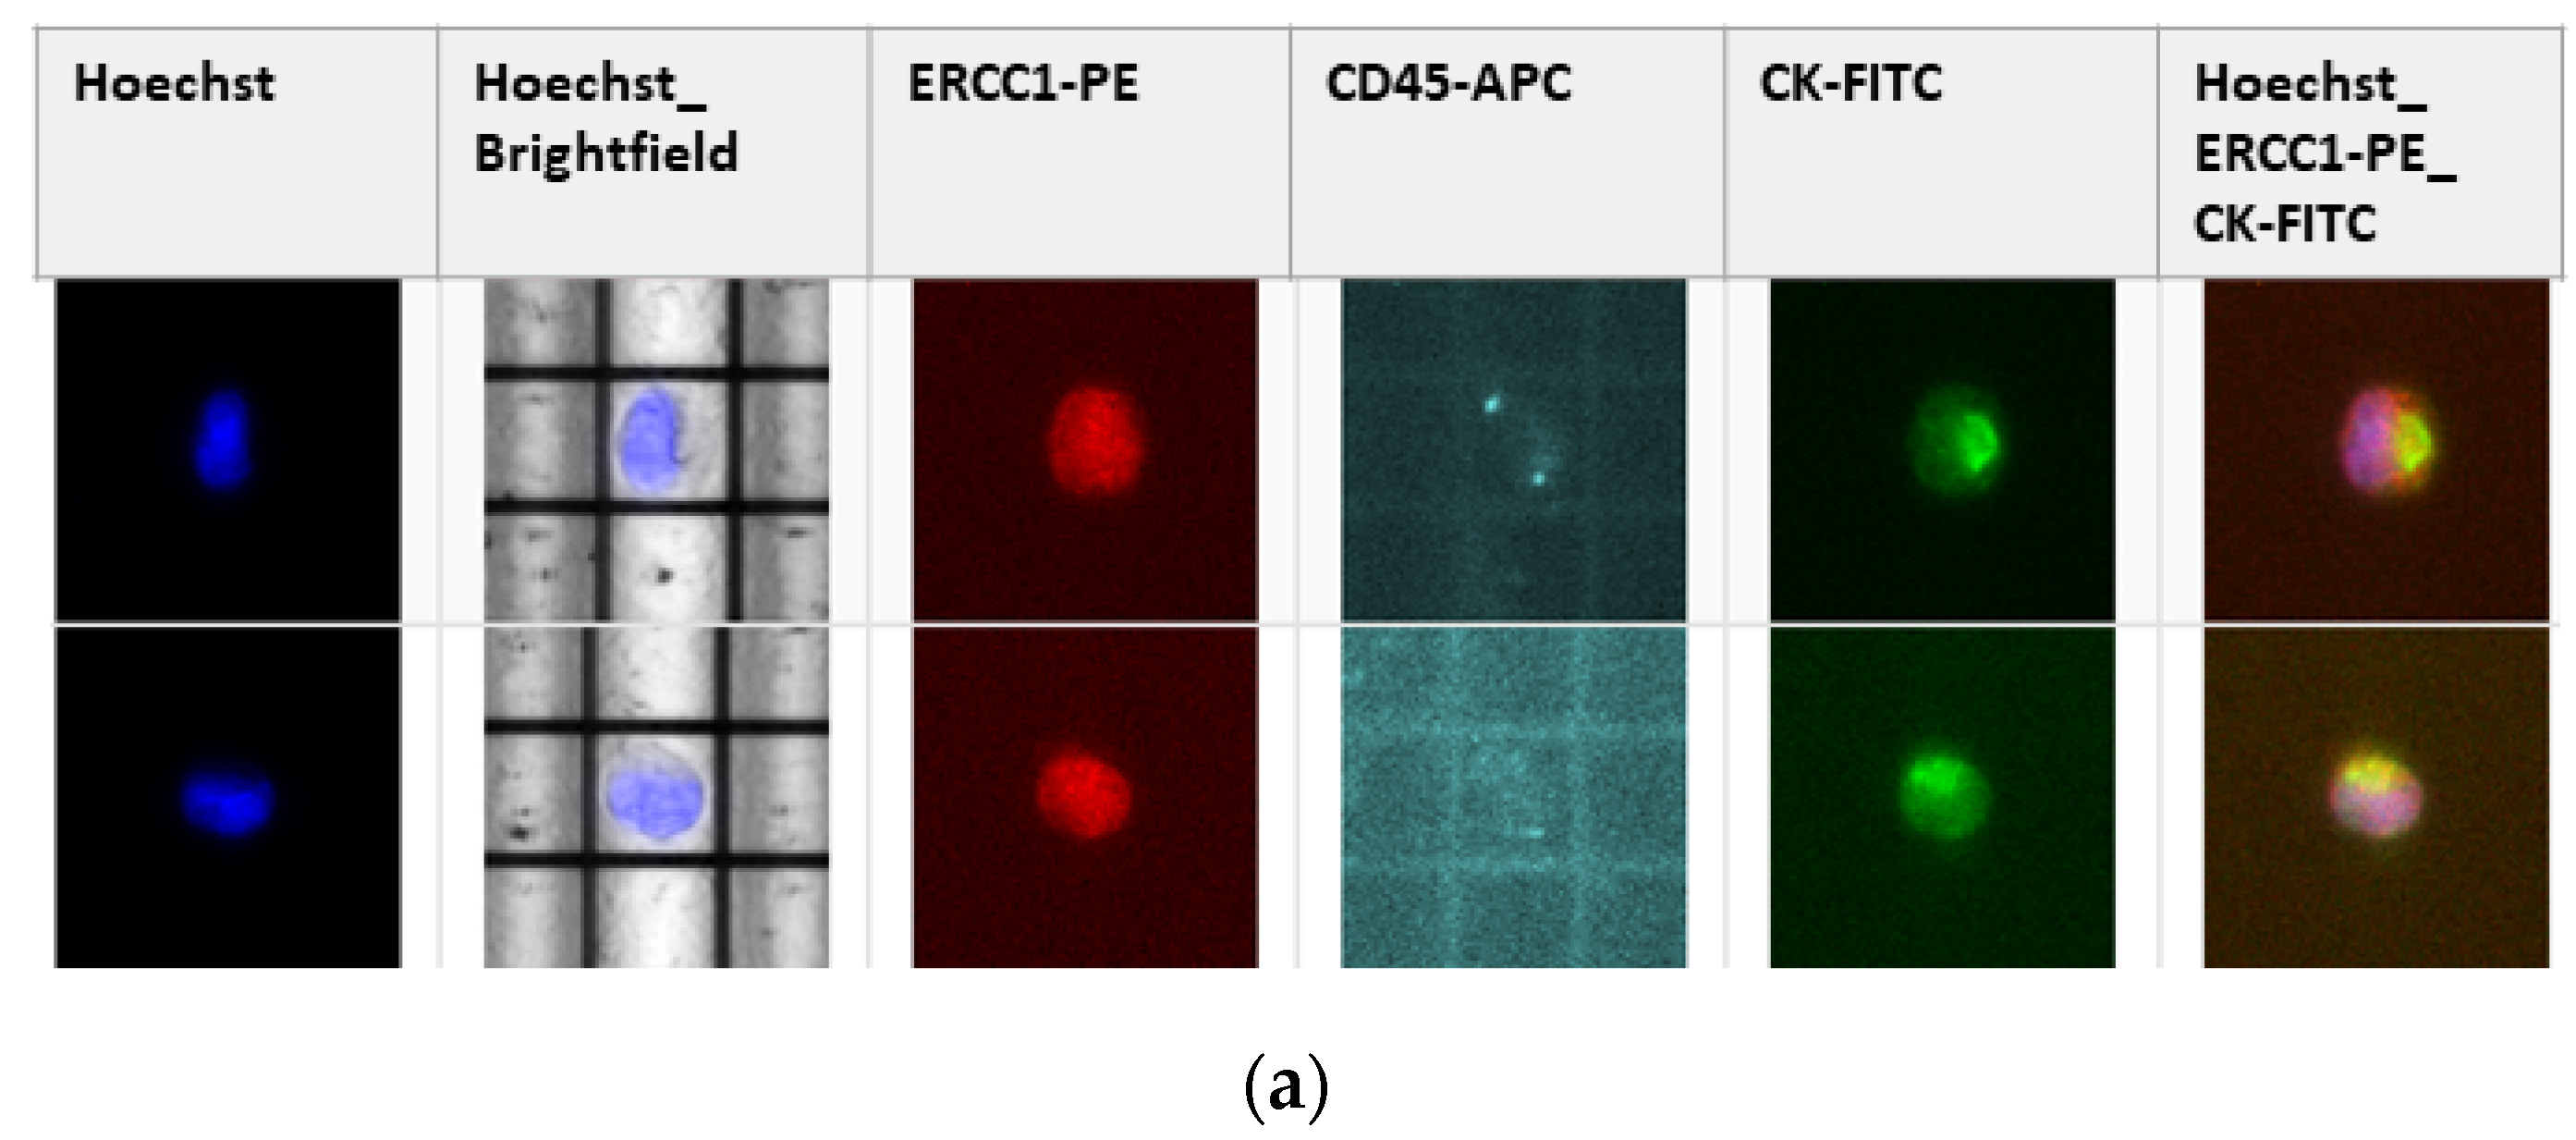
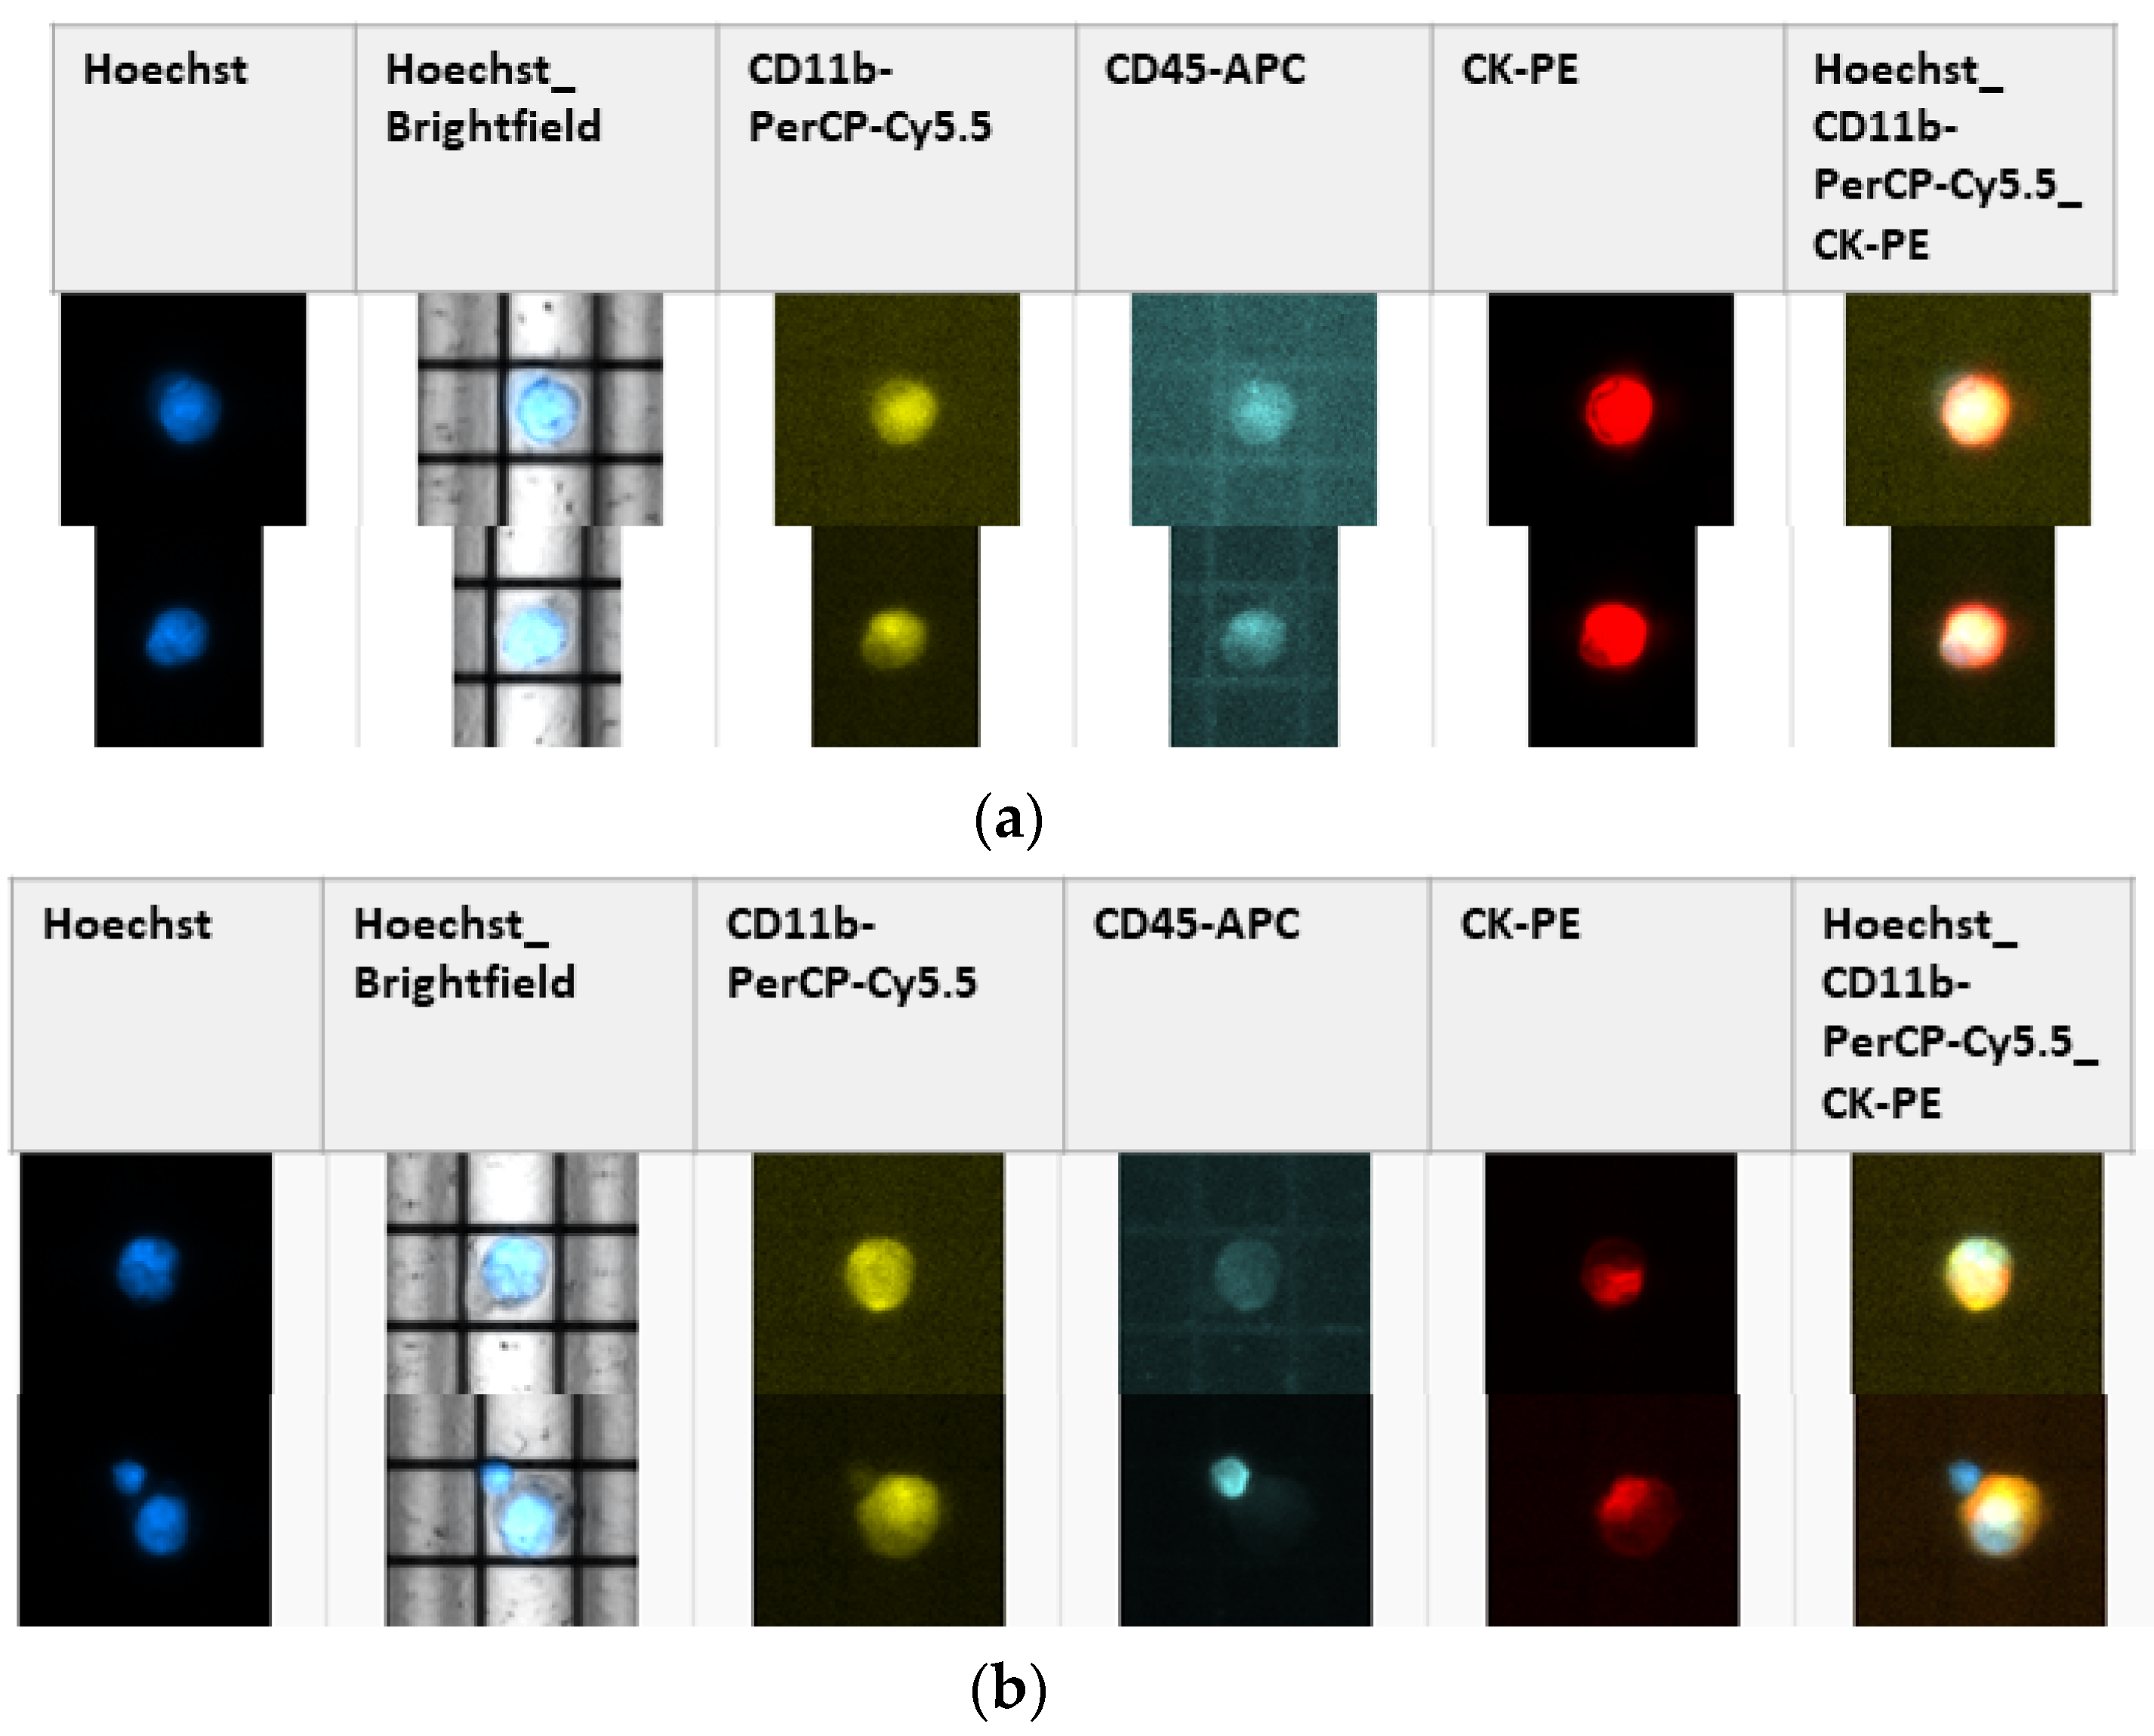
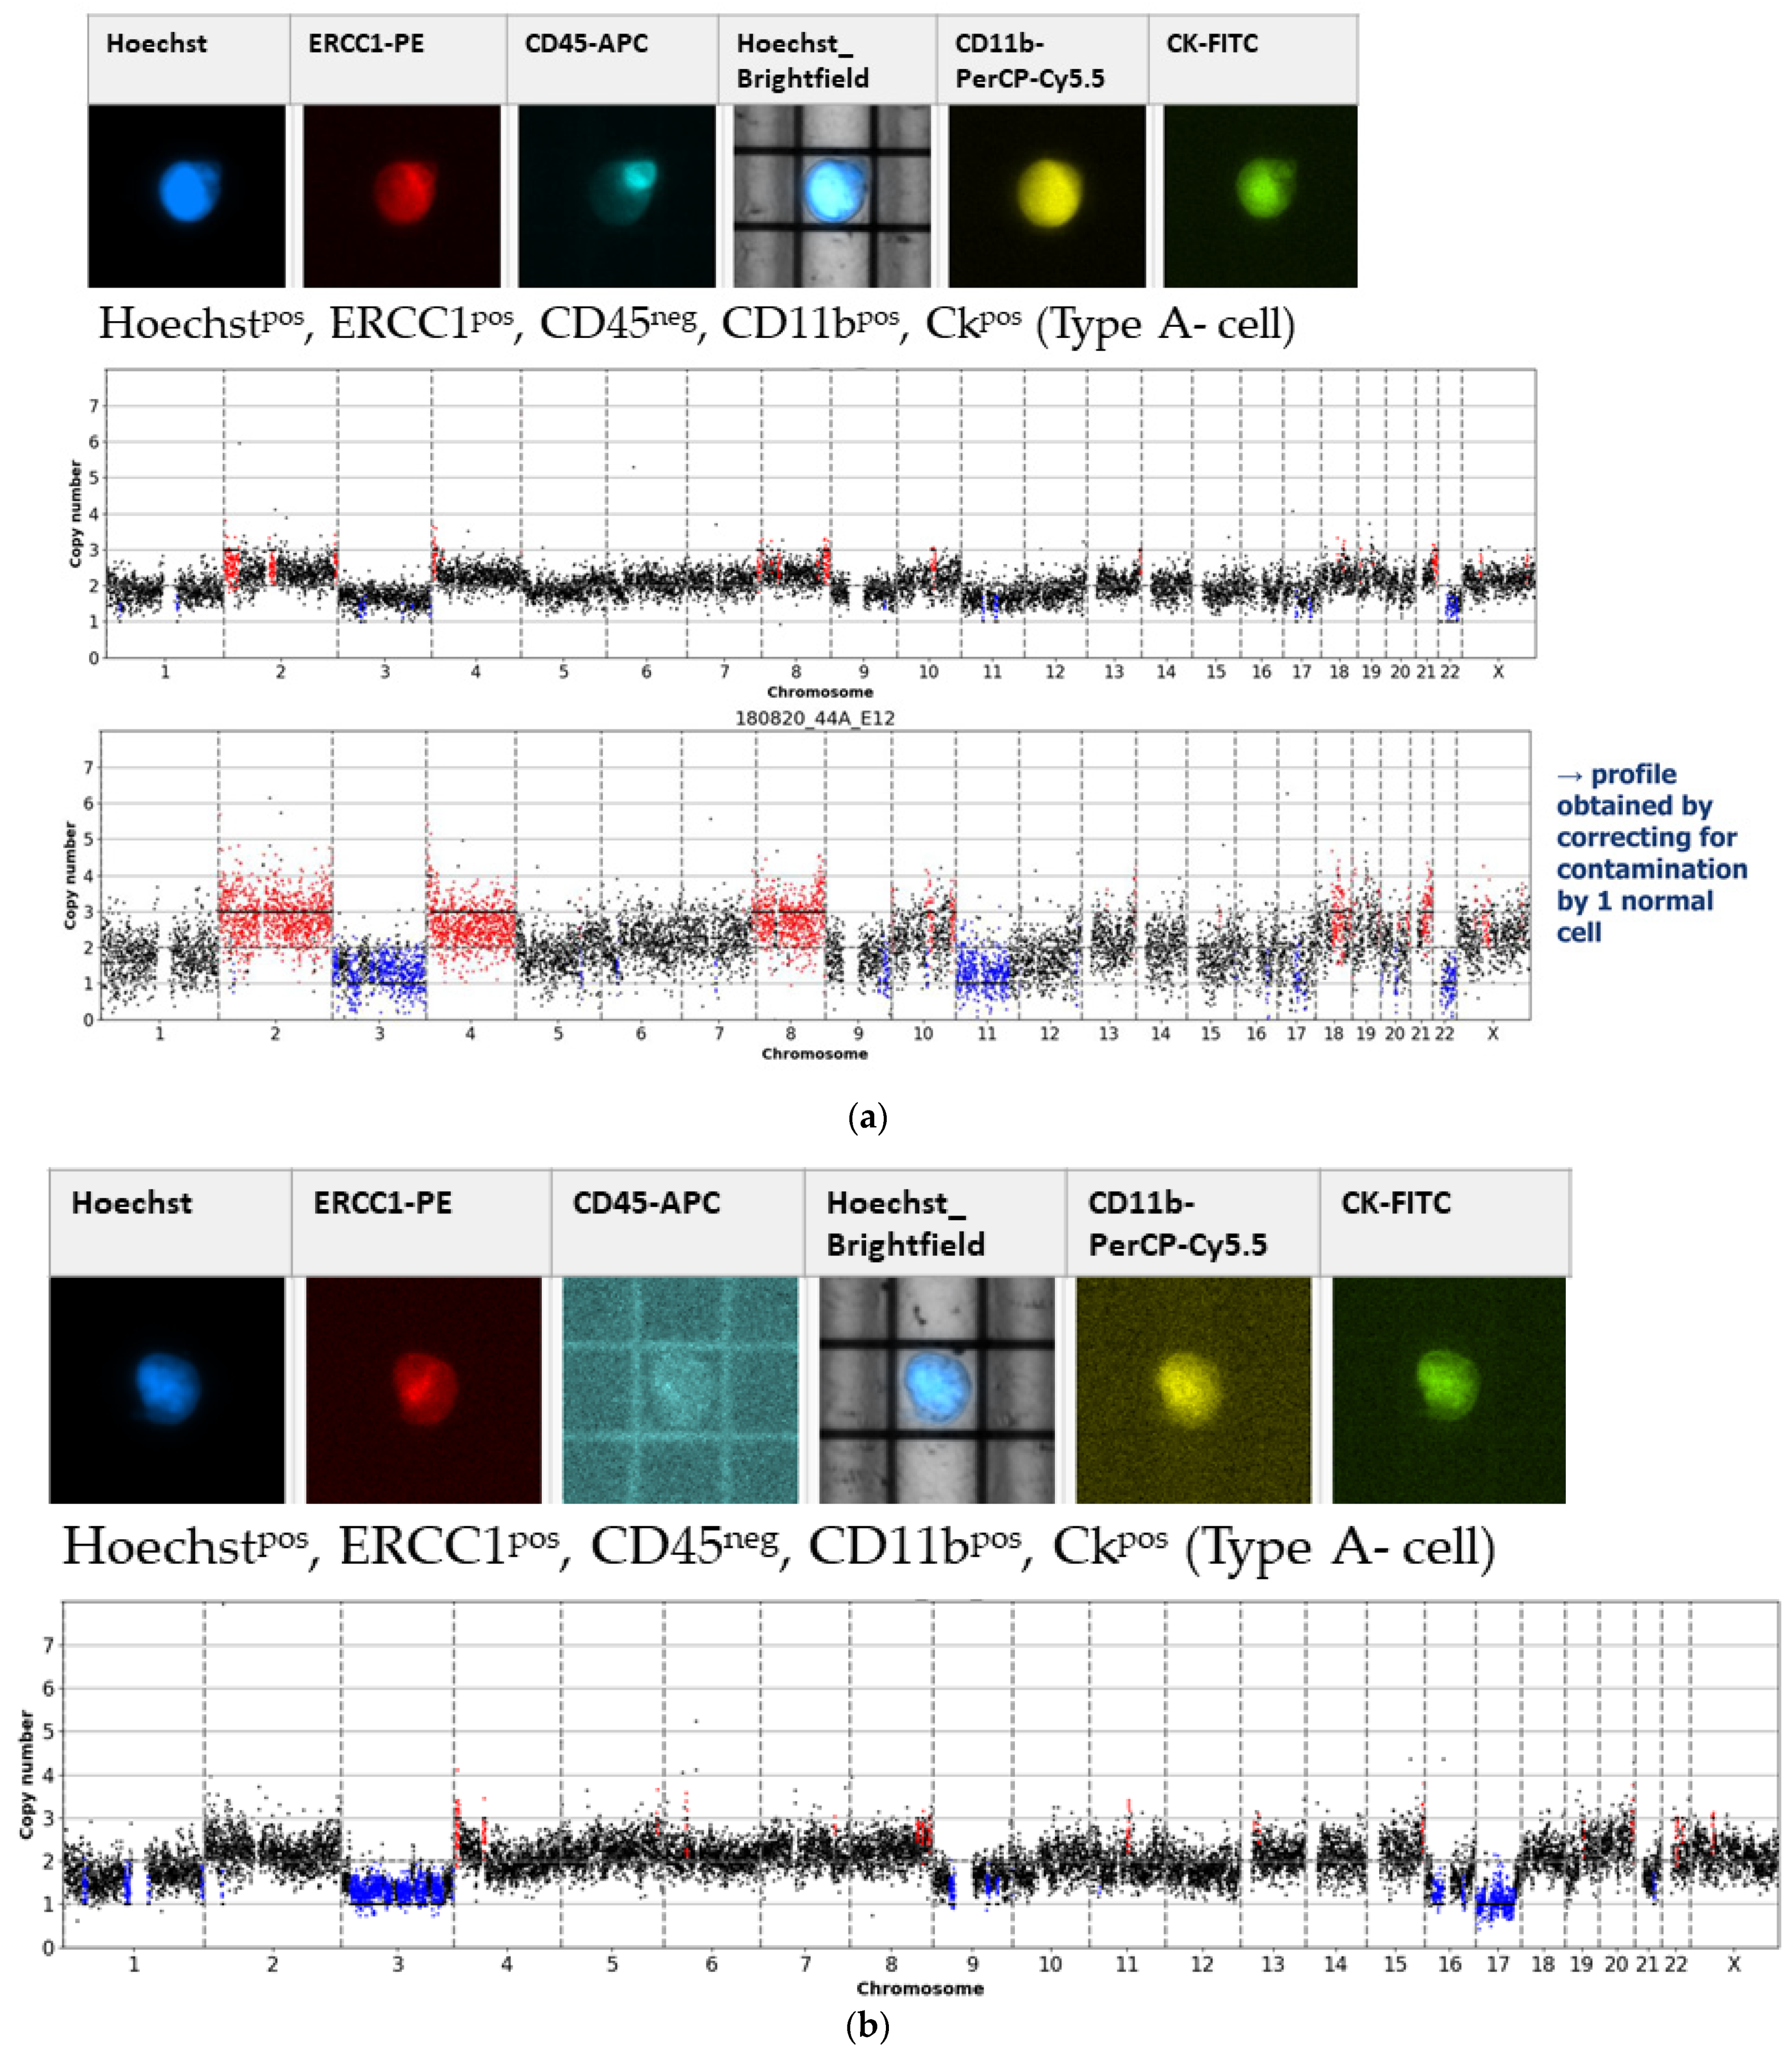
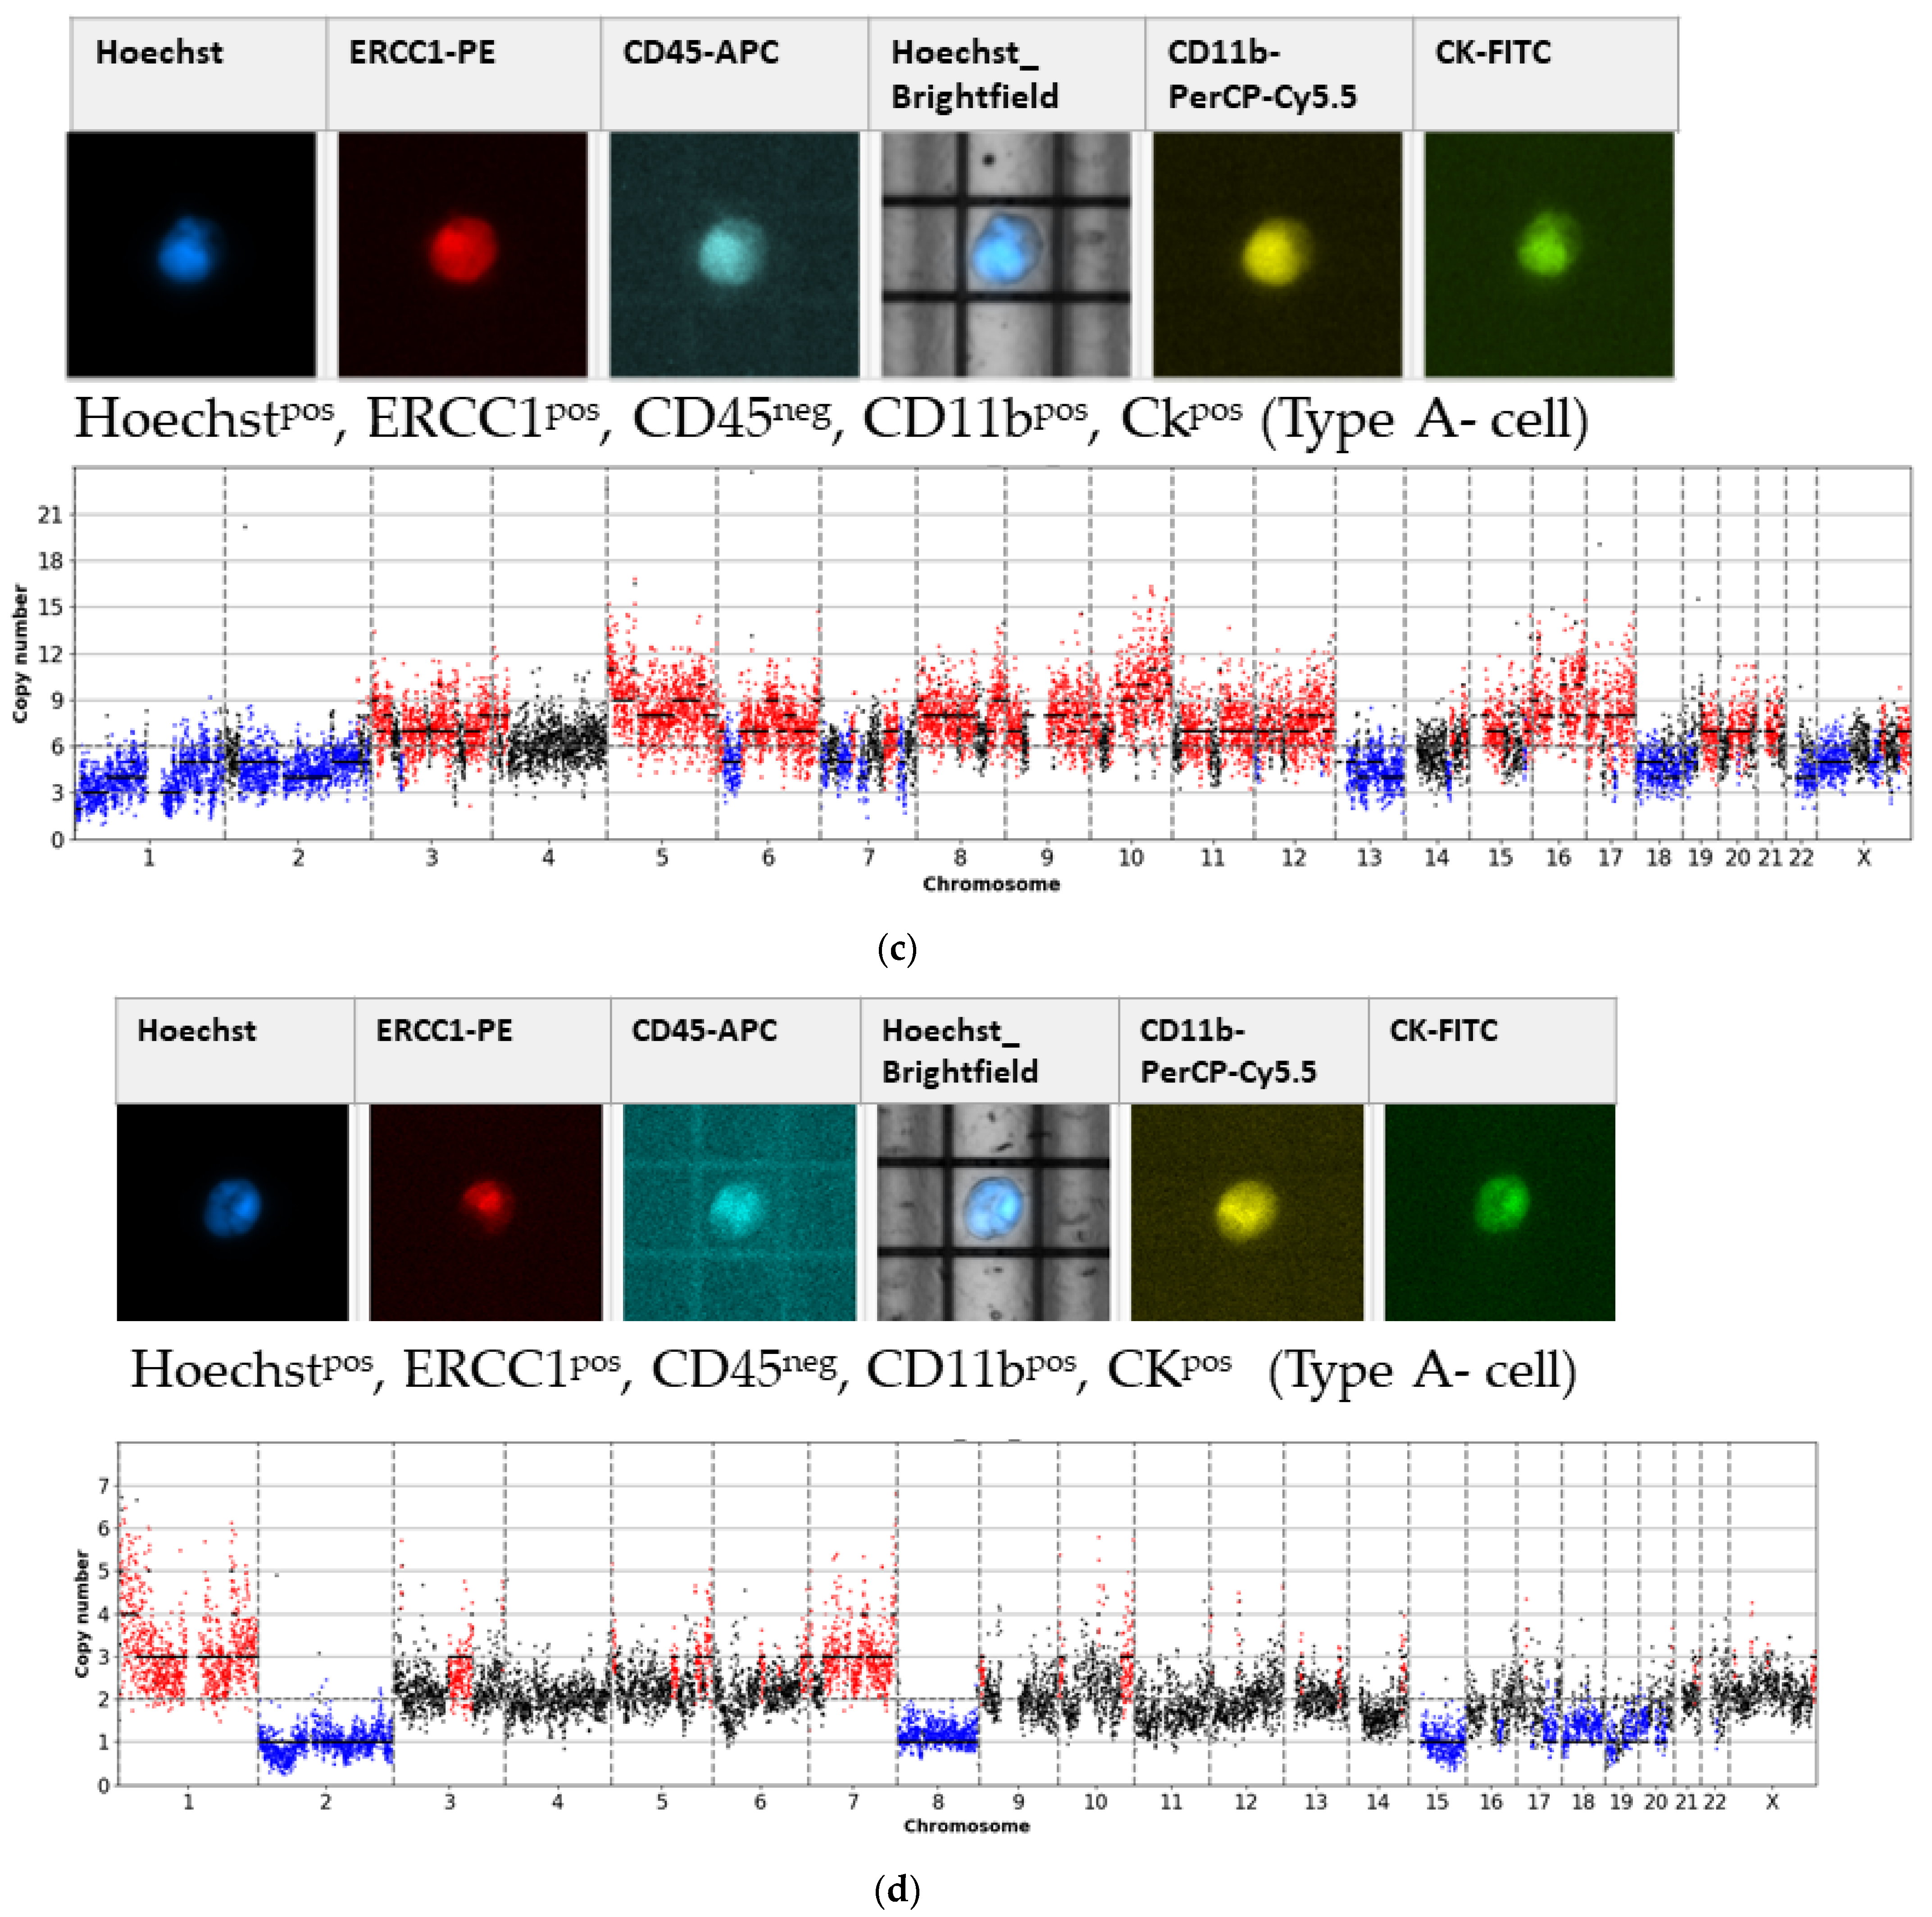
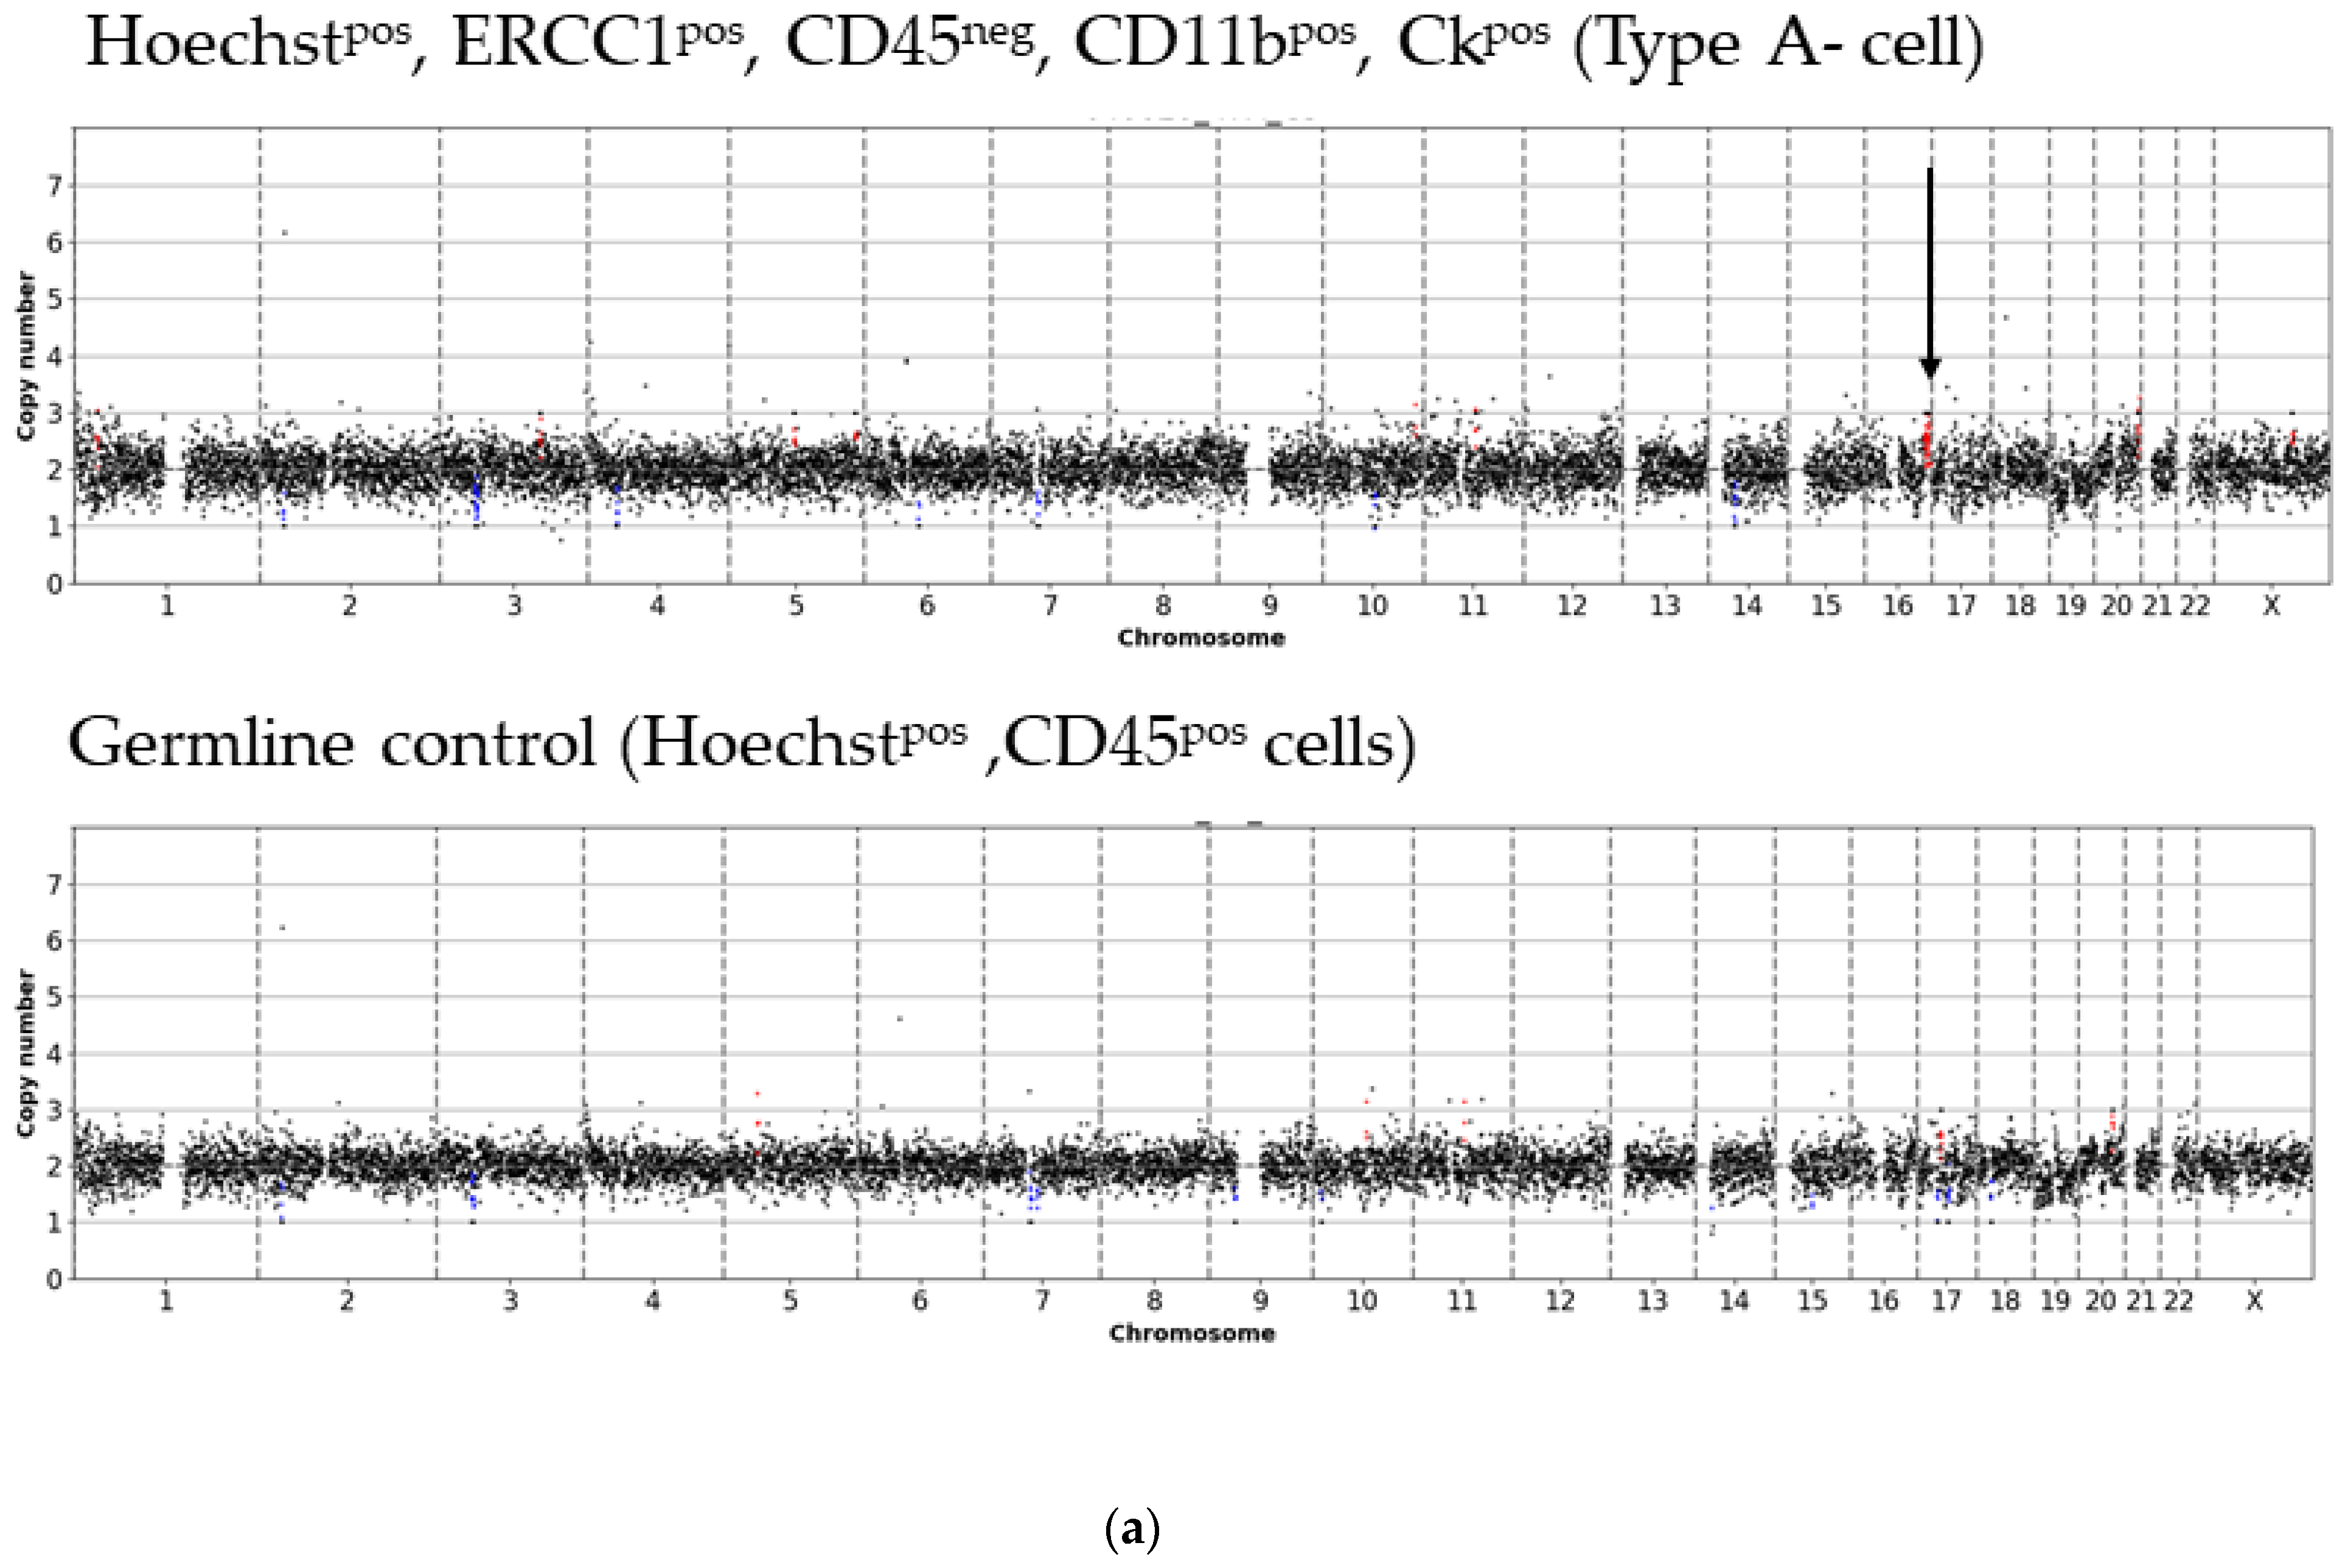
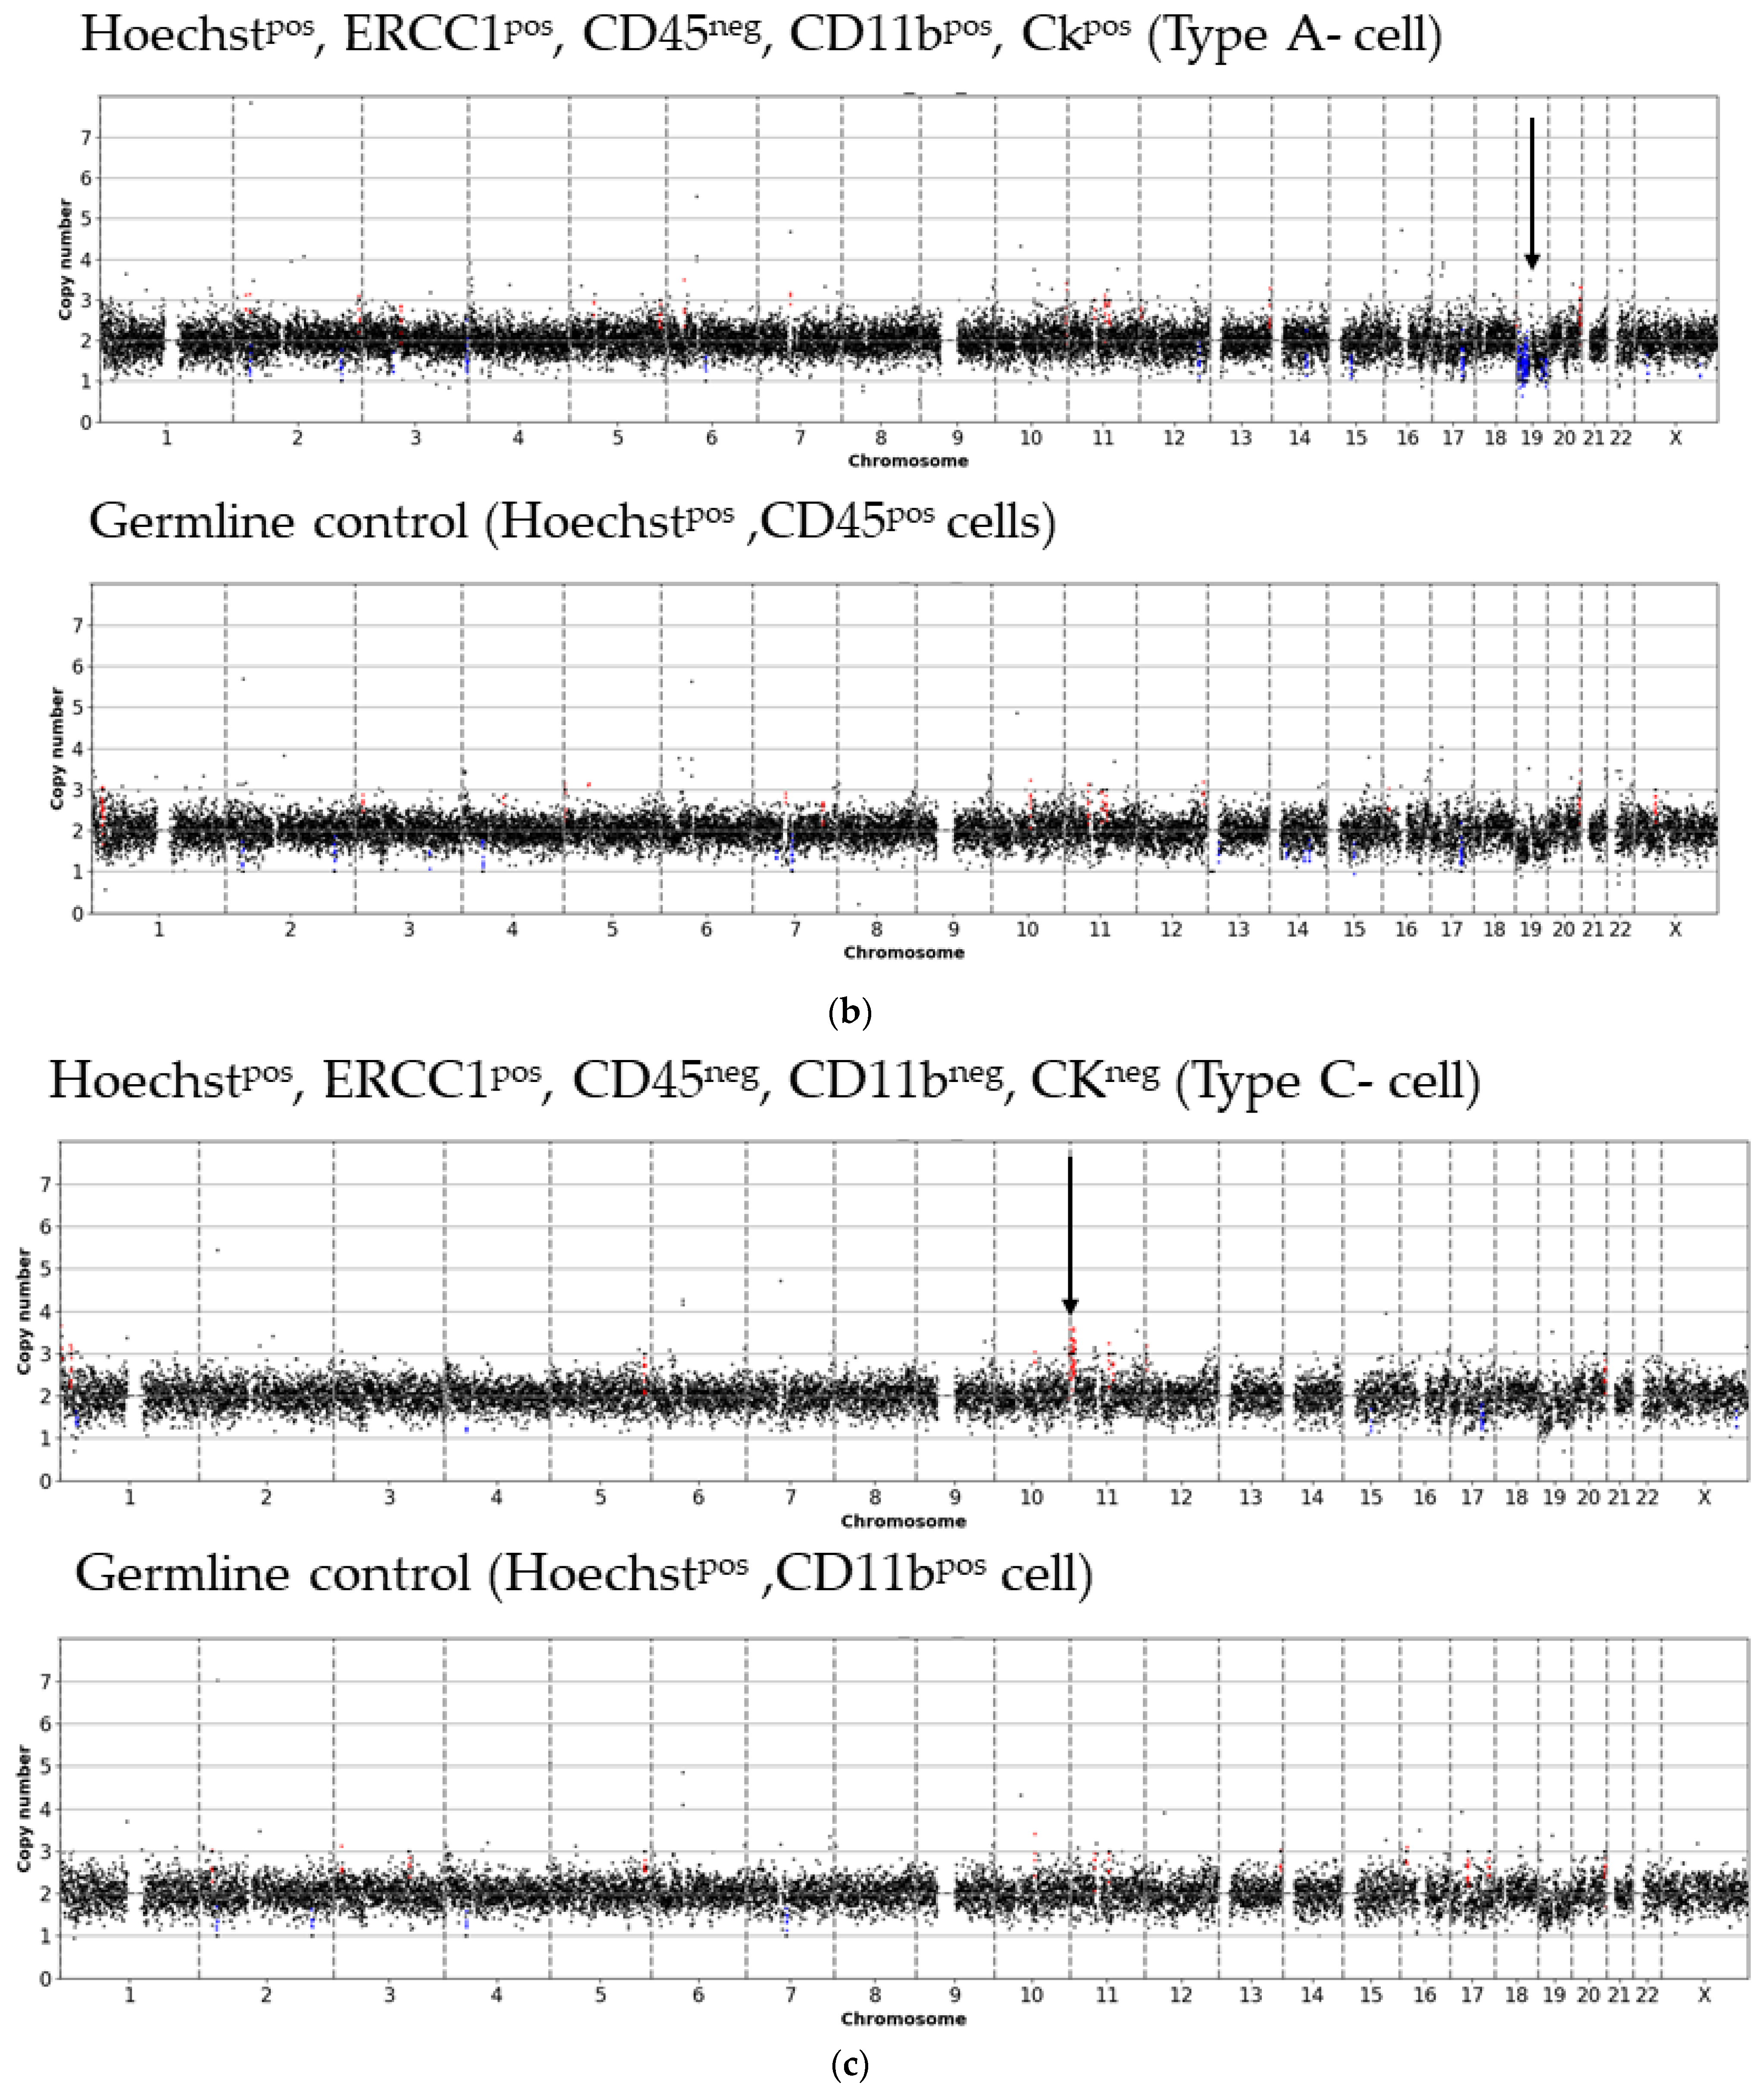
- Type A-cells (epithelial sCTC):Hoechstpos, ERCC1pos, CD45neg, CD11bpos, CKpos;
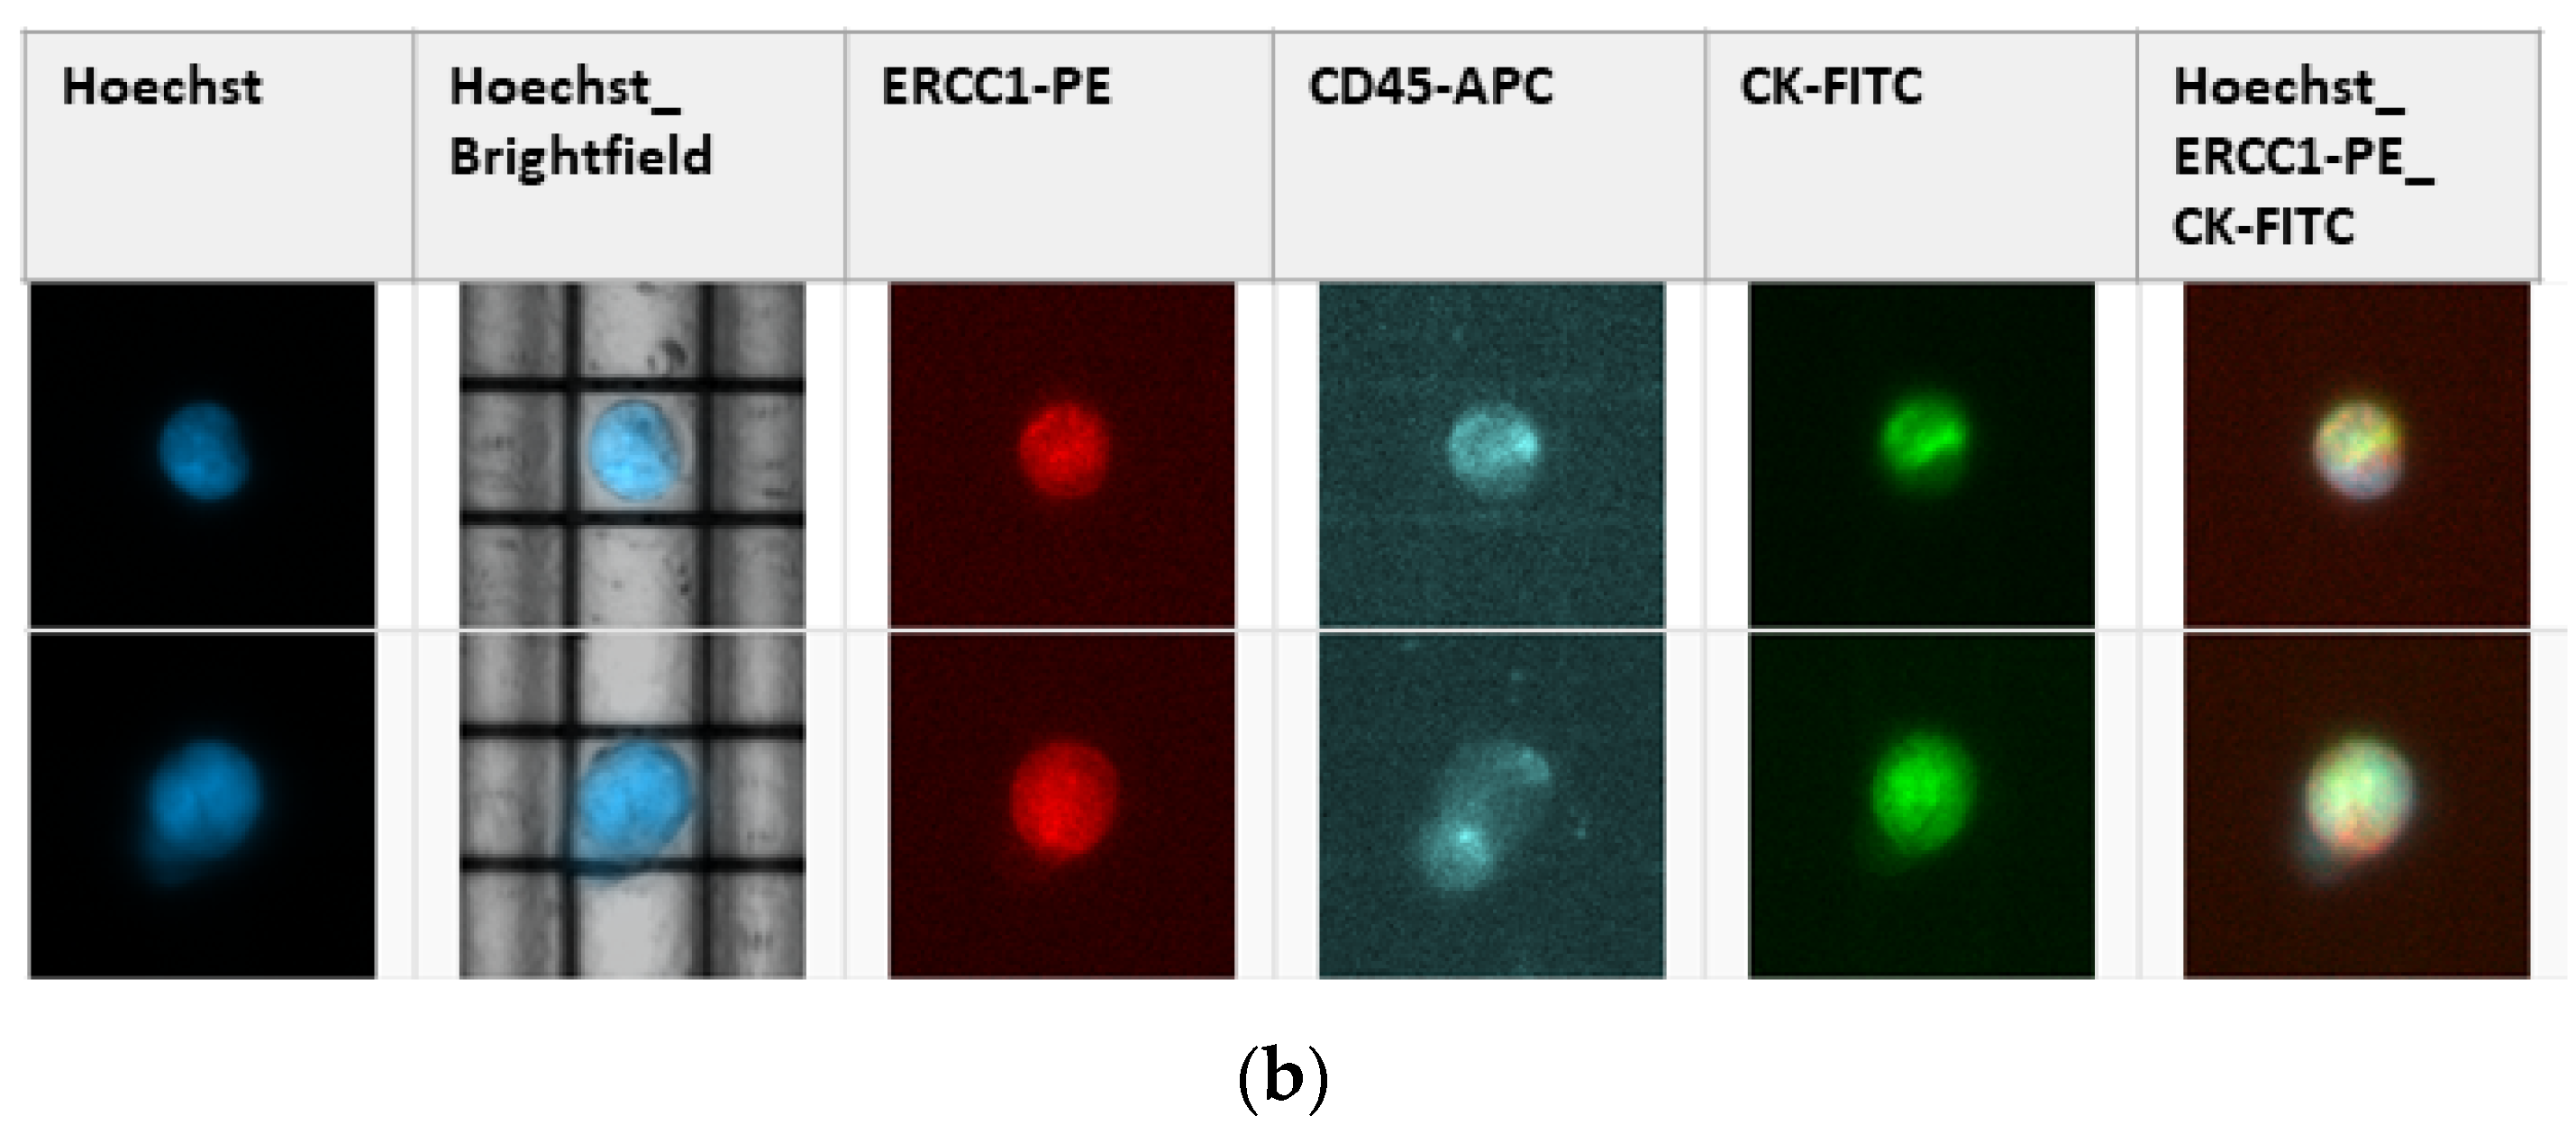
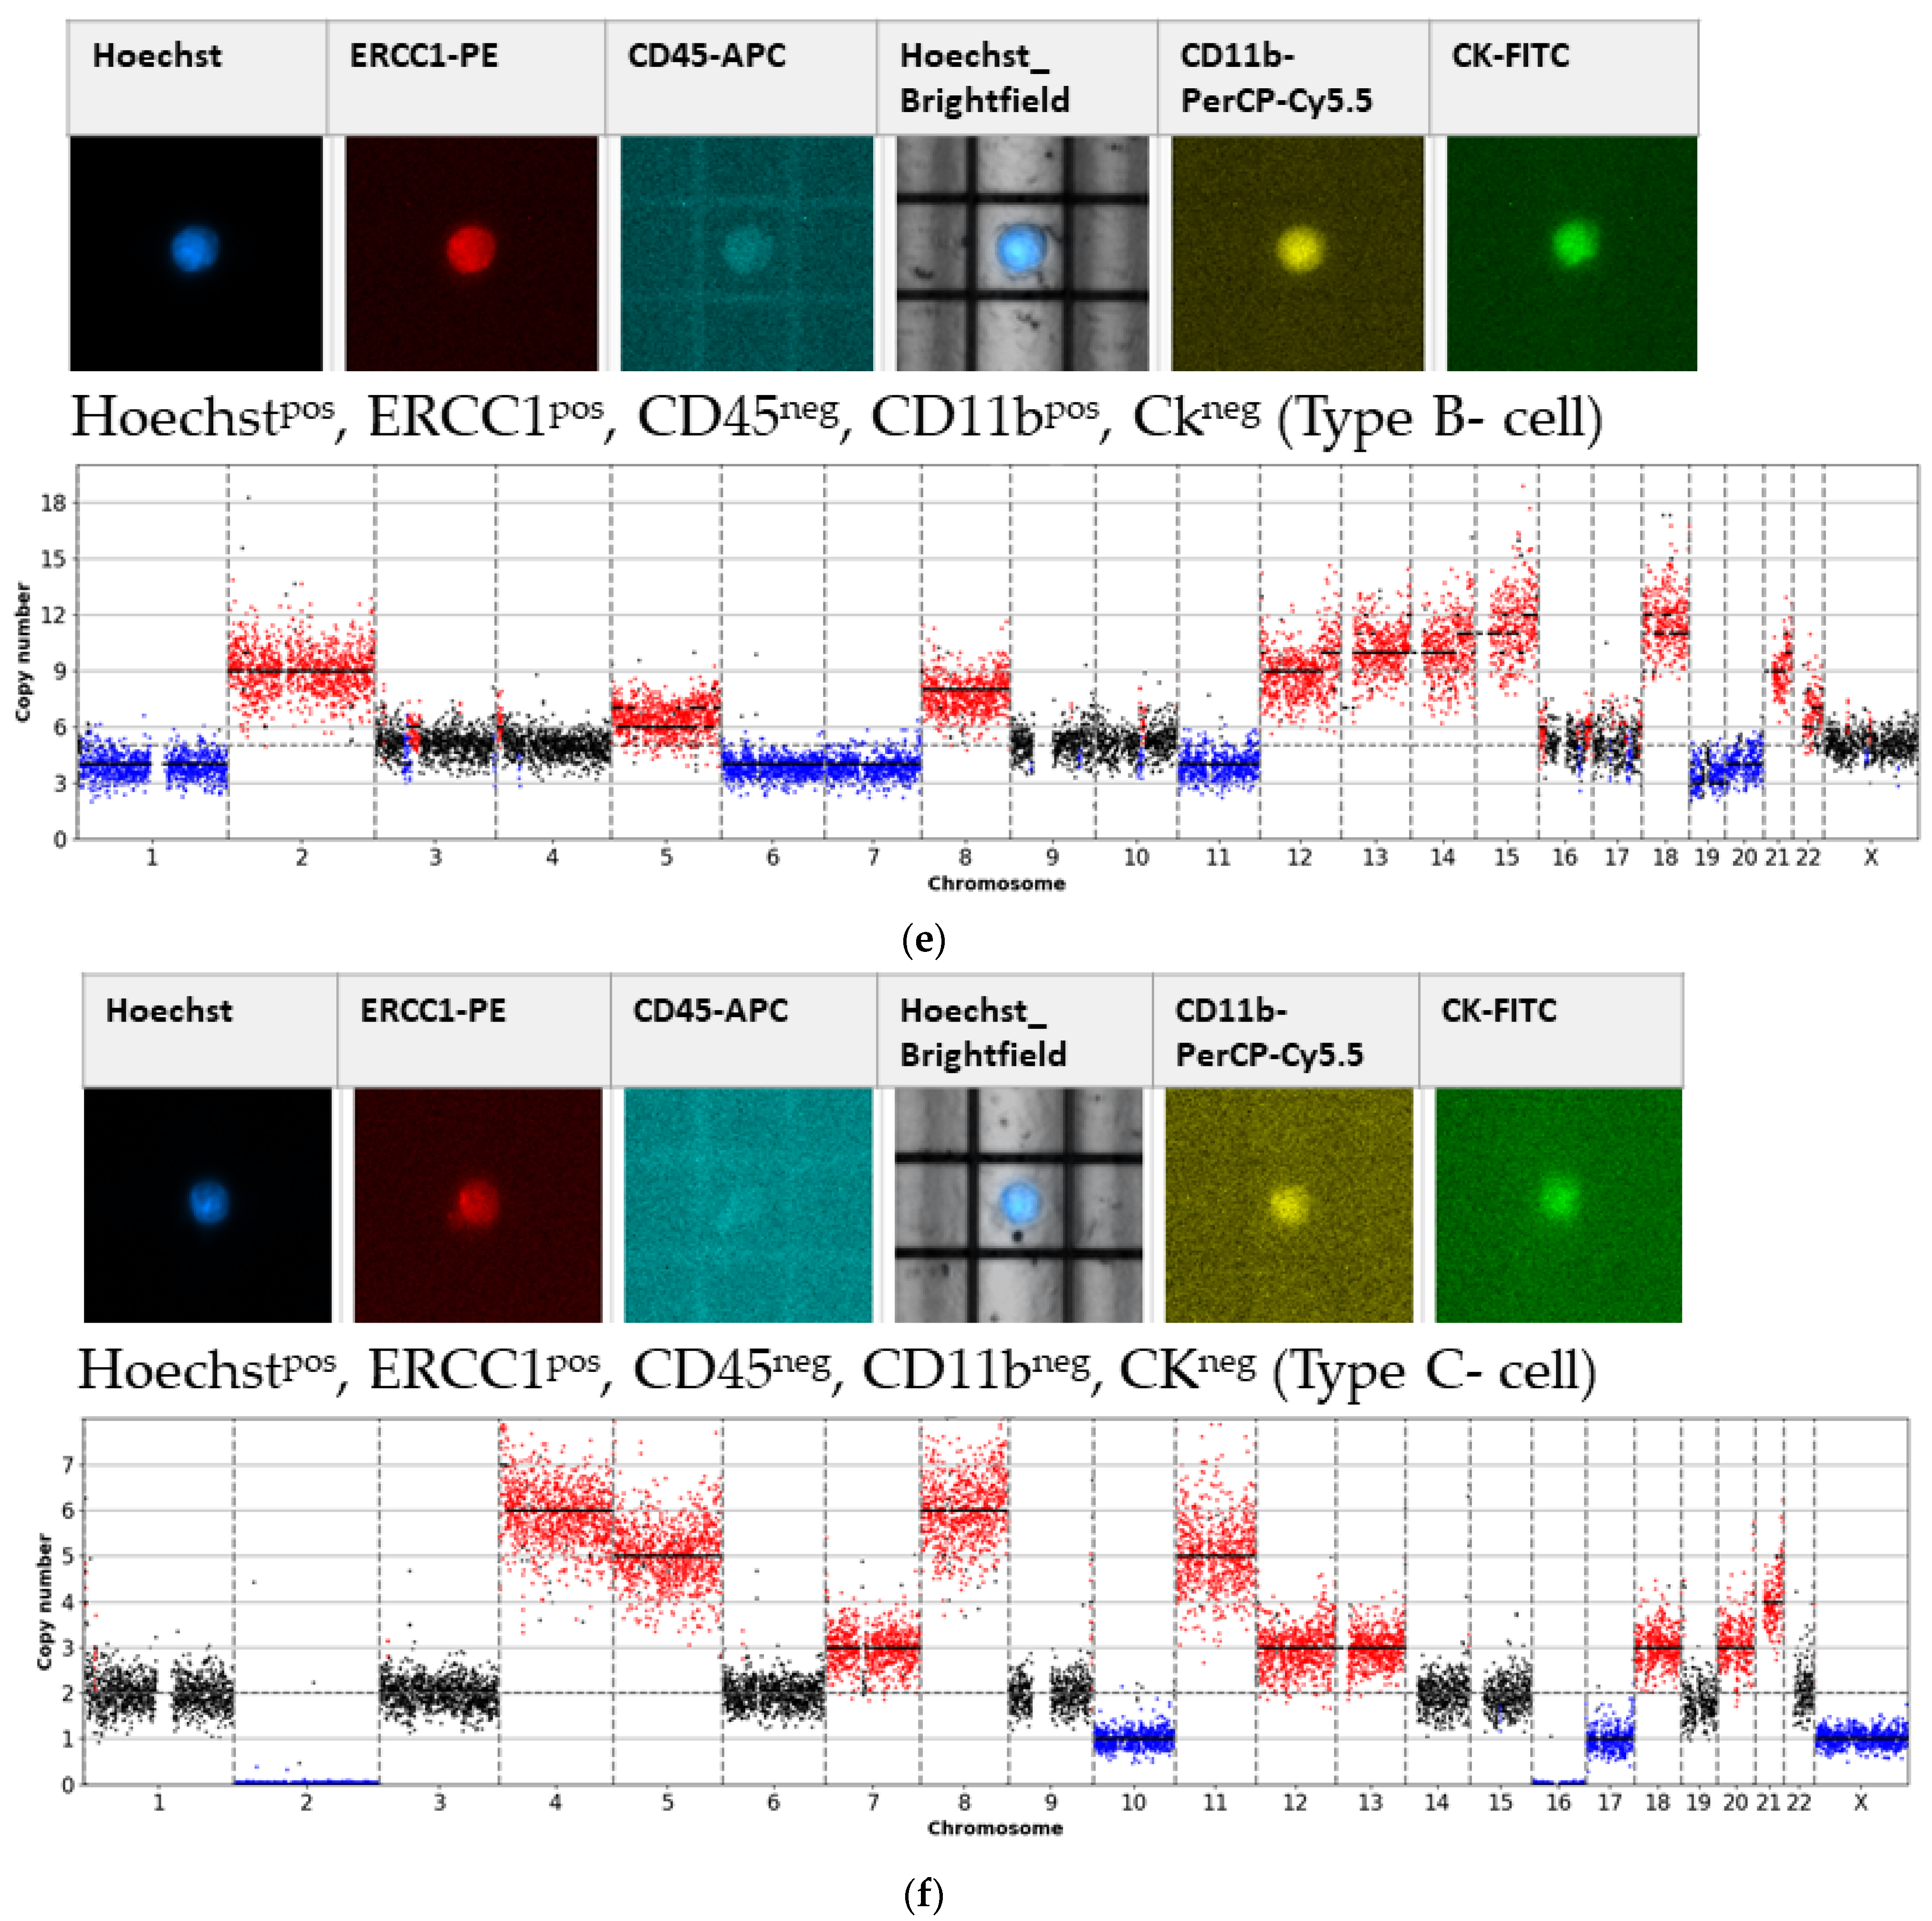
- Type B-cells (potential epithelial sCTC):Hoechstpos, ERCC1pos, CD45neg, CD11bpos, CKneg;
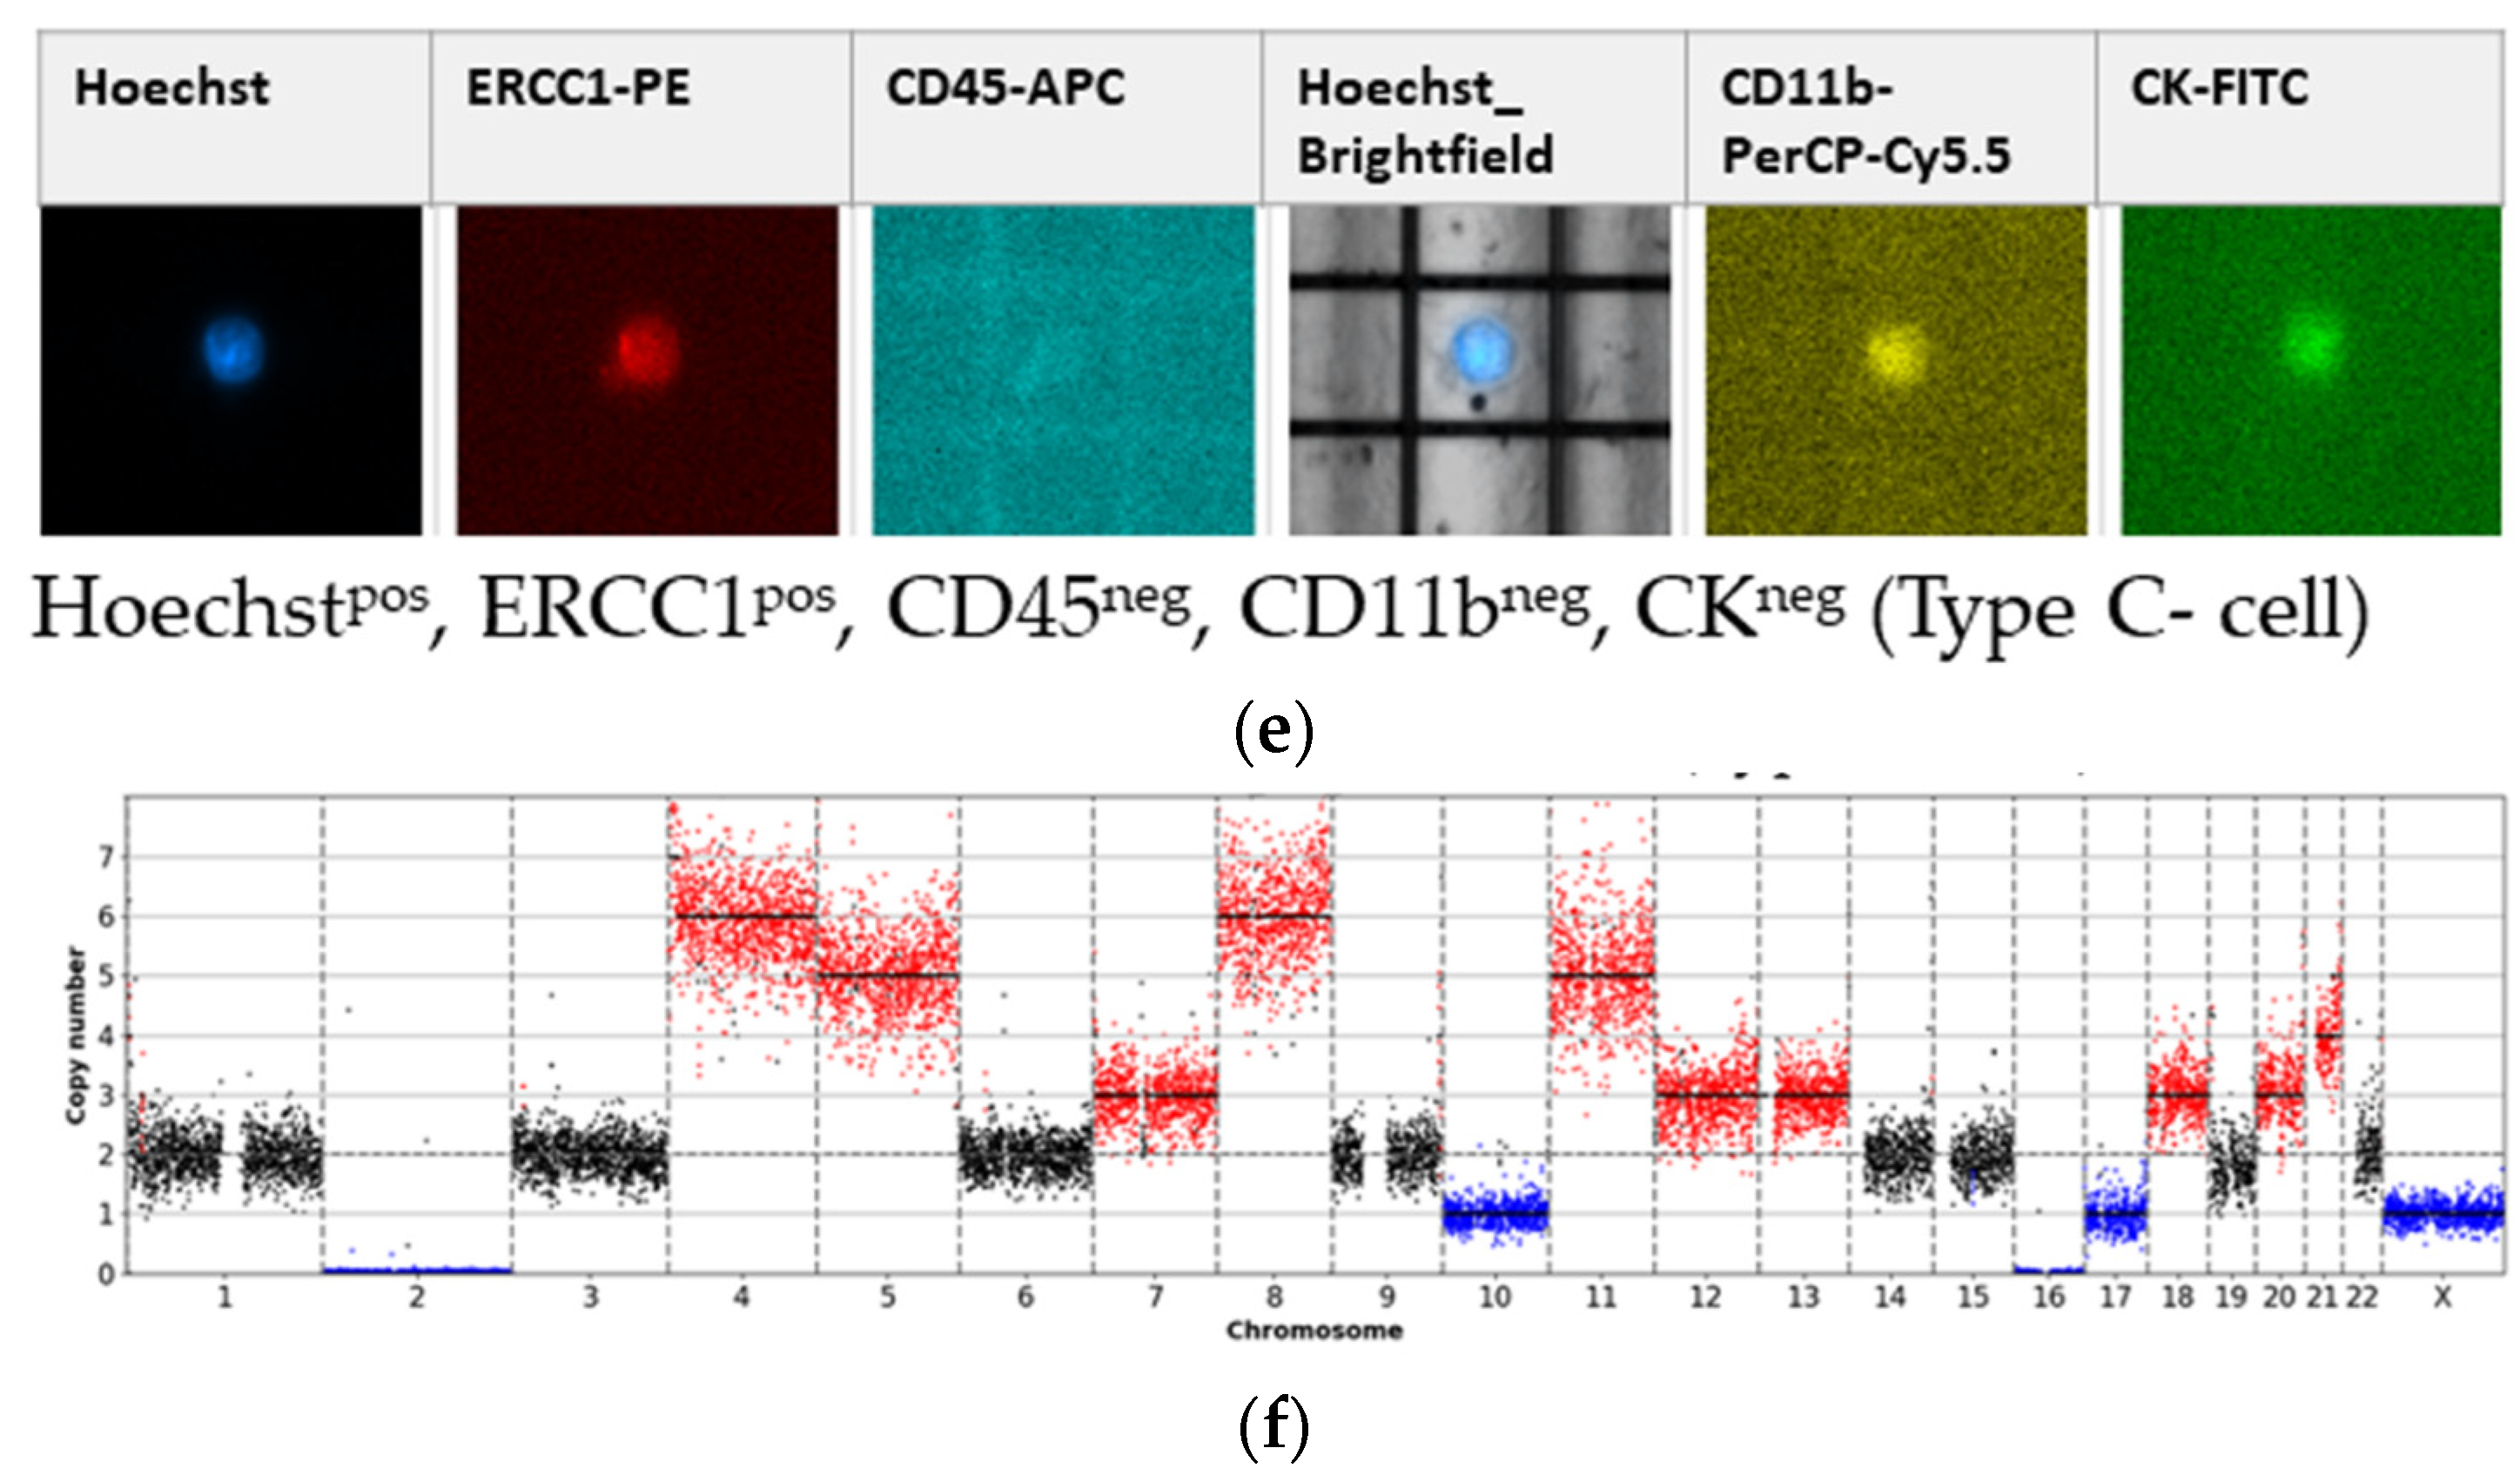
- Type C-cells (potential mesenchymal sCTC):Hoechstpos, ERCC1pos, CD45neg, CD11bneg, CKneg.
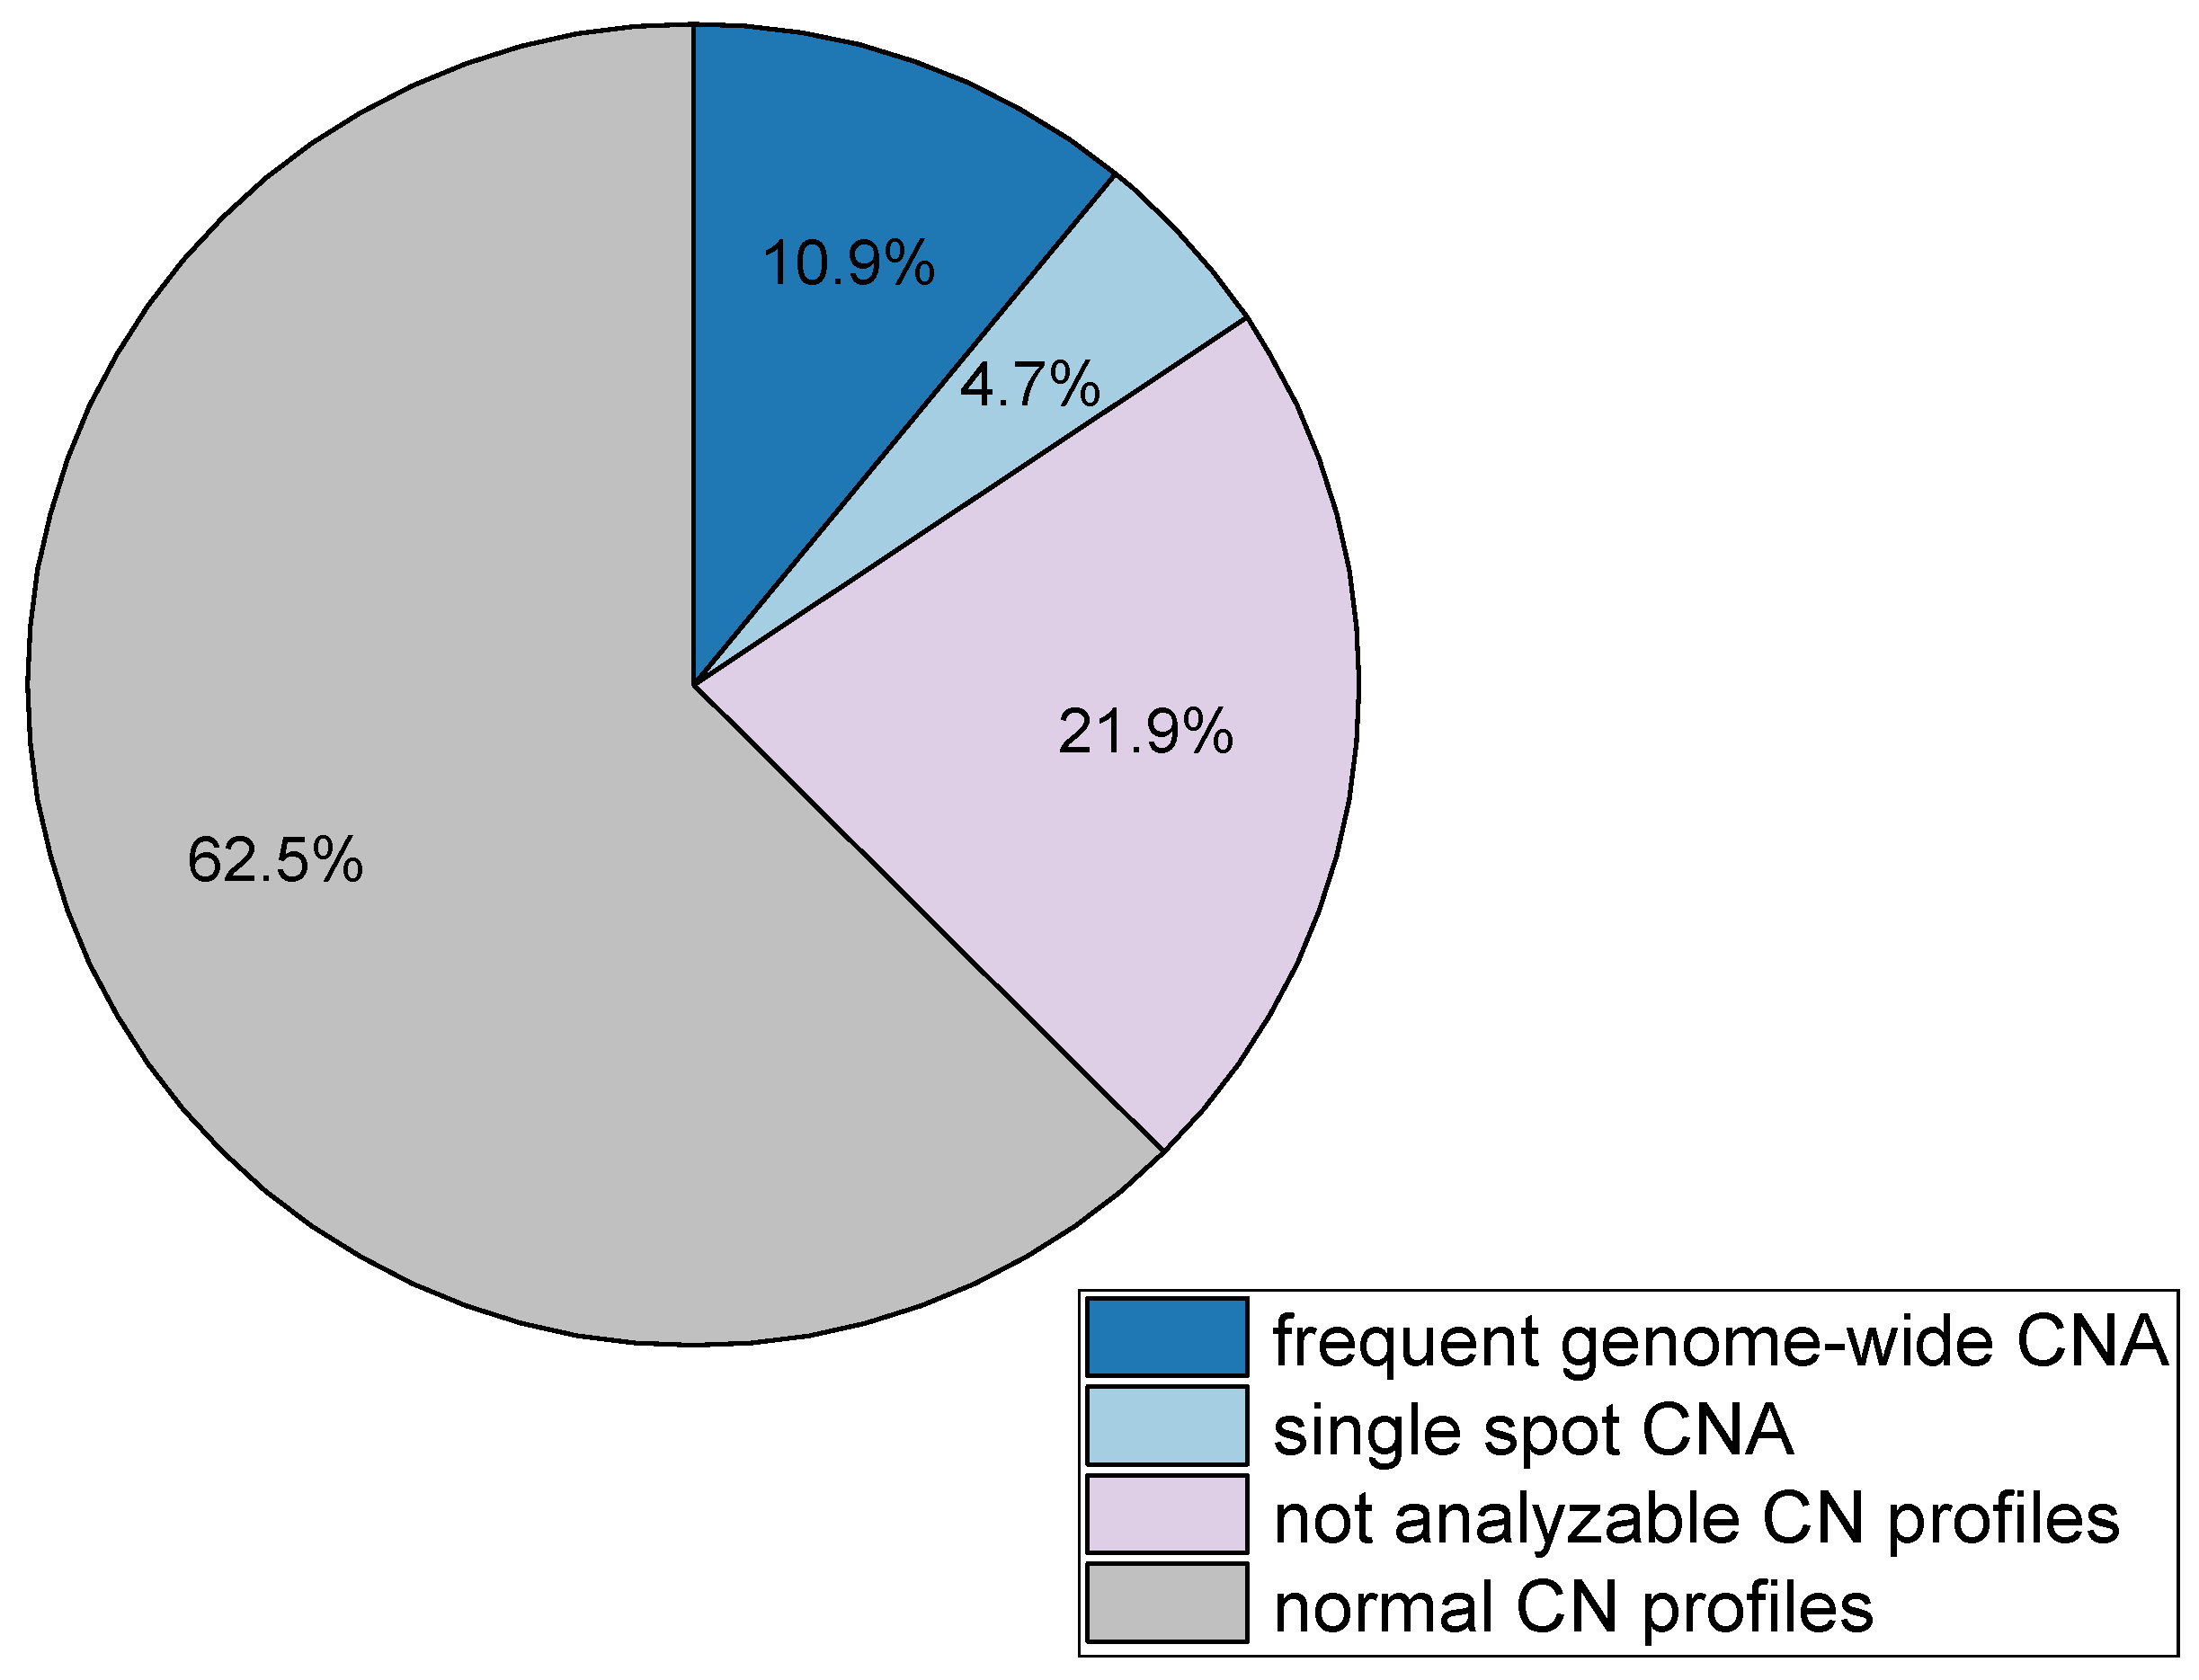
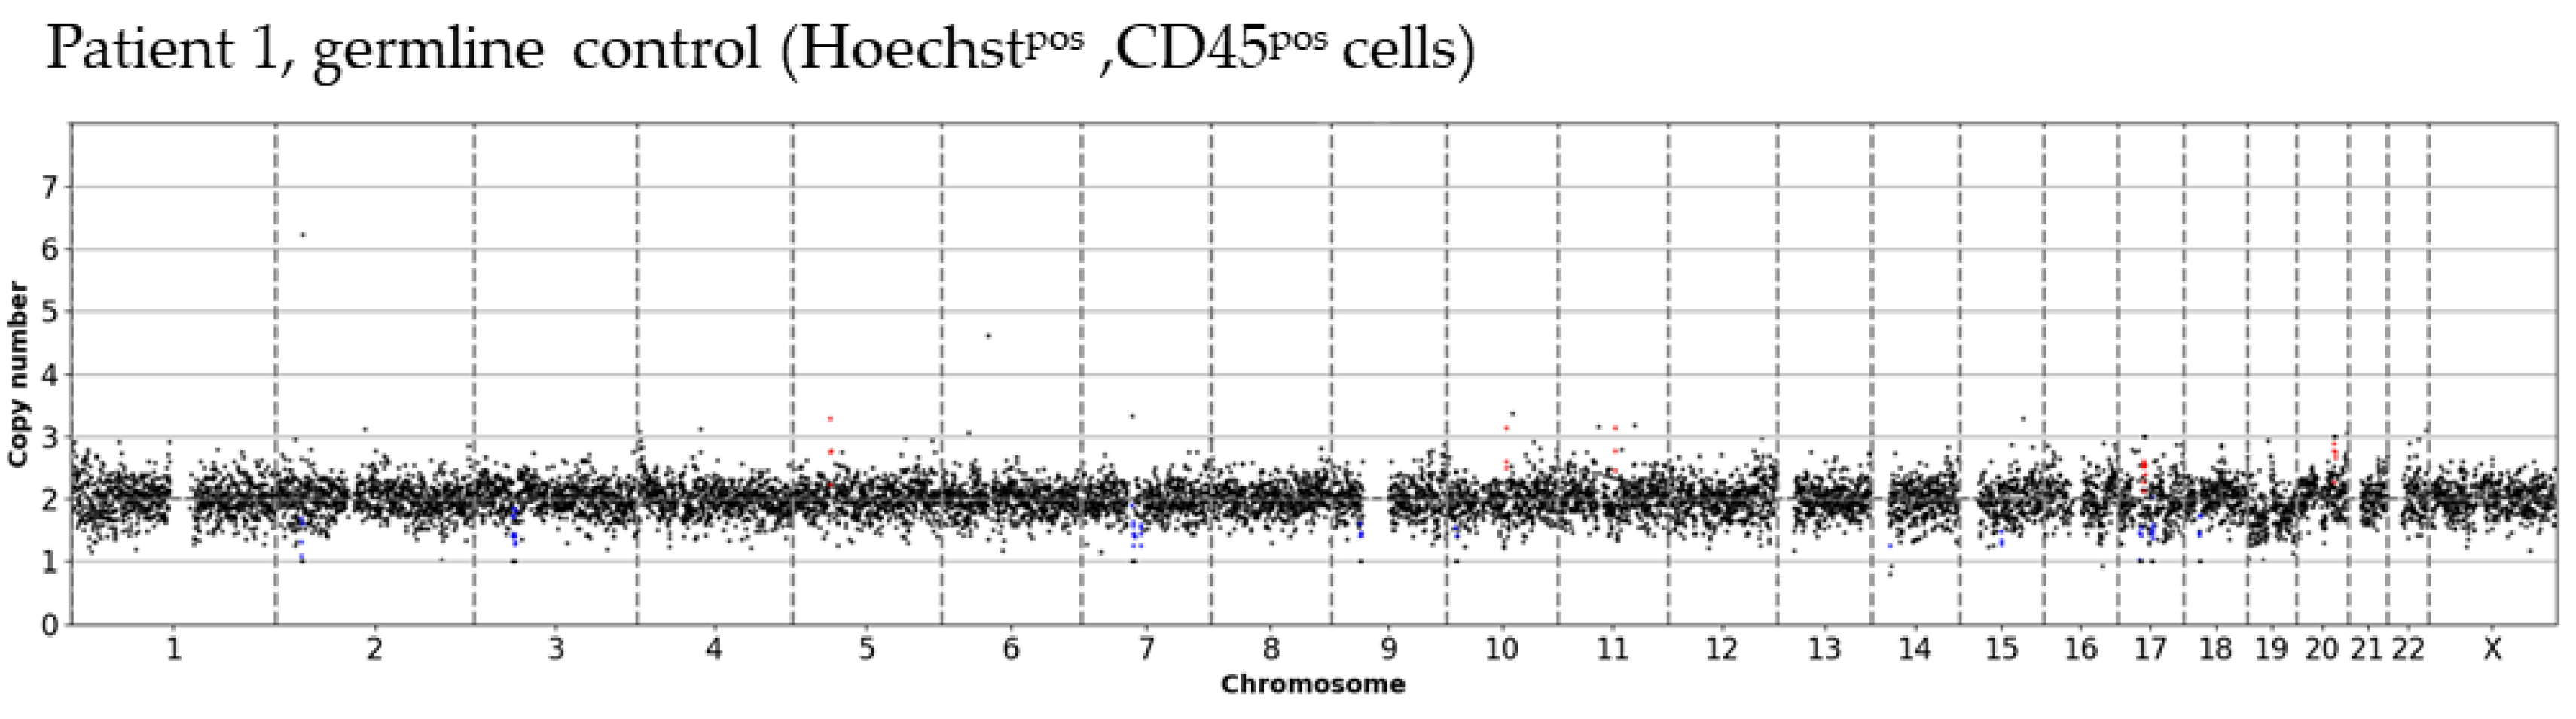
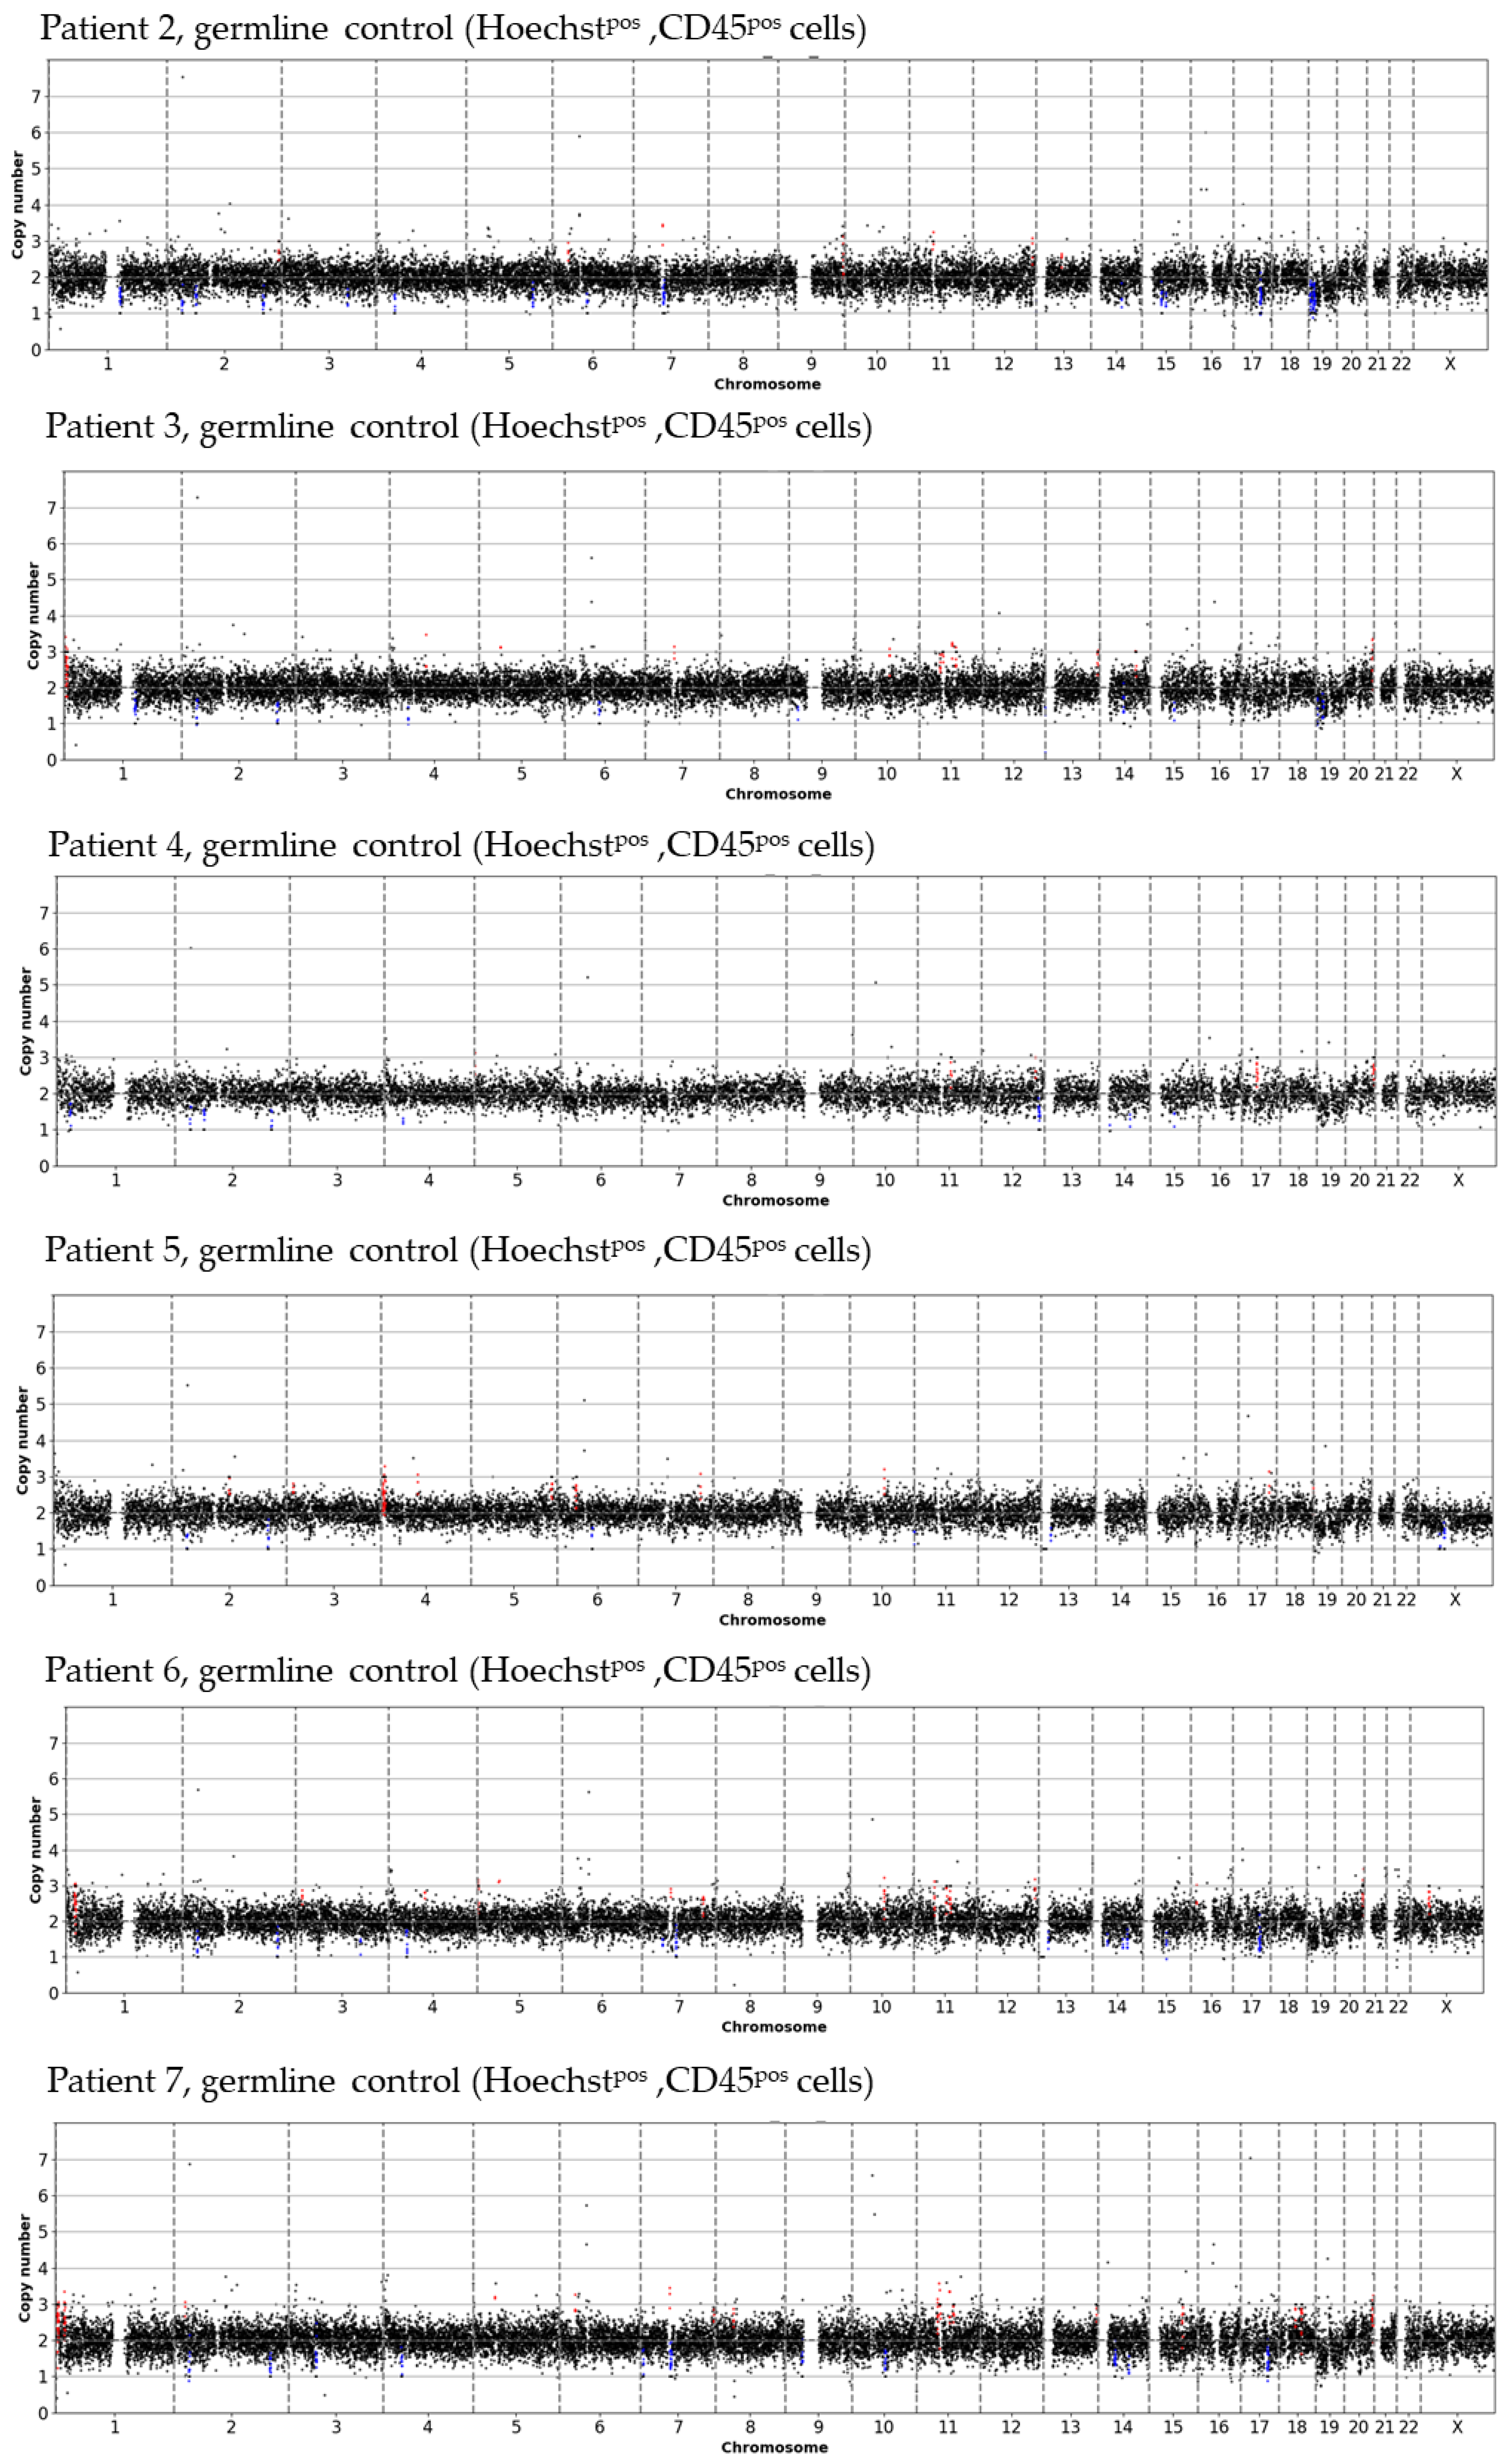
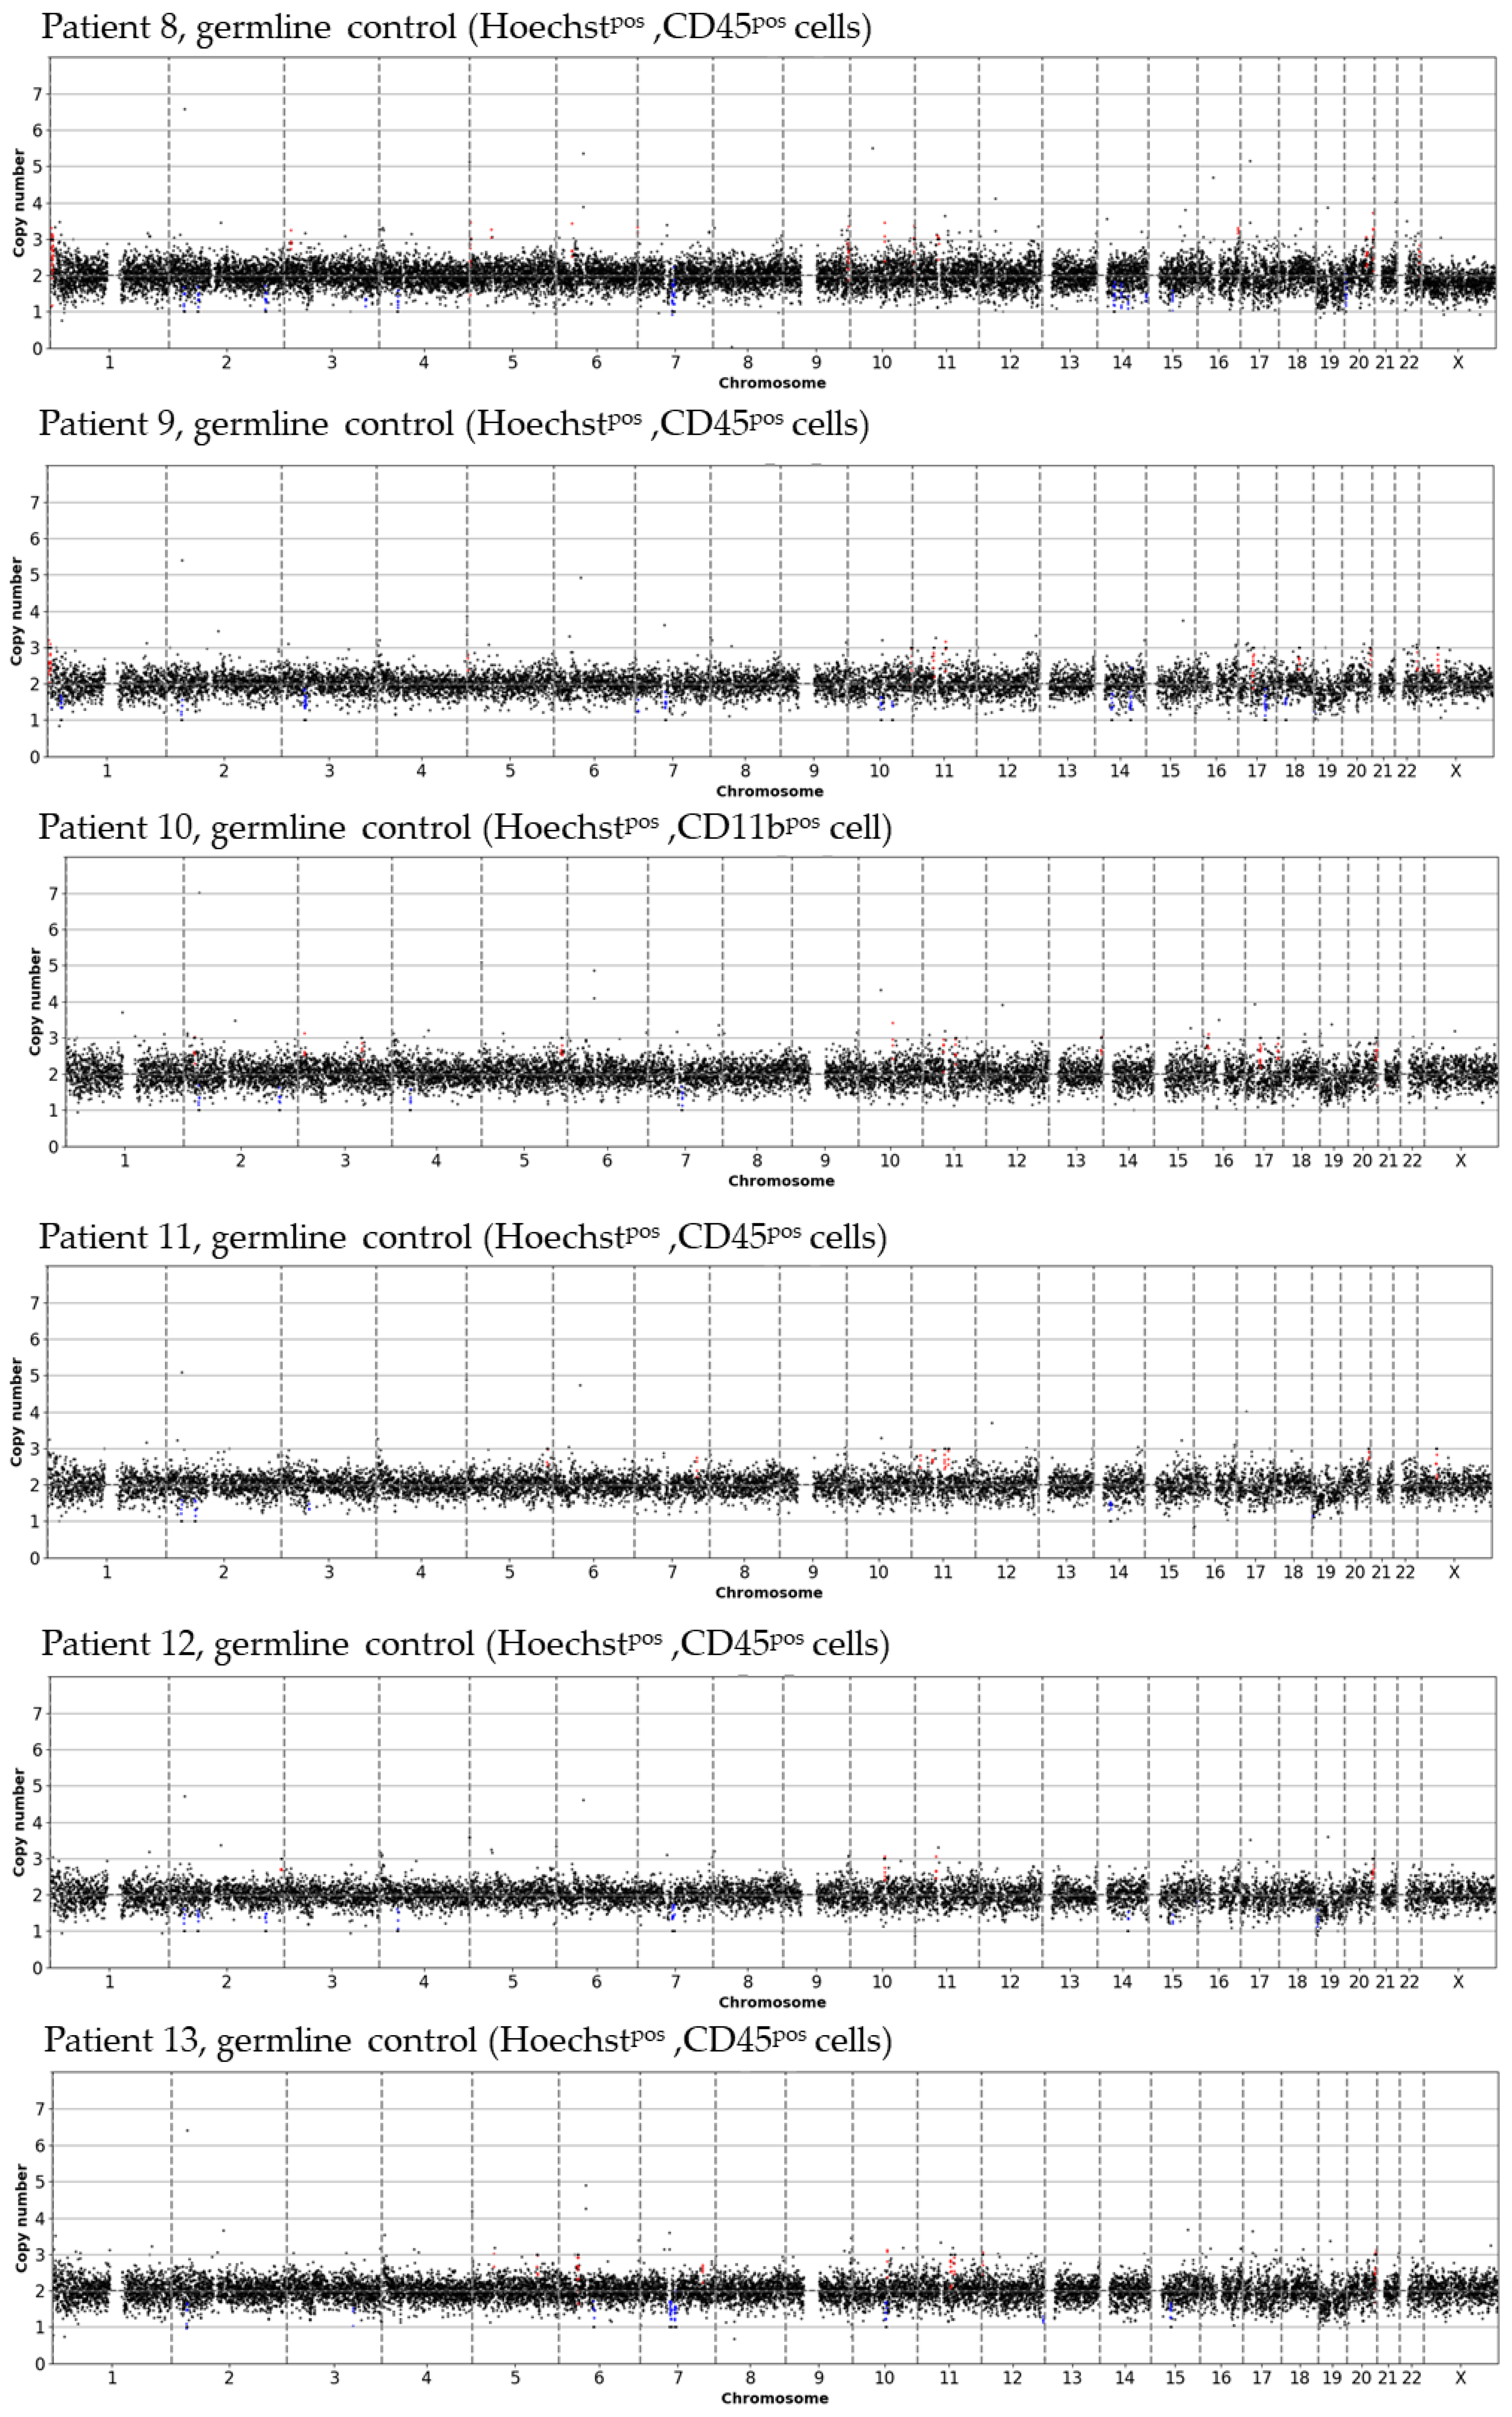
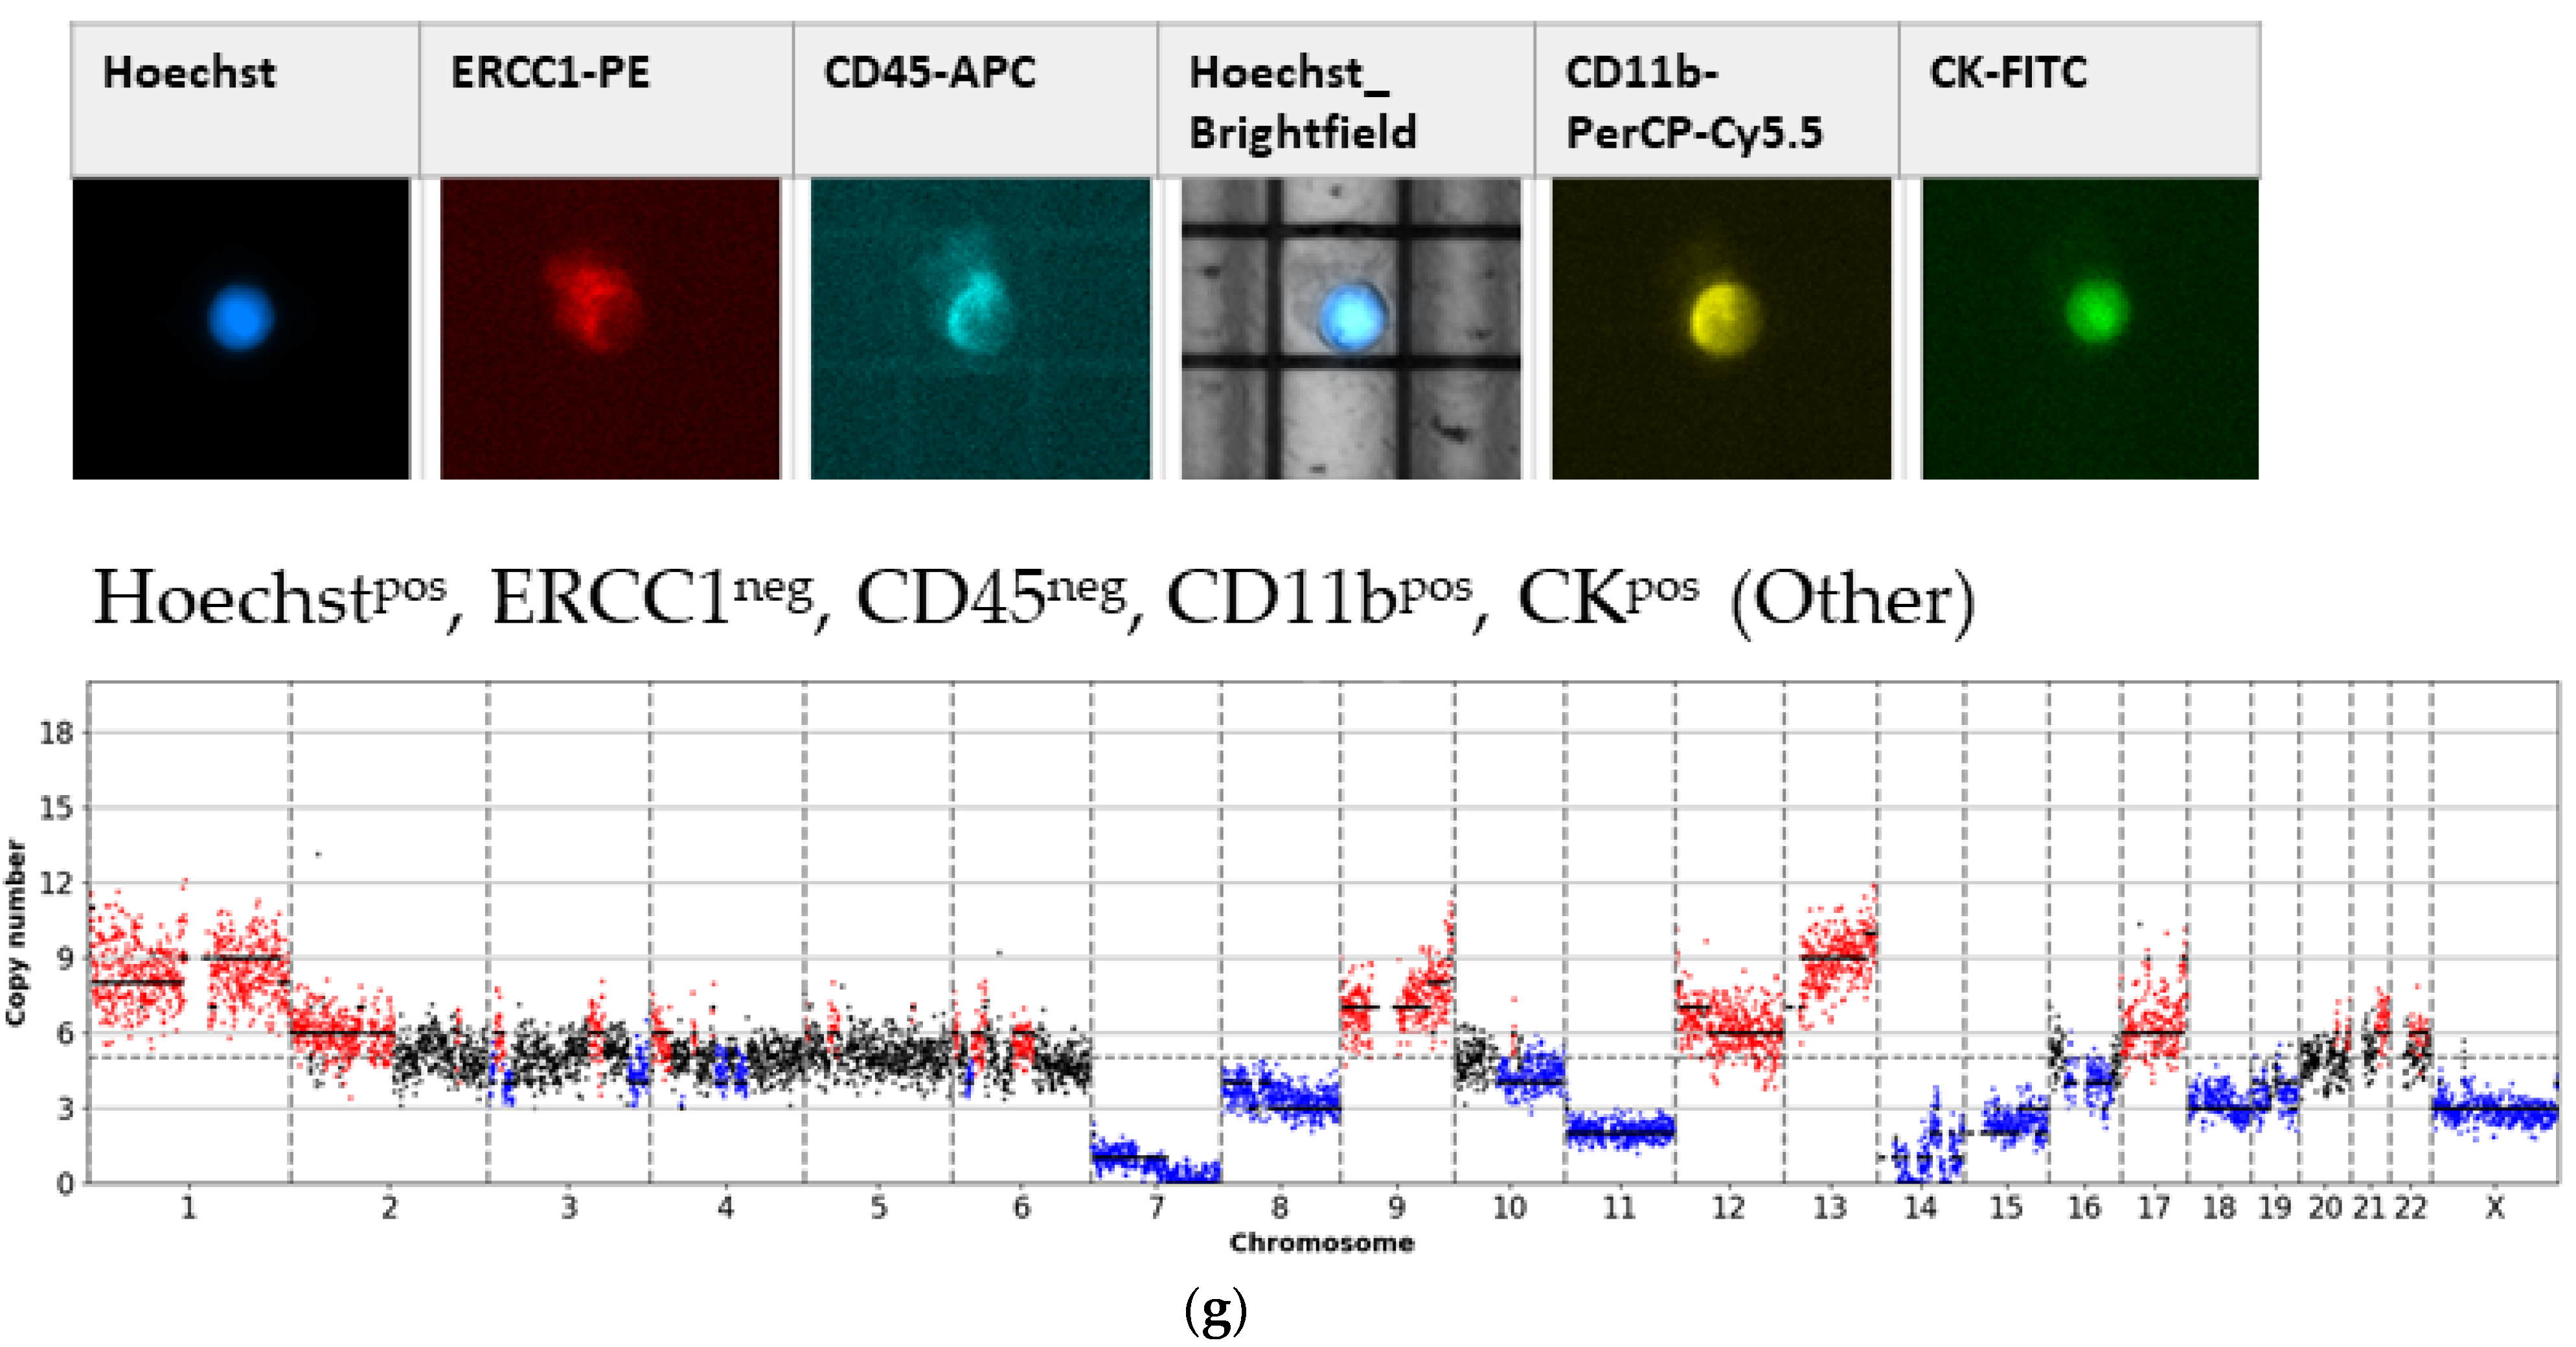
3.1. Detected Cell Types and Their Copy Number Alterations
3.2. Inter- and Intra-Patient Heterogeneity
4. Discussion
5. Conclusions
Author Contributions
Funding
Institutional Review Board Statement
Informed Consent Statement
Data Availability Statement
Acknowledgments
Conflicts of Interest
Appendix A


References
- Heintz, A.P.; Odicino, F.; Maisonneuve, P.; Quinn, M.A.; Benedet, J.L.; Creasman, W.T.; Ngan, H.Y.; Pecorelli, S.; Beller, U. Carcinoma of the ovary. Int. J. Gynecol. Obstet. 2006, 95, S161–S192. [Google Scholar] [CrossRef]
- The Cancer Genome Atlas Research Network. Integrated genomic analyses of ovarian carcinoma. Nature 2011, 474, 609–615. [Google Scholar] [CrossRef] [PubMed]
- Macintyre, G.; Goranova, T.E.; de Silva, D.; Ennis, D.; Piskorz, A.M.; Eldridge, M.; Sie, D.; Lewsley, L.-A.; Hanif, A.; Wilson, C.; et al. Copy number signatures and mutational processes in ovarian carcinoma. Nat. Genet. 2018, 1262–1270. [Google Scholar] [CrossRef] [PubMed]
- Lee, S.; Zhao, L.; Rojas, C.; Bateman, N.W.; Yao, H.; Lara, O.D.; Celestino, J.; Morgan, M.B.; Nguyen, T.V.; Conrads, K.A.; et al. Molecular analysis of clinically defined subsets of high-grade serous ovarian cancer. Cell Rep. 2020, 31, 107502. [Google Scholar] [CrossRef] [PubMed]
- Saed, G.M.; Fletcher, N.M.; Diamond, M.P.; Morris, R.T.; Gomez-Lopez, N.; Memaj, I. Novel expression of CD11b in epithelial ovarian cancer: Potential therapeutic target. Gynecol. Oncol. 2018, 148, 567–575. [Google Scholar] [CrossRef] [PubMed]
- Aktas, B.; Kasimir-Bauer, S.; Heubner, M.; Kimmig, R.; Wimberger, P. Molecular profiling and prognostic relevance of circulating tumor cells in the blood of ovarian cancer patients at primary diagnosis and after platinum-based chemotherapy. Int. J. Gynecol. Cancer 2011, 21, 822–830. [Google Scholar] [CrossRef]
- Obermayr, E.; Castillo-Tong, D.C.; Pils, D.; Speiser, P.; Braicu, I.; van Gorp, T.; Mahner, S.; Sehouli, J.; Vergote, I.; Zeillinger, R. Molecular characterization of circulating tumor cells in patients with ovarian cancer improves their prognostic significance—A study of the OVCAD consortium. Gynecol. Oncol. 2013, 128, 15–21. [Google Scholar] [CrossRef]
- Kuhlmann, J.D.; Wimberger, P.; Bankfalvi, A.; Keller, T.; Schöler, S.; Aktas, B.; Buderath, P.; Hauch, S.; Otterbach, F.; Kimmig, R.; et al. ERCC1-positive circulating tumor cells in the blood of ovarian cancer patients as a predictive biomarker for platinum resistance. Clin. Chem. 2014, 60, 1282–1289. [Google Scholar] [CrossRef] [Green Version]
- Chebouti, I.; Kuhlmann, J.D.; Buderath, P.; Weber, S.; Wimberger, P.; Bokeloh, Y.; Hauch, S.; Kimmig, R.; Kasimir-Bauer, S. ERCC1-expressing circulating tumor cells as a potential diagnostic tool for monitoring response to platinum-based chemotherapy and for predicting post-therapeutic outcome of ovarian cancer. Oncotarget 2017, 24303–24313. [Google Scholar] [CrossRef]
- Lianidou, E.S.; Strati, A.; Markou, A. Circulating tumor cells as promising novel biomarkers in solid cancers. Crit. Rev. Clin. Lab. Sci. 2014, 51, 160–171. [Google Scholar] [CrossRef]
- Abreu, M.; Cabezas-Sainz, P.; Alonso-Alconada, L.; Ferreirós, A.; Mondelo-Macía, P.; Lago-Lestón, R.M.; Abalo, A.; Díaz, E.; Palacios-Zambrano, S.; Rojo-Sebastian, A.; et al. Circulating tumor cells characterization revealed TIMP1 as a potential therapeutic target in ovarian cancer. Cells 2020, 9, 1218. [Google Scholar] [CrossRef] [PubMed]
- Obermayr, E.; Bednarz-Knoll, N.; Orsetti, B.; Weier, H.; Lambrechts, S.; Castillo-Tong, D.C.; Reinthaller, A.; Braicu, E.I.; Mahner, S.; Sehouli, J. Circulating tumor cells: Potential markers of minimal residual disease in ovarian cancer? A study of the OVCAD consortium. Oncotarget 2017, 106415–106428. [Google Scholar] [CrossRef] [PubMed]
- Yang, J.; Antin, P.; Berx, G.; Blanpain, C.; Brabletz, T.; Bronner, M.; Campbell, K.; Cano, A.; Casanova, J.; Christofori, G.; et al. Guidelines and definitions for research on epithelial-mesenchymal transition. Nat. Rev. Mol. Cell Biol. 2020, 21, 341–352. [Google Scholar] [CrossRef] [PubMed] [Green Version]
- Chebouti, I.; Kasimir-Bauer, S.; Buderath, P.; Wimberger, P.; Hauch, S.; Kimmig, R.; Kuhlmann, J.D. EMT-like circulating tumor cells in ovarian cancer patients are enriched by platinum-based chemotherapy. Oncotarget 2017, 48820–48831. [Google Scholar] [CrossRef] [Green Version]
- Po, J.W.; Roohullah, A.; Lynch, D.; DeFazio, A.; Harrison, M.; Harnett, P.R.; Kennedy, C.; de Souza, P.; Becker, T.M. Improved ovarian cancer EMT-CTC isolation by immunomagnetic targeting of epithelial EpCAM and mesenchymal N-cadherin. J. Circ. Biomark. 2018, 7, 1849454418782617. [Google Scholar] [CrossRef] [PubMed] [Green Version]
- Guo, Y.-X.; Neoh, K.H.; Chang, X.-H.; Sun, Y.; Cheng, H.-Y.; Ye, X.; Ma, R.-Q.; Han, R.P.S.; Cui, H. Diagnostic value of HE4+ circulating tumor cells in patients with suspicious ovarian cancer. Oncotarget 2018, 9, 7522–7533. [Google Scholar] [CrossRef] [PubMed]
- Kolostova, K.; Pinkas, M.; Jakabova, A.; Pospisilova, E.; Svobodova, P.; Spicka, J.; Cegan, M.; Matkowski, R.; Bobek, V. Molecular characterization of circulating tumor cells in ovarian cancer. Am. J. Transl. Res. 2016, 6, 973. [Google Scholar]
- Wu, Z.; Pan, Y.; Wang, Z.; Ding, P.; Gao, T.; Li, Q.; Hu, M.; Zhu, W.; Pei, R. A PLGA nanofiber microfluidic device for highly efficient isolation and release of different phenotypic circulating tumor cells based on dual aptamers. J. Mater. Chem. B 2021. [Google Scholar] [CrossRef]
- Keller, L.; Pantel, K. Unravelling tumour heterogeneity by single-cell profiling of circulating tumour cells. Nat. Rev. Cancer 2019, 19, 553–567. [Google Scholar] [CrossRef] [Green Version]
- Gao, Y.; Ni, X.; Guo, H.; Su, Z.; Ba, Y.; Tong, Z.; Guo, Z.; Yao, X.; Chen, X.; Yin, J.; et al. Single-cell sequencing deciphers a convergent evolution of copy number alterations from primary to circulating tumor cells. Genome Res. 2017, 27, 1312–1322. [Google Scholar] [CrossRef]
- Klein, C.A.; Schmidt-Kittler, O.; Schardt, J.A.; Pantel, K.; Speicher, M.R.; Riethmüller, G. Comparative genomic hybridization, loss of heterozygosity, and DNA sequence analysis of single cells. Proc. Natl. Acad. Sci. USA 1999, 96, 4494–4499. [Google Scholar] [CrossRef] [Green Version]
- Stoecklein, N.H.; Erbersdobler, A.; Schmidt-Kittler, O.; Diebold, J.; Schardt, J.A.; Izbicki, J.R.; Klein, C.A. SCOMP is superior to degenerated oligonucleotide primed-polymerase chain reaction for global amplification of minute amounts of DNA from microdissected archival tissue samples. Am. J. Pathol. 2002, 161, 43–51. [Google Scholar] [CrossRef] [Green Version]
- Polzer, B.; Medoro, G.; Pasch, S.; Fontana, F.; Zorzino, L.; Pestka, A.; Andergassen, U.; Meier-Stiegen, F.; Czyz, Z.T.; Alberter, B.; et al. Molecular profiling of single circulating tumor cells with diagnostic intention. EMBO Mol. Med. 2014, 6, 1371–1386. [Google Scholar] [CrossRef]
- Ferrarini, A.; Forcato, C.; Buson, G.; Tononi, P.; Del Monaco, V.; Terracciano, M.; Bolognesi, C.; Fontana, F.; Medoro, G.; Neves, R.; et al. A streamlined workflow for single-cells genome-wide copy-number profiling by low-pass sequencing of LM-PCR whole-genome amplification products. PLoS ONE 2018, 13, e0193689. [Google Scholar] [CrossRef] [PubMed]
- Joosse, S.A.; Hannemann, J.; Spötter, J.; Bauche, A.; Andreas, A.; Müller, V.; Pantel, K. Changes in keratin expression during metastatic progression of breast cancer: Impact on the detection of circulating tumor cells. Clin. Cancer Res. 2012, 18, 993–1003. [Google Scholar] [CrossRef] [PubMed] [Green Version]
- Cappelletti, V.; Verzoni, E.; Ratta, R.; Vismara, M.; Silvestri, M.; Montone, R.; Miodini, P.; Reduzzi, C.; Claps, M.; Sepe, P.; et al. Analysis of single circulating tumor cells in renal cell carcinoma reveals phenotypic heterogeneity and genomic alterations related to progression. Int. J. Mol. Sci. 2020, 21, 1475. [Google Scholar] [CrossRef] [PubMed] [Green Version]
- El Kebir, D.; Filep, J.G. Modulation of neutrophil apoptosis and the resolution of inflammation through β2 integrins. Front. Immunol. 2013, 4, 60. [Google Scholar] [CrossRef] [PubMed] [Green Version]
- Reduzzi, C.; Vismara, M.; Gerratana, L.; Silvestri, M.; de Braud, F.; Raspagliesi, F.; Verzoni, E.; Di Cosimo, S.; Locati, L.D.; Cristofanilli, M.; et al. The curious phenomenon of dual-positive circulating cells: Longtime overlooked tumor cells. Semin. Cancer Biol. 2020, 60, 344–350. [Google Scholar] [CrossRef]
- Loh, P.-R.; Genovese, G.; Handsaker, R.E.; Finucane, H.K.; Reshef, Y.A.; Palamara, P.F.; Birmann, B.M.; Talkowski, M.E.; Bakhoum, S.F.; McCarroll, S.A.; et al. Insights into clonal haematopoiesis from 8,342 mosaic chromosomal alterations. Nature 2018, 559, 350–355. [Google Scholar] [CrossRef]


| Patients | Age | FIGO | BRCA Mutation | Neoadjuvant 1 | Therapy | R0 Resection 2 |
|---|---|---|---|---|---|---|
| Patient 1 | 59 | IVa | No | No | Carbo/Pac + Bev 3 | Yes |
| Patient 2 | 77 | IIIC | n.a. | No | Carbo/Pac 4 | Yes |
| Patient 3 | 70 | IIC | No | Yes | Carbo/Pac | Yes |
| Patient 4 | 61 | IC | n.a. | No | Carbo/Pac | Yes |
| Patient 5 | 65 | IIIB | Yes | Yes | Carbo/Pac | No |
| Patient 6 | 57 | IA | n.a. | No | Carbo mono 5 | Yes |
| Patient 7 | 60 | IIIC | n.a. | No | Carbo/Pac + Bev | n.a. |
| Patient 8 | 72 | IIIB | n.a. | Yes | Carbo/Pac + Bev (DUO-O Study 6) | No |
| Patient 9 | 71 | IVb | n.a. | No | Carbo/Pac + Bev | Yes |
| Patient 10 | 52 | IVb | No | No | Carbo/Pac | Yes |
| Patient 11 | 60 | IVb | n.a. | No | Carbo/Pac + Bev | Yes |
| Patient 12 | 79 | IIIC | No | No | Carbo/Pac + Nira 7 | Yes |
| Patient 13 | 62 | IIB | No | No | Carbo/Pac | Yes |
Publisher’s Note: MDPI stays neutral with regard to jurisdictional claims in published maps and institutional affiliations. |
© 2021 by the authors. Licensee MDPI, Basel, Switzerland. This article is an open access article distributed under the terms and conditions of the Creative Commons Attribution (CC BY) license (https://creativecommons.org/licenses/by/4.0/).
Share and Cite
Salmon, C.; Levermann, J.; Neves, R.P.L.; Liffers, S.-T.; Kuhlmann, J.D.; Buderath, P.; Kimmig, R.; Kasimir-Bauer, S. Image-Based Identification and Genomic Analysis of Single Circulating Tumor Cells in High Grade Serous Ovarian Cancer Patients. Cancers 2021, 13, 3748. https://doi.org/10.3390/cancers13153748
Salmon C, Levermann J, Neves RPL, Liffers S-T, Kuhlmann JD, Buderath P, Kimmig R, Kasimir-Bauer S. Image-Based Identification and Genomic Analysis of Single Circulating Tumor Cells in High Grade Serous Ovarian Cancer Patients. Cancers. 2021; 13(15):3748. https://doi.org/10.3390/cancers13153748
Chicago/Turabian StyleSalmon, Carolin, Janina Levermann, Rui P. L. Neves, Sven-Thorsten Liffers, Jan Dominik Kuhlmann, Paul Buderath, Rainer Kimmig, and Sabine Kasimir-Bauer. 2021. "Image-Based Identification and Genomic Analysis of Single Circulating Tumor Cells in High Grade Serous Ovarian Cancer Patients" Cancers 13, no. 15: 3748. https://doi.org/10.3390/cancers13153748