Article

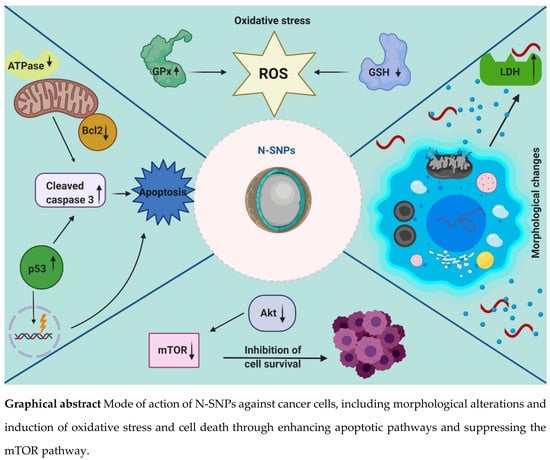
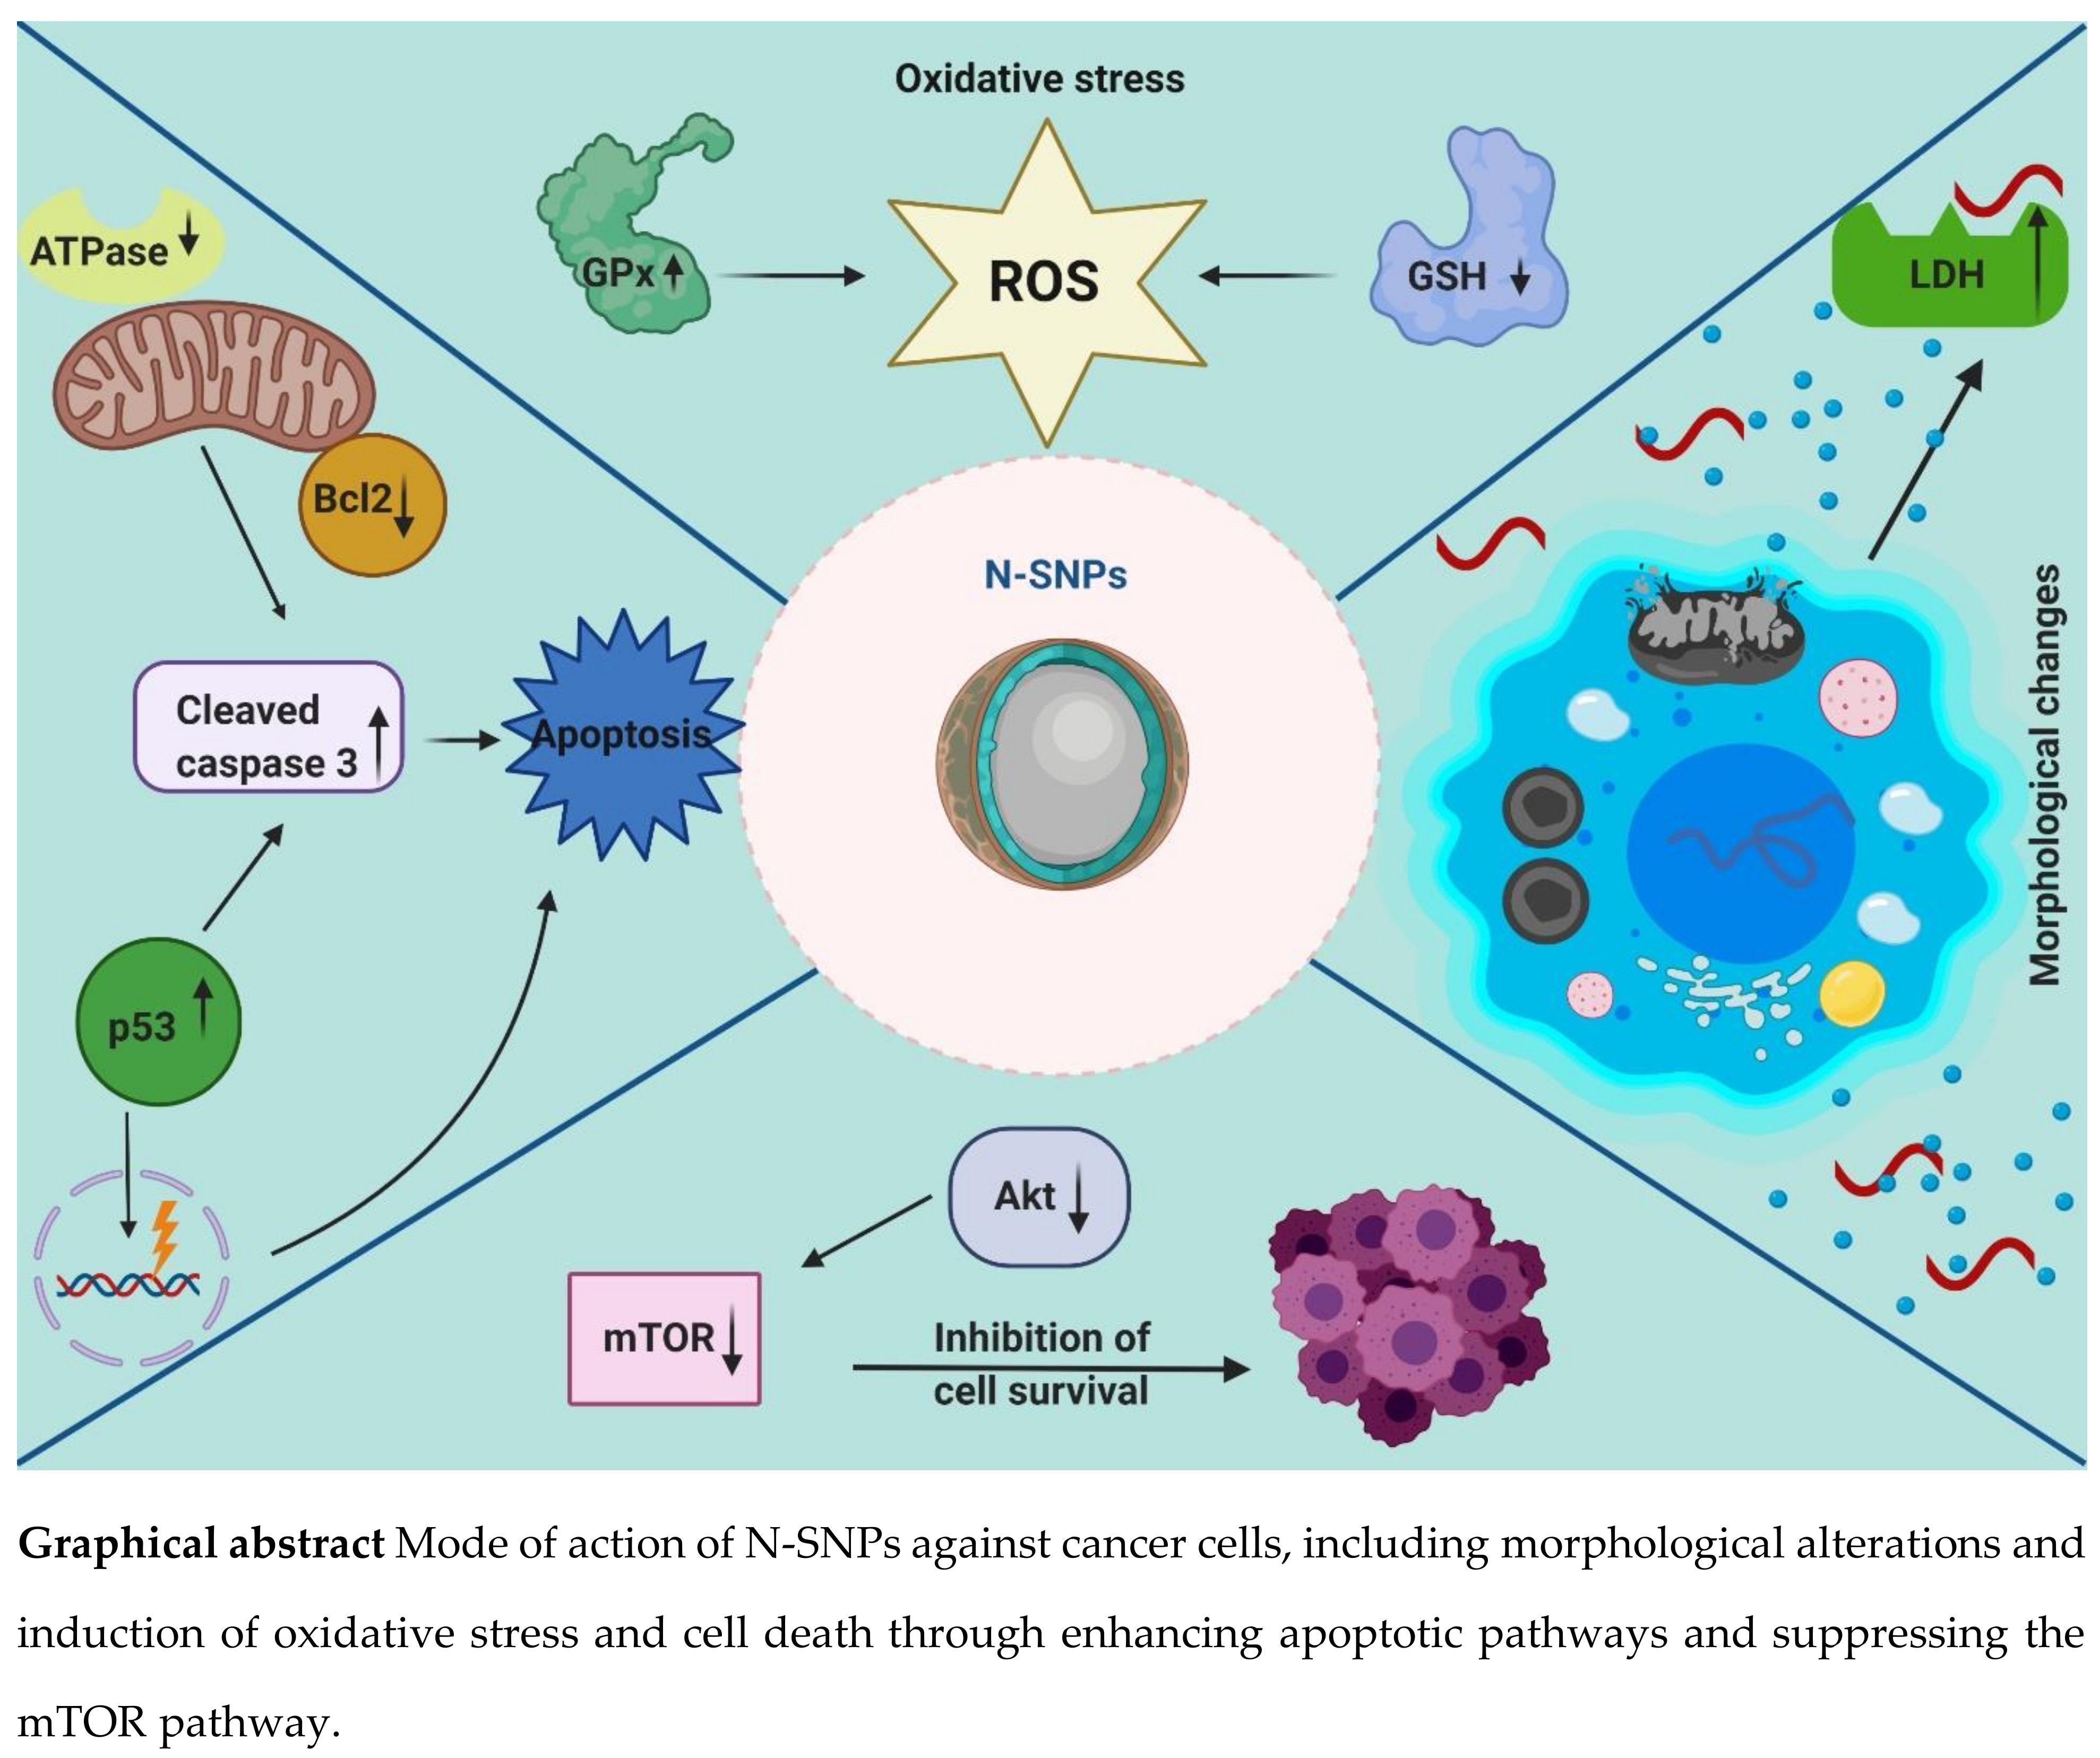
Oxidative Stress and Apoptotic Responses Elicited by Nostoc-Synthesized Silver Nanoparticles against Different Cancer Cell Lines

by
Reham Samir Hamida
1,*,†,
Gadah Albasher
2 and
Mashael Mohammed Bin-Meferij
3,*,†
1
Molecular Biology Unit, Department of Zoology, Faculty of Science, Alexandria University, Alexandria 21500, Egypt
2
Zoology Department, College of Science, King Saud University, Riyadh 11543, Saudi Arabia
3
Department of Biology, College of Science, Princess Nourah bint Abdulrahman University, Riyadh 11543, Saudi Arabia
*
Authors to whom correspondence should be addressed.
These authors contributed equally to this work.
Cancers 2020, 12(8), 2099; https://doi.org/10.3390/cancers12082099
Submission received: 2 July 2020 / Revised: 19 July 2020 / Accepted: 22 July 2020 / Published: 28 July 2020

Abstract

:
Green nanoparticles represent a revolution in bionanotechnology, providing opportunities to fight life-threatening diseases, such as cancer, with less risk to the environment and to human health. Here, for the first time, we systematically investigated the anticancer activity and possible mechanism of novel silver nanoparticles (N-SNPs) synthesized by Nostoc Bahar M against the MCF-7 breast cancer cells, HCT-116 colorectal adenocarcinoma cells, and HepG2 liver cancer cells, using cell viability assays, morphological characterization with inverted light and transmission electron microscopy, antioxidants and enzymes (glutathione peroxidase (GPx), glutathione (GSH), adenosine triphosphatase (ATPase), and lactate dehydrogenase (LDH)), and western blotting (protein kinase B (Akt), phosphorylated-Akt (p-Akt), mammalian target of rapamycin (mTOR), B-cell lymphoma 2 (Bcl-2), tumor suppressor (p53), and caspase 3). N-SNPs decreased the viability of MCF-7, HCT-116, and HepG2 cells, with half-maximal inhibitory concentrations of 54, 56, and 80 µg/mL, respectively. They also significantly increased LDH leakage, enhanced oxidative stress via effects on antioxidative markers, and caused metabolic stress by significantly decreasing ATPase levels. N-SNPs caused extensive ultrastructural alterations in cell and nuclear structures, as well as in various organelles. Furthermore, N-SNPs triggered apoptosis via the activation of caspase 3 and p53, and suppressed the mTOR signaling pathway via downregulating apoptosis-evading proteins in MCF-7, HCT-116, and HepG2 cells. Ultrastructural analysis, together with biochemical and molecular analyses, revealed that N-SNPs enhanced apoptosis via the induction of oxidative stress and/or through direct interactions with cellular structures in all tested cells. The cytotoxicity of Nostoc-mediated SNPs represents a new strategy for cancer treatment via targeting various cell death pathways. However, the potential of N-SNPs to be usable and biocompatible anticancer drug will depend on their toxicity against normal cells.

Graphical Abstract

1. Introduction

Cancer has a major impact on human life today, owing to enormous changes in lifestyle, and it is the second leading cause of death worldwide [1]. Normal cells avoid undergoing tumorigenesis through the regulation of cellular mechanisms underlying vital processes, such as proliferation and cellular growth; however, any deviations in these processes may result in cancer [2]. Cancer cells have the ability to evade apoptosis via controlling the expression of certain genes; that is, the upregulation of the expression of genes that favor survival and proliferation, and downregulation of genes that are responsible for the regulation of cell death pathways [3]. Conventional anticancer therapies, such as chemotherapeutic drugs, radiation, and surgery, are successful to some extent, but their use is limited by serious adverse effects and poor diagnosis, and by the potential for cancer cells to develop resistance to chemotherapeutic drugs [4].
Thus, there is a need for new and more effective therapies to fight this disease. Nanotechnology has been used to develop next-generation platforms for cancer diagnosis, therapy, and management [5,6,7]. The nano-revolution affords opportunities for researchers to create, improve, and develop nanoparticle (NP)-based products for use in many medical domains, including pharmaceutical applications, drug delivery, bioimaging, biolabeling, diagnostics, and medical nanodevices [8]. Nanotechnology also allows to us to clearly understand the interactions between nanoscale materials or particles and living cells, in order to create medical solutions to various serious diseases [9]. Furthermore, progress in materials and protein technology has led to a new nanoscale targeting method that may increase the safety and efficiency of therapies for cancer patients [10].
Unlike small-molecule drugs, NPs are distinguished by unique physicochemical features, including a large surface area to volume ratio, permitting these particles to easily penetrate living cells [11]. This makes NPs suitable as both therapeutic agents and detection tools in many diseases, including cancer and infectious diseases [7,12,13]. The large surface areas of NPs also facilitate the modification of their surface by conjugation or loading with target molecules for sensing or delivery in therapeutic applications [14,15,16]. Multiple synthetic methods exist to generate NPs, including physical, chemical, and biological routes [17]. The physicochemical approaches have been used to create NPs of various shapes and sizes, with important agricultural, industrial, and medical applications [18,19]. However, these physicochemical methods use toxic chemicals for capping and reduction during the fabrication of NPs, which threaten the environment. Moreover, these toxic materials remain conjugated to the surfaces of the synthesized NPs, which reduces their biosafety to normal living cells [18,20]. Green synthesis methods have emerged to overcome these limitations.
In green synthesis approaches, the synthesis process mimics phenomena that occur in nature. Many living organisms, including bacteria [21], fungi [22], plants [23], and cyanobacteria [24], are able to convert bulk materials in their environment into nanoscale materials. Thus, in the laboratory, to prepare NPs via biological synthesis, the bulk material of interest (as a salt) is reduced using natural sources of reducing and stabilizing agents (macro- or microorganisms, or biomolecules, such as vitamins, proteins, and enzymes) [25]. This process is easy to perform and it requires no toxic material, as well as having the advantages of low cost and low energy consumption, and it is ecofriendly [18]. Several studies have reported that biogenic NPs have low toxicity against normal cells [26,27]. El-Naggar et al. [28] showed that SNPs synthesized using phycobiliprotein that was extracted from Nostoc sp. had fewer cytotoxic effects against normal WI38 and WISH cells as compared with 5-fuorouracil (a standard anticancer drug).
Silver NPs (SNPs) have unique physicochemical and biological features that make them attractive in various domains, including medicine, agriculture, and industry [18]. These particles are also a promising alternative therapeutic agents against many diseases, including microbial and viral infections [12,29,30] and cancer [24], and for the treatment of burns [31]. For example, an SNP-based bandage approved by the Food and Drug Administration as a treatment for burns is already commercially available under the trade name of Acticoat [31]. Moreover, several studies have reported the antiproliferative activity of SNPs toward different types of cancer cells, including MCF-7, HepG2, Caco-2, and HCT-116 cells [32,33].
The detailed mechanism by which NPs kill cancer cells is still under investigation. However, several studies attributed the bioactivity of NPs against cancer cells to two general strategies: (i) direct influence, in which the NPs interact directly with cellular components (proteins, DNA, antioxidants, enzymes, etc.) and cellular structures (such as cell membranes and organelles), leading to enhanced cell death [34] and (ii) indirect influence, in which the NPs induce the production of reactive oxygen species (ROS). This results in intensive oxidative stress, which causes DNA damage and protein modification and degradation, as well as imbalance in enzyme activities causing metabolic toxicity and cellular dysfunctions that finally lead to cell death [35,36]. Gopinath et al. [37] showed that SNPs disrupted normal cellular functions and membrane integrity, enhancing various apoptotic signaling genes of living cells and, thus, causing apoptosis. Satapathy et al. [36] reported that SNPs are bona fide anticancer drugs that act in a p53-dependent manner. Sanpui et al. [9] showed that a chitosan nanocarrier-based delivery of SNPs induced apoptosis in HT-29 cells by increasing production of ROS and stimulating caspase signaling pathways. This ability of SNPs to enhance apoptosis has the potential to be exploited in nanomedicine, as programmed cell death is key to overcoming diseases, including cancer [9,38].
Here, we have systematically screened for the first time the anticancer potential of green novel SNPs synthesized by Nostoc Bahar M (N-SNPs) against three different cancer cell lines (MCF-7, HepG2, and HCT-116) and further explored the underlying mechanisms. The cytotoxicity of N-SNPs against cancer cells was investigated by cell viability assays and morphological analyses using inverted light and electron microscopes. Analyses of antioxidants (glutathione (GSH) and glutathione peroxidase (GPx)) and enzymes (lactate dehydrogenase (LDH) and adenosine triphosphatase (ATPase)) were also performed. To investigate the multiplex origins of N-SNP-mediated apoptosis, the protein expression levels of anti-apoptotic markers (Akt, p-Akt, mTOR, and Bcl-2) and apoptotic markers (p53 and caspase 3) were determined. The results suggest that the N-SNPs are potential ecofriendly bona fide anticancer drugs and provide insight into the molecular mechanism of the cytotoxicity of Nostoc-mediated SNPs against cancer cells.

2. Material and Methods

2.1. Materials

The MCF-7, HCT-116, and HepG2 cells were procured from the Medical Research Institute, Alexandria, Egypt. All cell culture reagents, media, and standard chemicals were procured from Sigma–Aldrich (St. Louis, MO, USA); the LDH assay kit (Colorimetric) and all antibodies (Table 1) were from Abcam (Cambridge, UK); and, the PiBind resin was from Expedeon (San Diego, CA, USA).

2.2. Methods

2.2.1. Preparation of N-SNP Suspension

The methods used for extracellular synthesis of SNPs using Nostoc Bahar M sp. and for their physicochemical characterization are described in a previous publication [24]. In brief, Nostoc sp. culture was harvested and washed by centrifugation at 4000 rpm and the biomass pellets collected. Afterward, the pellets were freeze-dried and then crushed into fine powder utilizing a mortar and pestle. 20 mg of cyanobacterial powder was mixed with 20 mL of distilled water to boil at 30 °C for 24 h. The mixture was filtrated while using Whatman filter paper no.1 (Camlab, Cambridge, UK) and 10 mL of filtrate mixed with 90 mL of 1 mM of silver nitrate aqueous solution at ambient temperature for 24 h in the dark. After 24 h, the pellets were harvested and then washed at least three time using centrifugation at 10000 rpm. Afterward, the resultant pellets were spread on plates to dry at 40 °C for 24 h.
The SNPs appear as a fine black powder, with the particles having spherical shape and sizes that range between 8.5 and 26.44 nm (nanosize), with a mean size of 14.9 ± 0.56 nm. A stock solution of N-SNPs (1 mg/mL) was prepared in aspect complete Dulbecco’s modified Eagle’s medium (DMEM) and diluted to the required concentrations with cell culture medium. The N-SNP solution was filtrated using a 0.22-µm sterile microfilter before being injected into cancer cells.

2.2.2. Cell Culture

MCF-7 breast cancer cells, HCT-116 colorectal adenocarcinoma cells, and HepG2 liver cancer cells were cultured following the standard protocols for established cell lines [32,33]. The cells were propagated in DMEM that was enriched with 10% fetal bovine serum and 50 U/mL penicillin/streptomycin, and then incubated in a humidified atmosphere containing 5% CO2 at 37 °C. The confluent cells were passaged using trypsin-EDTA.

2.2.3. MTT Assay

The MCF-7, HCT-116, and HepG2 cells (1 × 10⁴ cells/well) were plated in 96-well plates in complete DMEM and they reached optimal population densities within 48 h. The cells were then exposed to increasing concentrations of the filtrated N-SNPs (31.25–1000 µg/mL) and incubated for 24 h in a humidified atmosphere containing 5% CO2 at 37 °C. After 24 h, the old medium was discarded and replaced with 100 µL fresh DMEM; then, 10 µL of 12 mM MTT stock solution was added to each well and maintained for 24 h. As a negative control, 100 µL of medium alone was mixed with 10 µL MTT solution under the same conditions. Subsequently, 100 µL/well of dimethyl sulfoxide (DMSO) was added to dissolve the formazan crystals [39]. The absorbance of the samples was recorded at 570 nm with a Benchmark Microplate ELISA reader (Bio-Rad Laboratories, Hercules, CA, USA). The cell viability percentage was evaluated while using the following formula: (ATreatedABlank)/(AControlABlank) × 100.
The concentrations are necessary for 50% and 25% of growth inhibition (IC50 and IC25) were calculated using a sigmoidal curve of % cell viability versus logarithmic concentration of SNPs using Graph Pad Prism software [40].

2.2.4. Morphological Change Estimation

Equal numbers of MCF-7, HCT-116, and HepG2 cells (1 × 10⁴ cells/ well) were seeded onto 12-well plates until sub-confluent and then treated with the corresponding IC50 and IC25 of biogenic N-SNPs (Table 2) and kept for 24 h at 37 °C. The untreated cells were cultured similarly as a negative control. After 24 h, morphological changes were detected while using an inverted light microscope (Optika, Ponteranica BG, Via Rigla, Italy).

2.2.5. Transmission Electron Microscopy (TEM)

Ultrastructural alterations in the cells after treatment with N-SNPs were detected by TEM at 80 kV (Jeol 100 CX, Tokyo, Japan). In brief, HepG2, HCT-116, and MCF-7 cells (1 × 10⁴ cells/well) were seeded in a 25-cm2 cell culture flask until sub-confluent, exposed to N-SNPs at IC50 and IC25 (Table 2), and then incubated for 24 h at 37 °C. The cells were cultured similarly, but without treatment as a negative control. The cells were washed several times with phosphate-buffered saline (PBS) to remove excess unbound N-SNPs, trypsinized, and then washed again 4–5 times with PBS. The cell pellets were collected after centrifugation at 3000 rpm at 4 °C. The cells were immediately immersed in ice-cold 2.5% glutaraldehyde for 2 h at 4 °C, and then rinsed several times with 0.1 M PBS before being post-fixed with 1% osmium tetroxide (OsO4) for 2 h at 4 °C. Afterward, the specimens were serially dehydrated with graded ethanol (50%, 70%, 90%, and 100%), infiltrated with propylene oxide, and then embedded in Araldite-Epon mixture. The samples were cut into ultrathin (70 nm) sections with a glass knife on an LKB ultramicrotome and then double-stained on 200-mesh copper grids with 2% uranyl acetate and lead citrate for examination [41].

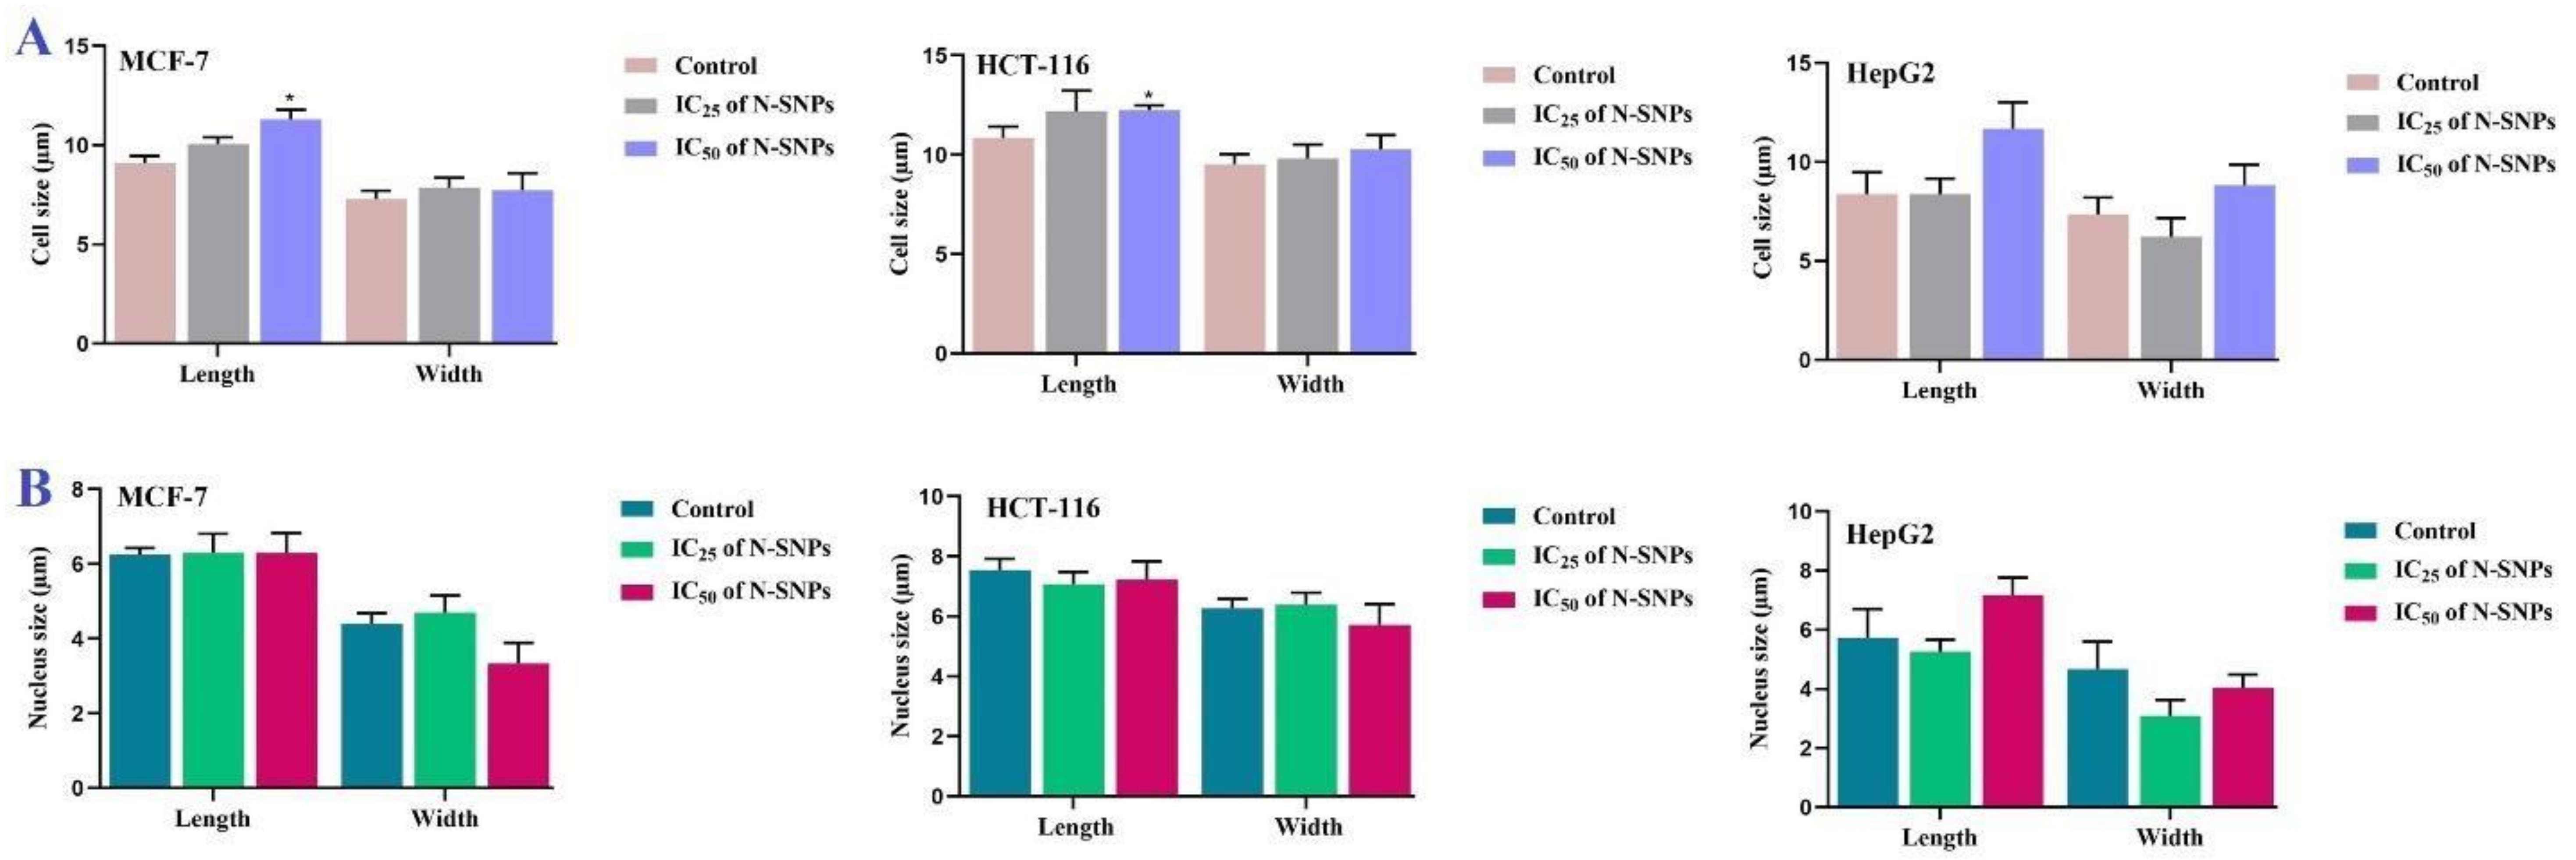
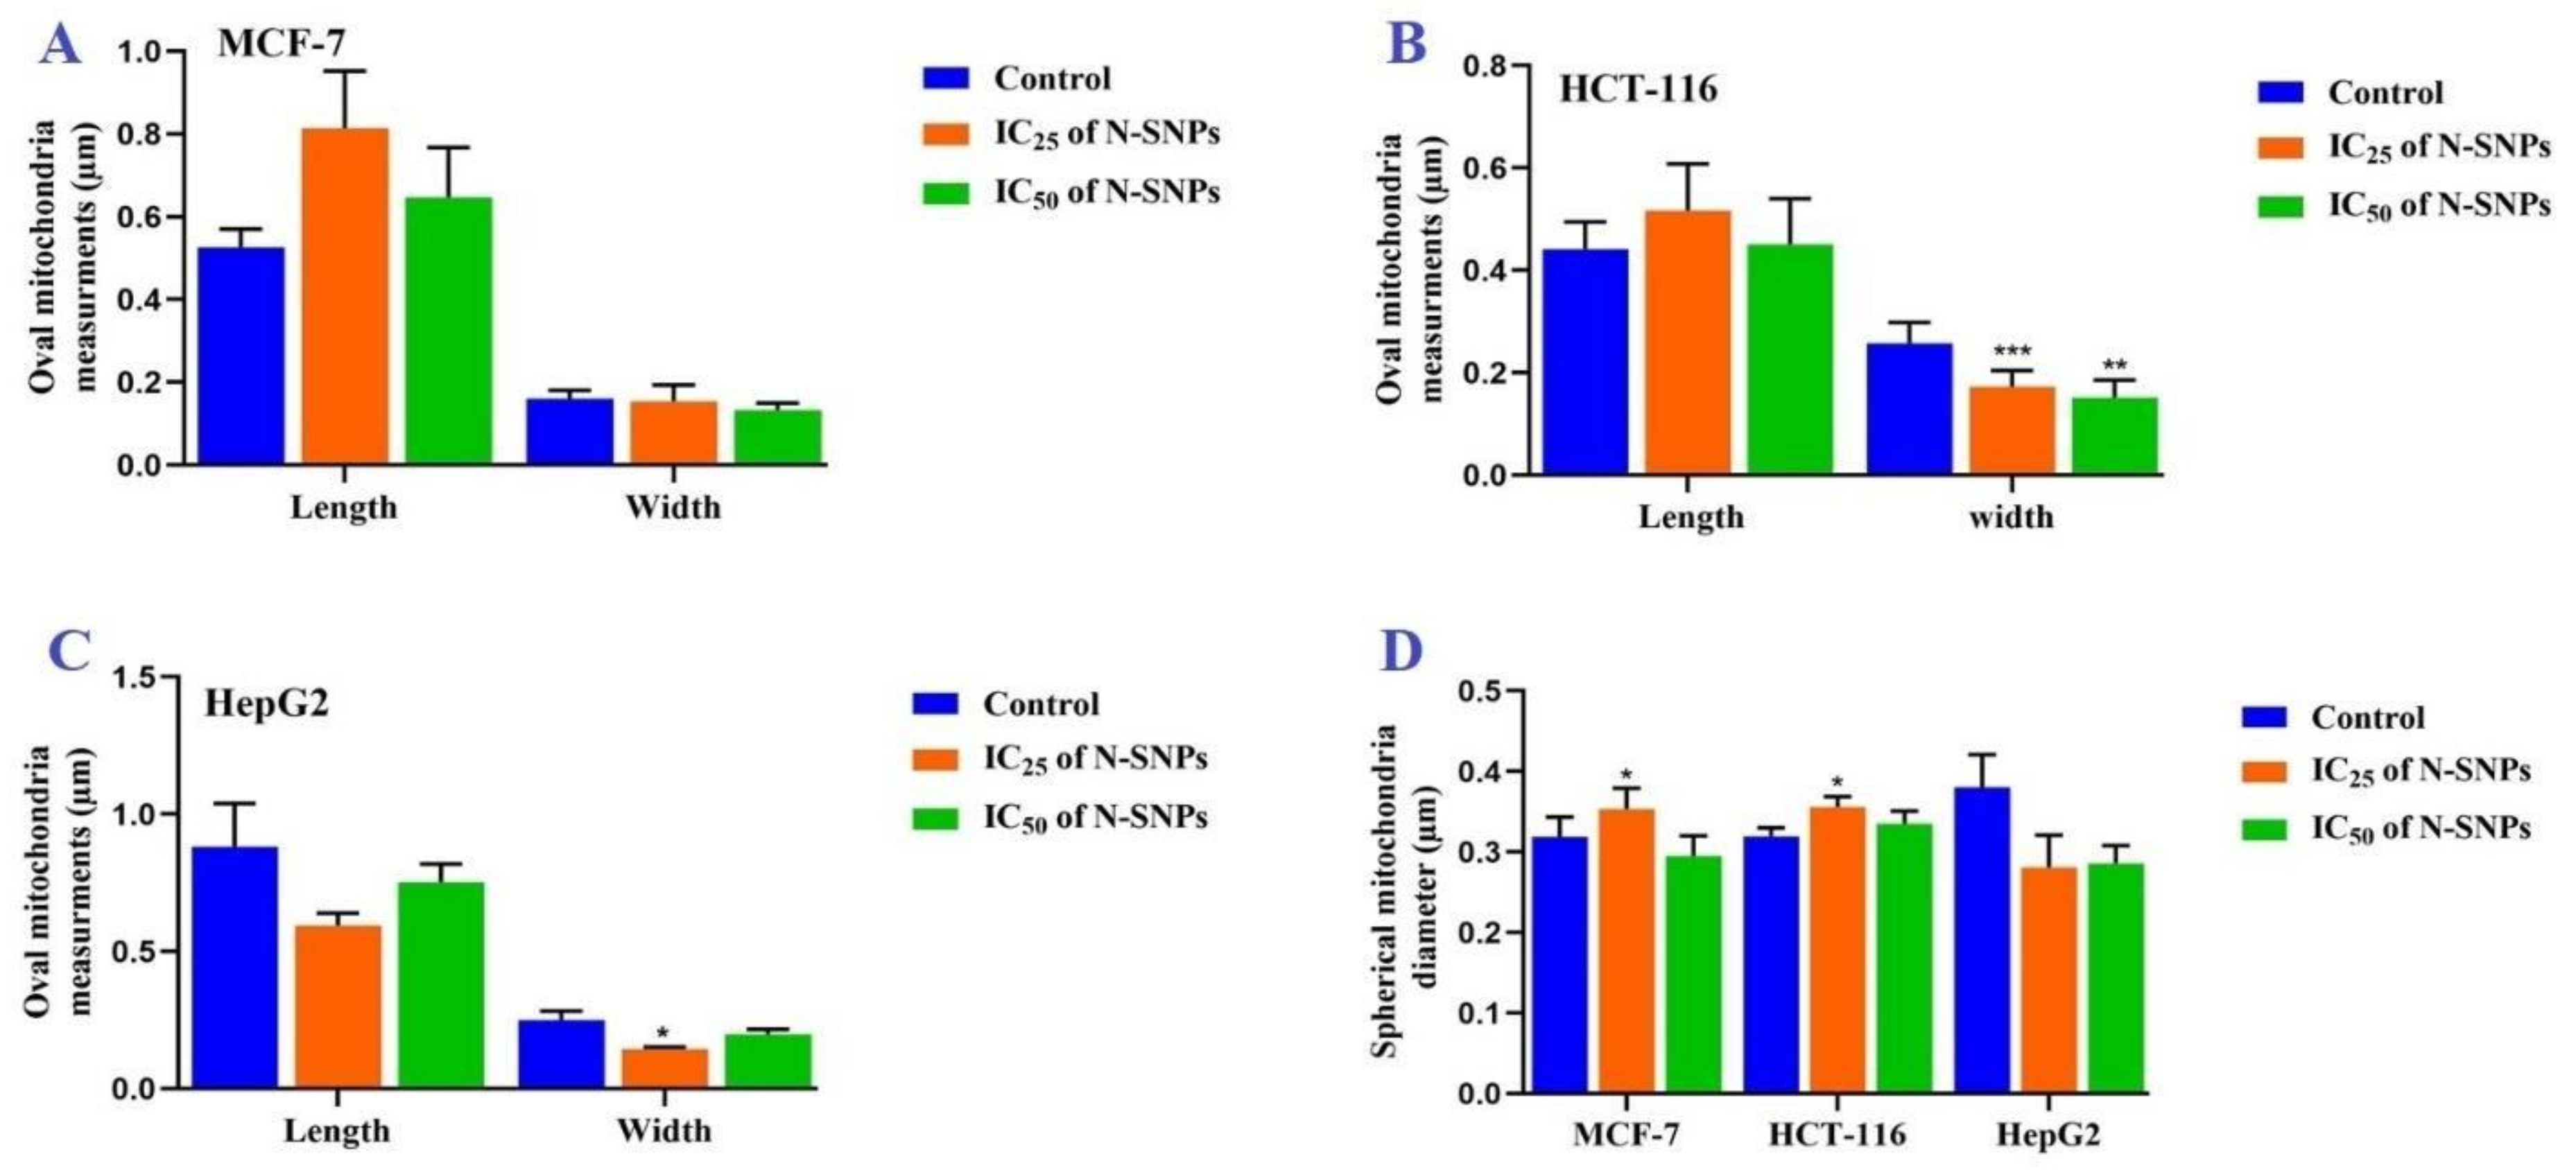
2.2.6. Morphometric Measurements

The dimensions of cells, nuclei, and oval mitochondria (length and width) and of spherical mitochondria (diameter) of the three tested cell types were measured based on the TEM micrographs while using the ImageJ software (averaged over 10 cells).

2.2.7. Membrane Integrity

LDH assays were used to determine the effects of N-SNPs on the cell membrane integrity of MCF-7, HCT-116, and HepG2 cells, following the manufacturer’s instructions. In this assay, the toxicity of the N-SNPs can be determined by measuring the LDH level in the supernatant, which increases due to the cytosolic LDH enzyme leaking out of the cells via disrupted cellular membranes. Briefly, the three cell lines before and after treatment with N-SNPs at IC25 and IC50 (Table 2) were maintained at 37 °C for 24 h. Subsequently, in a new 96-well plate, 100 µL/well of each cell-free supernatant was mixed in triplicate with 100 µL of the LDH assay reaction mixture. The absorbance of the color produced after 3 h of incubation was estimated at a wavelength of 490 nm while using a plate reader [42]. This experiment was performed at least three times under consistent conditions.

2.2.8. Estimation of ATPase Activity

ATPase activity before and after exposure of MCF-7, HepG2, and HCT-116 cells to different concentrations of N-SNPs was evaluated using a colorimetric ATPase assay kit, according to the method that was described by Andrés et al. [43] The supernatants of cells (10 µL) were mixed with 10 μL of PiBind resin to remove free inorganic phosphate (Pi). The amount of liberated Pi was evaluated by spectrophotometry (UV 2505, La Cienega Blvd., Los Angeles, CA 90034 U.S.A) at A650. For all experiments, calibration was performed while using a standard range of Pi concentrations. The experiments were performed at least three times under consistent conditions.

2.2.9. Evaluation of Antioxidative Marker Levels

In brief, the tested cells were incubated with different concentrations of N-SNPs (IC50 and IC25) in a 25-cm2 cell culture flask for 24 h at 37 °C. Subsequently, the cells were scraped and washed twice with PBS before being centrifuged at 4 °C and 1500 rpm for 6 min. The pellets were collected and then sonicated at 15 W for 10 s (three cycles) to obtain the cell lysate. The GPx and GSH concentrations of the supernatant were evaluated.
For evaluation of GPx levels, 0.9 mL of the sample was mixed with the reaction mixture (50 mM potassium phosphate buffer (pH 7.0), 1 mM EDTA, 1 mM sodium azide, 0.2 mM NADPH, 1 U glutathione reductase, and 1 mM reduced glutathione) and maintained at 25 °C for 5 min. The reaction was started by the addition of 0.1 mL 2.5 mM hydrogen peroxide (H2O2), and the absorbance was estimated at 340 nm. Values were expressed as nmol of NADPH oxidized to NADP using an extinction coefficient of 6.2 × 10³ M−1 cm−1 at 340 nm. The activity of GPx was expressed in terms of n mol NADPH consumed/min/mg protein [44].
For the evaluation of GSH levels, the supernatant was mixed with a solution of cold (4 °C) 320 mM sulfosalicylic acid, 28 mM L-ascorbic acid, and 4 mM EDTA for protein precipitation. Subsequently, the mixture was centrifuged at 27,000 × 1q g (Hettich Zentrifugen MIKRO 200, Föhrenstraße, Tuttlingen, Germany) for 15 min, at 4 °C to remove precipitated proteins, and the GSH concentration was measured in the clear supernatant by the colorimetric method that was described by Beutler et al. [45]. Subsequently, 0.1 mL of supernatant was mixed with the reaction mixture (5,5′-dithiobis (2-nitrobenzoic acid) dissolved in 25 mM PBS, pH 7.0). The absorbance was measured at 412 nm. The GSH content was expressed as μM GSH per milligram. These experiments were performed at least three times under consistent conditions.

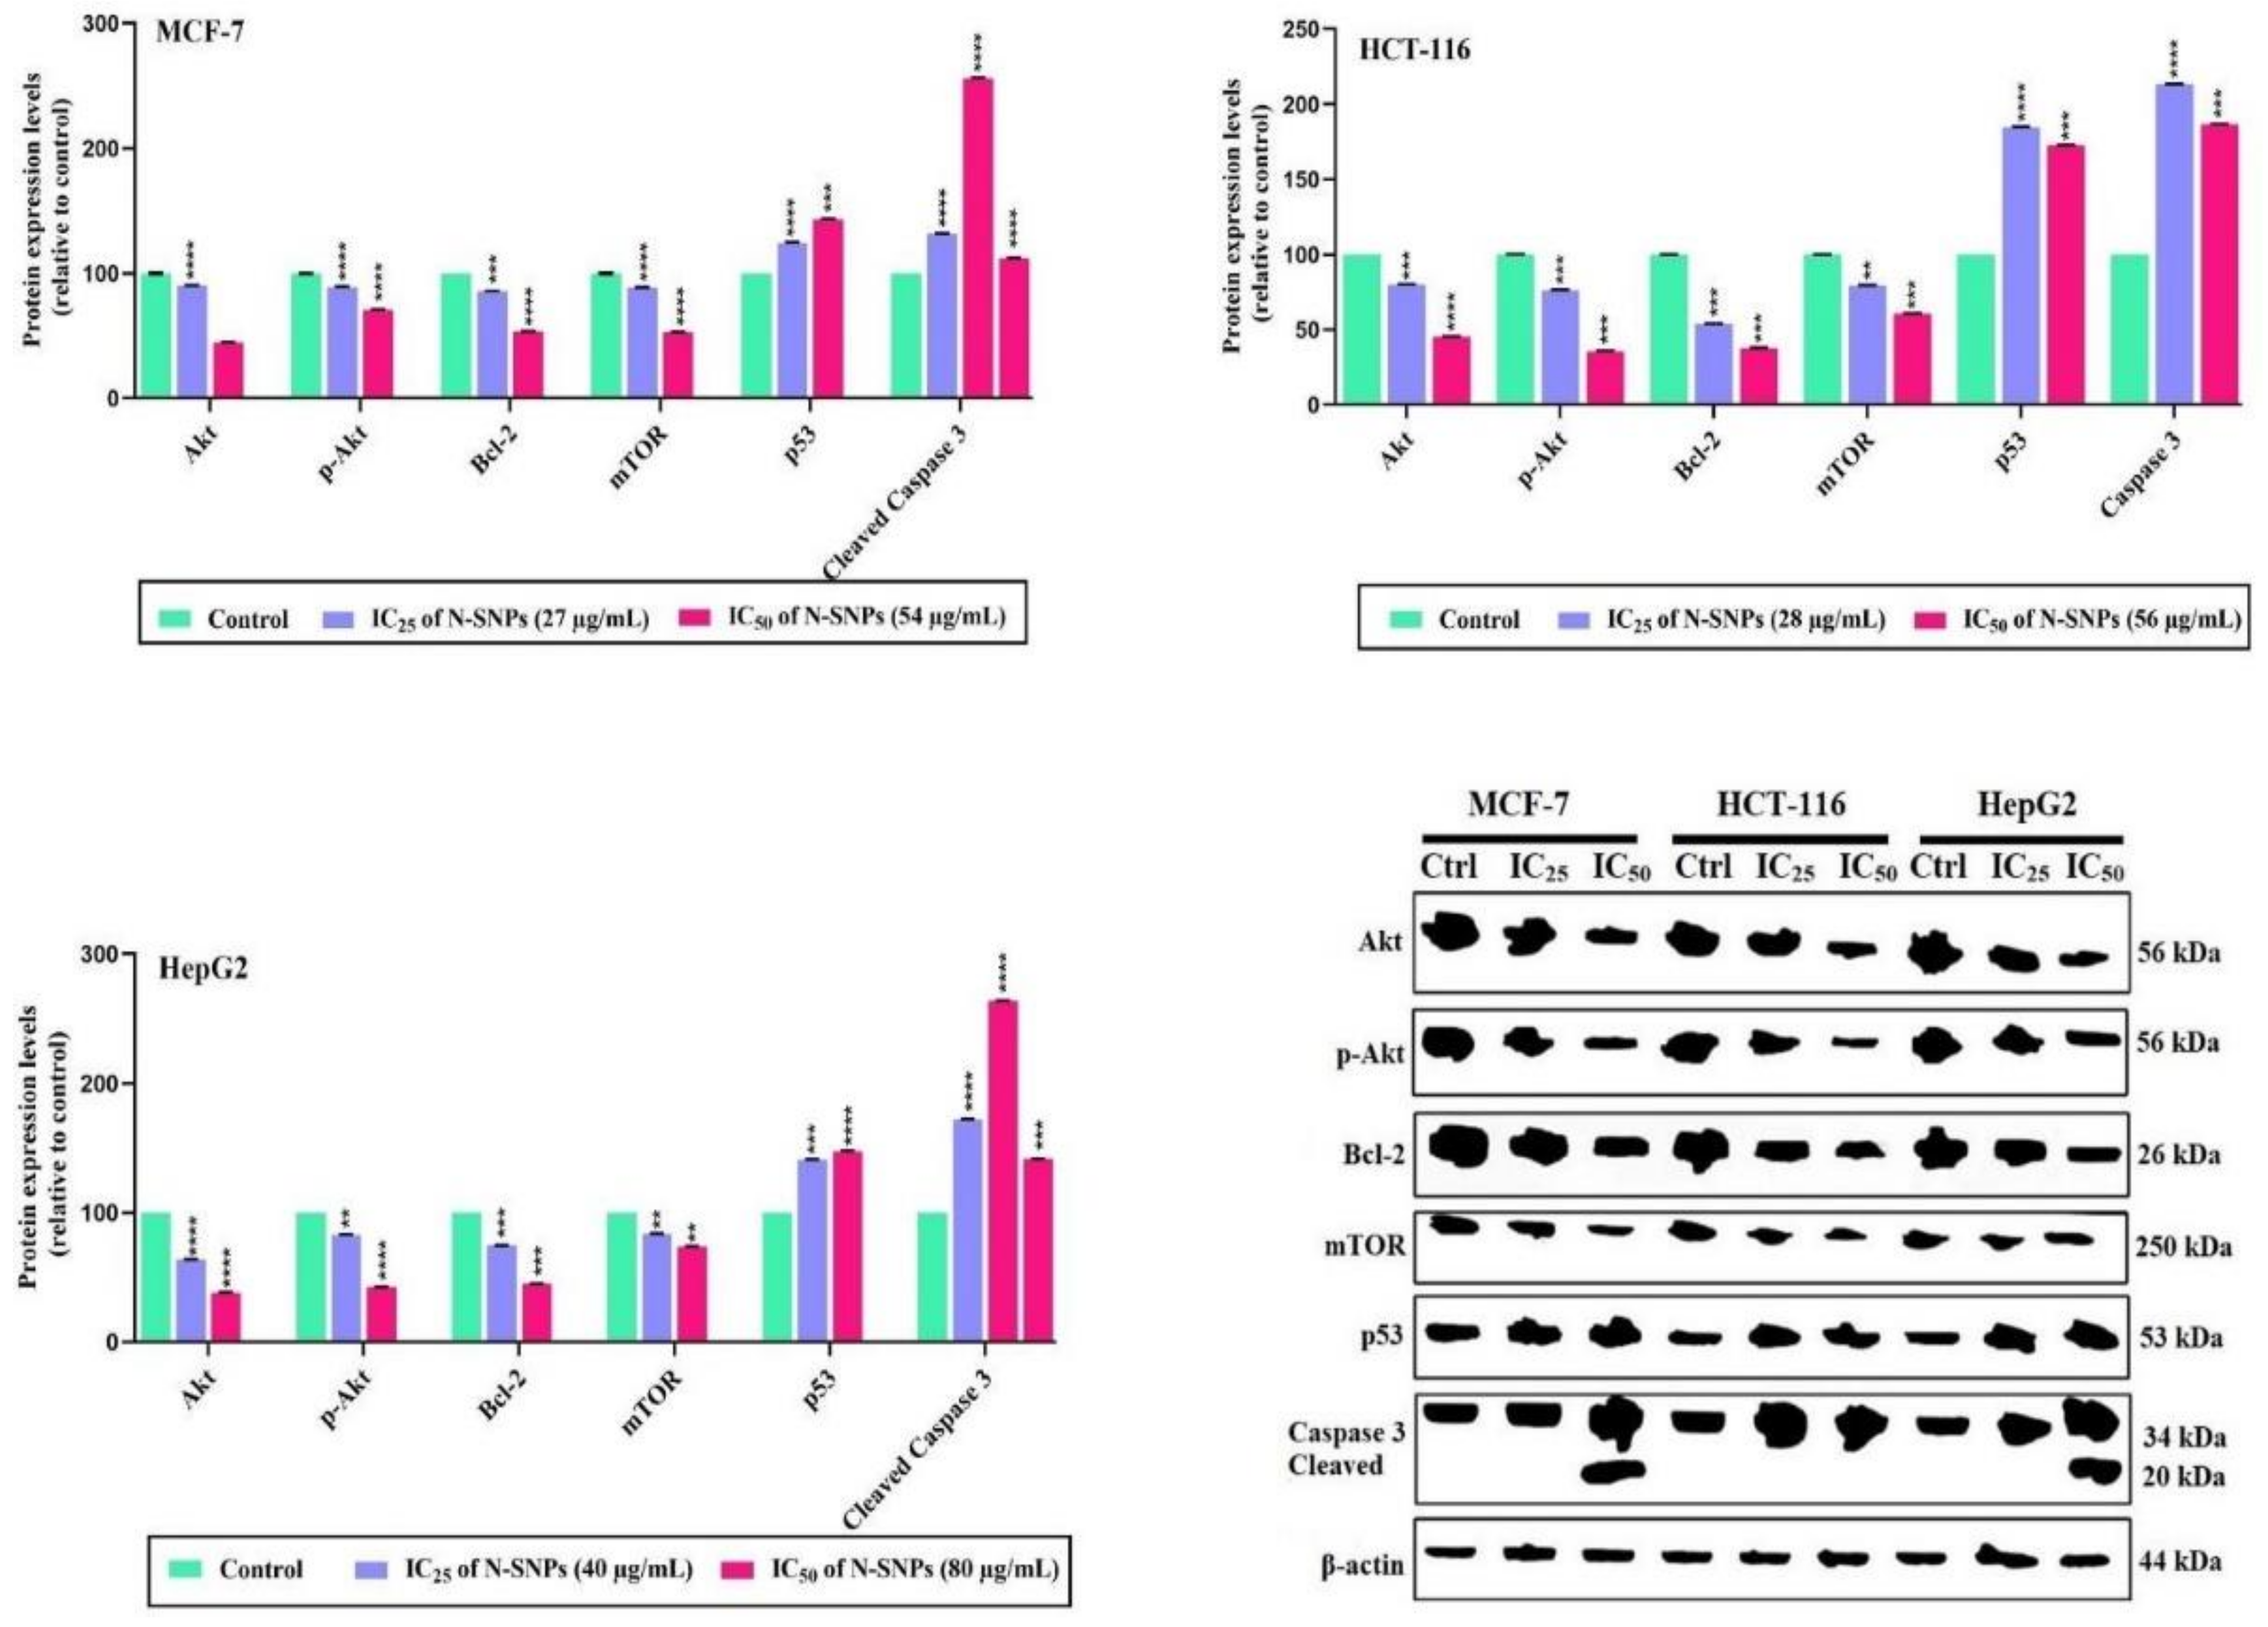
2.2.10. Western Blotting Analysis

The expression levels of apoptotic and antiapoptotic proteins (tumor suppressor p53, caspase 3, protein kinase B (Akt), phosphorylated-Akt (p-Akt), mammalian target of rapamycin (mTOR) and B-cell lymphoma 2 (Bcl-2)) were measured by western blotting. MCF-7, HCT-116, and HepG2 cells (1 × 10⁴) were separately cultured in six-well plates until they reached approximately 90% confluence. The cells were treated with N-SNPs at IC25 and IC50 and then incubated for 24 h at 37 °C. Afterwards, the media were discarded, and the cells were resuspended three times with ice-cold PBS, detached, and then centrifuged at 1500 rpm at ambient temperature. The cells were homogenized with protein lysis buffer (50 mM Tris pH 7.5, 150 mM NaCl, 1% Triton X-100, 0.1% sodium dodecyl sulfate (SDS)) in the presence of protease inhibitor. The concentration of protein was detected by the Bradford method [46]; 30 µg of the total protein sample was loaded into a mini-gel well while using a special gel loading tip, which was submerged in a migration buffer containing SDS. To visualize the fixed proteins, the gel was stained with 0.1% Coomassie blue R- 250 for 2 h, and then destained with a solution of glacial acetic acid, followed by methanol and water. After SDS polyacrylamide gel electrophoresis, the proteins were transferred to a Hybond nylon membrane (GE Healthcare) using a TE62 standard transfer tank with cooling chamber (Hoefer Inc. Holliston, Massachusetts, United States) and then detected using anti-Akt, anti-p-Akt, anti-mTOR, anti-Bcl-2, anti-p53, and anti-caspase 3. β-actin was used as a housekeeping protein. A gel documentation system (Geldoc-it UVP, Loughborough, Leicestershire, England) was used for the data analysis with Total Lab analysis software (www.totallab.com), version 1.0.1.

2.2.11. Statistical Analysis

All the data from three independent replicates are presented as mean ± SEM. Statistical analyses were performed using one-way analysis of variance with the Prism 8.3 software (GraphPad Software Inc., La Jolla, CA, USA). The results were considered to be statistically significant at p < 0.01, p < 0.001, p < 0.0003, and p < 0.0001. The ImageJ software (National Institutes of Health, Bethesda, MD, USA) was used for morphometric analysis.

3. Results

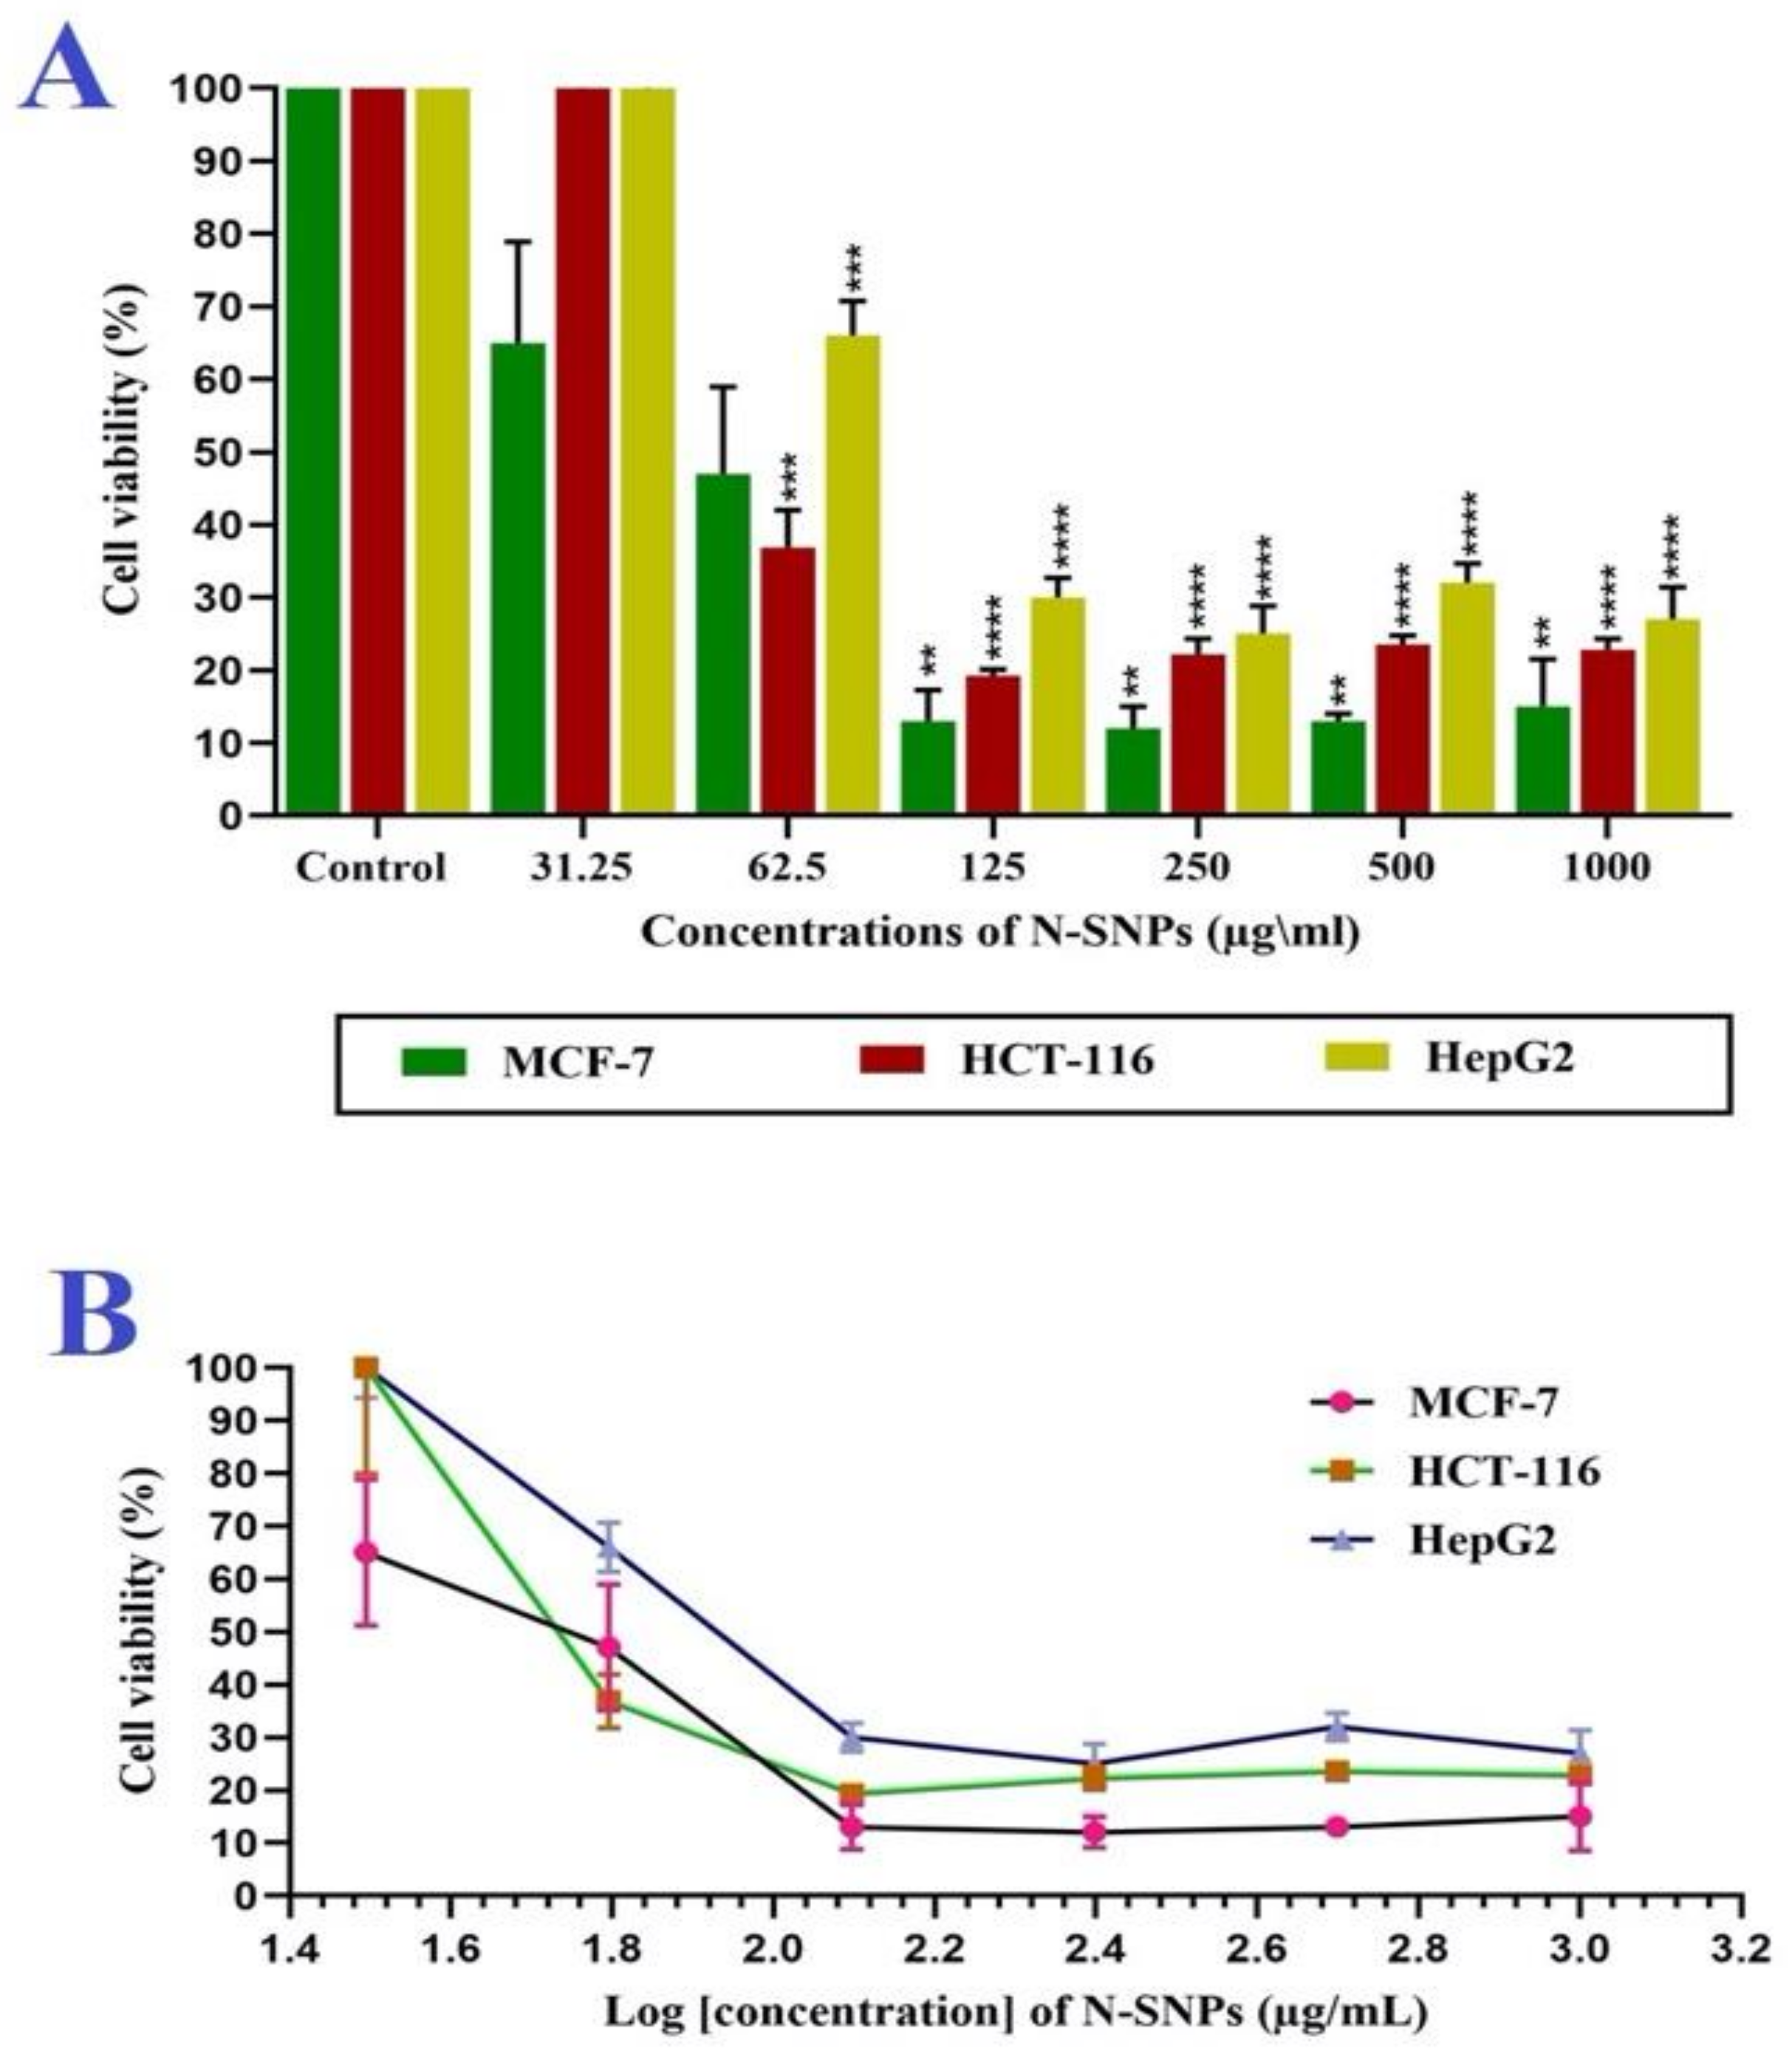
3.1. Cytotoxic Activity of N-SNPs Against MCF-7, HCT-116, and HepG2 Cells

The toxicity of green N-SNPs (31.25–1000 µg/mL) against the three cancer cell lines was evaluated while using cell viability assays. The results showed that N-SNPs significantly inhibited the proliferation of all tested cells in a dose-dependent manner as compared with untreated cells (Figure 1A). The cytotoxic potency of N-SNPs against the cells was variable; the MCF-7 cells were the most sensitive to N-SNPs, followed by HCT-116 and HepG2 cells, with IC50 values of 54, 56, and 80 µg/mL, respectively (Figure 1B and Table 2).

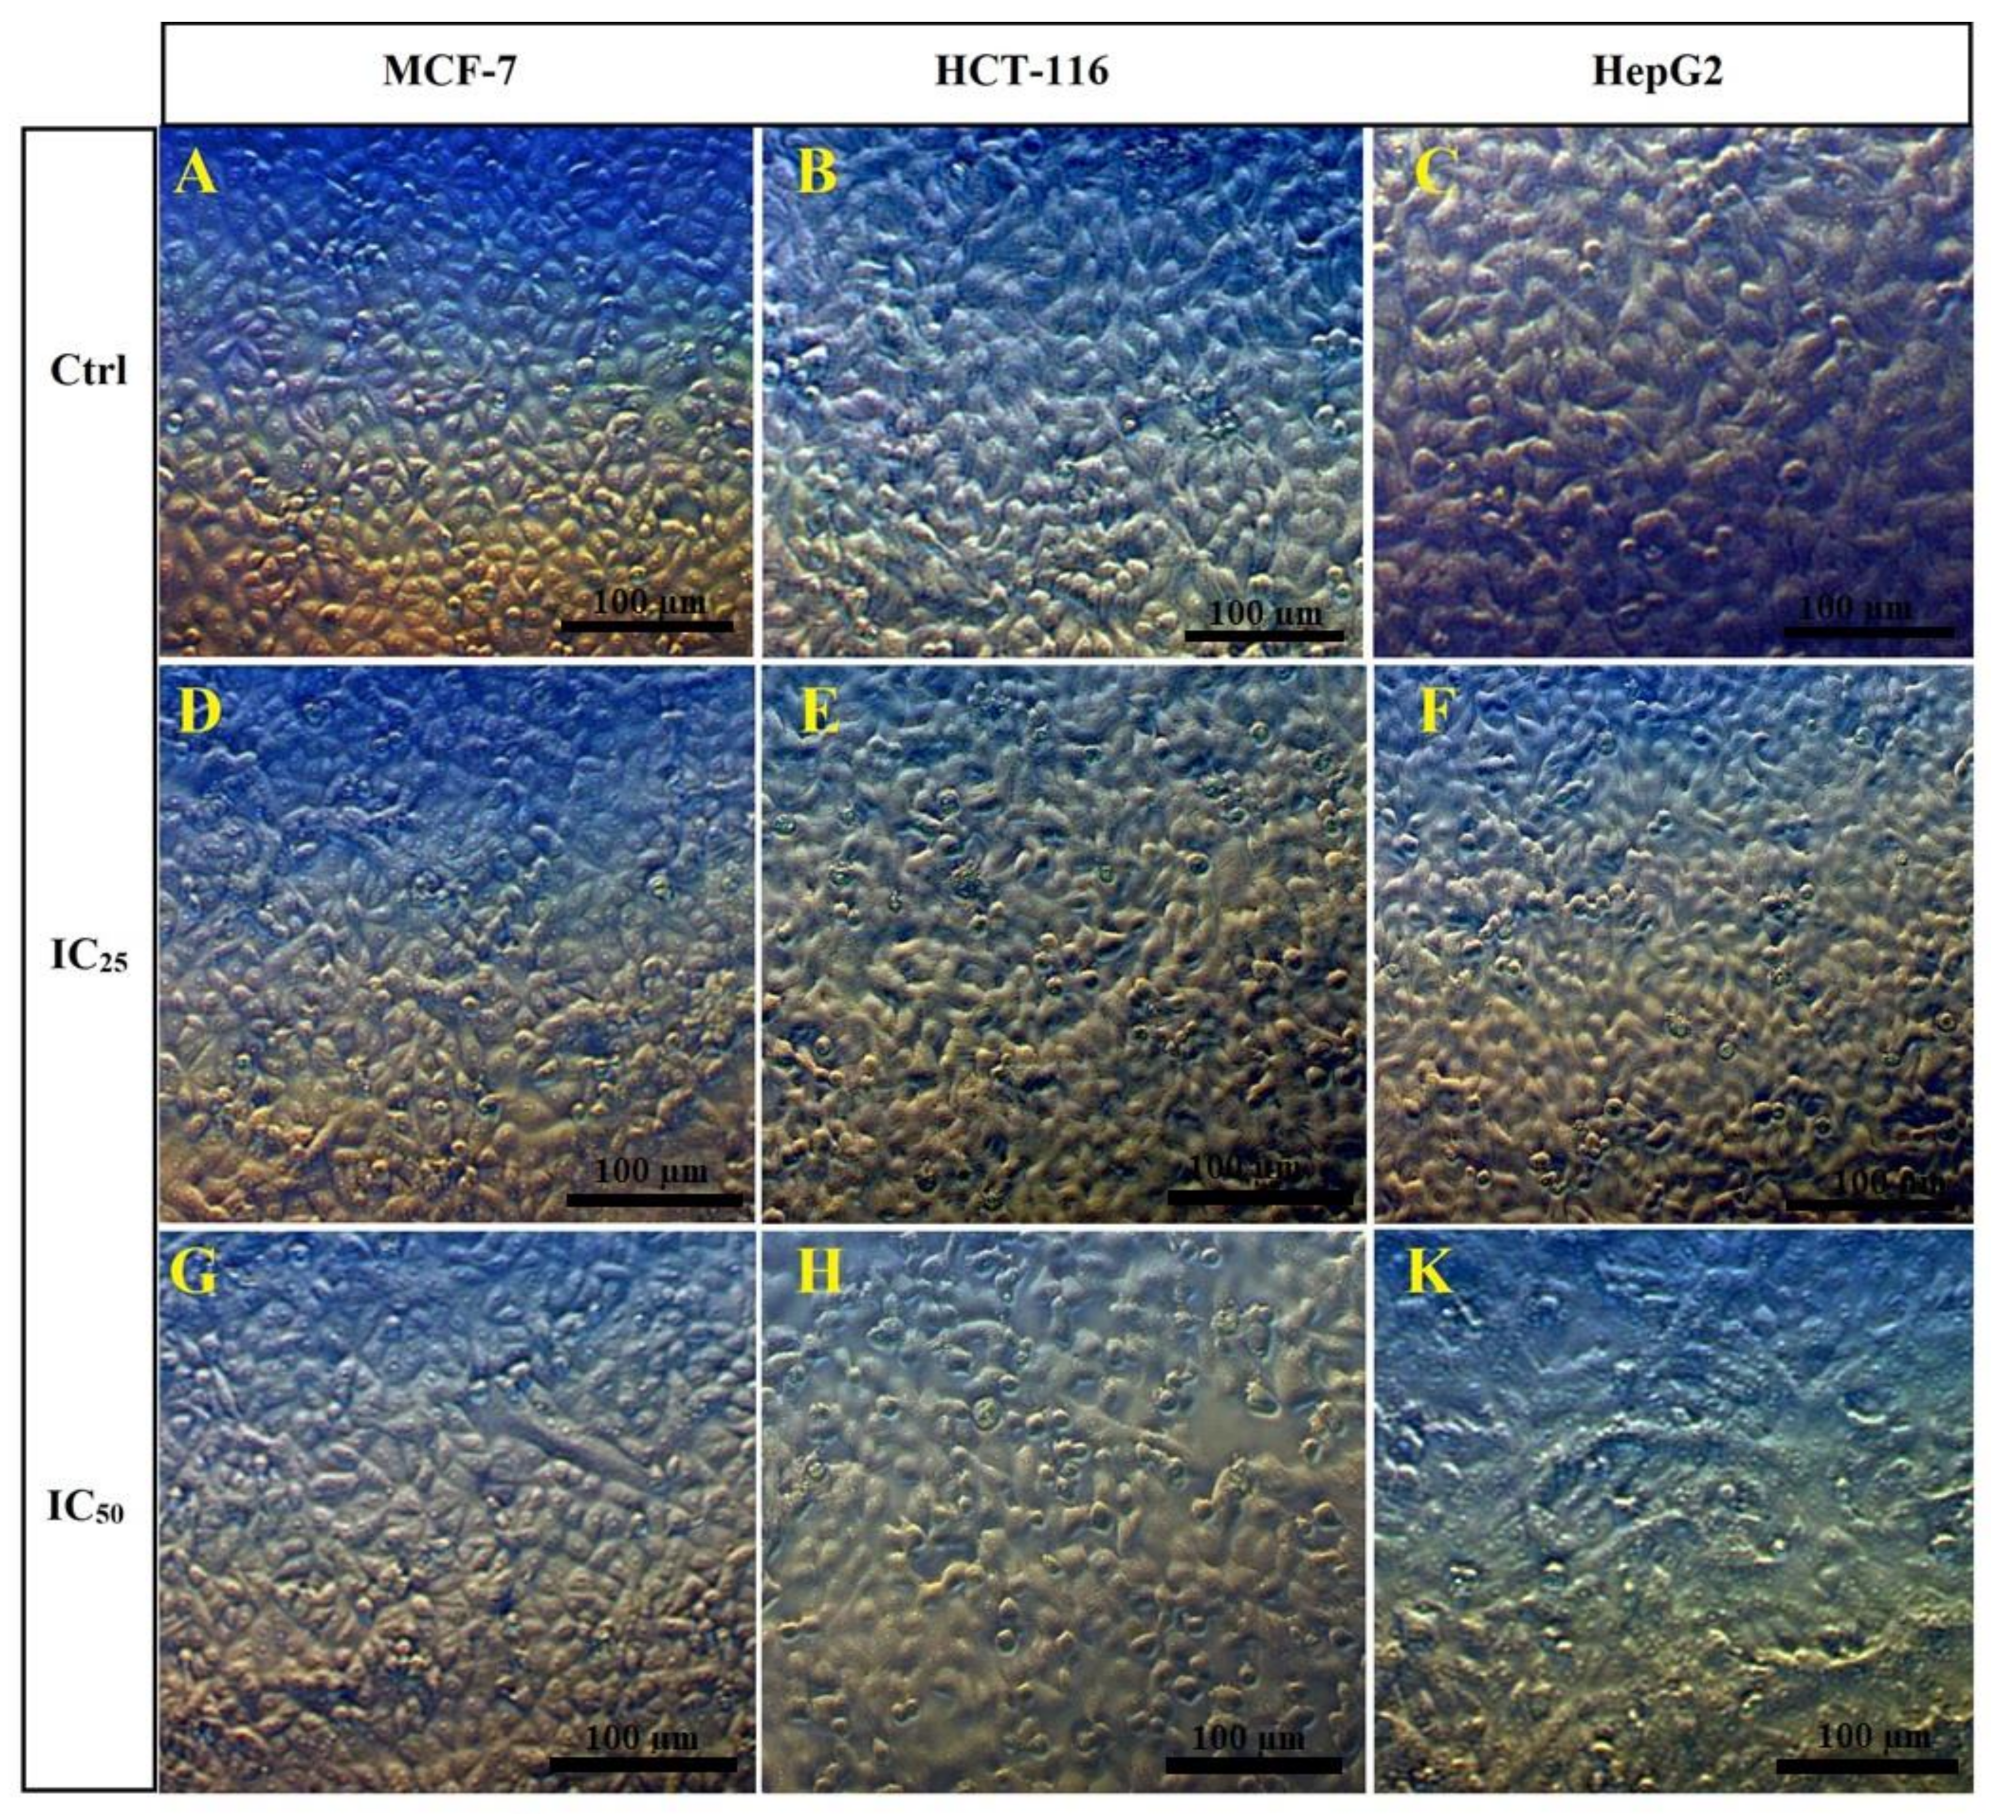
3.2. Morphological Changes of Cells Treated with N-SNPs

The morphological changes in MCF-7, HCT-116, and HepG2 cells after being treated with different concentrations of N-SNPs (IC25 and IC50) were examined by inverted light microscopy. All of the selected untreated cells showed normal morphological appearance and distribution, and formed a confluent monolayer of cells attached to the plate with almost 90% confluence and a low distance between cells (Figure 2A–C). By contrast, all of the tested cells showed detectable morphological alterations after treatment with both concentrations of N-SNPs, in a dose-dependent manner; these alterations included cell detachment, shrinkage, and rounding, a restricted spreading pattern, and clustering (Figure 2D–K). However, cells that were treated with N-SNPs at IC50 exhibited more drastic changes as compared with cells treated at IC25; there was a greater decrease in intracellular connections between the cells, a larger number of floating dead cells, and more lysed cells with incomplete nucleus and cytoplasm, the cell volume was decreased, and more rounded cells were generated (Figure 2G–K).

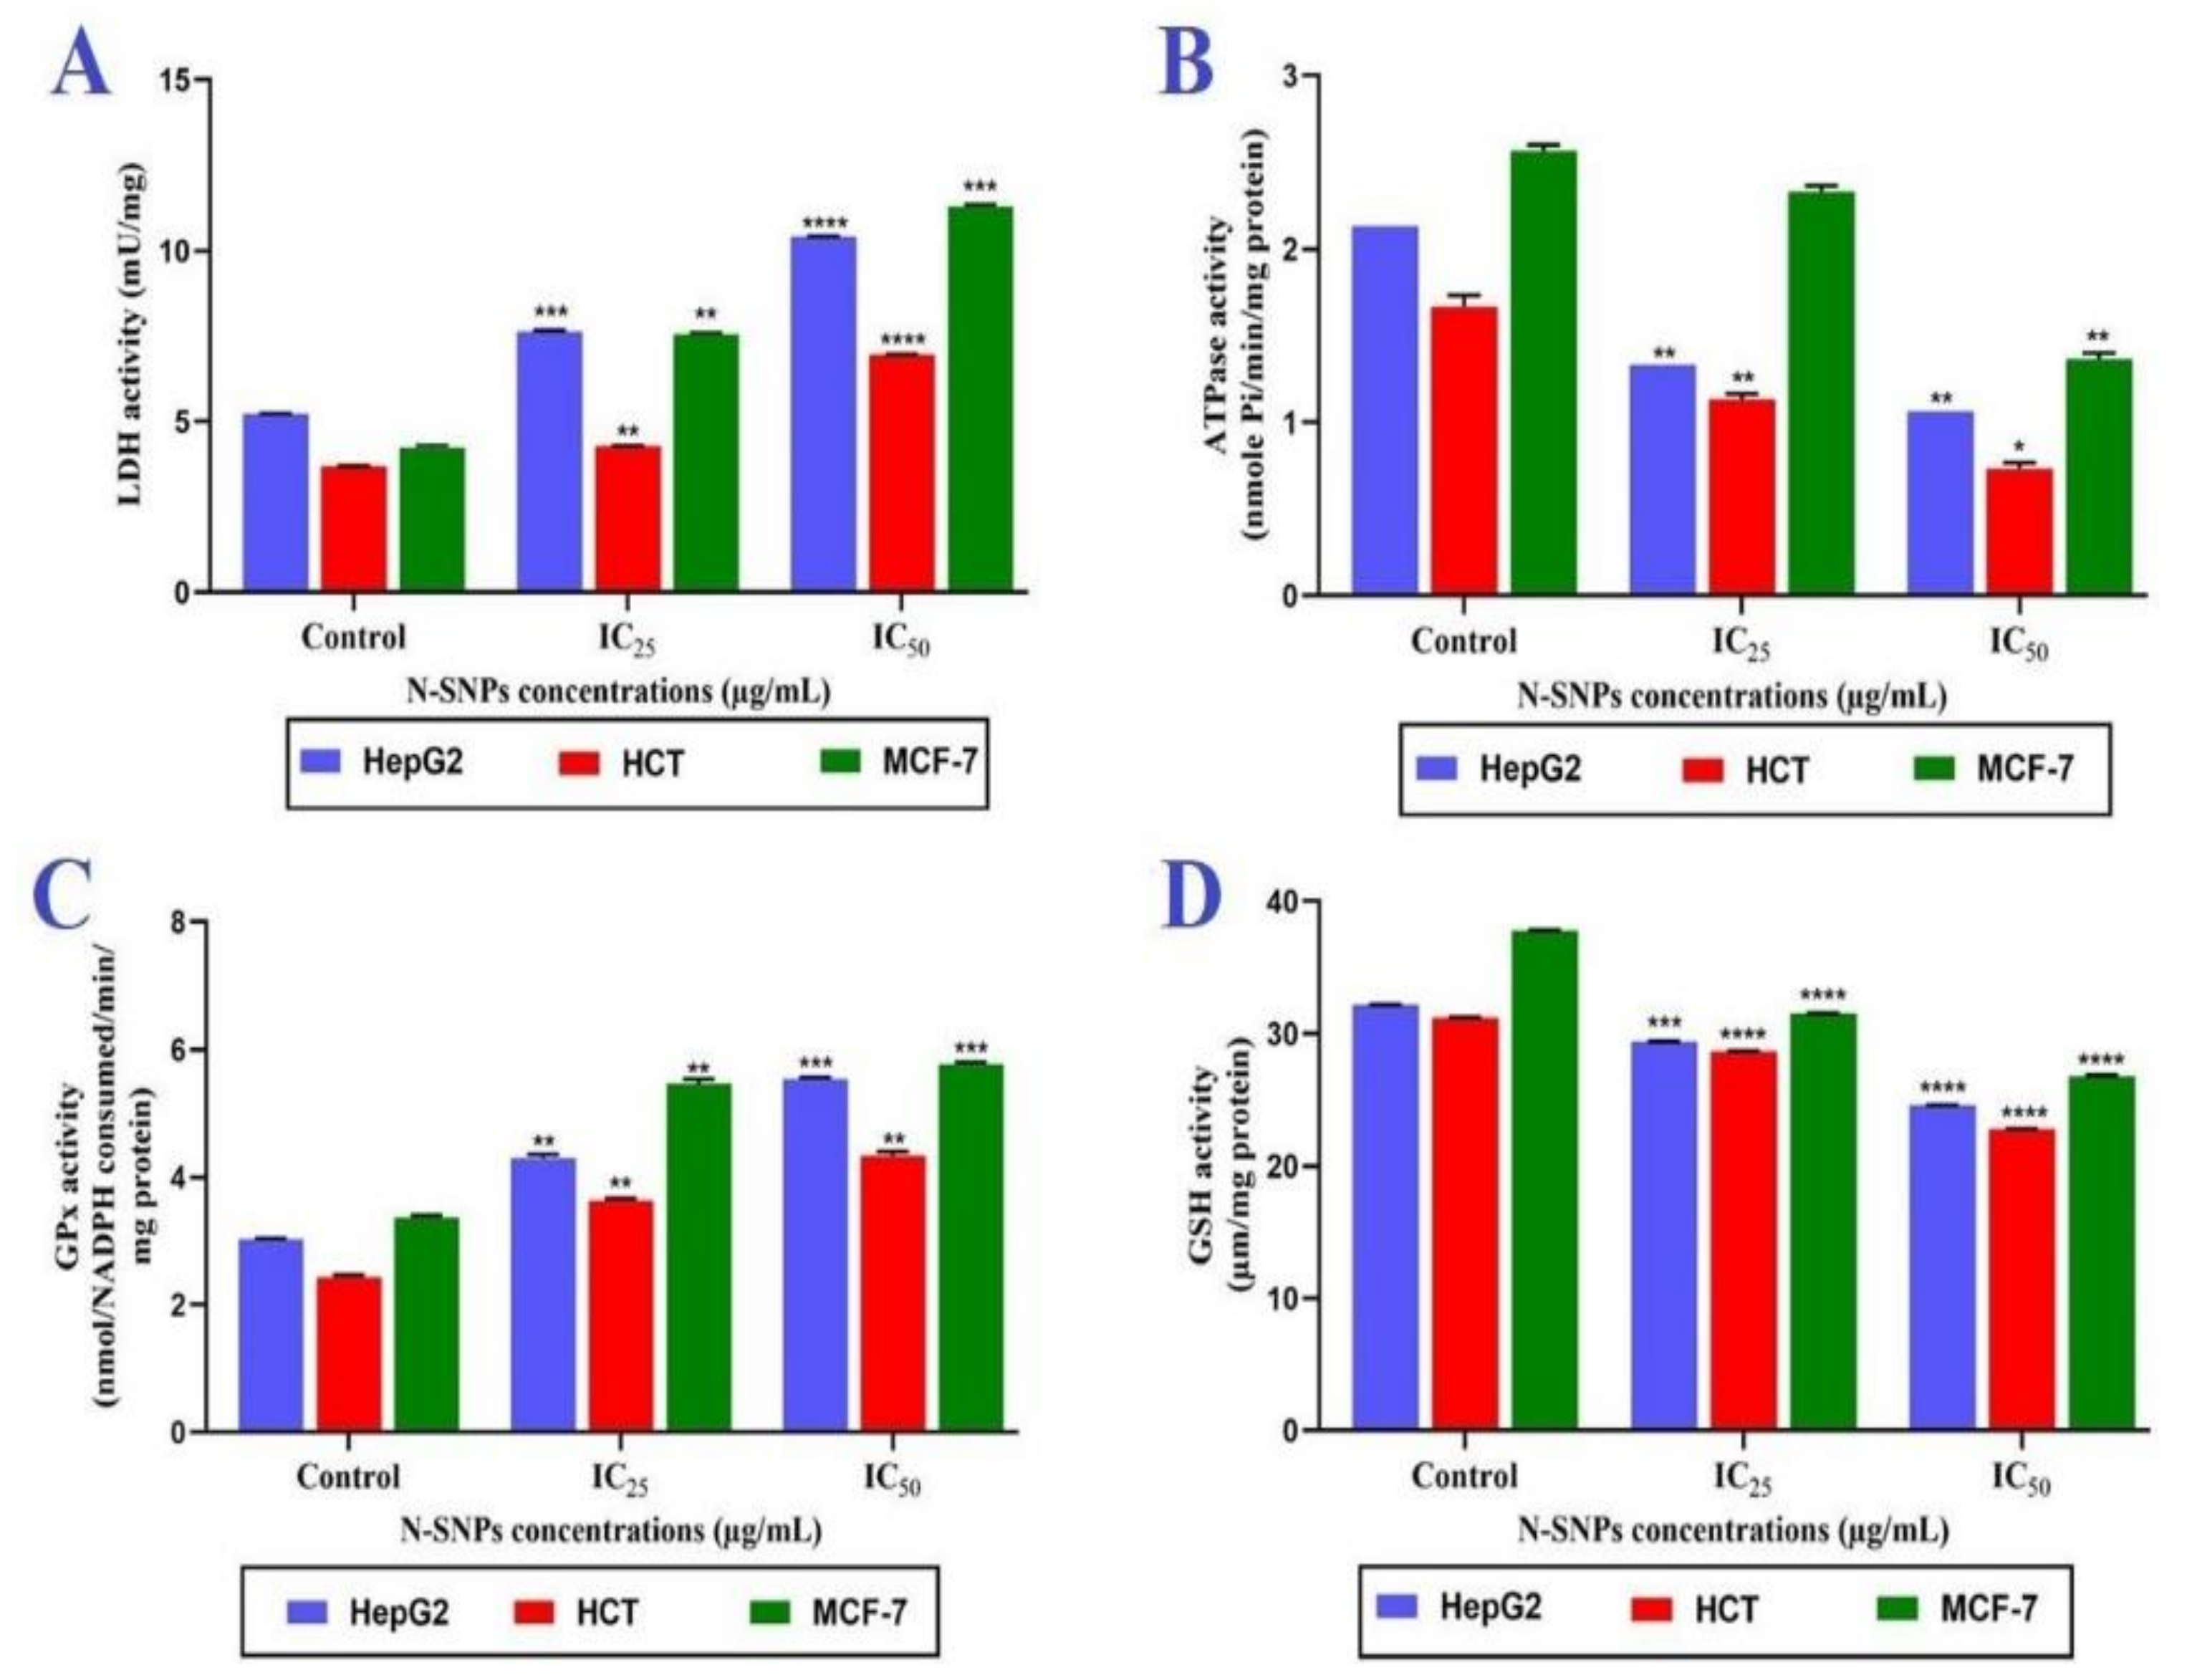
3.3. Membrane Integrity

In all tested cell lines, the LDH levels were significantly increased in a dose-dependent manner 24 h after treatment with N-SNPs at both IC25 and IC50 (Figure 3A). However, IC50 was the most potent concentration, causing a significant increase in LDH levels in all tested cells as compared with those that were treated at IC25 and untreated cells. Among the treated cells, the MCF-7 cells showed the greatest increase in LDH levels, followed by HepG2 and HCT-116, after exposure to both concentrations of N-SNPs.

3.4. ATPase Assay

The metabolic toxicity of N-SNPs against the three tested cell lines was determined by measuring ATPase activity before and after treatment with both concentrations of N-SNPs. In all tested cancer cells (MCF-7, HCT-116, and HepG2), the ATPase levels significantly decreased in a dose-dependent manner after exposure to N-SNPs at IC25 or IC50 (Figure 3B). Of the three cell lines, the MCF-7 cells showed the greatest decrease in ATPase levels.

3.5. Antioxidative Markers

The oxidative stress that was caused by N-SNPs was evaluated by measuring the activities of antioxidants (GPx and GSH). The results showed that the GPx levels significantly increased and GSH levels significantly decreased in a dose-dependent manner in all three cell types treated with both concentrations of N-SNPs (IC25 and IC50) (Figure 3C,D). The MCF-7 cells treated with N-SNPs showed the greatest imbalance in GPx and GSH levels.

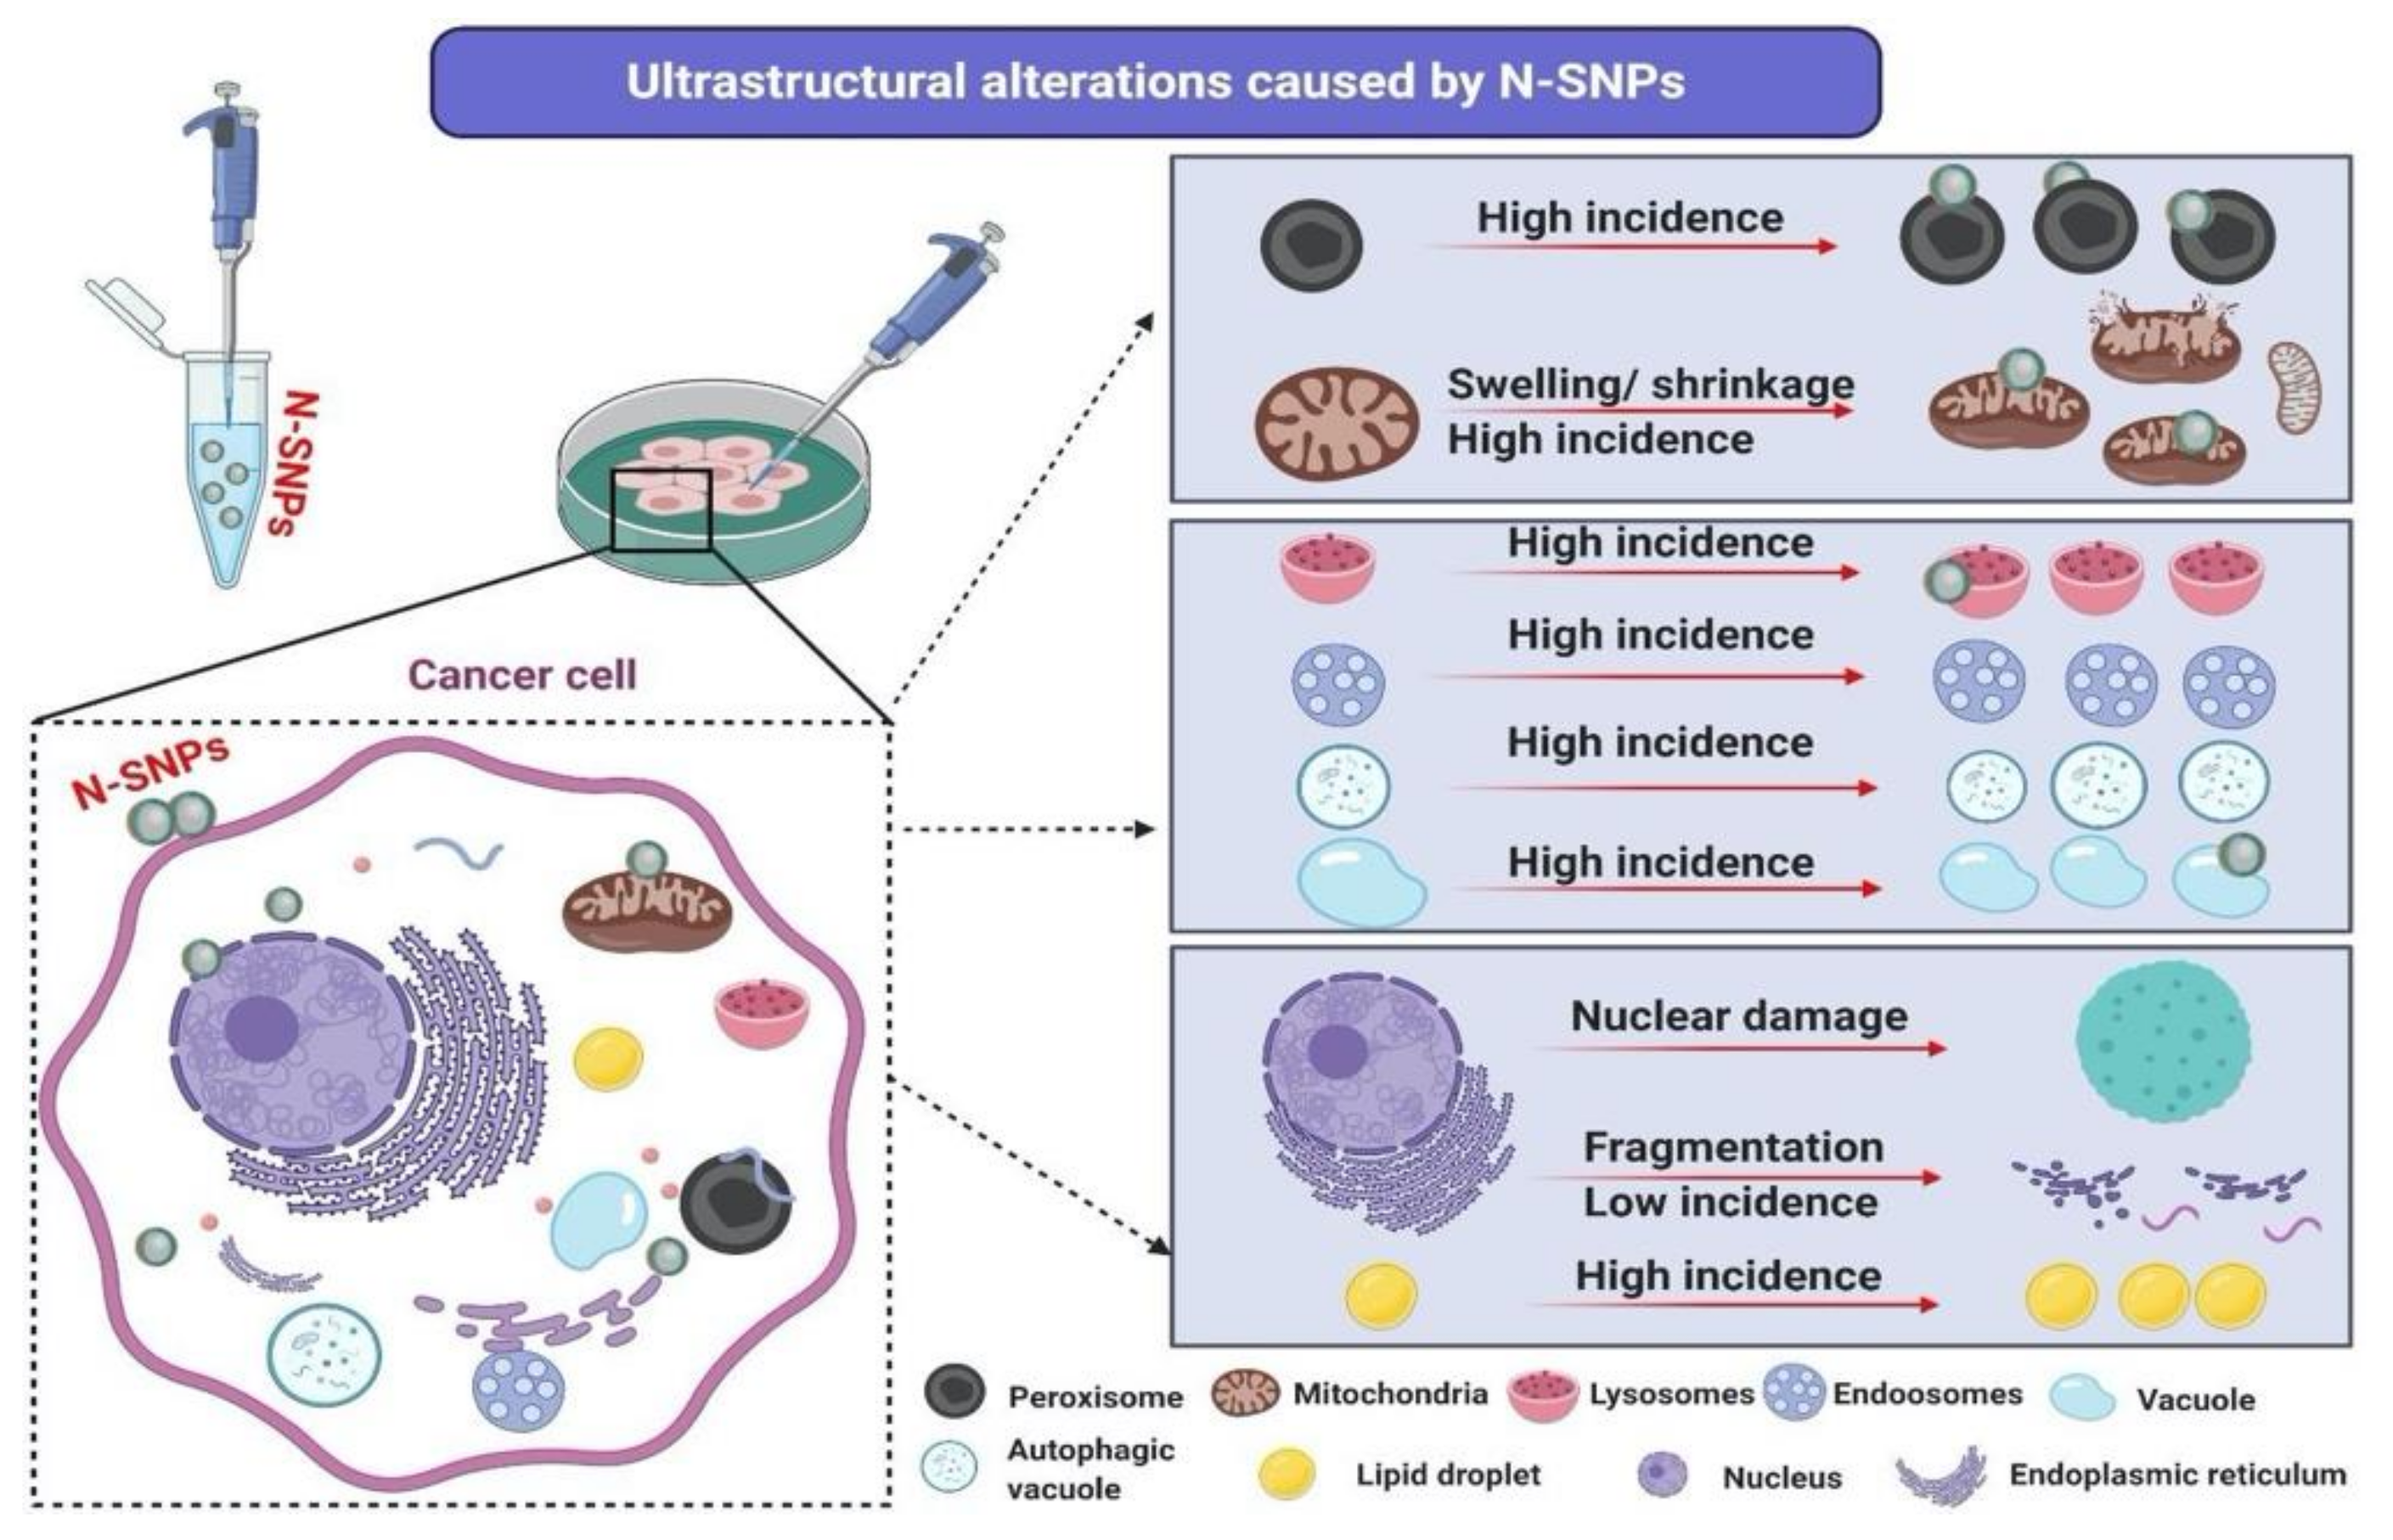
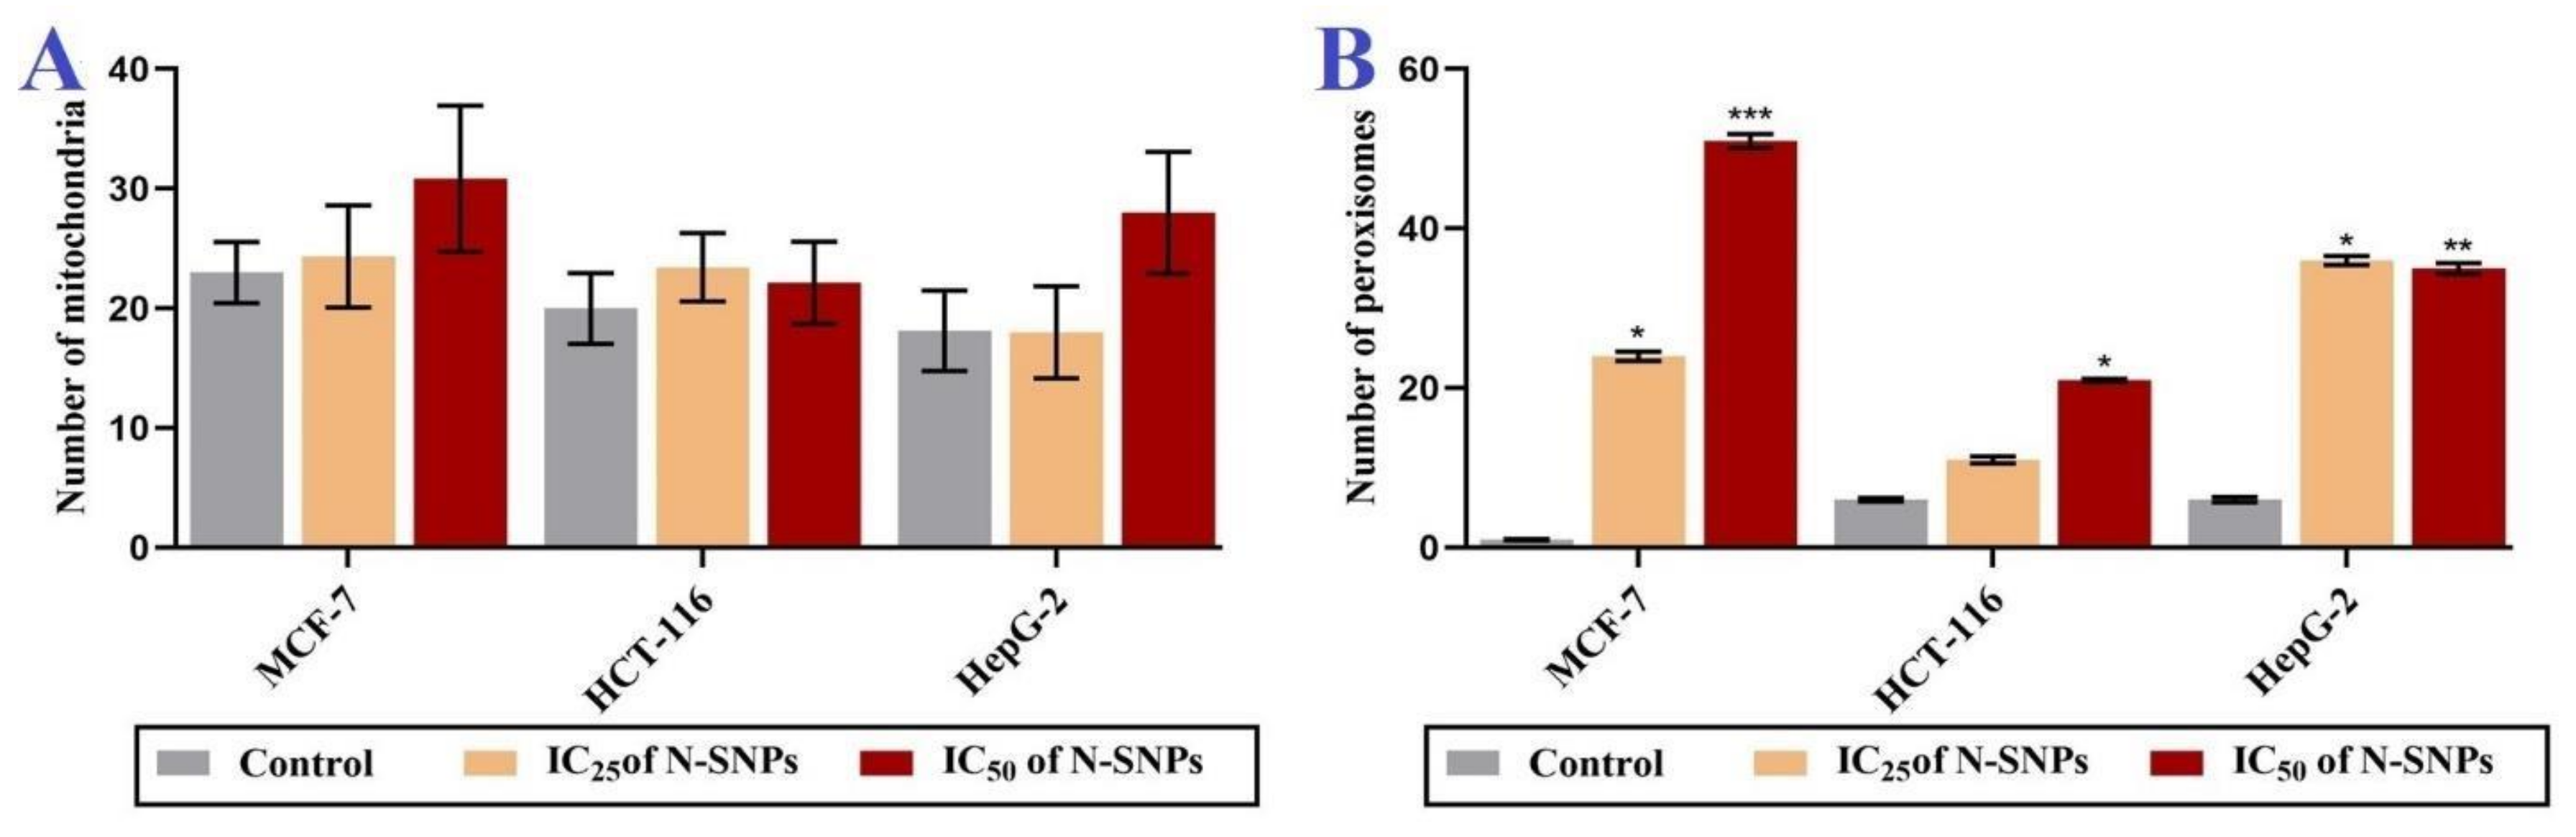
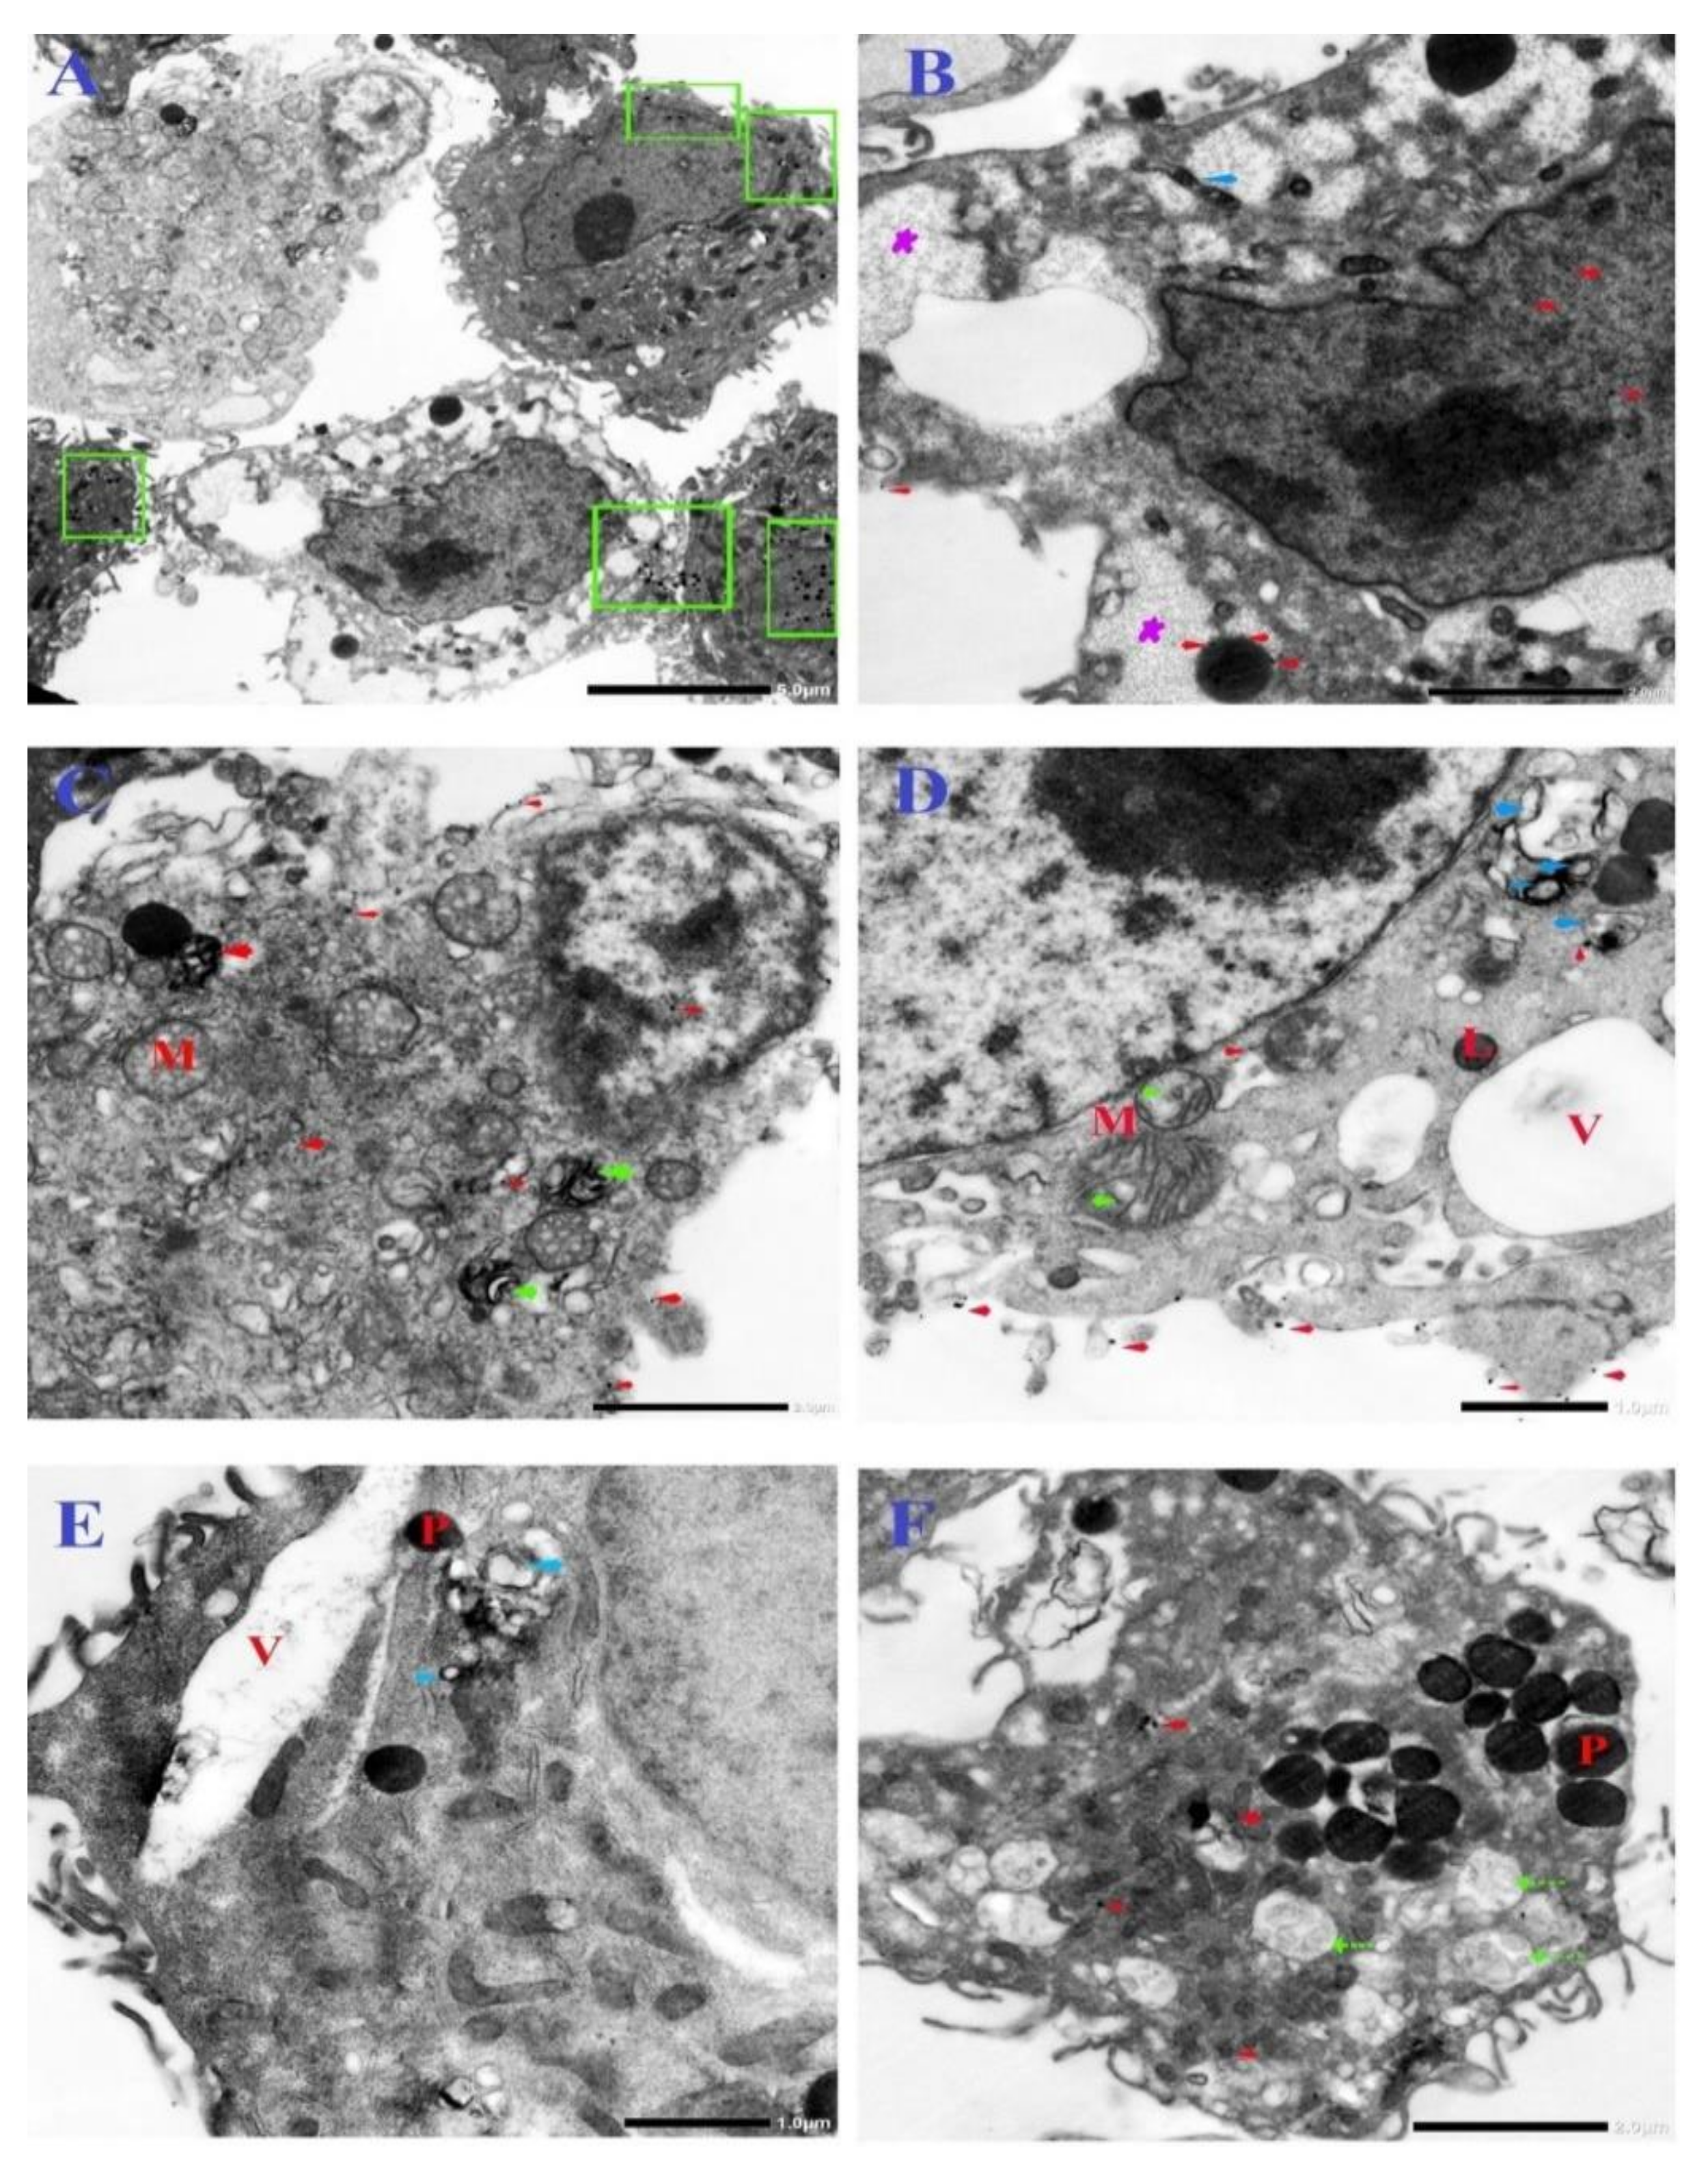
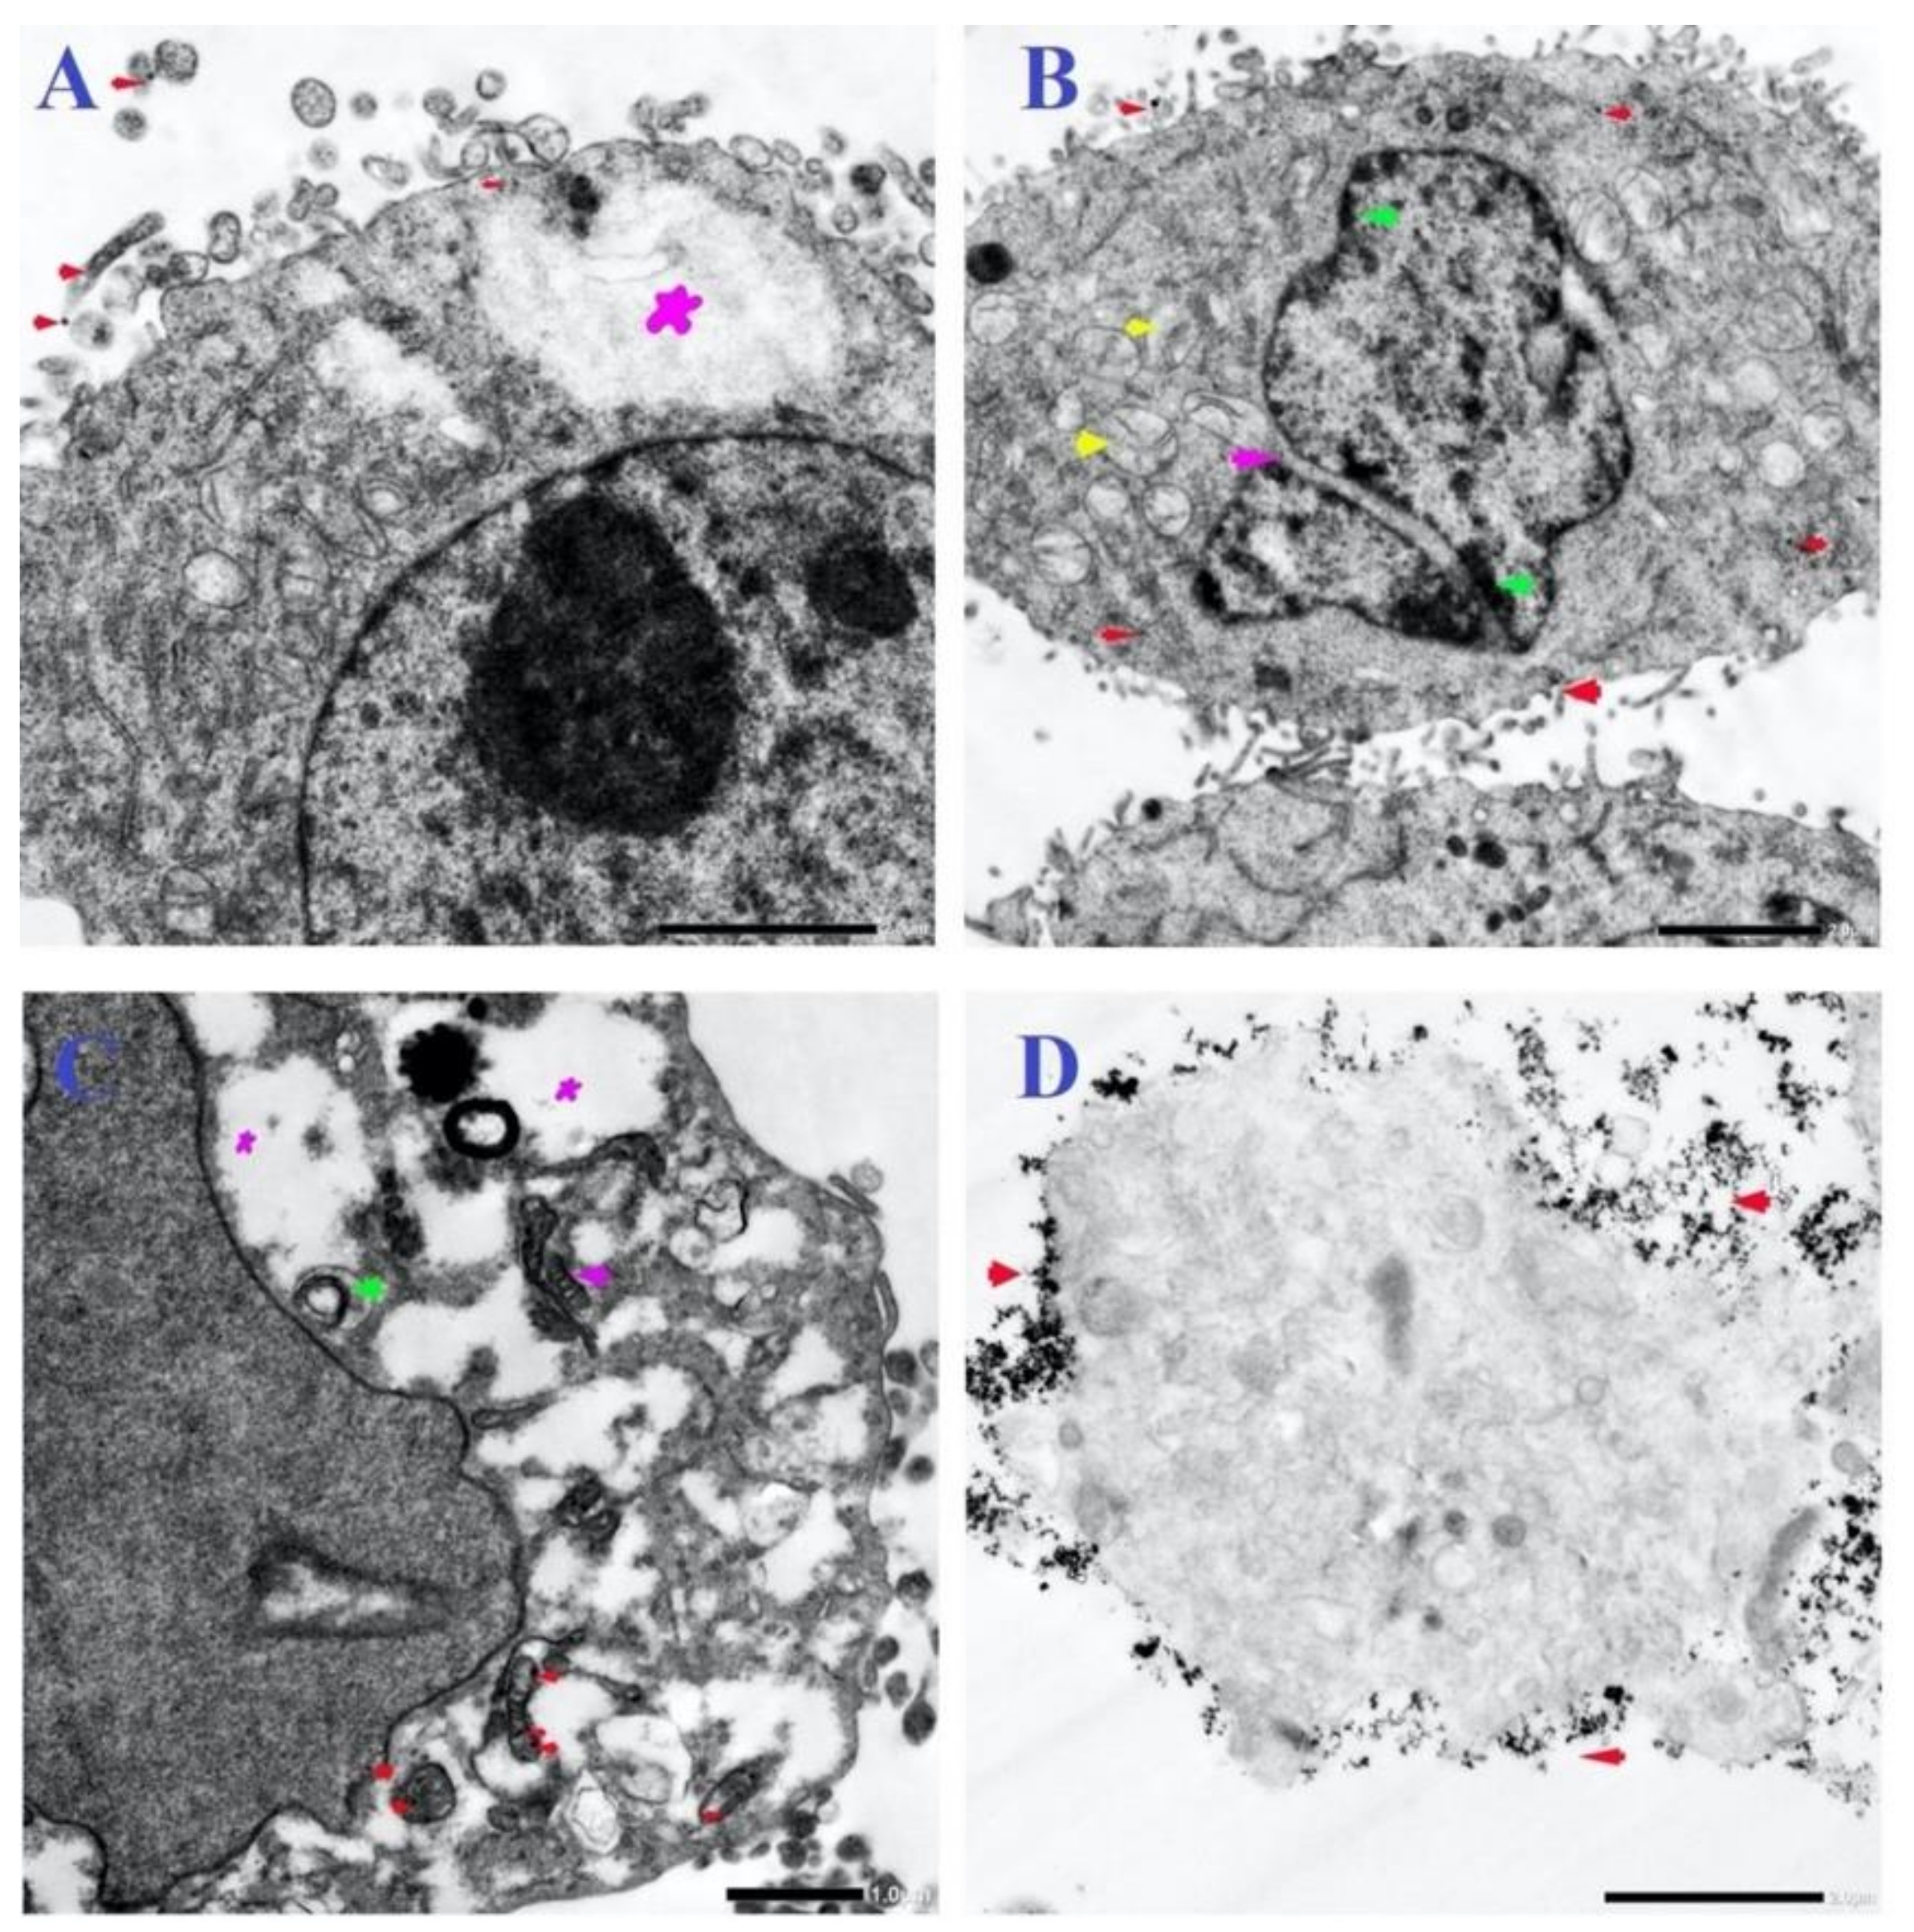
3.6. Ultrastructural Changes of Treated Cells with N-SNPs

TEM was used to investigate the toxic effects of N-SNPs on cellular structures and their interactions with organelles. The TEM micrographs of untreated MCF-7, HCT-116, and HepG2 cells showed typical morphological features of tumor cells, including intact cellular membranes; numerous microvilli and membrane blebbing on the surface of plasma membranes; centric large nuclei with obvious nucleoli, surrounded by intact nuclear membranes; and, a normal distribution of heterochromatin. In addition, there was a typical distribution of cellular organelles in the cytoplasm, including electron-dense pleomorphic mitochondria, lipid droplets (LDs), few cytoplasmic vacuoles, dense secretory granules that may have been peroxisomes, and endoplasmic reticulum (ER) (Figure 4A–C).
TEM micrographs of MCF-7, HCT-116, and HepG2 cells that were exposed to N-SNPs at concentrations of 27, 28, and 40 µg/mL, respectively, exhibited several morphological changes indicating cell injury and inactivation (unsteady metabolic state). These subcellular changes included irregular cell membranes and a reduction in microvilli and membrane blebbing on the cell surface, as well as cytoplasm condensation (Figure 4D–F). Mitochondria were peripherally aggregated in the cytoplasm, and fragmented oval mitochondria were observed. In addition, oval and spherical mitochondria became markedly swollen in MCF-7 and HCT-116 cells that were treated with N-SNPs, and showed shrinkage in HepG2 cells treated with N-SNPs. In addition, the numbers of cellular organelles showed changes when compared with the corresponding control cells (Figure 5).
For instance, the numbers of mitochondria and peroxisomes in cells that were treated with N-SNPs increased in comparison with those in untreated cells (Figure 6). The amount of ER in the cytoplasm decreased, and, the number of LDs increased; some of the LDs appeared to be fused with oval mitochondria (Figure 4). Moreover, many autophagic vacuoles and less dense endosomes were distributed in the cytoplasm (Figure 7). Folded nuclear membrane and marginated chromatin were also observed. Of note, small, dark electron-dense granules were scattered in the cytoplasm, some of which were attached to the surfaces of peroxisomes, mitochondria, nuclear and plasma membranes, and microvilli and membrane blebs (Figure 7); these particles are believed to have been the SNPs.
Similarly, micrographs of MCF-7, HCT-116, and HepG2 cells that were treated with N-SNPs at concentrations of 54, 56, and 80 µg/mL, respectively, showed distinct features of cellular apoptosis, including the disintegration of cell membranes, disappearance of microvilli and membrane blebbing, and cytoplasmic condensation and dissolution (Figure 4G–K). The mitochondria were found to be aggregated near the cytoplasmic membrane or nuclear envelope. The sizes of spherical and oval mitochondria increased after treatment with N-SNPs in MCF-7 and HCT-116 cells, but decreased in HepG2 cells. The numbers of mitochondria and peroxisomes distributed within the cytoplasm were higher in treated cells compared with untreated cells (Figure 6). A large number of primary lysosomes, condensation of lipid droplets, extensive cytoplasmic vacuoles, and a sparse distribution of ER were observed. Irregular or absent nuclear envelopes were only observed in MCF-7 and HCT-116 cells that were treated with N-SNPs at IC50. The nuclei of MCF-7 and HepG2 cells possessed peripheral heterochromatin restricted to the nuclear membrane, and aggregated patches or islands of heterochromatin were scattered within the nuclear matrix; however, the heterochromatin of HCT-116 cell nuclei was peripherally agglomerated near the cellular membrane. Moreover, some HCT-116 cells treated with N-SNPs at IC50 had fragmented nuclei (Figure 8). Dark, electron-dense spherical particles were attached to cellular and nuclear membranes and to the surfaces of mitochondria, vacuoles, and lipid bodies; these particles may have been SNPs (Figure 8).
The analysis of morphometric measurements revealed that both concentrations (IC25 and IC50) of N-SNPs induced changes in cell, nuclear, and mitochondrial dimensions as compared with control cells. Treatment with N-SNPs at IC25 led to non-significant increases in cellular lengths and widths in MCF-7 and HCT-116; however, there was no change in HepG2 cell length and a non-significant decrease in their width. Treatment with N-SNPs at IC50 resulted in significant increases in lengths of MCF-7 and HCT-116 cells and an insignificant increase in length of HepG2 cells, as well as non-significant increases in cellular widths of all three cell types (Figure 9A).
Similarly, N-SNPs at IC25 led to non-significant increases in both nuclear dimensions of MCF-7 cells, as well as a non-significant decrease in HCT-116 nuclear length and a non-significant increase in width. The nuclei of HepG2 cells treated with N-SNPs at IC25 showed non-significant decreases in both length and width. N-SNPs at IC50 resulted in non-significant increases in nuclear lengths in MCF-7, HCT-116, and HepG2 cells, and insignificant decreases in nuclear widths (Figure 9B).
In addition, both concentrations of N-SNPs led to significant changes in the dimensions of oval and spherical mitochondria (Figure 10A–C). In MCF-7 and HCT-116 cells, exposure to both concentrations of N-SNPs caused changes in the dimensions of oval mitochondria, with non-significant increases in length and significant decreases in width. Both concentrations of N-SNPs resulted in decreased oval mitochondria dimensions in HepG2.
In MCF-7 cells that were treated with N-SNPs at IC25, there was a significant increase in spherical mitochondria diameter (SMD), whereas treatment with N-SNPs at IC50 resulted in a non-significant decrease in SMD. By contrast, both concentrations of N-SNPs resulted in a significant increase in SMD in HCT-116 cells, but a non-significant decrease in HepG2 cells (Figure 10D). Interestingly, greater changes in oval mitochondria dimensions and SMD occurred in cells that were treated with N-SNPs at IC25 as compared with IC50.

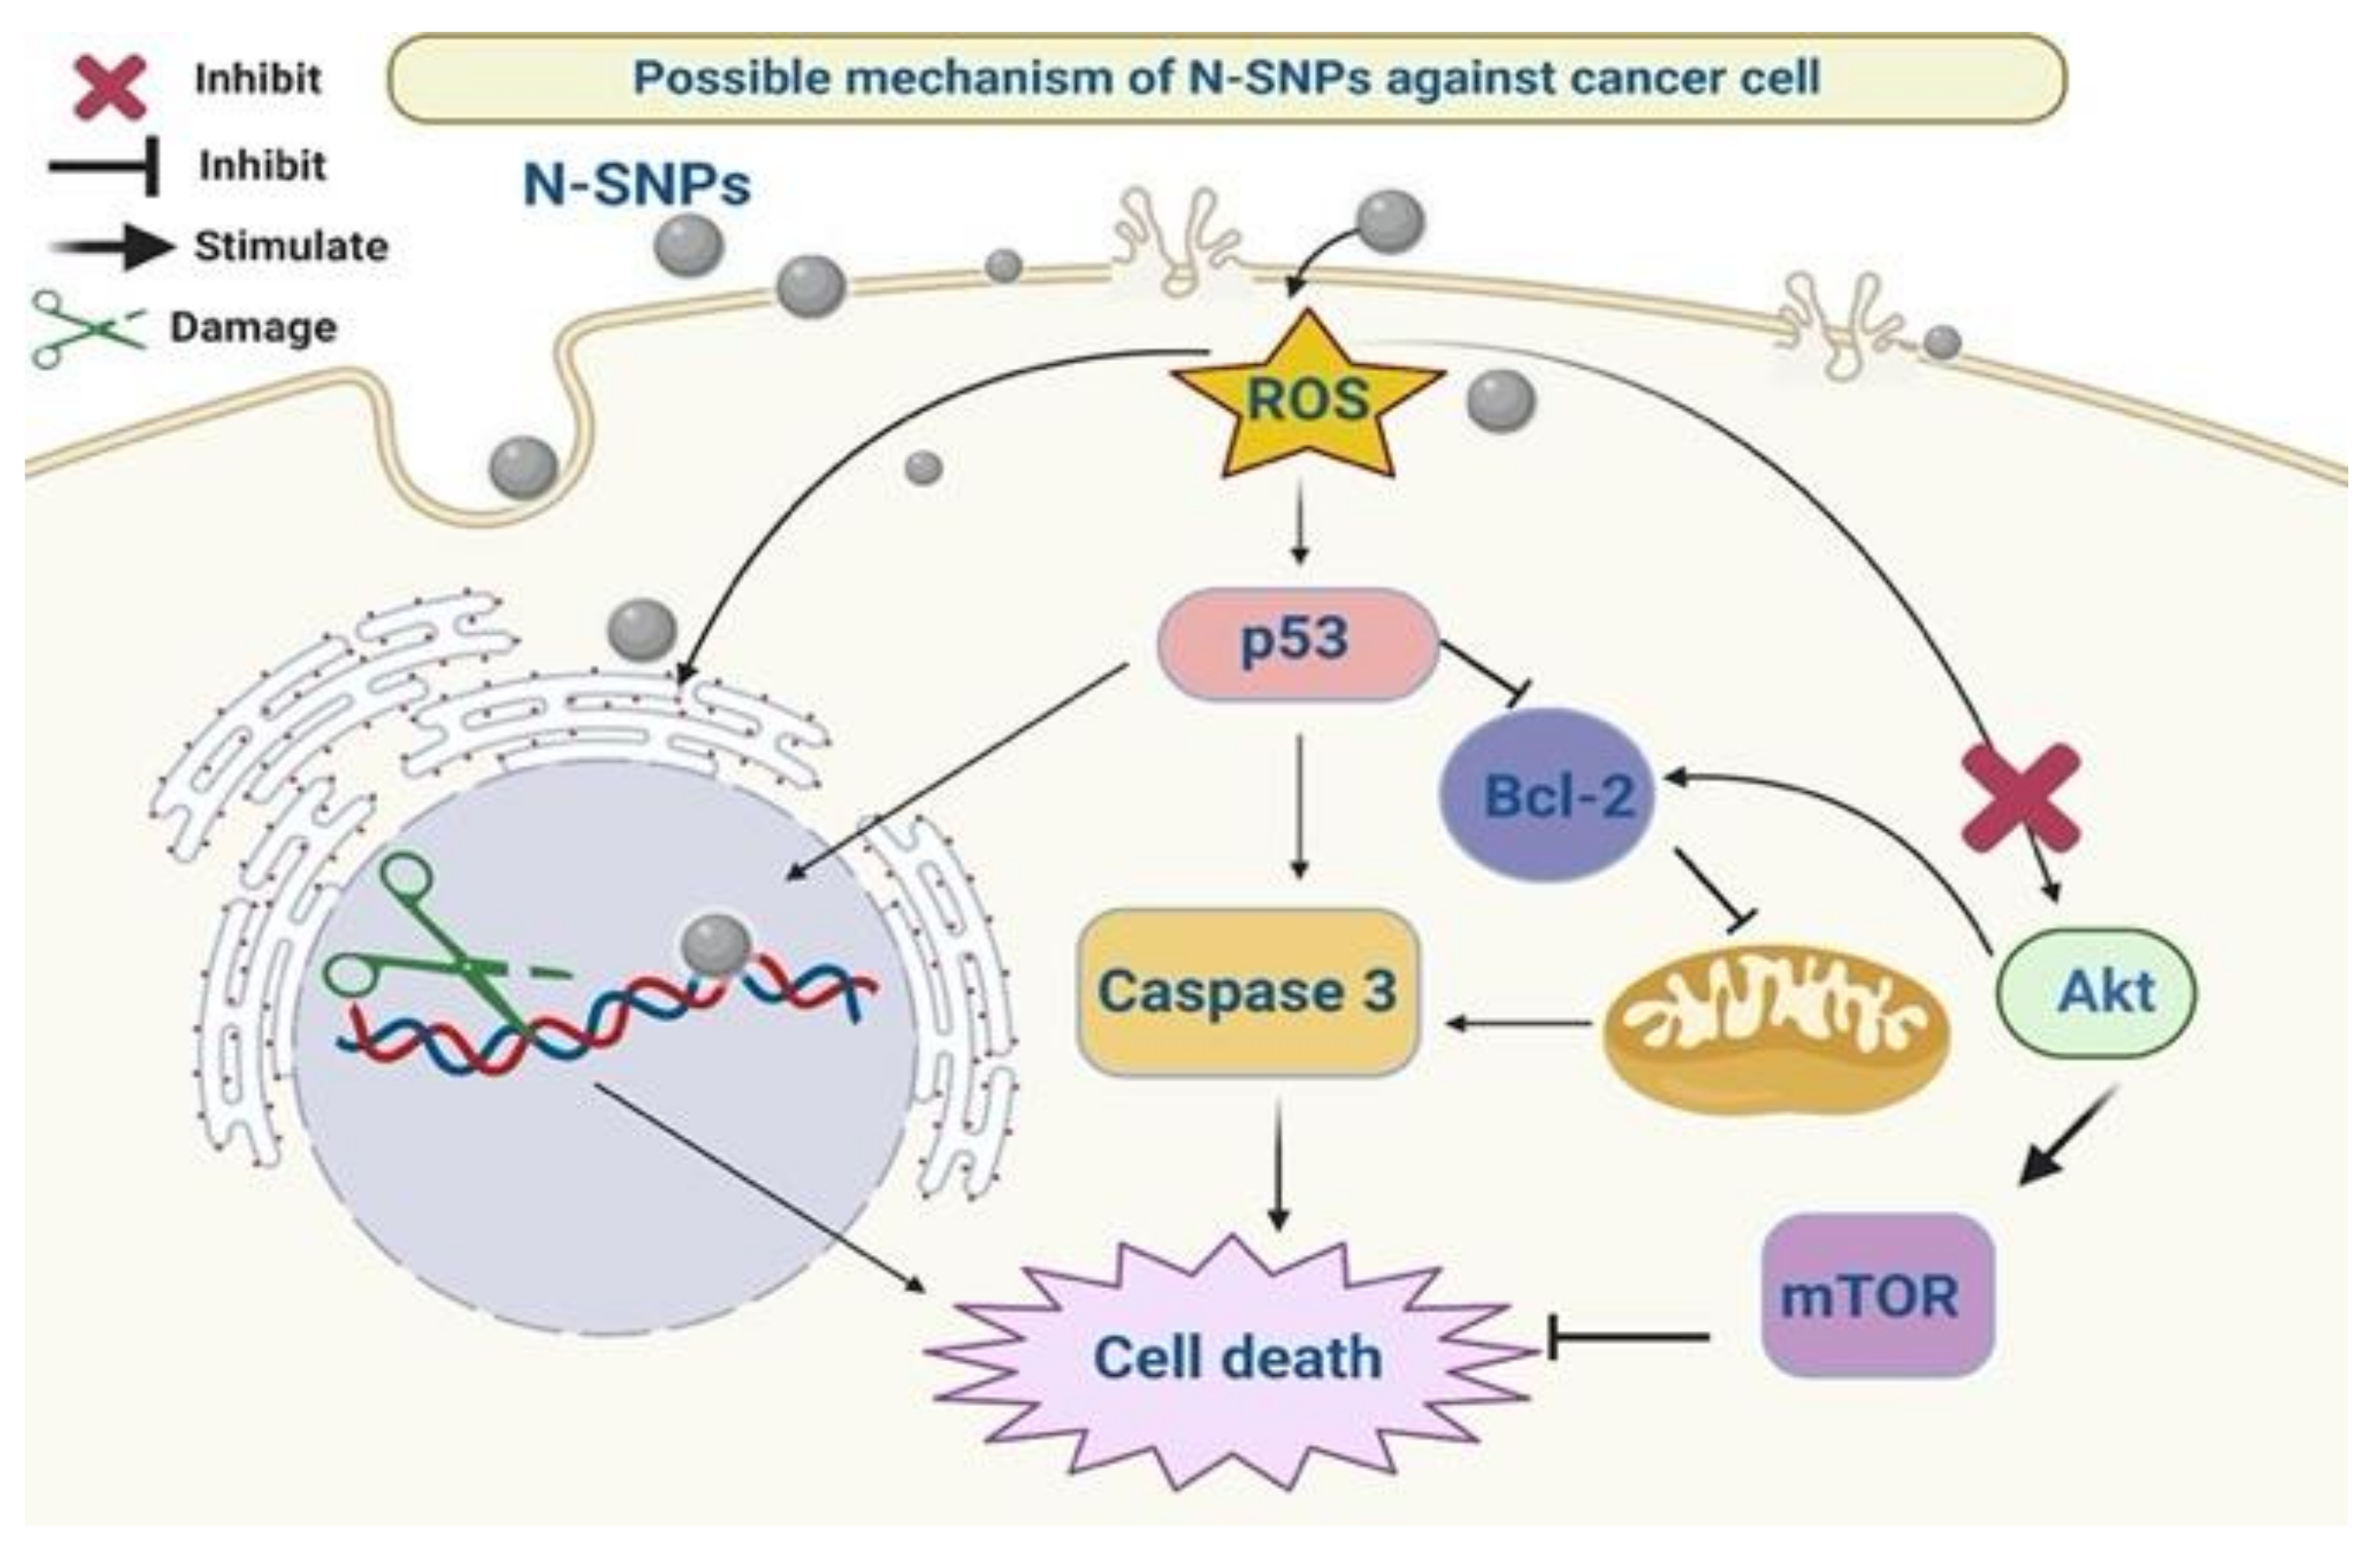
3.7. Western Blotting Technique
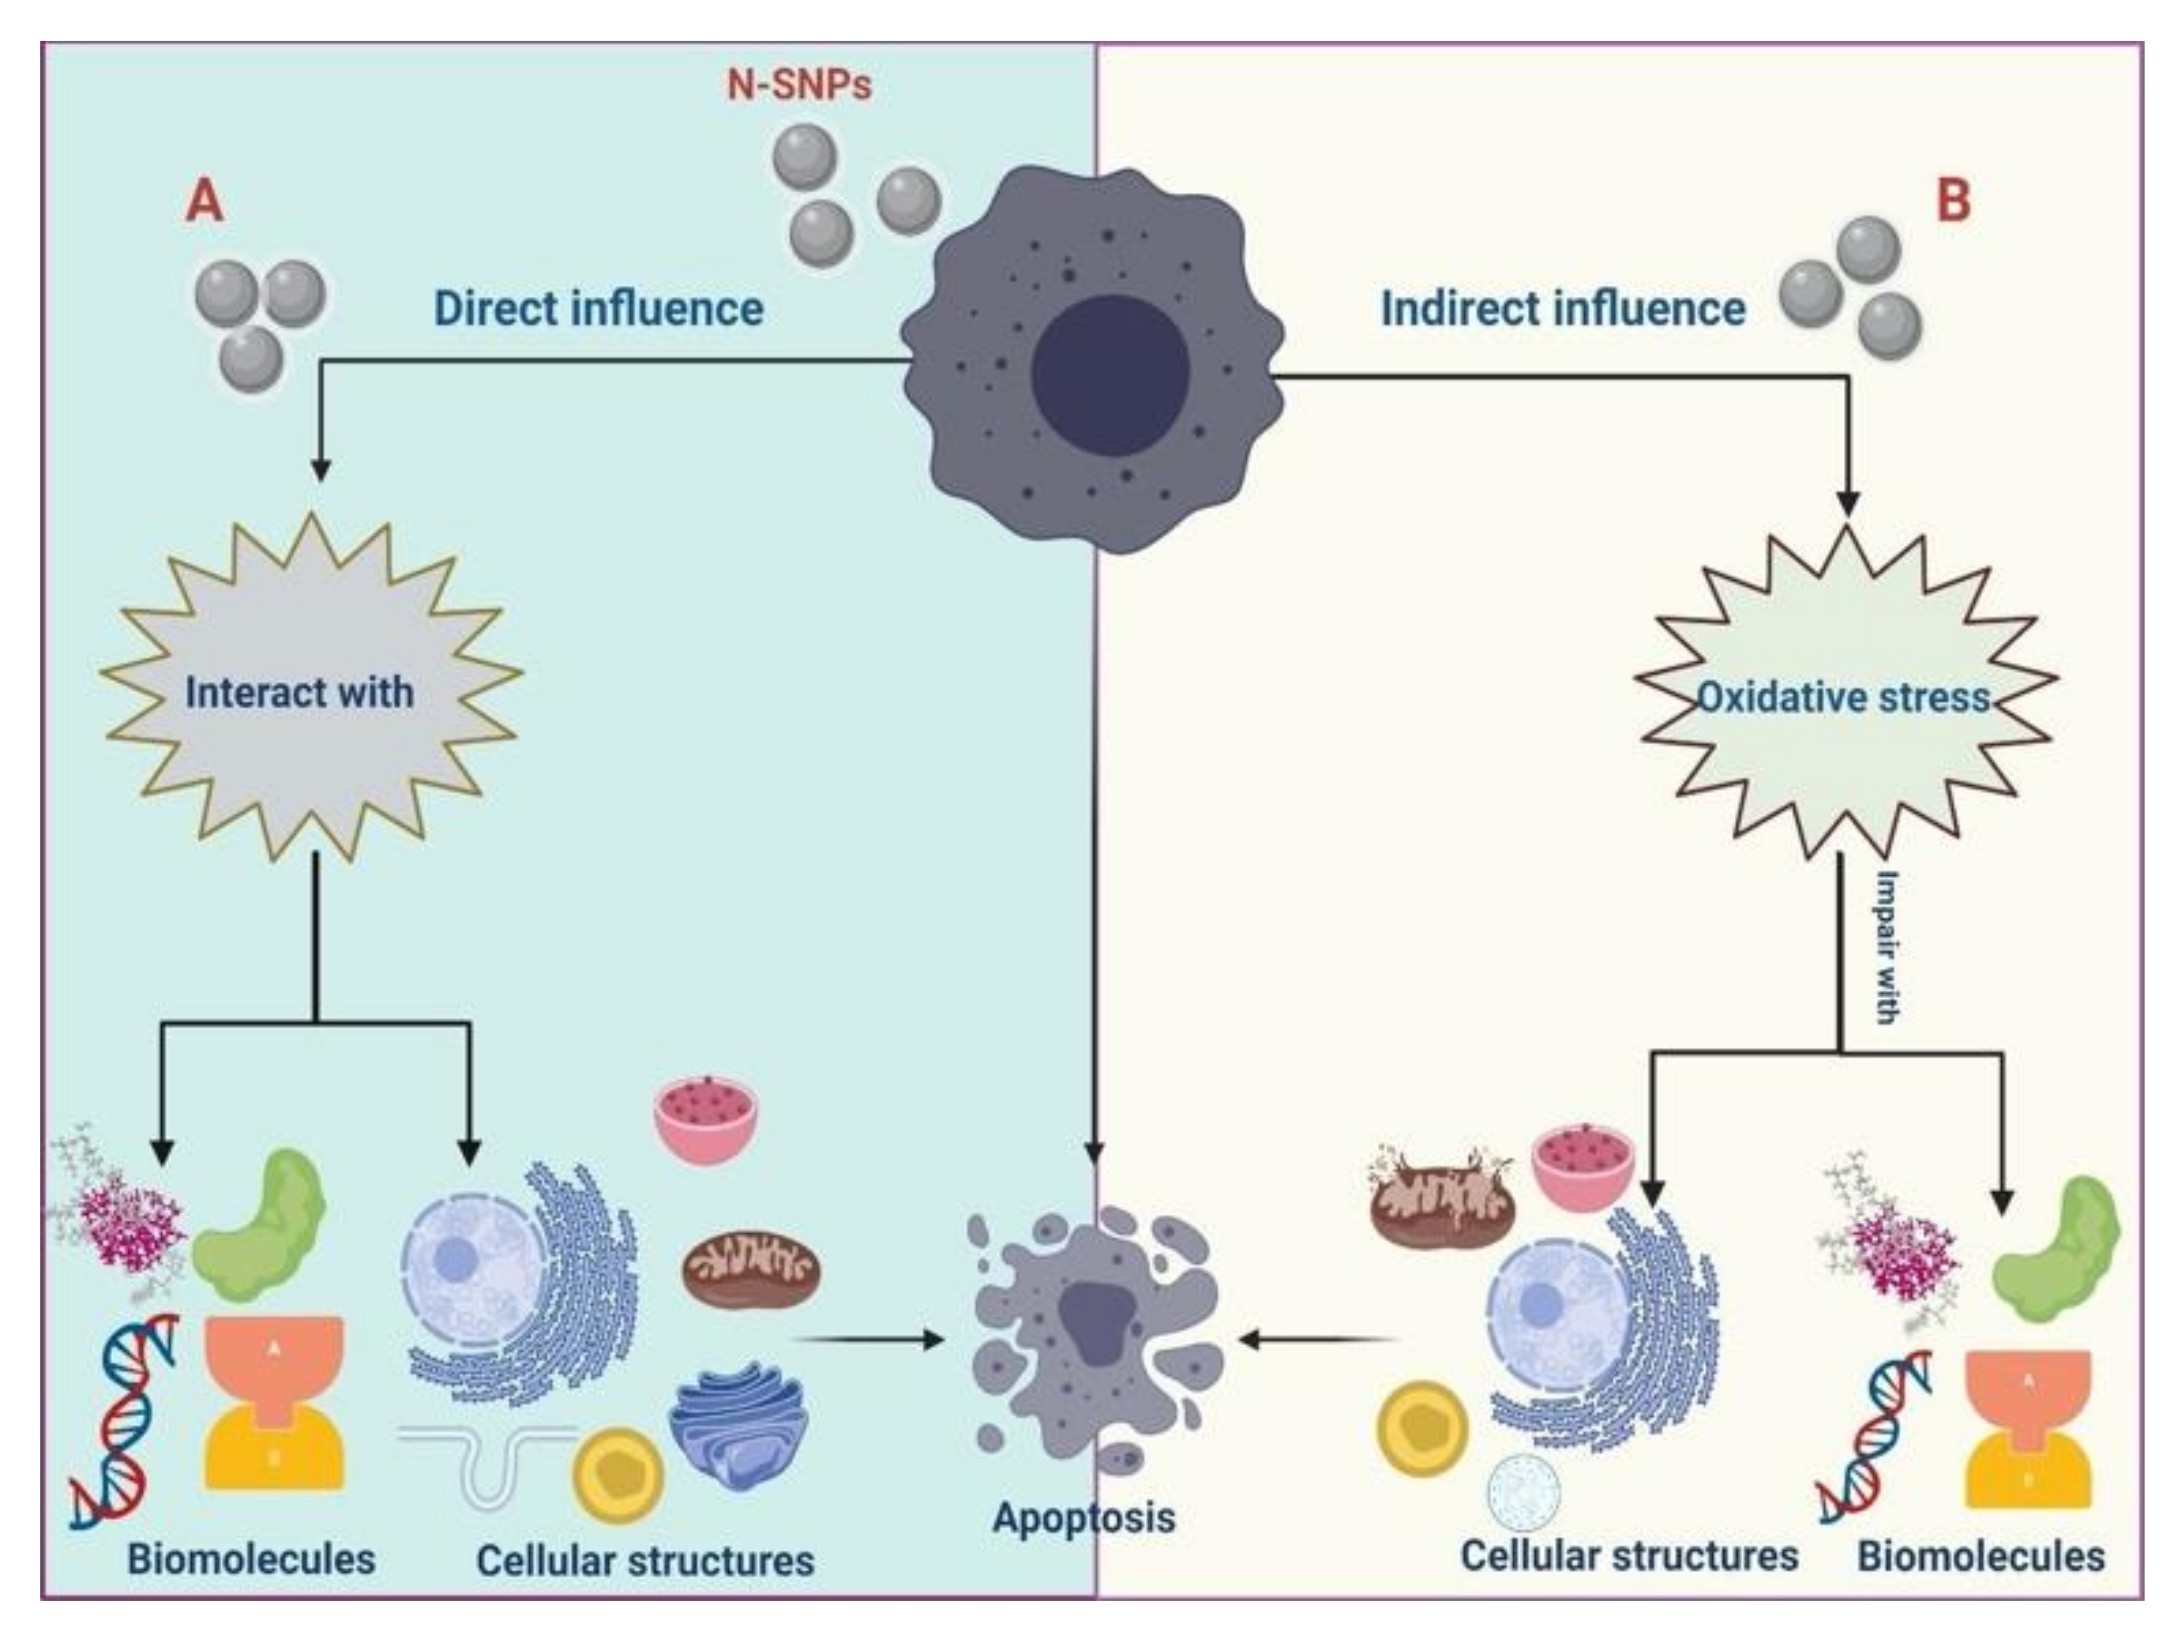
The ability of N-SNPs (at IC25 and IC50) to induce apoptotic cell death pathways in the three tested types cells (MCF-7, HCT-116, and HepG2) was evaluated against several apoptotic marker proteins (Akt, p-Akt, Bcl-2, mTOR, p53, and caspase 3) using western blotting (Figure 11, the whole WB images can be found in Figures S2–S8).
N-SNPs at IC25 and IC50 caused the downregulation of apoptosis-evading protein (Akt, p-Akt, Bcl-2, and mTOR) expression level in MCF-7, HCT-116, and HepG2 cells in a dose-dependent manner. N-SNPs at IC50 caused a greater decrease in Akt, p-Akt, Bcl-2, and mTOR protein expression levels when compared with N-SNPs at IC25 and no treatment.
By contrast, protein expression levels of p53 and caspase 3 were increased after treatment of MCF-7, HCT-116, and HepG2 cells with N-SNPs at IC25 or IC50. Similarly, the higher concentration of N-SNPs (IC50) caused a greater increase in both p53 and caspase 3 protein expression levels. Only MCF-7 and HepG2 cells that were treated with N-SNPs at IC50 showed cleavage of caspase 3; their western blots exhibited two protein bands (34 and 20 kDa, respectively), whereas that of HCT-116 only showed one caspase 3 protein band (34 kDa).

4. Discussion

In this study, we screened, for the first time, the cytotoxic activity of SNPs that were synthesized using novel cyanobacteria strain Nostoc Bahar M against three types of cancer cells, MCF-7, HCT-116, and HepG2, and investigated the possible mechanism of action. The results showed that the N-SNPs were cytotoxic; they caused cellular and subcellular morphological alterations, enhanced oxidative stress and metabolic toxicity, and eventually induced apoptotic cell death via downregulating the expression of Akt, p-Akt, mTOR, and Bcl-2 proteins and upregulating the expression of p53 and caspase 3 proteins
Cell viability assays showed that the N-SNPs acted as potent antiproliferative agents against MCF-7, HCT-116, and HepG2 cells (with IC50 values of 54, 56, and 80 µg/mL, respectively) in a dose-dependent manner. A recent study showed that SNPs (4.5–26 nm) synthesized using cyanobacteria Desertifilum sp. had dose-dependent cytotoxic activity against various cancer cell types, including HepG2, MCF-7, and Caco-2 cells (IC50 values of 32, 58, and 90 µg/mL, respectively). Similarly, Bin-Meferij and Hamida reported that SNPs (14.9 nm) that were synthesized using Nostoc Bahar M sp. significantly inhibited the growth of colon cancer cells with an IC50 of 150 µg/mL in a dose-dependent manner.
Furthermore, SNPs produced by Piper longum fruit extract showed cytotoxic activity against MCF-7 cells with an IC50 of 67 µg/mL [47]. SNPs that were fabricated by Lavandula dentata leaf extracts (284.5 nm) exhibited stronger antiproliferative activity against HCT-116 (IC50 59.79 µg/mL) than those that were synthesized by Olea chrysophylla extract (328.6 nm; IC50 99.35 µg/mL) [48]. The remarkably high degree of cell death caused by N-SNPs could be due to their small size and strong affinity to cell membranes, which facilitates their diffusion into cells; in addition, the Nostoc biomaterial coat surrounding SNPs may increase their stability and aid in intracellular uptake.
Inverted light micrographs showed that both concentrations of N-SNPs (IC25 and IC50) caused morphological changes; however, IC50 caused more drastic apoptosis-related alterations, including cell shrinkage, detachment, clustering, and rounding [24,49]. These cytomorphological changes may be attributed to the small size of N-SNPs, which enables them to interact with cellular structures, such as membranes, mitochondria, endoplasmic reticulum, and the nucleus, and cellular components, such as nucleic acids, proteins, and enzymes, leading to cellular dysfunction and cell death [24].
Analyses of enzymes and antioxidants showed that both concentrations of N-SNPs led to imbalances in ATPase, LDH, GPx, and GSH activities. The LDH leakage assay is used to estimate the toxicity of drugs against living cells based on the leakage of intracellular LDH into the extracellular matrix via impaired cellular membranes. LDH is a soluble cytoplasmic enzymes that exists in nearly all cells and it is liberated into the extracellular space through damaged plasma membranes [50,51]. The significant increase in LDH levels observed in the assay revealed that N-SNPs caused membrane disruption that influenced membrane integrity and permeability [52]. Yuan et al. [53] showed that SNPs (1 µM) alone or conjugated with camptothecin (1:1 µM) increased LDH leakage levels in HeLa cells, which indicated that SNPs influence plasma membrane integrity.
The decrease in ATPase activity after exposure of cells to N-SNPs could be attributed to the induction of oxidative stress, which inhibits the activity and expression of ATPase, resulting in imbalances in cellular homeostasis and eventual damage to cells. It could also be due to the direct interaction of N-SNPs with ATPase or mitochondrial membranes, resulting in the denaturation of enzymes and mitochondrial dysfunction. Chen et al. [54] showed that ZnO NPs caused cytotoxicity in murine photoreceptor cells via potassium channel blocking and Na+/K+-ATPase suppression. Kandil et al. [55] showed that gallium NPs caused a decrease in ATPase levels in Ehrlich carcinoma-bearing mice and, when accompanied by low gamma radiation intensity, significantly increased ATPase enzyme activity. They also found that gallium influenced cell membrane permeability and ATPase activity.
Antioxidants and antioxidant enzymes are the primary defense system against oxidative stress. In the first line of defense, antioxidant enzymes, such as superoxide dismutase and catalase, convert ROS into less damaging materials. The second tier of defense involves enzymes, such as GPx and glutathione S-transferases (GSTs), which detoxify the reactive intermediates. GSH plays an important part in the defense mechanism against oxidative stress as a free-radical scavenger and it can conjugate reactive intermediates via GSTs and GPx. Any imbalance in the activities of these antioxidants results in intensive oxidative stress [56,57]. The significant increase in GPx activity and decrease in GSH levels observed in the current study indicate that N-SNPs may stimulate the production of ROS, thereby inducing oxidative stress [53]. These data are in accordance with the findings of Petković et al. [58] who reported that TiO2 NPs caused a significant increase in GPx activity and decrease in GSH activity in HepG2 cells when compared with untreated cells. Al-Sheddi et al. [59] reported that the exposure of HeLa cells to different concentrations of SNPs (5, 10, and 25 μg/mL) caused increases in GSH levels of 40%, 55%, and 69%, respectively, as compared with untreated cells.
The TEM images showed that both concentrations of N-SNPs induced several cellular alterations that were related to cell death in a dose-dependent manner (Figure 5). These ultrastructural alterations may have been caused by direct interactions between NPs and cell structures, and/or via the induction of oxidative stress by NPs, leading to cell damage [32,60,61].
The morphological changes that appeared after treatment of cells with N-SNPs can be divided into three general subcellular alteration patterns. The first pattern involves changes related to cell borders, including cell membrane disruption, folded membranes, and disappearance or reduced incidence of microvilli and membrane blebbing [62]. These changes were consistent with the results of the LDH enzyme analysis, which indicated that N-SNPs influenced membrane integrity and permeability. Moreover, the reduction in microvilli and plasma membrane blebbing after exposure to N-SNPs indicated that these NPs may influence the metastatic characteristics of cancer cells [63]. Sathishkumar et al. [64] showed that SNPs biosynthesized using an aqueous leaf extract of Alternanthera tenella significantly inhibited MCF-7 cell proliferation and migration.
The second pattern comprised changes that occurred in the cytoplasm, including cytoplasmic dissolution and condensation, and those that occurred in cellular organelles. In MCF-7 and HCT-116 cells, N-SNPs increased the swelling of mitochondria and caused damage to their outer and inner membranes as well as their matrix and cristae. This suggests that the mechanism by which N-SNPs are toxic to cells involves their ability to induce oxidative stress via increasing ROS production; specifically, an increase in swelling of mitochondria enhances membrane fluidity and ROS generation and, thus, inhibits the respiration process [65]. These results were consistent with the data from the antioxidant analysis, which suggested that N-SNPs induced oxidative stress. On the other hand, HepG2 cells that were treated with N-SNPs showed a different response, in which the mitochondria size was decreased, which indicated that N-SNPs may exert their toxic effects against HepG2 cells by causing abnormalities in mitochondrial function [66]. It is clear that the response of cancer cells toward N-SNPs differs according to the cell type.
An increase in number of mitochondria is associated with the use of stored cellular energy reserves in response to nutrient deprivation or exercise [67]. Thus, the intensive stress caused by N-SNPs may cause an increase in the number of mitochondria in cells, in order to generate more energy and avoid this stress [68]. Moreover, the dose-dependent increase in number of peroxisomes observed in all tested cells after exposure to N-SNPs may indicate that N-SNPs kill cancer cells via inducing oxidative stress, as ROS can be generated in peroxisomes by the production of H2O2 during fatty acid oxidation [69,70]. The high incidence of LDs observed in cells that were treated with N-SNPs indicates that N-SNPs may impair lipid catabolic activity, or that the use of fatty acids by cells may decrease, owing to nanotoxicity.
Khatchadourian and Maysinger showed that the accumulation of LDs is a biomarker of oxidative stress and lipid homeostasis [71]. The fragmentation and dilation of ER and sparse distribution of ER observed in cells treated with N-SNPs indicate that these NPs caused ER stress and influenced the protein synthesis process [72]. These observations are consistent with the western blotting results, in which Akt and mTOR protein activity decreased after the treatment of cells with N-SNPs. In cancer cells, protein synthesis relies on mTOR signaling, in which the activation of mTOR activity enhances S6K and then S6 protein expression to synthesize proteins [73,74]. Thus, the downregulation of these proteins may impair protein synthesis. Kuang et al. [75] studied the effects of ZnO NPs on mouse liver and found that the NPs induced ER stress over an extended period of time, which activated apoptotic cell death pathways. The increases in numbers of lysosomes, endosomes, and autophagic vacuoles demonstrate that the N-SNPs have the potential to induce apoptosis as well as autophagic pathways [69,76].
The third pattern of subcellular alterations comprised nuclear alterations, such as disappearance or irregularities of the nuclear membrane, nucleoagglomeration, and dominant distribution of marginated heterochromatin and condensed chromatin. These observations indicated that N-SNPs may induce cell apoptosis by causing genetic damage [77]. This is consistent with data from the western blotting assay, in which p53 protein expression increased in all tested cells after exposure to N-SNPs, indicating DNA damage [36].
In addition, N-SNPs were successfully ingested into cancer cells and they were located in various cellular positions, including membranes, mitochondria, LDs, and peroxisomes; this may have been because their smaller size, charge, and bio-coat facilitated the internalization of the N-SNPs [68,78]. All of the previous observations indicate that N-SNPs induce cancer cells to undergo cell death via direct interactions with various organelles and biomolecules and/or via inducing oxidative stress, which causes organelle dysfunction and morphological changes leading to cell death.
N-SNPs enhanced cell death pathways by suppressing the expression of antiapoptotic proteins (Akt, p-Akt, mTOR, Bcl-2) and promoting the activity of apoptotic proteins (p53 and caspase 3), possibly via inducing oxidative stress and/or through interactions with cellular components and organelles, such as DNA and mitochondria. The tumor suppressor p53 has a crucial role in the response to cellular stress; it regulates many genes that are involved in numerous cellular process, including DNA damage repair, cell cycle arrest, apoptosis, and cell survival [79]. The observed upregulation of p53 protein may indicate that N-SNPs directly and/or indirectly interact (via oxidative stress) with DNA, causing DNA damage that stimulates cell death pathways [36]. This would be in accordance with the TEM images, which showed that N-SNPs caused nuclear morphological alterations, nucleoagglomeration, and nuclear damage.
Caspase 3 is a well-known major executor of the apoptosis pathway that orchestrates cellular destruction with proteolytic cascades [80]. Bcl-2 is a crucial protein that is involved in the mitochondrial apoptosis pathway, with the ability to control the permeability of the mitochondrial inner membrane [81,82]. Our results showed that N-SNPs increased the expression levels of caspase 3 and decreased the expression of Bcl-2, which suggests that N-SNPs may induce apoptosis via the mitochondrial signaling pathway [9,83].
Yao et al. [84] showed that PI3K/Akt/mTOR signaling is one of the classical pathways that suppresses apoptosis. Here, N-SNPs decreased the expression levels of Akt, p-Akt, and mTOR proteins, which suggests that N-SNPs suppress cell survival pathways via inhibiting mTOR signaling [36,83]. In addition, phosphorylated Akt can regulate cellular functions by regulating the phosphorylation of its downstream substrates, for example, controlling apoptosis via the regulation of Bcl-2 activity [85]. The observed imbalance in apoptosis-mediating proteins suggests that N-SNPs enhance programmed cell death by stimulating p53 and caspase 3 signaling, as well as suppressing cell survival pathways via inhibiting mTOR signaling [36,74]. Thus, we can hypothesize that N-SNPs have a broad range of cell-killing strategies, owing to their influence on various molecular pathways (Figure 12).
The influence of N-SNPs on apoptosis-mediating proteins of MCF-7 and HepG2 cells was dose dependent; however, p53 and caspase 3 proteins in HCT-116 cells exhibited a different response, showing the highest expression levels after exposure to N-SNPs at IC25 rather than at IC50. This suggests that these apoptotic proteins are stabilized at low concentrations of NPs [86]. Thus, we suggest that the potential of NPs to induce cell death in cancer cells may be dependent on the concentration of NPs, the cell type, and cellular resistance.

5. Conclusions

We conclusively demonstrated the cytotoxicity of novel N-SNPs against MCF-7, HepG2, and HCT-116 cells by various experiments, including cell viability assays, inverted light microscopy and TEM, antioxidative marker and enzyme analysis, and western blotting assays. Morphometric measurements based on TEM micrographs were also used to detect changes in the number and size of cells and organelles after treatment with N-SNPs. In all tested cells, N-SNPs led to decreased cell proliferation, imbalances in GPx and GSH causing intensive oxidative stress, increased LDH leakage suggesting loss of membrane integrity, and a reduction in ATPase activity that results in metabolic toxicity. In addition, N-SNPs caused drastic cellular and subcellular alterations, demonstrating the ability of these NPs to induce cell death via interactions with cell membranes and organelles. N-SNP treatment also increased levels of antiapoptotic proteins (Akt, p-Akt, mTOR, and Bcl-2) and decreased levels of apoptotic proteins (p53 and caspase 3). The results indicate that the cytotoxicity of N-SNPs against the tested cells depends on two strategies: first, direct interactions with cellular components and organelles, resulting in cellular dysfunction and then cell death; and/or, second, an indirect influence through inducing oxidative stress, which induces cells to undergo apoptosis via effects on caspase 3 and p53 and the mTOR signaling pathway (Figure 13). The present findings are promising with respect to potential applications of N-SNPs as potent anticancer agents, as their ability to enhance oxidative stress and affect various cellular pathways leads to efficient apoptosis. Further studies are needed in order to explore the toxicity of N-SNPs against normal cell lines as well as their relationship with protein corona to test their selectivity and biocompatibility. Similarly, other studies are necessary to study anticancer activity of N-SNPs in vivo, alone or in combination with other therapeutic agents. The potentiality of these NPs to be functionalized with different therapeutic or functionable molecules for drug delivery or detection applications is needed to explore. More experiments are also required for elucidating the exact molecular pathways by which biogenic SNPs exert their effects on cancer cells.

Supplementary Materials

The following are available online at https://www.mdpi.com/2072-6694/12/8/2099/s1, Figure S1: Effects of N-SNPs (IC25 and IC50) on antiapoptotic (Akt, p-Akt, Bcl-2, and mTOR) and apoptotic (p53 and caspase 3) protein expression levels in MCF-7, HCT-116, and HepG2 cells. Figures S2–S8: Uncropped images of the Western blots were utilized for the composition of Figure 11.

Author Contributions

R.S.H. contributed to the conception and design of the study. R.S.H., M.M.B.-M., and G.A. downloaded and organized datasets. R.S.H. performed the statistical analysis and wrote the first draft of the manuscript. All authors contributed to manuscript revision, and have read and approved the submitted version.

Funding

This work was supported by the Deanship of Scientific Research, Princess Nourah bint Abdulrahman University, through the Program of Research Project Funding After Publication [grant number 41- PRFA-P-32].

Conflicts of Interest

The authors declare that this research was conducted in the absence of any commercial or financial relationship that could be construed as a potential conflict of interest.

Abbreviations

NPsNanoparticles
SNPsSilver nanoparticles
nmNanometer
minMinute
µLMicroliter
mgMilligram
mLMilliliter
µgMicrogram
mMMillimolar
hHour
rpmRevolutions per minute
kVKilovolt
kbKilobase

References

  1. Ferlay, J.; Colombet, M.; Soerjomataram, I.; Mathers, C.; Parkin, D.M.; Piñeros, M.; Znaor, A.; Bray, F. Estimating the global cancer incidence and mortality in 2018: GLOBOCAN sources and methods. Int. J. Cancer 2018, 144, 1941–1953. [Google Scholar] [CrossRef] [PubMed] [Green Version]
  2. Yezhelyev, M.V.; Gao, X.; Xing, Y.; Al-Hajj, A.; Nie, S.; O’Regan, R.M. Emerging use of nanoparticles in diagnosis and treatment of breast cancer. Lancet Oncol. 2006, 7, 657–667. [Google Scholar] [CrossRef]
  3. Stephens, L.; Williams, R.L.; Hawkins, P. Phosphoinositide 3-kinases as drug targets in cancer. Curr. Opin. Pharmacol. 2005, 5, 357–365. [Google Scholar] [CrossRef] [PubMed]
  4. Rajeswaran, A.; Trojan, A.; Burnand, B.; Giannelli, M. Efficacy and side effects of cisplatin- and carboplatin-based doublet chemotherapeutic regimens versus non-platinum-based doublet chemotherapeutic regimens as first line treatment of metastatic non-small cell lung carcinoma: A systematic review of randomized controlled trials. Lung Cancer 2008, 59, 1–11. [Google Scholar] [CrossRef] [PubMed]
  5. Navya, P.N.; Kaphle, A.; Srinivas, S.P.; Bhargava, S.K.; Rotello, V.M.; Daima, H.K. Current trends and challenges in cancer management and therapy using designer nanomaterials. Nano Converg. 2019, 6, 23. [Google Scholar] [CrossRef] [Green Version]
  6. Goldberg, M.S. Improving cancer immunotherapy through nanotechnology. Nat. Rev. Cancer 2019, 19, 587–602. [Google Scholar] [CrossRef]
  7. Rosenblum, D.; Joshi, N.; Tao, W.; Karp, J.M.; Peer, D. Progress and challenges towards targeted delivery of cancer therapeutics. Nat. Commun. 2018, 9, 1410. [Google Scholar] [CrossRef] [Green Version]
  8. McNamara, K.; Tofail, S.A.M. Nanosystems: The use of nanoalloys, metallic, bimetallic, and magnetic nanoparticles in biomedical applications. Phys. Chem. Chem. Phys. 2015, 17, 27981–27995. [Google Scholar] [CrossRef]
  9. Sanpui, P.; Chattopadhyay, A.; Ghosh, S.S. Induction of Apoptosis in Cancer Cells at Low Silver Nanoparticle Concentrations using Chitosan Nanocarrier. ACS Appl. Mater. Interfaces 2011, 3, 218–228. [Google Scholar] [CrossRef]
  10. Lohcharoenkal, W.; Wang, L.; Chen, Y.C.; Rojanasakul, Y. Protein Nanoparticles as Drug Delivery Carriers for Cancer Therapy. BioMed Res. Int. 2014, 2014, 1–12. [Google Scholar] [CrossRef] [Green Version]
  11. Lee, K.J.; Nallathamby, P.D.; Browning, L.M.; Osgood, C.J.; Xu, X.-H.N. In Vivo Imaging of Transport and Biocompatibility of Single Silver Nanoparticles in Early Development of Zebrafish Embryos. ACS Nano 2007, 1, 133–143. [Google Scholar] [CrossRef] [PubMed] [Green Version]
  12. Hamida, R.S.; Ali, M.A.; Goda, D.A.; Khalil, M.; Al-Zaban, M.I. Novel Biogenic Silver Nanoparticle-Induced Reactive Oxygen Species Inhibit the Biofilm Formation and Virulence Activities of Methicillin-Resistant Staphylococcus aureus (MRSA) Strain. Front. Bioeng. Biotechnol. 2020, 8, 1–14. [Google Scholar] [CrossRef] [PubMed]
  13. Draz, M.S.; Shafiee, H. Applications of gold nanoparticles in virus detection. Theranostics 2018, 8, 1985–2017. [Google Scholar] [CrossRef]
  14. Tiwari, S.B.; Amiji, S.B.T.A.M.M. A Review of Nanocarrier-Based CNS Delivery Systems. Curr. Drug Deliv. 2006, 3, 219–232. [Google Scholar] [CrossRef] [PubMed]
  15. Sharifi, M.; Avadi, M.R.; Attar, F.; Dashtestani, F.; Ghorchian, H.; Rezayat, S.M.; Saboury, A.A.; Falahati, M. Cancer diagnosis using nanomaterials based electrochemical nanobiosensors. Biosens. Bioelectron. 2019, 126, 773–784. [Google Scholar] [CrossRef]
  16. Huang, T.; Nallathamby, P.D.; Xu, X.-H.N. Photostable Single-Molecule Nanoparticle Optical Biosensors for Real-Time Sensing of Single Cytokine Molecules and Their Binding Reactions. J. Am. Chem. Soc. 2008, 130, 17095–17105. [Google Scholar] [CrossRef] [Green Version]
  17. Thakkar, K.; Mhatre, S.S.; Parikh, R.Y. Biological synthesis of metallic nanoparticles. Nanomed. Nanotechnol. Boil. Med. 2010, 6, 257–262. [Google Scholar] [CrossRef]
  18. Gour, A.; Jain, N.K. Advances in green synthesis of nanoparticles. Artif. Cells, Nanomed. Biotechnol. 2019, 47, 844–851. [Google Scholar] [CrossRef] [Green Version]
  19. Dhand, C.; Dwivedi, N.; Ying, A.N.J.; Lakshminarayanan, R.; Ramakrishna, S.; Loh, X.J.; Verma, N.K.; Beuerman, R.W. Methods and strategies for the synthesis of diverse nanoparticles and their applications: A comprehensive overview. RSC Adv. 2015, 5, 105003–105037. [Google Scholar] [CrossRef]
  20. Shankar, S.; Rai, A.; Ahmad, A.; Sastry, M. Rapid synthesis of Au, Ag, and bimetallic Au core–Ag shell nanoparticles using Neem (Azadirachta indica) leaf broth. J. Colloid Interface Sci. 2004, 275, 496–502. [Google Scholar] [CrossRef]
  21. RajeshKumar, S.; Malarkodi, C.; Vanaja, M.; Annadurai, G. Anticancer and enhanced antimicrobial activity of biosynthesizd silver nanoparticles against clinical pathogens. J. Mol. Struct. 2016, 1116, 165–173. [Google Scholar] [CrossRef]
  22. Raman, J.; Reddy, G.R.; Lakshmanan, H.; Selvaraj, V.; Gajendran, B.; Nanjian, R.; Chinnasamy, A.; Sabaratnam, V. Mycosynthesis and characterization of silver nanoparticles from Pleurotus djamor var. roseus and their in vitro cytotoxicity effect on PC3 cells. Process. Biochem. 2015, 50, 140–147. [Google Scholar] [CrossRef]
  23. Mittal, A.K.; Chisti, Y.; Banerjee, U.C. Synthesis of metallic nanoparticles using plant extracts. Biotechnol. Adv. 2013, 31, 346–356. [Google Scholar] [CrossRef] [PubMed]
  24. Bin-Meferij, M.M.; Hamida, R.S. Biofabrication And Antitumor Activity Of Silver Nanoparticles Utilizing Novel Nostoc sp. Bahar M. Int. J. Nanomed. 2019, 14, 9019–9029. [Google Scholar] [CrossRef] [Green Version]
  25. Asmathunisha, N.; Kathiresan, K. A review on biosynthesis of nanoparticles by marine organisms. Colloids Surf. B Biointerfaces 2013, 103, 283–287. [Google Scholar] [CrossRef] [PubMed]
  26. R, D.; Revaprasadu, N. An in vitro and in vivo bio-interaction responses and biosafety evaluation of novel Au–ZnTe core–shell nanoparticles. Toxicol. Res. 2016, 5, 1078–1089. [Google Scholar] [CrossRef] [Green Version]
  27. Khorrami, S.; Zarrabi, A.; Khaleghi, M.; Danaei, M.; Mozafari, M.R. Selective cytotoxicity of green synthesized silver nanoparticles against the MCF-7 tumor cell line and their enhanced antioxidant and antimicrobial properties. Int. J. Nanomed. 2018, 13, 8013–8024. [Google Scholar] [CrossRef] [Green Version]
  28. El-Naggar, N.E.-A.; Hussein, M.H.; El-Sawah, A.A. Phycobiliprotein-mediated synthesis of biogenic silver nanoparticles, characterization, in vitro and in vivo assessment of anticancer activities. Sci. Rep. 2018, 8, 8925. [Google Scholar] [CrossRef]
  29. Hamida, R.S.; Ali, M.A.; Goda, D.A.; Khalil, M.I.; Redhwan, A. Cytotoxic effect of green silver nanoparticles against ampicillin-resistant Klebsiella pneumoniae. RSC Adv. 2020, 10, 21136–21146. [Google Scholar] [CrossRef]
  30. Mori, Y.; Ono, T.; Miyahira, Y.; Nguyen, V.Q.; Matsui, T.; Ishihara, M. Antiviral activity of silver nanoparticle/chitosan composites against H1N1 influenza A virus. Nanoscale Res. Lett. 2013, 8, 93. [Google Scholar] [CrossRef] [Green Version]
  31. Mazurak, V.C.; Burrell, R.E.; Tredget, E.E.; Clandinin, M.T.; Field, C.J. The effect of treating infected skin grafts with Acticoat™ on immune cells. Burns 2007, 33, 52–58. [Google Scholar] [CrossRef] [PubMed]
  32. Hamida, R.S.; Abdelmeguid, N.E.; Ali, M.A.; Bin-Meferij, M.M.; Kahlil, M. Synthesis of Silver Nanoparticles Using a Novel Cyanobacteria Desertifilum sp. extract: Their Antibacterial and Cytotoxicity Effects. Int. J. Nanomed. 2020, 15, 49–63. [Google Scholar] [CrossRef] [PubMed] [Green Version]
  33. Gurunathan, S.; Qasim, M.; Park, C.H.; Yoo, H.; Kim, J.-H.; Hong, K. Cytotoxic Potential and Molecular Pathway Analysis of Silver Nanoparticles in Human Colon Cancer Cells HCT116. Int. J. Mol. Sci. 2018, 19, 2269. [Google Scholar] [CrossRef] [Green Version]
  34. Liu, C.-G.; Han, Y.-H.; Kankala, R.K.; Wang, S.-B.; Chen, A. Subcellular Performance of Nanoparticles in Cancer Therapy. Int. J. Nanomed. 2020, 15, 675–704. [Google Scholar] [CrossRef] [PubMed] [Green Version]
  35. Krishnamoorthy, K.; Moon, J.Y.; Hyun, H.B.; Cho, S.K.; Kim, S.-J. Mechanistic investigation on the toxicity of MgO nanoparticles toward cancer cells. J. Mater. Chem. 2012, 22, 24610. [Google Scholar] [CrossRef]
  36. Satapathy, S.R.; Mohapatra, P.; Preet, R.; Das, D.; Sarkar, B.; Choudhuri, T.; Wyatt, M.D.; Kundu, C.N. Silver-based nanoparticles induce apoptosis in human colon cancer cells mediated through p53. Nanomedicine 2013, 8, 1307–1322. [Google Scholar] [CrossRef] [PubMed]
  37. Gopinath, P.; Gogoi, S.K.; Chattopadhyay, A.; Ghosh, S.S. Implications of silver nanoparticle induced cell apoptosis forin vitrogene therapy. Nanotechnology 2008, 19, 075104. [Google Scholar] [CrossRef] [PubMed]
  38. Thompson, C. Apoptosis in the pathogenesis and treatment of disease. Science 1995, 267, 1456–1462. [Google Scholar] [CrossRef]
  39. Mosmann, T. Rapid colorimetric assay for cellular growth and survival: Application to proliferation and cytotoxicity assays. J. Immunol. Methods 1983, 65, 55–63. [Google Scholar] [CrossRef]
  40. Buttacavoli, M.; Albanese, N.N.; Di Cara, G.; Alduina, R.; Faleri, C.; Gallo, M.; Pizzolanti, G.; Gallo, G.; Feo, S.; Baldi, F.; et al. Anticancer activity of biogenerated silver nanoparticles: An integrated proteomic investigation. Oncotarget 2017, 9, 9685–9705. [Google Scholar] [CrossRef] [Green Version]
  41. Abrahamse, H.; Harith, M.A.; El-Hussein, A.; Tynga, I. Photodynamic ability of silver nanoparticles in inducing cytotoxic effects in breast and lung cancer cell lines. Int. J. Nanomed. 2014, 9, 3771. [Google Scholar] [CrossRef] [Green Version]
  42. Sabaratnam, V.; Gurunathan, S.; Raman, J.; Malek, S.N.A.; A John, P.; Vikineswary, S. Green synthesis of silver nanoparticles using Ganoderma neo-japonicum Imazeki: A potential cytotoxic agent against breast cancer cells. Int. J. Nanomed. 2013, 8, 4399–4413. [Google Scholar] [CrossRef] [PubMed] [Green Version]
  43. Andrés, M.; Fierro, J. Antimicrobial Mechanism of Action of Transferrins: Selective Inhibition of H+-ATPase. Antimicrob. Agents Chemother. 2010, 54, 4335–4342. [Google Scholar] [CrossRef] [PubMed] [Green Version]
  44. Siddiqi, N.J.; Abdelhalim, M.A.K.; El-Ansary, A.; Alhomida, A.S.; Ong, W.Y. Identification of potential biomarkers of gold nanoparticle toxicity in rat brains. J. Neuroinflamm. 2012, 9, 123. [Google Scholar] [CrossRef] [PubMed] [Green Version]
  45. Beutler, E.; Duron, O.; Kelly, B.M. Improved method for the determination of blood glutathione. J. Lab. Clin. Med. 1963, 61, 882–888. [Google Scholar] [PubMed]
  46. Bradford, M.M. A rapid and sensitive method for the quantitation of microgram quantities of protein utilizing the principle of protein-dye binding. Anal. Biochem. 1976, 72, 248–254. [Google Scholar] [CrossRef]
  47. Reddy, N.J.; Vali, D.N.; Rani, M.; Rani, S.S. Evaluation of antioxidant, antibacterial and cytotoxic effects of green synthesized silver nanoparticles by Piper longum fruit. Mater. Sci. Eng. C 2014, 34, 115–122. [Google Scholar] [CrossRef] [PubMed]
  48. Al Sufyani, N.M.; Hussien, N.A.; Hawsawi, Y. Characterization and Anticancer Potential of Silver Nanoparticles Biosynthesized from Olea chrysophylla and Lavandula dentata Leaf Extracts on HCT116 Colon Cancer Cells. J. Nanomater. 2019, 2019, 1–9. [Google Scholar] [CrossRef] [Green Version]
  49. Firdhouse, J.; Lalitha, P. Apoptotic efficacy of biogenic silver nanoparticles on human breast cancer MCF-7 cell lines. Prog. Biomater. 2015, 4, 113–121. [Google Scholar] [CrossRef] [Green Version]
  50. Burd, J.; Usategui-Gomez, M. A colorimetric assay for serum lactate dehydrogenase. Clin. Chim. Acta 1973, 46, 223–227. [Google Scholar] [CrossRef]
  51. Chan, F.K.; Moriwaki, K.; De Rosa, M.J. Detection of Necrosis by Release of Lactate Dehydrogenase Activity; Springer Science and Business Media LLC: Berlin/Heidelberg, Germany, 2013; Volume 979, pp. 65–70. [Google Scholar]
  52. Gurunathan, S.; Qasim, M.; Park, C.H.; Yoo, H.; Choi, D.Y.; Song, H.; Seo, H.G.; Kim, J.-H.; Hong, K. Cytotoxicity and Transcriptomic Analysis of Silver Nanoparticles in Mouse Embryonic Fibroblast Cells. Int. J. Mol. Sci. 2018, 19, 3618. [Google Scholar] [CrossRef] [PubMed] [Green Version]
  53. Yuan, Y.-G.; Zhang, S.; Hwang, J.-Y.; Kong, I.-K. Silver Nanoparticles Potentiates Cytotoxicity and Apoptotic Potential of Camptothecin in Human Cervical Cancer Cells. Oxidative Med. Cell. Longev. 2018, 2018, 1–21. [Google Scholar] [CrossRef] [PubMed]
  54. Chen, C.; Bu, W.; Ding, H.; Li, Q.; Wang, D.; Bi, H.; Guo, D. Cytotoxic effect of zinc oxide nanoparticles on murine photoreceptor cells via potassium channel block and Na+/K+-ATP ase inhibition. Cell Prolif. 2017, 50, 1–9. [Google Scholar] [CrossRef] [PubMed] [Green Version]
  55. I Kandil, E.; El-Sonbaty, S.M.; Moawed, F.S.; Khedr, O.M. Anticancer redox activity of gallium nanoparticles accompanied with low dose of gamma radiation in female mice. Tumor Boil. 2018, 40, 1–14. [Google Scholar] [CrossRef] [Green Version]
  56. Hayes, J.D.; McLellan, L.I. Glutathione and glutathione-dependent enzymes represent a co-ordinately regulated defence against oxidative stress. Free. Radic. Res. 1999, 31, 273–300. [Google Scholar] [CrossRef]
  57. Mccord, J.M.; Fridovich, I. Superoxide dismutase. An enzymic function for erythrocuprein (hemocuprein). J. Boil. Chem. 1969, 244, 6049–6055. [Google Scholar]
  58. Petkovic, J.; Žegura, B.; Filipič, M. Influence of TiO2nanoparticles on cellular antioxidant defense and its involvement in genotoxicity in HepG2 cells. In Proceedings of the Journal of Physics: Conference Series, Grenoble, France, July 2011; IOP Publisher: Bristol, UK, 2011; pp. 12037–12045. [Google Scholar]
  59. Al-Sheddi, E.S.; Farshori, N.N.; Al-Oqail, M.M.; Al-Massarani, S.M.; Saquib, Q.; Wahab, R.; Musarrat, J.; Al-Khedhairy, A.; Siddiqui, M. Anticancer Potential of Green Synthesized Silver Nanoparticles Using Extract of Nepeta deflersiana against Human Cervical Cancer Cells (HeLA). Bioinorg. Chem. Appl. 2018, 2018, 1–12. [Google Scholar] [CrossRef] [Green Version]
  60. Kodiha, M.; Wang, Y.M.; Hutter, E.; Maysinger, D.; Stochaj, U. Off to the Organelles - Killing Cancer Cells with Targeted Gold Nanoparticles. Theranostics 2015, 5, 357–370. [Google Scholar] [CrossRef]
  61. Manke, A.; Wang, L.; Rojanasakul, Y. Mechanisms of Nanoparticle-Induced Oxidative Stress and Toxicity. BioMed Res. Int. 2013, 2013, 1–15. [Google Scholar] [CrossRef] [Green Version]
  62. Li, Y.; Guo, M.; Lin, Z.; Zhao, M.; Xia, Y.; Wang, C.; Xu, T.; Zhu, B. Multifunctional selenium nanoparticles with Galangin-induced HepG2 cell apoptosis through p38 and AKT signalling pathway. R. Soc. Open Sci. 2018, 5, 180509. [Google Scholar] [CrossRef] [Green Version]
  63. Vieira, L.F.D.A.; Lins, M.P.; Viana, I.M.M.N.; Dos Santos, J.E.; Smaniotto, S.; Reis, M.D.D.S. Metallic nanoparticles reduce the migration of human fibroblasts in vitro. Nanoscale Res. Lett. 2017, 12, 200. [Google Scholar] [CrossRef] [PubMed] [Green Version]
  64. Sathishkumar, P.; Vennila, K.; Jayakumar, R.; Yusoff, A.R.M.; Hadibarata, T.; Palvannan, T. Phyto-synthesis of silver nanoparticles using Alternanthera tenella leaf extract: An effective inhibitor for the migration of human breast adenocarcinoma (MCF-7) cells. Bioprocess Biosyst. Eng. 2016, 39, 651–659. [Google Scholar] [CrossRef]
  65. Barkhade, T.; Mahapatra, S.K.; Banerjee, I. Study of mitochondrial swelling, membrane fluidity and ROS production induced by nano-TiO2 and prevented by Fe incorporation. Toxicol. Res. 2019, 8, 711–722. [Google Scholar] [CrossRef] [PubMed]
  66. Xu, F.; Piett, C.; Farkas, S.; Qazzaz, M.; Syed, N. Silver nanoparticles (AgNPs) cause degeneration of cytoskeleton and disrupt synaptic machinery of cultured cortical neurons. Mol. Brain 2013, 6, 29. [Google Scholar] [CrossRef] [PubMed] [Green Version]
  67. Baranowski, Z.; Hrebenda, B.; Cieslawska, M.; Beylina, S. Division of Phusarum mitochondria during starvation. Cell Biol. Int. Rep. 1991, 15, 197–204. [Google Scholar] [CrossRef]
  68. Kepsutlu, B.; Wycisk, V.; Achazi, K.; Kapishnikov, S.; Pérez-Berná, A.J.; Guttmann, P.; Cossmer, A.; Pereiro, E.; Ewers, H.; Ballauff, M.; et al. Cells Undergo Major Changes in the Quantity of Cytoplasmic Organelles after Uptake of Gold Nanoparticles with Biologically Relevant Surface Coatings. ACS Nano 2020, 14, 2248–2264. [Google Scholar] [CrossRef]
  69. Ostaszewska, T.; Śliwiński, J.; Kamaszewski, M.; Sysa, P.; Chojnacki, M. Cytotoxicity of silver and copper nanoparticles on rainbow trout (Oncorhynchus mykiss) hepatocytes. Environ. Sci. Pollut. Res. 2017, 25, 908–915. [Google Scholar] [CrossRef] [Green Version]
  70. Herrero, E.; Ros, J.; Belli, G.; Cabiscol, E. Redox control and oxidative stress in yeast cells. Biochim. Biophys. Acta (BBA) Gen. Subj. 2008, 1780, 1217–1235. [Google Scholar] [CrossRef]
  71. Khatchadourian, A.; Maysinger, D. Lipid Droplets: Their Role in Nanoparticle-Induced Oxidative Stress. Mol. Pharm. 2009, 6, 1125–1137. [Google Scholar] [CrossRef] [Green Version]
  72. Erlandson, R.A. Ultrastructural Pathology of the Cell and Matrix. Am. J. Surg. Pathol. 1997, 21, 1391. [Google Scholar] [CrossRef]
  73. Zoncu, R.; Efeyan, A.; Sabatini, D.M. mTOR: From growth signal integration to cancer, diabetes and ageing. Nat. Rev. Mol. Cell Boil. 2010, 12, 21–35. [Google Scholar] [CrossRef] [PubMed] [Green Version]
  74. Lunova, M.; Smolková, B.; Lynnyk, A.; Uzhytchak, M.; Jirsa, M.; Kubinová, Š.; Dejneka, A.; Lunov, O. Targeting the mTOR Signaling Pathway Utilizing Nanoparticles: A Critical Overview. Cancers 2019, 11, 82. [Google Scholar] [CrossRef] [PubMed] [Green Version]
  75. Kuang, H.; Yang, P.; Yang, L.; Aguilar, Z.P.; Xu, H. Size dependent effect of ZnO nanoparticles on endoplasmic reticulum stress signaling pathway in murine liver. J. Hazard. Mater. 2016, 317, 119–126. [Google Scholar] [CrossRef] [PubMed]
  76. Borkowska, M.; Siek, M.; Kolygina, D.V.; Sobolev, Y.I.; Lach, S.; Kumar, S.; Cho, Y.-K.; Kandere-Grzybowska, K.; Grzybowski, B.A. Targeted crystallization of mixed-charge nanoparticles in lysosomes induces selective death of cancer cells. Nat. Nanotechnol. 2020, 15, 1–11. [Google Scholar] [CrossRef]
  77. Kim, S.; Ryu, D.-Y. Silver nanoparticle-induced oxidative stress, genotoxicity and apoptosis in cultured cells and animal tissues. J. Appl. Toxicol. 2012, 33, 78–89. [Google Scholar] [CrossRef]
  78. Song, K.; Xu, P.; Meng, Y.; Geng, F.; Li, J.; Li, Z.; Xing, J.; Chen, J.; Kong, B.-H. Smart gold nanoparticles enhance killing effect on cancer cells. Int. J. Oncol. 2012, 42, 597–608. [Google Scholar] [CrossRef] [Green Version]
  79. Hafner, A.; Bulyk, M.L.; Jambhekar, A.; Lahav, G. The multiple mechanisms that regulate p53 activity and cell fate. Nat. Rev. Mol. Cell Boil. 2019, 20, 199–210. [Google Scholar] [CrossRef]
  80. Nakajima, Y.-I.; Kuranaga, E. Caspase-dependent non-apoptotic processes in development. Cell Death Differ. 2017, 24, 1422–1430. [Google Scholar] [CrossRef]
  81. Hird, A.W.; Tron, A.E. Recent advances in the development of Mcl-1 inhibitors for cancer therapy. Pharmacol. Ther. 2019, 198, 59–67. [Google Scholar] [CrossRef]
  82. Kalkavan, H.; Green, D.R. MOMP, cell suicide as a BCL-2 family business. Cell Death Differ. 2017, 25, 46–55. [Google Scholar] [CrossRef]
  83. Wu, Y.; Ma, J.; Sun, Y.; Tang, M.; Kong, L. Effect and mechanism of PI3K/AKT/mTOR signaling pathway in the apoptosis of GC-1 cells induced by nickel nanoparticles. Chemosphere 2020, 126913. [Google Scholar] [CrossRef] [PubMed]
  84. Yao, H.; Han, X.; Han, X. The Cardioprotection of the Insulin-Mediated PI3K/Akt/mTOR Signaling Pathway. Am. J. Cardiovasc. Drugs 2014, 14, 433–442. [Google Scholar] [CrossRef] [PubMed]
  85. Huang, D.; Jian, J.; Li, S.; Zhang, Y.; Liu, L. TPX2 silencing exerts anti-tumor effects on hepatocellular carcinoma by regulating the PI3K/AKT signaling pathway. Int. J. Mol. Med. 2019, 44, 2113–2122. [Google Scholar] [CrossRef] [PubMed]
  86. Kovács, D.; Igaz, N.; Keskeny, C.; Bélteky, P.; Tóth, T.; Gáspár, R.; Madarász, D.; Rázga, Z.; Kónya, Z.; Boros, I.M.; et al. Silver nanoparticles defeat p53-positive and p53-negative osteosarcoma cells by triggering mitochondrial stress and apoptosis. Sci. Rep. 2016, 6, 27902. [Google Scholar] [CrossRef] [Green Version]
Figure 1. Antiproliferative activity of Nostoc-mediated synthesized silver nanoparticles (N-SNPs). (A) Percentages of viable breast, liver and colon cancer (MCF-7, HCT-116, and HepG2, respectively) cells before and after treatment with different concentrations of N-SNPs for 24 h. (B) Cell viability percentages and log concentration of N-SNPs. All of the data were collected from independent experiments performed in triplicate and are presented as mean ± standard error of the mean (SEM). p-values were calculated versus untreated cells: **** p < 0.0001, *** p < 0.0003, **p < 0.001.
Cancers 12 02099 g001
Figure 2. Morphological features before and after treatment of MCF-7, HCT-116, and HepG2 cells with N-SNPs at IC25 and IC50 for 24 h. (AC) Untreated MCF-7, HCT-116, and HepG2 cells, respectively. (DF) MCF-7, HCT-116, and HepG2 cells treated with N-SNPs at IC25, respectively. (GK) MCF-7, HCT-116, and HepG2 cells treated with N-SNPs at IC50, respectively. Scale bar = 100 µm.
Cancers 12 02099 g002
Figure 3. Influence of N-SNPs at IC25 and IC50 on enzymes and antioxidants in MCF-7, HCT-116, and HepG2 cells. (A) Lactate dehydrogenase (LDH) enzyme, (B) adenosine triphosphatase (ATPase), (C) glutathione peroxidase (GPx), and (D) glutathione (GSH). All of the data were collected from independent experiments performed in triplicate and are presented as mean ± SEM. p-values were calculated versus untreated cells: **** p < 0.0001, *** p < 0.0003, **p < 0.001, *p < 0.01.
Cancers 12 02099 g003
Figure 4. Transmission Electron Microscopy (TEM) micrographs of MCF-7, HCT-116, and HepG2 illustrating ultrastructural features before treatment (AC), after exposure to N-SNPs at IC25 (27, 28, and 40 µg/mL, respectively) (DF), and after exposure to N-SNPs at IC50 (54, 56, and 80 µg/mL, respectively) (GK). Images show irregular plasma membrane (Pm), low distribution or absence of microvilli (Mv), and endoplasmic reticulum (ER), high incidence of lipid droplets (LD), mitochondria (M), lysosomes (L), vacuoles (V), large vacuoles (headed yellow arrow), autophagic vacuoles (yellow arrow), cytoplasmic dissolution (cut arrow), irregular nuclear envelope (Ne), marginated and aggregated heterochromatin (green arrow), and condensed chromatin (C). Red arrows show the distribution of N-SNPs in cytoplasm, plasma membrane, and organelles. Scale bar = 2 µm.
Cancers 12 02099 g004
Figure 5. Ultrastructural alterations in cancer cells caused by N-SNPs.
Cancers 12 02099 g005
Figure 6. Changes in distribution of (A) number of mitochondria and (B) number of peroxisomes in MCF-7, HCT- 116, and HepG2 cells before and after treatment with N-SNPs at IC25 and IC50 for 24 h. Data represent averages of measurements from 10 cells and are presented as mean ± SEM. p-values were calculated versus untreated cells: *** p < 0.0001, ** p < 0.001, * p < 0.01.
Cancers 12 02099 g006
Figure 7. TEM micrographs of MCF-7 (A–E) and HepG2 (F) cells treated with N-SNPs at IC25. (A) Distribution of dark electron-dense granules that may indicate N-SNPs in cytoplasm (green square). (B) Cytoplasm dissolution (violet star), swollen oval mitochondria (blue arrow), scattering of N-SNPs in nuclear matrix and peroxisomes (red arrow). (C) Scattering of autophagic vacuoles (green arrow), swelling of spherical mitochondria (M), and distribution of N-SNPs in cytoplasm and plasma membrane (red arrow). (DE) Autophagic vacuoles (blue arrow), mitochondrial damage (green arrow), and attachment of NPs to cell membrane, mitochondria, and autophagic vacuoles (E). (F) Extensive appearance of early endosomes (green cut arrow) and peroxisomes (P), as well as scattering of N-SNPs in cytoplasm (red arrow). V, vacuole; P, peroxisome; L, lysosome; M, mitochondria. Scale bar = 5 µm (A), 2 µm (B, C, and F), and 1 µm (D and E).
Cancers 12 02099 g007
Figure 8. TEM micrographs of HCT-116 (A-B), MCF-7 (C), and HepG2 (D) cells treated with N-SNPs at IC50. (A) Cytoplasm dissolution (violet star), N-SNPs attached to membrane blebbing and microvilli and scattered in cytoplasm (red arrow). (B) Swollen mitochondria with damaged cristae (yellow arrow), fragmented nucleus (purple arrow) with margined chromatin (green arrow), N-SNPs attached to membrane blebs and scattered in cytoplasm (red arrow). (C) Cytoplasmic dissolution (violet star), autophagic vacuoles (green arrow), fragmented oval mitochondria (violet arrow), attachment of N-SNPs to mitochondria (red arrow). (D) Apoptotic body and attachment of NPs to plasma membrane (red arrow). Scale bar = 2 µm (A, B and D) and 1 µm (C).
Cancers 12 02099 g008
Figure 9. Morphometric analysis (µm) of (A) cell size (length and width) and (B) nucleus size (length and width) of MCF-7, HCT-116, and HepG2 cells before and after treatment with N-SNPs at IC25 and IC50. Data represent averages of measurements of 10 cells and they are presented as mean ± SEM. p-values were calculated versus untreated cells: * p < 0.01.
Cancers 12 02099 g009
Figure 10. Morphometric analysis (µm) of (A-C) oval mitochondria dimensions and (D) spherical mitochondria diameters in MCF-7, HCT-116, and HepG2 cells before and after treatment with IC25 and IC50 of N-SNPs. Data represent averages of measurements from 10 cells and are presented as mean ± SEM. p-values were calculated versus untreated cells: *p < 0.01.
Cancers 12 02099 g010
Figure 11. Effects of N-SNPs (IC25 and IC50) on antiapoptotic (protein kinase B (Akt), phosphorylated-Akt (p-Akt), B-cell lymphoma 2 (Bcl-2) and mammalian target of rapamycin (mTOR)) and apoptotic (tumor suppressor (p53) and caspase 3) protein expression levels in MCF-7, HCT-116, and HepG2 cells. All of the data were collected from independent experiments performed in triplicate and are presented as mean ± SEM. p-values were calculated versus untreated cells: **** p < 0.0001, *** p < 0.0003, **p < 0.001.
Cancers 12 02099 g011
Figure 12. The possible molecular mechanism of N-SNPs against cancer cells.
Cancers 12 02099 g012
Figure 13. Possible strategies by which N-SNPs kill cancer cells.
Cancers 12 02099 g013
Table 1. Antibodies used in the current study.
AntibodyTypeProduct CodeCompany
Akt Rabbit monoclonal EPR16798Abcam
p-AktRabbit polyclonal ab8805Abcam
Bcl-2Rabbit polyclonal ab59348Abcam
mTOR Rabbit monoclonal ab32028Abcam
p53Rabbit polyclonal ab131442Abcam
Caspase 3Rabbit polyclonal ab13847Abcam
β-actinRabbit polyclonal ab228001Abcam
Table 2. IC25 and IC50 values of Nostoc-mediated synthesized silver nanoparticles (N-SNPs) (µg/mL) used in all experiments against MCF-7, HCT-116, and HepG2 cells.
CellIC25IC50
MCF-727 ± 0.0254 ± 0.08
HCT-11628 ± 0.0456 ± 0.03
HepG240 ± 0.0880 ± 0.02

