Article

Liver Cancer Cell Lines Treated with Doxorubicin under Normoxia and Hypoxia: Cell Viability and Oncologic Protein Profile

1
Department of Pharmacy, Uppsala University, Box 580, 751 23 Uppsala, Sweden
2
Department of Medical Cell Biology, Uppsala University, Box 571, 751 23 Uppsala, Sweden
*
Author to whom correspondence should be addressed.
Cancers 2019, 11(7), 1024; https://doi.org/10.3390/cancers11071024
Submission received: 3 July 2019 / Revised: 9 July 2019 / Accepted: 17 July 2019 / Published: 20 July 2019
(This article belongs to the Special Issue Hepatocellular Cancer Treatment)

Abstract

:
Hepatocellular carcinoma is often treated with a combination of doxorubicin and embolization, exposing it to high concentrations and hypoxia. Separation of the possible synergistic effect of this combination in vivo is difficult. Here, treatment with doxorubicin, under hypoxia or normoxia in different liver cancer cell lines, was evaluated. Liver cancer cells HepG2, Huh7, and SNU449 were exposed to doxorubicin, hypoxia, or doxorubicin + hypoxia with different duration. Treatment response was evaluated with cell viability, apoptosis, oxidative stress, and summarized with IC50. The protein profile of a 92-biomarker panel was analyzed on cells treated with 0 or 0.1 µM doxorubicin during 6 or 72 h, under normoxia or hypoxia. Hypoxia decreased viability of HepG2 and SNU499. HepG2 was least and SNU449 most tolerant to doxorubicin treatment. Cytotoxicity of doxorubicin increased over time in HepG2 and Huh7. The combination of doxorubicin + hypoxia affected the cells differently. Normalized protein expression was lower for HepG2 than Huh7 and SNU449. Hierarchical clustering separated HepG2 from Huh7 and SNU449. These three commonly used cell lines have critically different responses to chemotherapy and hypoxia, which was reflected in their different protein expression profile. These different responses suggest that tumors can respond differently to the combination of local chemotherapy and embolization.

Graphical Abstract

1. Introduction

Intermediate hepatocellular carcinoma (HCC) is treated with image-guided transcatheter tumor therapy by locally infusing a chemotherapeutic agent in a drug delivery system, so called transarterial chemoembolization (TACE) [1,2,3,4]. This treatment has two purposes: to deliver the drug close to the tumor site and to cause an arterial embolization close to the cancer region [5]. The embolization reduces or eliminates the blood flow to the tumor, reducing the tumor’s oxygen supply and creating a hypoxic microenvironment. By infusing the drug close to the tumor (locoregional), the tumor is exposed to a high concentration of the drug, which will lead to an increased antitumor effect, while reducing systemic exposure and side-effects [6]. One of the most commonly used chemotherapeutic agents of this locoregional treatment of HCC is doxorubicin (DOX) [7], an anthracycline which has been on the market since the 1970s. Its main mechanisms of action lead to the activation of apoptotic pathways and are intercalation into DNA, inhibition of topoisomerase II, and generation of reactive oxygen species [8,9,10]. DOX has been used for the treatment of advanced HCC for over 30 years, but definitive evidence that DOX as a systemic treatment improves survival has not been provided [11], while the survival benefit in combination with chemoembolization has been generally accepted [12].
Tumor hypoxia is a key hallmark of all solid tumors, including HCC. An inevitable consequence of chemoembolization therapy is the de novo formation of hypoxic regions within the tumor [13]. Hypoxic cancer cells undergo phenotypic adaptations that allow the cells to survive or escape from the hostile environment, often creating a more aggressive tumor phenotype [14]. These hypoxia-induced adaptations include switching to anaerobic metabolism, inducing angiogenesis, stimulating tissue remodeling, and activating molecular mechanisms that allow invasion and metastasis [15,16]. Apparently, hypoxia may act as a double-edged sword when it comes to drug-response. On the one hand, intratumoral hypoxia and the hypoxic phenotype have been implicated in resistance to radiotherapy and anticancer chemotherapy, as well as predisposing for increased tumor metastases [17]. On the other hand, depriving the cells of their oxygen supply—for instance by inhibiting neoangiogenesis—has been a successful strategy for extending the survival of patients. This is currently the standard of care for patients with advanced HCC [18]. The efficacy of the cytostatic agent sorafenib in the advanced setting suggest that antiangiogenic therapy may enhance the efficacy of chemoembolization, yet this combinational treatment has generated contradictory results when it comes to overall survival [19,20,21]. Also, preclinical studies report conflicting results on whether intratumoral hypoxia enhances or reduces efficacy of chemotherapeutic agents [22,23].
Human cancer-derived cell lines are the most widely used in vitro models to study cancer mechanistically and to validate the efficacy of cancer treatments [24]. One of the main advantages of using cell lines is that they offer a nearly infinite supply of a homogeneous cell population. However, this homogeneity is only found within the same cell line and can also be seen as a disadvantage considering the heterogeneity of in vivo tumors [5]. Thus, a panel of different cancer cell lines, representative of the natural heterogeneity observed in primary tumors, could be used instead [25].
In this study, the objective was to investigate the tolerance to DOX and/or hypoxic treatment of three commonly used liver cancer cell lines [25,26,27]. HepG2 cells are derived from a 15-year old Caucasian American male with a well-differentiated liver tumor [28]. Huh-7 cells, a differentiated HCC cell line taken from a liver tumor in a 57-year-old Japanese male [28]. SNU449 cells is a hepatitis B-positive cell line derived from a 52-year-old Korean male with a primary HCC [28]. The cells were treated with different DOX concentrations at different exposure times and under normoxic or hypoxic conditions. The effect of the treatments was assessed by their antitumor effect (cell viability and cell death), presence of oxidative stress, and the change in expression in a number of cancer proteins that participate in biological mechanisms central to the initiation and progression of cancer [29].

2. Results

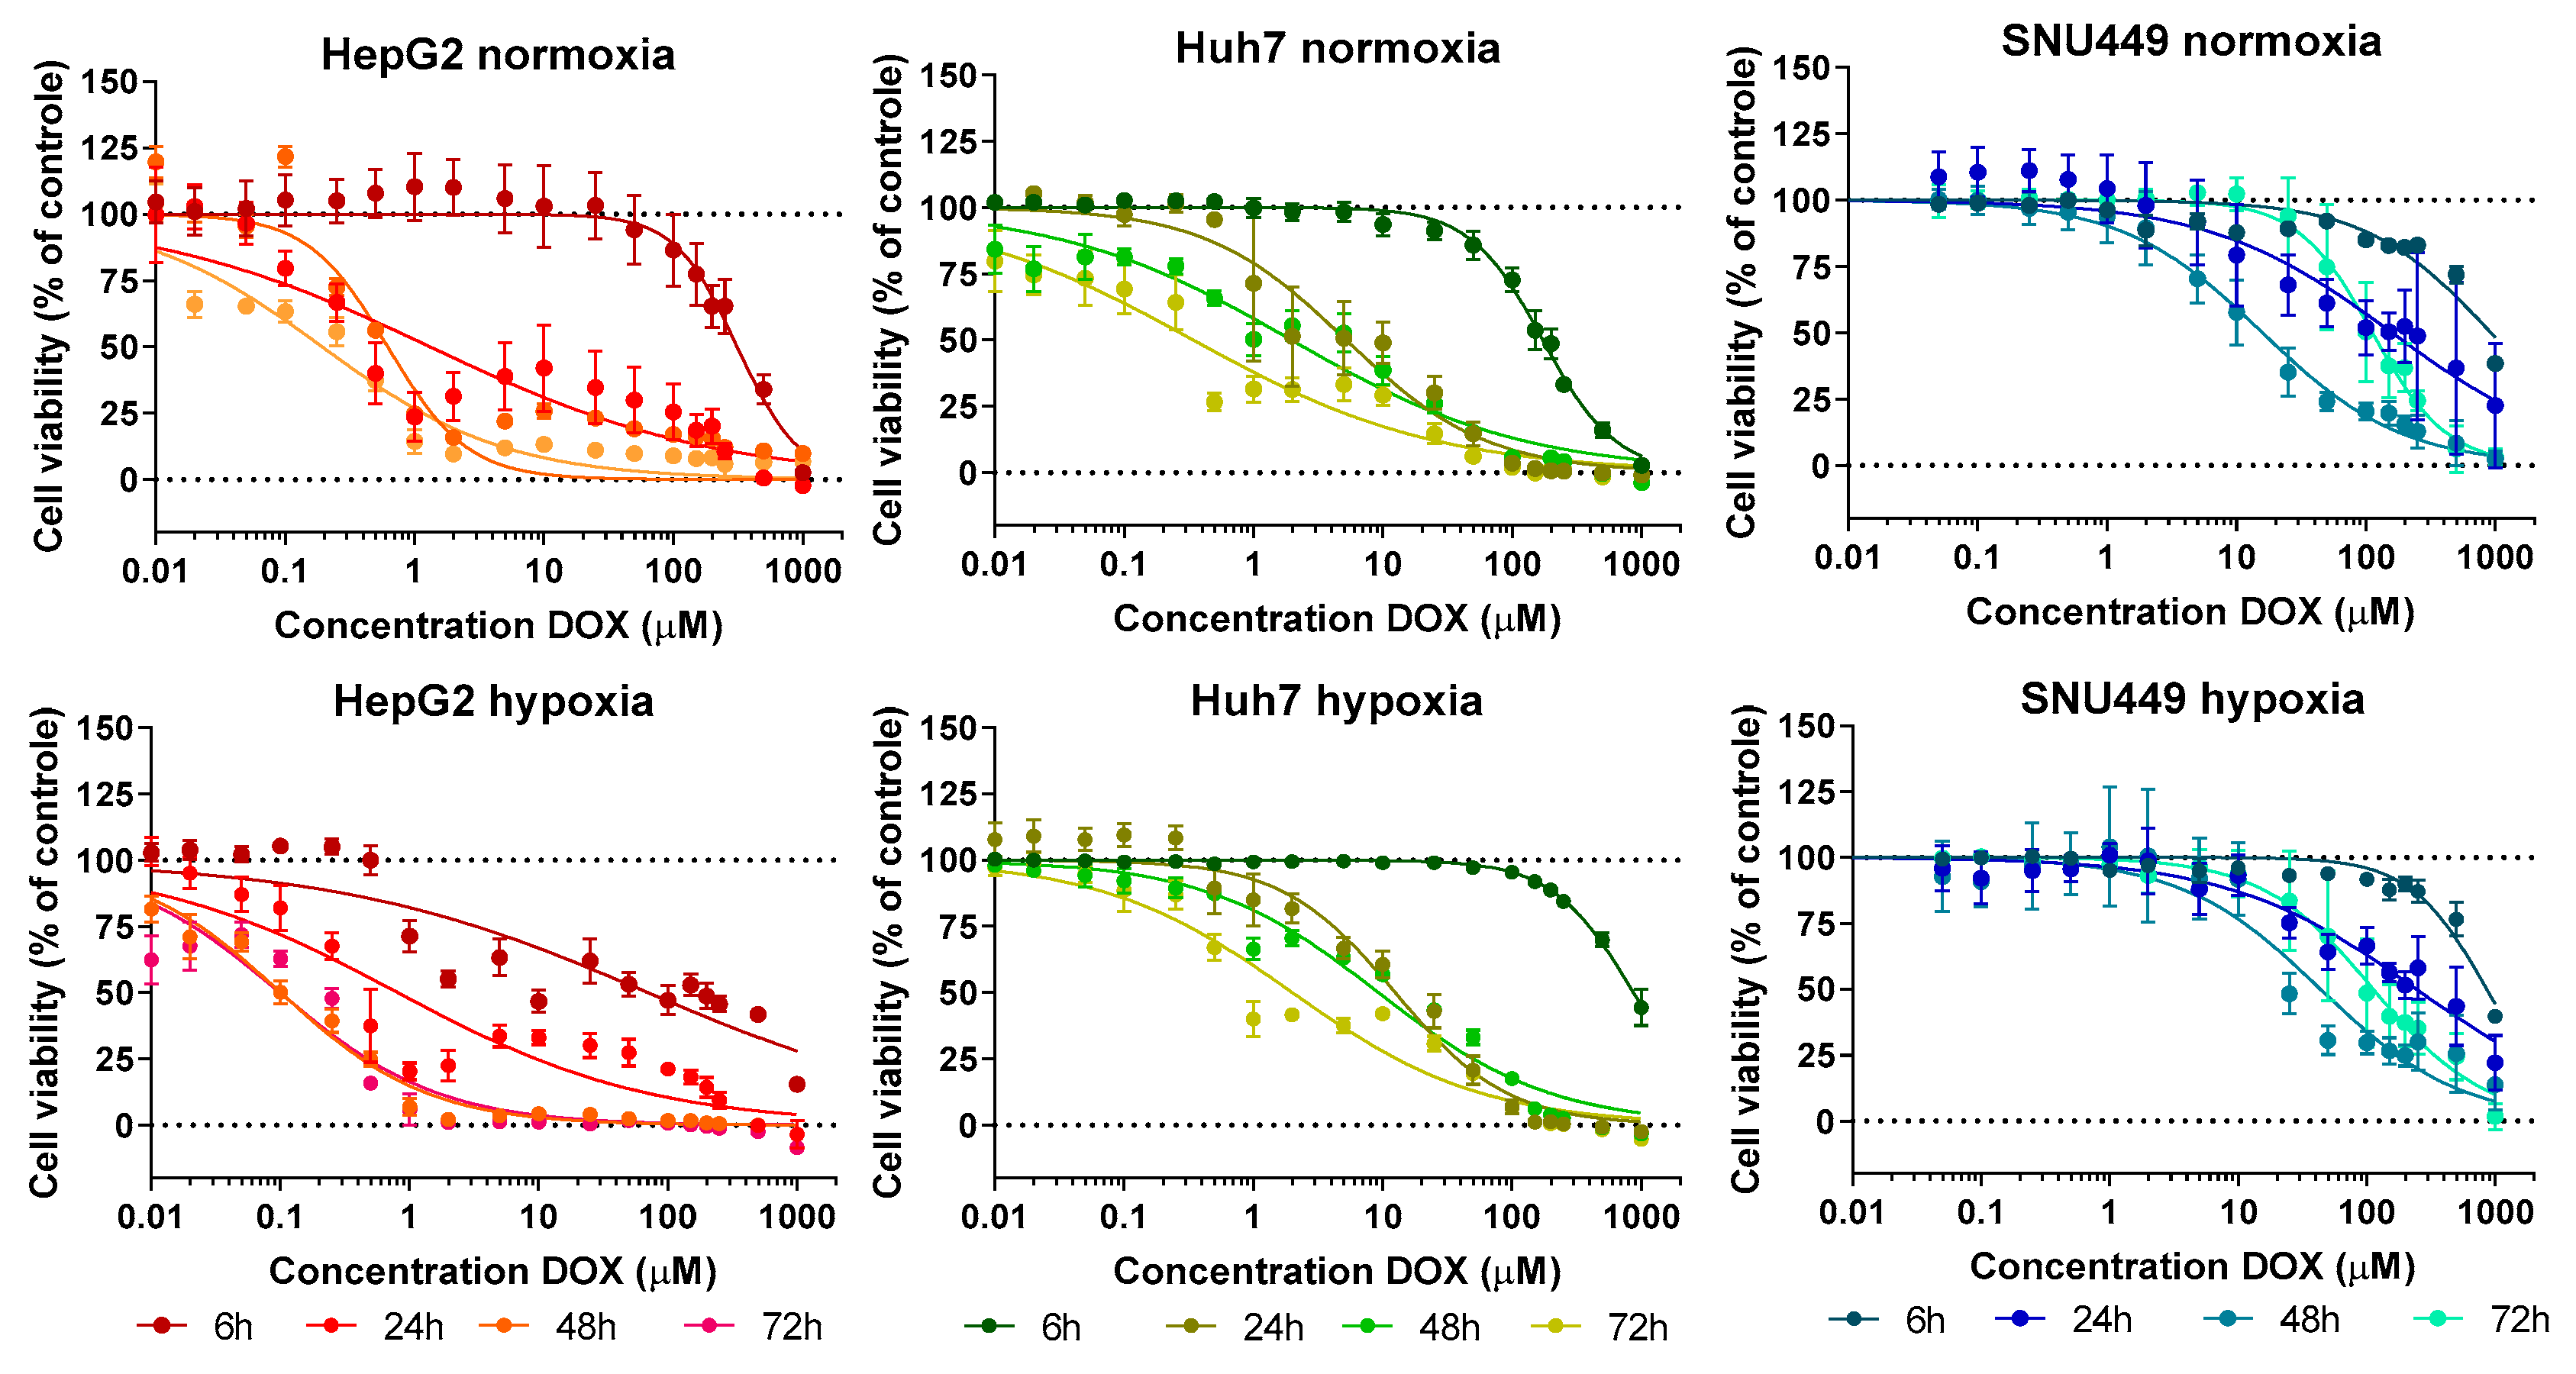
2.1. Cell Viability—Treatment with DOX under Hypoxic or Normoxic Conditions

Effect of hypoxia on cell viability over time is summarized in Table 1. Presence of hypoxia after exposure to 100 µM CoCl2 was confirmed by measurement of HIF1α and PDK1 after CoCl2 treatment confirmed presence of hypoxia (Supplementary Material, Figure S1). The effect of treatments with DOX and/or hypoxia on cell viability can be seen in Figure 1, and the corresponding IC50 values are shown in Table 2.
Cell viability of HepG2 cells grown under hypoxic conditions declined to 81% from 6 to 72 h compared to normoxic conditions (Table 1). Tolerance (IC50) of HepG2 cells to DOX decreased 1600-fold from 6 to 72 h of exposure in normoxic conditions (Table 2; Figure 1). Tolerance to DOX decreased between 1.6- and 6-fold at each time point when HepG2 were exposed to DOX under hypoxic conditions (Table 2; Figure 1).
Under hypoxic conditions, Huh7 cell viability was unaffected or even slightly increased compared to normoxic conditions (Table 1). Similar to the HepG2 cells, tolerance of Huh7 cells to DOX decreased in normoxic conditions, here with 500-fold from 6 to 72 h of exposure (Table 2; Figure 1). Tolerance of Huh7 to DOX increased between 2- and 6-fold at each time point when exposed to DOX under hypoxic conditions (Table 2; Figure 1).
SNU449 cell viability declined to 76% from 6 to 48 h in hypoxic conditions compared to normoxia, but cell viability recovered to baseline at 72 h (Table 1). Under normoxic conditions, tolerance of SNU449 to DOX first declined ~60-fold over time (48 h), and then increased at 72 h to an 8-fold decline of IC50,6h (Table 2; Figure 1). Tolerance to DOX of SNU449 cells under chemical hypoxia was only slightly affected (<3-fold) compared to normoxic conditions (Table 2; Figure 1).

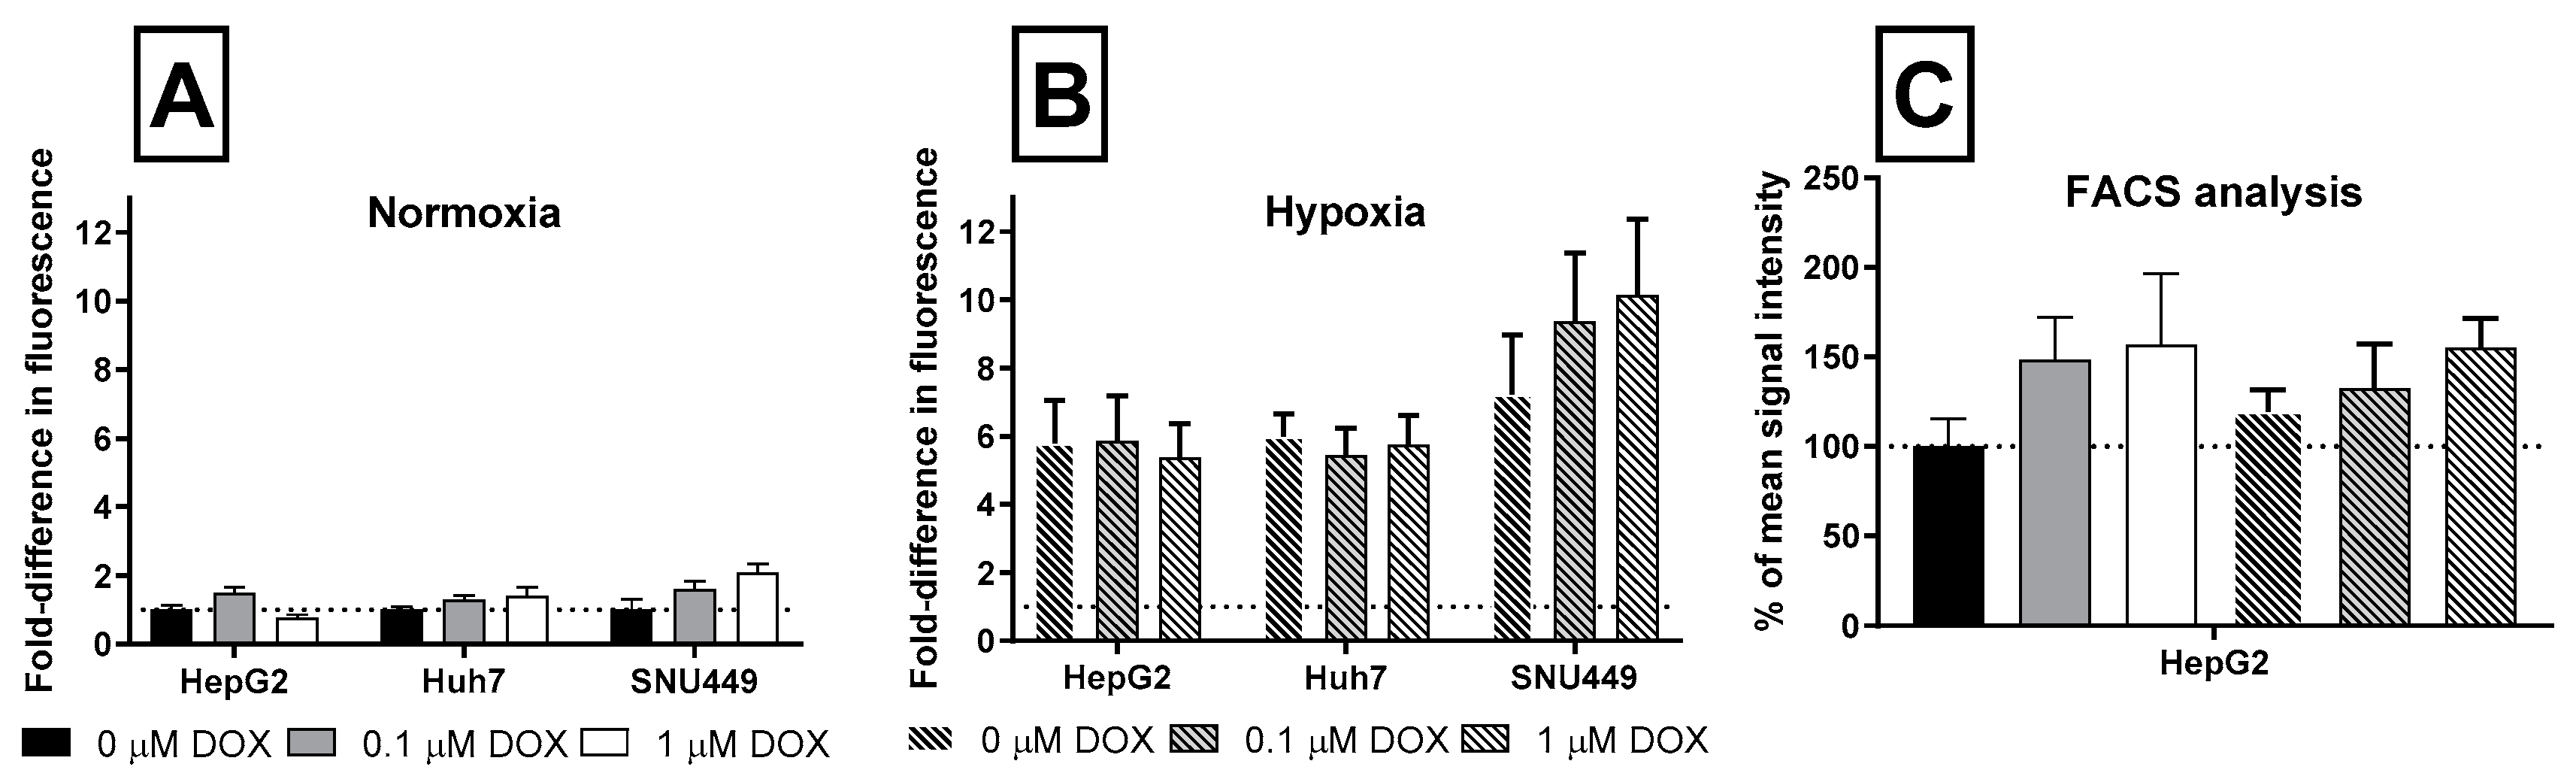
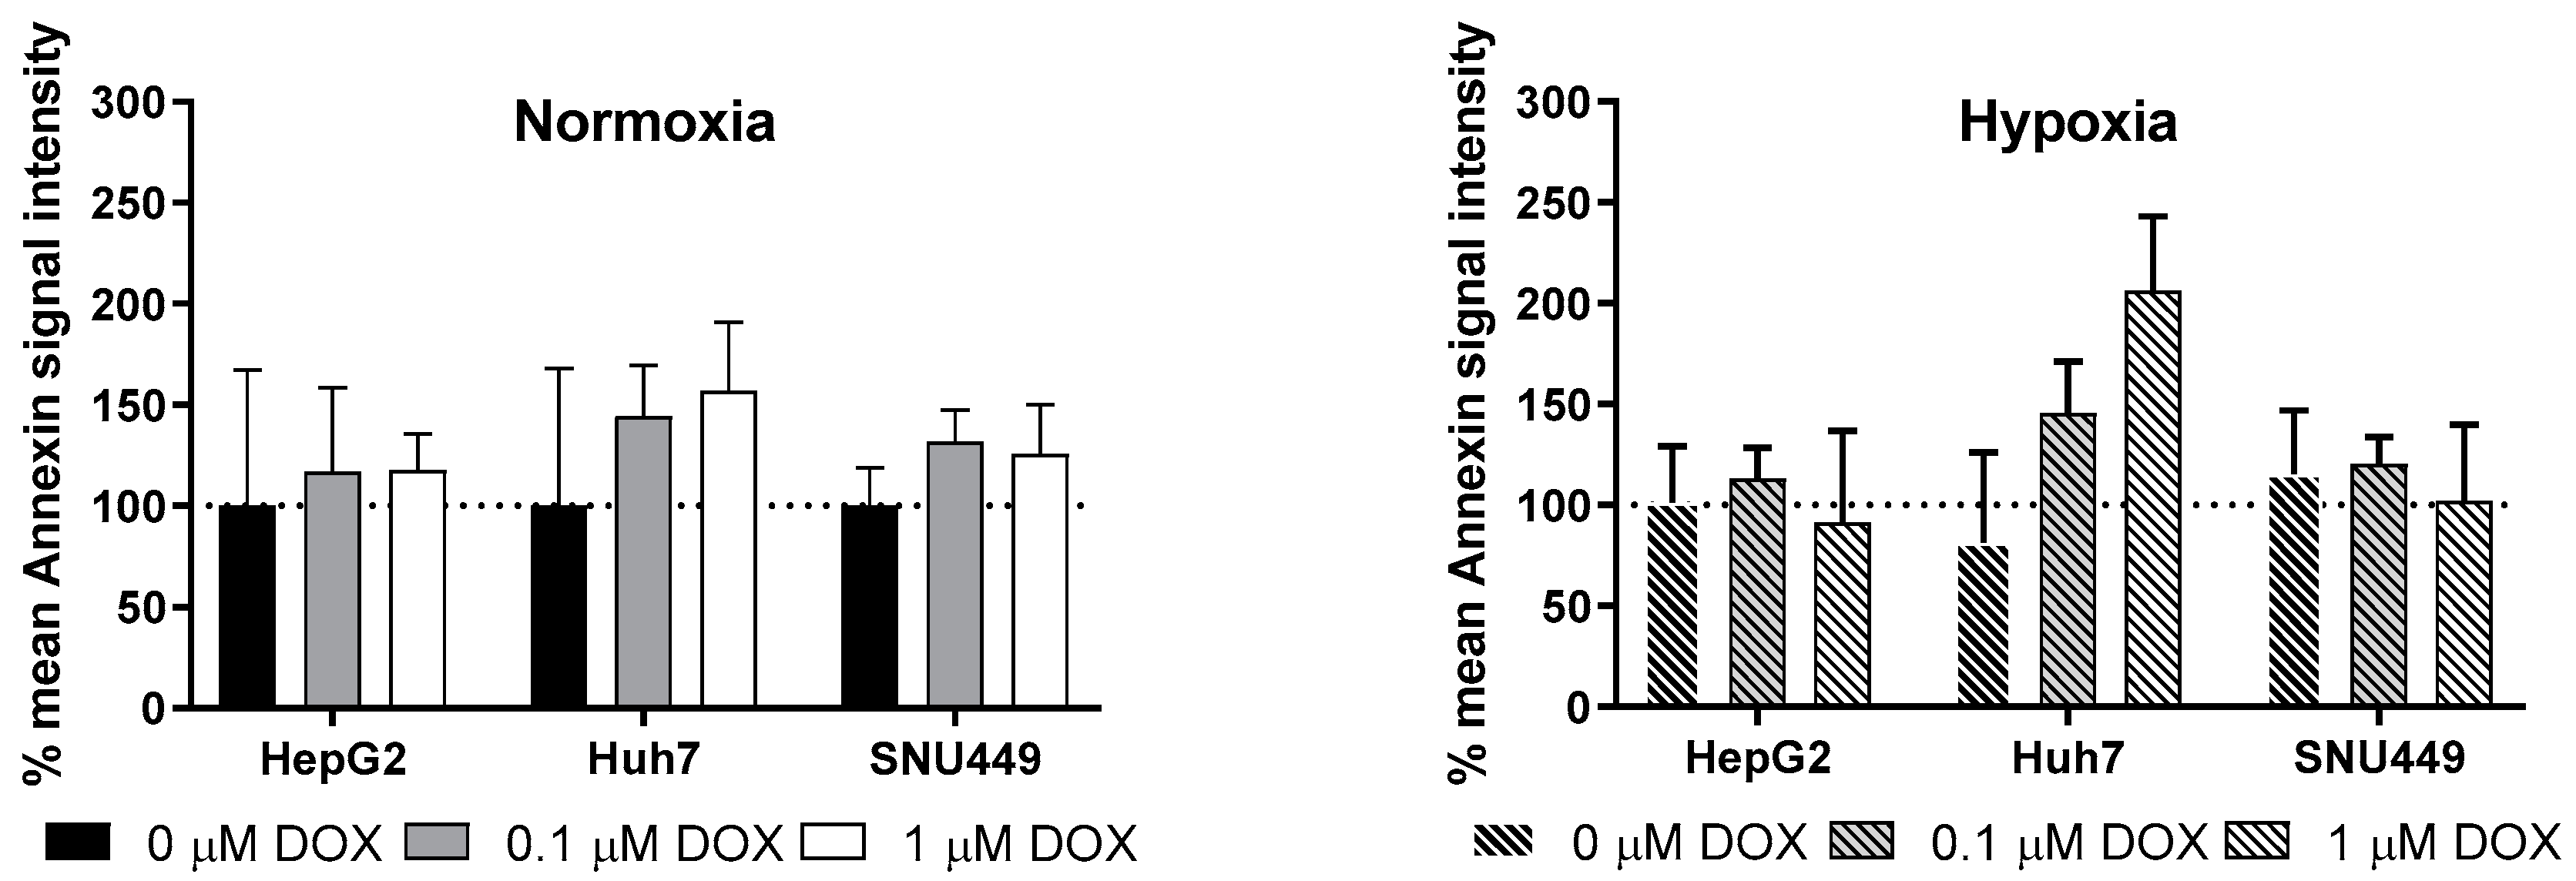
2.2. Oxidative Stress and Apoptosis

The effect of treatment with DOX after 24 h on oxidative stress and apoptosis are shown in Figure 2 and Figure 3. Under normoxia, 0.1 µM DOX led to a nonsignificant increase of oxidative stress in all cell lines after 24 h (Figure 2A). A higher exposure of 1 µM DOX lead to a nonsignificant increase of oxidative stress in Huh7 and SNU449, but decreased oxidative stress levels in HepG2 cells (Figure 2A). Since this method does not normalize for total cell number, we also measured DCFDA using flow cytometry and selecting living cells. This revealed a significant increase of oxidative stress in HepG2 cells treated with 0.1 and 1 µM DOX (Figure 2C). Oxidative stress was significantly increased in all cells exposed to CoCl2-induced hypoxia (Figure 2B). Interestingly, only the SNU449 experienced a significant additive effect of hypoxia and DOX on oxidative stress levels (Figure 2B).
HepG2 cells showed no change in the apoptotic marker Annexin V during any of the treatments. Under normoxia, levels of Annexin-V nonsignificantly increased in the Huh7 and SNU449 cells treated with 0.1 and 1 µM for 24 h (Figure 3). Huh7 cells showed a nonsignificant increase of Annexin V, after 24 h exposure of 0.1 µM and 1 µM DOX in hypoxic conditions. Under hypoxia, the SNU449 cells had no increased levels of the apoptotic marker Annexin-V after treatment with DOX.

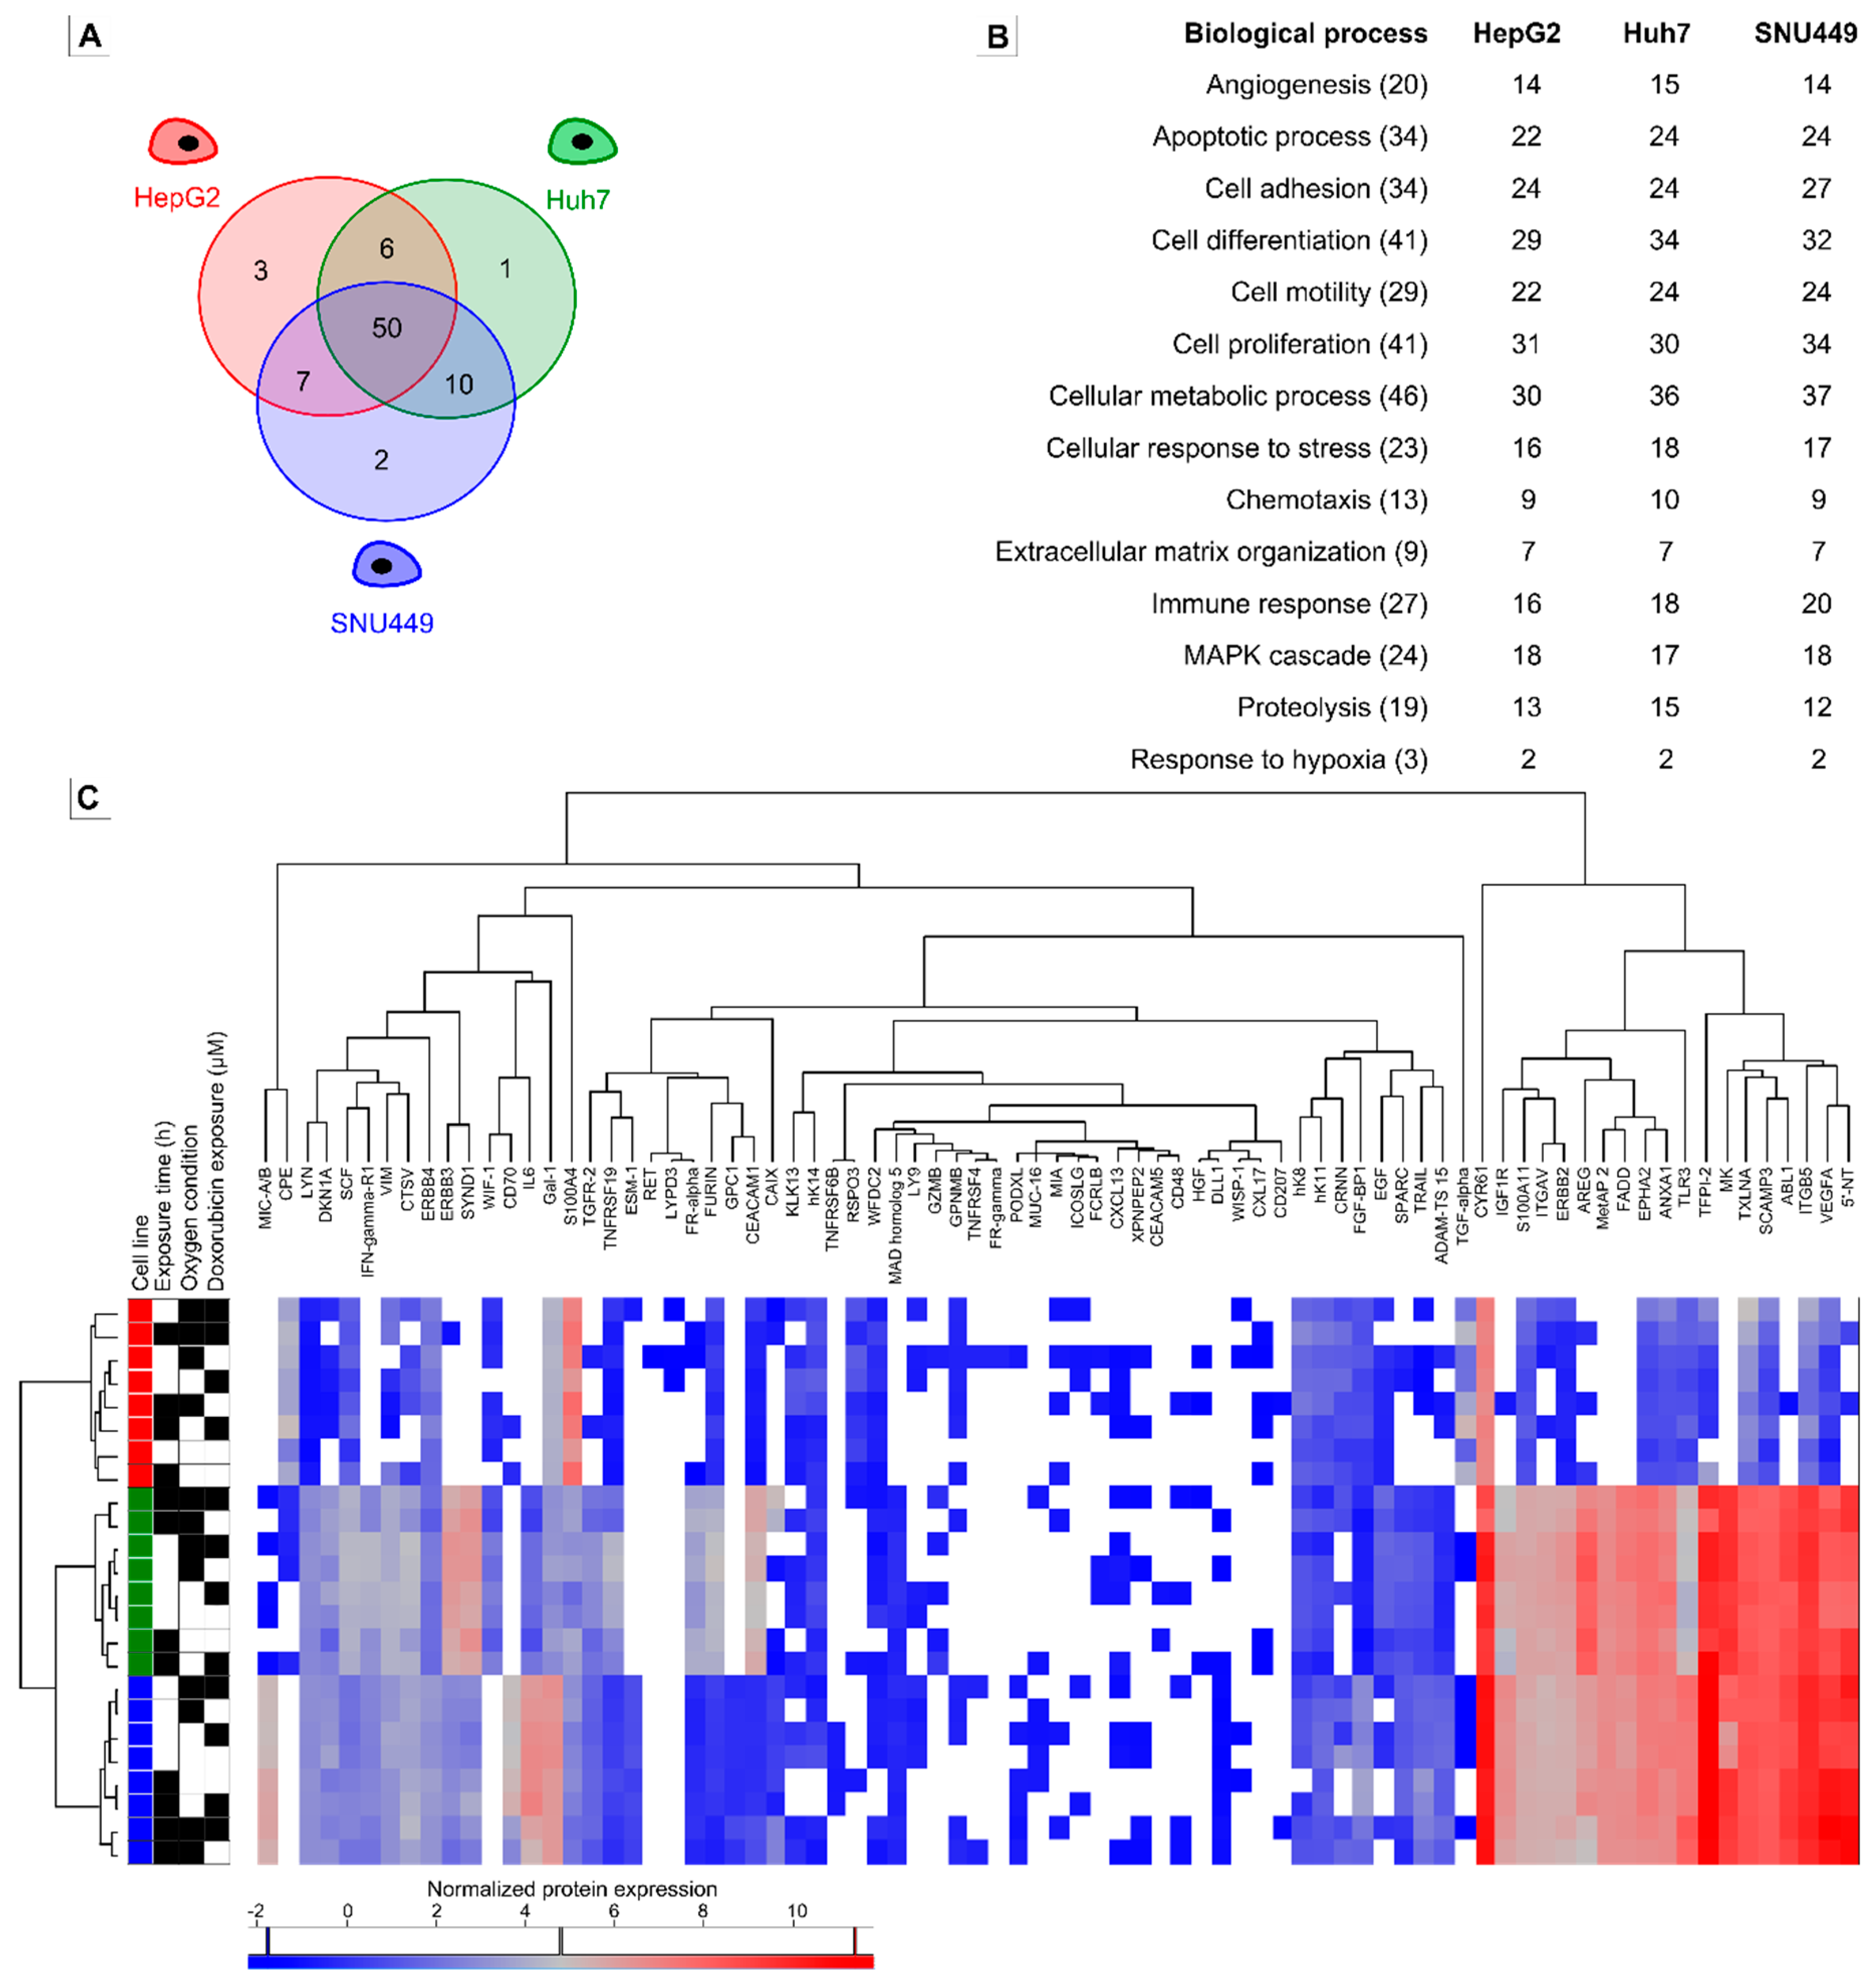
2.3. Oncologic Protein Profile

Of the 92 proteins included in the OLINK Oncology panel [29], 79 proteins (84.9%) were detected in at least one median sample (Figure 4A). The majority (50) of proteins were detected in all three cell lines, while six proteins were detected in one cell line only (Supplementary Material, Figure S2). Sixty-six proteins (71.7%) were detected in at least one median sample of the HepG2, 67 (72.8%) in Huh7, and 69 (75%) in SNU449 cells. Significant differences in protein expression were observed between HepG2 and Huh7 for 37 proteins (Table 3). The normalized expression of 35 proteins was significantly different between HepG2 and SNU449, and normalized expression of 32 proteins was significantly different between Huh7 and SNU449 (Table 3). Changes in exposure time, oxygen conditions, or DOX exposure did not result in significantly different protein expressions (results not shown). The number of detected proteins per biological process class (GO terms) per cell line are shown in Figure 4B.
Hierarchical clustering of samples (Figure 4C, left side heat map) revealed that the type of cell line was the most important factor contributing to the protein profile. Neither exposure time, nor oxygen conditions or DOX exposure caused any further subclustering. Hierarchical clustering of expressed proteins is shown Figure 4C (top side). Protein clustering could not be assigned to any biological process, molecular function, or cellular component (GO terms; results not shown).
The heatmap (Figure 4C) shows the different normalized protein expression of each protein in each sample. For a number of detected proteins, HepG2 cell samples had lower expression of proteins compared to Huh7 and SNU449 cell samples (Figure 4C, right side heat map, Table 3). In HepG2 cells only eight proteins had a normalized protein expression higher than 2 (average from all HepG2 samples, irrespective of treatment), while 34 proteins in Huh7 cells and 35 proteins in SNU449 cells were detected with normalized protein expression over 2.

3. Discussion

The cytotoxic potency of DOX and the synergistic effects of chemical hypoxia on cell viability, oxidative stress, and cell death were investigated for three liver cancer cell lines (HepG2, Huh7, and SNU449). These cell lines were selected based on previously published data on their response to DOX and their morphological features.
The observed tolerance to DOX was significantly different between the cell lines, where HepG2 cells exhibited the lowest and SNU449 cells the highest tolerance. For example, at 72 h exposure to DOX there was a 580-fold difference between IC50 values for HepG2 and SNU449. Huh7 and HepG2 are epithelial cell lines, characterized by a high expression of E-cadherin and low expression of Vimentin [30]. In contrast, SNU449 has a mesenchymal phenotype, characterized by loss of E-cadherin and low expression of vimentin [30,31]. The study by Zhang, et al. in 2018 has shown that epithelial–mesenchymal transition is the driving factor behind DOX resistance in SNU449 cell lines [30,31]. In similarity to this study, Chang et al. in 2013 reported that tolerance to DOX is lower in HepG2 compared to SNU449 cell lines [32]. However, the Huh7 cell line was reported to be equally sensitive as HepG2 to DOX in the study by Chang et al. in 2013, while higher tolerance to DOX in Huh7 was observed in our study. Furthermore, there are large discrepancies in studies reporting on of DOX tolerance of the different cell lines. Reports on the sensitivity of HepG2 and Huh7 range from equivalent tolerance [33,34] up to 30-fold differences [32,35]. Also, reported IC50 values of DOX from different studies vary vastly. For example, after 48 h DOX exposure on HepG2 cells IC50 values varied from 0.038 to 1.9 µM [34,36,37]. This large interstudy variability indicates that it is not possible to compare DOX cytotoxicity between different studies and emphasize the need to include multiple cell lines for preclinical drug development studies. To enable cell-dependent comparisons of DOX cytotoxicity, experiments need to be performed within one study and cannot be solely based on compilations of external data. In general, reported in vitro IC50 values for DOX in human carcinoma cell lines decrease with exposure time [37,38]. This correlates well to the strong in vivo PK–PD relationship for DOX treatment observed between plasma exposure (area under the plasma concentration–time curve (AUC)) and cell survival [8]. A 20-fold decrease in DOX IC50 is reported for HepG2 cells when increasing exposure time from 6 to 48 h, and similar effects (30-fold decrease) are observed in a ovarian cancer cell line when increasing exposure time from 2 to 12 h. [37,38] Our results are in line with these observations as DOX IC50 decreased between 60- and 500-fold, depending on cell line and increase in exposure time. This suggests that our cell lines were highly responsive to DOX. Interestingly, the SNU449 cell line showed higher tolerance at 72 h than after 48 h, having possibly built up resistance to DOX treatment. Several mechanisms have been described to contribute to the acquired resistance to DOX [39]. Firstly, an upregulation of multidrug resistance efflux pumps could create a reduction in nuclear drug accumulation [40]. Unfortunately, the biomarkers analyzed with the oncology panel did not represent proteins for drug response, which could be why there were no noticeable differences in hierarchical clustering on treatment levels. Secondly, reduction in DNA Topoisomerase 2-Alpha (TOP2A) expression and increased dependence on the beta-isoform of topoisomerase II contribute to the acquired resistance of DOX [39,41]. This beta isoform is less sensitive to DOX and would thus result in a decrease in the number of double-strand breaks and subsequent decrease in apoptosis. Thirdly, a downregulation of proapoptotic and upregulation of antiapoptotic proteins could also contribute to the acquired drug resistance in cells [39]. In our biomarker analysis, both VEGFA and MK expression in SNU449 were seemingly higher after 72 h cell incubation compared to 6 h. These proteins may cause induction of cell proliferation (MK) and inhibition of apoptosis (VEGFA) [42], which could result in the above-described resistance observed at 72 h. Lastly, the inherent differences in cell proliferation could have contributed to the different response of the cell lines to DOX. The tolerance of cells to DOX is known to be lower in proliferating cells than in nonproliferating cells [43]. An in vitro study on breast cancers cells has shown that tumor proliferation rate is one of the major biologic parameters associated with response to DOX [44]. SNU449 cells were the least sensitive to DOX treatment and they also have a slower doubling time compared to Huh7 and HepG2.
The difference in viability of cells after treatment with DOX is also reflected in their different expression of the apoptotic marker Annexin V. Under normoxia, Annexin-V increased in the Huh7 and SNU449 cells treated with 0.1 and 1 µM DOX for 24 h. This is in line with our viability data, which show a decrease of 3% in cell viability of Huh7 cells after 24 h of exposure to 0.1 µM and 29% after 24 h of exposure to 1 µM DOX in normoxic conditions. In contrast, the SNU449 cells had no increased levels of Annexin V, after treatment with DOX in hypoxic conditions. This is in line with our viability data, which show that SNU449 cells experience no decrease in cell viability at 0.1 µM and 1 µM DOX. Under hypoxia, Huh7 cells showed a significant increase of Annexin V, after 24 h exposure to 0.1 µM and 1 µM DOX. This partially corresponds to our viability data, which show no decrease in cell viability of Huh7 cells after 24 h of exposure to 0.1 µM, but a 15% after 24 h of exposure to 1 µM DOX in hypoxic conditions. Remarkably, HepG2 cells showed no change in the apoptotic marker Annexin V, suggesting other mechanism may be responsible for the decreased viability. Despite the widespread clinical use of DOX, its antiproliferative and death-inducing signal cascades are not yet fully understood. Studies have suggested that decreased viability seen after DOX treatment is a result of apoptosis, necrosis, cell cycle arrest, and senescence [45,46,47], which explains some of the discrepancies we see between expression of Annexin V and the viability data. Our data also suggest that these mechanisms can differ between different cell lines and further warrant the use of multiple cell lines for preclinical studies on HCC.
Inducing hypoxia with CoCl2 resulted in varying responses of the three cell lines. HepG2 and SNU449 cell viability declined when exposed to hypoxia. Huh7 had unaffected or slightly increased cell viability in hypoxic conditions, suggesting that Huh7 has a higher tolerance to hypoxia. It is important to note that HIF1α activity varies between different cancer cell lines under the same level of hypoxia [48]. The different levels of HIF1α and PDK1 found in our three cell lines, could perhaps explain differences in their adaptation to survive in hypoxic conditions. Notably, SNU449 cells had the highest protein level of stabilized HIF1α and PDK1 and its viability was decreased at 24 h and 48 h CoCl2-induced hypoxia, but recovered to normal levels at 72 h. This suggests that these cells adapted to the hypoxic conditions over time. In contrast, Huh7 has a higher tolerance to hypoxia, but also lower baseline levels of stabilized HIF1α and PDK1 in normoxic conditions. In agreement to our findings, a study on six human breast cancer cell lines found high basal levels of VEGF A and low HIF-1α and HIF-2α induction was correlated with improved survival under hypoxia [49]. HIF-1α is activated during hypoxia, here induced by CoCl2, and then activates transcription of both VEGF A and CAIX [42]. In our protein profile results, VEGF A was detected in all three cell lines at 6 and 72 h. Normalized protein expression of VEGF A was only slightly increased in SNU449 cells for all samples incubated 72 h, but more interestingly basal levels of VEGF A were 8-fold higher in Huh7 and SNU449 than in HepG2. Cell viability of both Huh7 and SNU449 was unaffected at 6 and 72 h in hypoxia, which is in agreement with the higher basal VEGF A expression. CAIX, a protein that helps with neutralizing intracellular pH and acidifying extracellular microenvironment [42,50] was detected in Huh7 and SNU449. CAIX was increased 8–fold in Huh7 cells treated for 72 h with hypoxia and 2-fold in SNU449 cells. This suggests that Huh7 and SNU449 cells actively adapt to the hypoxic conditions, which could have led to the sustained cell viability from 6 to 72 h.
Tolerance of cancer cell lines to chemotherapeutic agents can increase or decrease in hypoxic conditions. Increased tolerance to chemotherapeutics under hypoxic conditions are observed in human embryonal carcinoma testicular germ cell tumor cell lines [51], HCC cell lines (HepG2, BEL-7402, and SMMC-7721) [52,53], and human and mouse prostatic adenocarcinoma cells [54]. However, conflicting results have also been published, where hypoxia could cause either increased or decreased tolerance to different chemotherapeutic agents [55]. This is similar to the results in this study, where different effects of hypoxia on DOX tolerance were observed for the three cell lines included. For HepG2 cultured in hypoxia, the cell viability with DOX treatment decreased over time compared to non-DOX treated cells. On the contrary, cell viability for Huh7 cells was not affected over time under hypoxia, while the tolerance to DOX increased compared to normoxic conditions. This suggested that hypoxia induces a more DOX-resistant phenotype in these cells. Interestingly, the tolerance to DOX of SNU449 was only marginally affected by hypoxic conditions.
It has been hypothesized that cells that proliferate less in hypoxia will be more tolerant to chemotherapeutic agents, as the chemotherapeutic agents act on dividing cells [55]. DOX has three working mechanisms: topoisomerase inhibition, intercalation to DNA, and formation of reactive oxygen species [8,9,10]. The latter mechanism is often described in the context of adverse effects, such as cardiotoxicity, but also occurs in DOX-treated cancer cells [56]. Since CoCl2 does not create an actual oxygen deprivation, but mimics hypoxia by binding to prolyl hydroxylase containing domain proteins that activate HIF-1α, there is still an abundance of reactive oxygen species, which might have contributed to the DOX cytotoxicity [57]. In line with previous findings [58], we found an increase of oxidative stress in all cells exposed to CoCl2. A low exposure of 0.1 µM DOX induced oxidative stress in all cell lines after 24 h, which is in line with previous reports [56]. A higher exposure of 1 µM DOX also led to an increase of oxidative stress in Huh7 and SNU449, but decreased oxidative stress in HepG2 cells. Since this method did not normalize for total cell number, we assumed that this decrease could be a result of the high number of HepG2 cells dying because of the DOX treatment. Measuring ROS using flow cytometry and selecting living cells, indeed revealed an increase of oxidative stress in HepG2 cells exposed to 1 µM DOX. Interestingly, the tolerance to DOX of SNU449 was only marginally affected by hypoxic conditions, while SNU449 cells was the only cell line to increase the level of oxidative stress when CoCl2-induced hypoxia was combined with DOX treatment. This suggests that oxidative stress did not contribute to DOX cytotoxicity in the SNU499 cell line. Elevation of intracellular mitochondrial ROS levels in tumors is known to activate PKD1 and NF-κB, leading to upregulation antiapoptotic proteins such as A20 and cIAPs [59]. Therefore, generation of ROS in tumor cell can work as a double-edged sword, by both promoting and inducing cell death, depending on duration of oxidative stress, intracellular ROS levels, as well as cell-specific mechanisms that counter proapoptotic stimuli or prevent the activation of oxidative stress-induced signaling cascades [60].
DOX is known to upregulate and activate HIF-1α, and HIF-1α targeting strategies have been suggested to enhance the effect of DOX treatment [61]. Possibly, treatment with DOX could have led to a secondary activation of HIF-1α, which could induce a positive feedback loop to increase the number of prolyl hydroxylase containing domain proteins and thus interfere with the working mechanism of CoCl2 [62]. It is thus possible that the differences in tolerance to DOX under hypoxic conditions in the tested cell lines is caused by a different main antitumor effect for each cell line, or because of subjection to HIF-1α-induced feedback mechanisms that interfered with CoCl2. In our study, we found different levels of HIF1α and PDK1 in the three cell lines under the same oxygen conditions, which could explain differences in their adaptation to hypoxia and their sensitivity to DOX. In addition, there were differences in generation of ROS between the different cell lines under normoxia and hypoxia, before and after DOX treatment, which would further contribute to the cytotoxic effect of both hypoxia and DOX.
Another possible explanation of the different responses between cell lines, both in historical data and our results, could be the difference in how hypoxia was created. Chemical hypoxia with CoCl2 is a hypoxic mimetic that functions by stabilizing HIF-1α. It has been shown that the difference in oxygen levels during hypoxia could affect cell behavior, where induction of apoptosis was observed when oxygen levels decreased below 0.5%, but not at oxygen levels of 1–3% [63]. Interestingly, it was also found that tolerance to DOX both increased (1% O2) and decreased (0.1% O2) in five different cancer cell lines (not liver) [55], which is in agreement with the induction of apoptosis at lower oxygen levels.
A final important finding in our study was the difference in oncogenic protein profile between cell lines. Previous studies have shown a high similarity in gene expression between Huh7 and HepG2 cell lines and HCC tumor tissue, based upon rank-based gene expression [25,27]. The same study also observed a low similarity between the gene expression in SNU449 and HCC tumor tissue, and so discouraged readers to use SNU449 for in vitro experiments [25]. However, our results clearly show a higher degree of similarity between Huh7 and SNU449 cells compared to HepG2 cells. Most notable was the lower normalized expression of most oncogenic proteins in HepG2 cells compared to the other cell lines. The used oncologic protein panel is composed specifically of cancer proteins that participate in biological mechanisms central to the initiation and progression of cancer [29]. This could suggest that HepG2 cells could represent a less aggressive form of HCC tumors, compared to Huh7 and SNU449 cell lines. It is important to note that HepG2 cells are derived from a 15-year-old Caucasian American male and there is currently no real consensus whether these cells are derived from hepatocellular carcinoma [64] or from hepatoblastoma [65]. Irrespective of origin of HepG2, and in agreement with our results, Pang et al. in 2014 also concluded that HepG2 should not reflect the apoptotic and drug resistance properties of other HCC cell lines [26]. This discrepancy in historic tumor classifications, and our findings showing a differential oncogenic protein profile, raise questions on how representative this cell line truly is for research on initiation and progression of HCC.

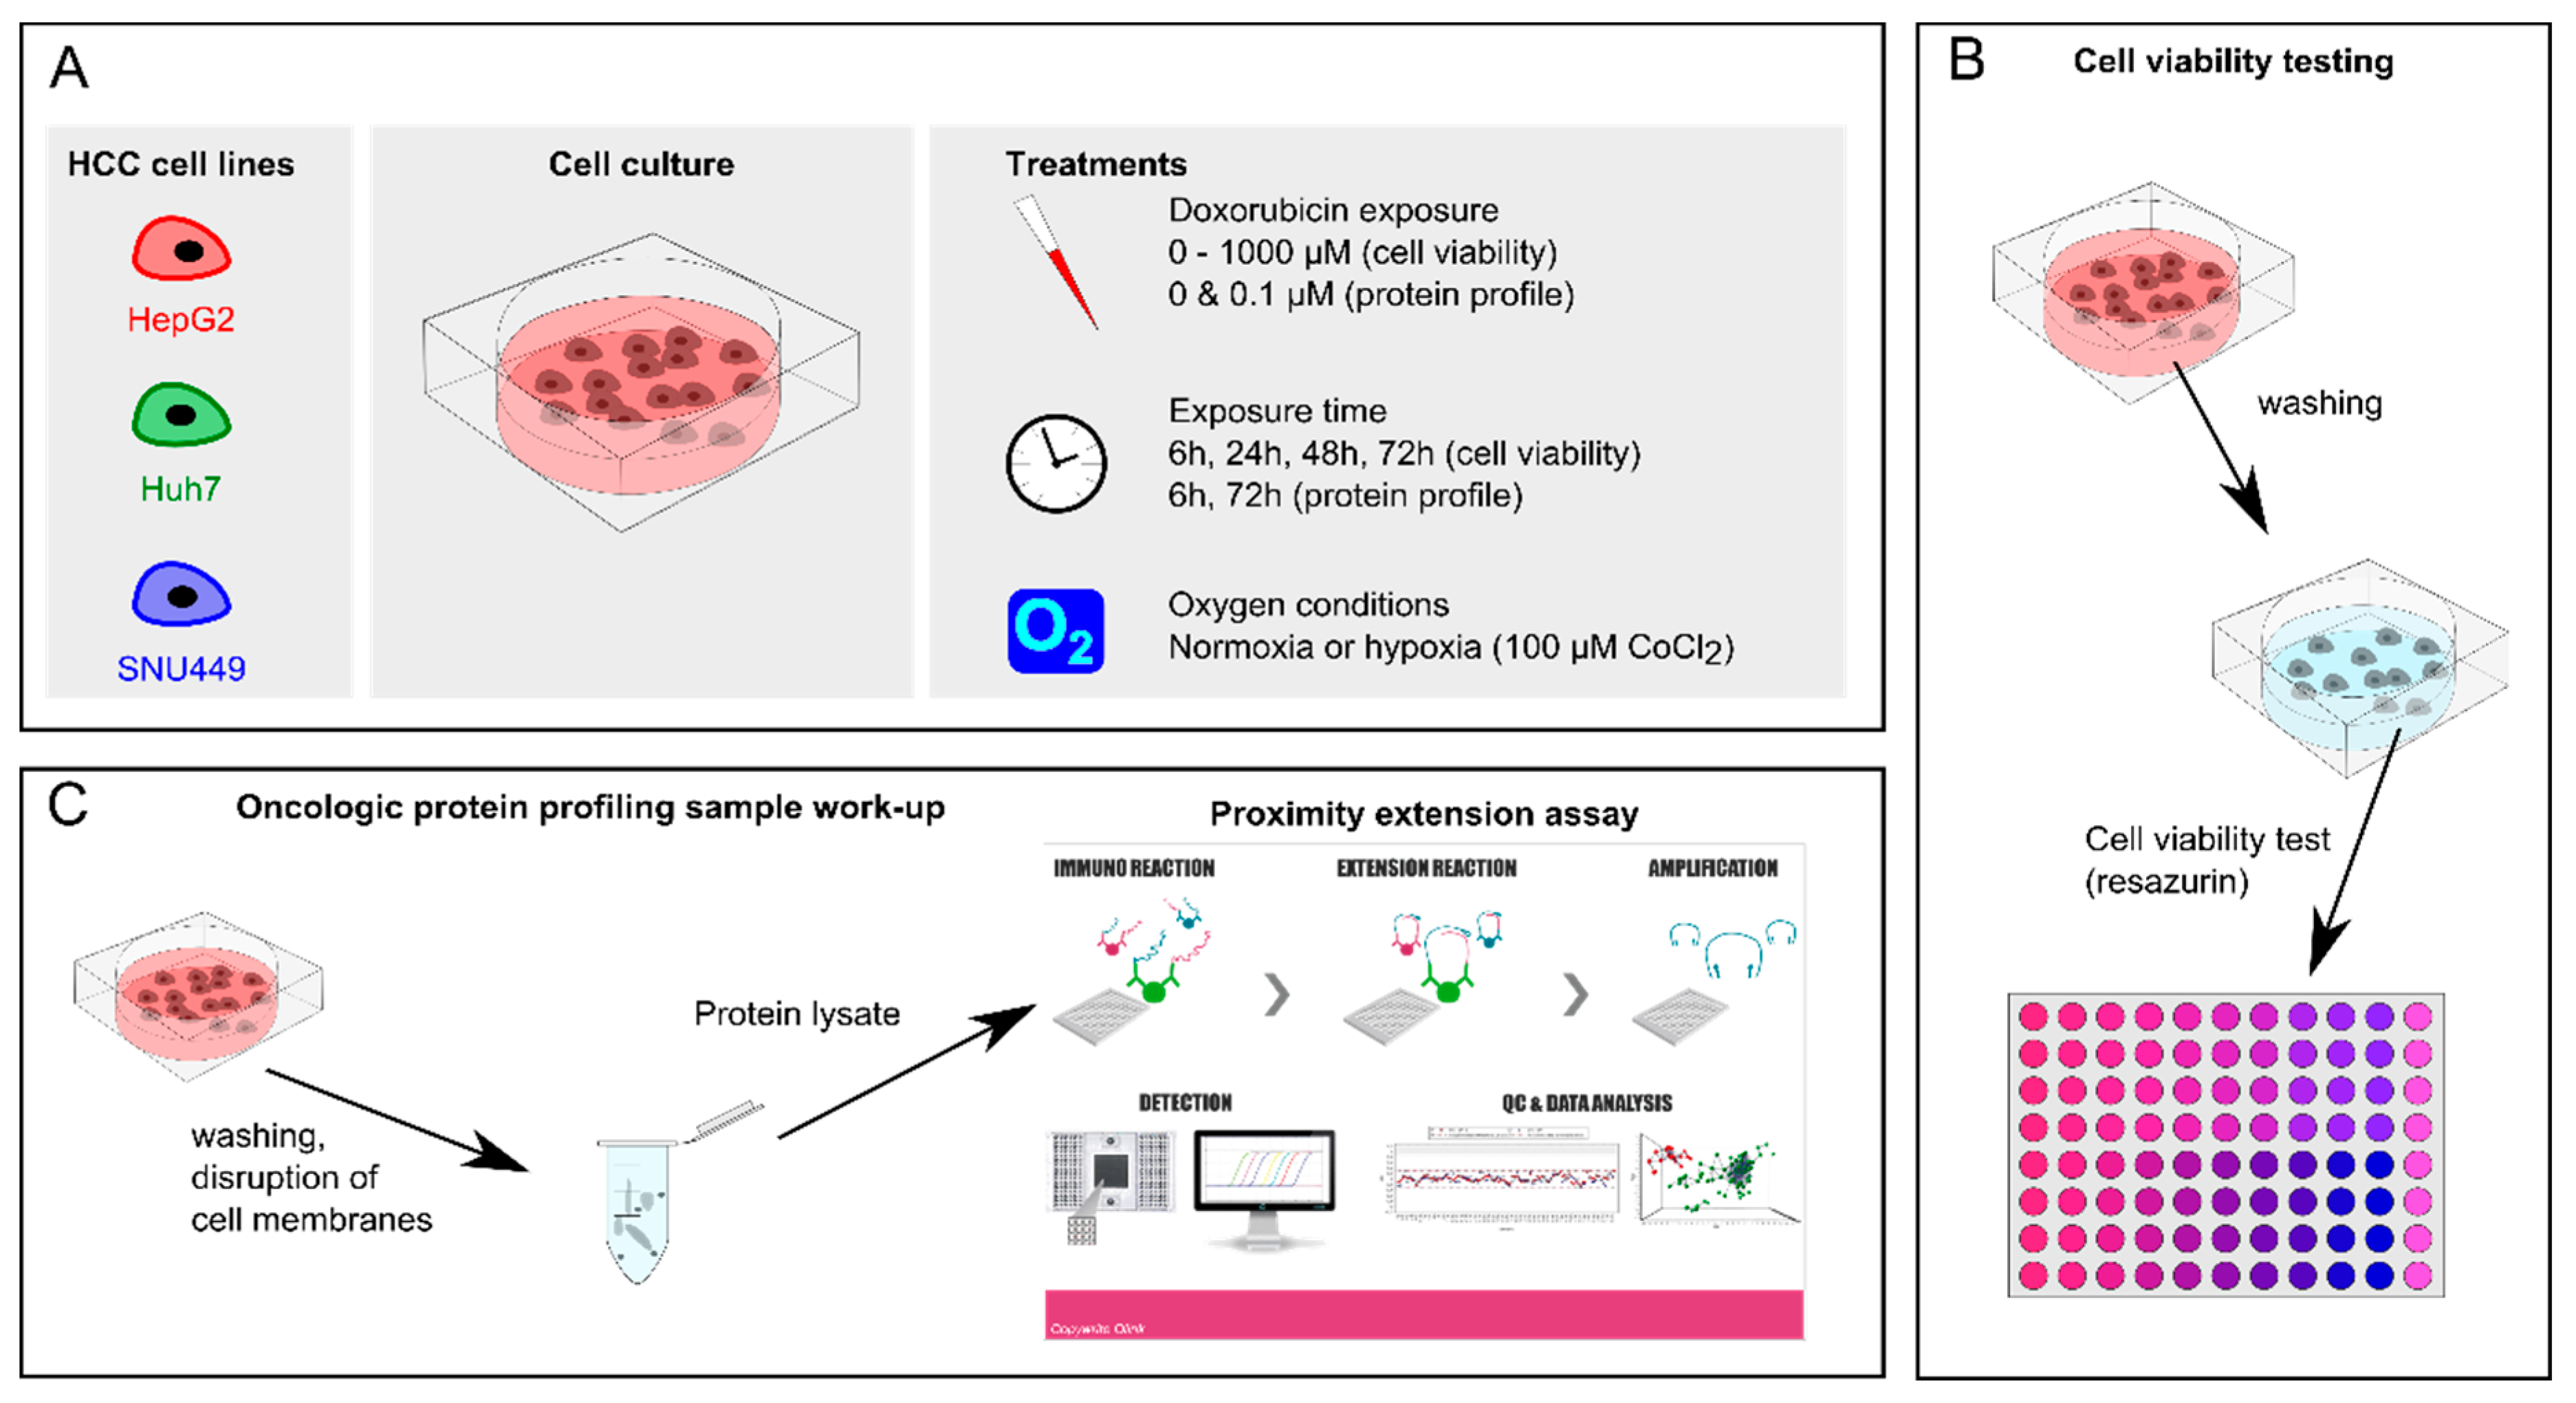
4. Materials and Methods

4.1. Chemicals

Doxorubicin hydrochloride (DOX HCl) was purchased from Toronto Research Chemicals, Canada. DOX stock solutions (100 mM) were prepared by dissolving the DOX in DMSO (Sigma-Aldrich, Germany). RIPA buffer, resazurin sodium salt and phosphate buffered saline (PBS) were purchased from Sigma-Aldrich (Darmstadt, Germany). Dulbecco’s Modified Eagle’s Medium (DMEM), Roswell Park Memorial Institute medium (RPMI), fetal bovine serum (FBS), and trypsin-EDTA were purchased from Gibco. Cobalt (iii) chloride hexahydrate (CoCl2, Sigma-Aldrich, Darmstadt, Germany) stock solutions were prepared by dissolving CoCl2 in sterile water (25 mM) and filtering through a syringe filter (0.22 µm).

4.2. Cell Culture

Three HCC cell lines (Figure 5A) were selected based on published data concerning IC50 values of the most commonly used HCC and hepatoma cell lines (Table 4). Our literature search showed that the most drug-resistant tumor cell line commercially available, which mimics the gene expression pattern of the original HCC patient (in contrast to cell lines that were genetically engineered to be chemoresistant) was SNU449. HepG2 and Huh7 cells were chosen as described to be more sensitive to DOX and because of their common use in HCC research. Contamination of the three cell lines was checked at the Register of Misidentified Cell Lines, and none of the chosen cell lines were on the list [66]. The liver cancer cell lines HepG2 and SNU449 were purchased from ATCC and Huh7 was kindly provided by Ahmed Dilruba, Karolinska Institute. Cells were routinely cultured in DMEM (HepG2 and Huh7) or RPMI (SNU449) supplemented with 10% FBS (cell culture media+FBS: CCMFBS) and 1% antibiotic–antimycotic solution (Sigma-Aldrich, Darmstadt, Germany). Cells were cultured at 37 °C with 5% CO2 under standard cell culturing conditions (Figure 5A).

4.3. Cell Viability Assay

For in vitro experiments, cells were detached using trypsin-EDTA, re-suspended in CCMFBS, and plated at a density of 1 × 10⁴ cells/well. Cells were allowed to attach and left undisturbed to adhere overnight. Thereafter, cells were treated with monotherapies of DOX and hypoxia, respectively or as a combination DOX + hypoxia. DOX stock solution was serially diluted to concentrations in the range of 0.01 to 1000 µM in CCMFBS (CCMFBS + DOX, Figure 5A). For the chemically induced hypoxia experiments, CoCl2 stock solutions were diluted with cell culture medium (CCMFBS + CoCl2) before making the 0, 0.01–1000 µM DOX concentration range in CCMFBS + CoCl2 (CCMFBS + CoCl2 + DOX, Figure 5A). A final concentration of 100 µM CoCl2 was used to induce chemical hypoxia, as previously described [70]. Medium was removed from the wells and 150 µL of CCMFBS (+CoCl2) + DOX was added to each well. Plates were again incubated in a humidified incubator with 5% CO2 at 37°C for the desired exposure time (6, 24, 48, or 72 h), with and without chemically induced hypoxia (Figure 5A). Note that media was not replaced under the exposure time. Each treatment was tested on eight or more replicates. Medium was removed after the exposure time and cells were washed with 100 µL PBS (Figure 5B). Cell viability was monitored via resazurin reduction assay, which provides a cost-effective and accurate method to determine cell viability in cytotoxicity studies [71]. A 1% solution of resazurin sodium salt (Sigma-Aldrich) in PBS was filtered through a 0.22 µm filter. The filtered resazurin solution was added in 1/80 dilution to the cells and incubated for 24 h, after which fluorescent signal was measured with a 485/35 excitation filter and a 550/20 emission filter on a Fluostar Omega plate reader. The seeding density of the cells was confirmed to be within the limits of linearity between cell number and absorbance for this technique (Supplementary Material, Figure S3).

4.4. HIF1α and PDK1 in Cell ELISA Assay

Cells were seeded into 96-well amine-coated plates at a density of 1 × 10⁴ cells/well and exposed to normoxic (CCMFBS) or hypoxic conditions (CCMFBS + CoCl2, 100 µM) for 6, 24, and 72 h. HIF1α and PDK1 expression was measured using Hypoxic Response Human In-Cell ELISA Panel (Abcam, Cambridge, MA) according to manufacturer’s guidelines. Plates were scanned using an Odyssey imager (LI-COR, Lincoln, NE). Expression values were obtained by subtracting background values from wells with negative controls for each condition and normalized to the corresponding Janus Green fluorescence values for each well.

4.5. Oxidative Stress Measurement

Oxidative stress was measured using DCFDA—Cellular Reactive Oxygen Species (ROS) Detection Assay Kit (ab113851) in a microplate format and by flow cytometry. DCFDA is fluorogenic dye that measures ROS activity within the cell. After diffusion in to the cell, DCFDA is deacetylated by cellular esterases to a non-fluorescent compound, which is later oxidized by ROS into DCF, a highly fluorescent compound with maximum excitation and emission spectra of 495 nm and 529 nm respectively. Cells were seeded into 96-well plates with clear bottom and black sides at a density of 2.4 × 10⁴ cells/well for the microplate assay, and into 24-well plates at 1.2 × 10⁵ cells/well for flow cytometry and left to adhere overnight. On the next day, cells were stained with 25 µM DCFDA for 45 min at 37 °C, according to manufacturer’s guidelines. Following this step, cells were exposed to 0, 0.1 µM and 1 µM DOX in normoxic (CCMFBS) or hypoxic conditions (CCMFBS + CoCl2, 100 µM). After 6 h of treatment, fluorescence was measured at 485 nm excitation and 535 nm emission wavelengths using a Fluostar Omega plate reader and BD FACSCallibur. Results of the microplate assay are shown as fold change fluorescence. Results of the flow cytometry measurements are shown as percentage of mean DCF signal intensity of control conditions.

4.6. Annexin V Flow Cytometry

Cells were seeded into 24-well plates at 1.2 × 10⁵ cells/well and left to adhere overnight. On the next day, cells were exposed to 0, 0.1 µM, and 1 µM DOX in normoxic (CCMFBS) or hypoxic conditions (CCMFBS + CoCl2, 100 µM) for 24 h, following which apoptosis was assessed by flow cytometry using eBioscience™ Annexin V Apoptosis Detection Kit FITC (88-8005-72) according to manufacturer’s guidelines. Briefly, cells were washed with 1× Binding Buffer and incubated with a 1/20 dilution of fluorochrome-conjugated Annexin V for 10 min, after which fluorescence was measured at 485 nm excitation and 535 nm emission wavelengths using BD FACSCallibur. Results are shown as percentage of mean Annexin V signal intensity of normoxic untreated condition.

4.7. Oncologic Protein Profile

Preparation of the cells was as per the previous section. Cells were seeded in 6-well plates at 2 × 10⁵ per well and left to adhere overnight. DOX stock solution was diluted to 0.1 µM in CCMFBS (+ CoCl2). Eight different conditions were tested per cell line: normoxia or chemically induced hypoxia with exposure to 0 or 0.1 µM DOX during 6 or 72 h, with three replicates per experimental condition. Medium and cell debris were removed and remaining cells washed with PBS. Cells were detached with 100 µL ice-cold RIPA containing protease inhibitors (Sigma Aldrich), and cells were scraped off and aspired (Figure 5C). Cell suspension was collected in Eppendorf tubes and kept on ice for 20–30 min, whilst mixing vigorously to enhance disruption of the cell membranes. The cell suspensions were centrifuged (20 min, 13,000 rpm, 4 °C) and supernatant containing protein was collected. Supernatant was stored at −20 °C until protein measurement. Protein concentration was measured using the BCA kit (ThermoFisher). Finally, all supernatants were diluted to 1 mg/mL protein in RIPA. All samples were analyzed with a multiplex proximity extension assay for 92 biomarkers in the oncology panel (Olink Bioscience, Uppsala, Sweden) [29].

4.8. Data Analysis

Cell viability, defined as the percentage of fluorescence value of treated cells compared to fluorescence value of untreated cells, was calculated with Equation (1):
Cell viability   ( % ) = ( Fluorescence exp well–Average of Fluorescence blank well ) / ( Average of Fluorescence control well–Average of Fluorescence blank well )
The blank wells were empty in the plate while control wells contained cells in medium without any additional DOX treatment. Cell viability data vs. DOX concentrations were plotted in GraphPad Prism (version 7.04, GraphPad Software Inc., San Diego, CA, USA) and fitted with the “inhibitor vs. response—variable slope analysis” to determine the 50% inhibitory concentration (IC50) of DOX. DOX IC50 values were determined per cell line, for each exposure time, for both normoxic and hypoxic conditions. Differences between DOX IC50 with and without hypoxia per cell line was tested statistically with a 2-way ANOVA and Tukey’s multiple comparisons test (significant when adjusted p < 0.05) in GraphPad Prism. The effect of hypoxia was assessed by taking the ratio of cell viability under hypoxic and normoxic conditions. The effect of hypoxia on cell viability was tested statistically with a one-sample t-test (difference from 1) in GraphPad Prism.
Protein expression data from all different treatments on the three cell lines (Figure 5C) was obtained from OLINK [29], and processed using the following steps. (1) All data below LOQ or at LOQ were assumed to be not detected (NA). (2) All samples that had not passed the quality control were assumed to be not detected (NA). (3) Take median of duplicates or triplicates if at least two samples had a value over LOQ, otherwise median was set to NA. Analysis and visuals presented in this report are based on this processed data set. Hierarchical clustering was performed in Perseus (version 1.6.0.7) [72], where standard parameters were selected. Statistically differently expressed proteins between cell lines, exposure time, oxygen condition and DOX exposure was determined using volcano plots in Perseus.

5. Conclusions

In this study, we present our findings that three established and commonly used liver cancer cell lines (HepG2, Huh7, and SNU449) have critically different responses to chemotherapy and hypoxia. This was also reflected in their oncogenic protein profile and their response to hypoxia and oxidative stress. A synergic effect of hypoxia and treatment with DOX was only observed in HepG2 cells, while Huh7 and SNU449 might have developed escape mechanisms from both treatment and hypoxia. These escape mechanisms are of uttermost importance when studying chemotherapeutic agents. Adaptation of tumor cells to hypoxia is believed to be the main driver for selection of more invasive and therapy-resistant cancer phenotypes [73]. Our results emphasize the need to consider inter- and intratumoral heterogeneity and include multiple cell lines in preclinical studies. Our study further suggests that tumors can respond differently to the combination of local chemotherapy and embolization, which is important for future treatment optimization. This treatment is often a combination of the local intrahepatic administration of one or more chemotherapeutic agents, combined or followed with an occlusion of the tumor feeding vessels. There are two purposes of the treatment: obtaining high local chemotherapeutic tumor concentrations and creating a hypoxic environment to cause synergistic cell death. However, our findings suggest that this might not always be the best strategy. They support the numerous clinical findings that the combination of vessel occlusion and chemotherapeutic treatment does not cause increased overall survival [5].

Supplementary Materials

The following are available online at https://www.mdpi.com/2072-6694/11/7/1024/s1, Figure S1: Measurement of HIF1α and PDK1 on three liver cancer cell lines (HepG2, Huh7 and SNU449) cultured in normoxic and hypoxic conditions, Figure S2: Normalized protein concentrations for each analyzed biomarker and all analyzed conditions and samples, Figure S3: Seeding density and cell viability after 24 h.

Author Contributions

Conceptualization, I.R.D., F.H., E.S., and H.L.; Data curation, I.R.D.; Formal analysis, I.R.D.; Funding acquisition, F.H. and H.L.; Investigation, N.P. and F.H.; Methodology, I.R.D., N.P., and F.H.; Project administration, I.R.D. and F.H.; Resources, F.H. and H.L.; Supervision, F.H. and H.L.; Validation, F.H.; Visualization, I.R.D.; Writing—original draft, I.R.D. and F.H.; Writing—review & editing, I.R.D., F.H., E.S., and H.L.

Funding

Femke Heindryckx is funded through grants obtained from the Swedish Cancer Foundation (Cancerfonden, CAN2017/518 and CAN2013/1273), the Swedish society for medical research (SSMF, S17-0092), the O.E. och Edla Johanssons stiftelse. Hans Lennernäs is funded through grants obtained from the Swedish Cancer Foundation (Cancerfonden, CAN2018/602) and Swedish Research Council (2018-03301).

Conflicts of Interest

The authors declare no conflicts of interest.

References

  1. Pecorelli, A.; Lenzi, B.; Gramenzi, A.; Garuti, F.; Farinati, F.; Giannini, E.G.; Ciccarese, F.; Piscaglia, F.; Rapaccini, G.L.; Di Marco, M.; et al. Curative therapies are superior to standard of care (transarterial chemoembolization) for intermediate stage hepatocellular carcinoma. Liver Int. 2017, 37, 423–433. [Google Scholar] [CrossRef]
  2. Galle, P.R.; Tovoli, F.; Foerster, F.; Wörns, M.A.; Cucchetti, A.; Bolondi, L. The treatment of intermediate stage tumours beyond TACE: From surgery to systemic therapy. J. Hepatol. 2017, 67, 173–183. [Google Scholar] [CrossRef] [PubMed]
  3. Gaba, R.C.; Lewandowski, R.J.; Hickey, R.; Baerlocher, M.O.; Cohen, E.I.; Dariushnia, S.R.; Janne d’Othee, B.; Padia, S.A.; Salem, R.; Wang, D.S.; et al. Transcatheter Therapy for Hepatic Malignancy: Standardization of Terminology and Reporting Criteria. J. Vasc. Interv. Radiol. 2016, 27, 457–473. [Google Scholar] [CrossRef] [Green Version]
  4. European Association for the Study of the Liver. EASL Clinical Practice Guidelines: Management of hepatocellular carcinoma. J. Hepatol. 2018. [Google Scholar] [CrossRef]
  5. Hepatocellular Carcinoma: Diagnosis and Treatment, 3rd ed.; Carr, B.I. (Ed.) Springer International Publishing: Cham, Switzerland, 2016. [Google Scholar] [CrossRef]
  6. El Fouly, A.; Ertle, J.; El Dorry, A.; Shaker, M.K.; Dechene, A.; Abdella, H.; Mueller, S.; Barakat, E.; Lauenstein, T.; Bockisch, A.; et al. In intermediate stage hepatocellular carcinoma: Radioembolization with yttrium 90 or chemoembolization? Liver Int. 2015, 35, 627–635. [Google Scholar] [CrossRef] [PubMed]
  7. Lencioni, R.; de Baere, T.; Soulen, M.C.; Rilling, W.S.; Geschwind, J.F. Lipiodol transarterial chemoembolization for hepatocellular carcinoma: A systematic review of efficacy and safety data. Hepatology 2016, 64, 106–116. [Google Scholar] [CrossRef] [PubMed] [Green Version]
  8. Danesi, R.; Fogli, S.; Gennari, A.; Conte, P.; Del Tacca, M. Pharmacokinetic-pharmacodynamic relationships of the anthracycline anticancer drugs. Clin. Pharmacokinet. 2002, 41, 431–444. [Google Scholar] [CrossRef] [PubMed]
  9. Minotti, G.; Menna, P.; Salvatorelli, E.; Cairo, G.; Gianni, L. Anthracyclines: Molecular advances and pharmacologic developments in antitumor activity and cardiotoxicity. Pharmacol. Rev. 2004, 56, 185–229. [Google Scholar] [CrossRef]
  10. Tacar, O.; Sriamornsak, P.; Dass, C.R. Doxorubicin: An update on anticancer molecular action, toxicity and novel drug delivery systems. J. Pharm. Pharmacol. 2013, 65, 157–170. [Google Scholar] [CrossRef]
  11. Asghar, U.; Meyer, T. Are there opportunities for chemotherapy in the treatment of hepatocellular cancer? J. Hepatol. 2012, 56, 686–695. [Google Scholar] [CrossRef] [Green Version]
  12. Sieghart, W.; Hucke, F.; Peck-Radosavljevic, M. Transarterial chemoembolization: Modalities, indication, and patient selection. J. Hepatol. 2015, 62, 1187–1195. [Google Scholar] [CrossRef] [Green Version]
  13. Corbet, C.; Feron, O. Tumour acidosis: From the passenger to the driver’s seat. Nat. Rev. Cancer 2017, 17, 577–593. [Google Scholar] [CrossRef]
  14. Copple, B.L. Hypoxia stimulates hepatocyte epithelial to mesenchymal transition by hypoxia-inducible factor and transforming growth factor-beta-dependent mechanisms. Liver Int. 2010, 30, 669–682. [Google Scholar] [CrossRef]
  15. Vaupel, P.; Mayer, A. Tumor Hypoxia: Causative Mechanisms, Microregional Heterogeneities, and the Role of Tissue-Based Hypoxia Markers; Springer: Cham, Switzerland, 2016; pp. 77–86. [Google Scholar]
  16. Vaupel, P.; Multhoff, G. Accomplices of the Hypoxic Tumor Microenvironment Compromising Antitumor Immunity: Adenosine, Lactate, Acidosis, Vascular Endothelial Growth Factor, Potassium Ions, and Phosphatidylserine. Front. Immunol. 2017, 8, 1887. [Google Scholar] [CrossRef] [Green Version]
  17. Wilson, G.K.; Tennant, D.A.; McKeating, J.A. Hypoxia inducible factors in liver disease and hepatocellular carcinoma: Current understanding and future directions. J. Hepatol. 2014, 61, 1397–1406. [Google Scholar] [CrossRef] [Green Version]
  18. Llovet, J.M.; Ricci, S.; Mazzaferro, V.; Hilgard, P.; Gane, E.; Blanc, J.F.; de Oliveira, A.C.; Santoro, A.; Raoul, J.L.; Forner, A.; et al. Sorafenib in advanced hepatocellular carcinoma. N. Engl. J. Med. 2008, 359, 378–390. [Google Scholar] [CrossRef]
  19. Zhang, Y.F.; Wei, W.; Wang, J.H.; Xu, L.; Jian, P.E.; Xiao, C.Z.; Zhong, X.P.; Shi, M.; Guo, R.P. Transarterial chemoembolization combined with sorafenib for the treatment of hepatocellular carcinoma with hepatic vein tumor thrombus. Oncotargets Ther. 2016, 9, 4239–4246. [Google Scholar] [CrossRef]
  20. Choi, G.H.; Shim, J.H.; Kim, M.J.; Ryu, M.H.; Ryoo, B.Y.; Kang, Y.K.; Shin, Y.M.; Kim, K.M.; Lim, Y.S.; Lee, H.C. Sorafenib alone versus sorafenib combined with transarterial chemoembolization for advanced-stage hepatocellular carcinoma: Results of propensity score analyses. Radiology 2013, 269, 603–611. [Google Scholar] [CrossRef]
  21. Meyer, T.; Fox, R.; Ma, Y.T.; Ross, P.J.; James, M.W.; Sturgess, R.; Stubbs, C.; Stocken, D.D.; Wall, L.; Watkinson, A.; et al. Sorafenib in combination with transarterial chemoembolisation in patients with unresectable hepatocellular carcinoma (TACE 2): A randomised placebo-controlled, double-blind, phase 3 trial. Lancet Gastroenterol. Hepatol. 2017, 2, 565–575. [Google Scholar] [CrossRef]
  22. Chau, D.K.; Chen, G.G.; Zhang, H.; Leung, B.C.; Chun, S.; Lai, P.B. Differential functions of C- and N-terminal hepatitis B x protein in liver cells treated with doxorubicin in normoxic or hypoxic condition. PLoS ONE 2012, 7, e50118. [Google Scholar] [CrossRef]
  23. Chen, Y.L.; Yang, T.Y.; Chen, K.C.; Wu, C.L.; Hsu, S.L.; Hsueh, C.M. Hypoxia can impair doxorubicin resistance of non-small cell lung cancer cells by inhibiting MRP1 and P-gp expression and boosting the chemosensitizing effects of MRP1 and P-gp blockers. Cell. Oncol. 2016, 39, 411–433. [Google Scholar] [CrossRef]
  24. Wang, C.; Tang, Z.; Zhao, Y.; Yao, R.; Li, L.; Sun, W. Three-dimensional in vitro cancer models: A short review. Biofabrication 2014, 6, 022001. [Google Scholar] [CrossRef]
  25. Ao, L.; Guo, Y.; Song, X.K.; Guan, Q.Z.; Zheng, W.C.; Zhang, J.H.; Huang, H.Y.; Zou, Y.; Guo, Z.; Wang, X.L. Evaluating hepatocellular carcinoma cell lines for tumour samples using within-sample relative expression orderings of genes. Liver Int. 2017, 37, 1688–1696. [Google Scholar] [CrossRef]
  26. Pang, R.T.K.; Poon, T.C.W.; Wong, N.; Lai, P.B.S.; Wong, N.L.Y.; Chan, C.M.L.; Yu, J.W.S.; Chan, A.T.C.; Sung, J.J.Y. Comparison of protein expression patterns between hepatocellular carcinoma cell lines and a hepatoblastoma cell line. Clin. Proteom. 2004, 1, 313–331. [Google Scholar] [CrossRef] [Green Version]
  27. Chen, B.; Sirota, M.; Fan-Minogue, H.; Hadley, D.; Butte, A.J. Relating hepatocellular carcinoma tumor samples and cell lines using gene expression data in translational research. BMC Med. Genom. 2015, 8 (Suppl. 2), S5. [Google Scholar] [CrossRef]
  28. American Type Culture Collection. Available online: www.lgcstandards-atcc.org (accessed on 5 November 2018).
  29. Olink Proteomics: Oncology Panel. Available online: https://www.olink.com/ (accessed on 5 November 2018).
  30. Zhou, Q.Y.; Tu, C.Y.; Shao, C.X.; Wang, W.K.; Zhu, J.D.; Cai, Y.; Mao, J.Y.; Chen, W. GC7 blocks epithelial-mesenchymal transition and reverses hypoxia-induced chemotherapy resistance in hepatocellular carcinoma cells. Am. J. Transl. Res. 2017, 9, 2608–2617. [Google Scholar]
  31. Zhang, Y.; Lu, Y.; Zhang, C.; Huang, D.; Wu, W.; Zhang, Y.; Shen, J.; Cai, Y.; Chen, W.; Yao, W. FSCN1 increases doxorubicin resistance in hepatocellular carcinoma through promotion of epithelial-mesenchymal transition. Int. J. Oncol. 2018. [Google Scholar] [CrossRef]
  32. Chang, A.Y.; Wang, M. In-vitro growth inhibition of chemotherapy and molecular targeted agents in hepatocellular carcinoma. Anti-Cancer Drugs 2013, 24, 251–259. [Google Scholar] [CrossRef]
  33. Barraud, L.; Merle, P.; Soma, E.; Lefrancois, L.; Guerret, S.; Chevallier, M.; Dubernet, C.; Couvreur, P.; Trepo, C.; Vitvitski, L. Increase of doxorubicin sensitivity by doxorubicin-loading into nanoparticles for hepatocellular carcinoma cells in vitro and in vivo. J. Hepatol. 2005, 42, 736–743. [Google Scholar] [CrossRef]
  34. Hu, Q.D.; Chen, W.; Yan, T.L.; Ma, T.; Chen, C.L.; Liang, C.; Zhang, Q.; Xia, X.F.; Liu, H.; Zhi, X.; et al. NSC 74859 enhances doxorubicin cytotoxicity via inhibition of epithelial-mesenchymal transition in hepatocellular carcinoma cells. Cancer Lett. 2012, 325, 207–213. [Google Scholar] [CrossRef]
  35. Lee, T.K.; Lau, T.C.; Ng, I.O. Doxorubicin-induced apoptosis and chemosensitivity in hepatoma cell lines. Cancer Chemother. Pharmacol. 2002, 49, 78–86. [Google Scholar] [CrossRef]
  36. Qi, W.W.; Yu, H.Y.; Guo, H.; Lou, J.; Wang, Z.M.; Liu, P.; Sapin-Minet, A.; Maincent, P.; Hong, X.C.; Hu, X.M.; et al. Doxorubicin-loaded glycyrrhetinic acid modified recombinant human serum albumin nanoparticles for targeting liver tumor chemotherapy. Mol. Pharm. 2015, 12, 675–683. [Google Scholar] [CrossRef]
  37. Bains, O.S.; Szeitz, A.; Lubieniecka, J.M.; Cragg, G.E.; Grigliatti, T.A.; Riggs, K.W.; Reid, R.E. A correlation between cytotoxicity and reductase-mediated metabolism in cell lines treated with doxorubicin and daunorubicin. J. Pharmacol. Exp. Ther. 2013, 347, 375–387. [Google Scholar] [CrossRef]
  38. Levasseur, L.M.; Slocum, H.K.; Rustum, Y.M.; Greco, W.R. Modeling of the time-dependency of in vitro drug cytotoxicity and resistance. Cancer Res. 1998, 58, 5749–5761. [Google Scholar]
  39. Cox, J.; Weinman, S. Mechanisms of doxorubicin resistance in hepatocellular carcinoma. Hepatic Oncol. 2016, 3, 57–59. [Google Scholar] [CrossRef]
  40. Buschauer, S.; Koch, A.; Wiggermann, P.; Muller, M.; Hellerbrand, C. Hepatocellular carcinoma cells surviving doxorubicin treatment exhibit increased migratory potential and resistance to doxorubicin re-treatment in vitro. Oncol. Lett. 2018, 15, 4635–4640. [Google Scholar] [CrossRef]
  41. Delgado, J.L.; Hsieh, C.M.; Chan, N.L.; Hiasa, H. Topoisomerases as anticancer targets. Biochem. J. 2018, 475, 373–398. [Google Scholar] [CrossRef]
  42. The UniProt Consortium. UniProt: The universal protein knowledgebase. Nucleic Acids Res. 2017, 45, D158–D169. [Google Scholar] [CrossRef]
  43. Baral, E.; Auer, G. In vitro effect of doxorubicin on non-proliferating and proliferating epithelial cells. Int. J. Radiat. Oncol. Biol. Phys. 1990, 19, 963–965. [Google Scholar] [CrossRef]
  44. Campiglio, M.; Somenzi, G.; Olgiati, C.; Beretta, G.; Balsari, A.; Zaffaroni, N.; Valagussa, P.; Menard, S. Role of proliferation in HER2 status predicted response to doxorubicin. Int. J. Cancer 2003, 105, 568–573. [Google Scholar] [CrossRef]
  45. Eom, Y.W.; Kim, M.A.; Park, S.S.; Goo, M.J.; Kwon, H.J.; Sohn, S.; Kim, W.H.; Yoon, G.; Choi, K.S. Two distinct modes of cell death induced by doxorubicin: Apoptosis and cell death through mitotic catastrophe accompanied by senescence-like phenotype. Oncogene 2005, 24, 4765–4777. [Google Scholar] [CrossRef]
  46. Wei, L.; Surma, M.; Gough, G.; Shi, S.; Lambert-Cheatham, N.; Chang, J.; Shi, J. Dissecting the Mechanisms of Doxorubicin and Oxidative Stress-Induced Cytotoxicity: The Involvement of Actin Cytoskeleton and ROCK1. PLoS ONE 2015, 10, e0131763. [Google Scholar] [CrossRef]
  47. Czeczuga-Semeniuk, E.; Wolczynski, S.; Dabrowska, M.; Dzieciol, J.; Anchim, T. The effect of doxorubicin and retinoids on proliferation, necrosis and apoptosis in MCF-7 breast cancer cells. Folia Histochem. Cytobiol. 2004, 42, 221–227. [Google Scholar]
  48. Zhou, W.; Dosey, T.L.; Biechele, T.; Moon, R.T.; Horwitz, M.S.; Ruohola-Baker, H. Assessment of hypoxia inducible factor levels in cancer cell lines upon hypoxic induction using a novel reporter construct. PLoS ONE 2011, 6, e27460. [Google Scholar] [CrossRef]
  49. Blancher, C.; Moore, J.W.; Talks, K.L.; Houlbrook, S.; Harris, A.L. Relationship of hypoxia-inducible factor (HIF)-1alpha and HIF-2alpha expression to vascular endothelial growth factor induction and hypoxia survival in human breast cancer cell lines. Cancer Res. 2000, 60, 7106–7113. [Google Scholar]
  50. Pastorekova, S.; Ratcliffe, P.J.; Pastorek, J. Molecular mechanisms of carbonic anhydrase IX-mediated pH regulation under hypoxia. BJU Int. 2008, 101 (Suppl. 4), 8–15. [Google Scholar] [CrossRef]
  51. Koch, S.; Mayer, F.; Honecker, F.; Schittenhelm, M.; Bokemeyer, C. Efficacy of cytotoxic agents used in the treatment of testicular germ cell tumours under normoxic and hypoxic conditions in vitro. Br. J. Cancer 2003, 89, 2133. [Google Scholar] [CrossRef]
  52. Li, J.-q.; Wu, X.; Gan, L.; Yang, X.-l.; Miao, Z.-h. Hypoxia induces universal but differential drug resistance and impairs anticancer mechanisms of 5-fluorouracil in hepatoma cells. Acta Pharmacol. Sin. 2017, 38, 1642. [Google Scholar] [CrossRef]
  53. Available online: https://www.nature.com/articles/aps201779#supplementary-information (accessed on 19 June 2019).
  54. Bowyer, C.; Lewis, A.L.; Lloyd, A.W.; Phillips, G.J.; Macfarlane, W.M. Hypoxia as a target for drug combination therapy of liver cancer. Anti-Cancer Drugs 2017, 28, 771–780. [Google Scholar] [CrossRef] [Green Version]
  55. Frederiksen, L.J.; Siemens, D.R.; Heaton, J.P.; Maxwell, L.R.; Adams, M.A.; Graham, C.H. Hypoxia induced resistance to doxorubicin in prostate cancer cells is inhibited by low concentrations of glyceryl trinitrate. J. Urol. 2003, 170, 1003–1007. [Google Scholar] [CrossRef]
  56. Strese, S.; Fryknäs, M.; Larsson, R.; Gullbo, J. Effects of hypoxia on human cancer cell line chemosensitivity. BMC Cancer 2013, 13, 331. [Google Scholar] [CrossRef]
  57. Mai, Y.; Yu, J.J.; Bartholdy, B.; Xu-Monette, Z.Y.; Knapp, E.E.; Yuan, F.; Chen, H.; Ding, B.B.; Yao, Z.; Das, B.; et al. An oxidative stress-based mechanism of doxorubicin cytotoxicity suggests new therapeutic strategies in ABC-DLBCL. Blood 2016, 128, 2797–2807. [Google Scholar] [CrossRef] [Green Version]
  58. Kotake-Nara, E.; Saida, K. Characterization of CoCl2-induced reactive oxygen species (ROS): Inductions of neurite outgrowth and endothelin-2/vasoactive intestinal contractor in PC12 cells by CoCl2 are ROS dependent, but those by MnCl2 are not. Neurosci. Lett. 2007, 422, 223–227. [Google Scholar] [CrossRef]
  59. He, Y.; Gan, X.; Zhang, L.; Liu, B.; Zhu, Z.; Li, T.; Zhu, J.; Chen, J.; Yu, H. CoCl2 induces apoptosis via a ROS-dependent pathway and Drp1-mediated mitochondria fission in periodontal ligament stem cells. Am. J. Physiol. Cell Physiol. 2018, 315, C389–C397. [Google Scholar] [CrossRef]
  60. Storz, P.; Doppler, H.; Ferran, C.; Grey, S.T.; Toker, A. Functional dichotomy of A20 in apoptotic and necrotic cell death. Biochem. J. 2005, 387, 47–55. [Google Scholar] [CrossRef] [Green Version]
  61. Liou, G.Y.; Storz, P. Reactive oxygen species in cancer. Free Radic. Res. 2010, 44, 479–496. [Google Scholar] [CrossRef] [Green Version]
  62. Cao, Y.; Eble, J.M.; Moon, E.; Yuan, H.; Weitzel, D.H.; Landon, C.D.; Nien, C.Y.; Hanna, G.; Rich, J.N.; Provenzale, J.M.; et al. Tumor cells upregulate normoxic HIF-1alpha in response to doxorubicin. Cancer Res. 2013, 73, 6230–6242. [Google Scholar] [CrossRef]
  63. Kelly, T.J.; Souza, A.L.; Clish, C.B.; Puigserver, P. A hypoxia-induced positive feedback loop promotes hypoxia-inducible factor 1alpha stability through miR-210 suppression of glycerol-3-phosphate dehydrogenase 1-like. Mol. Cell. Biol. 2011, 31, 2696–2706. [Google Scholar] [CrossRef]
  64. Blokhina, O.; Virolainen, E.; Fagerstedt, K.V. Antioxidants, oxidative damage and oxygen deprivation stress: A review. Ann. Bot. 2003, 91, 179–194. [Google Scholar] [CrossRef]
  65. Costantini, S.; Di Bernardo, G.; Cammarota, M.; Castello, G.; Colonna, G. Gene expression signature of human HepG2 cell line. Gene 2013, 518, 335–345. [Google Scholar] [CrossRef]
  66. Lopez-Terrada, D.; Cheung, S.W.; Finegold, M.J.; Knowles, B.B. Hep G2 is a hepatoblastoma-derived cell line. Hum. Pathol. 2009, 40, 1512–1515. [Google Scholar] [CrossRef]
  67. Capes-Davis, A.; Theodosopoulos, G.; Atkin, I.; Drexler, H.G.; Kohara, A.; MacLeod, R.A.; Masters, J.R.; Nakamura, Y.; Reid, Y.A.; Reddel, R.R.; et al. Check your cultures! A list of cross-contaminated or misidentified cell lines. Int. J. Cancer 2010, 127, 1–8. [Google Scholar] [CrossRef]
  68. Shiraga, K.; Sakaguchi, K.; Senoh, T.; Ohta, T.; Ogawa, S.; Sawayama, T.; Mouri, H.; Fujiwara, A.; Tsuji, T. Modulation of doxorubicin sensitivity by cyclosporine A in hepatocellular carcinoma cells and their doxorubicin-resistant sublines. J. Gastroenterol. Hepatol. 2001, 16, 460–466. [Google Scholar] [CrossRef]
  69. Chang, J.E.; Shim, W.S.; Yang, S.G.; Kwak, E.Y.; Chong, S.; Kim, D.D.; Chung, S.J.; Shim, C.K. Liver cancer targeting of Doxorubicin with reduced distribution to the heart using hematoporphyrin-modified albumin nanoparticles in rats. Pharm. Res. 2012, 29, 795–805. [Google Scholar] [CrossRef]
  70. Lou, B.; Fan, J.; Wang, K.; Chen, W.; Zhou, X.; Zhang, J.; Lin, S.; Lv, F.; Chen, Y. N1-guanyl-1,7-diaminoheptane (GC7) enhances the therapeutic efficacy of doxorubicin by inhibiting activation of eukaryotic translation initiation factor 5A2 (eIF5A2) and preventing the epithelial-mesenchymal transition in hepatocellular carcinoma cells. Exp. Cell Res. 2013, 319, 2708–2717. [Google Scholar] [CrossRef]
  71. Wu, D.; Yotnda, P. Induction and testing of hypoxia in cell culture. JoVE 2011. [Google Scholar] [CrossRef]
  72. Rampersad, S.N. Multiple applications of Alamar Blue as an indicator of metabolic function and cellular health in cell viability bioassays. Sensors 2012, 12, 12347–12360. [Google Scholar] [CrossRef]
  73. Tyanova, S.; Temu, T.; Sinitcyn, P.; Carlson, A.; Hein, M.Y.; Geiger, T.; Mann, M.; Cox, J. The Perseus computational platform for comprehensive analysis of (prote)omics data. Nat. Methods 2016, 13, 731–740. [Google Scholar] [CrossRef]
Figure 1. The effect of different treatments on cell viability over time. Doxorubicin exposure–response curves for the three cell lines (left to right: HepG2, Huh7, and SNU449) at the different exposure times. Cells were kept under normoxia (top) or chemical hypoxia with 100 µM CoCl2 (bottom) during the duration of the experiment. Average (symbols) and standard deviation (error bars) are shown for each exposure of DOX concentration; at least 6 replicates were used for each tested concentration.
Cancers 11 01024 g001
Figure 2. Effects on the oxidative stress cells experience with different DOX concentrations. Panel A and B show the oxidative stress to cells under normoxia and chemical hypoxia using a DCFDA—Cellular Reactive Oxygen Species (ROS) Detection Assay Kit in the microplate format. Panel C shows the same experiment, except that DCFDA was measured by flow cytometry. Results are shown as mean fold difference (A&B) or % of mean signal intensity (C) of control condition (normoxia and 0 µM DOX), error bars show SD. Six replicates were used for each tested condition.
Cancers 11 01024 g002
Figure 3. The apoptotic response of cells exposed to different concentrations of DOX for 24 h. Results are shown as percentage of mean Annexin V signal intensity of control conditions (normoxia and 0 µM DOX), with SD as error bars. Three replicates were used for each tested condition.
Cancers 11 01024 g003
Figure 4. Results of oncological protein profiling. (A) Venn diagram showing the number of detected proteins in each cell line. (B) The number of detected proteins for each biological process in each cell line. For each biological process, the number of proteins included in the analysis are given in brackets behind the process. Note that proteins can have several biological process classes. (C) Hierarchical clustering based on proteomic quantification visualized in a heat map. A two-way unsupervised hierarchical clustering of the median protein expression values of all proteins in three cell lines—HepG2 (red), Huh7 (green), and SNU449 (blue)—treated during 6 (white) or 72 h (black) under chemical hypoxia (black) or normoxia (white) and exposed to no doxorubicin (white) or 0.1 µM doxorubicin (black). The colored bar under the heat map represents the abundance of the different proteins in the heat map; blue is low abundance, red is high abundance. White squares in the heat map show NA values, i.e., not detected in at least 2 of 3 samples. Raw data is shown in Supplementary Material, Figure S2.
Cancers 11 01024 g004
Figure 5. Overview of the used methods to assess the effect of treatments in hepatic cell lines. (A) The used liver cancer cell lines, cell culture in 96-well plates, and the applied treatments. (B) The sample work-up and analysis for cell viability testing. (C) Oncological protein profiling sample work-up and analysis by proximity extension assay [29].
Cancers 11 01024 g005
Table 1. The effect of exposure time of chemical hypoxia with 100 µM CoCl2 on cell viability of HepG2, Huh7, and SNU449 liver cancer cell lines. Ratio of hypoxia effect was calculated as cell viability at hypoxia/normoxia with 0 µM doxorubicin, and is described as average with standard deviation; at least 6 replicates were used for each tested concentration.
TimeHepG2Huh7SNU449
6 h1.01 ± 0.0451.01 ± 0.0055 *0.99 ± 0.022
24 h1.03 ± 0.141.04 ± 0.0640.95 ± 0.077 *
48 h0.90 ± 0.072 *1.06 ± 0.0091 *0.76 ± 0.082 *
72 h0.81 ± 0.1 *0.99 ± 0.009 *1.02 ± 0.044
* indicate a significant difference (p < 0.05) from 1 as tested with one-sample t-test.
Table 2. IC50 values (µM) of DOX for cell lines at specified time intervals and oxygen conditions following exposure to the drug. Chemical hypoxia was induced with 100 µM CoCl2. IC50 values are given as mean ± standard error; at least 6 replicates were used for each tested concentration.
TimeHepG2Huh7SNU449
NormoxiaHypoxiaRhyp/normNormoxiaHypoxiaRhyp/normNormoxiaHypoxiaRhyp/norm
6 h310 ± 1270 ± 11 *0.2170 ± 3.3 a870 ± 15 *,a5.1920 ± 72 a,b860 ± 32 a0.9
24 h1.3 ± 0.18c0.81 ± 0.0870.65.2 ± 0.49 c12 ± 0.78 c2.4160 ± 17 a,b,c240 ± 16 *,a,b,c1.5
48 h0.62 ± 0.06 c0.1 ± 0.00460.22 ± 0.18 a,c9.2 ± 0.58 c4.716 ± 0.73 c,d44 ± 3.7 c,d2.8
72 h0.19 ± 0.017 c0.099 ± 0.00890.50.34 ± 0.038 c2 ± 0.17 c5.8110 ± 3.9 a,b,c,e110 ± 5.5 a,b,c,d,e1.0
* statistically different from normoxia at same time point and cell line; a statistically different from HepG2 at same time point and oxygen condition; b statistically different from Huh7 at same time point and oxygen condition; c statistically different from same cell line and oxygen condition at 6 h; d statistically different from same cell line and oxygen condition at 24 h; e statistically different from same cell line and oxygen condition at 48 h. Tested with 2-way Anova with Tukey’s multiple comparisons test, significant when adjusted p < 0.05. Rhyp/norm ratio IC50 hypoxia/normoxia.
Table 3. Analyzed proteins and their biological process together with the difference in normalized protein expression between cell lines.
ProteinBiological Process HepG2 vs. Huh7HepG2 vs. SNU449Huh7 vs. SNU449
5′-nucleotidase (5′-NT; P21589)Cell adhesion; Cellular metabolic process---- *---- *-- *
A disintegrin and metalloproteinase with thrombospondin motifs 15 (ADAM-TS 15; Q8TE58) - *-- *-- *
Alpha-taxilin (TXLNA; P40222)Cell proliferation; Cellular response to stress--- *--- *-
Amphiregulin (AREG; P15514)Cell differentiation; Cell proliferation; Cellular metabolic process---- *--- *++ *
Annexin A1 (ANXA1; P04083)Apoptotic process; Cell adhesion; Cell differentiation; Cell motility; Cell proliferation; Cellular metabolic process; Cellular response to stress; Chemotaxis; Immune response--- *--- *+
Carbonic anhydrase 9 (CAIX; Q16790)Cellular metabolic process; Cellular response to stress; Response to hypoxia---- *+
Carboxypeptidase E (CPE; P16870)Cellular metabolic process; Proteolysis+++ *NANA
Carcinoembryonic antigen-related cell adhesion molecule 1 (CEACAM1; P13688)Angiogenesis; Cell adhesion; Cell differentiation; Cell motility; Cell proliferation; Cellular metabolic process; Immune response; MAPK cascade--- *- *+++ *
Carcinoembryonic antigen-related cell adhesion molecule 5 (CEACAM5; P06731)Apoptotic process; Cell adhesion; Cell differentiationNANANA
Cathepsin L2 (CTSV; O60911)Cell differentiation; Cell proliferation; Cellular metabolic process; Cellular response to stress; Extracellular matrix organization; Proteolysis-- *-- *+
CD160 antigen (CD160; O95971)Cell proliferation; Immune response;NDNDND
CD27 antigen (CD27; P26842)Apoptotic process; Cell differentiation; Cell proliferation; Cellular metabolic process; Cellular response to stress; Immune response; MAPK cascadeNDNDND
CD48 antigen (CD48; P09326)Cell motility+--
CD70 antigen (CD70; P32970)Apoptotic process; Cell proliferation; Immune responseNA--- *NA
Cornulin (CRNN; Q9UBG3)Cell adhesion+--
C-type lectin domain family 4 member K (CD207; Q9UJ71) NA-NA
C-X-C motif chemokine 13 (CXCL13; O43927)Angiogenesis; Cell adhesion; Cell motility; Cell proliferation; Chemotaxis; Immune response--+
Cyclin-dependent kinase inhibitor 1 (DKN1A; P38936)Apoptotic process; Cell differentiation; Cell proliferation; Cellular metabolic process; Cellular response to stress-- *-- *+
Delta-like protein 1 (DLL1; O00548)Angiogenesis; Apoptotic process; Cell adhesion; Cell differentiation; Cell proliferation; Cellular metabolic process; Immune responseNANA-
Disintegrin and metalloproteinase domain-containing protein 8 (ADAM 8; P78325)Angiogenesis; Apoptotic process; Cell adhesion; Cell differentiation; Cell motility; Cellular metabolic process; Cellular response to stress; Chemotaxis; Extracellular matrix organization; Immune response; MAPK cascade; Proteolysis; Response to hypoxiaNDNDND
Endothelial cell-specific molecule 1 (ESM-1; Q9NQ30)Angiogenesis; Cell proliferationNA--NA
Ephrin type-A receptor 2 (EPHA2; P29317)Angiogenesis; Apoptotic process; Cell adhesion; Cell differentiation; Cell motility; Cell proliferation; Cellular metabolic process; Cellular response to stress; Chemotaxis; MAPK cascade--- *--- *+ *
FAS-associated death domain protein (FADD; Q13158)Apoptotic process; Cell adhesion; Cell differentiation; Cell motility; Cell proliferation; Cellular metabolic process; Immune response; ProteolysisNANA+ *
Fc receptor-like B (FCRLB; Q6BAA4)Immune response+NANA
Fibroblast growth factor-binding protein 1 (FGF-BP1; Q14512)Cell proliferation; Cellular response to stress;++ *-- *-- *
Folate receptor alpha (FR-alpha; P15328)Cell differentiation; Cell motility; Cellular metabolic process; Cellular response to stress--- *-- *++ *
Folate receptor gamma (FR-gamma; P41439) NANANA
Furin (FURIN; P09958)Cell motility; Cell proliferation; Cellular metabolic process; Extracellular matrix organization; Proteolysis--- *++++ *
Galectin-1 (Gal-1; P09382)Apoptotic process; Cell adhesion; Cell differentiation; Immune response++ *-- *-- *
Glypican-1 (GPC1; P35052)Cell differentiation; Cellular metabolic process; ChemotaxisNANANA
Granzyme B (GZMB; P10144)Apoptotic process; Immune response; Proteolysis-NANA
Granzyme H (GZMH; P20718)Apoptotic process; Immune response; ProteolysisNDNDND
Hepatocyte growth factor (HGF; P14210)Angiogenesis; Apoptotic process; Cell differentiation; Cell motility; Cell proliferation; Cellular metabolic process; Cellular response to stress; Chemotaxis; MAPK cascade; Proteolysis-NANA
ICOS ligand (ICOSLG; O75144)Cell adhesion; Cell proliferation; Immune responseNA-NA
Insulin-like growth factor 1 receptor (IGF1R; P08069)Apoptotic process; Cell motility; Cell proliferation; Cellular metabolic process; Cellular response to stress; Immune response; MAPK cascade-------- *
Integrin alpha-V (ITGAV; P06756)Angiogenesis; Apoptotic process; Cell adhesion; Cell differentiation; Cell motility; Cell proliferation; Cellular metabolic process; Chemotaxis; Extracellular matrix organization; MAPK cascade--- *--- *+ *
Integrin beta-5 (ITGB5; P18084)Cell adhesion; Cell differentiation; Extracellular matrix organization--- *--- *- *
Interferon gamma receptor 1 (IFN-gamma-R1; P15260)Immune responseNANA++ *
Interleukin-6 (IL6; P05231)Angiogenesis; Apoptotic process; Cell adhesion; Cell differentiation; Cell motility; Cell proliferation; Cellular metabolic process; Cellular response to stress; Chemotaxis; Immune response; MAPK cascade; ProteolysisNANA--- *
Kallikrein-11 (hK11; Q9UBX7) ++ *+-- *
Kallikrein-13 (KLK13; Q9UKR3)Proteolysis++-
Kallikrein-14 (hK14; Q9P0G3)Proteolysis++ *+
Kallikrein-8 (hK8; O60259)Cell differentiation; Cell proliferation; Cellular response to stress++ *+ *-
Kit ligand (SCF; P21583)Apoptotic process; Cell adhesion; Cell differentiation; Cell motility; Cell proliferation; Cellular metabolic process; MAPK cascade-- *-- *++ *
Ly6/PLAUR domain-containing protein 3 (LYPD3; O95274)Cell adhesionNANANA
Melanoma-derived growth regulatory protein (MIA; Q16674)Cell proliferation+--
Mesothelin (MSLN; Q13421)Cell adhesionNDNDND
Methionine aminopeptidase 2 (MetAP 2; P50579)Cellular metabolic process; ProteolysisNANA+
MHC class I polypeptide-related sequence A and B (MIC-A/B; Q29983,Q29980)Cell adhesion; Cellular response to stress; Immune responseNANA--- *
Midkine (MK; P21741)Apoptotic process; Cell differentiation; Cell motility; Cellular metabolic processNANA++ *
Mothers against decapentaplegic homolog 5 (MAD homolog 5; Q99717)Cell differentiation; Cellular metabolic processNANA+
Mucin-16 (MUC-16; Q8WXI7)Cell adhesion; Cellular metabolic process;NANA+
Nectin-4 (PVRL4; Q96NY8)Cell adhesionNDNDND
Pancreatic prohormone (PPY; P01298)Cellular response to stressNDNDND
Podocalyxin (PODXL; O00592)Cell adhesion; Cell differentiation; Cell motilityNA+NA
Pro-epidermal growth factor (EGF; P01133)Angiogenesis; Cell motility; Cell proliferation; Cellular metabolic process; MAPK cascade; Proteolysis-- *-++ *
Protein CYR61 (CYR61; O00622)Angiogenesis; Apoptotic process; Cell adhesion; Cell differentiation; Cell motility; Cell proliferation; Cellular metabolic process; Chemotaxis; Extracellular matrix organization; MAPK cascade; Proteolysis-- *-- *-- *
Protein S100-A11 (S100A11; P31949)Cell proliferation; Cellular metabolic process--- *--- *+
Protein S100-A4 (S100A4; P26447)Cell differentiation++ *+++ *+
Proto-oncogene tyrosine-protein kinase receptor Ret (RET; P07949)Apoptotic process; Cell adhesion; Cell differentiation; Cell motility; Cellular metabolic process; MAPK cascade; ProteolysisNANANA
Protransforming growth factor alpha (TGF-alpha; P01135)Cell proliferation; Cellular metabolic process; MAPK cascade+++ *+++ *+
Receptor tyrosine-protein kinase erbB-2 (ERBB2; P04626)Angiogenesis--- *--- *+ *
Receptor tyrosine-protein kinase erbB-3 (ERBB3; P21860)Apoptotic process; Cell adhesion; Cell differentiation; Cell motility; Cell proliferation; Cellular metabolic process; MAPK cascade-----++ *
Receptor tyrosine-protein kinase erbB-4 (ERBB4; Q15303)Apoptotic process; Cell differentiation; Cell motility; Cell proliferation; Cellular metabolic process; MAPK cascade+-- *-- *
R-spondin-3 (RSPO3; Q9BXY4)Angiogenesis++ *++-
Secretory carrier-associated membrane protein 3 (Secretory carrier membrane protein 3) (SCAMP3; O14828) --- *--- *-
Seizure 6-like protein (SEZ6L; Q9BYH1) NDNDND
SPARC (SPARC; P09486)Angiogenesis; Cell motility; Cell proliferation; Extracellular matrix organization;-- *-- *-
Syndecan-1 (SYND1; P18827)Cell differentiation; Cell motility; Cellular metabolic processNANA++ *
T-cell leukemia/lymphoma protein 1A (TCL1A; P56279) NDNDND
TGF-beta receptor type-2 (TGFR-2; P37173)Angiogenesis; Apoptotic process; Cell adhesion; Cell differentiation; Cell motility; Cell proliferation; Cellular metabolic process-- *-- *+ *
Tissue factor pathway inhibitor 2 (TFPI-2; P48307) ---- *---- *-- *
T-lymphocyte surface antigen Ly-9 (LY9; Q9HBG7)Cell adhesion; Cell differentiation; Immune response+--
Toll-like receptor 3 (TLR3; O15455)Apoptotic process; Cell differentiation; Cellular metabolic process; Cellular response to stress; Immune response; MAPK cascade-- *--- *-- *
Transmembrane glycoprotein NMB (GPNMB; Q14956)Cell adhesion; Cell differentiation; Immune response++-
Tumor necrosis factor ligand superfamily member 10 (TRAIL; P50591)Apoptotic process; Cellular metabolic process; Immune response; Proteolysis-- *-- *-- *
Tumor necrosis factor ligand superfamily member 13 (TNFSF13; O75888)Cell proliferation; Cellular metabolic processNDNDND
Tumor necrosis factor ligand superfamily member 6 (FASLG; P48023)Angiogenesis; Apoptotic process; Cell differentiation; Cell proliferation; Cellular metabolic process; Immune response; ProteolysisNDNDND
Tumor necrosis factor receptor superfamily member 19 (TNFRSF19; Q9NS68)Apoptotic process; Cellular metabolic process; Cellular response to stress; MAPK cascade-- *- *++ *
Tumor necrosis factor receptor superfamily member 4 (TNFRSF4; P43489)Apoptotic process; Cell adhesion; Cell proliferation; Cellular metabolic process; Immune response; MAPK cascadeNA+NA
Tumor necrosis factor receptor superfamily member 6B (TNFRSF6B; O95407)Apoptotic process; Cell proliferation; Cellular metabolic process; Immune response; MAPK cascadeNANANA
Tyrosine-protein kinase ABL1 (ABL1; P00519)Apoptotic process; Cell adhesion; Cell differentiation; Cell motility; Cell proliferation; Cellular metabolic process; Cellular response to stress; Extracellular matrix organization; Immune response; MAPK cascade---------
Tyrosine-protein kinase Lyn (LYN; P07948)Apoptotic process; Cell adhesion; Cell differentiation; Cell motility; Cell proliferation; Cellular metabolic process; Cellular response to stress; Chemotaxis; Immune response; MAPK cascade-- *-- *-
Vascular endothelial growth factor A (VEGFA; P15692)Angiogenesis; Apoptotic process; Cell adhesion; Cell differentiation; Cell motility; Cell proliferation; Cellular metabolic process; Cellular response to stress; Chemotaxis; MAPK cascade; Proteolysis; Response to hypoxia--- *---- *-- *
Vascular endothelial growth factor receptor 2 (VEGFR-2; P35968)Angiogenesis; Apoptotic process; Cell adhesion; Cell differentiation; Cell motility; Cell proliferation; Cellular metabolic process; Cellular response to stress; Chemotaxis; Extracellular matrix organization; MAPK cascadeNDNDND
Vascular endothelial growth factor receptor 3 (VEGFR-3; P35916)Angiogenesis; Apoptotic process; Cell motility; Cell proliferation; Cellular metabolic process; Cellular response to stress; MAPK cascadeNDNDND
VEGF coregulated chemokine 1 (CXL17; Q6UXB2)Angiogenesis; Cell differentiation; Chemotaxis+NANA
Vimentin (VIM; P08670)Cell differentiation-- *-- *+ *
WAP four-disulfide core domain protein 2 (WFDC2; Q14508)Proteolysis++-
Wnt inhibitory factor 1 (WIF-1; Q9Y5W5)Cell differentiation-- *NANA
WNT1-inducible-signaling pathway protein 1 (WISP-1; O95388)Cell adhesionNA+NA
Xaa-Pro aminopeptidase 2 (XPNPEP2; O43895) +--
information gathered from reference [29]; ND: protein not detected in any of the median samples; NA: protein not detected in any of median samples for one or more cell lines; Difference in normalized protein expression between −12–−8 (----), −8–−4 (---), −4–−1 (--), −1–0 (-), 0–1 (+), 1–4 (++), 4–8 (+++), negative difference means the first cell line has lower expression than the second (1st vs. 2nd) and vice versa; * statistically different protein expression (p < 0.05).
Table 4. Summary of previously published IC50 values of doxorubicin in different liver cancer cell lines. Values are shown as IC50 (µM).
Cell LinesExperimental Conditions
Incubation24 h24 h36 h48 h72 h48 h
Reference[33][67][35][34][68][69]
Cell lineIC50 (µM ± St. dev)
HepaRG1.73 ± 0.38 ----
HepG22.33 ± 0.05-3.85 ± 0.591.91 (1.52–2.4)0.029 ± 0.0020.288 (0.25–0.32)
HepG2.2.153.15 ± 0.92----
HLE----0.67 ± 0.06
HLF----0.76 ± 0.04
HT-17----6.0 ± 1.9
Huh-72.55 ± 0.10-0.47 ± 0.93.38 (2.57–4.46)0.37 ± 0.010.36 (0.29–0.42)
Li-7----0.46 ± 0.01
PLC/DOR-48.63 ± 17.04---
PLC/PRF/5-0.93 ± 0.29---
PLC/PRF/6----1.2 ± 0.04
sk-Hep1----0.031 ± 0.002
SNU449---24.86 (17.97–34.40)-1.30 (0.84–0.90)

