
OctCarb—A GNU Octave Script for the Analysis and Evaluation of Wide-Angle Scattering Data of Non-Graphitic Carbons


Institute of Physical Chemistry, Justus-Liebig-University Giessen, Heinrich-Buff-Ring 17, 35392 Giessen, Germany
*
Authors to whom correspondence should be addressed.
C 2022, 8(4), 78; https://doi.org/10.3390/c8040078
Submission received: 3 November 2022
/
Revised: 25 November 2022
/
Accepted: 29 November 2022
/
Published: 9 December 2022
(This article belongs to the Special Issue Characterization of Disorder in Carbons (2nd Edition))
Abstract
:We present a free software script operating in GNU Octave for the refinement of wide-angle X-ray and neutron scattering (WAXS/WANS) data of non-graphitic carbons (NGCs). The refinement script (OctCarb) is based on the evaluation approach of Ruland and Smarsly (2002). As result, up to 14 physically meaningful parameters such as the layer extension La, the stack height Lc, as well as the degree of disorder of the graphenes and their stacking are obtained through a well-established fitting routine. In addition, background scattering based on specific physical phenomena and different correction parameters such as polarization and absorption can be considered. Since the complex mathematical calculations are implemented and performed in the background, with only a few settings to be made, the software was designed to be usable by inexperienced users. As another key feature, Octave and thus OctCarb run on all common operating systems (Windows, MacOS and Linux), and can even be used on high-performance computing clusters (HPCs) to perform multiple calculations at once. In addition to this, the whole refinement can be performed within minutes, and it is possible to tweak and optimize it for special purposes and measuring geometries. These features make OctCarb useful for all scientists dealing with the characterization of NGCs by X-ray or neutron scattering techniques.

1. Introduction
Non-graphitic carbons (NGCs) are an important class of sp2-based carbon materials, comprising a wide variety of ton-scale natural and synthetic carbons such as charcoal, activated carbon, glassy carbon, and soot, as well as research-oriented materials such as carbide-derived carbons (CDC). They also represent a promising and sustainable class of materials that are studied and applied in current research, industrial development, and commercial applications. The bulk material can be used for different electrical and low-friction applications [1,2,3], whereas the porous derivates and CDCs are used in gas storage/separation [4,5,6,7,8], as electrodes in sulfur–lithium-batteries [7,9,10] and super-capacitors [11,12,13], and as catalyst support [14,15]. Carbons made of phenol–formaldehyde resins (PF-R), the so-called glassy carbons, serve as containers in high-temperature applications [16] as they maintain a pronounced chemical resistance [17].
Per IUPAC definition [18], NGCs “are all varieties of solids consisting mainly of the element carbon with two-dimensional long-range order of the carbon atoms in planar hexagonal networks, but without any measurable crystallographic order in the third direction (c-direction) apart from more or less parallel stacking.” Thus, NGCs are defined by characteristic features in wide-angle X-ray and neutron scattering. The general basic structure as well as typical wide-angle X-ray scattering (WAXS) data are shown in Figure 1 and Figure 2, respectively.
Physical properties such as thermal and chemical resistance and electrical features are directly related to the microstructure of NGCs [2], the characterization of which is challenging. Electron microscopy (TEM, HRTEM) only reveals a small section of the sample. Hence, Raman spectroscopy and wide-angle X-ray/neutron scattering (WAXS/WANS) are commonly used to obtain quantitative structural parameters of NGCs. While Raman spectroscopy is mainly used to determine the average extension La of the graphene layers, WAXS/WANS allows for precisely determining a significant number of different structural parameters describing the NGC microstructure [19,20,21,22,23,24,25,26,27,28]. Recently, we discussed and compared the determination of La by these two methods, applied on a systematic series of carbons, and a procedure was presented for thorough characterization of NGCs based on Raman spectroscopy only [29,30].
However, in spite of the potential of refining WAXS/WANS data to determine the turbostratic microstructure of different carbon materials, the currently available software for the analysis of such data suffers from certain limitations. The most common approaches and their respective features (advantages and disadvantages) are summarized in the following.
CarbonXS introduced by Shi et al. featuring a corresponding graphical user interface (GUI) [31,32,33] is one of the most commonly used software tools. To the best of our knowledge, this program only allows to refine X-ray, but not neutron scattering data. In addition, CarbonXS uses a straightforward polynomial to account for the incoherent background, which however has no specific underlying physical model. Nevertheless, this approach is certainly useful and applicable to many different samples. The work of Fujimoto et al. [34,35,36] based on the approach of Warren and Bodenstein [37] is also only available for WAXS and not for WANS, and the software is currently not available in English [38]. The method of Saenko [39] uses the crystallite size as the only effect causing signal broadening, thus supposing that the material does not possess any disorder, which is not meaningful for NGC samples. The approach developed by Dopita et al. [40,41] uses MathWorks Matlab [42] as the programming language, which is a commercial software tool. In this approach, the graphite crystal structure is used as a model to refine the WAXS data, which is only meaningful for highly ordered carbon materials, but not for NGCs, because the turbostratic structure does not exhibit 3D periodicity. Ungár et al. also assume a 3-dimensional ordered hexagonal structure [43], which is only applicable to graphite-like materials, i.e., for high temperature-treated pitches but not for carbons with disorder in the graphene-based stacks. In 2002, Ruland and Smarsly introduced an evaluation method [44] based on the turbostratic structure of the NGCs and particularly takes into account the disorder of the layers and stacks to refine the WAXS data [44]. This model is used in CarbX [25], another software using a GUI, developed by our group, which currently does not allow for refining neutron scattering data either. Furthermore, it is only available for Microsoft Windows but not for other operation systems and needs Wolfram Mathematica [45] as backend for certain advanced mathematical calculations. Hence, by this option CarbX, it is not free of charge and also not entirely open-source. Furthermore, it so far suffers from a quite long calculation time up to multiple hours, especially for a larger number of measurement points. Hence, the approach by Ruland and Smarsly represents on one hand a reasonable structural make-up of NGCs but is on the other hand handicapped by the mathematical complexity of the underlying theoretical scattering functions.
Therefore, this study presents a first version of a script (OctCarb) for refining WAXS and WANS data on the basis of the approach introduced by Ruland and Smarsly [44], using GNU Octave [46] as free open-source software, which is under the GNU General Public License [47]. Although Octave does not feature an extended graphical user interface (GUI), there are important benefits by using Octave: Octave is completely free and open-source and available for different operating systems and it does not need any further software. It is also possible to compile Octave for MacOS and nearly all Linux distributions, and therefore Octave can also be used with most high-performance computing clusters. In addition to the automatic and GUI-based refinement, OctCarb can be modified and customized easily for special purposes. This makes the presented approach not only usable for users aiming at a straightforward refinement of WAXS/WANS data of NGCs in an automated fashion, but also for advanced scientists and users, who would like to customize and optimize the whole refinement process for their individual needs.
In the following sections, the model of Ruland and Smarsly [44] is briefly summarized, and subsequently the implementation of OctCarb in Octave and its installation and operation will be explained in detail. The provided refinement method and structural parameters derived thereof are compared with published evaluations of WAXS/WANS data of previous studies. Additionally, a detailed description of the options for automatic and manual refinement and their advantages as well as the possibility to refine WANS data are provided. In particular, we describe criteria for a satisfactory analysis and provide video tutorials on how to refine WAXS/WANS data using GNU Octave.
2. Materials and Methods
In this section, first a brief description of the evaluation approach is given (2.1). In the second part, the microstructure parameters are explained (2.2), and in 2.3, an overview of the improvements using Octave/OctCarb is provided. In Section 2.4, technical details and the installation progress are explained.
2.1. WAXS/WANS of Non-Graphitic Carbons (NGCs)
The microstructure, i.e., the basic structure unit, of NGCs generally consists of two-dimensional sp2-layers, e.g., graphene layers, that are stacked on top of each other (Figure 1). Since the stacks suffer from transitional and rotational disorder [48], NGCs do not exhibit three-dimensional crystallographic long-range order [44], which is equivalent to the IUPAC definition of NGCs [18]. In addition, the layer dimension and the C-C bond length, e.g., the sp2-structure itself, exhibit non-uniformity (disorder) to be considered when analyzing the microstructure of NGCs. The resulting broad asymmetric (hk) reflections in the WAXS/WANS powder pattern, which are caused by the turbostratic structure [48,49], as well as the strong overlap of the signals, make the use of the full-width-at-half-maximum (FWHM) and in particular a Scherrer-type analysis [50] unsuitable to evaluate WAXS/WANS data [51]. Therefore, several approaches for fitting single (hk) [52,53,54,55] and (00l) [56] reflections were already developed more than 50 years ago. Yet, because of the pronounced overlapping, analyzing single (hk) or (00l) reflections [48,49] possesses inherent shortcomings. Shi et al. developed a software tool to refine the microstructure data of NGCs based on fitting the entire range of a WAXS curve [31]. In 2002, Ruland and Smarsly refined the profile functions for the (00l) and (hk) reflections and proposed a further developed approach to treat the complete WAXS curve of NGC powder materials [44]. This theoretical approach represents the basis for the CarbX software tool, which can be used to refine experimental WAXS data of powder materials and derive physically meaningful parameters [25]. It should be noted that the indexing shown with parentheses strictly denotes lattice planes, and reflections would have to be indexed without parentheses. However, brackets are used in this publication for both meanings, to improve readability.
Here, only a short summary of the used WAXS/WANS model [44] is given. A more detailed description can be found in previous studies [22,25]. In this approach, the normalized WAXS or WANS intensity in electron units per carbon atom (Ie.u.) is modified by a normalization constant (k), the polarization (P) and an absorption factor (A):
Iobs = k · A · P · Ie.u.
Note that the Lorentz factor is already considered in Ie.u. [44]. In addition, the reflections are usually so broad that the influence of device broadening is negligible. A more detailed description of all these correction parameters is given in the SI File (part B) in S16. Iobs is the observed (or theoretically calculated) wide-angle scattering, and Ie.u. contains the coherent scattering Icoh originating from the NGC, and the incoherent scattering (Iincoh), which is assumed as modified Compton scattering of carbon (Icom, c):
Ie.u. = Icoh + Iincoh
The incoherent scattering (Iincoh) as well as the influence of foreign atoms (H, N, O, S) will be described in the SI File (part B) in section S14.
Icoh is given by the superposition of the scattering of the single graphenes (intralayer scattering Iintra; (hk) reflections) and the interferences of their stacking (interlayer scattering Iinter; (00l) reflections), modulated by the atomic form factor of carbon (fc):
Icoh, c = fc2 · (Iinter + Iintra)
It should be noted that this equation applies to both X-ray and neutron radiation, with only one important difference: while fc features a specific course for X-ray radiation and needs to be suitably interpolated, it is a constant for neutron radiation. Hence, a fixed value of 1 can be assumed for fc in case of WANS, since it is adjusted by the normalization constant k anyway. Icoh can also be expanded to include the concentration of foreign atoms such as hydrogen (cH), nitrogen (cN), oxygen (cO), sulfur (cS) and non-organized carbon (cun), following the works of Franklin [57,58]. In addition, an anisotropy factor (Δan) for the different atomic form factors parallel (fc, perp) and perpendicular (fc, perp) to the layers can be considered [25,44]. For the proportion of scattering that results from “non-organized” carbon [44], the following equation applies:
Ie.u., c (WAXS) = (Icoh, c + Iincoh, c) = (1 − cun) · (f2c, perp · Iinter + f2c, para · Iintra) + cun · f2c, para + Icom, c · recoil · Qabs · Q
Ie.u., c (WANS) = (Icoh, c + Iincoh, c) = (1 − cun) · (f2c · Iinter + f2c · Iintra) + cun · f2c + Iincoh, c
= a · (Iinter + Iintra) + b(s)
= a · (Iinter + Iintra) + b(s)
Note that (4) holds for WAXS, while (5) is valid for WANS. In (4), fc, para is used because the difference between fc, para and fc, perp is very small, and therefore, it is more practical to use this atomic form factor instead introducing a third (mixed) atomic form factor, which would also have no significant effect on the result. a in (5) is a normalization factor constant, which is included in the scaling factor k in equation (6), and b is a non-constant background. Hence, for WANS equation (5) is applied, separating the coherent and incoherent background b(s) differently compared with WAXS (see S19 in the SI File (part B)).
Regarding experimental effects additional multiplicative factors considering a fixed irradiated length or a fixed divergence slit (AutoColl), an exponential damping factor (gFact) for taking the possibility of a small-angle scattering contribution at low s values, and two constants (const1, const2) for considering a non-linear background, can be used to adapt the calculated WAXS/WANS pattern (Iobs) to a particular instrumental setup:
Iobs = 10^[log10((1/AutoColl) · gFact · k · A · P · (Ie.u.)) + const1) + const2]
This logarithmic representation was used as we found that the fitting refinement worked more reliably. The subsequent exponentiation was used to obtain the correct (measured) intensities. In principle, this equation contains all factors entering the theoretical WAXS/WANS, especially the impact of the device and background scattering. Further information about these parameters, their calculation and their background can be found in the SI File (part B) in S16 and in the SI of previous works [25,44].
2.2. Refined Microstructural Parameters
The physically meaningful microstructure parameters can be distinguished into three sets: layer structure, stacking structure and impurities. A more detailed overview of all parameters including the microstructure parameters as well as the parameters used by OctCarb is given in the SI File (part A) in S1.
2.2.1. Layer Structure
In our approach, the most important parameters for describing the layer structure, i.e., also the intralayer scattering, are the average layer extension (La), its polydispersity (κa), the average C-C bond length (lcc) and disorder in the layers (i.e., stress and strain) (σ1), see (Ruland & Smarsly, 2002), Table 1.
2.2.2. Interlayer Stacking Structure
Analogous to the intralayer parameters, an average stacking height (Lc), its polydispersity (κc), an average layer distance () and the standard deviation (σ3) can be defined for describing the interlayer stacking. In addition, the minimal layer distance (a3 min = − da3), the average number of graphene layers per stack (N = Lc/) and the homogeneity of the stacks (η) are physically meaningful parameters [44]. Additionally, the thermal motion (u3), i.e., in principle the Debye–Waller factor, and the anisotropy of the atomic form factor of carbon (Δan) can be refined but have in most cases only a small influence on the analysis. The preferred orientation parameter (q) might also be refined, it also depends on the experimental setup, Table 2.
2.2.3. Impurities
In addition to the microstructural parameters related to Icoh, the concentration of disordered sp3 carbon (cun) and the concentration of disordered hydrogen (cH), nitrogen (cN), oxygen (cO) and sulfur (cS) can also be considered, which might be needed to evaluate WAXS data in terms of the background scattering. However, especially for hydrogen in a WANS experiment, this approach is insufficient. For cH > 0.5% a Voigt-function showed satisfactory results to determine the background of WANS data as shown in the SI File (part B) in S19, Table 3.
2.3. Improvements and Implementation in OctCarb
The Ruland and Smarsly approach [44] as used by Pfaff et al. [25] can be implemented in different programming languages. At the current state, it is implemented in the tool CarbX, based on C++ and Wolfram Mathematica [25]. Here, in OctCarb we modified the refinement routine used in CarbX for several reasons. First, in CarbX external files were needed for the computation of the atomic form factors and incoherent scattering. In detail, published values for the atomic form factors and the incoherent scattering (WAXS) were tabulated in a text file, which was read during the refinement, and the in-between values needed to be interpolated. As a shortcoming, the necessary interpolation was time-inefficient, and the values could not be calculated outside the range of the tabulated values. For this reason, here the atomic form factors for nitrogen (fN) and oxygen (fO) as well as the Compton scattering of carbon (Icom, C) were fitted by suitable spline functions and could then be calculated with an analytical function. Moreover, for carbon (including the form factor anisotropy Δan (fc, para)), the approximation function for calculating the atomic form factor (fc) was improved, being closer to the theoretical values given in [59]. A more detailed description of these parameters can be found in the SI File (part B) S14. Additionally, in CarbX the atomic form factor of carbon is not correct for high s values (s > 3 Å−1). For Cu-Kα radiation, this shortcoming is irrelevant, since the maximum value is smax ≈ 1.2 Å−1. However, for small wavelengths (λ < 0.5 Å), another interpolation function has to be used [59] to calculate the correct atomic form factor for higher values of s to make it suitable also for synchrotron experiments with small wavelengths.
Second, in OctCarb two additional parameters were added for the ability to consider the concentrations of non-organized hydrogen (cH) and sulfur (cS) atoms, in addition to nitrogen and oxygen. Similarly, it was assumed that hydrogen and sulfur are spatially statistically distributed and contribute only by diffuse scattering. Third, separately calculating the coherent or the incoherent scattering is another improvement, which might be a useful feature to judge the order of the graphenes themselves and the impact of background. Another difference in the code used in this study compared with Pfaff et al. [25] is the implementation of ν, which together with α serves for modeling the intralayer scattering Iintra. Since this is a very special feature, it is described in the SI File (part B) in S15.
Advancements in computing:
- OctCarb is an entirely free software tool, also with respect to automatic data fitting;
- The data analysis can be performed on average personal computers, i.e., the analysis of one WAXS/WANS curve can be performed within a satisfactory time, i.e., within minutes;
- The tool is resource-efficient in terms of CPU usage, which means that other programs can be run simultaneously;
- Octave and therefore OctCarb is available for Windows, MacOS and Linux;
- Octave provides an option for batch compilation (important for parallel data fitting);
- The program is—in practical details—more convenient than CarbX, e.g., the fitting results (parameters) are now automatically stored;
- No other third-party software tool is needed.
Advancements in the structural characterization based on WAXS/WANS:
- Wide-angle neutron scattering data can be analyzed;
- A rigorous background treatment (and fitting) for WAXS and WANS, based on the corresponding theoretical contributions (Compton scattering, non-organized carbon, etc.), is included;
- The treatment of impurity atoms (sulfur, nitrogen, etc.) in terms of a contribution to the background scattering was improved;
- The incorporation/treatment of the atomic form factors was optimized;
- The statistical, experimental errors are treated in terms of the well-established theory of error propagation, and calculated based on the covariance matrix, i.e., the standard deviations of the refined parameters are calculated;
- In some cases, the data at the left and right end of the accessible data range are not useable, e.g., because of strong small-angle scattering contributions. The tool contains a comfortable option to skip such data.
2.4. Technical Details and Installation
GNU Octave is a free and open-source software that was “originally intended to be companion software for an undergraduate-level textbook on chemical reactor design written by James B. Rawlings of the University of Wisconsin-Madison and John G. Ekerdt of the University of Texas” [60]. Meanwhile, Octave is a high-end software for solving mathematical problems in an analytical and/or numerical way. A script language is used to define and perform the needed calculations. The scripts are comparable and compatible with the commercial software MatLab from MathWorks [42]. While Octave is pre-compiled for Microsoft Windows, it can be also installed or compiled for MacOS, nearly all Linux distributions such as Debian, Ubuntu, or CentOS, and distribution-independent software such as Docker or Flatpak; in principle, Octave can also be compiled for Android or BSD systems. Overall, Octave can be used for nearly all operating systems and hardware. System requirements and links for downloading and instructions for compiling are in the next sections.
2.4.1. Third-Party Plugins
Even if GNU Octave has already included a lot of mathematical functions and operations, it can be extended by several plugins. For the present purposes of refining a theoretical function to measured data points, the optim package is needed to perform all mathematical operations. Generally, if the Octave-GUI is used, all other dependencies, which in turn are required for the use of optim, are automatically installed. If the Octave-CLI (command line interface) is used, all other dependencies, which in turn are required for the use of optim, might be installed manually. Hence, struct and statistics (which need io itself) must be installed before installing optim.
2.4.2. Refinement Algorithm
In the optim package, different algorithms for optimization, data fitting and data refinement are available. However, taking a look at the source code, most of these functions use the Levenberg–Marquardt algorithm developed for non-linear refinement [61,62,63]. In this work, the function nonlin_curvefit is applied for the refinement since it can be used with additional refinement parameters such as the weighting of the points or minimum and maximum values of the structure parameters. In addition, the function curvefit_stat is used to obtain additional statistical information such as the accuracy of the fit and standard deviations of the refined parameters.
2.4.3. System Requirements and Installation
Overall, there are no special system requirements for installing and using Octave. Since the calculations can take a long time, especially with large data sets, at least 4 GB RAM and a fast CPU (speed per core) are recommended, but not essential. The refinement was also tested with a Raspberry Pi running Linux Raspbian (Based on Debian Bullseye), and although it takes more time than on a “classic” tower PC, it does work. However, Octave only uses one CPU core by default, so that the computing speed per core is crucial for the total computing time. In the end, calculations can also be performed on high-performance computing clusters under Linux.
To use the iObs algorithm in C++ or to compile an *.oct file by your own, the “numerical recipes in C” as a third-party library is needed. Since this product is only commercially and not open-source available, the needed files cannot be shared as SI and must be purchased instead [64].
An instruction including a video explaining the installations and initial setups is available in the SI File (part A) in S8, in the GitHub (https://github.com/osswaldo/NGCs/tree/master/Instruction%20Videos (accessed on 2 November 2022)) and at YouTube (English: https://www.youtube.com/playlist?list=PLTlnYDX5g1FylWfH8cSM_ZQUQpn3dSp6M (accessed on 2 November 2022)), (German: https://www.youtube.com/playlist?list=PLTlnYDX5g1FwaOQkLXTxrpvHW9CRUwBrk (accessed on 2 November 2022)).
3. Results
3.1. Usage of OctCarb
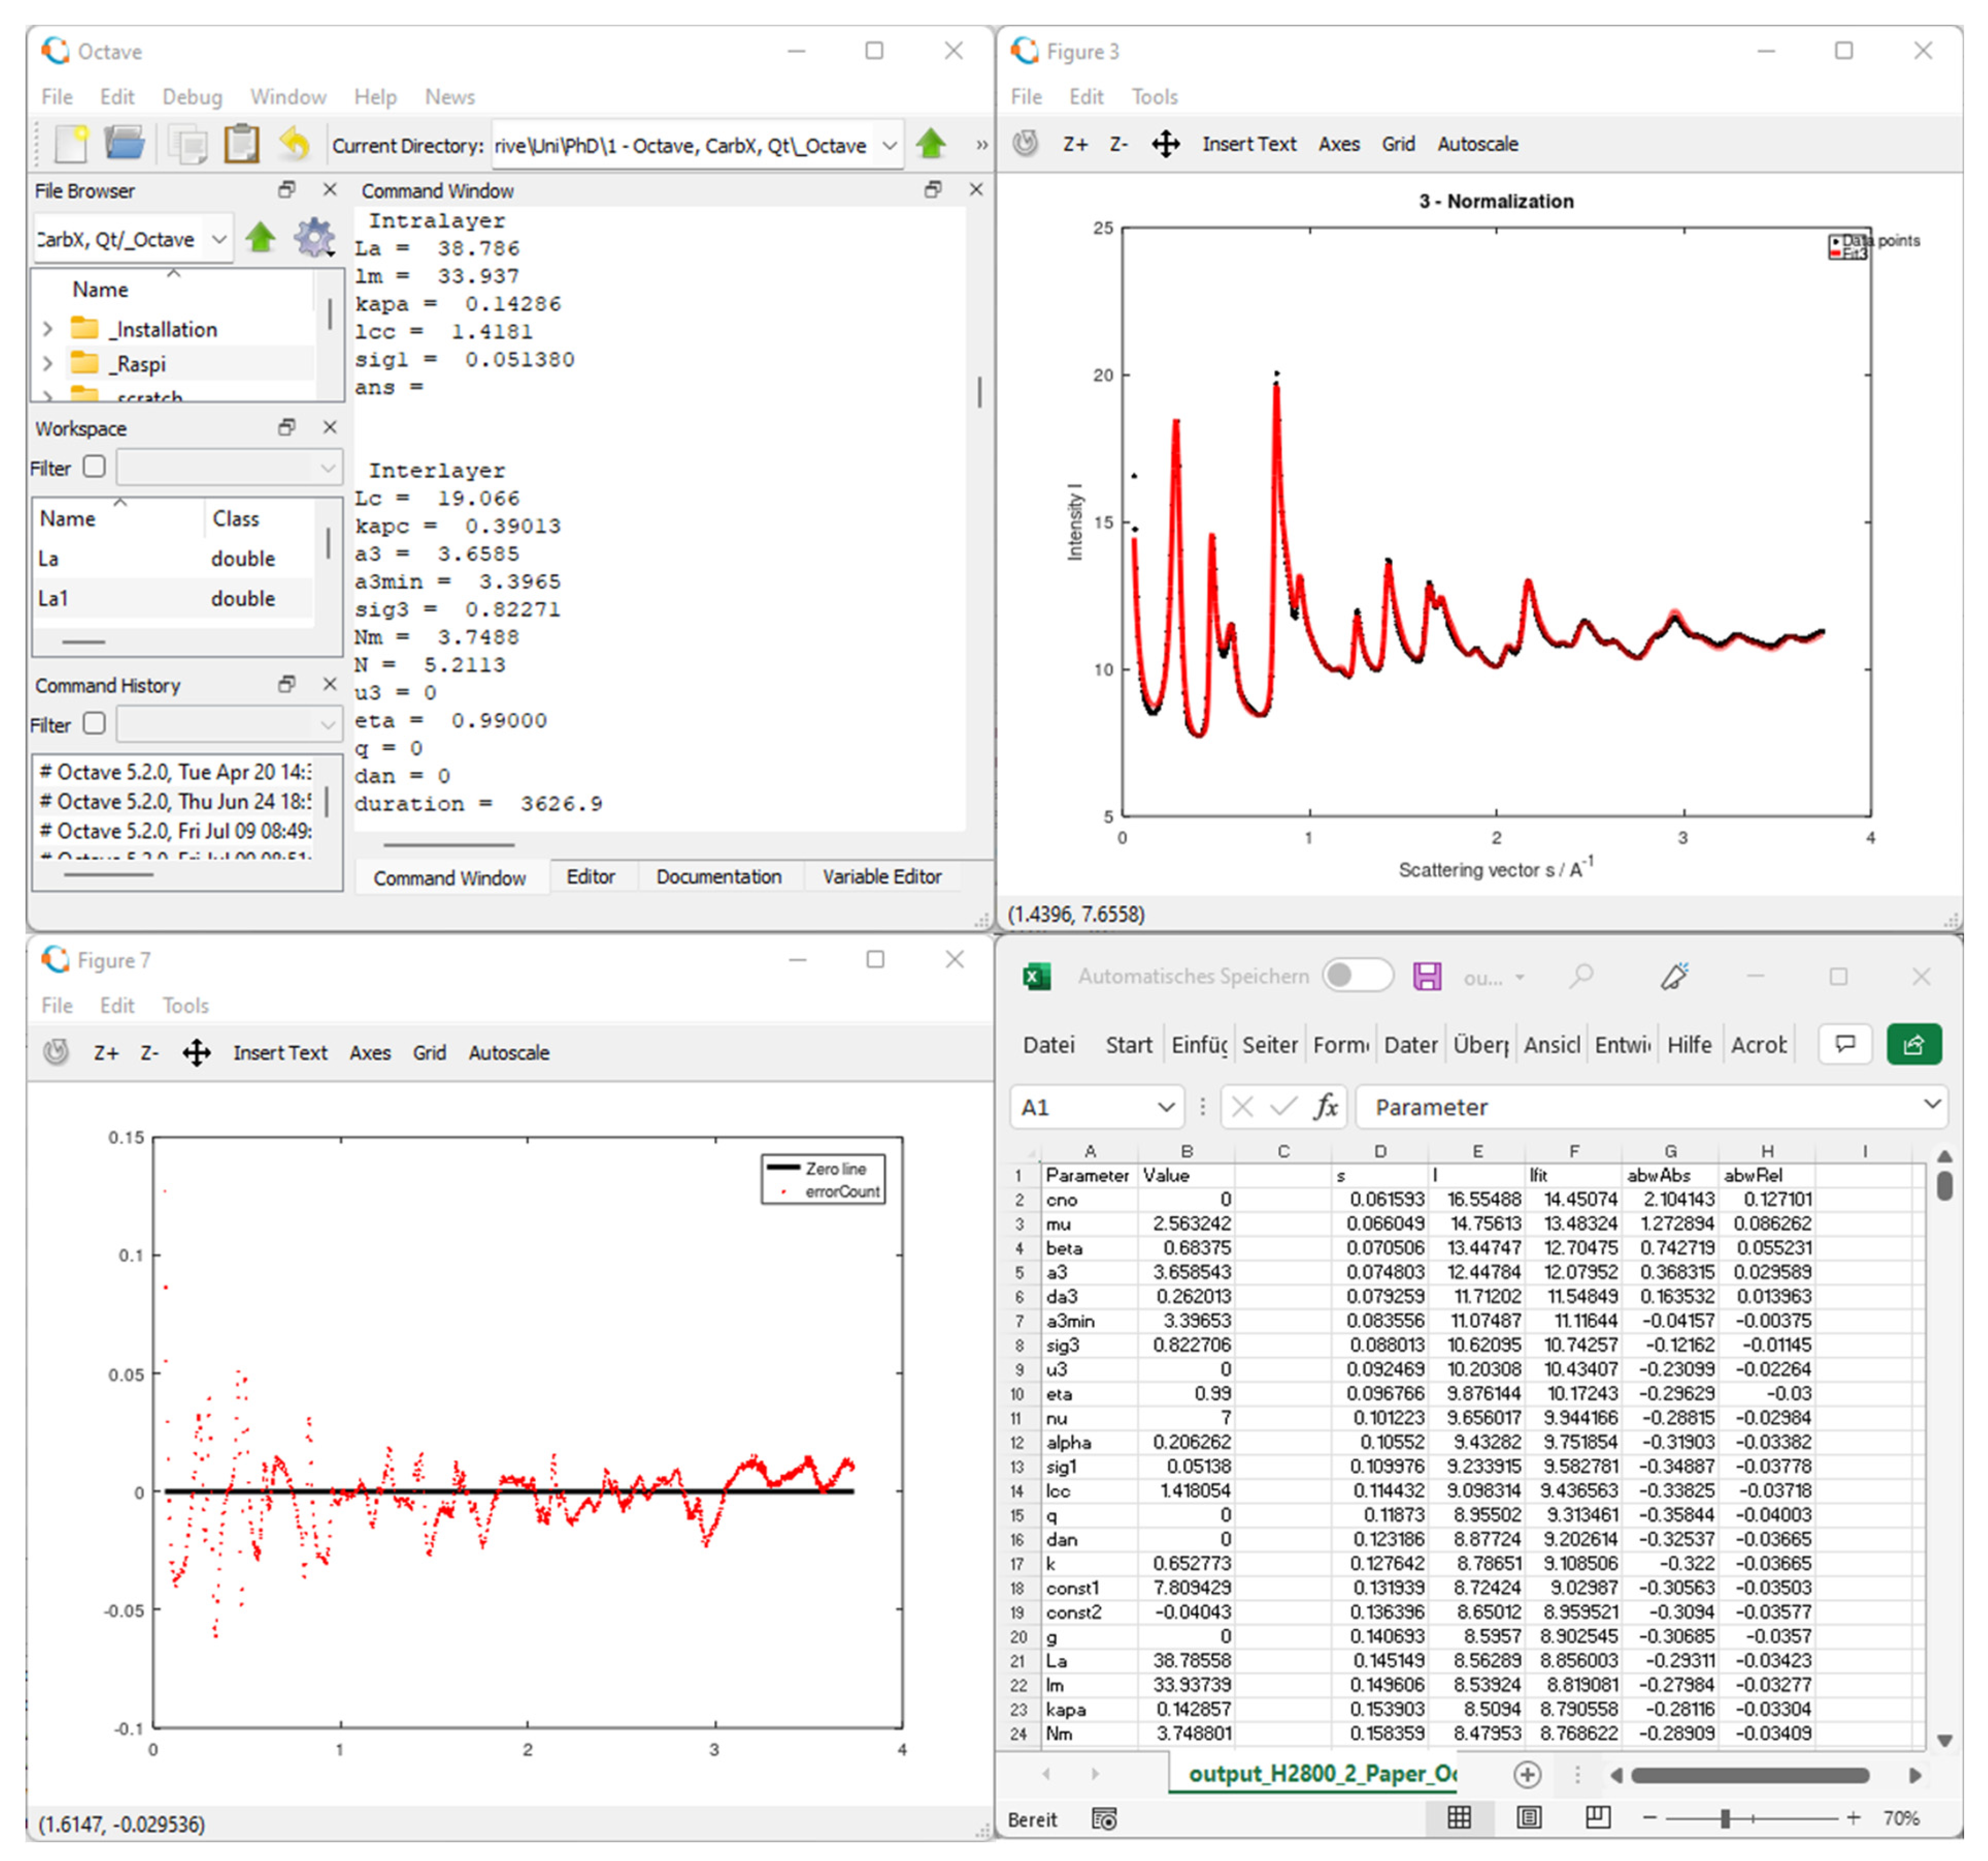
To use OctCarb for the refinement of the WAXS/WANS data of non-graphitic carbons, first Octave and the optim package must be installed. During the installation of Octave, the chosen installation path should not contain empty spaces (“ “), otherwise, problems during the installation of the optim package might occur. For example, a safe path would be “C:/Octave/Octave-6.3.0”. Next, the iObs.oct file must be downloaded (or self-compiled) as described in the SI File (part A) in S7 and in the GitHub (https://github.com/osswaldo/NGCs/tree/master/Octave/oct-files (accessed on 2 November 2022)). Third, the file Fit-Routine.m must be downloaded and modified for the required purpose, e.g., with respect to the sample name and measurement data path. An example for starting the algorithm and the operations can be found in the “Excerpt from GitHub” (SI). After opening Octave, the example script can be loaded either using File → Open or the shortcut in the upper toolbar. In Figure 3, the basic graphical user interface (GUI), and in Figure 4, the results of a typical refinement using OctCarb are shown: In addition to the microstructure parameters in text form, Octave/OctCarb plots the experimental data, the refined fitting curve as well as their deviation, and saves all these data in a CSV file.
If you have never worked with Octave so far, it is highly recommended to watch an instruction video. Due to the high distribution and availability of Octave, there are a lot of instruction videos available, e.g., under YouTube (https://www.youtube.com/watch?v=sHGqwF2s-tM (accessed on 2 November 2022)). For this reason, no further basic instruction into Octave is given here. More details about the installation and setup as well as the typical refinement steps including an exemplary refinement can be found in the SI File (part A) in section S9. Additionally, a detailed tutorial for the fitting of WAXS/WANS data of NGCs with pictures for every step can be found in the SI File (part A) in S9.
3.2. Verification and Application
In general, nonlinear fitting procedures, as used in our Octave-based refinement, can suffer from various complications, e.g., a reasonable fitting might be achieved by different sets of the parameter values. Hence, in OctCarb particular emphasis was put on the validity of the refinement and the structural parameters obtained thereof. First, we demonstrated the general functionality of OctCarb for refining typical WAXS data (3.2.1). In 3.2.2, the impact of data noise and the number of data points are discussed. Validation was performed by applying OctCarb on the same WAXS and WANS data as previously published, comparing the fits and the parameter values (3.2.3) [19,23,25,26]. Second, in order to perform a self-consistency test, theoretical WAXS/WANS data were computed and artificially blurred with different levels of data noise (3.2.4). These “new experimental” data were then used as input for OctCarb to verify if the fitting algorithm yields the original parameters. All fit results/microstructure parameters including the standard deviation as well as exemplary calculation times can be found in Table S2.
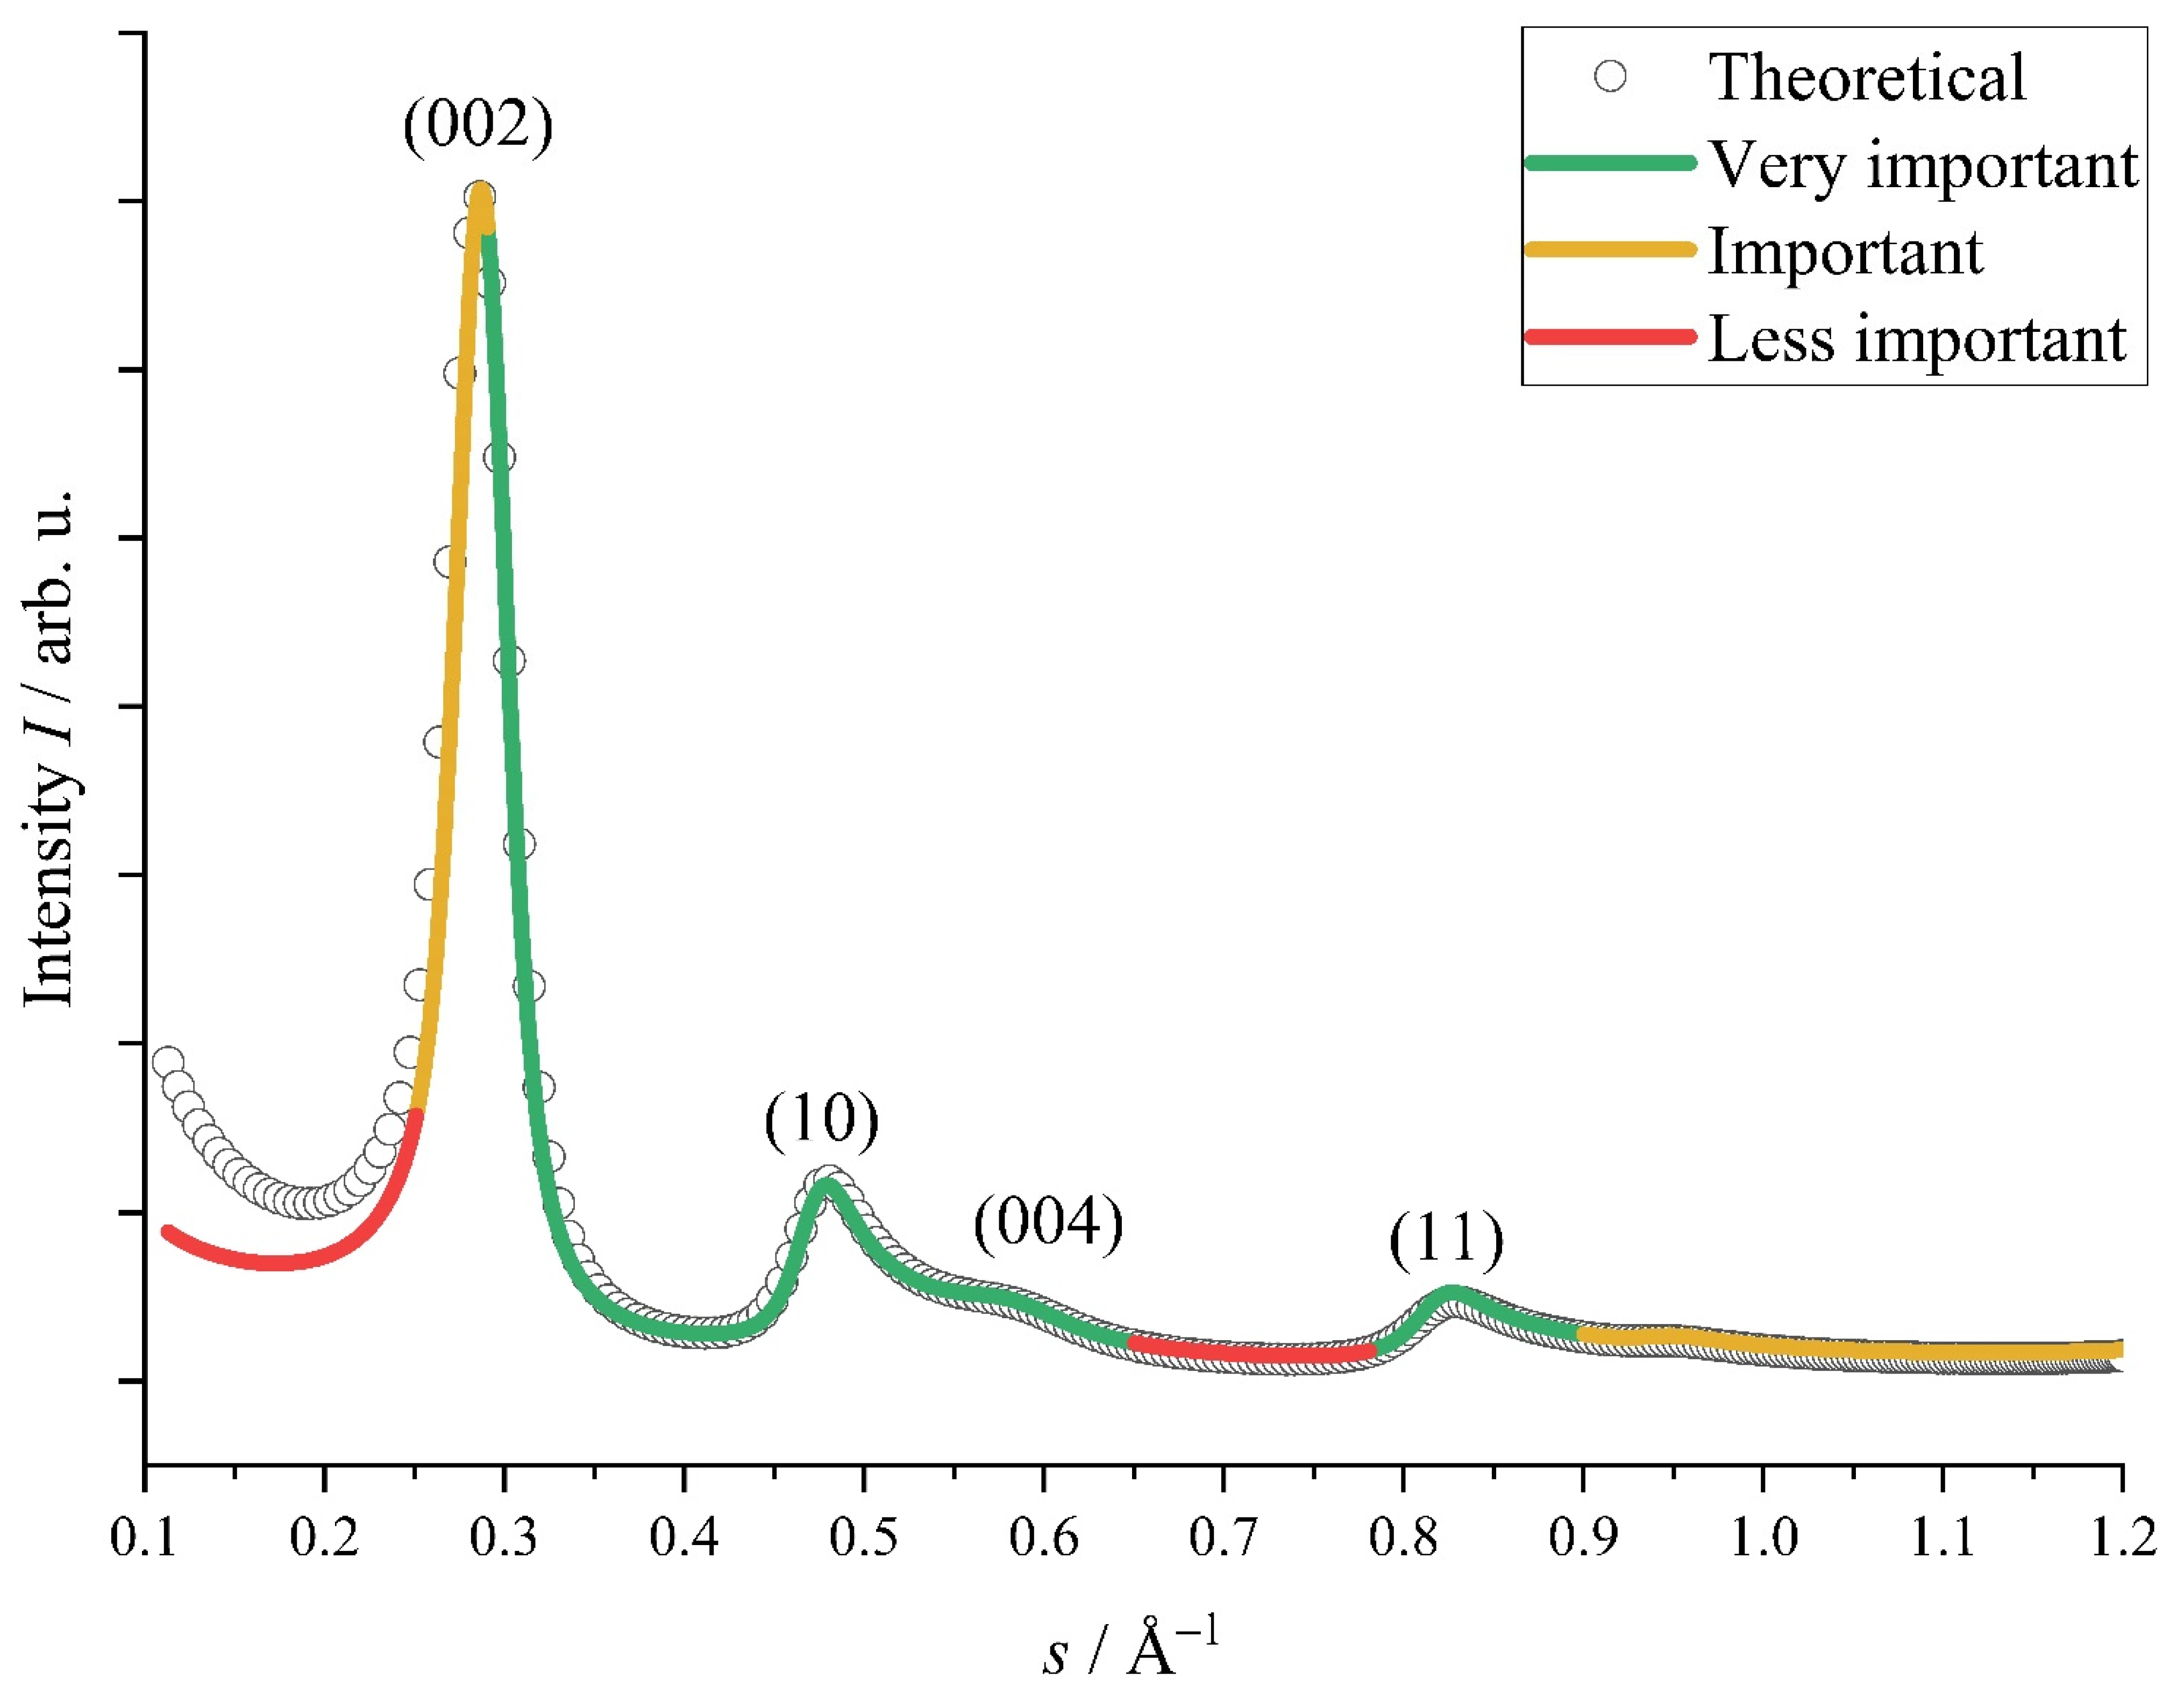
Figure 5 shows an exemplary WAXS pattern and a reasonable fitting result, proving the applicability of OctCarb to typical experimental data. However, in some cases a refinement might not fit the data over the entire range of WAXS/WANS data, in particular with respect to two issues, namely, the course of the data curve at small s and the background scattering. Yet we found that a meaningful and precise determination of the main structural parameters such as the average stack height (Lc) or the average layer extension (La) does not require a reasonable fitting of the entire data set, i.e., a deviation between the data and the fitting function in certain parts is tolerable. Figure 5 highlights the importance of the various parts along the s-axis in assessing the quality of a fitting, which is valid for most samples studied. In plain terms: even if the red regions (Figure 5) are not well fitted, still the structural parameters are reliably determined. On the other side, the green regions must be well fitted in order to obtain reliable and meaningful parameter values.
3.2.1. Software Validation on WAXS Data and General Issues
Octave and thus also OctCarb use the Levenberg–Marquardt non-linear fitting algorithm to perform the refinement (“fitting”). In CarbX, in the standard mode, a manual modeling of the WAXS data is performed, using a qualitative criterion in the form of a reasonable fit upon parameter variation, as determined by visual perception. In contrast, as a main advantage, OctCarb provides the values of the structural parameters and the calculation of their error bars based on a well-defined mathematical procedure, using the covariance matrix. A more detailed discussion of the refinement procedure, especially the determination of the error bars, is found in the SI File (part A) in Section S3.
For the verification of the refinement method using OctCarb, four WAXS data sets were used, taken from Faber et al. [22], i.e., a coal tar pitch carbonized at 800 °C (CTP-800), an activated carbon (AC Type H), a carbonized furfuryl alcohol treated at 850 °C (FA-850) and a poly(ionic liquid)-derived carbon fiber (PIL) from Einert et al. [65]. These samples were chosen since they were already used in the study of Pfaff et al. [25] for the verification of CarbX, our previously introduced software tool used for the evaluation of WAXS data of NGCs (Figure 6 and Figure S1). Indeed, OctCarb is also able to achieve a reasonable fitting, showing the applicability to typical experimental WAXS data (Figure 6 and Figure S1). The resulting parameters for the aforementioned samples, in comparison to the modelling by CarbX, are found in the SI File (part A) in Table S3.
Overall, the automized non-linear fitting algorithm of Octave/OctCarb provides reasonable fitting for all samples over the entire range of the dataset (Figure 6 and Figure S1), which corresponds to a standard XRD setup with Cu-Kα wavelength. We would like to emphasize that OctCarb performs the fitting in a fully automated fashion, with a significant number (typically 12) of structural parameters typically being fitted: the average and minimal layer distance, its standard deviation and polydispersity (a3, a3 min, σ3 & κc), the average stack height and the number of layers per stack (Lc & N), the homogeneity of the stacks (η), the average C-C bond length (lcc), the average layer extension, and the disorder and polydispersity of it (La, σ1 & κa) and a possible preferred orientation (q) are usually varied and, hence, obtained in a mathematical refinement algorithm.
The resulting parameters of fitting using OctCarb are in the same range as in the reference studies [25,26]; thus, both approaches provide reasonable results. However, for several of the parameters the deviation can be up to 20% (see La, Lc, for sample FA-850, Figure 6 and Table S3). Based on the systematic fitting in Octave, we consider the OctCarb-derived values more reliable.
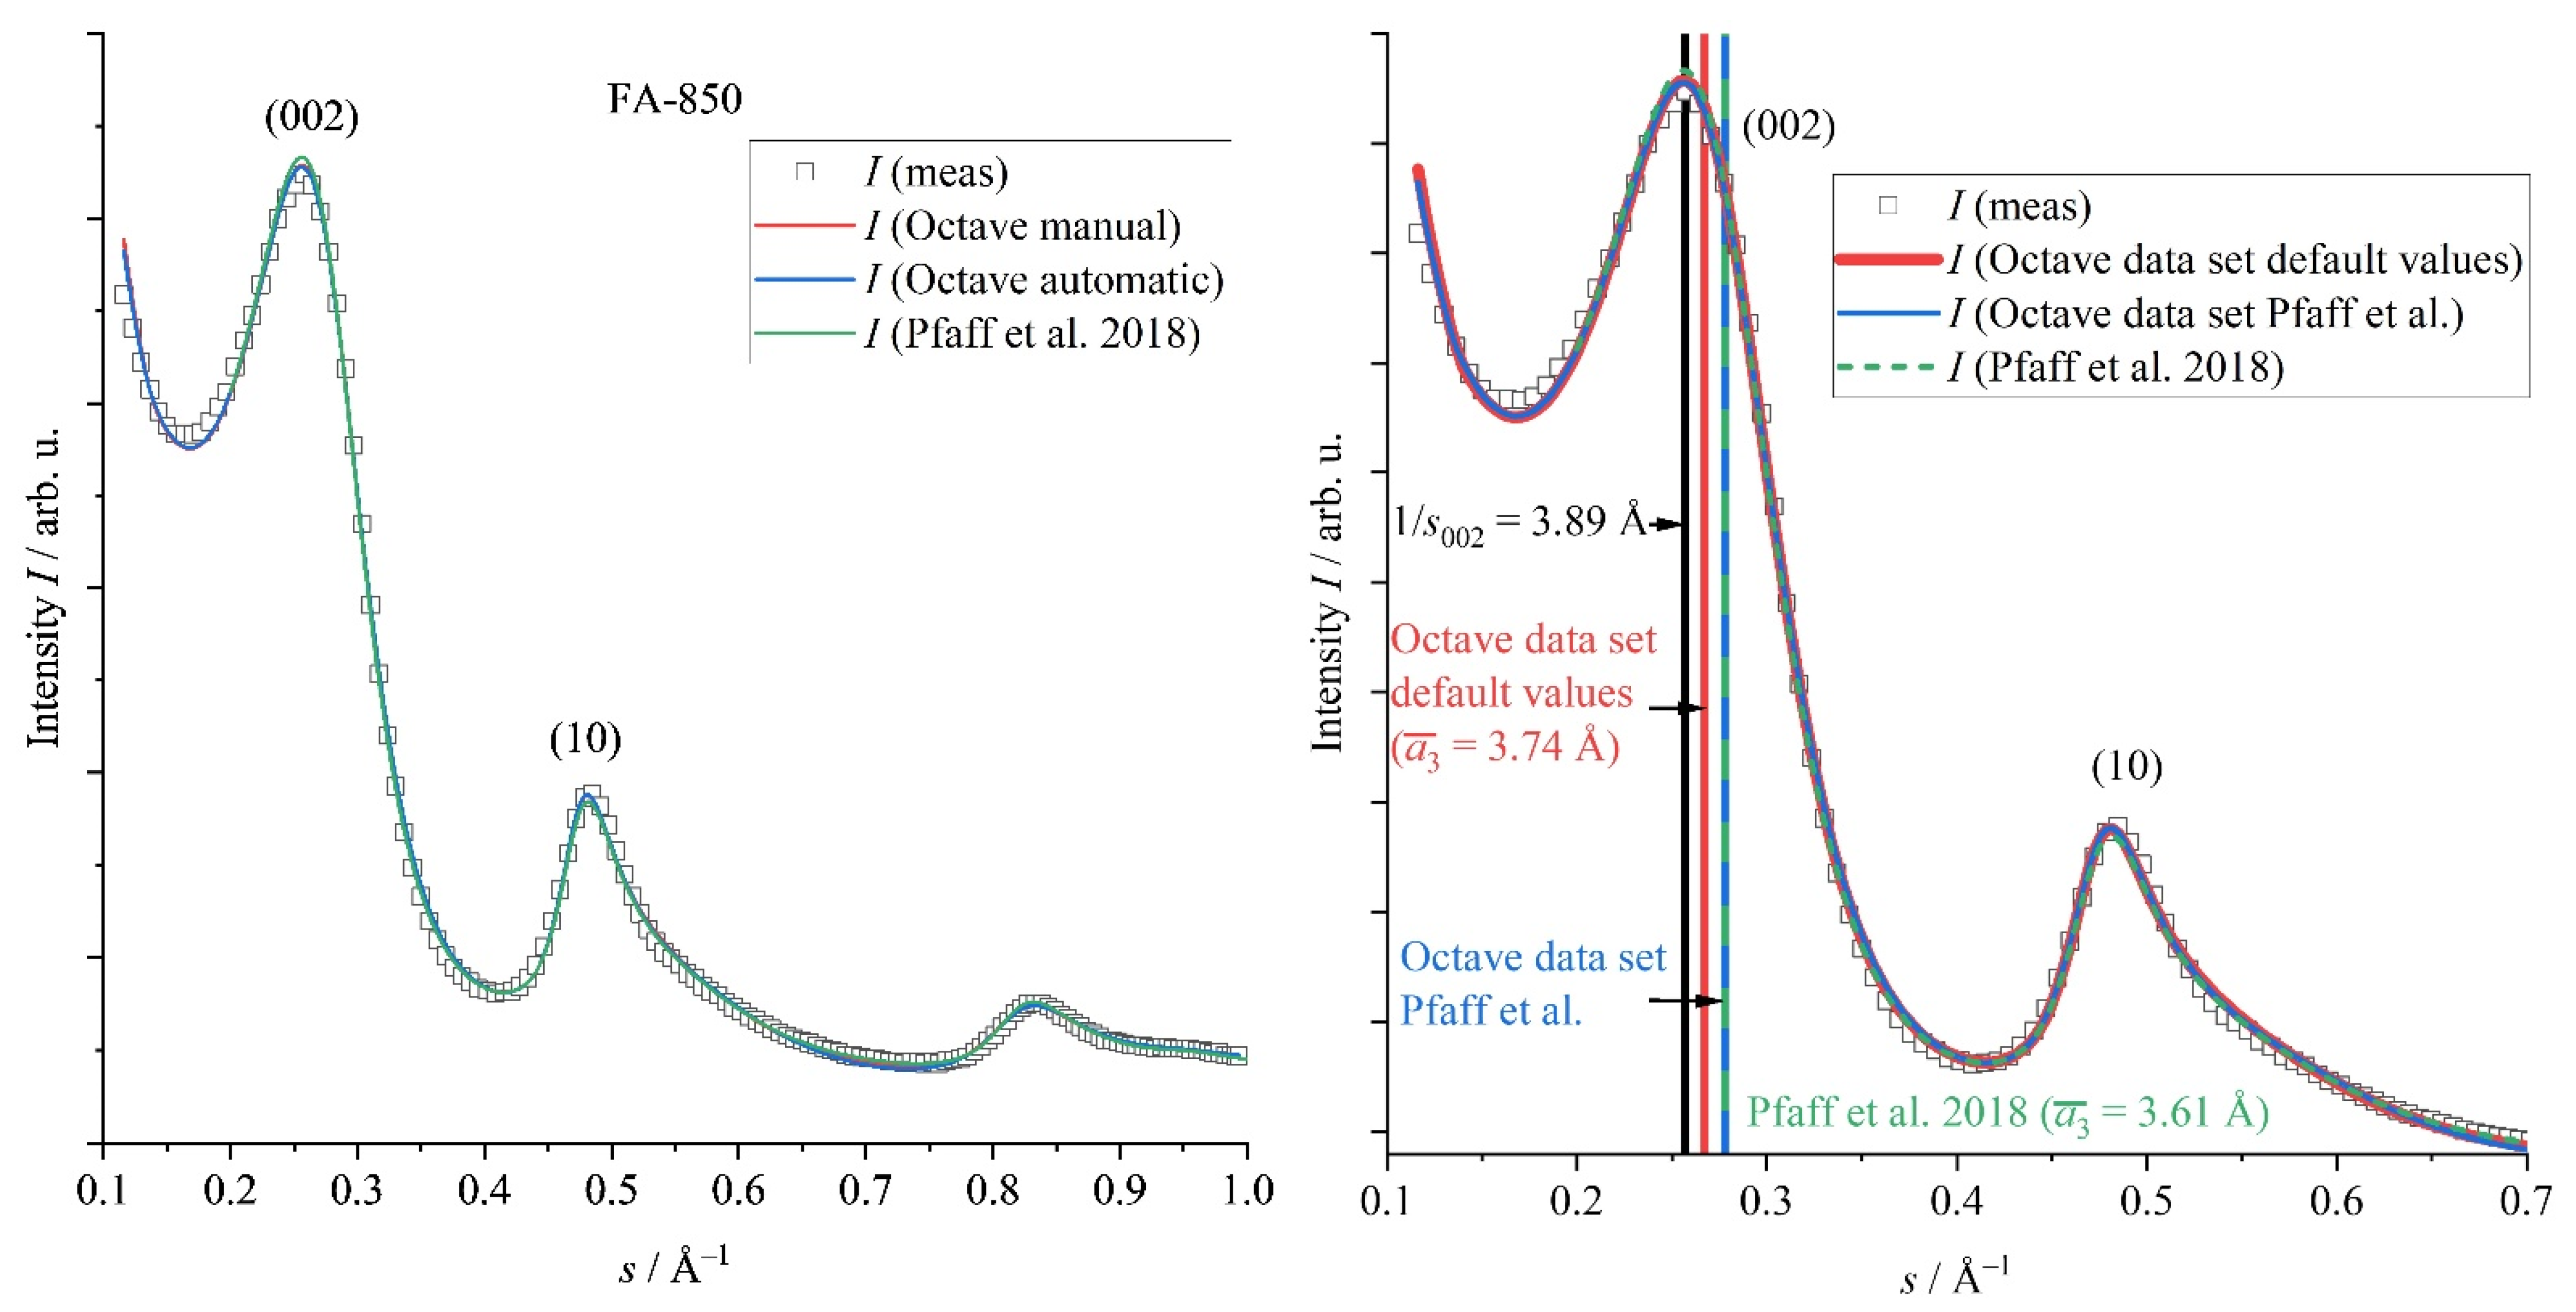
In detail, we now compare the evaluation of WAXS data by Octave and the study of Pfaff et al. [25] by the closer inspection of the sample FA-850 as an exemplary case (Figure 6). As already mentioned, there are significant differences in the resulting parameters (Table S3), which can be correlated to the quality of the fit in this case. The fitting curve of Pfaff et al. [25] is shifted slightly, but systematically to higher intensities than the data points in the region of the (002) reflection, and a little lower in the range of the (10) reflection (Figure 6), which might explain the significant differences seen in La and Lc. By contrast, fitting by OctCarb provides an almost perfect fit in these regions, demonstrating the superiority of a rigorous mathematical fitting algorithm.
Here, we would also like to take this example to illustrate that a simple analysis generates misleading values for structural parameters: calculating the average layer distance () simply by a3 = 1/s(002) yields about 3.9 Å. However, this calculation ignores the variation of a3, which is taken into consideration by Ruland and Smarsly (2002), providing ~ 3.6 Å (Pfaff et al. [25]) and ~ 3.75 Å (OctCarb), which are quite disparate from the simple calculation “ = 1/s(002)“. Even if the absolute difference in these two values is only 0.15 Å (4%), it must be considered that for structural reasons, lies normally in the range of 3.3 Å up to 4.0 Å (in some cases also lower or higher), and therefore, 0.15 Å is a significant difference. More precisely, 3.6 Å is much closer to the theoretical layer distance of perfect graphite (3.35 Å) [66,67] and could therefore lead to the false assumption that the stacks are more highly ordered as they actually are.
This example underlines the necessity for using advanced evaluation and software for WAXS/WANS data of NGCs, especially when physical properties should be related to the microstructure data (for example Li-intercalation properties/possibility in batteries). Only systematic refinement can lead to precise microstructural data and thus to meaningful interpretation in regard to physical properties.
3.2.2. Influence of the Amount/Noise of Data Points and Start Parameters on the Fitting Routine
Generally, the influence of the number of data points and the noise must be considered in a differentiated manner. Evidently, data noise should be as low as possible, especially for the parts of low scattering intensities in a WAXS/WANS curve. Further information about this feature and the general influence of the amount/noise of data points and start parameters on the fitting routine can be found in the SI File (part A) in S11.
3.2.3. Software Validation Using WANS Data
For testing the functionality of OctCarb for WANS data, we applied it to the WANS data published by Pfaff et al. [26]. Two different classes of carbons had been studied, namely carbon obtained from phenol formaldehyde resorcinol (PF-R) and heat-treated at 2100 °C and 2800 °C (H-2100/H-2800), and a low-softening point pitch heat-treated at 1200 °C (LSPP-1200). These samples were chosen to determine whether OctCarb is able to depict fine differences from high-quality WANS data in the structural parameters upon treating at temperatures close to graphitization, as well as a function of the precursor. The WANS data were acquired at the E2 flat-cone diffractometer at the BER II reactor of Helmholtz-Zentrum Berlin using a Debye–Scherrer geometry [68]. The refinement by OctCarb uses the default starting parameters from Table S7 in the SI File (part A) and the normalization based on absolute WANS intensities.
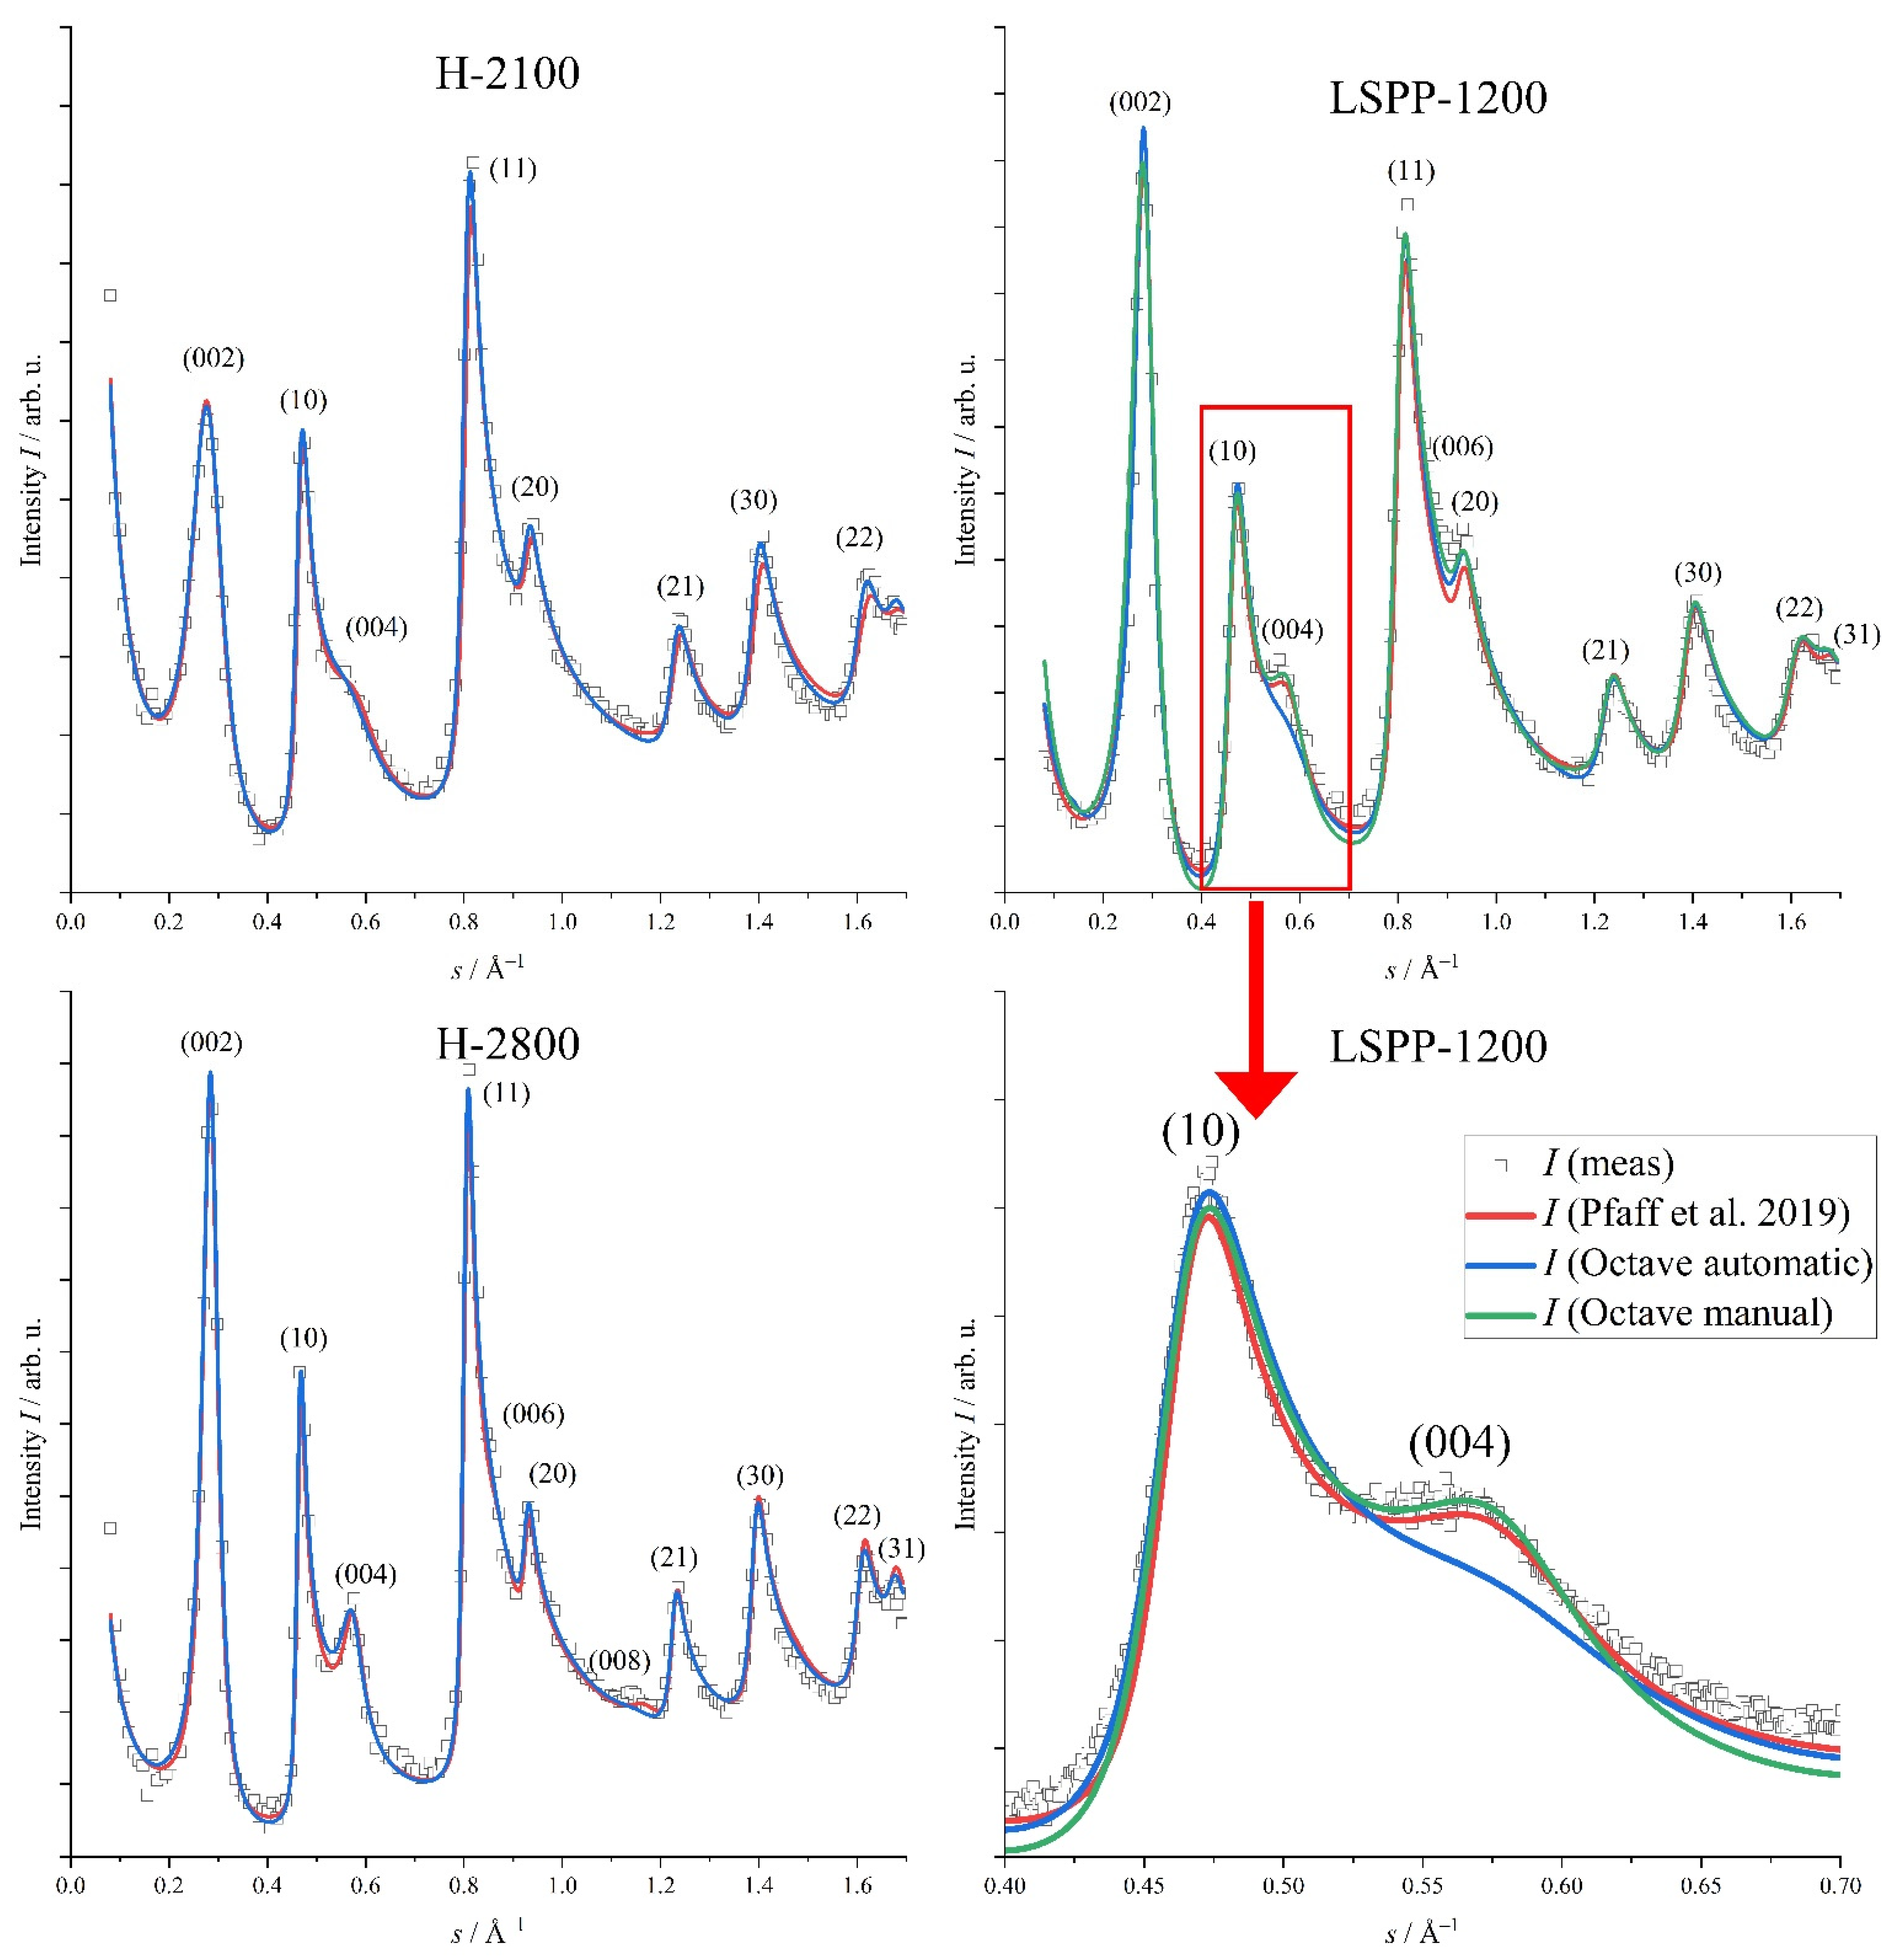
It is seen (Figure 7) that an excellent refinement is obtained by OctCarb for all of these chemically quite different samples, also taking into account that the s range is significantly larger (three times) than the WAXS data obtained with a typical lab setup (Cu-Kα). Based on this exceptional functional capability of OctCarb, in the following, we compare the refinement of these samples with the previous analysis [25] with respect to the reliability and validity in determining the relevant structural parameters (La, σ3, …).
In general, the relative error for each parameter is in the range of 10–15% for a manual refinement [25], while for the automatic refinement (OctCarb), the errors for each parameter are smaller, on the order of 5% (see Table S5). Overall, all mean parameters refined using OctCarb fit well to the values already determined by Pfaff et al. [26], except for La and σ3 for LSPP-1200, which is caused by a poor refinement of the (004)-reflection (Figure 7). Here, a manual parameter variation allowed for a better data refinement, which will be explained below. In case of H-2800, the agreement in the values is excellent, showing that the excellent fitting of WANS data spanning a large range of s yields meaningful structural information. An interesting feature is seen for sample H-2100: the OctCarb fit yields a lower value for σ1 compared with Pfaff et al. [26], and at the same time, the average layer size (La) is also lower. Since a smaller degree of disorder correlates in principle with sharper reflections and, on the other hand, a smaller layer La to a broadening of (hk) reflections, the two effects can possibly cancel out each other in the fitting.
Notably, for both H-2100 and LSPP-1200, the (004) reflection is quite broad and thus appears only as a “shoulder” of the (10) reflection, which the automatic fitting routine of OctCarb is not able to handle appropriately. This undesired fitting behavior can be understood in terms of the underlying fitting algorithm: OctCarb tries to fit the entire scattering curve, containing various single reflections. The region around the (004)-reflection is comparably small and therefore a relative unimportant part in its relevance for the fitting process. The feet/valleys right and left in the vicinity of the (10)/(004) reflections are well fitted by OctCarb using the automatic refinement, since overall, there are a lot more relevant data points available for this range than for the (004) reflection, so that Octave (i.e., the Levenberg–Marquardt algorithm) weights these feet/valleys higher than the (004) reflection itself. On the other hand, these feet/valleys cannot be well fitted by the manual refinement, if the (004) reflection is well fitted manually. Thus, in such cases, one has to compromise, which part of the WAXS/WANS curve is considered more relevant for the analysis. This example illustrates that in the end, it is up to the user to set priorities with regard to the quality of the fit and how to deal with a potential discrepancy between automatic (purely mathematical) and manual (experience-based) refinement. More details about such cases, i.e., fitting the parts of a scattering curve, can be found in the SI File (part A) in S6.
In order to establish a reasonable fitting for the (004) reflection, the WANS data of the low-softening-point pitch sample LSPP-1200 were refined manually in OctCarb after the automatic refinement. Here, “manual refinement” means that after the automatic refinement, the resulting parameters were variated manually, and the quality of the fit was judged by the user. Overall, it can be concluded that WANS data can be well refined and evaluated using Octave in combination with the model of Ruland and Smarsly [44] to obtain meaningful microstructural parameters of NGC.
3.2.4. Noise Level Test on WAXS and WANS Data
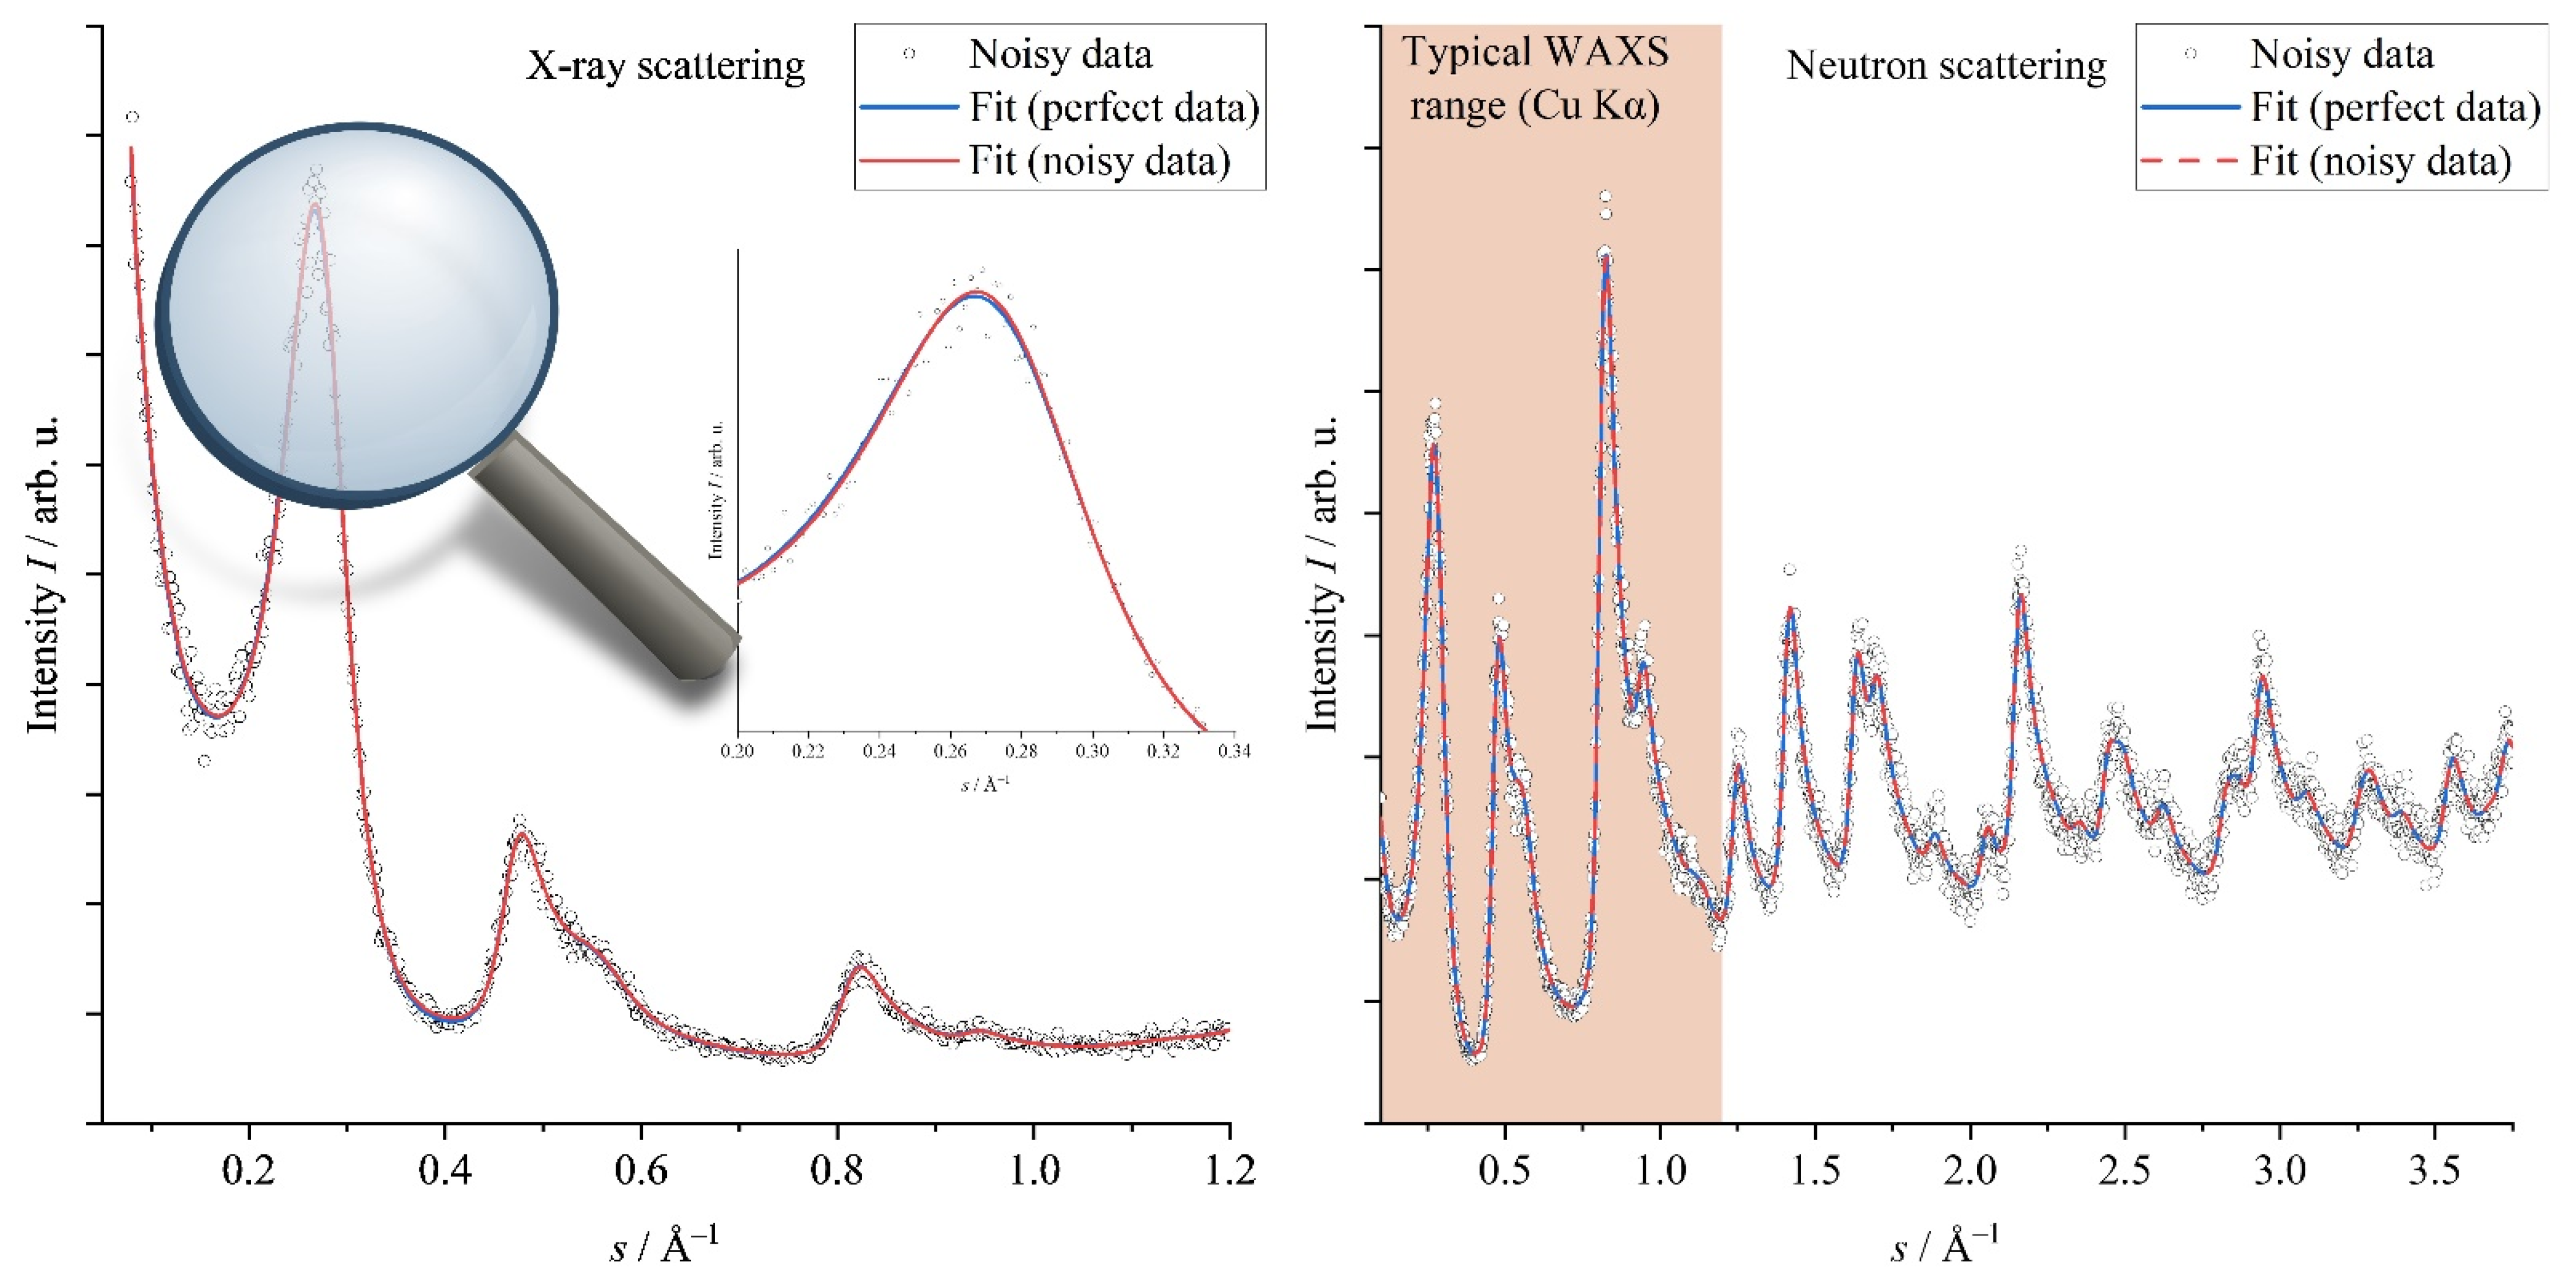
For the noise level test, common average WAXS/WANS patterns were simulated, and the simulated points were noised by a random Gaussian deviation with a standard deviation of σnoise = 0.05. For WAXS, in addition to the coherent scattering (Icoh), the incoherent scattering (Iincoh) was simulated analytically, where for WANS, only Icoh was calculated. Both the unperturbed data (absence of noise) and the noised WAXS/WANS data were refined using OctCarb as an automatic fit. Table 4 summarizes the input values for the data simulation and the resulting parameters using the automatic fit function. In Figure 8, the blurred WAXS and WANS data as well as the refinements for the perfect data (blue) and the noisy data (red) are shown. Overall, the fitting as well as the individual parameters are very close to the initial data for both, the unperturbed and the noisy data. This excellent match means that the refinement leads to reliable fitting parameters also for noisy data, and thus the structural parameters obtained from the fitting routine can be considered meaningful.
Looking at the disorder parameters for the stacks (interlayer, σ3) and the layers (intralayer, σ1), the accuracy of σ3 is not improved using WANS data. In contrast, the intralayer disorder parameter σ1 can be determined with significant higher accuracy if the WANS data extend until such large s values. This interesting result can be attributed to the degree of disorder in the intra- and interlayer structure, in combination with different accessible ranges of s: at higher values of s the interlayer reflections are usually dampened out because of the significant disorder in the stacking, and thus the (004) or, at best, (006) reflection appears at least as a shoulder. Hence, using WAXS/WANS data ranging to high s values does not provide higher accuracy in determining the degree of the disorder in the layer stacking. By contrast, usually a much larger number of intralayer reflections appears, and consequently, the evaluation of σ1 benefits from an extended range of s.
4. Discussion
A main improvement compared with our previously introduced package (CarbX) is the ability to analyze powder wide-angle neutron scattering (WANS) data, and in particular the integration into the well-established Octave software. Additionally, OctCarb is open-source and can be modified to adapt it for individual needs. Compared with other software tools and our predecessor software (CarbX), the new program OctCarb provides an all-in-one tool for data processing and refinement for different radiation types (WAXS/WANS) and measurement geometries and without the usage of any external software. The main progress compared with CarbX is the usage of an open-source tool for a standardized fitting procedure (Levenberg–Marquardt algorithm), which is included in the Octave package. As a further improvement, the concentrations of foreign atoms of hydrogen, nitrogen, oxygen, and sulfur are also considered, and an incoherent background scattering is accurately taken into account. Another important improvement is the simplified handling of the parameter for the polydispersity of the graphenes (ν), which had originally been introduced by Ruland and Smarsly [44], and the refinement of which had complicated the procedure. Fixing this parameter in a well-defined procedure now leads to the possibility of significantly tweaking the amount of time for a single refinement, which can be reduced now to the order of some minutes only. Moreover, in our opinion, the possibility of refining WANS data as well as the possibility to use OctCarb and the whole refinement algorithm on all common operating systems (Windows, MacOS and Linux) and therefore also on high-performance computing systems are relevant and useful improvements. While using an HPC is certainly advantageous for refining several samples simultaneously, we found that for one single dataset, even standard computers evaluate with similar speed.
In contrast to other provided software for the WAXS analysis of NGCs, the calculation of (hk)-profiles and thus also La in the approach of Ruland and Smarsly [44] is based on the concept of the chord-length distribution (CLD), i.e., single-atom positions are not used for the graphenes, as is the case in the Debye scattering function. It uses an analytical expression based on a Gaussian distribution as described in Ruland and Tompa (1967) [69]. As La is thus calculated from a CLD, the used approach is valid also for small La values on the Ångstrom scale. Additionally, due to the calculation of the whole profile shape and not only a simple single-peak or peak-position analysis, the peak-maximum shift mentioned by Warren and Bodenstein (1966) [70] is intrinsically considered in the approach of Ruland and Smarsly [44] and thus also in OctCarb.
5. Conclusions
Here we presented a reliable, free, comfortable and fully open-source software tool (OctCarb) for evaluating the wide-angle X-ray/neutron scattering (WAXS/WANS) of non-graphitic carbon powder materials. OctCarb enables the refinement of WAXS/WANS data using the theoretical model of Ruland and Smarsly [44] and provides physically meaningful parameters describing the stacking and layer structure including intrinsic structural disorder. While the underlying theoretical scattering model is complex, we would like to emphasize that OctCarb is usable also by non-XRD experts for a profound analysis of experimental WAXS/WANS data.
As an outlook, it is planned to use the algorithm and OctCarb for the refinement of pair-distribution-function (PDF) data of NGCs, which can be obtained from WANS as well as from low-wavelength WAXS experiments, e.g., from synchrotron measurements [71,72]. Another option is the distribution of a *.mex file in order to make the calculation in iObs and OctCarb usable in MathWorks MatLab, another mathematical software tool similar to Octave. [42] Even if MathWorks MatLab is not free of charge, it might be a good alternative since it is widely spread and has well-working parallel computing functions implemented. Even if this part is not provided in this study, it is still possible to create the needed *.mex file using the C/C++ data from GitHub (https://github.com/osswaldo/NGCs/tree/master/Octave/oct-files (accessed on 2 November 2022)) and compile the iObs.mex analogous to iObs.oct.
Supplementary Materials
The following supporting information can be downloaded at: https://www.mdpi.com/article/10.3390/c8040078/s1, SI part A—Octave installation and examples, SI part B—Correction/fine treatment of WAXS/WANS data and mathematical background, Excerpt from GitHub, OctCarb Test Data [73,74,75,76,77,78,79,80,81,82,83,84,85,86,87,88,89].
Author Contributions
Conceptualization, O.O. and B.M.S.; methodology, O.O.; software, O.O.; validation, O.O.; formal analysis, O.O.; investigation, O.O. and B.M.S.; resources, O.O. and B.M.S.; data curation, O.O.; writing—original draft preparation, B.M.S.; writing—review and editing, B.M.S.; visualization, O.O.; supervision, B.M.S.; project administration, B.M.S.; funding acquisition, B.M.S. All authors have read and agreed to the published version of the manuscript.
Funding
Financial support is provided by the DFG via the GRK (Research Training Group) 2204 “Substitute Materials for Sustainable Energy Technologies”.
Data Availability Statement
The data presented in this study are available in the SI File “OctCarb Test Data.zip”.
Acknowledgments
We acknowledge Torben Pfaff for programming the basic calculation routine in C++, and Henry E. Fischer for assistance in the inelastic neutron scattering experiments, data preparation and beamtime support. We would also like to thank Torben Pfaff and Felix Badaczewski for performing the WANS measurements and Marc Oliver Loeh for synthesizing the samples. We also acknowledge computational resources provided by the HPC Core Facility and the HRZ of the Justus-Liebig University Giessen. We thank Christian Bauer and Felix Badaczewski for testing and evaluating OctCarb.
Conflicts of Interest
The authors declare no conflict of interest.
References
- Doherty, C.M.; Caruso, R.A.; Smarsly, B.M.; Adelhelm, P.; Drummond, C.J. Hierarchically Porous Monolithic LiFePO 4/Carbon Composite Electrode Materials for High Power Lithium Ion Batteries. Chem. Mater. 2009, 21, 5300–5306. [Google Scholar] [CrossRef]
- Kumar, R.; Dhakate, S.R.; Mathur, R.B. The role of ferrocene on the enhancement of the mechanical and electrochemical properties of coal tar pitch-based carbon foams. J. Mater. Sci. 2013, 48, 7071–7080. [Google Scholar] [CrossRef]
- Oberlin, A. Carbonization and graphitization. Carbon 1984, 22, 521–541. [Google Scholar] [CrossRef]
- Goel, C.; Bhunia, H.; Bajpai, P.K. Synthesis of nitrogen doped mesoporous carbons for carbon dioxide capture. RSC Adv. 2015, 5, 46568–46582. [Google Scholar] [CrossRef]
- Li, J.; Lu, R.; Dou, B.; Ma, C.; Hu, Q.; Liang, Y.; Wu, F.; Qiao, S.; Hao, Z. Porous graphitized carbon for adsorptive removal of benzene and the electrothermal regeneration. Environ. Sci. Technol. 2012, 46, 12648–12654. [Google Scholar] [CrossRef] [Green Version]
- Oschatz, M.; Borchardt, L.; Thommes, M.; Cychosz, K.A.; Senkovska, I.; Klein, N.; Frind, R.; Leistner, M.; Presser, V.; Gogotsi, Y.; et al. Carbide-derived carbon monoliths with hierarchical pore architectures. Angew. Chem. Int. Ed. Engl. 2012, 51, 7577–7580. [Google Scholar] [CrossRef]
- Oschatz, M.; Kockrick, E.; Rose, M.; Borchardt, L.; Klein, N.; Senkovska, I.; Freudenberg, T.; Korenblit, Y.; Yushin, G.; Kaskel, S. A cubic ordered, mesoporous carbide-derived carbon for gas and energy storage applications. Carbon 2010, 48, 3987–3992. [Google Scholar] [CrossRef]
- Silvestre-Albero, A.; Rico-Frances, S.; Rodríguez-Reinoso, F.; Kern, A.M.; Klumpp, M.; Etzold, B.J.; Silvestre-Albero, J. High selectivity of TiC-CDC for CO2/N2 separation. Carbon 2013, 59, 221–228. [Google Scholar] [CrossRef] [Green Version]
- Dash, R.; Chmiola, J.; Yushin, G.; Gogotsi, Y.; Laudisio, G.; Singer, J.; Fischer, J.; Kucheyev, S. Titanium carbide derived nanoporous carbon for energy-related applications. Carbon 2006, 44, 2489–2497. [Google Scholar] [CrossRef] [Green Version]
- Manthiram, A.; Fu, Y.; Chung, S.-H.; Zu, C.; Su, Y.-S. Rechargeable lithium-sulfur batteries. Chem. Rev. 2014, 114, 11751–11787. [Google Scholar] [CrossRef]
- Inagaki, M.; Konno, H.; Tanaike, O. Carbon materials for electrochemical capacitors. J. Power Sources 2010, 195, 7880–7903. [Google Scholar] [CrossRef]
- Oschatz, M.; Borchardt, L.; Pinkert, K.; Thieme, S.; Lohe, M.R.; Hoffmann, C.; Benusch, M.; Wisser, F.M.; Ziegler, C.; Giebeler, L.; et al. Hierarchical Carbide-Derived Carbon Foams with Advanced Mesostructure as a Versatile Electrochemical Energy-Storage Material. Adv. Energy Mater. 2014, 4, 1300645. [Google Scholar] [CrossRef]
- Wang, J.; Sugita, S.; Nagayama, K.; Matsumoto, T. OS18-3 Spatiotemporal Dynamics of Actin during Adhesion Process of MC3T3-E1 Cells to Substrate(Cell and Tissue mechanics 1,OS18 Cell and tissue mechanics, BIOMECHANICS). ATEM 2015, 14, 237. [Google Scholar] [CrossRef]
- Kim, Y.-S.; Guo, X.-F.; Kim, G.-J. Synthesis of carbon monolith with bimodal meso/macroscopic pore structure and its application in asymmetric catalysis. Catal. Today 2010, 150, 91–99. [Google Scholar] [CrossRef]
- Zhang, S.; Chen, L.; Zhou, S.; Zhao, D.; Wu, L. Facile Synthesis of Hierarchically Ordered Porous Carbon via in Situ Self-Assembly of Colloidal Polymer and Silica Spheres and Its Use as a Catalyst Support. Chem. Mater. 2010, 22, 3433–3440. [Google Scholar] [CrossRef]
- Tzeng, S.-S.; Chr, Y.-G. Evolution of microstructure and properties of phenolic resin-based carbon/carbon composites during pyrolysis. Mater. Chem. Phys. 2002, 73, 162–169. [Google Scholar] [CrossRef]
- Perret, R.; Ruland, W. X-ray small-angle scattering of glassy carbon. J. Appl. Crystallogr. 1972, 5, 183–187. [Google Scholar] [CrossRef]
- Fitzer, E.; Kochling, K.-H.; Boehm, H.P.; Marsh, H. Recommended terminology for the description of carbon as a solid (IUPAC Recommendations 1995). Pure Appl. Chem. 1995, 67, 473–506. [Google Scholar] [CrossRef]
- Badaczewski, F.M.; Loeh, M.O.; Pfaff, T.; Dobrotka, S.; Wallacher, D.; Clemens, D.; Metz, J.; Smarsly, B.M. Peering into the structural evolution of glass-like carbons derived from phenolic resin by combining small-angle neutron scattering with an advanced evaluation method for wide-angle X-ray scattering. Carbon 2019, 141, 169–181. [Google Scholar] [CrossRef]
- Badaczewski, F.M.; Loeh, M.O.; Pfaff, T.; Wallacher, D.; Clemens, D.; Smarsly, B.M. An advanced structural characterization of templated meso-macroporous carbon monoliths by small- and wide-angle scattering techniques. Beilstein J. Nanotechnol. 2020, 11, 310–322. [Google Scholar] [CrossRef]
- Faber, K.; Badaczewski, F.M.; Oschatz, M.; Mondin, G.; Nickel, W.; Kaskel, S.; Smarsly, B.M. In-Depth Investigation of the Carbon Microstructure of Silicon Carbide-Derived Carbons by Wide-Angle X-ray Scattering. J. Phys. Chem. C 2014, 118, 15705–15715. [Google Scholar] [CrossRef]
- Faber, K.; Badaczewski, F.M.; Ruland, W.; Smarsly, B.M. Investigation of the Microstructure of Disordered, Non-graphitic Carbons by an Advanced Analysis Method for Wide-Angle X-ray Scattering. Z. Anorg. Allg. Chem. 2014, 640, 3107–3117. [Google Scholar] [CrossRef]
- Loeh, M.O.; Badaczewski, F.M.; Faber, K.; Hintner, S.; Bertino, M.F.; Mueller, P.; Metz, J.; Smarsly, B.M. Analysis of thermally induced changes in the structure of coal tar pitches by an advanced evaluation method of X-ray scattering data. Carbon 2016, 109, 823–835. [Google Scholar] [CrossRef]
- Loeh, M.O.; Badaczewski, F.M.; von der Lehr, M.; Ellinghaus, R.; Dobrotka, S.; Metz, J.; Smarsly, B.M. Hard-templating of carbon using porous SiO2 monoliths revisited—Quantitative impact of spatial confinement on the microstructure evolution. Carbon 2018, 129, 552–563. [Google Scholar] [CrossRef]
- Pfaff, T.; Simmermacher, M.; Smarsly, B.M. CarbX: A program for the evaluation of wide-angle X-ray scattering data of non-graphitic carbons. J. Appl. Crystallogr. 2018, 51, 219–229. [Google Scholar] [CrossRef] [Green Version]
- Pfaff, T.; Badaczewski, F.M.; Loeh, M.O.; Franz, A.; Hoffmann, J.-U.; Reehuis, M.; Zeier, W.G.; Smarsly, B.M. Comparative Microstructural Analysis of Nongraphitic Carbons by Wide-Angle X-ray and Neutron Scattering. J. Phys. Chem. C 2019, 123, 20532–20546. [Google Scholar] [CrossRef]
- Ou, M.; Zhang, Y.; Zhu, Y.; Fan, C.; Sun, S.; Feng, J.; Sun, X.; Wei, P.; Xu, J.; Peng, J.; et al. Local Structures of Soft Carbon and Electrochemical Performance of Potassium-Ion Batteries. ACS Appl. Mater. Interfaces 2021, 13, 28261–28269. [Google Scholar] [CrossRef]
- Härmas, R.; Palm, R.; Kurig, H.; Puusepp, L.; Pfaff, T.; Romann, T.; Aruväli, J.; Tallo, I.; Thomberg, T.; Jänes, A.; et al. Carbide-Derived Carbons: WAXS and Raman Spectra for Detailed Structural Analysis. C 2021, 7, 29. [Google Scholar] [CrossRef]
- Schüpfer, D.B.; Badaczewski, F.M.; Guerra-Castro, J.M.; Hofmann, D.M.; Heiliger, C.; Smarsly, B.M.; Klar, P.J. Assessing the structural properties of graphitic and non-graphitic carbons by Raman spectroscopy. Carbon 2020, 161, 359–372. [Google Scholar] [CrossRef]
- Schüpfer, D.B.; Badaczewski, F.M.; Peilstöcker, J.; Guerra-Castro, J.M.; Shim, H.; Firoozabadi, S.; Beyer, A.; Volz, K.; Presser, V.; Heiliger, C.; et al. Monitoring the thermally induced transition from sp3-hybridized into sp2-hybridized carbons. Carbon 2021, 172, 214–227. [Google Scholar] [CrossRef]
- Shi, H.; Reimers, J.N.; Dahn, J.R. Structure-refinement program for disordered carbons. J. Appl. Crystallogr. 1993, 26, 827–836. [Google Scholar] [CrossRef]
- Tsui, L. CarbonXS GUI. Available online: https://lktsui.github.io/carbon_xs_gui/tutorial.html (accessed on 4 January 2021).
- Tsui, L.; Garzon, F. CarbonXS GUI: A graphical front-end for CarbonXS. J. Appl. Crystallogr. 2017, 50, 1830–1833. [Google Scholar] [CrossRef]
- Fujimoto, H.; Shiraishi, M. Characterization of unordered carbon using Warren–Bodenstein’s equation. Carbon 2001, 39, 1753–1761. [Google Scholar] [CrossRef]
- Fujimoto, H. Theoretical X-ray scattering intensity of carbons with turbostratic stacking and AB stacking structures. Carbon 2003, 41, 1585–1592. [Google Scholar] [CrossRef]
- Fujimoto, H. A new estimation method for the degree of graphitization for random layer lattices. Carbon 2010, 48, 3446–3453. [Google Scholar] [CrossRef]
- Warren, B.E.; Bodenstein, P. The diffraction pattern of fine particle carbon blacks. Acta Cryst. 1965, 18, 282–286. [Google Scholar] [CrossRef] [Green Version]
- Fujimoto, H. Carbon Analyzer, 2022. Available online: http://www.asahi-net.or.jp/~qn6h-fjmt (accessed on 2 November 2022).
- Saenko, N.S. The X-ray diffraction study of three-dimensional disordered network of nanographites: Experiment and theory. Phys. Procedia 2012, 23, 102–105. [Google Scholar] [CrossRef] [Green Version]
- Dopita, M.; Rudolph, M.; Salomon, A.; Emmel, M.; Aneziris, C.G.; Rafaja, D. Simulations of X-Ray Scattering on Two-Dimensional, Graphitic and Turbostratic Carbon Structures. Adv. Eng. Mater. 2013, 15, 1280–1291. [Google Scholar] [CrossRef]
- Dopita, M.; Emmel, M.; Salomon, A.; Rudolph, M.; Matěj, Z.; Aneziris, C.G.; Rafaja, D. Temperature evolution of microstructure of turbostratic high melting coal-tar synthetic pitch studied using wide-angle X-ray scattering method. Carbon 2015, 81, 272–283. [Google Scholar] [CrossRef]
- MATLAB, Version 9.9.0 (R2020b); The MathWorks Inc.: Natick, MA, USA, 2020.
- Ungár, T.; Gubicza, J.; Ribárik, G.; Pantea, C.; Zerda, T. Microstructure of carbon blacks determined by X-ray diffraction profile analysis. Carbon 2002, 40, 929–937. [Google Scholar] [CrossRef]
- Ruland, W.; Smarsly, B.M. X-ray scattering of non-graphitic carbon: An improved method of evaluation. J. Appl. Crystallogr. 2002, 35, 624–633. [Google Scholar] [CrossRef]
- Wolfram Research, Inc. Mathematica, Version 12.1, 2020. Available online: https://www.wolfram.com/mathematica (accessed on 2 November 2022).
- Eaton, J.W.; Bateman, D.; Hauberg, S.; Wehbring, R. {GNU Octave} Version 5.2.0 Manual: A High-Level Interactive Language for Numerical Computations, 2020. Available online: https://www.gnu.org/software/octave/doc/v5.2.0/ (accessed on 2 November 2022).
- Free Software Foundation, Inc. GNU General Public License: Version 3. Available online: https://www.gnu.org/licenses/gpl-3.0.html (accessed on 21 October 2020).
- Warren, B.E. X-Ray Diffraction in Random Layer Lattices. Phys. Rev. 1941, 59, 693–698. [Google Scholar] [CrossRef]
- Biscoe, J.; Warren, B.E. An X-Ray Study of Carbon Black. J. Appl. Phys. 1942, 13, 364–371. [Google Scholar] [CrossRef]
- Scherrer, P. Bestimmung der inneren Struktur und der Größe von Kolloidteilchen mittels Röntgenstrahlen. In Kolloidchemie ein Lehrbuch; Zsigmondy, R., Ed.; Springer: Berlin/Heidelberg, Germany, 1912; pp. 387–409. ISBN 978-3-662-33517-8. [Google Scholar]
- Sharma, A.; Kyotani, T.; Tomita, A. Comparison of structural parameters of PF carbon from XRD and HRTEM techniques. Carbon 2000, 38, 1977–1984. [Google Scholar] [CrossRef]
- Diamond, R. X-ray studies of some carbonized coals. Phil. Trans. R. Soc. Lond. A 1960, 252, 193–223. [Google Scholar] [CrossRef]
- Perret, R.; Ruland, W. Profile analysis of random-layer lines. J. Appl. Crystallogr. 1968, 1, 257–262. [Google Scholar] [CrossRef]
- Ruland, W. X-ray studies on the carbonization and graphitization of acenaphthylene and bifluorenyl. Carbon 1965, 2, 365–378. [Google Scholar] [CrossRef]
- Ruland, W. Fourier transform methods for random-layer line profiles. Acta Cryst. 1967, 22, 615–623. [Google Scholar] [CrossRef]
- Houska, C.R.; Warren, B.E. X-Ray Study of the Graphitization of Carbon Black. J. Appl. Phys. 1954, 25, 1503–1509. [Google Scholar] [CrossRef]
- Franklin, R.E. The interpretation of diffuse X-ray diagrams of carbon. Acta Cryst. 1950, 3, 107–121. [Google Scholar] [CrossRef]
- Franklin, R.E. Crystallite growth in graphitizing and non-graphitizing carbons. Proc. R. Soc. Lond. A 1951, 209, 196–218. [Google Scholar] [CrossRef]
- Prince, E.; Fuess, H.; Hahn, T.; Wondratschek, H.; Müller, U.; Shmueli, U.; Authier, A.; Kopský, V.; Litvin, D.B.; Rossmann, M.G.; et al. International Tables for Crystallography; International Union of Crystallography: Chester, UK, 2006; ISBN 978-1-4020-5259-0. [Google Scholar]
- octave.org. Preface (GNU Octave (Version 5.2.0)). Available online: https://octave.org/doc/v5.2.0/Preface.html (accessed on 2 November 2021).
- Levenberg, K. A method for the solution of certain non-linear problems in least squares. Quart. Appl. Math. 1944, 2, 164–168. [Google Scholar] [CrossRef] [Green Version]
- Marquardt, D.W. An Algorithm for Least-Squares Estimation of Nonlinear Parameters. J. Soc. Ind. Appl. Math. 1963, 11, 431–441. [Google Scholar] [CrossRef]
- Moré, J.J. The Levenberg-Marquardt algorithm: Implementation and theory. In Numerical Analysis; Watson, G.A., Ed.; Springer: Berlin/Heidelberg, Germany, 1978; pp. 105–116. ISBN 978-3-540-08538-6. [Google Scholar]
- Vetterling, W.T. Numerical Recipes, 3rd ed.; Cambridge University Press: Cambridge, UK, 2007; ISBN 0521880688. [Google Scholar]
- Einert, M.; Wessel, C.; Badaczewski, F.; Leichtweiß, T.; Eufinger, C.; Janek, J.; Yuan, J.; Antonietti, M.; Smarsly, B.M. Nitrogen-Doped Carbon Electrodes: Influence of Microstructure and Nitrogen Configuration on the Electrical Conductivity of Carbonized Polyacrylonitrile and Poly(ionic liquid) Blends. Macromol. Chem. Phys. 2015, 216, 1930–1944. [Google Scholar] [CrossRef]
- Holleman, A.F.; Wiberg, E.; Wiberg, N.; Fischer, G. Anorganische Chemie; 103. Auflage; De Gruyter: Berlin, Boston, 2017; ISBN 978-3-11-051854-2. [Google Scholar]
- Strunz, H. Strunz Mineralogical Tables. Ninth Edition: Chemical-Structural Mineral Classification System, 9th ed.; Schweizerbart: Stuttgart, Germany, 2020; ISBN 9783510654529. [Google Scholar]
- Hoffmann, J.-U.; Reehuis, M. E2: The Flat-Cone Diffractometer at BER II. JLSRF 2018, 4, A129. [Google Scholar] [CrossRef] [Green Version]
- Ruland, W.; Tompa, H. The effect of multiple scattering on structural parameters determined from X-ray small-angle scattering. J. Appl. Crystallogr. 1972, 5, 1–7. [Google Scholar] [CrossRef]
- Warren, B.E.; Bodenstein, P. The shape of two-dimensional carbon black reflections. Acta Cryst. 1966, 20, 602–605. [Google Scholar] [CrossRef]
- Masson, O.; Thomas, P. Exact and explicit expression of the atomic pair distribution function as obtained from X-ray total scattering experiments. J. Appl. Crystallogr. 2013, 46, 461–465. [Google Scholar] [CrossRef]
- Olds, D.P.; Duxbury, P.M. Efficient algorithms for calculating small-angle scattering from large model structures. J. Appl. Crystallogr. 2014, 47, 1077–1086. [Google Scholar] [CrossRef]
- HKHLR—HPC Hessen. justHPC Gießen. Available online: https://www.hkhlr.de/de/cluster/justhpc-giessen (accessed on 21 July 2022).
- Placzek, G. The Scattering of Neutrons by Systems of Heavy Nuclei. Phys. Rev. 1952, 86, 377–388. [Google Scholar] [CrossRef]
- Fischer, H.E.; Barnes, A.C.; Salmon, P.S. Neutron and x-ray diffraction studies of liquids and glasses. Rep. Prog. Phys. 2006, 69, 233–299. [Google Scholar] [CrossRef]
- Milberg, M.E.; Brailsford, A.D. The atomic incoherent scattering intensities of boron, oxygen and carbon. Acta Cryst. 1958, 11, 672–673. [Google Scholar] [CrossRef]
- Keating, D.T.; Vineyard, G.H. The complete incoherent scattering function for carbon. Acta Cryst. 1956, 9, 895–896. [Google Scholar] [CrossRef]
- Ruland, W. X-ray determination of crystallinity and diffuse disorder scattering. Acta Cryst. 1961, 14, 1180–1185. [Google Scholar] [CrossRef]
- James, R.W. The Optical Principles of the Diffraction of X-rays; George Bell & Sons: London, UK, 1962; Volume 2. [Google Scholar]
- Ruland, W. The separation of coherent and incoherent Compton X-ray scattering. Br. J. Appl. Phys. 1964, 15, 1301–1307. [Google Scholar] [CrossRef]
- Buerger, M.J. The Correction of X-Ray Diffraction Intensities for Lorentz and Polarization Factors. Proc. Natl. Acad. Sci. USA 1940, 26, 637–642. [Google Scholar] [CrossRef] [Green Version]
- Schulz, L.G. A Direct Method of Determining Preferred Orientation of a Flat Reflection Sample Using a Geiger Counter X-Ray Spectrometer. J. Appl. Phys. 1949, 20, 1030–1033. [Google Scholar] [CrossRef]
- Sivia, D.S. Elementary Scattering Theory: For X-ray and Neutron Users; Reprinted; Oxford University Press: Oxford, UK, 2017; ISBN 9780199228683. [Google Scholar]
- Hubbell, J.H.; Seltzer, S. Tables of X-Ray Mass Attenuation Coefficients and Mass Energy-Absorption Coefficients 1 keV to 20 MeV for Elements Z = 1 to 92 and 48 Additional Substances of Dosimetric Interest. 1995. Available online: https://www.semanticscholar.org/paper/Tables-of-X-Ray-Mass-Attenuation-Coefficients-and-1-Hubbell-Seltzer/2098301d7be3283817f2567a2c5ca4553b5b41a8 (accessed on 2 November 2022).
- NIST Center for Neutron Research. Neutron Scattering Lengths and Cross Sections. Available online: https://www.ncnr.nist.gov/resources/n-lengths/ (accessed on 2 November 2022).
- Fox, A.G.; O’Keefe, M.A.; Tabbernor, M.A. Relativistic Hartree–Fock X-ray and electron atomic scattering factors at high angles. Acta Crystallogr. A Found Crystallogr. 1989, 45, 786–793. [Google Scholar] [CrossRef] [Green Version]
- Sears, V.F. Neutron scattering lengths and cross sections. Neutron News 1992, 3, 26–37. [Google Scholar] [CrossRef]
- Cromer, D.T. Compton Scattering Factors for Aspherical Free Atoms. J. Chem. Phys. 1969, 50, 4857–4859. [Google Scholar] [CrossRef]
- Salmon, P.S.; Petri, I. Structure of glassy and liquid GeSe 2. J. Phys. Condens. Matter 2003, 15, S1509–S1528. [Google Scholar] [CrossRef]
Figure 1.
Sketch of the structural make-up of non-graphitic carbons (NGCs) containing a turbostratic stacking of graphenes. Detailed information about all parameters can be found in Section 2.2.
Figure 1.
Sketch of the structural make-up of non-graphitic carbons (NGCs) containing a turbostratic stacking of graphenes. Detailed information about all parameters can be found in Section 2.2.

Figure 2.
Representative example for an experimental wide-angle X-ray scattering (WAXS) data set of a NGC, which is given by a superposition of interlayer reflections (00l), asymmetric intralayer reflections (hk) and the incoherent scattering (Iincoh). s is the modules of the scattering vector (s = 2/λ · sin(θ)). It should be noted that the indexing shown with parentheses, strictly speaking, denotes lattice planes, and that reflections would have to be indexed without parentheses. However, brackets are coherently used in this publication for both meanings, for improving readability.

Figure 3.
Main graphical user interface (GUI) of Octave and the OctCarb refinement script (main window). On the top bar, the Octave files (*.m) can be opened and saved, and various windows can be activated and deactivated. On the left side, the current working directory can be changed, and the currently used variables and executed commands are shown. On the lower side, one can switch between the Command Window (e.g., the Octave Command User Interface), the Editor (to edit the script files) and the Variable Editor and Documentation.

Figure 4.
Results of the wide-angle neutron scattering (WANS) refinement using OctCarb (upper left): In addition to the microstructural parameters in text form categorized by interlayer and intralayer parameters, Octave plots the measurement data and the fit as well as the deviation, and saves all in a CSV file.

Figure 5.
Theoretical WAXS data of NGCs and a typical, reasonable fit. Green: Most important regions for fitting, which are strongly influenced by the NGC microstructural parameters. These parts must be refined as well as possible. Based on our experience, the yellow regions are significantly influenced by foreign atoms, the measurement geometry and factors contributing to the incoherent scattering. Overall, the green regions should have a higher priority in judging the quality of a fitting result. While micropores influence the lower s-range of the red region, the range around s = 0.7 Å−1 can be influenced by amorphous carbon with a bond length of around dC-C ~ 1.42 Å and sC-C = 1/dc-c ~ 0.7 Å. As another point, only low amounts (<5–10%) of unorganized carbon or foreign atoms such as nitrogen or oxygen can be considered well by the present model. Higher amounts can significantly influence the data at lower values of s, e.g., the red region. Our approach cannot model such higher concentrations of impurities, as it assumes that these atoms are isolated and show no mutual correlation in their position. Hence, a reasonable fitting of these specific regions might be impossible using OctCarb because these additive scattering contributions are not considered by our approach.

Figure 6.
Validation of OctCarb using WAXS data of FA-850 (furfuryl alcohol-based carbon). Automatic refinements using different starting parameters were performed in order to analyze the impact of the initial values on the final fitting result during the non-linear fitting procedures. Green: Final refinement of Pfaff et al. [25]: red: automatic fitting by OctCarb using the refined microstructural values from Pfaff et al. [25] as initial parameters (Octave data set Pfaff et al. see Figure S1), blue: automatic fit with our default starting parameters as described in the SI File (part A) in Table S7 (Octave data set default values, see Figure S1). A first analysis using the already refined microstructure parameters from Pfaff et al. [25] served to validate if the general refinement works in principle and leads to comparable results. The second analysis using the default starting parameters aimed to validate if the numerical refinement/minimalization of OctCarb works well and leads to the same (or similar) results. These default starting values are in principle means of the aforementioned structural parameters of common NGCs. Additionally, in this study and in the model of Ruland and Smarsly [44], is defined as the mean value of the layer distances, whereas calculating the average layer distance by 1/s(002) does not provide a mean, but the modal value. Therefore, these values are different, and in conclusion, an average layer distance (mean) can only be calculated by a refinement of the whole (002) reflection and not only from the position of the maximum. Note: only every second measurement point is shown for better visibility. For plots of the other samples, see Figure S1 in the SI File (part A).

Figure 7.
Refinement of previously reported wide-angle neutron scattering (WANS) data by Pfaff et al. [26]. The measured WANS data (black; every 10th point (except for the last plot)) were fitted automatically (red) and the result manually refined (blue). For H-2800, no manual refinement was needed. For LSPP-1200, the interlayer parameters had to be adjusted to fit better the (004) reflection.

Figure 8.
Noise level test using simulated WAXS (left) and WANS (right) data, which were blurred by statistical noise according to a Gaussian distribution (σ = 0.05) (black). The range of s values and the used noise level correspond to that of a typical laboratory instrument using Cu Kα radiation, especially for WAXS. The resulting fit of the noised data (red) is close to the fit for the perfect data (blue). The deviations are only small, implying that such noise level does not exert significant influence on the resulting structural parameters (Table 4). The data are simulated corresponding to a resin treated at medium heat-treatment temperatures (1800–2500 °C) or a pitch at lower temperatures (1200–2000 °C).


Table 1.
Microstructure parameters describing the layer structure. Note that La, lm and κa are mathematically dependent on each other and calculated from a gamma distribution with the shape factors ν and α.
Table 1.
Microstructure parameters describing the layer structure. Note that La, lm and κa are mathematically dependent on each other and calculated from a gamma distribution with the shape factors ν and α.
| Parameter | Description | Explanation |
|---|---|---|
| La | Average graphene layer size |  |
| lm κa | Average chord length of layers Polydispersity of layers |  |
| lcc σ1 | Average C-C bond length Intralayer disorder |  |
Adapted from Faber et al. [21].
Table 2.
Microstructural parameters describing the graphene stacking (interlayer scattering Iinter). Lc, κc and N are mathematically dependent on each other and calculated from a gamma distribution n(N). N being the number of layers per stack, with the parameters μ and β [44] and is also dependent on .
| Parameter | Description | Explanation |
|---|---|---|
| Lc κc | Average stack height Polydispersity of stack height |  |
a3 min σ3 N | Average layer distance Minimal layer distance Standard deviation of layer distances Average number of layers per Stack |  |
| η | Homogeneity of the stacks |  |
| q | Preferred orientation |  |
| Δan | Anisotropy for the atomic form factor of carbon |  |
Adapted from Faber et al. [21].
Table 3.
NGCs can contain non-organized carbon (sp3 hybridized) or foreign atoms (e.g., H, N, O, S). It must be assumed that these atoms are also non-organized and cause only background scattering.
Table 3.
NGCs can contain non-organized carbon (sp3 hybridized) or foreign atoms (e.g., H, N, O, S). It must be assumed that these atoms are also non-organized and cause only background scattering.
| Parameter | Description | Explanation |
|---|---|---|
| cun cH cN cO cS | Concentration of unorganized carbon Concentration of unorganized hydrogen Concentration of unorganized nitrogen Concentration of unorganized oxygen Concentration of unorganized sulfur |  |
Adapted from Faber et al. [21].
Table 4.
Overview of the refinement of simulated WAXS data, which were blurred by statistical noise generated by a Gaussian distribution. The results indicate that OctCarb can evaluate reproducibly microstructural parameters from given WAXS and WANS data. Since the influence of σ1 on WAXS (for typical Cu-Kα lab setups) and the influence of σ3 on WANS data is only small, these parameters cannot always be determined exactly. Therefore, the resulting values for σ1 (WAXS) and σ3 (WANS) deviate significantly from the input value.
| Perf. WAXS Data | Noisy WAXS Data | Perf. WANS Data | Noisy WANS Data | ||||||
|---|---|---|---|---|---|---|---|---|---|
| Parameter | Input | Fit | Error | Fit | Error | Fit | Error | Fit | Error |
| 3.70 | 3.70 | 0.0% | 3.69 | −0.3% | 3.70 | 0.0% | 3.69 | −0.3% | |
| σ3 | 0.50 | 0.50 | 0.0% | 0.49 | −2.0% | 0.50 | 0.0% | 0.46 | −8.0% |
| N | 3.0 | 3.0 | 0.0% | 3.0 | 0.0% | 3.0 | 0.0% | 3.0 | 0.0% |
| Lc | 11.1 | 11.1 | 0.0% | 11.1 | 0.0% | 11.1 | 0.0% | 11.10 | 0.0% |
| κc | 0.50 | 0.50 | 0.0% | 0.50 | 0.0% | 0.50 | 0.0% | 0.52 | 4.0% |
| La | 20.0 | 20.0 | 0.0% | 20.0 | 0.0% | 20.0 | 0.0% | 20.00 | 0.0% |
| lcc | 1.420 | 1.420 | 0.0% | 1.419 | −0.1% | 1.420 | 0.0% | 1.420 | 0.0% |
| σ1 | 0.025 | 0.030 | 20.0% | 0.016 | −36.0% | 0.025 | 0.0% | 0.025 | 0.0% |
Publisher’s Note: MDPI stays neutral with regard to jurisdictional claims in published maps and institutional affiliations. |
© 2022 by the authors. Licensee MDPI, Basel, Switzerland. This article is an open access article distributed under the terms and conditions of the Creative Commons Attribution (CC BY) license (https://creativecommons.org/licenses/by/4.0/).
Share and Cite
MDPI and ACS Style
Osswald, O.; Smarsly, B.M. OctCarb—A GNU Octave Script for the Analysis and Evaluation of Wide-Angle Scattering Data of Non-Graphitic Carbons. C 2022, 8, 78. https://doi.org/10.3390/c8040078
AMA Style
Osswald O, Smarsly BM. OctCarb—A GNU Octave Script for the Analysis and Evaluation of Wide-Angle Scattering Data of Non-Graphitic Carbons. C. 2022; 8(4):78. https://doi.org/10.3390/c8040078
Chicago/Turabian StyleOsswald, Oliver, and Bernd M. Smarsly. 2022. "OctCarb—A GNU Octave Script for the Analysis and Evaluation of Wide-Angle Scattering Data of Non-Graphitic Carbons" C 8, no. 4: 78. https://doi.org/10.3390/c8040078
Note that from the first issue of 2016, this journal uses article numbers instead of page numbers. See further details here.