Practical Implementation of the Indoor Environmental Quality Model for the Assessment of Nearly Zero Energy Single-Family Building


Thermal Physics, Acoustics and Environment Department, ITB, Filtrowa 1, 00-611 Warsaw, Poland
Buildings 2019, 9(10), 214; https://doi.org/10.3390/buildings9100214
Submission received: 11 September 2019
/
Revised: 26 September 2019
/
Accepted: 30 September 2019
/
Published: 1 October 2019
(This article belongs to the Special Issue Advances in Sustainable Building Material Engineering)
Abstract
:The article presents a practical implementation of the indoor quality model. The indoor environmental quality (IEQ) model, including its essential elements (TCindex—thermal comfort, IAQindex—indoor air quality, ACcindex—acoustic comfort and Lindex—daylight quality), is used to evaluate a case-study single-family building built with the nearly zero energy (NZEB) standard. The results of comfort sub-indices based on the measured indoor parameters are aggregated into one IEQindex value representing the predicted building occupants’ satisfaction in percentage terms. The author’s intention is to use the proposed model in broader civil and environmental engineering practice, especially in terms of supporting the energy performance certification. The results obtained using the IEQ model were also compared with the results obtained with a similar method based on the comprehensive assessment system for built environment efficiency (CASBEE) approach for the same building.
1. Introduction
People in European cities usually spend 8–10 hours a day in offices, then a dozen or so hours at homes and in transport vehicles. The indoor environment affects their health, comfort, self-esteem and work efficiency. For energy saving reasons, new homes are becoming more airtight, condemning people to artificial climatic conditions. Some actual studies provide that the global cost of the employers, the building owners, the building users and public bodies, related to poor indoor environment conditions, may be much higher than the costs of energy use in a building [1,2]. The satisfactory quality of indoor environment can improve life satisfaction, well-being, work efficiency as well as reduce health problems [3,4]. In order to assess the influence of indoor building environmental conditions on the user, taking into account the type of installation and construction materials, it is necessary to combine knowledge of human behaviour with environmental and civil engineering. Currently, the indoor environmental quality (IEQ) problem is widely discussed but there is still no simple tool and approach at the disposal of engineers. Responding to this technical and environmental challenge, the researchers of Building Research Institute ITB have been investigating this issue since 2015 and the research results are currently promising [5]. Findings are disseminated in a case study of a real building assessment. A simplified approach was developed to assess indoor environmental quality as an aggregated IEQindex, which, due to the use of known relatively quick indoor measurement methods, can answer the question whether the building is comfortable for users, i.e., the predicted percentage of dissatisfaction with individual environmental parameters can be calculated. The proposed method uses known and accepted sensory based curves that determine the impact of stimuli on human senses (predicted satisfaction expressed in percentage terms). A summary of the IEQ literature was provided in [3]. Researchers [5,6,7,8,9,10,11,12] indicate that the IEQ approach is a recommended approach for indoor comfort assessment. The choice of the relevant indoor environmental parameters is partly suggested by the new European Standard 16798:2019 Energy Performance of Buildings—Part 1: Indoor and Outdoor Environment (replacing old one EN 15251:2007) providing the quantification of indoor environment parameters (four indoor categories). The recommendation regarding the inclusion of specific information on indoor environment classes in energy performance certificates can be found also in European Directive 2010/31 (hereinafter EPBD). Article 7 provides statements that would be recommended to provide in environmental building information as one (aggregated) indicator. This is in line with an assumption of the IEQindex model provided in this article, which combines four sub-elements of indoor environment quality: Thermal performance, air indoor quality, and acoustic and daylight quality. The author is aware of the unspoken consensus in some European countries that energy characteristics do not take into account the internal environment make no sense. Technical problems in newly built construction objects with a very low energy need were analysed often neglecting air quality and comfort issues [13,14]. This problem is very common and, in the author’s experience, at least 30% of new buildings have significant problems due to low indoor comfort (bad acoustics, poor air quality, low thermal comfort in winter and summer, bad lighting). This is reflected in the number of commercial orders, including court disputes, in the laboratory where the author works. Currently, methods of commercial environmental assessment of buildings (Building Research Establishment Environmental Assessment Method BREEAM or Leadership in Energy and Environmental Design LEED, etc.), although very popular in Poland (about 600 certified buildings), do not translate into the number of new objects implemented in accordance with the sustainability criteria on a global scale. The number of residential or single-family buildings with high environmental comfort is relatively small (no reliable data exist on this subject). Presumably, it is only a few dozen buildings compared to seventy thousand new objects. Meeting the national construction requirements cannot guarantee that the new construction object is friendly for users, human health neutral and comfortable for occupants. The wide implementation of nearly zero energy buildings (NZEB—required by national code, on the conditions and technical requirements that should be met by buildings and their location, effective from 1 January, 2021) is a technical challenge from the civil engineering and environmental engineering point of view that has to create well-being and comfort in buildings. Taking the aforementioned issues into consideration, the assessment of the occupants’ level of comfort whilst living and working in NZEBs requires a new horizontal approach [5] that is simple and effective for a wide implementation.
An important reason to undertake research on single-family buildings in the NZEB stock is the number of single-family buildings completed each year in the country. According to the data published by the National Central Office of Measures in 2018, 79,295 new residential buildings were commissioned with a total volume of 80,123.3 thousand m3. Single-family buildings accounted for 96.6% of all buildings completed. According to the building regulations provided in the technical conditions to be met by buildings, all new buildings from December 31, 2020 will have to be built as nearly zero energy buildings (NZEB).
As the author found, the scholars and researchers in any comfort assessment case study focuses primarily on office and multi-family buildings with a low attention to single-family objects. There is not a large number of papers referring to overall comfort of single-family houses built under the NZEB standard. From the global review of the literature, some positions are worth being mentioned as relevant to the author’s research in this paper. Researchers in [15] investigated NZEB social housing building. This paper presented the results of an occupant satisfaction survey and post occupancy monitoring and analysis. Analyses showed that the design parameters can vary from the actual situation. Occupants’ well-being and indoor environmental quality in NEZBs were analysed in [16]. In this paper, authors’ justified indoor environmental assessment as an important factor to avoid sick building syndrome (SBS) including absenteeism, overheating, poor daylight, or bad air quality. The problem to be solved by authors is to maintain the airtight high-performance building with good IEQ. In [17], indoor environmental quality experimental studies in NZEB were provided. Authors justified the indoor environmental quality assessment approach mainly because from 2020 all the buildings constructed must be nearly zero energy, the same situation as in the author’s country. This can be achieved by implementing good combined active and passive strategies, but even the indoor environmental quality can be hard to reach in energy-efficient buildings with high insulation, low infiltration rates, etc. In [18], the authors’ claimed that day lighting reduction would create consequently higher electricity demand for lighting. The research presented a detailed approach applicable to further analyses aimed at optimizing energy efficiency measures in order to reduce the imbalance between visual and thermal comfort and to ensure the best performance in both domains. The article [19] is a key one justifying work on the IEQ methodology in the European countries. This review paper was about indoor air quality, thermal comfort and daylight requirements in eight selected member states (MS) (BE—Brussels Region, DK-Denmark, FR- France, DE- Germany, IT- Italy, PL- Poland, SE-Sweden, UK—England and Wales) and addressed a range of IEQ parameters that are vital for buildings and their inhabitants. The results of the analysis showed that all studied MS have at least a basic reference to IAQ included in their building codes. Minimum ventilation rates are required or recommended in all eight countries and precise airtightness requirements are in place in six. Concerning thermal comfort indicators, indoor temperature requirements or recommendations range between 16 °C (PL) and 28 °C (FR) and recommendations about humidity are given in six MS (DE, PL, IT, SE, UK). All eight countries include at least a basic reference to daylight in their building codes mainly referring to a minimum share of window area per floor area [19] and minimum levels of daylight. Based on these findings, it can be concluded that indoor health and comfort aspects should be considered to a greater extent in the EU and national building requirements. In position [20], indoor climate and energy performance in nearly zero energy day care centers and school buildings were analysed. Results showed that all the buildings had good indoor climate during the heating season. However, a large percentage of occupied hours were categorized as low category IV during the cooling season. Fedorczak in [21] analyzed the potential of NZEB certifications in terms of sustainability. As provided, there are currently no good and unified requirements for indoor climate conditions in buildings. It is promising that the assessment of NZEB certified buildings may include an assessment of the indoor environment and thus, help fill the gap.
Considering these three conditions (large number of new single-family buildings every year, NZEB standard requirement for all new buildings in 2021 and the literature review), the author focused attention on low energy single-family buildings. The author presents the experimental results of an IEQ study for a single-family NZEB based on indoor measurements. Theoretical models for each IEQ subcomponent are presented. The author hopes that the IEQ method will find wider application in support of assessing the energy performance of buildings. The assessment method specified in the article can be used for any single-family house that meets the NZEB standard
2. Materials and Methods
2.1. Objectives and Scope
The essential goal of the study was to present the assumptions and practical approach for the indoor environment evaluation of a single-family NZEB using the IEQ model including:
- Definition of boundary conditions for analysis with measurement strategy, equipment selection, determination of uncertainty;
- Environmental measurements (including air pollution, concentrations of CO2, total volatile organic compounds (TVOC), formaldehyde (HCHO), thermal performance, acoustic measurements and intensity of daylight);
- Conversion of measured physical values to predicted user satisfaction levels based on sensory equations;
- Calculation of the IEQ index value for the entire building (based on sub-component values);
- Discussion of the method and obtained results;
- Comparison of IEQinsex results with other models of building environmental effectiveness (BEE).
2.2. IEQ Model and Sub-Components Used for a Building Assessment
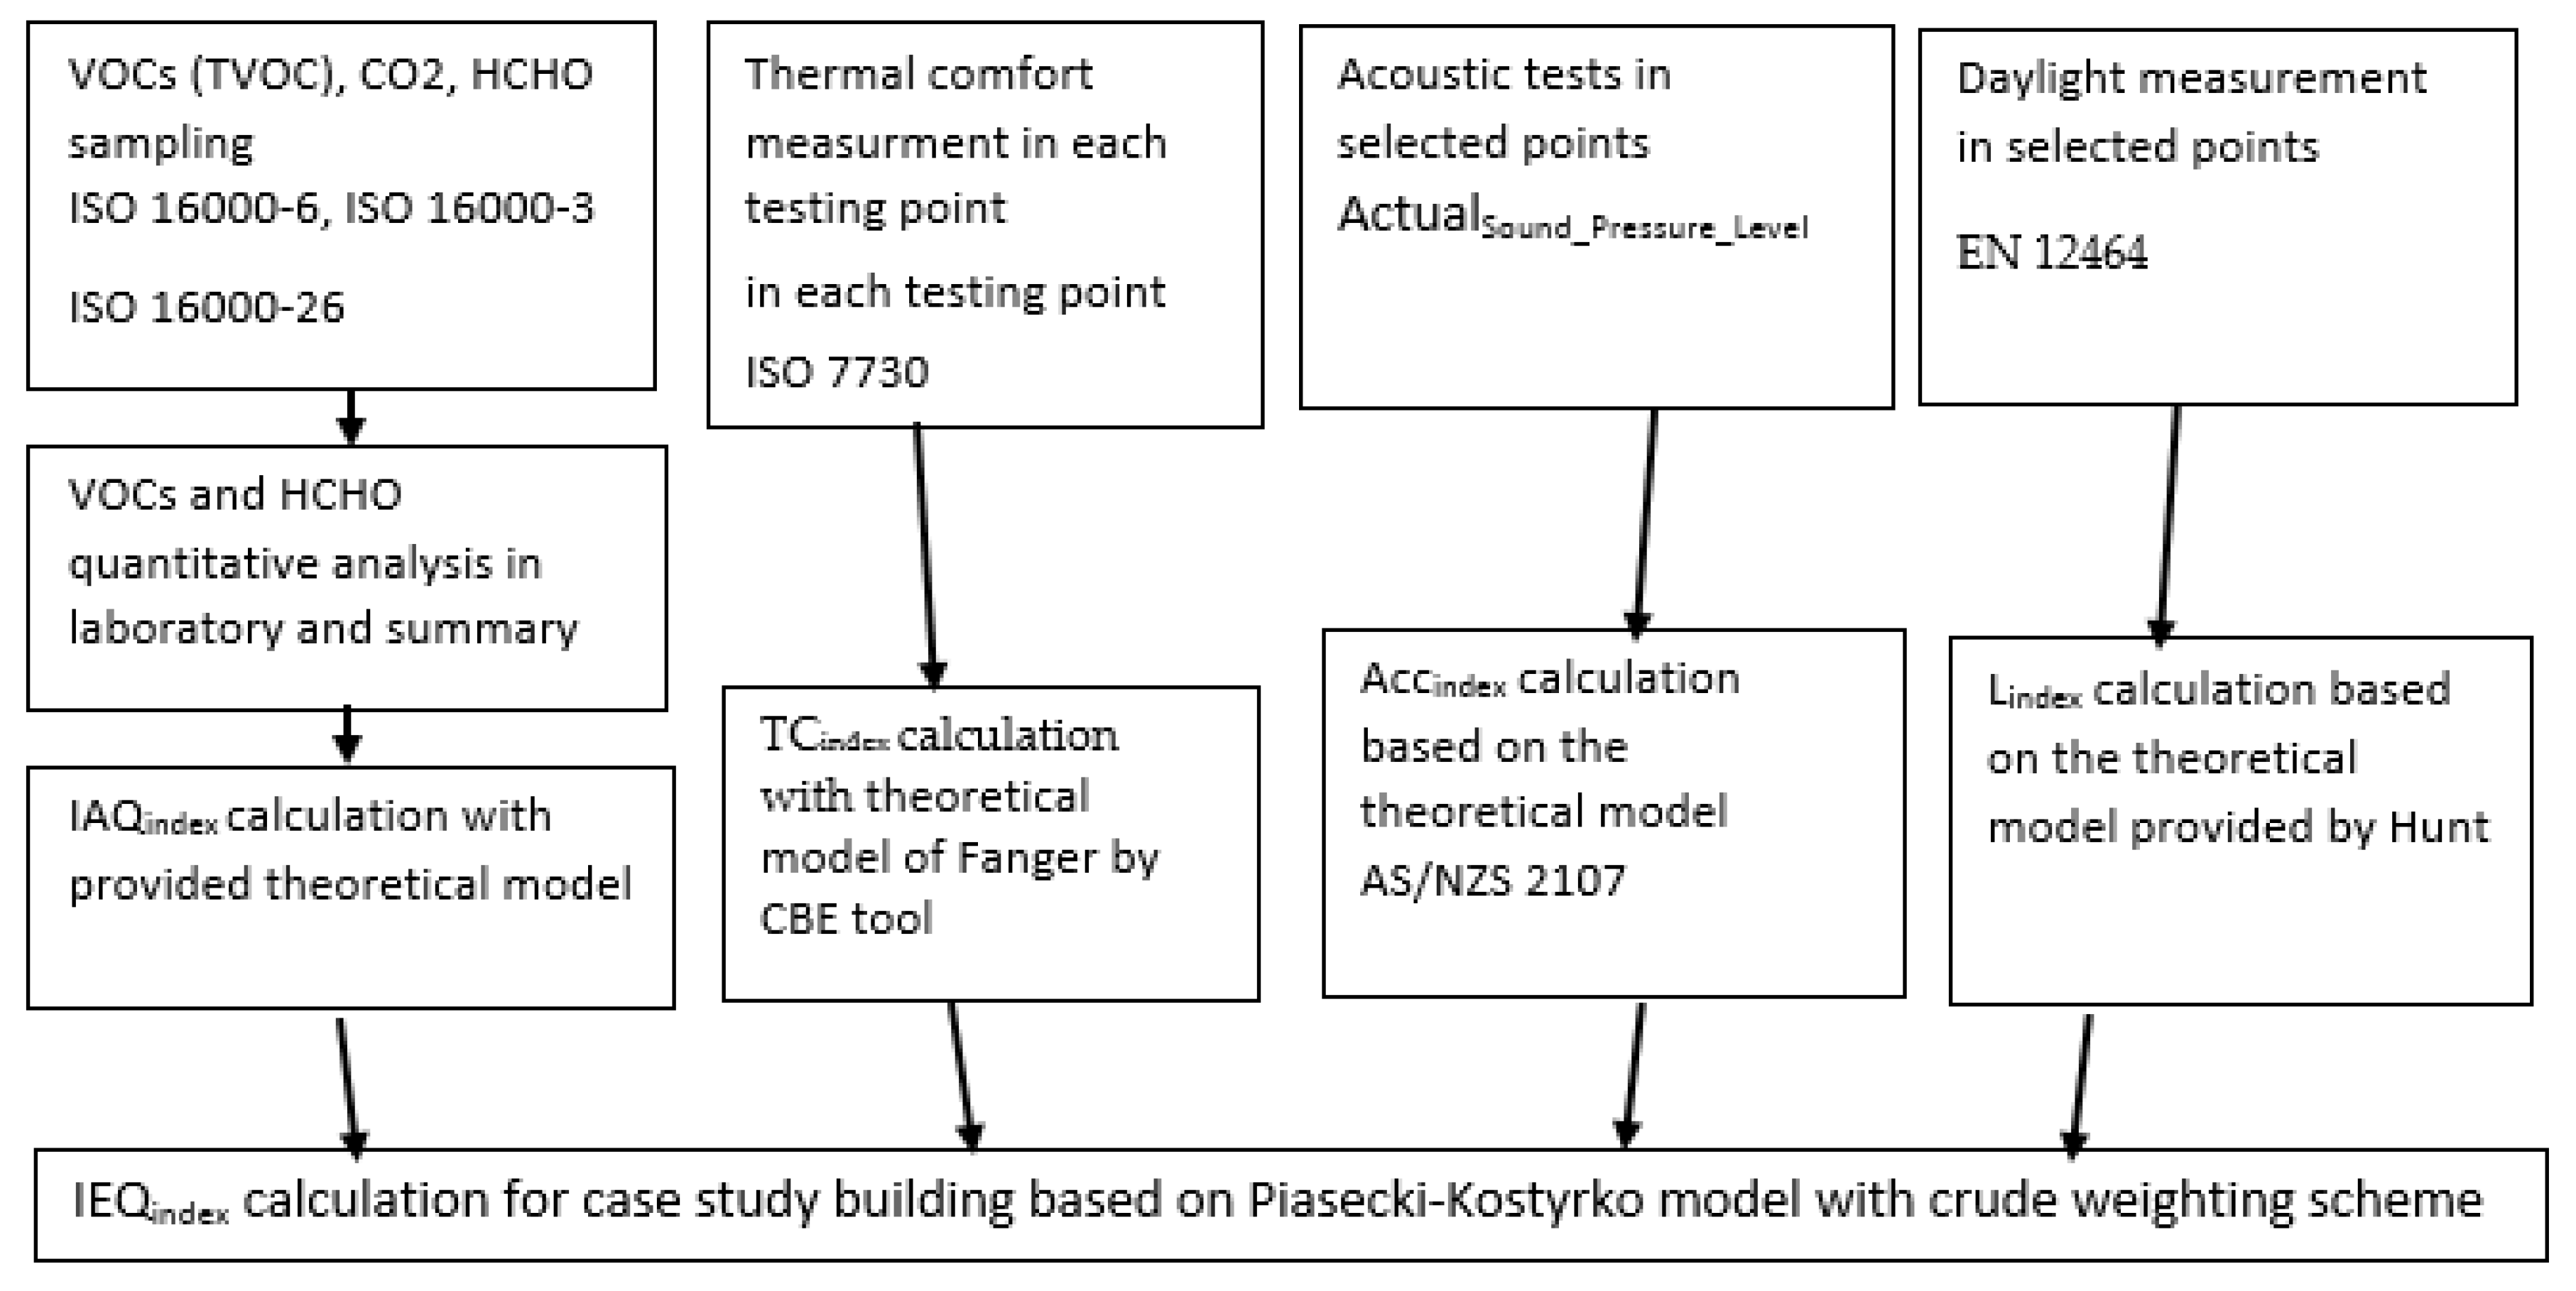
IEQ index refers to the quality of an indoor environment with the measure of predicted occupants satisfied in percentage terms. The morphology of the IEQindex model was used to assess or predict building comfort using four elements: TCindex—thermal comfort index, IAQindex—indoor air quality index, ACcindex—acoustic comfort and Lindex—daylight quality index. Indices were calculated based on the indoor measurements of the physical properties in each of the sub-models in accordance with the IEQ Piasecki–Kostyrko model. Sub-component models were developed and presented in the literature [5,22] based on sensory studies in panel groups. This included research by the author [23,24]. For a physical parameter (e.g., light intensity or volatile organic compound concentration in indoor air), the corresponding satisfaction index was calculated by formulas (1–10) provided in this section. The simplified scheme of the assessment model developed during the period 2016–2019 is presented in Figure 1. The previous version of Figure 1 was published by the authors of [23].
In simplified terms, measurements of the indoor environment based on existing standards were carried out on the building first. Then, they were modelled to obtain IEQ component indices. EN 16798-1:2019 was the main resource for IEQ model creation [5], as it represents an international consensus on the analysis. The approach allowed complex indoor information to be presented as one overall indicator IEQindex. The reliability of the IEQ model, including the uncertainties of measurements and data for this model, was discussed earlier in [22], where the team of Piasecki and Kostyrko presented the internal incongruity analysis of the model structure and the justification for the crude weights method for the components. The IEQindex (in %) was made up of the following four elements (SIi): TCindex, IAQindex, ACcindex, Lindex, including their weights Wi. This led to Equation (1):
IEQindex = Σ Wi·SIi
The crude weighting system was used, where elements were weighted 0.25 for W1–W4, as shown in Equation (2):
The author also adopted a special weighting system for the IAQ sub-component elements and this is provided in another publication (forthcoming). The predicted percentage of satisfaction SIi can be obtained from the dissatisfaction percentage (PD) using Equation (3) [5]
where PD is the expected percentage of occupant dissatisfaction and PD(SIi) is the percentage of occupants dissatisfied with the IEQ sub-component (SIi) level. The authors-performed preliminary metrological analyses on overall IEQ model fitting and these were performed using Monte Carlo tests.
SIi = 100 − PD(SIi)
The basics of the sub-component model for determining thermal performance TCindex were provided almost forty years ago by Fanger and were based on a measured set of indoor thermal environmental parameters. For buildings with a mechanical ventilation system, predicted mean vote indicator, PMV = f(ta, tmr, va, pv, M and Icl) was recommended as a reference parameter for thermal environmental assessment. Percentage of dissatisfied occupants with thermal comfort may be calculated from a PMV value. The Fanger function PDTC = f(PMV) (as provided in ISO 7730) was slightly corrected for NZEBs by the experimental approach and the author provided the dependence expressed by Equation (4) [14]:
PDTC = 100 − 99.9·exp(−0.0355·PMV4 − 0.242·PMV2)
For a practical reasons, the values of PMV and PD = f(PMV) may be provided by a measurement device (often included in an algorithm in a device computer) or may be assessed easily by open source tools like http://comfort.cbe.berkeley.edu/EN.
In environments where occupants were an important source of air contamination, it was recommended to calculate the percentage of occupants dissatisfied with IAQ (as a function of pollutant concentrations). For the main representative pollutant, which was CO2, 350 ppm were taken as the typical outdoor concentration of CO2. The PD = f(CCO2) function was slightly corrected by the experimental approach and the author provided experimental dependence expressed by Equation (5) [5]:
where CCO2 is CO2 concentration above outdoor levels in ppm.
PDCO2 = 407·exp(−15.05·CCO2−0.25)
CO2 shouldn’t be used alone for IAQ assessment. It does not represent other sources of indoor pollution, such as volatile compounds (VOCs) emission from construction materials, for example: Paints, fittings, finishinngs, carpets, renders, furniture, wood tiles, textiles and covering materials. Where the main air pollution impact may come from is construction products, PD = f(cTVOC) is also used for IAQ assessment. The Weber–Fechner theory was a starting point for model development based on large-scale experiments and the author of [23] proposed an equation for percentage of dissatisfaction with TVOC concentration, as shown in Equation (6):
PDTVOC = 405·exp(−11.3·CTVOC−0.25)
Another factor frequently considered in IAQ an analysis is formaldehyde (HCHO) concentration in indoor air, which until recently was the main component of wood adhesives and wood-based panels. For such concentrations, Piasecki and Kostyrko proposed the use of the equation taken from the work of Zhu and Li (2017) [24] based on the analysis of ‘health effects on the human body’, derived from indoor air quality comfort evaluation experiments and the literature. This is shown in Equation (7):
Equation (7) links the value of the new unit, ‘the effect of HCHO on human comfort’, called PMVHCHO, with its indoor cHCHO concentration (mg/m3). It covers the range from 10 µg/m3 to 320 µg/m3 and, as declared by the author, this value has the same qualities as PMV thermal comfort, which can be converted into a PD unit according to Equation (8):
PDHCHO = 100 − 95 · exp(−0.03353·PMV4 − 0.2179·PMV2)
For the purpose of determining acoustic comfort, the team of Kostyrko and Piasecki suggested using the New Zealand standard provisions [9,25] that show the approach for the people dissatisfied (PDACc) assessment calculation based on the increase in A-weighted sound level (measured) LAeq beyond design value. The equation for the PDACc calculation is given by Equation (9) [25]:
and the calculated result is the percentage of dissatisfaction in % PD(ACc).
PDAcc = [2(LAeq actual sound_ level − LDesignLevel )]
The function of daylight luminance Emin [lux] and the predicted percentage of dissatisfied occupants was calculated with Equation (10) provided by Hunt [26]:
PDL = {−0.018 + 1.036/{1 + exp(+4.08(log10(Emin) − 1.82))}
Lindex was analysed by daylight luminance measuring Emin in lux, using Equations (10) and (3).
2.3. The Case Study Building—Location, Weather and Technical Data
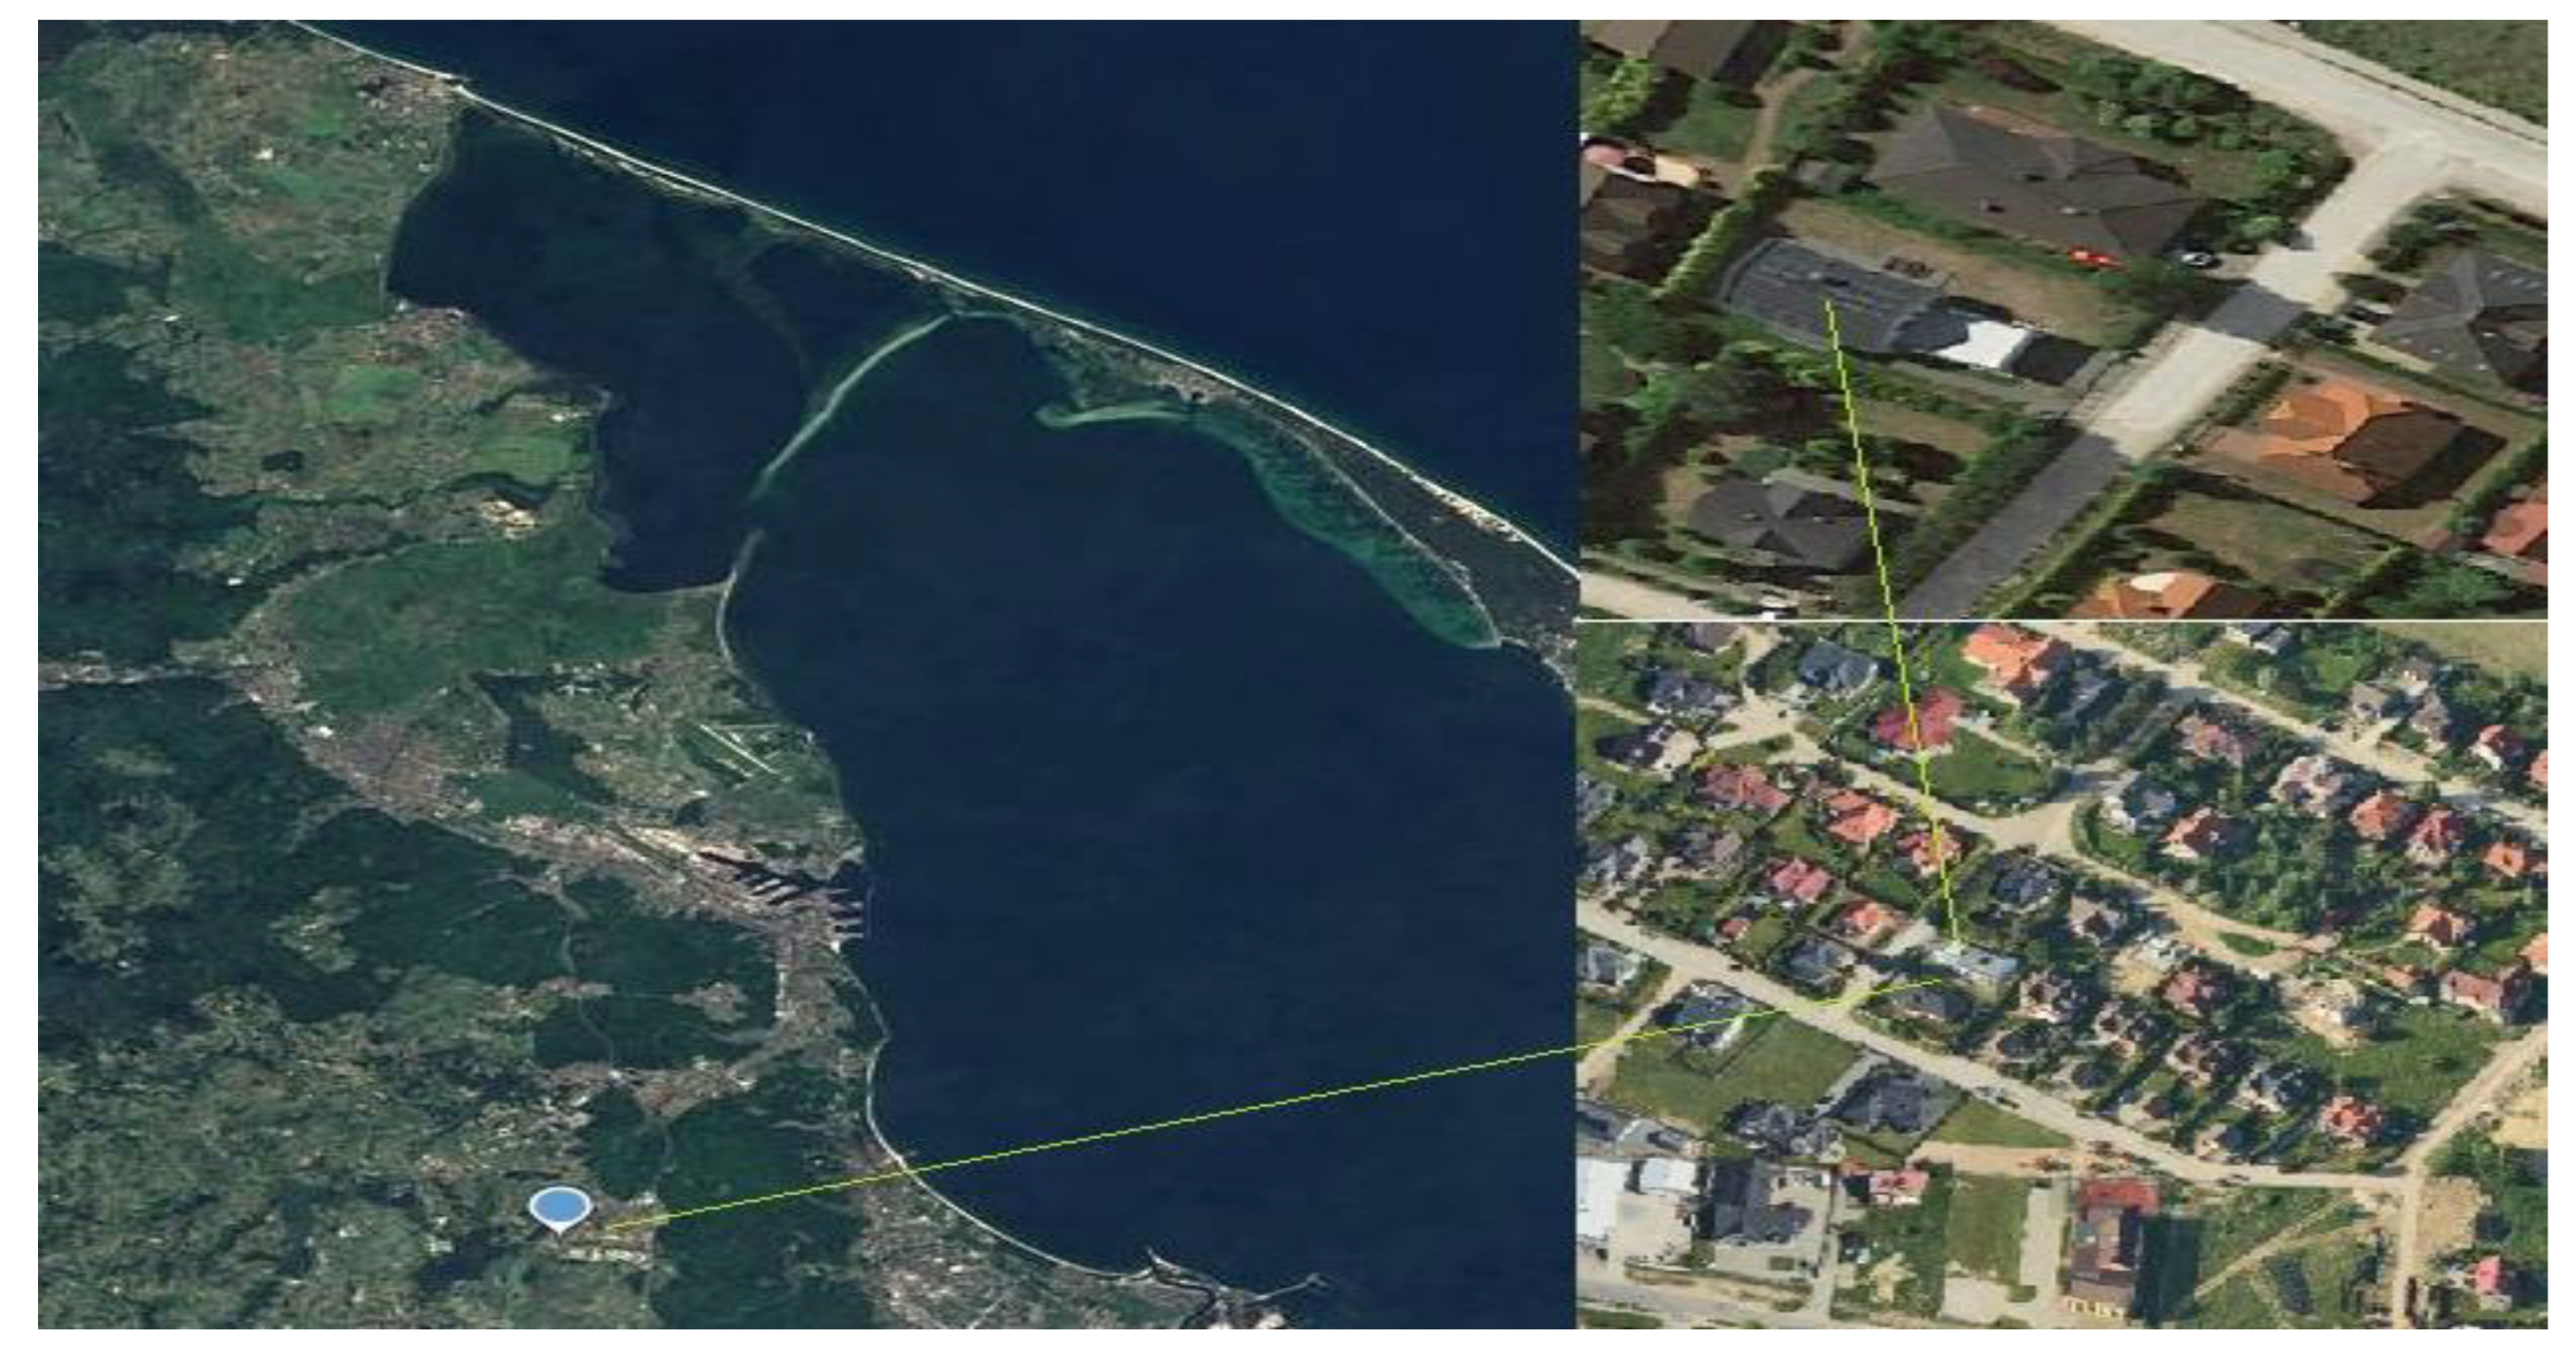
Geographically, the area where the case-study building is located belongs to the Upland, which is part of the mesoregion of the Kashubian Lake District. It stretches over a flat area about 140 m above sea level. The boundaries of the district, determined by the arrangement of natural conditions, are as follows: From the west—a complex of two lakes: Osowski (1375 × 337 m, area: Approx. 24 ha) and Wysocki (1875 × 260 m, area: Approx. 41 ha) and green lands; from the north and east these forest areas belonging to Landscape Park; south of Barniewice—flat areas. The author used the motives for describing the location of the object included in the study in [27]. The location of the case study building with its surrounding is provided in Figure 2.
The climate of the case study building region depends on the sea (about 15 km to the coast), which works like a heat pump; in the summer it receives heat and in the winter, it releases it. The climate in this area has been classified as marine climate Cfb according to the Köppen–Geiger system. As a result, spring begins relatively late (in April), summer air temperatures are lower than the national average (the felt temperature is further lowered by the sea breeze) although the sun strongly heats the water in the close by bay (up to 24 °C). The autumn warm and full of sunshine lasts until October, while the winters are rather mild (in some winter months there is no frost day and more significant snowfall usually does not persist much longer than two weeks a year). The winds blow from different sides depending on the season: In summer, most often from the west and northwest, in winter from the mainland. Stormy winds are also characteristic of the coast, which generally blow in the winter and reach dizzying speeds. The rainfall is significant even in the driest month. In the case study location, the average annual temperature is 6.7 °C. About 541 mm of rainfall occurs annually. The driest month is February, with 23 mm of rain. Most precipitation falls in August with an average of 68 mm. July is the warmest month of the year. The average temperature in July is 16.2 °C. January is the coldest month, with temperatures around –2.5°C. Annual solar radiation is approx. 990 kWh/(m2year). Table 1 presents monthly statistics for dry bulb temperatures for the case study (°C) and precipitation levels. The following information is derived directly from source weather data, located about 10 km from the case study building. Data is publicly open and provided by climate.onebuilding.org.
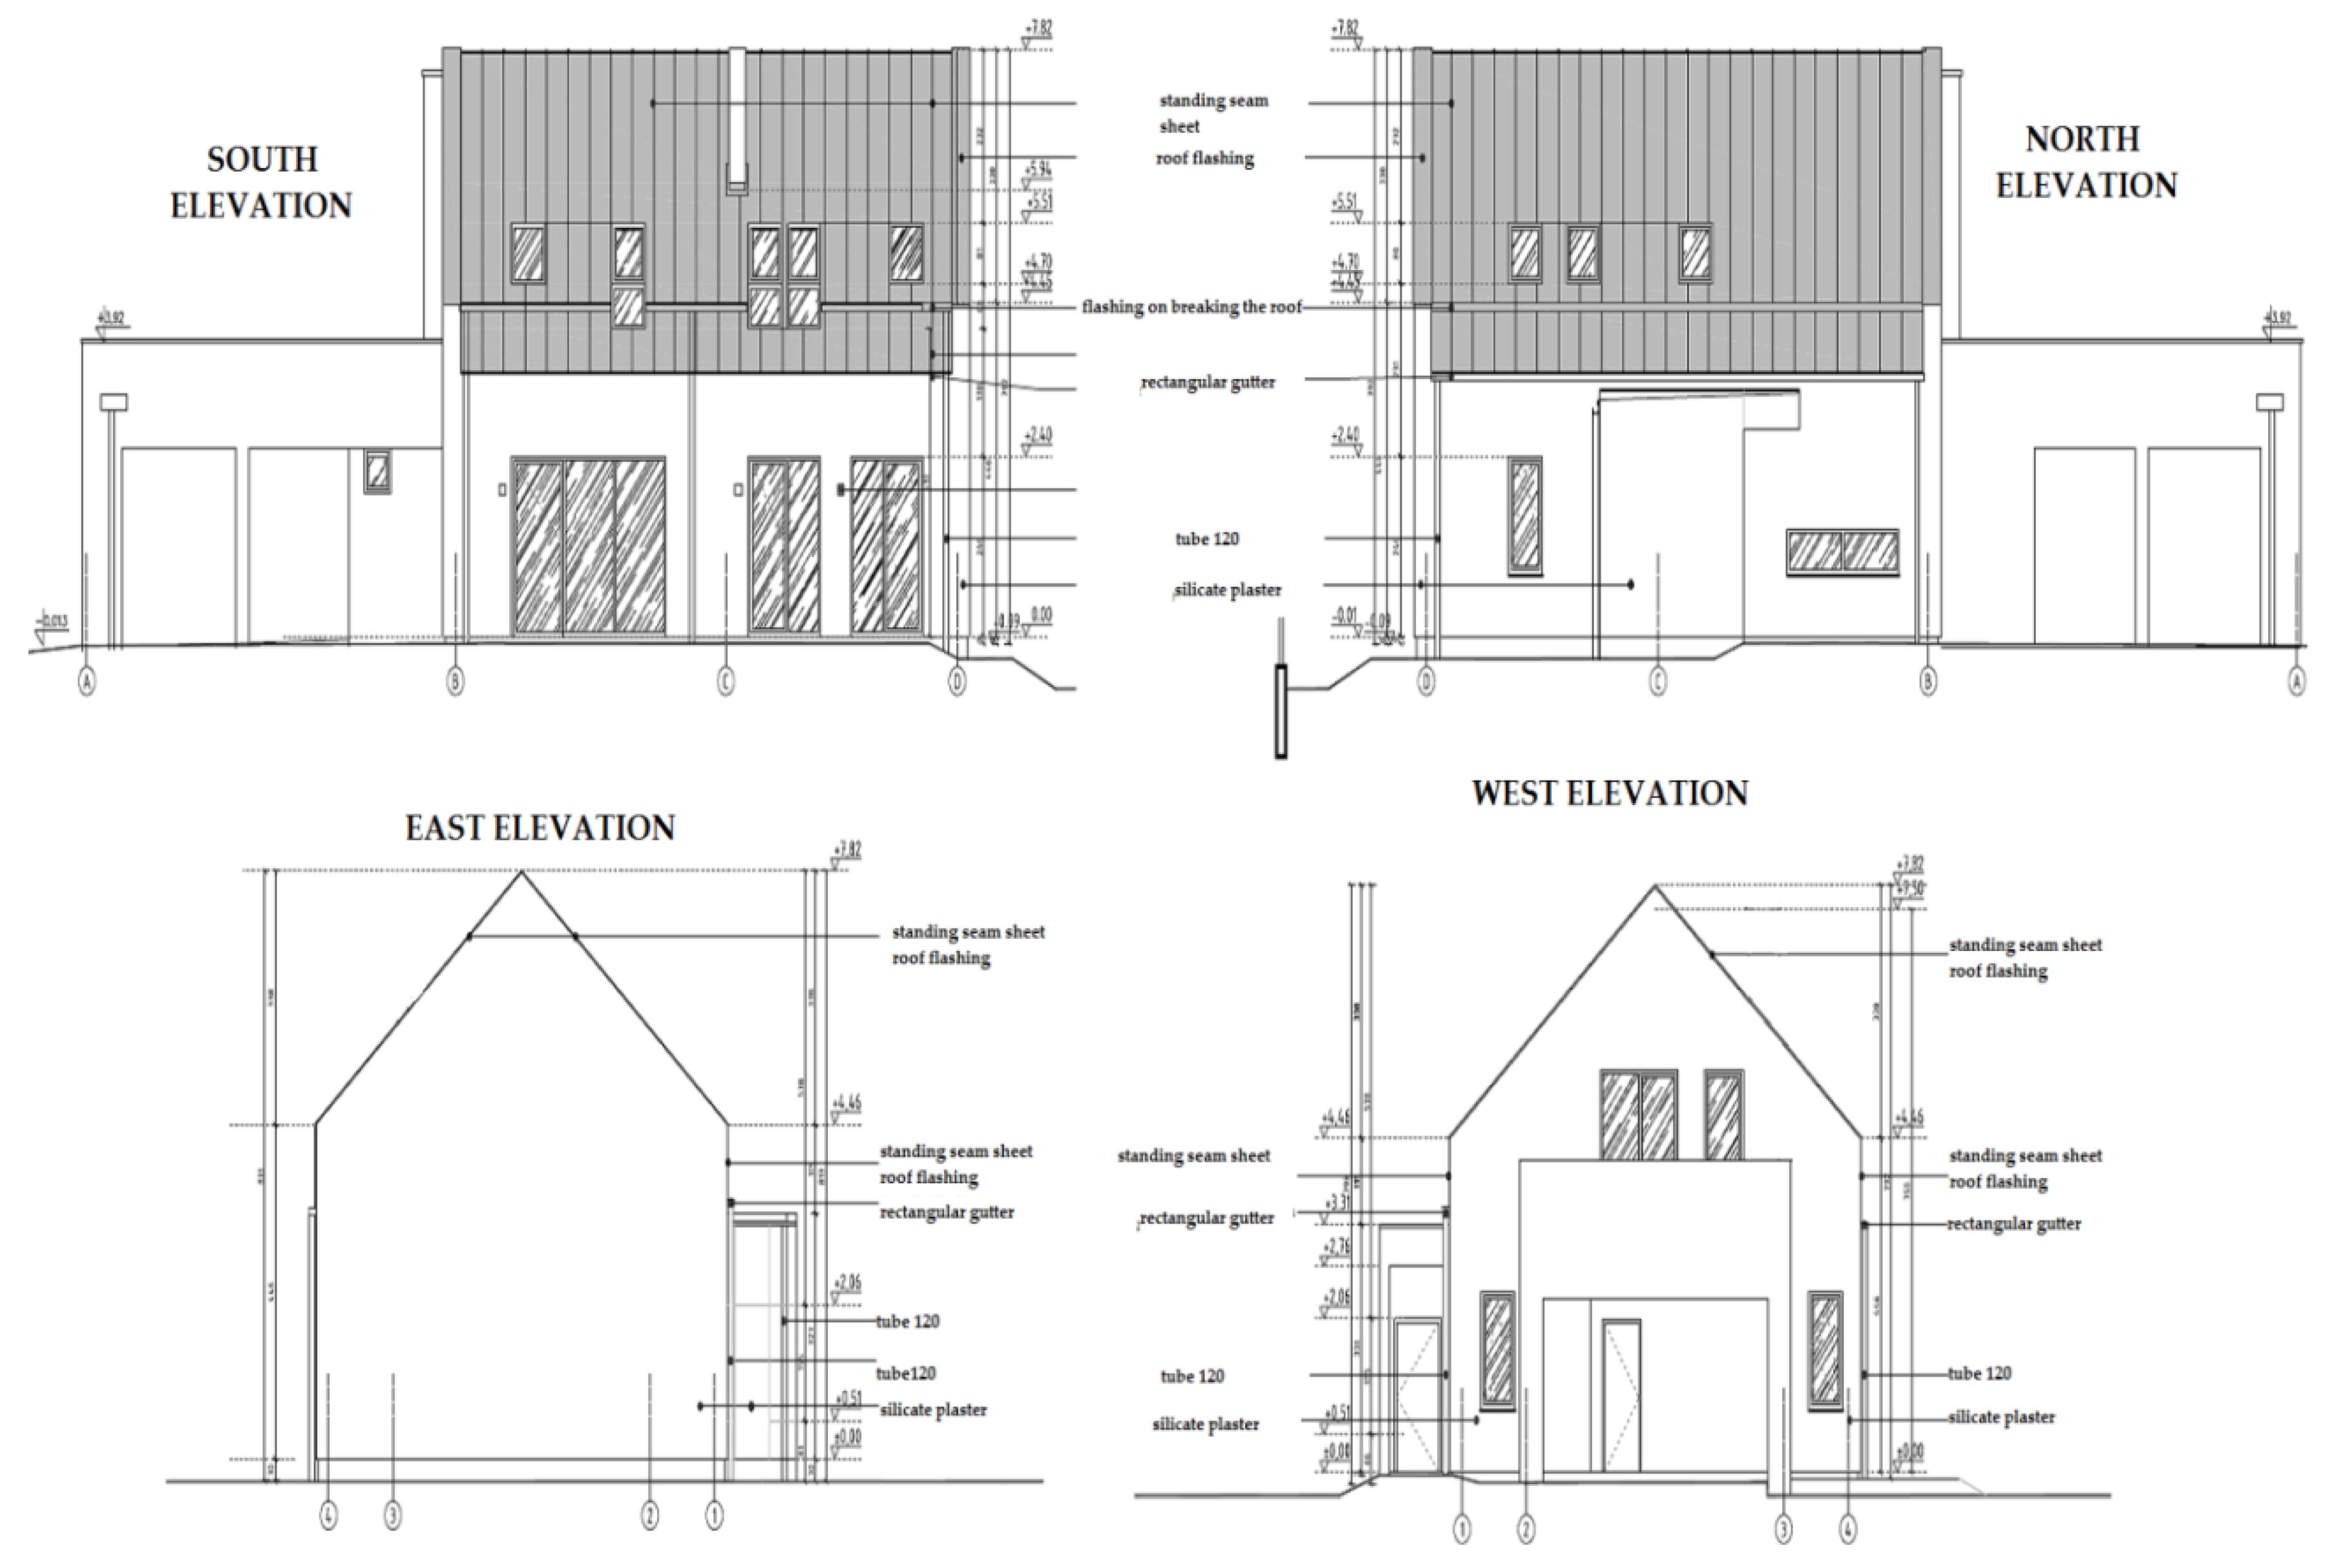
The experimental investigation was carried out for a single-family detached building for one family (two adults + two kids). This building was erected taking into account the following standards: A passive house, an indoor comfort standard (EN 15251, category I–II), and cost-optimal requirements and national standards for thermal performance (NF15 and National Building Code WT2017). The building is a residential building, one-storey, without a basement. It is covered with a symmetrical sloping roof with a 35° inclination angle. The building plot area size is 645 m², the building volume is 796 m3 with a total space area of 250.4 m². The usable area is 176.2 m². The number of floors above ground is two and the building height is 7.98 m. The views of the facade are shown in Figure 3. The building is open to daylight from the south and closed from the north and east sides, where there are no living or rest rooms but bathrooms, the kitchen and technical rooms, such as wardrobes.
The source of heat and heated water in the home is the energy contained in the ground, taken in and processed by the heat pump (vertical). Internal installations used in the building are: A water installation (domestic net), sanitary installation (with a waste water treatment plant), floor heating, installation of mechanical ventilation with heat recuperation, electrical installation (grid + PV cells 1.0 kW), lighting (light-emitting diodes (LED) systems) and a tele-technical installation. Heat and ventilation systems are supplemented by recuperation, which recovers heat from the mechanical circulation of air in the building. These systems are almost energy-independent. Energy to their power supply may come from the photovoltaic cells mounted on the roof of the building. The building has no integrated cooling system. A shed with a flat roof (used as a garage) was added to the building, fulfilling the function of a terrace (floor I). The surface area of the residential building and sheds is 175.1 m2. In relation to the plot area of 645 m2, this is 27.1%. The biologically active area (grass lawn of 243m2 and semi grass/gravel lawn of 132 m2) is about 58.1%. The plot also has ten trees with an area of crowns of about 22.5 m2, which are actually not shading the windows. Table 2 presents the number of building elements with their properties related to thermal conductivity. The building uses elements with high thermal parameters, dictated by the applicable standards of energy efficiency (national NF-15 standard).
The calculated annual energy demand for heating and ventilation QH,nd was 4355 kWh/year while the designed operational temperature was 20 °C, the area of rooms with adjustable temperature was 163.5 m2 (Af), and the expected thermal loads of rooms with internal gains were 2.5 W/m2. Total design ventilation air flow rate was 300 m3/h (Category I in accordance to EN 16798), about 0.4 exchange rate per hour. Ventilation central LWZ 370 provided a maximum of 400 m3/h. Annual domestic hot water energy demand, QW,nd, was 2466 kWh/year where: The specific heat of the water was 4.19 kJ/kgK, the designed temperature of hot water was 45 °C, the designed temperature of cold water was 10 °C, and the expected daily consumption of hot water was 35 dm3 per person. The assumed heat pump efficiency for energy performance calculation was 3.0. Energy for auxiliary equipment for heat and ventilation was 1312.75 kWh/year, and the energy for auxiliary equipment for the hot water system was 65.39 kWh/year. Table 3 shows the summary of annual primary and end-use energy calculation results for the building. The annual primary energy comparison (QP = QP, H + QP, W) was 12.042 kWh/year, the final (end-use) energy consumption EK was 16.1 kWh/(m2 year), and the annual calculation demand for non-renewable primary energy for heating, ventilation and hot water EP (QP/Af) was 73.7 kWh/(m2 year).
Occupant comfort connected to the indoor air quality IAQ was affected by the finishing materials emitting VOCs. A list of basic construction and finishing materials is presented in Table 4. In the choice of materials, attention was paid to low-emission materials (plasters, paints, adhesives) and products with higher acoustic values.
The monthly cost of maintaining a house (heating of the building and utility water, as well as electricity and waste disposal) was about 60 Euro. The construction technology adopted in the house met the requirements of the National Fund (NFOŚ) program, under which it was possible to obtain co-financing for the construction of a single-family house with the relevant energy standard.
During the experiment, the building was at pre-occupant stage, with finished interiors but no furniture. During the measurements, there were four people inside and the mechanical ventilation was active (about 290 m3/h).
2.4. Location of Measuring Points
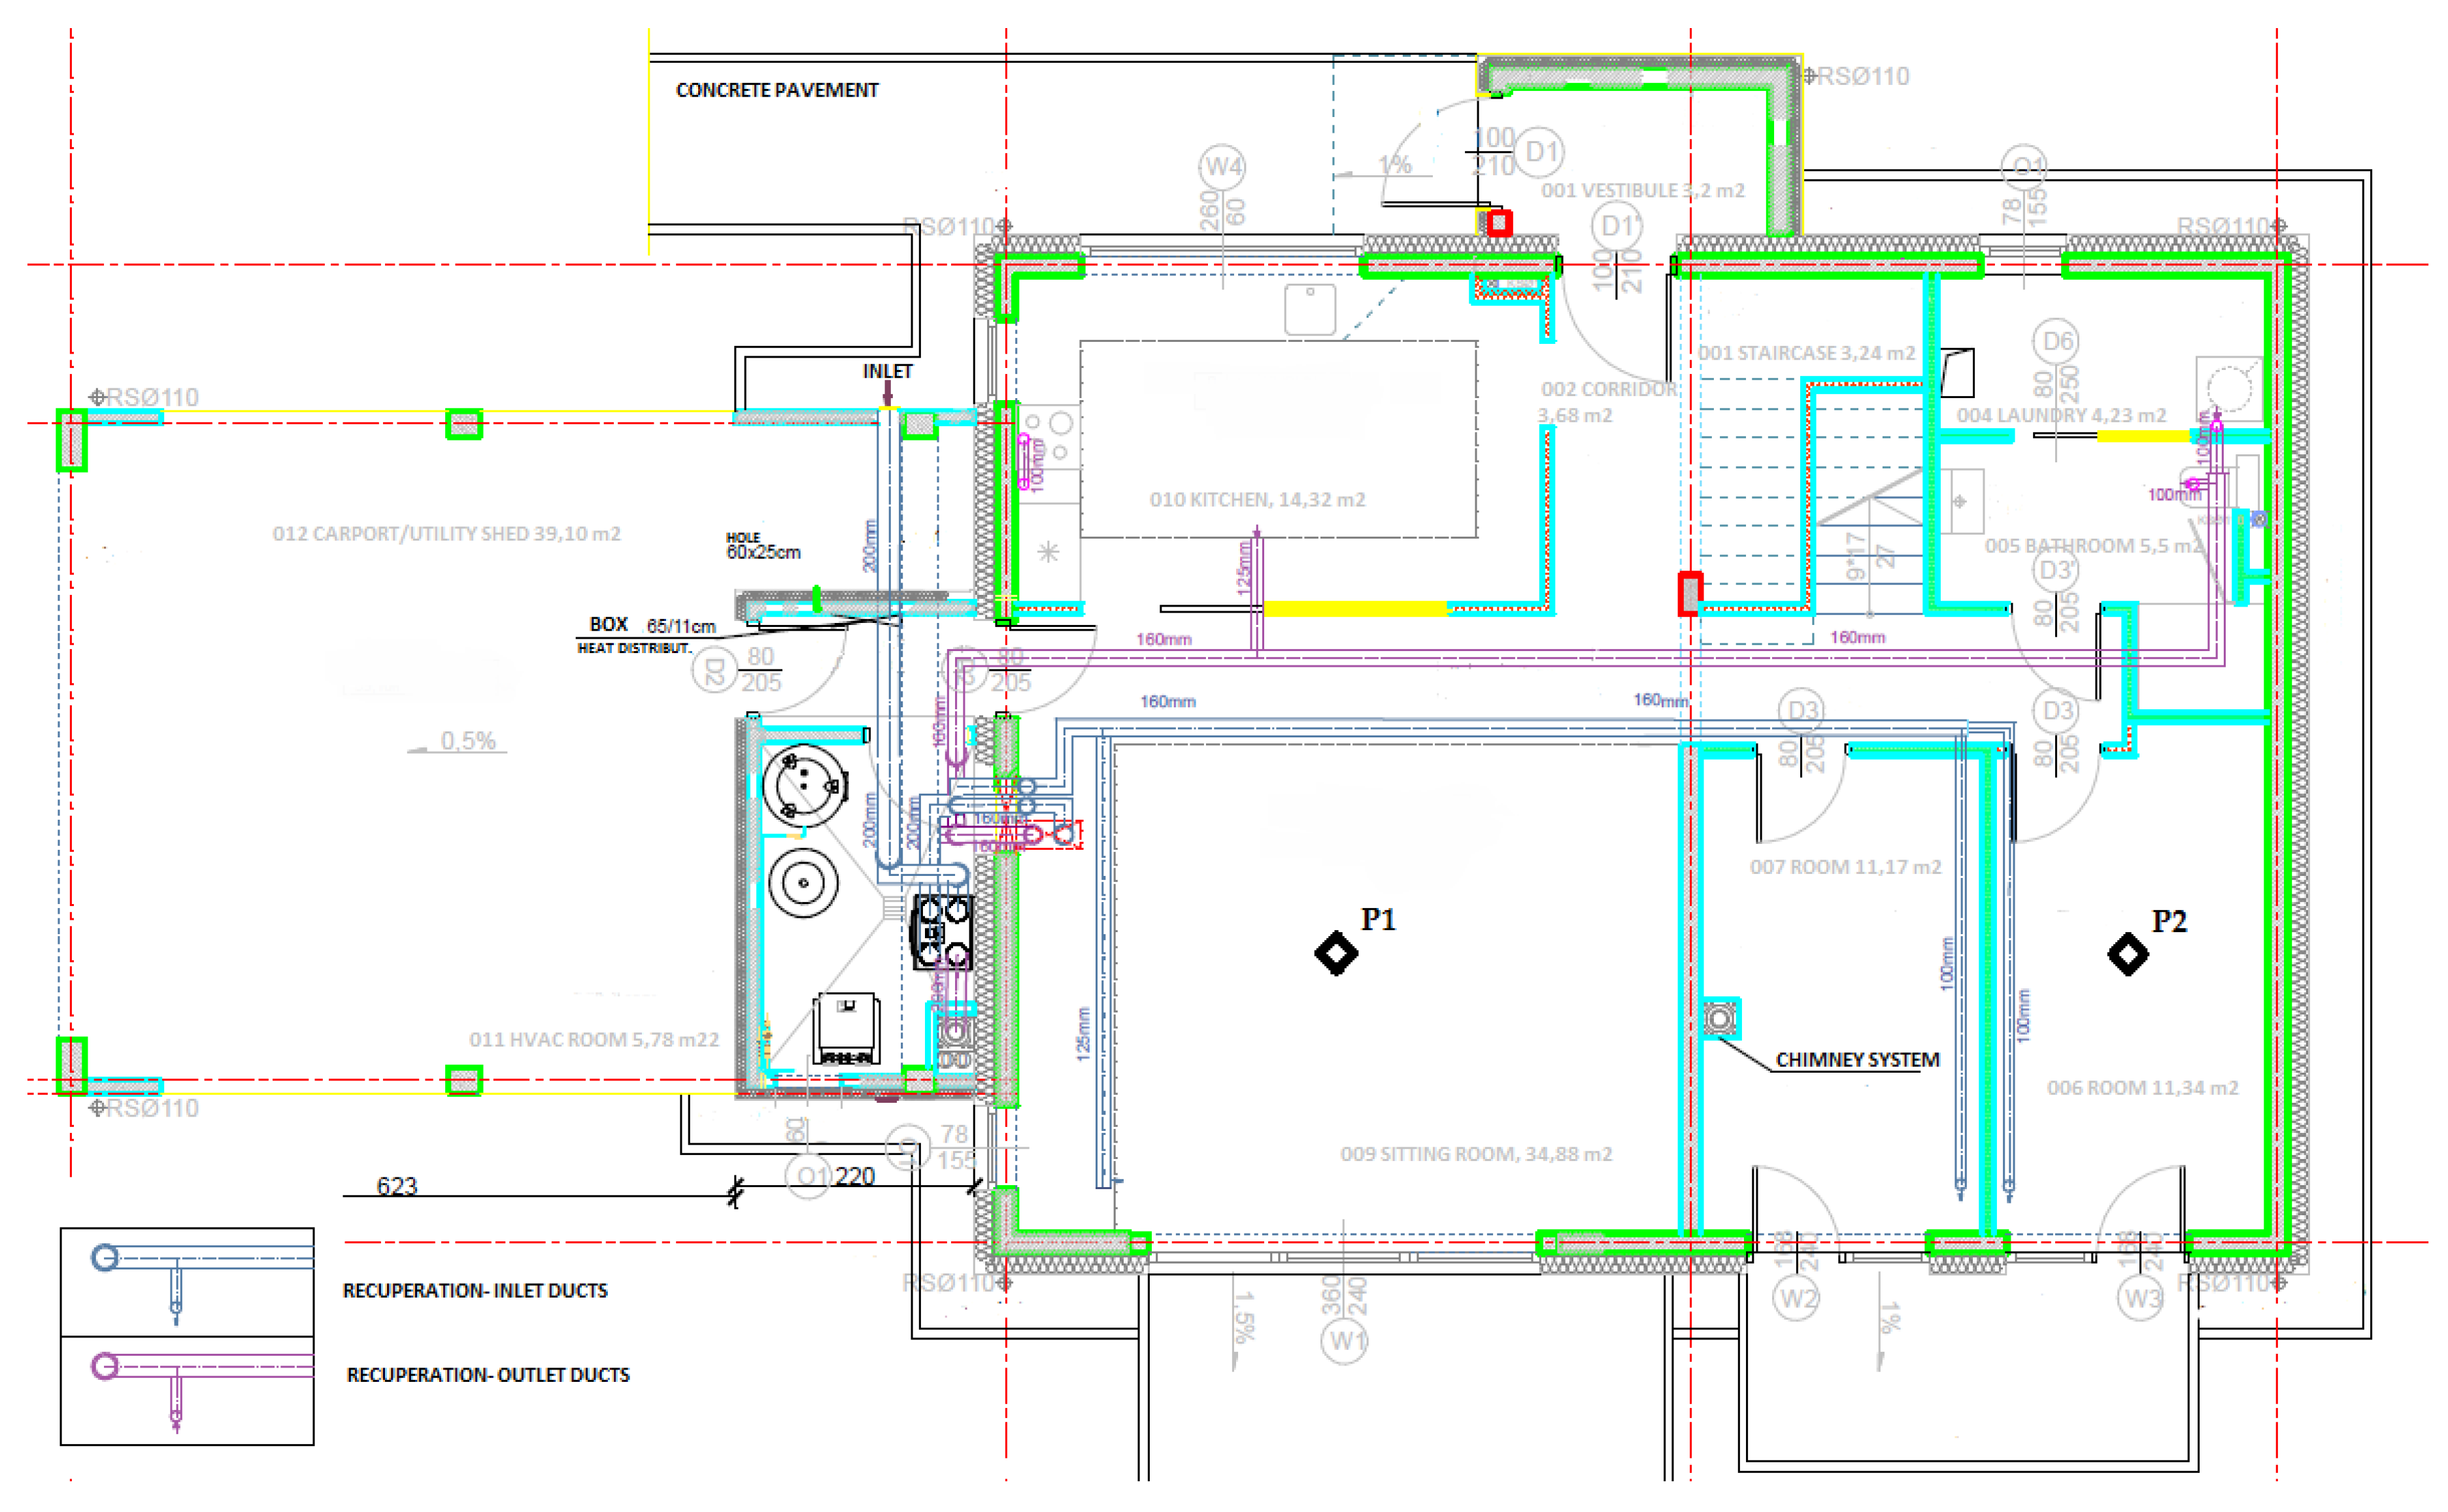
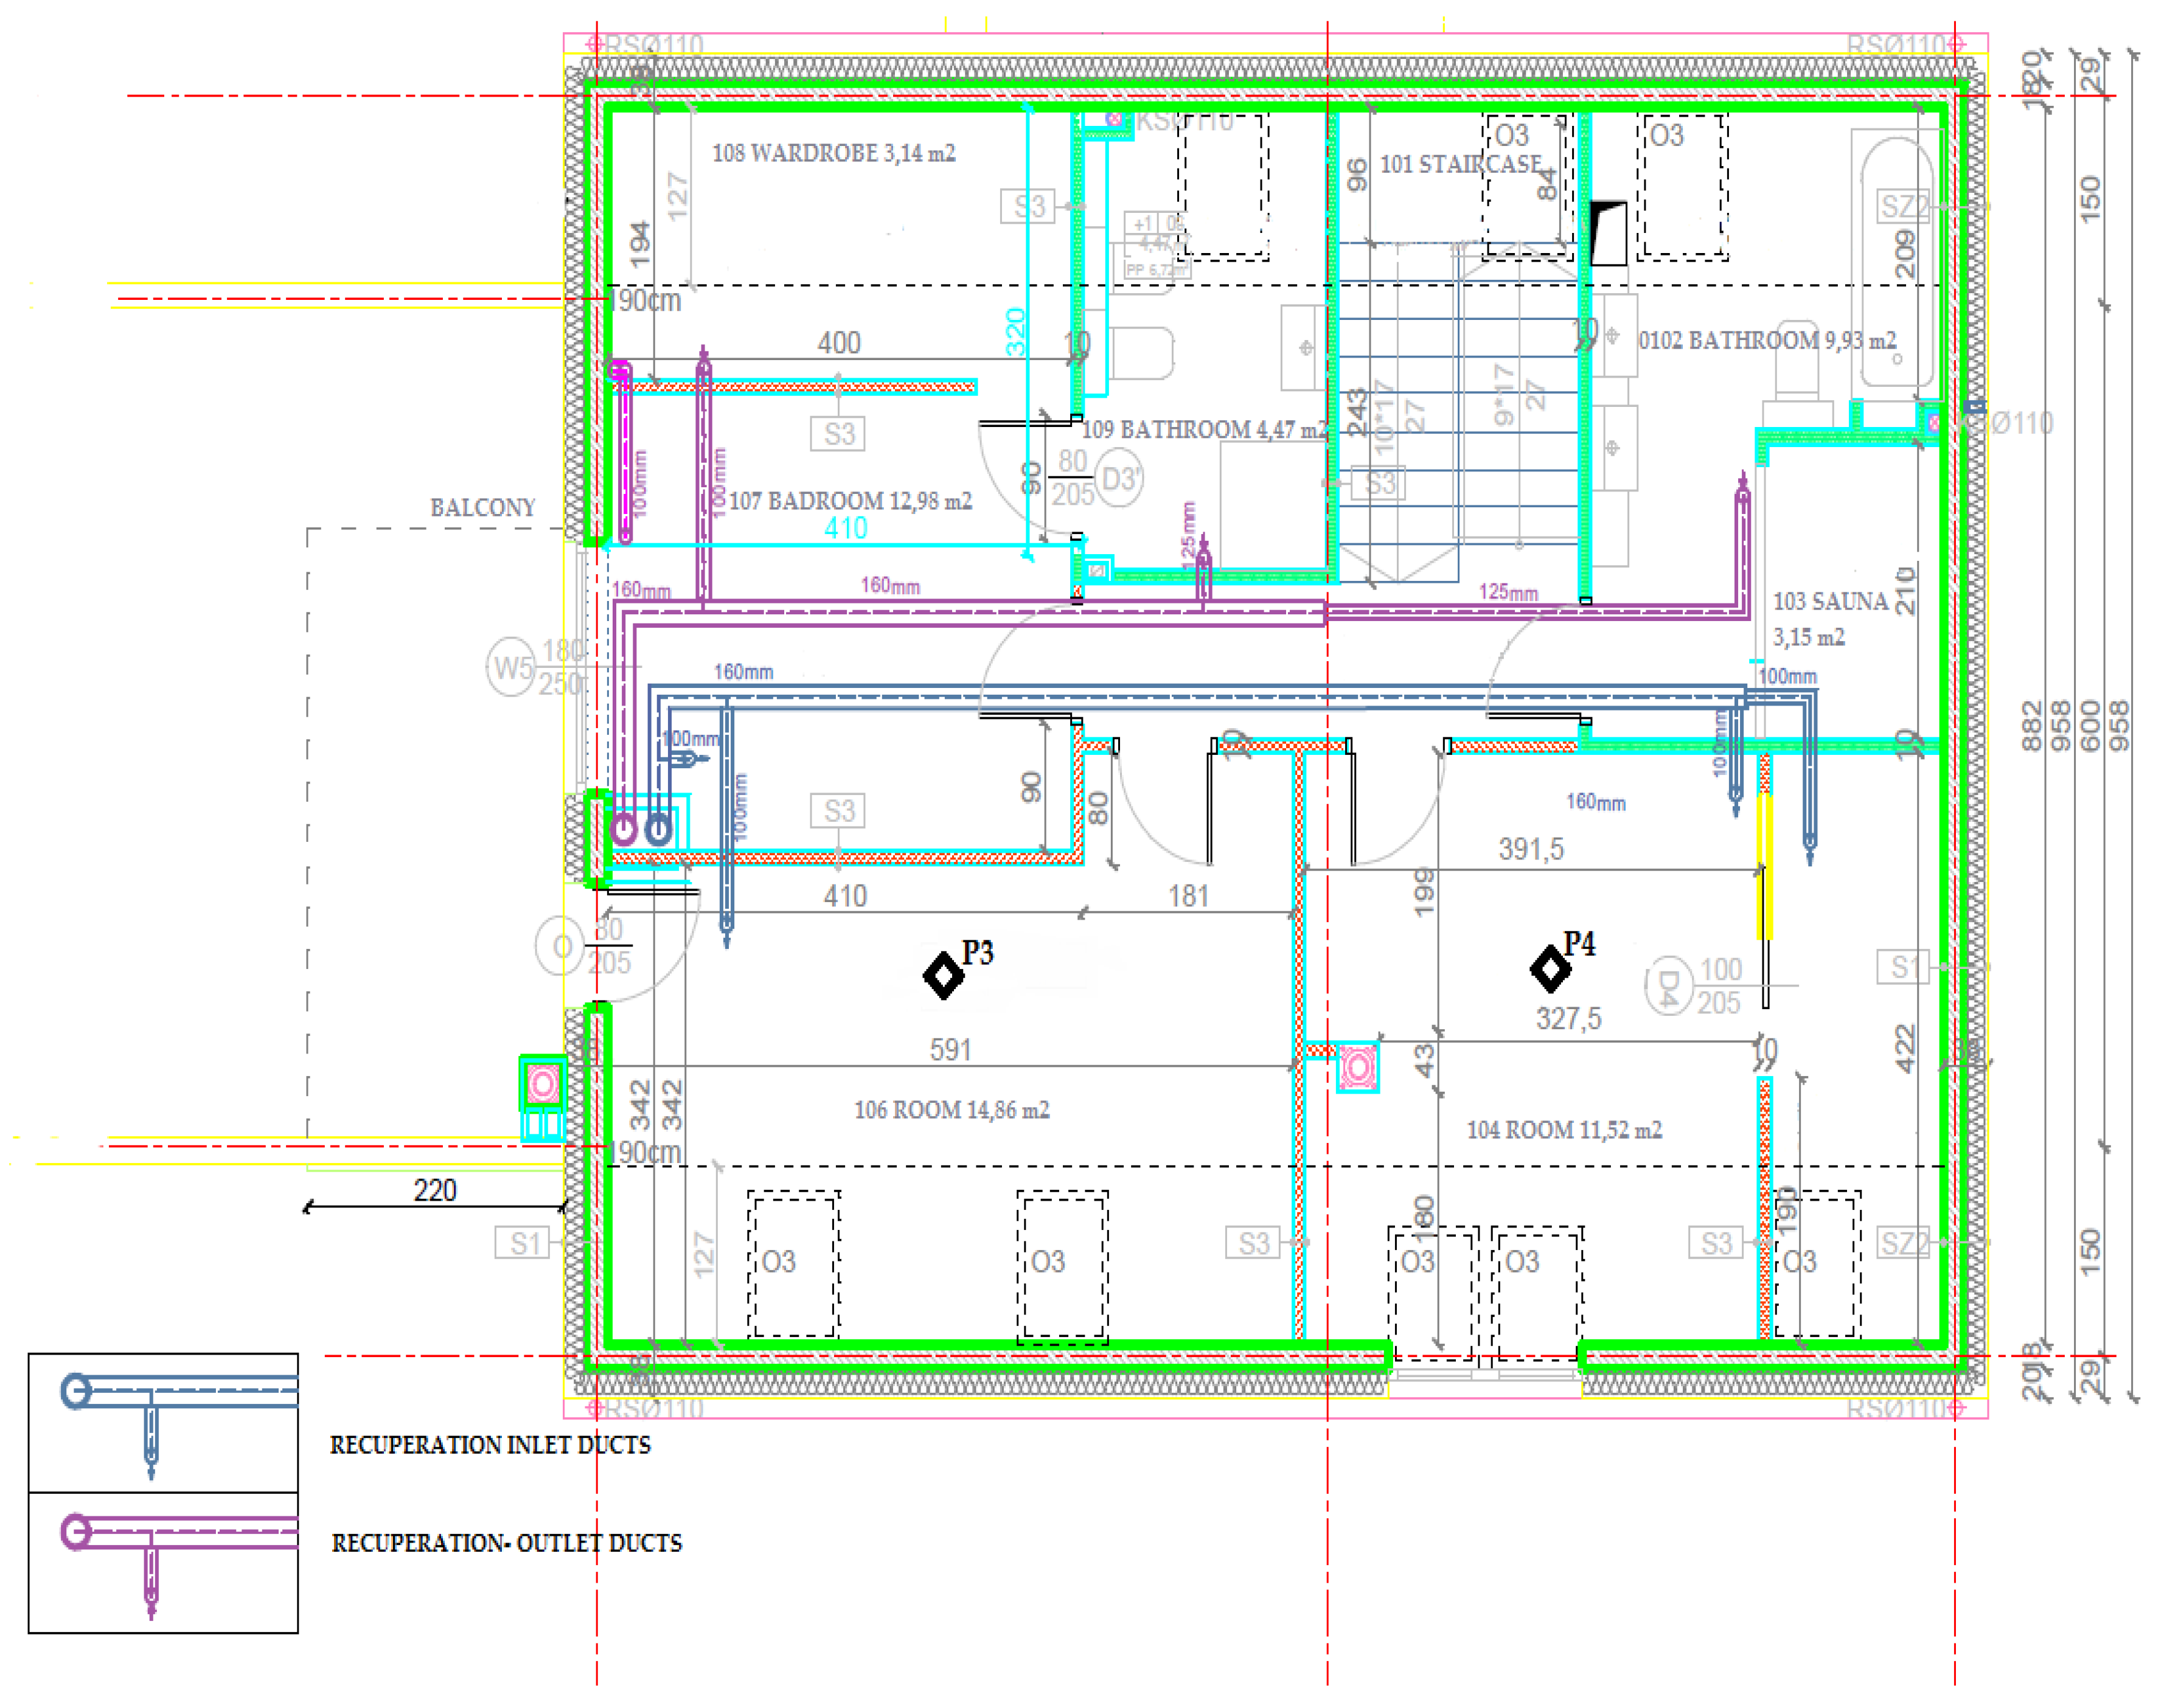
Indoor environmental measuring points (P1–P4) were located on the ground floor and first floor of the building (Figure 4 and Figure 5, black dots). Points were located in living rooms in which residents spent most of their time (south). Points were located in the middle of rooms, two upstairs and two downstairs within 3 m from the windows of the building. All measuring devices were placed at the measuring points and measurements were made in situ.
2.5. Equipment and Experimental Tests Methodology
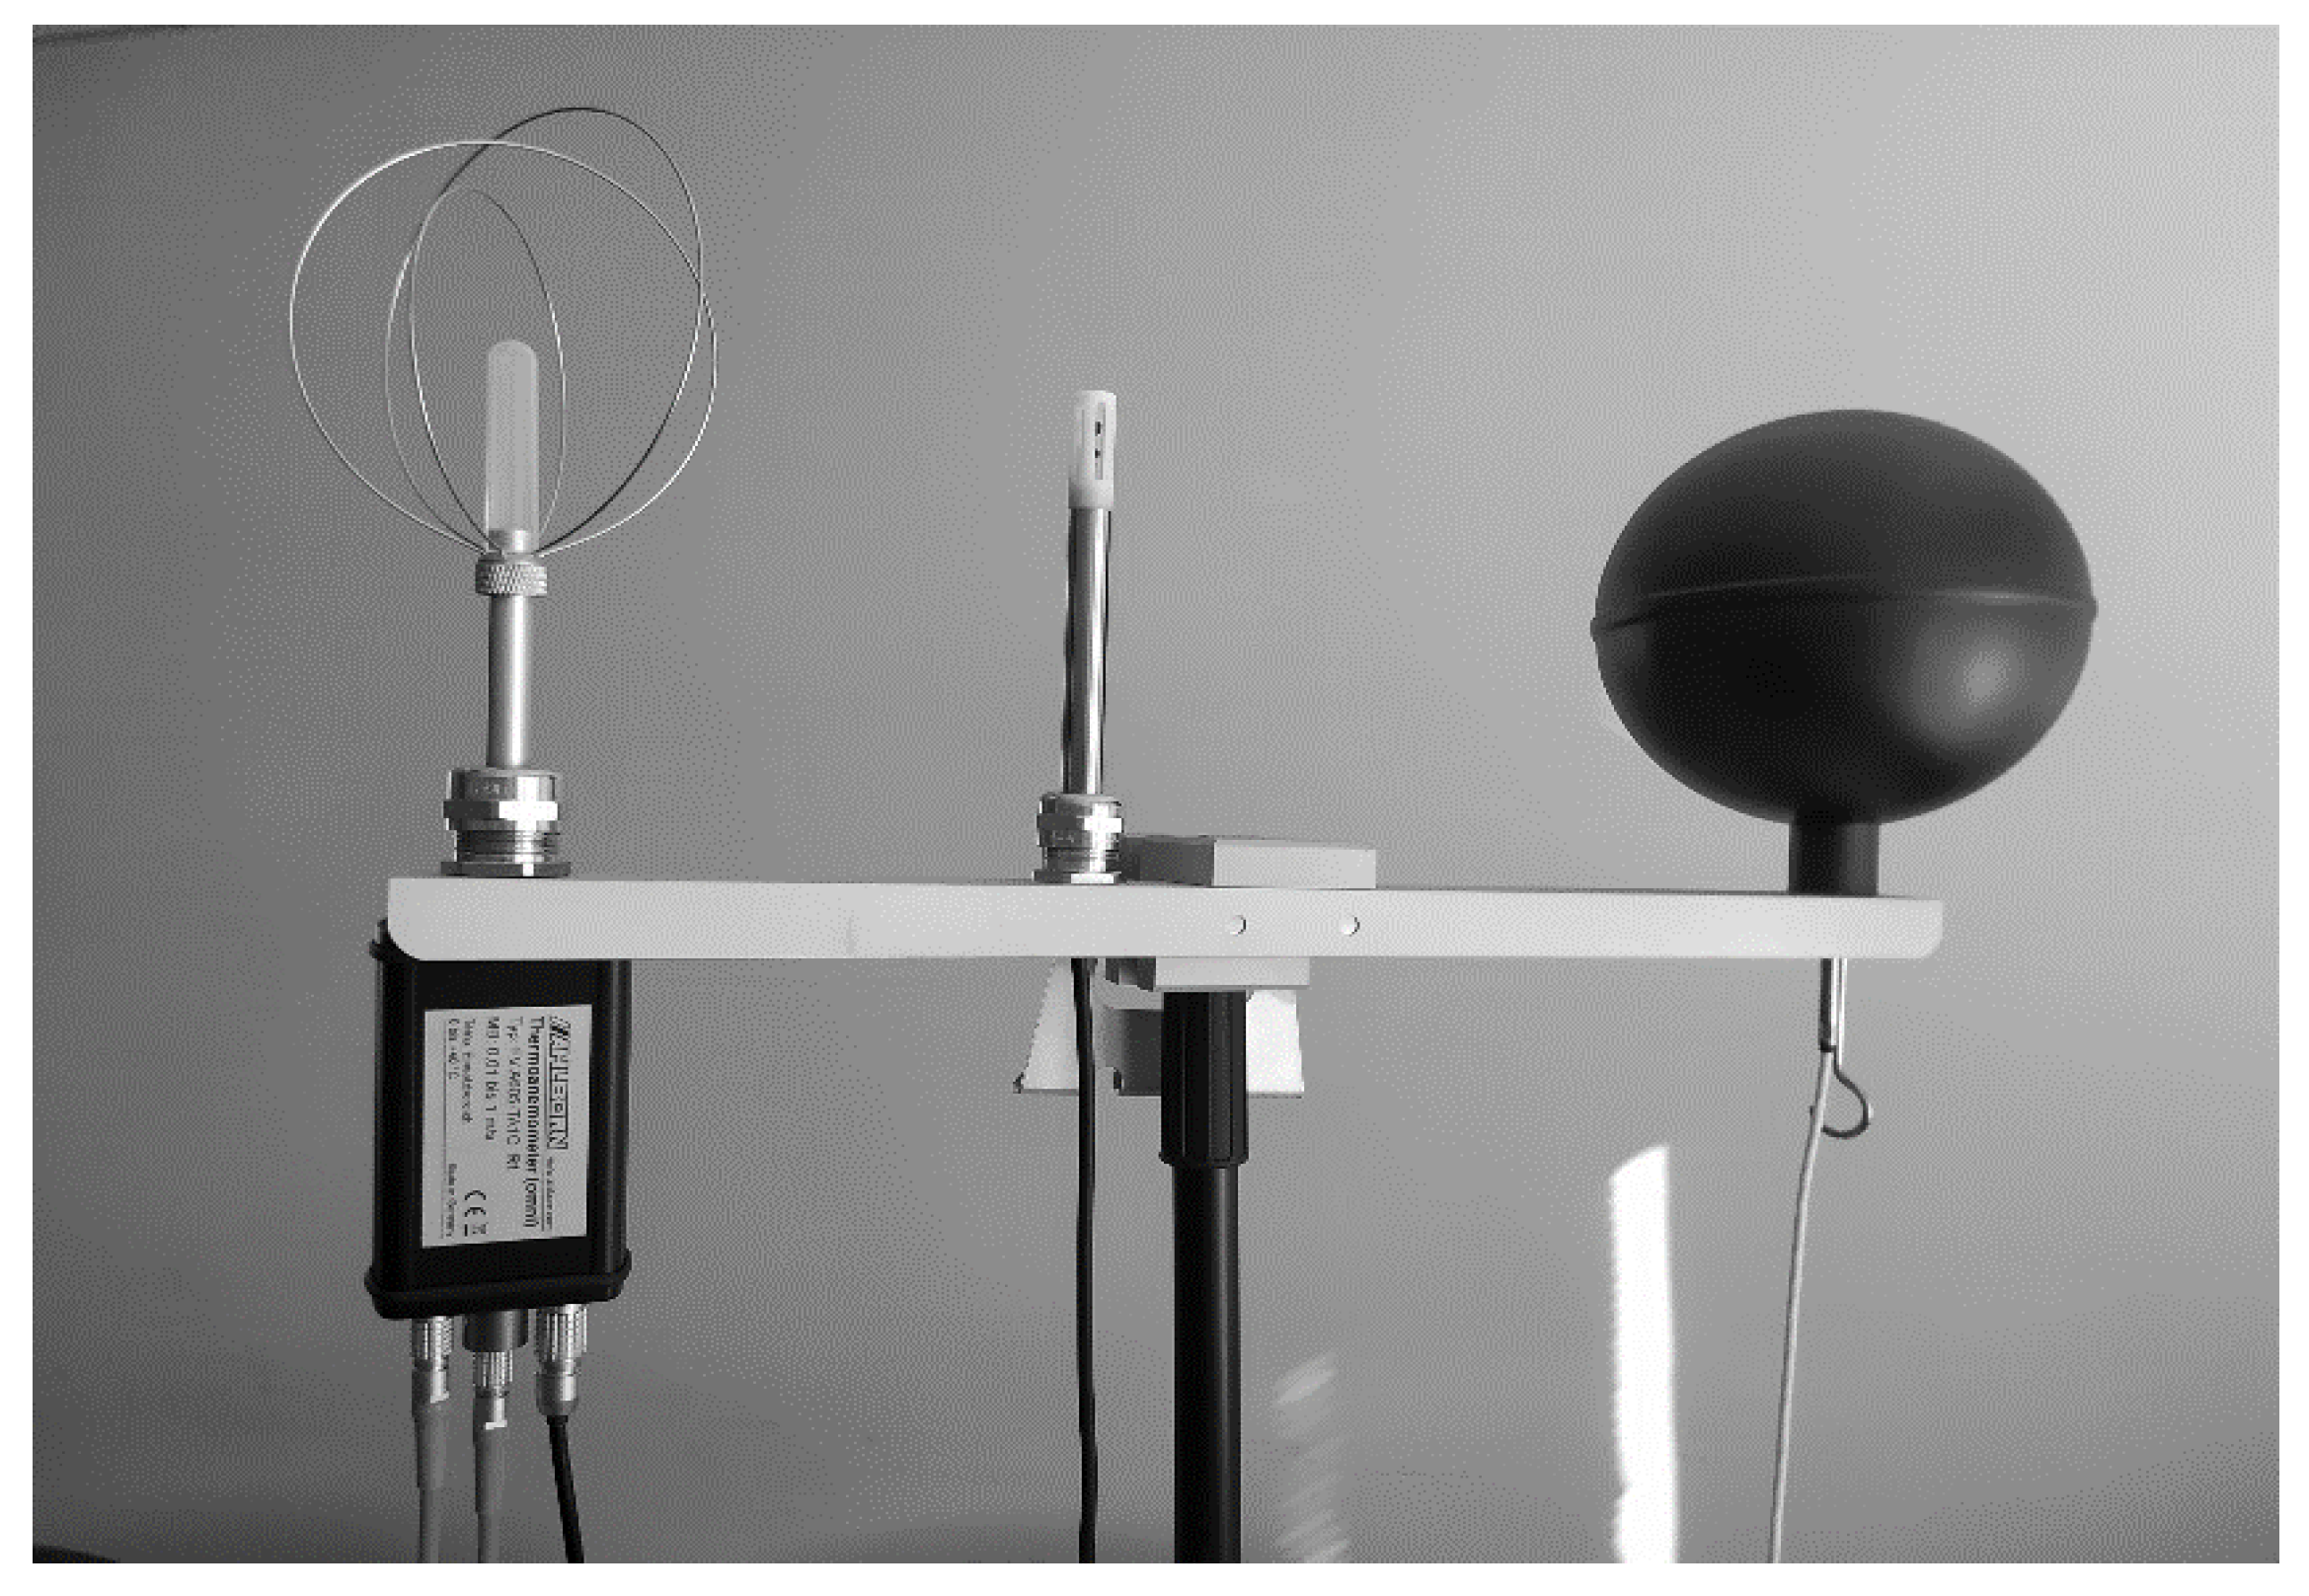
Thermal environmental measurements were provided by an AHLBORN microclimate multi-functional instrument with a digital ALMEMO D6 (Germany) and the experiments were done considering ISO 7726 [28] and ISO 7730 [29] provisions. In all P1–P4 locations, thermal performance was tested simultaneously with other parameters (CO2 and HCHO, VOCs). Figure 6 presents the main sensors in the thermal performance device. The parameters tested were: ta—actual air temperature, tg —blackened globe temperature, tnw—wet bulb temperature, RH—relative air humidity, va—air flow speed.
The designated parameters for thermal comfort assessment were as follows: Predicted mean vote, PMV (-) and PD; percentage of dissatisfied residents (%). Measurements were done at a height of 160cm. The frequency of data collection was every 10 s over two hours. The technical data and sensor resolution are presented in Table 5.
Based on the physical measurements, thermal comfort parameters were calculated in accordance to the thermal comfort model. The realistic uncertainty of PDTC determination is provided in Table 6.
The other assumptions for thermal performance analysis were based on EN ISO 7730 [29].
The daylight illumination level Emin [lux] was assessed by device MAVO-LUX 5032C with detector 3C15683 considering the provisions of EN 12464. PDL was calculated based on Equation (10).
The standardised approach is provided to detect the VOCs (TVOC as sum of detected VOCs) and formaldehyde (HCHO) concentrations in the experimental locations. Air samples were collected in selected measurement points P1–P4 (Figure 4 and Figure 5), approximately 1.6 m above the ground, 3 m away from windows. Rooms were not specially ventilated 24 h before experiment, all windows were closed. The air flow via samples was 10 dm3/h for VOCs tests and 30 dm3/h for HCHO tests. The collected samples (Tenax adsorbent) were transported to the accredited laboratory and assessed considering ISO 16000-6 [30] and ISO 16000-3 [31] provisions. Samples (VOCs) were thermally desorbed by TD 20 device and analyzed using the chromatograph (type QP2010 by Shimadzu, made in Japan). The volatile compounds were identified referring to the mass spectral database. TVOC was assessed by adding identified VOC compounds. PDTVOC was calculated based on Equation (6).
The acoustic tests were carried out by the standard measurement of the equivalent sound levels LAeq, in the P1–P4 locations. The measurements were carried out in daytime (starting at 11 am). The following measurements were used: Brüel & Kjær 4231 acoustic calibrator (made in USA), Norsonic-121 analyser (made in Norway), Brüel & Kjær 4165 measuring microphones (made in USA), analyser with microphone Norsonic-140 (made in Norway). Before the tests were carried out, the calibration of the measuring path was effected in accordance with the instruction ‘check of the acoustic measurement channel’. The test results were evaluated in relation to the requirements of the standard PN-B-02151-2:2018-01 [32], considering permissible sound levels A in rooms intended for human dwelling.
All indoor measurements were carried out the same day, in the month of May, from 10 am to 4 pm. Outdoor conditions were monitored, the external mean temperature was 22.9 °C, relative humidity was 51.9%, wind flow was 13.5 m/s, CO2 concentration was 350 ppm, pressure was 1013 hPa, there was no precipitation and cloudy 33%. The mean daylight intensity during the measurements was 18,500 lux.
3. Results
This section provides the experimental results of indoor environmental assessments according to the IEQ model. Table 7 shows the measurement results necessary to calculate four sub-component indices of IEQ sub-components in the four measuring points of the building. PAVG is the average value representing the whole building. The IEQ index for a case study building and its standard measurement standard uncertainty (with subcomponent standard deviation values SD) was calculated for IEQ physical parameter values, where ta is the air temperature (°C), tr is the mean radiant temperature (°C), va is the relative air velocity (m/s), pa is the water-vapour partial pressure (Pa), M is the metabolic rate of occupants (met) and Icl, is the calculated actual clothing insulation of occupants (clo). In addition, cCO2 is the concentration in ppm, cTVOC is the TVOC concentration in μg/m3, cHCHO is the formaldehyde HCHO concentration in μg/m3, actual noise level is in dB(A) and Emin is a daylight illuminance (lux). IAQquality, TCindex, ACcindex, Lindex are subcomponents of the IEQindex (predicted number of satisfied occupants in percentage).
Next, the measured input measured values were sub-modelled to determine the subsidence comfort indices for all measuring points. The results for all sub component indices are presented in Table 8, they are calculated based on input parameters presented in Table 7 and Equations (4)–(10). IEQindex is calculated based on Equations (1) and (2). Table 8 provides the IEQindex for all four measurement points (P1–P2 ground floor, P2–P4 first floor).
4. Discussion of Results
4.1. Evaluation of Results in the Context of Designated Comfort
The purpose of the experimental part was to determine the values of four indoor environment components (comfort indices) in a single-family building of the NZEB standard, taking into account the quality of the indoor air (based on CO2, TVOC, HCHO concentrations), thermal comfort (based on PMV-PD), acoustic comfort (based on actual sound level) and comfort associated with daylight (based on daylight intensity). In each of four measuring points P1–P4 (two on the ground floor and two on the first floor), a series of measurements of indoor environment parameters were made (results in Table 7). These parameters were used to calculate the predicted number of satisfied residents (Table 8) based on sensory functions presented in the article as Equations (4)–(10). The sum of the subcomponent indices multiplied by their weights (0.25 each) in accordance to Equation (2) allowed calculating the values of summary IEQ indices for each measurement point (91–100%).
For the thermal comfort index (TCindex), the obtained value for the building was 91% of the predicted percentage of occupants satisfied, for the indoor air quality index the obtained IAQindex value was 94%, for the acoustic comfort index the ACc was 99%, and for visual comfort Lindex was 96%. The calculated value of the overall comfort index of the IEQindex building was 95% (the expected percentage of satisfied occupants) (Table 9). The results obtained indicate that the case study building was characterised by very good comfort parameters at the time of the measurement (Category I in accordance to EN 16798).
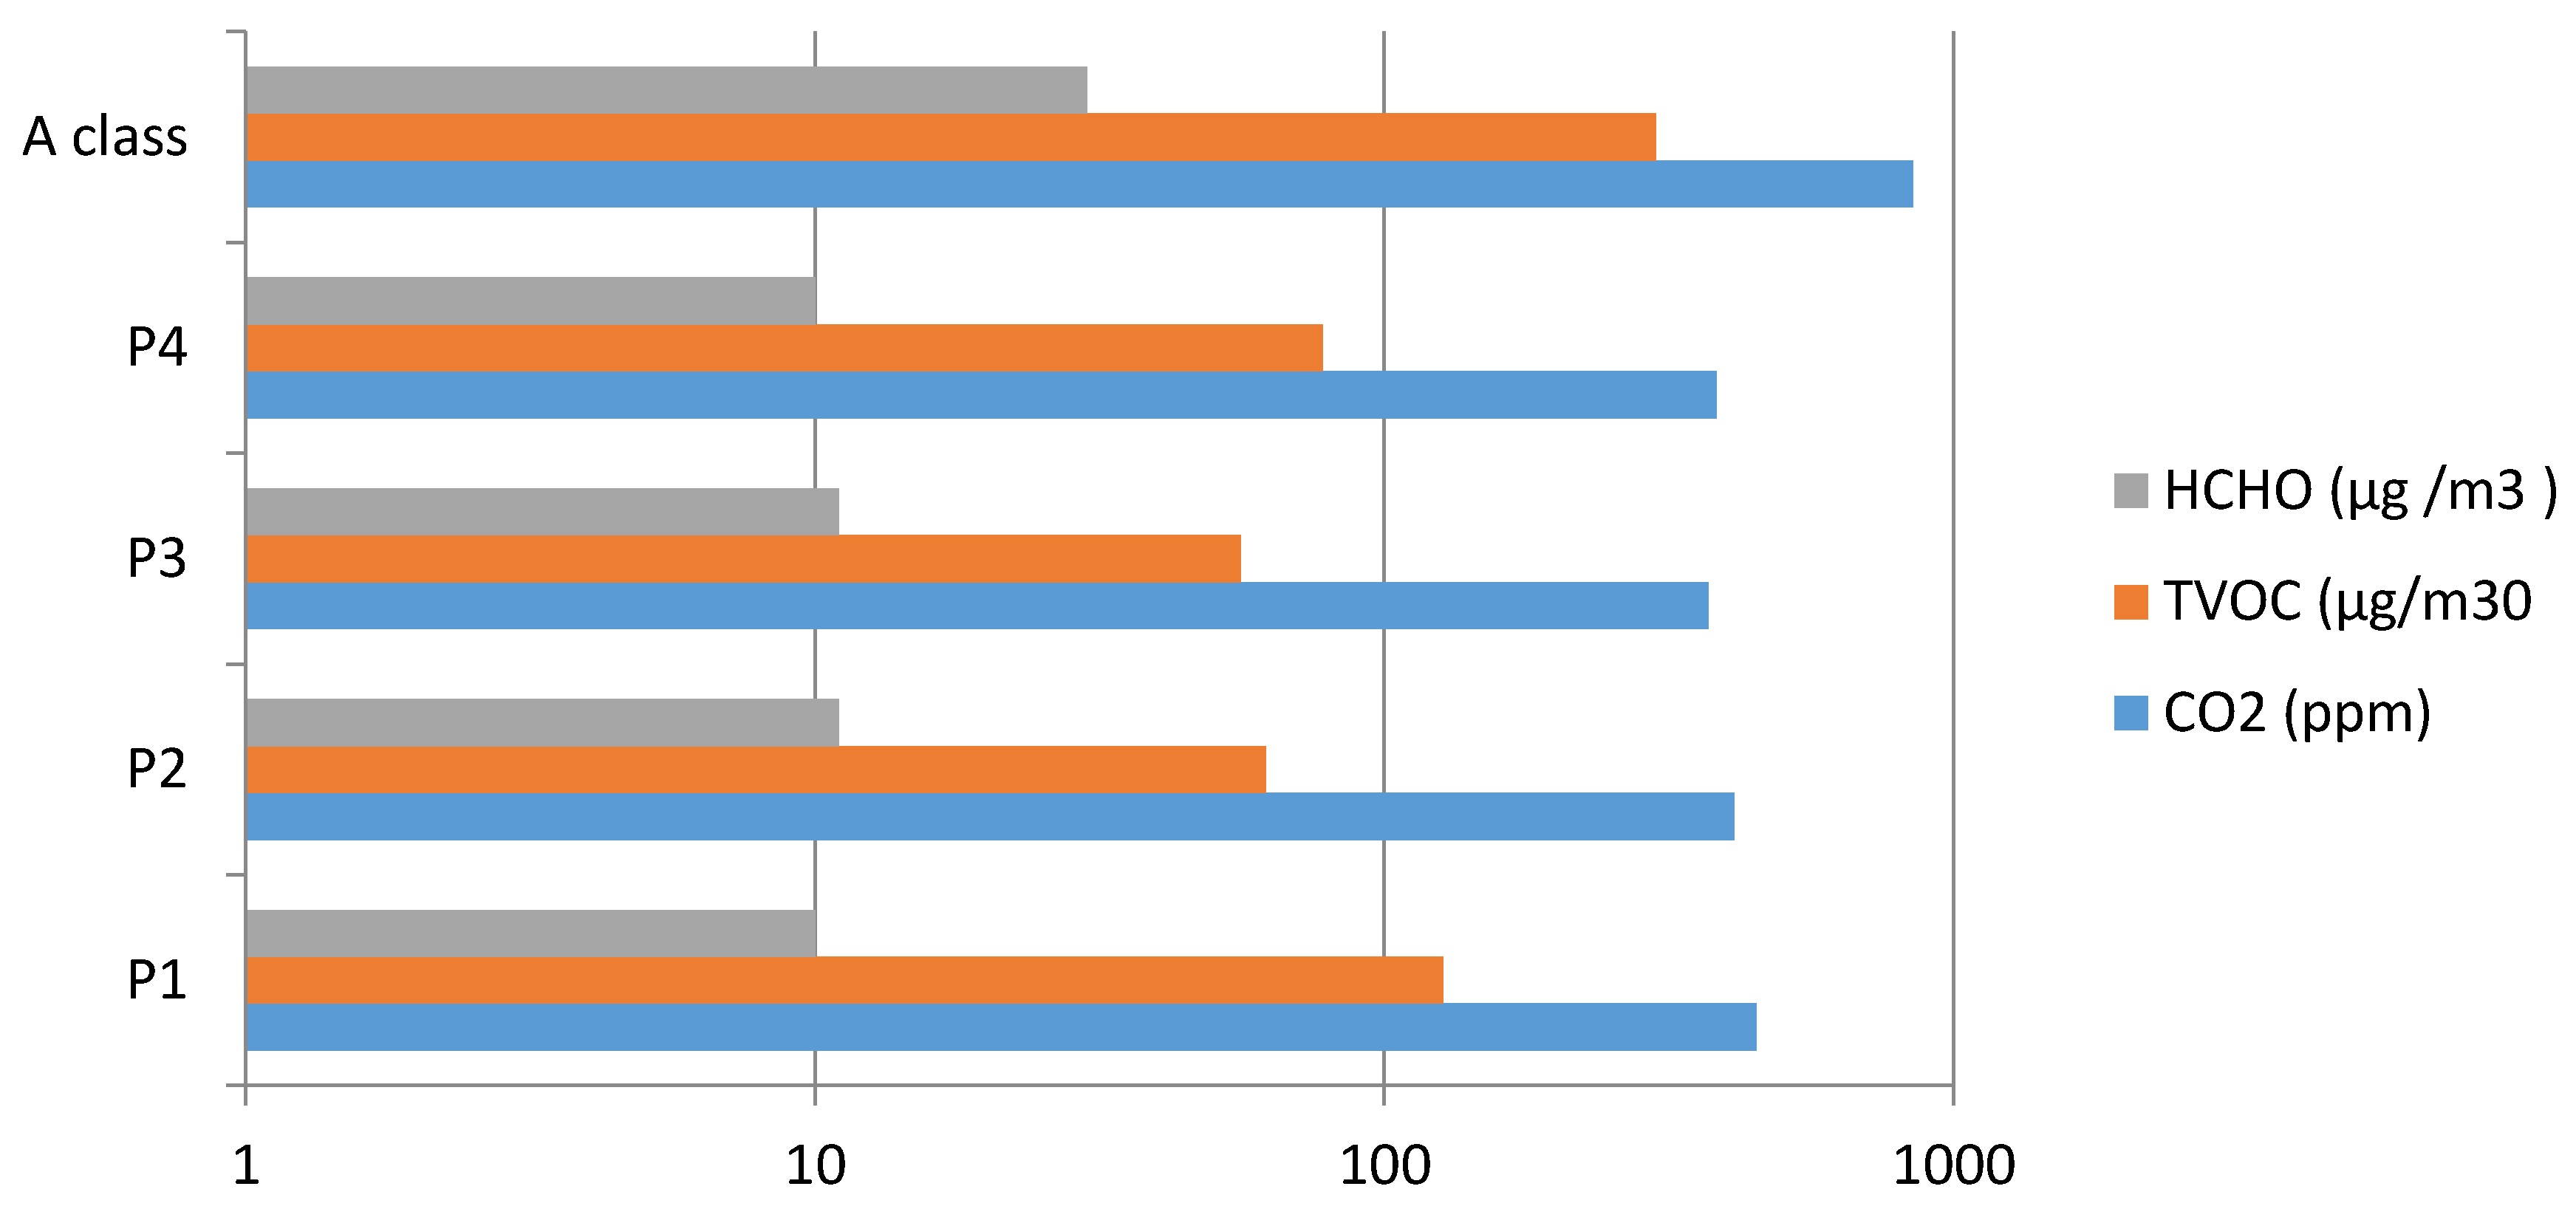
The first component of the indoor environment to be discussed was IAQ. The obtained results are summarized in the Figure 7 together with recommended low emission concentrations values (HCHO, TVOC and CO2) based on the EN 16798 standard and BREEAM assessment guidelines. It can be seen that all values were significantly lower than the recommended values.
In accordance to author’s laboratory experience a large number construction and finishing products, despite product performance declaration (DoP), were characterised by significant emissions (adhesives, plasters, sealants, paints), especially in recent days after use. This phenomenon is demonstrated for example in [23] and another publication [33]. The most common contaminants detected in the case study building were aldehydes and aromatic hydrocarbons. It was assumed that the level of air pollution in the building should not exceed 300 µg/m3 in the case of TVOCs and 30 µg/m3 in the case of HCHO. In our case study, TVOC emissions of about 100 µg/m3 and HCHO at a level of 10 µg/m3 were detected (Figure 7). These are the acceptable values for permanent residency. These emissions most likely come from wall paints and adhesives used to mount wooden panels. It should be noted, that over time, pollutant concentration values decrease (they peak usually in the first week, and then show a significant drop after about 3–4 weeks). In the context of CO2 pollution, it can be noted that the value of CO2 concentration at about 100 ppm above the almost constant value in the outdoor air resulted from the presence of four people inside. As such, it was a value indicating good air quality and ventilation. However, with higher numbers of occasional people in the building, it may deteriorate.
In the context of the thermal comfort analysis of the building, it can be concluded that during the measurement day (mild Spring period) thermal comfort was found in the building at category II level of EN 16798 and the expected percentage of dissatisfaction PD was at the level of 10%. In the case of case study NZEB, mainly designed to sustain a winter thermal performance, the thermal seasonal performance was strongly related to the construction and installation technologies used such as; air tightness, glazing type, thermal mass inertia, ventilation system inertia, solar radiation transmittance, manual controllability, and mechanical ventilation [34]. With this in mind, the author focused to check a springtime performance and found thermal comfort to be at a good level. An interesting additional issue connected to thermal comfort investigation was that the building was designed for an indoor operative temperature of 20 °C and the calculations of energy performance (heating) were carried out using this value. It must be underlined that such a temperature, with added variability of other thermal and humidity parameters, was unable to provide the neutral thermal comfort required, and the building had to be heated extra in order to maintain comfort.
In the context of acoustic measurements, the building was designed to meet the equivalent sound levels (A), LAeq at the 35-decibel level (40 dB ground floor and 30 upper floors). The detected sound levels (Table 7) demonstrated the fulfilment of the assumed design criteria; therefore, high acoustic comfort index (Table 8 and Table 9) is expected throughout the whole year because the expected same levels of noise from ventilation and there are no any significant external sources of noise in a close location.
In the context of daylight intensity in the spring period, the building interior on the south side (residential) was well lit. The theoretical levels of users’ satisfaction with the measured illumination level in the 320–620 lux range for measurement points P1–P4 (see Table 7) with a cloudiness of 33% gave the values of light quality index of 93–98% of satisfied users (Table 8). During the day, there was no need to illuminate indoors with artificial light.
The obtained IEQ index was in the range of 92–96% for the measurement points (Table 8) and that indicates that the building meets the assumption of comfort to a good degree. The author is aware that the results are limited and refer to the measurement period. Nevertheless, they give a forecast for the rest of the year. It should be expected that the thermal index will worsen with summer heat (there are indications that the building may warm up) and during the winter, if the operative temperature is not raised and the relative humidity is not increased. Further measurements on NZEB are already being carried out and will be provided in a subsequent publication. Comparable comfort studies in newly constructed buildings indicate that the mean level of users’ satisfaction is about 60–70% [10].
4.2. Comparison of Results Obtained with the IEQ Model and the BEE Method
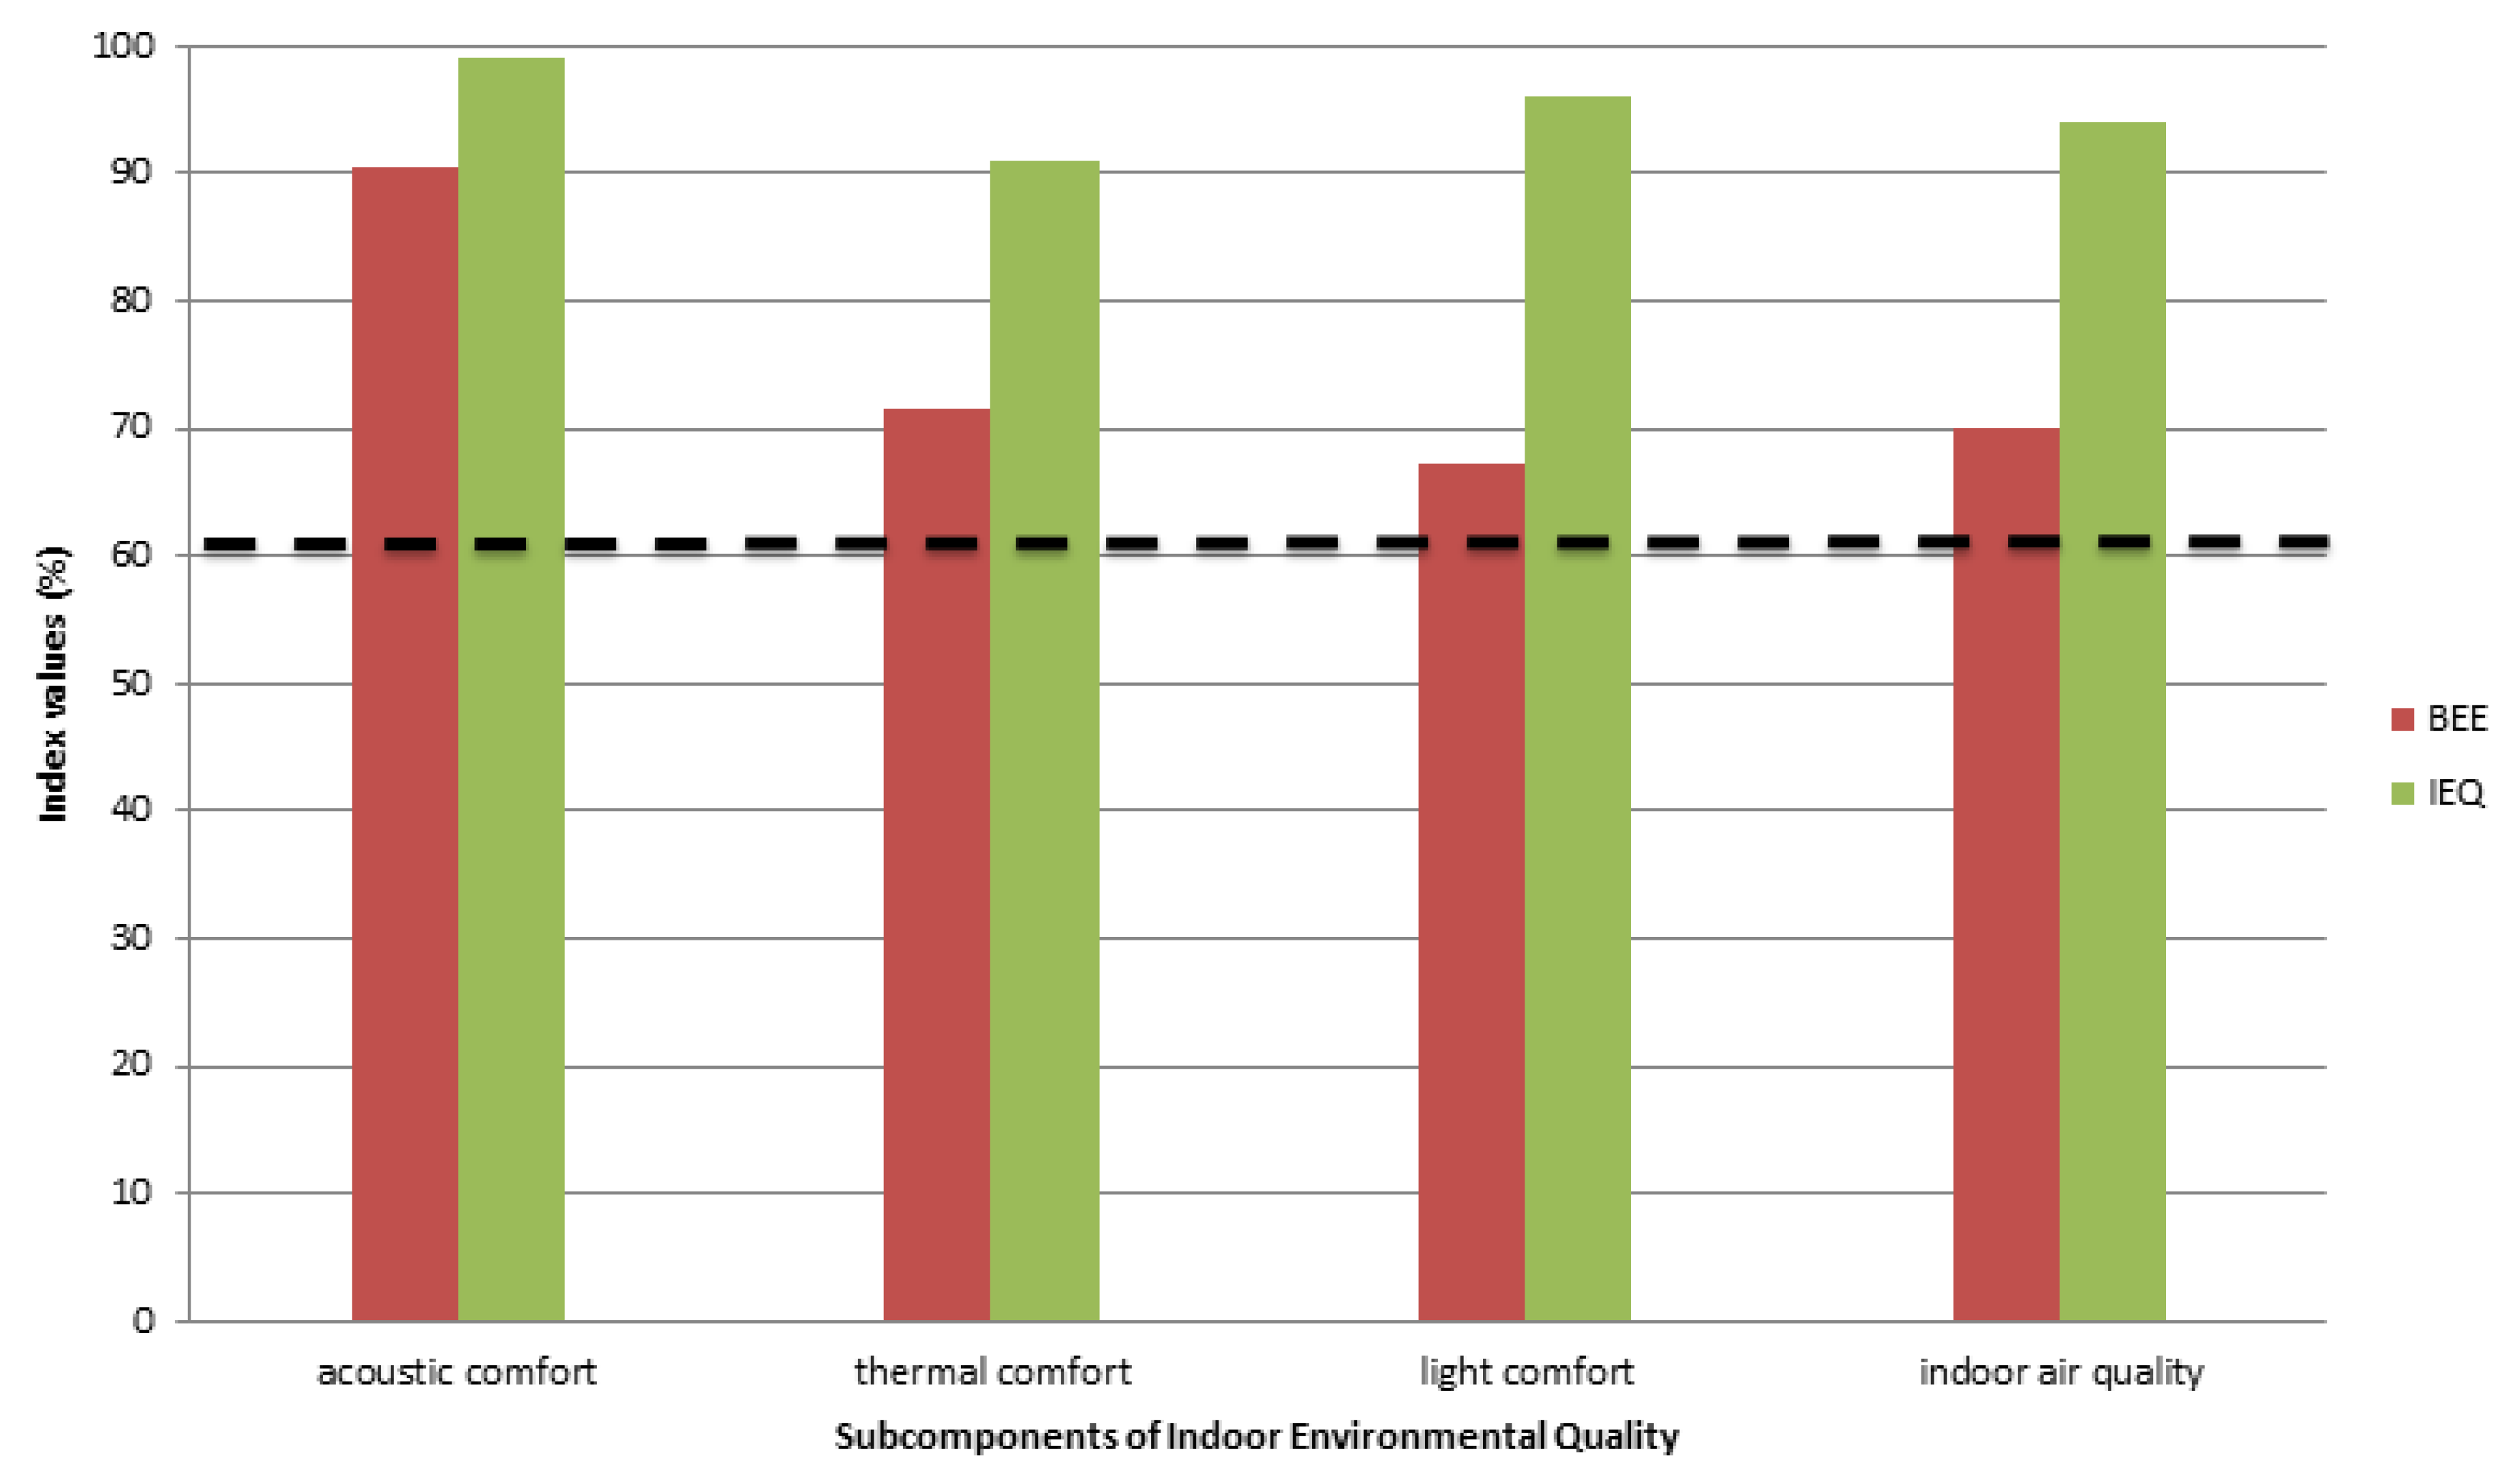
The comfort of the case-study building was also determined by another popular research method; building environmental effectiveness (BEE, Appendix A). It seems interesting to present a comparison of the different approaches, especially in the context of the indoor environment (included in the BEE assessment). As part of the author’s PhD, a national code oriented method for determining the environmental performance index, BEE was developed based on the concept of the comprehensive assessment system for built Environment efficiency (CASBEE, made in Japan). CASBEE system was developed by the Japan Sustainable Building Consortium (JSBC) [35,36] and publicly available for researchers in 2005. The range of assessments in environmental quality called Q1 in BEE method is similar to that with the IEQ model components, i.e., it includes indoor air quality, acoustic, visual and thermal comfort criteria. Both methods differ in the defined criteria for the assessment of subcomponents. The most noticeable difference is with the scale. Comfort categories are assessed in the BEE method on a scale of 1–5 and in the IEQ method on a scale of 0–100%, which may have a significant impact on results. For the purpose of result comparison, the five-point scale of the BEE method was converted to 100%. Figure 8 presents the results of the indoor environment quality methods BEE and IEQ comparison for a case-study building.
The main impact on the differences of results is the fact that the BEE method promotes the ability to control the environmental conditions. The case study building has a low controllability level of environmental parameters (manual). In simplified terms, it means that in the BEE approach, the building is more comfortable when the users can define for themselves what comfort means to them. It is assumed that if the installation system can be regulated or programmed to meet the user’s needs, which is the best solution and gives the best score. The IEQ model is not defined this way. It only considers whether, at a given moment, comfort corresponds with the expected high satisfaction parameters based on sensory curves. In an optimal situation, the controllability of the parameters should give optimal environmental conditions, which is not a common situation.
In the author’s opinion, both methods are suitable in the future to supplement the building energy performance characteristics with elements related to environmental indoor quality.
5. Conclusions
The present paper refers to actual regional research trends and needs [37,38,39,40,41,42] and provides a practical implementation of the IEQ model including its essential subcomponents: Thermal comfort, air quality, acoustic comfort and daylight visual comfort. The indoor environment quality index as it is shown may be used as measure of how occupants may perceive comfort in low energy single-family buildings. The intention to undertake this research on single-family buildings in the NZEB is connected to the large number of single-family buildings completed each year, according to the data published by the National Central Office of Measures where single-family buildings accounted for 96.6% of all buildings completed. National building codes state that all new buildings from December 31, 2020 will have to be built as nearly zero energy. Considering the restrictive energy requirements for buildings, it should be expected that the indoor climate of new buildings significantly will depend on new materials and energy efficient construction technologies. Practice shows that buildings with low energy consumption may have problems in terms of the quality of the indoor environment. It is recommended that the assessment of the building energy efficiency of should include an assessment of environmental comfort while energy efficiency should not be achieved at its expense. Considering presented conditions and the rather limited number of publications in this research area, this paper may contribute to the regional needs as a practical pilot study. The IEQ method is based on fairly simple measurements and can easily be used to evaluate buildings. Measurements can be done in one day.
The author in a paper compared IEQ method results with a similar tool—BEE (CASBEE based) with a corresponding assessment range. It was found that the IEQ method was more suitable for determining the actual level of satisfaction of residents, while the BEE method offered a more comprehensive way of assessing the overall possibilities of controlling the indoor environment of building. Some other researchers also observed that personal comfort control is the occupant’s priority in well-designed sustainable buildings [43,44]. Although the presented methods, BEE and IEQ, have similar content considering overall quality of the indoor environment; in practice they have rather different application purposes. The IEQ method can give a much better picture of the current environmental situation of a building because it is mainly based on measurements.
The method presented here can be used by other scholars to determine its usefulness in engineering practice.
Funding
This research received no external funding.
Acknowledgments
Special thanks to Krystyna Kostyrko for the inspiration and close cooperation on issues related to modelling the indoor environment of buildings and to Lech Czarnecki for his constant motivation to support the development of the scientific employees of the Building Research Institute.
Conflicts of Interest
The authors declare no conflict of interest.
Appendix A
The figure presents a case-study building assessment results using BEE method (using an interface of the author’s software). In addition to information on the quality of the internal environment, the assessment also contains other relevant information and assessments from the point of view of sustainable construction, including; building energy consumption, cost of ownership or carbon footprint.

References
- Al Horr, Y.; Arif, M.; Katafygiotou, M.; Mazroei, A.; Kaushik, A.; Elsarrag, E. Impact of indoor environmental quality on occupant well-being and comfort: A review of the literature. Int. J. Sustain. Built Environ. 2016, 5, 1–11. [Google Scholar] [CrossRef]
- Heerwagen, J. Green buildings, organizational success and occupant productivity. Build. Res. Inf. 2000, 28, 353–367. [Google Scholar] [CrossRef]
- Al Horr, Y.; Arif, M.; Kaushik, A.; Mazroei, A.; Katafygiotou, M.; Elsarrag, E. Occupant productivity and office indoor environment quality: A review of the literature. Build. Environ. 2016, 105, 369–389. [Google Scholar] [CrossRef] [Green Version]
- Geng, Y.; Ji, W.; Lin, B.; Zhu, Y. The impact of thermal environment on occupant IEQ perception and productivity. Build. Environ. 2017, 121, 158–167. [Google Scholar] [CrossRef]
- Piasecki, M.; Kostyrko, K.; Pykacz, S. Indoor environmental quality assessment: Part 1: Choice of the indoor environmental quality sub-component models. J. Build. Phys. 2017, 41, 264–289. [Google Scholar] [CrossRef]
- Frontczak, M.; Schiavon, S.; Goins, J.; Arens, E.; Zhang, H.; Wargocki, P. Quantitative relationships between occupant satisfaction and satisfaction aspects of indoor environmental quality and building design. Indoor Air 2012, 22, 119–131. [Google Scholar] [CrossRef]
- Lee, Y.S.; Guerin, D.A. Indoor environmental quality related to occupant satisfaction and performance in LEED-certified buildings. Indoor Built Environ. 2009, 18, 293–300. [Google Scholar] [CrossRef]
- Mihai, T.; Iordache, V. Determining the indoor environment quality for an educational building. Energy Procedia 2016, 85, 566–574. [Google Scholar] [CrossRef]
- Ncube, M.; Riffat, S. Developing an indoor environment quality tool for assessment of mechanically ventilated office buildings in the UK—A preliminary study. Build. Environ. 2012, 53, 26–33. [Google Scholar] [CrossRef]
- Sakellaris, I.A.; Saraga, D.; Mandin, C.; Roda, C.; Fossati, S.; De Kluizenaar, Y.; Carrer, P.; Dimitroulopoulou, S.; Mihucz, V.; Szigeti, T.; et al. Perceived indoor environment and occupants’ comfort in European ‘Modern’ office buildings: The OFFICAIR Study. Int. J. Environ. Res. Public Health 2016, 13, 444. [Google Scholar] [CrossRef]
- Sarbu, I.; Sebarchievici, C. Aspects of indoor environmental quality assessment in buildings. Energy Build. 2013, 60, 410–419. [Google Scholar] [CrossRef]
- Nimlyat, P.S. Indoor environmental quality performance and occupants’ satisfaction [IEQPOS] as assessment criteria for green healthcare building rating. Build. Environ. 2018, 144, 598–610. [Google Scholar] [CrossRef]
- Węglarz, A.; Pierzchalski, M. Comparing construction technologies of single family housing with regard of minimizing embodied energy and embodied carbon. E3S Web Conf. 2018, 49, 00126. [Google Scholar] [CrossRef] [Green Version]
- Piasecki, M.; Cisak, M.F.; Biskupski, J.; Furtak, M. Experimental confirmation of the reliability of Fanger’s thermal comfort model—Case study of a near-zero energy building (NZEB) office building. Sustainability 2019, 11, 2461. [Google Scholar] [CrossRef]
- Colclough, S.; Kinnane, O.; Hewitt, N.; Griffiths, P. Investigation of nZEB social housing built to the Passive House standard. Energy Build. 2018. [Google Scholar] [CrossRef]
- Attia, S. Occupants Well-Being and Indoor Environmental Quality. Net Zero Energy Build. 2018. [Google Scholar] [CrossRef]
- Bejan, A.S.; Catalina, T.; Munteanu, A.T. Indoor Environmental Quality Experimental Studies in an Energy-efficient Building. Case study: EFdeN Project. Energy Procedia 2017. [Google Scholar] [CrossRef]
- Ballarini, I.; De Luca, G.; Paragamyan, A.; Pellegrino, A.; Corrado, V. Transformation of an office building into a nearly zero energy building (NZEB): Implications for thermal and visual comfort and energy performance. Energies 2019, 12, 895. [Google Scholar] [CrossRef]
- Kunkel, S.; Kontonasiou, E. Indoor Air Quality, Thermal Comfort and Daylight Policies on the Way to nZEB—Status of Selected MS and Future Policy Recommendations; ECEEE: Brussels, Belgium, 2015. [Google Scholar]
- Ahmed, K.; Kuusk, K.; Heininen, H.; Arumägi, E.; Kalamees, T.; Hasu, T.; Kurnitski, J. Indoor climate and energy performance in nearly zero energy day care centers and school buildings. E3S Web Conf. 2019. [Google Scholar] [CrossRef]
- Fedorczak-Cisak, M.; Furtak, M.; Radziszewska-Zielina, E. Certification of “nearly Zero-Energy Buildings” as a Part of Sustainability; IOP Conference Series: Earth and Environmental Science; IOP Publishing Ltd.: Brno, Czech Republic, 2019. [Google Scholar] [CrossRef]
- Piasecki, M.; Kostyrko, K.B. Indoor environmental quality assessment, part 2: Model reliability analysis. J. Build. Phys. 2018, 5. [Google Scholar] [CrossRef]
- Piasecki, M.; Kozicki, M.; Firląg, S.; Goljan, A.; Kostyrko, K. The approach of including TVOCs concentration in the indoor environmental quality model (IEQ)—Case studies of BREEAM certified office buildings. Sustainability 2018, 10, 3902. [Google Scholar] [CrossRef]
- Zhu, C.; Li, N. Study on indoor air quality evaluation index based on comfort evaluation experiment. Procedia Eng. 2017, 205, 2246–2253. [Google Scholar] [CrossRef]
- AS. AS/NZS 2107:2000 Acoustics—Recommended Design Sound Levels and Reverberation Times for Building Interiors; Joint Australian/New Zealand Standard: Sydney, Australia, 2000. [Google Scholar]
- Hunt, D.R.G. Predicting artificial lighting use—A method based upon observed patterns of behaviour. Lighting Res. Technol. 1980, 12, 7–14. [Google Scholar] [CrossRef]
- Ozarisoy, B.; Altan, H. Low Energy Design Strategies for Retrofitting Existing Residential Buildings in Cyprus. In Proceedings of the Institution of Civil Engineers (ICE); ICE Publishing: London, UK, 2018; Volume 171, pp. 1–15. [Google Scholar] [CrossRef]
- CEN. Ergonomics of the Thermal Environment—Instruments for Measuring Physical Quantities; EN 7726; Comité Européen de Normalisation: Brussels, Belgium, 2002. [Google Scholar]
- CEN. Ergonomics of the Thermal Environment—Analytical Determination and Interpretation of Thermal Comfort Using Calculation of the PMV and PPD Indices and Local Thermal Comfort Criteria; EN 7730; Comité Européen de Normalisation: Brussels, Belgium, 2005. [Google Scholar]
- ISO. ISO 16000-6: 2011 Indoor Air—Part 6: Determination of Volcanic Organic Compounds in Tenax TA Sorbent, Thermal Desorption and Gas Chromatography Using MS or MS/FID; ISO: Geneva, Switzerland, 2011. [Google Scholar]
- ISO. ISO 16000-3: 2011 Indoor Air—Part 3: Determination of Formaldehyde and other Carbonyl Compounds–Active Sampling Method; ISO: Geneva, Switzerland, 2011. [Google Scholar]
- PKN. PN-B-02151-2:2018-01 Akustyka Budowlana—Ochrona Przed Hałasem w Budynkach–Część 2: Wymagania Dotyczące Dopuszczalnego Poziomu Dźwięku w Pomieszczeniach; PKN: Warsaw, Poland, 2018. (In Polish) [Google Scholar]
- Kostyrko, K.B.; Wargocki, P. Pomiary Zapachów i Odczuwalnej Jakości Powietrza w Pomieszczeniach; Monography ITB: Warsaw, Poland, 2012. [Google Scholar]
- Kim, J.; de Dear, R. Thermal comfort expectations and adaptive behavioural characteristics of primary and secondary school students. Build. Environ. 2018, 127, 13–22. [Google Scholar] [CrossRef]
- CASBEE. Available online: http://www.ibec.or.jp/CASBEE/english/ (accessed on 10 August 2019).
- Piasecki, M. Chosen Assessment Criteria of Building Sustainable Development Compliance. Ph.D. Thesis, Building Research Institute ITB, Warsaw, Poland, 2008. (In Polish). [Google Scholar]
- Czarnecki, L. Innovation in construction materials engineering versus sustainable development. Bull. Pol. Acad. Sci. Tech. Sci. 2017, 65, 765–771. [Google Scholar] [CrossRef] [Green Version]
- Kisilewicz, T. On the role of external walls in the reduction of energy demand and the mitigation of human thermal discomfort. Sustainability 2019, 11, 1061. [Google Scholar] [CrossRef]
- Nowoświat, A.; Ślusarek, J.; Żuchowski, R.; Pudełko, B. The impact of noise in the environment on the acoustic assessment of green houses. Int. J. Acoust. Vib. 2018, 23, 392–401. [Google Scholar] [CrossRef]
- Czarnecki, D.L. Van Gemert Civil Engineering–Ongoing Technical Research. Part I. Bull. Pol. Acad. Sci. Tech. Sci. 2016, 64, 661–663. [Google Scholar]
- Orlik-Kożdoń, B.; Nowoświat, A. Modelling and testing of a granular insulating material. J. Build. Phys. 2018. [Google Scholar] [CrossRef]
- Zastawna-Rumin, A.; Nowak, K. Experimental thermal performance analysis of building components containing phase change material (PCM). Procedia Eng. 2015, 108, 428–435. [Google Scholar] [CrossRef]
- Göçer, Ö.; Candido, C.; Thomas, L.; Göçer, K. Differences in Occupants’ Satisfaction and Perceived Productivity in High- and Low-Performance Offices. Buildings 2019, 9, 199. [Google Scholar] [CrossRef]
- Park, J.; Loftness, V.; Aziz, A. Post-Occupancy Evaluation and IEQ Measurements from 64 Office Buildings: Critical Factors and Thresholds for User Satisfaction on Thermal Quality. Buildings 2018, 8, 156. [Google Scholar] [CrossRef]
Figure 1.
The experimental strategy to assess each comfort element of indoor environmental quality (IEQ) model.
Figure 1.
The experimental strategy to assess each comfort element of indoor environmental quality (IEQ) model.

Figure 2.
Case study building location map with its surroundings.

Figure 3.
Views of the facade of the building by orientation.

Figure 4.
The view of the ground floor of the building with marked measuring points P1 and P2 (black dots) and the layout of the ventilation system with the distinction of inlet and outlet points.
Figure 4.
The view of the ground floor of the building with marked measuring points P1 and P2 (black dots) and the layout of the ventilation system with the distinction of inlet and outlet points.

Figure 5.
The view of the ground floor of the building with marked measuring points P3 and P4 (black dots) and the layout of the ventilation system with the distinction of inlet and outlet points.
Figure 5.
The view of the ground floor of the building with marked measuring points P3 and P4 (black dots) and the layout of the ventilation system with the distinction of inlet and outlet points.

Figure 6.
Measuring device consisting of thermal comfort sensors used for a study.

Figure 7.
Results of pollutant concentration levels at P1–P4 measurement points and recommended values A class for HCHO, CO2 and TVOC concentrations.
Figure 7.
Results of pollutant concentration levels at P1–P4 measurement points and recommended values A class for HCHO, CO2 and TVOC concentrations.

Figure 8.
Summary of the assessment results of the subcomponents of the indoor environment of the case-study building on a percentage scale using IEQ and building environmental effectiveness (BEE) methods (the dotted line indicates the minimum accepted level of requirements resulting from national regulations according to the BEE method, 100% is best performance).


Table 1.
Monthly statistics for dry bulb temperatures for case study and precipitation.
| Month | Dry Bulb Temperature (°C) | Mean Total Precipitation (mm) | Mean No. of Precipitation (Days) | |
|---|---|---|---|---|
| Daily Max. | Daily Min. | |||
| Jan | 8.0 | –20.0 | 28.7 | 17.0 |
| Feb | 5.0 | –13.5 | 22.5 | 14.7 |
| Mar | 20.0 | –10.0 | 27.9 | 14.7 |
| Apr | 20.0 | –4.0 | 31.2 | 12.2 |
| May | 28.9 | 0.0 | 54.8 | 12.8 |
| Jun | 30.0 | 7.2 | 68.0 | 14.4 |
| Jul | 30.1 | 10.0 | 68.4 | 13.0 |
| Aug | 30.0 | 8.0 | 69.2 | 13.9 |
| Sep | 24.0 | 0.0 | 63.9 | 13.2 |
| Oct | 20.0 | –4.0 | 49.3 | 15.0 |
| Nov | 12.8 | -3.9 | 46.4 | 17.0 |
| Dec | 9.0 | –17.0 | 38.8 | 18.1 |
Table 2.
Heat transfer coefficient Uc of the main building elements.
| No | Type | Construction Material | Uc (W/m2K) | Standard (W/m2K) |
|---|---|---|---|---|
| 1 | External walls | Silicate blocs 18cm + rock wool; λ = 0.036, 20 cm | 0.1 | 0.2 |
| 2 | Roof | Rafter-collar beam system with rock wool λ = 0.030, 20 cm | 0.1 | 0.15 |
| 3 | Ground floor | Concrete slab reinforced with mesh, waterproofing layer and Styrofoam λ = 0.040, 12 cm | 0.15 | 0.3 |
| 4 | Windows | Three-pane package | 0.8 | 0.9 |
| 5 | Roof windows | Three-pane package | 1.0 | 1.1 |
Table 3.
Summary of annual primary and end-use energy results.
| Heat Systems | End Use Energy QK, H (kWh/year) | Primary Energy QP, H (kWh/year) |
|---|---|---|
| Heat and ventilation (heat pump) | 1378 | 8072 |
| Hot water (heat pump) | 1257 | 3969 |
Table 4.
Main finishing products used in indoor environments.
| Element | Construction Product | Thickness | Location |
|---|---|---|---|
| Internal walls living rooms | Cement-lime plaster and eco-acrylic paint | 0.015 m | Rooms, corridor, kitchen |
| “Wet” utility rooms | Cement-lime plaster and eco-ceramic tiles | 0.015 m | Bathrooms, WC, garage |
| Floors | Semi-dry cement screed with a pipe heat system, insulation mat, exotic wood panels and ceramic tiles (kitchen) | 0.12 m | Rooms |
| Ceilings, suspended ceilings | Cement-lime plaster, and eco-acrylic paint, acoustic gypsum cardboard plates, paint | 0.015 m 0.03 m | On the floor slab in the attic (slants) |
Table 5.
Type of sensors and their measurement range.
| Type of Sensor | Range | Scale | Accuracy |
|---|---|---|---|
| Temperature FHAD46 | –20 °C–50 °C | 0.01 °C | ±0.5 °C |
| Humidity FHAD46 | 0–100% | 0.1% | ±1% |
| Air speed FVAD15 | 0–10m/s | 0.01 m/s | ±2% |
| Radiant temperature FIAD43 | 0–50 °C | 0.01 °C | ±2% |
| Carbon dioxide FYAD00 | 0–5000 | 1 ppm | ±0.6% |
Table 6.
Realistic measurement uncertainty of PDTC assessment
| Parameter | Real Accuracy (%) | Reference |
|---|---|---|
| Air temperature ta °C | ±0.5°C ⇒ ±0.08 predicted mean vote indicator (PMV) ⇒ ±0.6% percentage of dissatisfied residents (PD) | ISO 7726 |
| Radiant temperature tmr °C | ±2°C ⇒ ±0.28 PMV ⇒ ±3% PD | ISO 7726 |
| Relative humidity (RH, %) | ±5 RH ⇒ ±0.07 PMV ⇒ ±0.5% PD | ISO 7726 |
| Relative air speed va m/s | ±|0.01+0.01va|m/s ⇒ ±0.03 PMV ⇒ ±0.2% PD | ISO 7726 |
| Table errors | ±0.1 PMV ⇒ ±0.73% PD | ISO 7730 |
| ±SD = (0.36 + 9 + 0.25 + 0.04 + 0.54)0.5 = 3.2% | ||
Table 7.
Results of measured indoor parameters (inputs to IEQ sub-components calculation) in four locations (P1–P4) and mean value PAVG (weighed by using the locations by the floor area).
Table 7.
Results of measured indoor parameters (inputs to IEQ sub-components calculation) in four locations (P1–P4) and mean value PAVG (weighed by using the locations by the floor area).
| Point | IAQquality | TCindex | ACcindex | Lindex | ||||||||
|---|---|---|---|---|---|---|---|---|---|---|---|---|
| cCO2 [ppm] | cTVOC [µg/m3] | cHCHO [µg/m3] | ta [°C] | tmr [°C] | RH [%] | va [m/s] | Iclo [clo] | M [met] | LAeq [dB] | Design [dB] | E [lux] | |
| P1 | 451 ± 3 | 127 ± 2 | 10.2 ± 1 | 24.1 ± 0.5 | 23.4 ± 2 | 38.2 ± 1.4 | 0.15 ± 0.05 | 0.7 | 1.1 | 42 ± 3 | 40 | 460 ± 25 |
| P2 | 412 ± 3 | 62 ± 2 | 11.4 ± 1 | 23.8 ± 0.5 | 22.9 ± 2 | 38.5 ± 1.4 | 0.14 ± 0.05 | 0.7 | 1.1 | 34 ± 3 | 40 | 325 ± 25 |
| P3 | 371 ± 3 | 56 ± 2 | 11.2 ± 1 | 24.5 ± 0.5 | 24.8 ± 2 | 37.7 ± 1.4 | 0.13 ± 0.05 | 0.6 | 1.0 | 28 ± 3 | 30 | 620 ± 25 |
| P4 | 383 ± 3 | 78 ± 2 | 10.4 ± 1 | 24.9 ± 0.5 | 24.9 ± 2 | 38.6 ± 1.4 | 0.15 ± 0.05 | 0.6 | 1.0 | 29 ±3 | 30 | 540 ± 25 |
| Pavg | 416 ± 3 | 95 ± 2 | 10.3 ± 1 | 24.3 ± 0.5 | 23.8 ± 2 | 38.4 ± 1.4 | 0.14 ± 0.05 | 0.7 | 1.1 | 36 ± 3 | 35 | 480 ± 25 |
Table 8.
List of predicted occupant satisfaction indices (in each IEQ category) for four building measurement points.
Table 8.
List of predicted occupant satisfaction indices (in each IEQ category) for four building measurement points.
| Point | IAQCO2 | IAQTVOC | IAQHCHO | IAQindex | TCindex | ACcindex | Lindex | IEQindex |
|---|---|---|---|---|---|---|---|---|
| [%] | [%] | [%] | [%] | [%] | [%] | [%] | [%] | |
| P1 | 97 | 86 | 95 | 92 | 92 | 96 | 96 | 94 |
| P2 | 98 | 93 | 95 | 96 | 89 | 100 | 93 | 94 |
| P3 | 99 | 93 | 95 | 96 | 88 | 100 | 99 | 96 |
| P4 | 99 | 91 | 95 | 95 | 90 | 100 | 98 | 96 |
Table 9.
The IEQ sub-component models, the indoor parameters (input values) and IEQindex results for building (Pavg) assuming the realistic uncertainty.
Table 9.
The IEQ sub-component models, the indoor parameters (input values) and IEQindex results for building (Pavg) assuming the realistic uncertainty.
| Component | PD(SIi) Model | Measures | Index (Satisfied) ± SD |
|---|---|---|---|
| TCindex | PMV (Fanger-ISO 7730) PDTC = f(PMV) Equation (4) | Icl 0.7 clo | 91.0% ± 3.2% |
| ta 24.3 °C | |||
| tr 23.8 °C | |||
| va 0.14 m/s | |||
| RH 28.4% | |||
| M 1.05 met | |||
| ΣIAQindex Sub-indices | PDCO2 = 395·exp(−15.15·CCO2−0.25) | c = 416 ppm | 98.0% ± 0.6% |
| PD(VOC) = 405·exp(−11.3·CTVOC−0.25) PDHCHO = 100 − 95·exp(−0.03353·PMV4 − 0.2179·PMV2) | C = 95 μg/m3 c = 0.01 mg/m3 | 89.2% ± 13.8% 95.0% ± 10.7% | |
| ΣIAQindex | IAQVOC = 0.9·IAQ(TVOC) + 0.1·IAQ(HCHO) ΣIAQ index = 0.5·IAQ(CO2) + 0.5·IAQ(TVOC) | 90.0% ± 17.3% 93.9% ± 9.1% | |
| ACc index | PDACc = 2(ActualSound_Level– DesignSound_Level) Actual (background) sound level Sound level—required by design | 36 dB(A) 35 dB(A) | 99.9% ± 6.7% |
| Lindex | PDL = −0.018 + 1.036/{1 + exp(+4.08 (log10(Emin) − 1.82))} | 480 lux | 96.0% ± 9.0% |
| IEQindex | IEQindex ± SD = 0.25⋅TCindex + 0.25⋅ΣIAQindex + 0.25⋅ACcindex + 0.25⋅Lindex ± uoverall(IEQ) = [Σ (SDreal(PD(SIi))2+Σ (SDvotePD(SIi))2]1/2 | 95% ± 16% | |
© 2019 by the author. Licensee MDPI, Basel, Switzerland. This article is an open access article distributed under the terms and conditions of the Creative Commons Attribution (CC BY) license (http://creativecommons.org/licenses/by/4.0/).
Share and Cite
MDPI and ACS Style
Piasecki, M. Practical Implementation of the Indoor Environmental Quality Model for the Assessment of Nearly Zero Energy Single-Family Building. Buildings 2019, 9, 214. https://doi.org/10.3390/buildings9100214
AMA Style
Piasecki M. Practical Implementation of the Indoor Environmental Quality Model for the Assessment of Nearly Zero Energy Single-Family Building. Buildings. 2019; 9(10):214. https://doi.org/10.3390/buildings9100214
Chicago/Turabian StylePiasecki, Michał. 2019. "Practical Implementation of the Indoor Environmental Quality Model for the Assessment of Nearly Zero Energy Single-Family Building" Buildings 9, no. 10: 214. https://doi.org/10.3390/buildings9100214
Note that from the first issue of 2016, this journal uses article numbers instead of page numbers. See further details here.