Quantifying the Generality and Adaptability of Building Layouts Using Weighted Graphs: The SAGA Method
by
 , ,
, ,
Pieter Herthogs
1,2,* ,
,
Wim Debacker
3,4,
Bige Tunçer
2,1,
Yves De Weerdt
3 and
Niels De Temmerman
5 1
ETH Zürich, Singapore-ETH Centre (SEC), Future Cities Laboratory, 1 Create Way, Singapore 138602, Singapore
2
Informed Design Lab, Architecture and Sustainable Design, Singapore University of Technology and Design (SUTD), 8 Somapah Road, Singapore 487372, Singapore
3
Transition Platform, Flemish Institute for Technological Research (VITO), Boeretang 200, 2400 Mol, Belgium
4
Smart Energy and Built Environment, Flemish Institute for Technical Research (VITO), Boeretang 200, 2400 Mol, Belgium
5
Department of Architectural Engineering, Vrije Universiteit Brussel (VUB), Pleinlaan 2, 1050 Brussel, Belgium
*
Author to whom correspondence should be addressed.
Buildings 2019, 9(4), 92; https://doi.org/10.3390/buildings9040092
Submission received: 28 February 2019
/
Revised: 29 March 2019
/
Accepted: 3 April 2019
/
Published: 20 April 2019
(This article belongs to the Special Issue Responsive Architecture)
Abstract
:This paper presents an assessment method that uses weighted graphs to quantify a building’s capacity to support changes. The method is called Spatial Assessment of Generality and Adaptability (SAGA), and evaluates the generality (passive support for change) and adaptability (active support for change) of a building’s spatial configuration. We put forward that the generality and adaptability of a floor plan can be expressed in terms of graph permeability, and introduce a set of five quantitative indicators. To illustrate the method, we evaluate six representative plan layouts, and discuss how their generality and adaptability scores relate to their spatial configuration. We are developing the SAGA method for two areas of application. First, SAGA’s global graph indicators can be used to analyse and compare large sets of plan graphs, for example to map or plan adaptable capacity throughout a building or city. Second, the SAGA method can serve as a tool to inform design, allowing architects to improve the generality and adaptability of their plan layouts. While we conclude that the method has significant strengths and promising applications, the paper ends by discussing ways to make the assessment more robust and extend it beyond measuring spatial configuration.
1. Introduction
Despite change being fundamental to cities and urban development, the built environment is not purposefully designed to support it. Buildings are often unable to accommodate changes over time [1] (p. 216); to keep up with changing standards, demands, or functional programs, they either need to be subjected to extensive renovations or demolished and replaced. This process is costly, resource intensive, and generates significant amounts of waste—construction and demolition represents an estimated 30 to 40% of global waste production [2] (p. 23). Moreover, the inability to support change can have impacts beyond the building level. Herthogs [3] hypothesised that the lack of ‘adaptable capacity’ of individual buildings (i.e. their passive ability to support change) introduces important inertias on the adaptive capacity of the urban ecosystem in its entirety (i.e. a city’s active, emergent adaptivity), and put forward a methodology to study how adaptable capacity could be effectively distributed (i.e. planned) throughout the built environment.
Studying the benefits of ‘building adaptability’ requires a robust framework to quantify the various aspects of a building’s capacity to adapt. However, although designing buildings for adaptability (or flexibility) has been ‘a legitimate goal of architecture and planning’ since the 1960s [4] (p. 51), it has arguably remained a niche field of study in architecture and building research. In a review paper discussing developments in building adaptability between 1990 and 2017, Heidrich et al. [5] (p. 296) discussed the lack of methods to score and evaluate adaptability, and emphasised the need to develop approaches and tools to inform design for adaptability. Geraedts et al. [6] (p. 1054) argued that existing adaptability assessment methods often only evaluate specific aspects of adaptability, such as technical or functional aspects, or focus on particular building types. Osman et al. [7] (p. 13) put forward that existing evaluations are not necessarily suited to assess buildings that were not designed to be adapted: obtaining results is often time-consuming and requires expert knowledge, but does not necessarily result in relevant data to inform conventional building design. In a review of existing assessment models, Rockow et al. [8] (p. 13) concluded that the modelling of building adaptation is ‘in a nascent stage’, and recommended the development of data-driven quantitative modelling approaches in future. They categorised the reviewed models () according to their application: models either measure an existing building’s potential for adaptive reuse (), a designed building’s level of design for adaptability (), or the impact of adaptability on a building’s life cycle (; one method combining design and life cycle assessment).
In this paper, we introduce a quantitative modelling approach called the SAGA method (Spatial Assessment of Generality and Adaptability). SAGA quantifies how well a building’s spatial connectivity network can support change passively (i.e. generality) and actively (i.e. adaptability). Buildings with a high level of generality are designed in such a way that they can support changing needs and requirements without having to make physical alterations. Rather than being designed for a specific function, a general (or multi-purpose) building has characteristics—such as spatial layout, room sizes, or daylighting—that are suitable for general use. Adaptability is the result of (purposeful) decisions regarding design and detailing that make it easier to support changes in needs and requirements. This can be achieved using specific technological solutions, such as sliding walls, removable partitioning or reroutable service ducts, or by optimising the placement and hierarchy of conventional building components according to their technical or functional life spans (i.e. pace-layering [9]). Generality and adaptability represent the two dimensions of adaptability described by Heidrich et al. [5] (p. 288).
SAGA is related to the j-graph or Justified Plan Graph (JPG) method, an often-used graph analysis method for plan layouts. The JPG method is part of Space Syntax theory, a set of theories, methods and tools to analyse and understand the built environment in terms of spatial configuration and topology, primarily developed in the early 1980s in London [10].
The aim of the present paper is to introduce, explain, and illustrate the SAGA method’s indicators for configurational generality and adaptability. The next section argues why graph permeability is a measure for the total number of functional uses a plan layout can support, which is the main premise of this work. Section 3 introduces three absolute indicators—Generality (G), Adaptability (A) and Maximum Adaptability (MA)—and two relative indicators—Normalised Generality (G) and Normalised Adaptability (A)—and discusses related literature. Section 4 discusses each step of a SAGA analysis in detail, explaining how to build plan graphs, calculate and normalise the indicators using Permeability (P). Section 5 illustrates the method by analysing six representative plan layouts, known to be general or adaptable, or designed to be. To conclude, we discuss the four main strengths of the SAGA method. Finally, we describe its potential to inform urban planning (by using its indicators to study and ‘plan’ adaptable capacity) and architectural design (by analysing and improving the generality and adaptability of an individual building layout).
The presented research has limitations. In terms of scope, SAGA emphasises plan analysis, which might not correctly represent more three-dimensional characteristics of a building layout. In addition, the method uses aggregate graph measures to quantify a multitude of potential uses, which likely results in a loss of sensitivity compared to conventional architectural or sociological plan analysis, and most certainly requires a shift in perspective. Moreover, the present work only considers configurational characteristics of a plan layout; although we are developing complementary indicators to evaluate different plan characteristics (such as surface areas), such characteristics are not yet represented. In terms of validation, the present paper is intended as a proof-of-concept of the proposed method. We argue that our main premise linking permeability to generality is theoretically sound, and we have applied the method to several representative cases (more than the six discussed in this paper). Nevertheless, a large-scale analysis covering a varied set of representative cases would be required to truly understand the practical potential and applicability of the indicators we introduced, and to fully prove the underlying premise. However, the level of proof is representative for the topic: in a review of existing adaptability assessment models [8], only one out of ten had been validated using a substantial dataset (); six out of ten were ‘validated’ using representative cases; three had not been validated.
We end the paper by suggesting how the calculation and evaluation could become more robust, and how the method could include a broader range of building characteristics related to generality and adaptability. We see SAGA as a spatial assessment framework with a range of assessment modules covering the spectrum of adaptable capacity, the assessment module introduced in this paper emphasising spatial configuration.
2. Premise: Permeable Plan Layouts are More General
To quantify the generality and adaptability of a building, SAGA starts at the level of the building layout or space plan. We argue that the properties of a building’s space plan and its underlying building layout are at the core of a building’s function, and strongly (but not solely) determine a building’s capacity to support functional changes. This argument was illustrated by Schmidt III and Austin [11] (p. 57): their analysis of the interconnectivity of Brand’s shearing layers of change [9] (i.e. Site, Structure, Skin, Services, Space Plan, and Stuff, extended to include Social, Space, and Surroundings) demonstrated that the Space Plan layer has both the highest number of links to other layers and the highest link strengths—see also: [5] (p. 289).
The SAGA method uses graphs to represent building layouts and their spatial configuration. In a plan graph, each space is represented by a vertex (or node), and each connection between two spaces is represented by an edge (see Figure 1). Both vertices and edges could contain additional information about the plan layout: vertices regarding the space they represent (e.g. its surface area, access to daylight, …) and edges regarding the connection they represent (e.g. height differences, distances, …). In the present paper, we adopt a purely configurational perspective: the plan graphs do not include any information regarding the size and location of spaces, or the physical distance between them.
A general plan layout can support changing uses without alterations. The use of a building—its functional program—can also be represented as a graph, with vertices representing spaces where particular functions take place, and (combinations of) edges representing the relational proximity between these different functions. From a strictly configurational perspective, ignoring requirements regarding the size or shape of spaces, one can therefore argue that the generality of a plan layout is directly related to the number of distinct graph representations of functional programs that fit within its plan graph. Hence, the potential to support different functional configurations is related to the overall permeability of a plan graph, as graphs with redundant edges can be traversed in multiple ways (they contain rings—i.e. have closed-loop paths). Steadman [12] (pp. 198–207), discussing ‘adaptability and flexibility’ in his book Architectural Morphology, provided a detailed worked example of this idea using a four-room plan, demonstrating that the total number of ways in which a functional program could be made to ‘fit’ inside a four-node plan graph increases with the graph’s total number of edges e. In other words, when a plan graph with v nodes is more permeable (or less linear), it can potentially shelter more unique v-room functional programs, and each of these programs can be organised within the plan graph in more unique ways—at least in a theoretical, configurational sense.
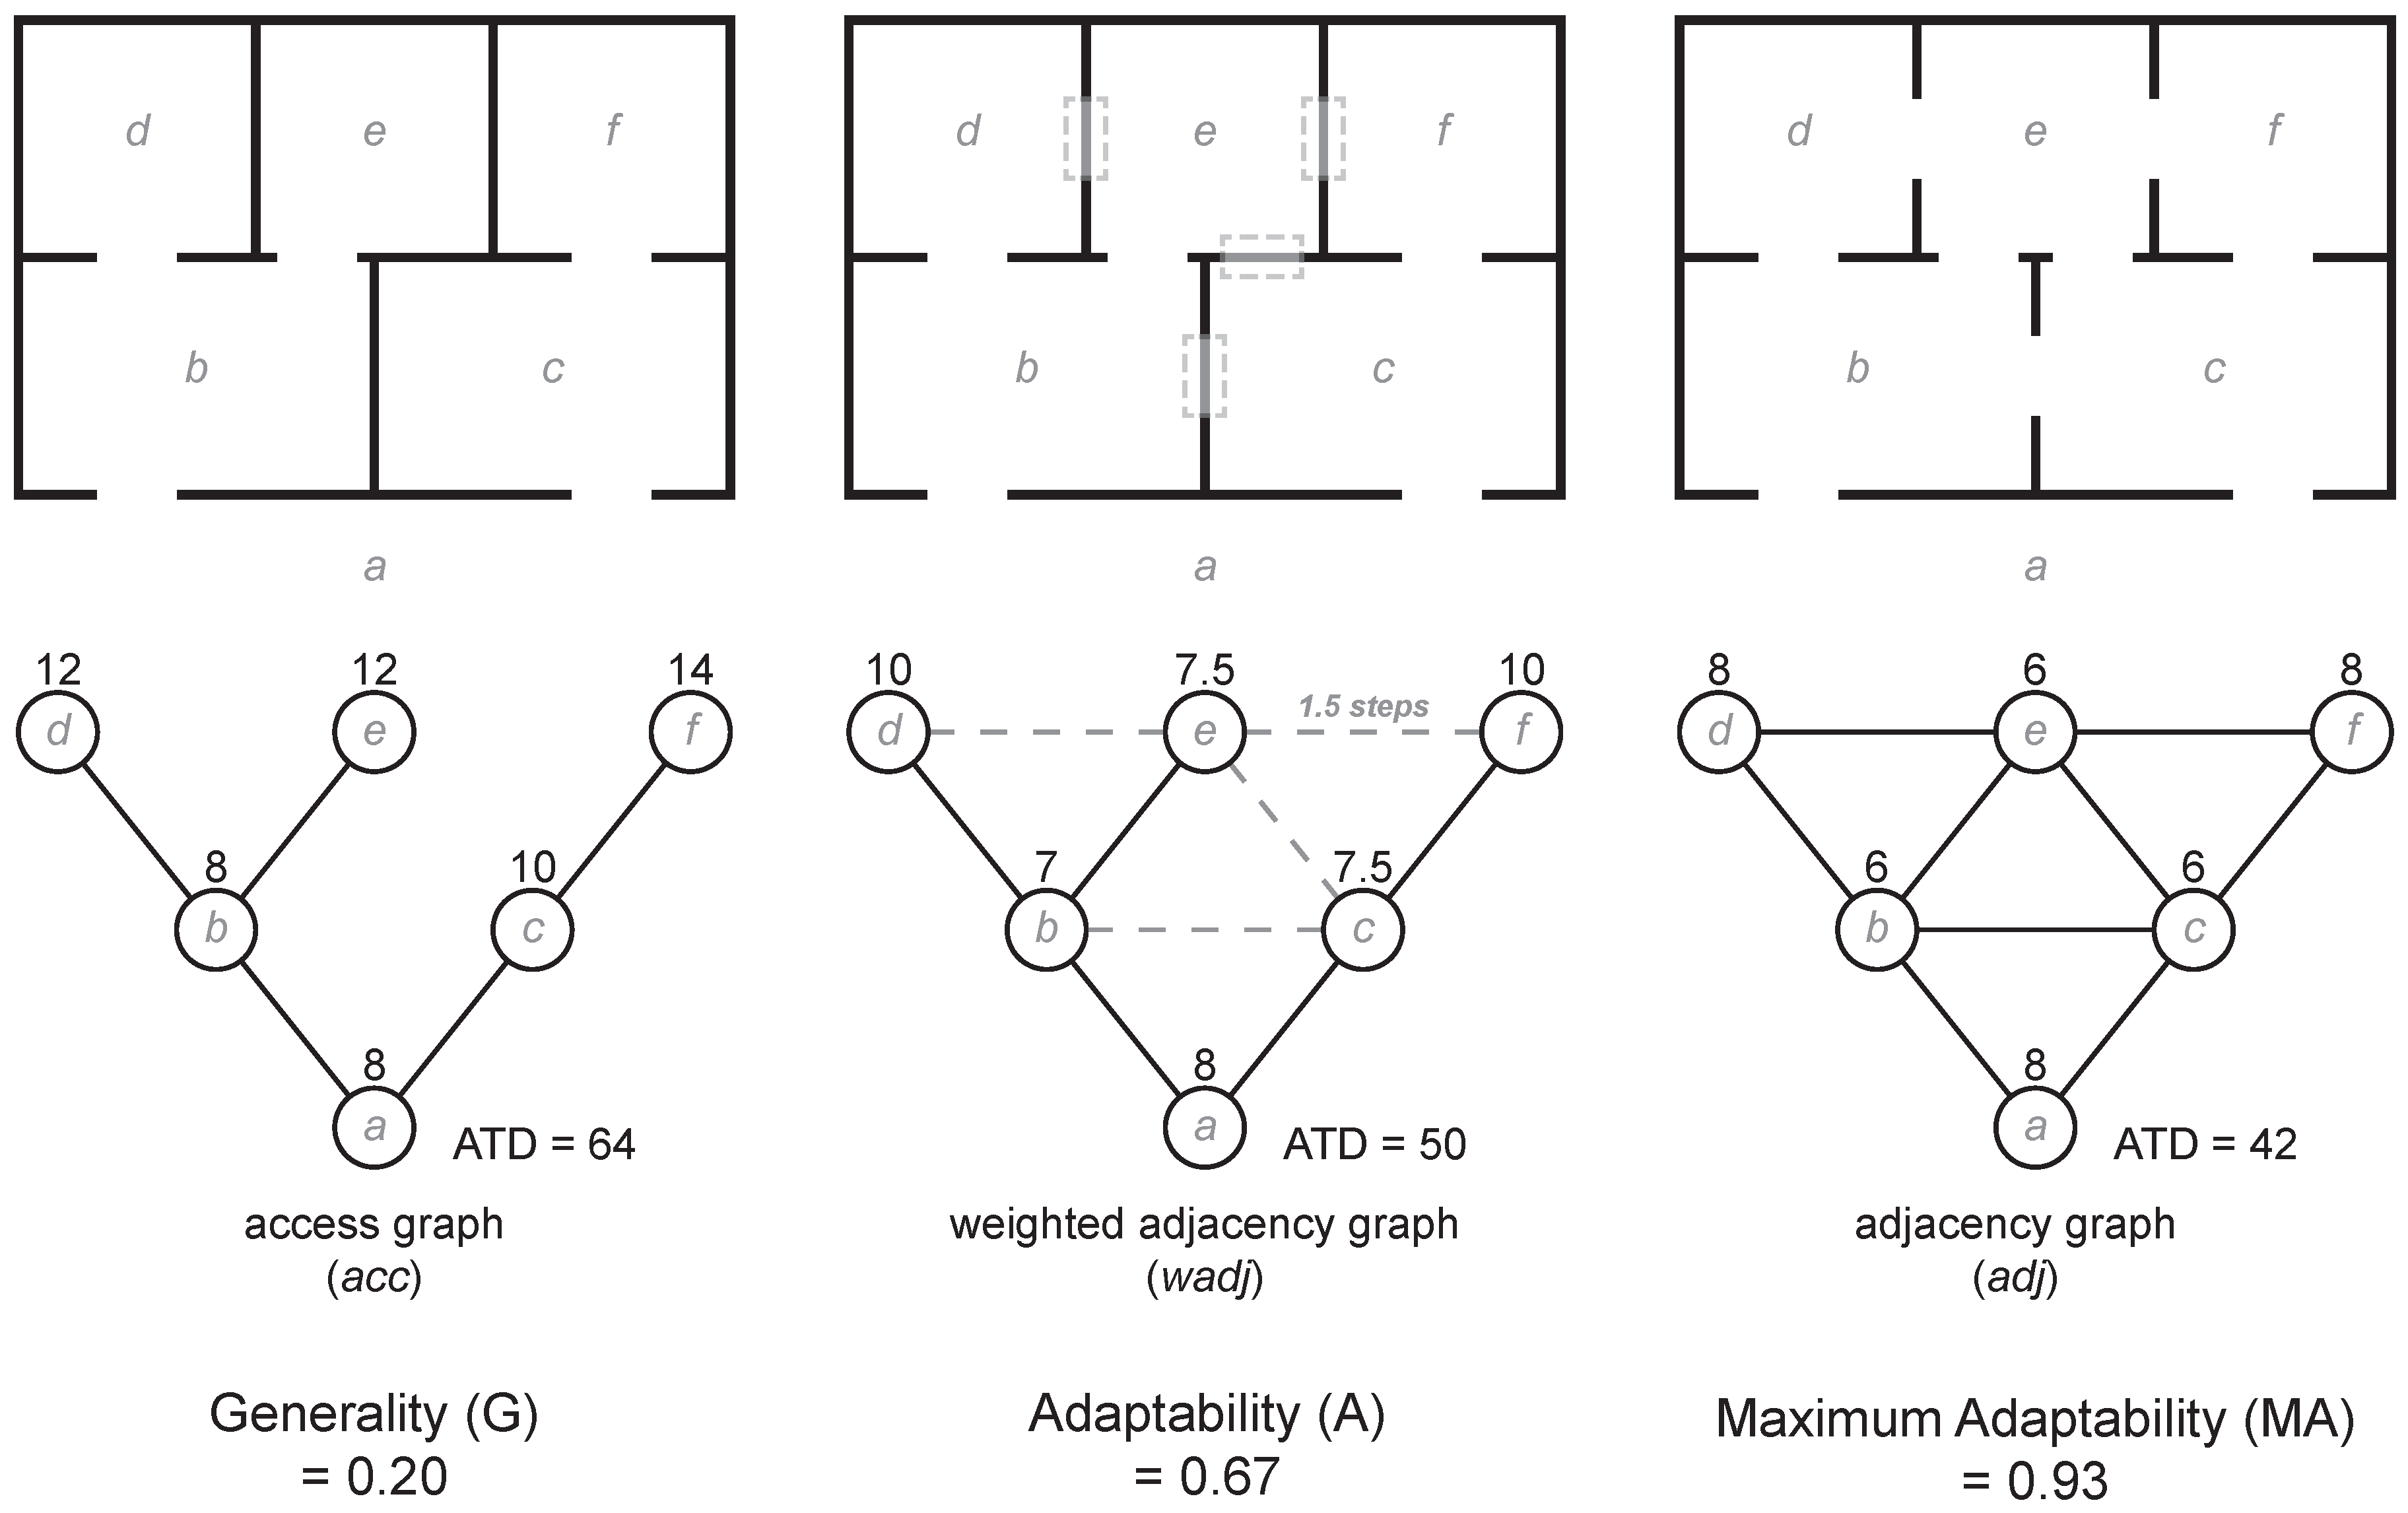
While computing all configurational possibilities for a four-vertex graph is feasible, as the number of vertices increases the number of options quickly becomes computationally unwieldy. An alternative approach is to construct an indicator for permeability based on global graph characteristics, such as the cyclomatic number c () [12] (pp. 189–191, 202–203), which counts the total number of closed faces in a graph (i.e. the number of rings that do not contain other vertices). The downside of a global graph measure is that it cannot measure the relative contribution of particular edges within the overall plan layout. Instead, we propose to quantify the permeability of a plan graph using vertex depth, which is the number of edges that need to be travelled to go from one particular vertex to another—usually a root vertex that has been singled out for analysis. In Figure 1, the plan graphs with root c are drawn under their respective plan layouts, with the distance from the root marked by grey horizontal lines; this type of drawing is a JPG. The Total Depth (TD) of a vertex—a measure used in JPG analysis—is the sum of its vertex depths to all other vertices in the graph. TD indicates how close or far a single space is to all other spaces, so the inverse of TD is a local measure of permeability. We then define Aggregated Total Depth (ATD) as the sum of the TD of every vertex, or the aggregated vertex depth from all vertices to all other vertices. In Figure 1, the fully permeable graph has an ATD of 6, while the linear graph has an ATD of 8. Rather than measuring a characteristic of the overall graph, ATD aggregates characteristics of individual vertices.
The main premise presented in this paper is that the generality of a plan layout increases with its permeability, and that this can be measured using (an inverse form of) ATD. Moreover, adaptability can be interpreted as the potential permeability achievable within a plan layout. The next section discusses these ideas at length. Afterwards, we explain how the ATD-based indicators can be normalised, how to construct plan graphs, and illustrate our premise using SAGA analyses of various plan layouts.
Initially, we developed the SAGA method as a reinterpretation and adaptation of the JPG method, one of the first analysis methods of Space Syntax theory. The JPG is featured extensively in its three seminal books [10,13,14]. For a detailed overview and critique of the method, consult [15]. The aim of the JPG is to study plan layouts in terms of configurations and relations rather than dimensions and geometry. It is used to study how spaces are related and connected, and whether there are correlations between patterns of spatial configuration and social behaviour or space use. The JPG applies and adapts graph theory to quantify these properties and identify important spaces within a building; an important form of analysis compares the integration (a measure of permeability derived from Total Depth) of individual graph nodes. Conversely, the SAGA method quantifies the permeability of an entire plan layout (i.e. the entire graph). Hence, characteristics related to generality and adaptability can be expressed in terms of a plan graph’s ATD values. This implies a shift from local to aggregate vertex indicators, which explains the difference in interpretation and application between both methods: while the JPG method analyses the current use of one particular spatial configuration (i.e. one defined solution in the present time), the SAGA method analyses the potential future uses a spatial configuration could support (i.e. a solution space of hypothetical variants). Because SAGA uses aggregate measures instead of vertex measures, it hence foregoes social interpretation of a specific plan layout in favour of quantifying an unspecified number of potential uses. To avoid confusion between both methods, in the present paper we decided to express all indicators in terms of general graph theory and notation, and introduced a more appropriate normalisation method.
Nevertheless, the SAGA and JPG method are similar when it comes to graph representation, calculation and normalisation, and we often rely on JPG-related literature to illustrate particular points. Moreover, SAGA indicators can also be expressed in terms of JPG indicators (consult [16] for an overview). Two prior conference publications about the SAGA method [16,17] share similar narratives to the present article, but feature different calculation methods and cases; in both, the indicators were expressed in terms of JPG indicators (integration and relative asymmetry, respectively). Herthogs et al. [17] introduced the first results of the method: three indicators (G, A, and MA) applied to two variants of the same floor plan. The calculation method in [17] is incorrect: using average integration values results in a non-monotonic normalisation of the indicator (i.e. normalisation changes the ranking of cases). Herthogs et al. [16] didactically illustrated the main concept behind the SAGA method using two particular historic building types (one of which—the ‘gentry house’—is also discussed in Section 5.1). The five indicators listed in [16] are based on JPG indicators; they produce different indicator scores, as the JPG method relies on a different v-node graph type for its upper bound normalisation.
3. Five Indicators for Configurational Generality and Adaptability
The main premise of the SAGA method is that the permeability of an existing plan layout is a measure of its Generality (G), with permeability expressed as an inverse of the Aggregated Total Depth (ATD) of the corresponding plan graph. As generality is a characteristic of an existing layout, the ATD is calculated using the access graph (acc) of the plan layout, i.e. a plan graph where edges represent physical connections between spaces (with a width of at least a standard doorway, or 0.8 m); this is illustrated in the first plan graph in Figure 2.
As discussed in the previous section, a more permeable plan will have a higher probability to accommodate different functional organisations, as there are more possible ways in which its set of spaces can be connected and functionally arranged. Please note that this requires one to assume that if necessary, connections (doorways) can be closed when a floor plan is used in a different way.
Several researchers have discussed the idea that a building’s spatial configuration determines its capacity to support different uses. For example, Steadman [12] (pp. 198–207) explored the use of graph theory and measures related to permeability to quantify particular characteristics of the ‘adaptability and flexibility’ of plan layouts. Leupen [18] (p. 8) used plan graphs to explore and explain the generality of floor plans, arguing that the level of generality of a floor plan depends ‘on the number of possible arrangements or combinations of activities it permits’ [18] (p. 8). He stated that dwellings where every room can be accessed from a central, functionally neutral hub or via several different routes are easier to adapt to ‘suit different living patterns’ [18] (p. 1), and illustrated this by analysing five general layouts, all of which had star-like or ring-like spatial configurations, leading Leupen to conclude that these are essential characteristics for the generality of a floor plan [18] (pp. 8–9). Manum—e.g. refs. [19,20]—analysed several apartment types using the JPG method in order to understand their spatial configuration, surveyed the inhabitants of these apartments to establish types of usage patterns, and compared both to examine the ‘potential usability’ of housing types. One of the findings of his study was that apartment types with a less deep configuration are used by a wider range of household types [20] (p. 12).
The concept of adaptability can also be expressed in terms of plan graph permeability. In terms of spatial configuration, adaptability could be seen as the possibility to increase the permeability of a building, i.e. the ability to create new connections between rooms. In the access graph of a plan layout, spaces are either connected by a doorway or separated by a wall. If every possible connection between spaces would be made (by adding doorways wherever possible), the access graph would become the same as the adjacency graph, i.e. the plan graph that represents all rooms that are adjacent to each other (but not necessarily connected). Hence, the maximum permeability that can be achieved in a particular plan layout is proportional to the inverse of the ATD of its adjacency graph (adj). We call this indicator Maximum Adaptability (MA); as with the Generality indicator, the MA indicator is inversely related to ATD.
Access graphs have binary edges: an edge either exists or not. Now imagine a connection that instead expresses a level of permeability: zero being impermeable, one being fully permeable, and values between zero and one expressing degrees of permeability. These degrees could represent the ease or ‘probability’ of creating new doorways. For example, it would be easier to connect two rooms separated by a stud wall than by a load-bearing brick wall.
We can represent this on a plan layout using a weighted adjacency graph. If we define the graph weight as the reciprocal of the probability, existing connections between rooms will have a weight (or vertex depth) of 1, while connections that pass through walls have a weight that is higher than 1—the inverse of a probability lower than 1 results in a graph weight that is higher than 1. In Figure 2, the second plan layout is identical to the first, except for four walls with an increased degree of permeability; instead of being impassable, it takes 1.5 steps to ‘pass through’ these walls. As a result, the TD of the individual nodes and the ATD is reduced. This implies a shift from vertex depth to shortest path calculations, from graph theory to network theory.
We put forward that the permeability of a plan’s weighted adjacency graph (wadj) is a measure of the Adaptability (A) of the spatial configuration, with weights representing the difficulty to create a doorway between two unconnected rooms.
Existing connections have a permeability rating of one, while ‘potential’ connections have a permeability rating between zero and one. The resulting weights are the reciprocal of the permeability rating, resulting in connections that take more than one step to travel. Section 4.1.2 elaborates on the weighting of permeability.
We did not encounter prior studies using weighted plan graphs to directly measure adaptability. However, the basic idea is present in related work. For example, in an early study on the relation between building adaptability and the social use of space, Priemus [21] used weighted adjacency matrices to express and calculate the relationship between and clustering of different functions in a house (e.g. sitting, drinking coffee, doing laundry), with weights representing how closely related functions are. Based on surveys, Priemus also weighted user appreciation for walls with different degrees of permeability to separate these functions [21] (pp. 210–213). The canonical works of Space Syntax contain examples of spatial layouts with multiple possible graphs that represent a change in use: e.g. Hanson’s analysis of the Rietveld-Schröder house [14] (chapter 7), or Hillier and Hanson’s discussion of an Ashanti palace with special passageways for royals [10] (pp. 167–172). More recently, Behbahani et al. [22] used weights to represent characteristics of ‘spatio-visual’ relations between spaces, including the size of wall openings, to inform a discursive grammar method. Eloy [23,24] used JPGs to inform the development of a shape grammar for housing transformation and rehabilitation, with the aim to generate and evaluate alternative plan layouts for housing units that need to be adapted. The methodology included comparing the JPG of an original plan to those of refurbished variants, and labelling graph edges according to wall type (also in relation to their permeability). Several of her recommendations to improve a dwelling’s ‘flexibility’ imply increasing or maintaining the permeability of internal walls.
G, A, and MA are absolute measures that can be used to compare different plan layouts. However, indicators G and A fail to take into account two important aspects related to the buildings these graphs represent. Firstly, the maximal permeability that can be achieved in a building with v spaces depends on the overall proportions of the building (layout). For example, a more rectangular building will likely have a higher ATD than a more square building, even if both have the same number of spaces and are fully permeable, as the proportions of a rectangular building are deeper and could restrict certain (shallower) configurations of spaces. Secondly, because the wadj is an extension of the acc, a high adaptability score could simply be the result of a building’s very general spatial layout, and not the high permeability ratings of its internal walls.
Hence, we introduce two relative indicators that use MA as a benchmark for G and A—they can be used to determine how general or adaptable a floor plan is compared to the achievable minimum and maximum. Normalising G and A relative to MA results in the indicators Normalised Generality (G) and Normalised Adaptability (A), respectively. This concept is similar to a graph’s gamma index [25], a global graph characteristic expressed as the number of edges in an access graph divided by the theoretical maximum edges in a planar graph (i.e. ). However, unlike the depth-based SAGA indicators, the gamma index cannot measure the relative impact of the location of a vertex within the overall spatial configuration.
4. Step-by-Step Overview of a SAGA Analysis: Graph Representation, Calculation Methods and Conventions
This section describes the steps of a SAGA analysis: how to use its software tool, how to represent building layouts as graphs, how to rate the permeability of walls, and how to calculate and normalise the indicators. Table 1 provides an overview of the steps.
We developed a software tool combining Rhinoceros 3D [26], used to open a plan and draw convex maps and graphs, and its visual programming plugin Grasshopper [27], used to calculate all indicators and generate relevant colours, geometries, and vector images. Convex maps and graphs can be drawn in digital plans and models, or on top of images (e.g. photographs of archived building plans). Graph calculations have been implemented using Grasshopper plugin Spiderweb [28]. A floor plan can be scored within minutes. We refer to Figure 5 for an example of the output of the software tool.
4.1. Constructing Three Permeability Plan Graphs
4.1.1. Convex Mapping
To construct plan graphs consistently, the spaces in a building need to be formally defined. As with the JPG method, SAGA uses convex mapping to represent a plan layout as a plan graph. Traditionally, a plan graph is constructed using convex spaces: spaces in which every point can be seen from all other points. Convex spaces are representations of the visible space in a building [15] (p. 450), and do not necessarily correspond to functional rooms. Most notably, ‘L-shaped’ rooms are not convex and need to be split. Hillier and Hanson [10] (pp. 97–98) defined a rule-set stating that a non-convex space needs to be divided into the fewest and fattest convex spaces as possible, the former taking precedence over the latter, with fatness defined as the area-perimeter ratio of a convex space [10] (pp. 16–17).
The use of convex spaces can lead to a proliferation of the amount of spaces in the plan graph. This is especially the case in floor plans that have small setback spaces along walls due to columns, chimneys, alcoves, bay windows, etcetera. Ostwald [15] (p. 450) described how several authors do not use convex spaces to create JPGs, but use functional spaces instead. However, the SAGA method relies on convex spaces for the resolution of its indicators. Using functional spaces would result in a loss of information about the connections between spaces, as it becomes impossible to distinguish between the different walls of an L-shaped room. The density of (functionally useful) convex spaces determines the level of detail (i.e. number of edges) of the resulting graphs, and hence the resolution of the method.
To address particular issues of conventional convex mapping, we developed an alternative rule-set for SAGA. Firstly, we introduced a rule that allows the removal of convex spaces that are less than 0.8 m wide. Such spaces are not wide enough to accommodate a doorway, and can hence support neither movement nor occupation. When constructing convex maps, these spaces are simply ignored, and connections between two spaces that pass through them are replaced by direct connections. This results in far fewer convex spaces. Secondly, we proposed rules to make it easier to draw convex maps ‘by hand’. We avoid the need to measure and compare perimeters iteratively by proposing a ‘fewest and most connected’ rule-set, which results in very similar convex maps. It does require several additional rules to guaranty consistency. In future, we plan to integrate methods to automate the construction of convex maps, e.g. refs. [29,30], removing what is arguably the most error prone human input.
4.1.2. Wall Permeability Ratings
The weights of potential connections in the adaptability graph are determined by permeability ratings, which express the probability of adding a doorway to a wall on a 0–1 scale. The permeability rating of a wall can depend on various criteria, such as whether it is structural or not, designed for disassembly, contains service ducts, etcetera. It is not the aim of this paper to introduce a comprehensive method to determine the permeability ratings of different wall types. The concept of an adaptability indicator can be adequately illustrated using a provisional set of values, as the concept of graph weights does not rely on the actual values of the weights.
We suggest provisional values based on the probability of creating doorways that are 0.8 metre wide; a conventional width that arguably represents a minimum comfort. We used a basic system of permeability ratings, shown in Table 2. There are three possible ratings: 0.3, 0.6 and 0.9, resulting in weights of 3.33, 1.66 and 1.11 respectively. There are also two modifiers that reduce the rating by 0.3, used if a wall has embedded plumbing, when it is load-bearing, or when it is a dividing wall. If a permeability rating becomes zero, the corresponding graph edge is removed. Walls with existing connections have a weight of 1 (fully permeable).
These provisional values only take into account constructional criteria. The list could be expanded to include, for example, functional and behavioural criteria, such as the current use of an adjacent space (e.g. whether a room is private or not), or criteria related to cost (e.g. whether a room houses specialised equipment or not). In future renditions of the method, we plan to implement a more elaborate framework to quantify wall permeabilities—e.g. refs. [31,32]. Both convex mapping and permeability weighting could be automated in a Building Information Modelling environment.
4.2. Calculating and Normalising SAGA Indicators
4.2.1. Normalising Scores Relative to Graph Size and Type
The ATD of a plan graph is calculated by aggregating the vertex depths or shortest paths from all vertices to all other vertices. The ATD will naturally increase with the size of a plan graph, i.e. its number of vertices v. Hence, results need to be normalised for graph size to make them comparable. We normalise the ATD value of a particular v-size plan graph relative to the highest and lowest achievable ATD in a v-size graph. The JPG method has an analogous normalisation, transforming TD to Relative Asymmetry, which is a normalisation relative to its highest and lowest possible values—the end node of linear graph and the hub of a star graph, respectively [10].
The graph type with the highest ATD (i.e. the least permeable) is a linear graph. The ATD of a linear graph with v vertices is:
The graph type with the lowest possible ATD (i.e. the most permeable) is not straightforward to determine. A complete graph, where all vertices are connected, would result in the lowest ATD, but is physically impossible for all but the smallest sized plan layouts: unlike vertices, rooms are not dimensionless. A wheel graph—i.e. a ring with a spoked central hub—is a highly permeable plan graph that is physically possible (e.g. interconnected rooms around a central room or corridor). The ATD of a wheel graph with v vertices is:
We can then derive the Permeability (P) of a v-node plan graph by normalising its ATD relative to the minimum and maximum ATD achievable:
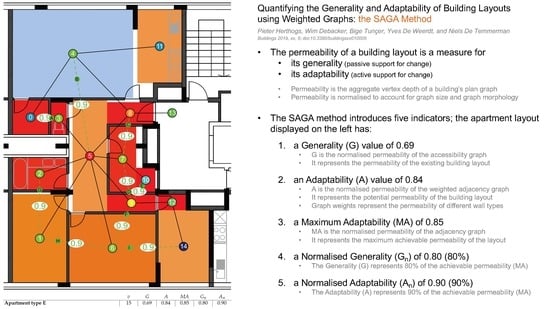
The Generality (G), Adaptability (A), and Maximum Adaptability (MA) of a plan graph are the Permeability of its access graph (acc), weighted adjacency graph (wadj), and adjacency graph (adj), respectively. For example, the Adaptability of the plan layout in Figure 2 is:
These normalisations have a 0–1 range. Each of the three indicators express the percentage to which they achieve maximum permeability, i.e. how non-linear or wheel-like their plan graph is. Please note that because these measures are normalisations, there is no need to invert ATD or average it per vertex (unlike in the JPG method).
Determining the most suitable graph type to represent the smallest achievable ATD warrants further study. While a wheel graph is highly permeable and physically possible, the likeliness of it occurring in the built environment will likely decrease as v increases. In buildings, the depth of the spatial configuration does not increase uniformly with the number of spaces in a building, but increases at a higher rate [10]. Larger buildings tend to be divided into units, sections, wings, or courts connected by corridors or passageways, resulting in multiple integrated clusters (i.e. units) linked by linear segregating spaces (i.e. the circulation between those units). In the JPG method, Relative Asymmetry values are further normalised to take this into account; in JPG-related literature, this normalisation process is subject to much debate and scrutiny, see e.g. ref. [33] (p. 8), ref. [34], ref. [15] (p. 453), which has led to several alternative approaches. Moreover, it is likely that particular building types tend towards particular graph configurations or overall dimensions. Perhaps such differences ought to be taken into account in SAGA’s indicators, using different normalisation graph types for different building types. In future, we will likely devise a more general approach to normalise ATD; for now, comparisons between graphs of significantly different sizes will likely have some degree of normalisation bias.
4.2.2. Normalising Scores Relative to Maximum Adaptability
The final transformation, normalising G and A relative to MA, results in Normalised Generality (G) and Normalised Adaptability (A), respectively. They reflect how much Generality and Adaptability have been achieved in the plan layout relative to the maximum achievable Permeability score for that layout. The formulas are:
The smallest possible Generality score is always zero (by definition, due to normalisation). G and A both have a 0–1 range.
5. Illustration: Six SAGA Analyses
This section illustrates the SAGA method by analysing plan layouts and discussing their indicator scores. Figure 3 and Figures 5–8 show examples of SAGA analyses. In the figures, each convex space is represented by a node in its center, existing connections are drawn between nodes using black lines, and the connections of the adaptability graph are drawn in green, with their probabilities attached to the midpoints of the edge. Node colours are assigned based on a relative gradient from blue (highest Total Depth) to red (lowest Total Depth).
5.1. Belgian ‘Gentry Houses’
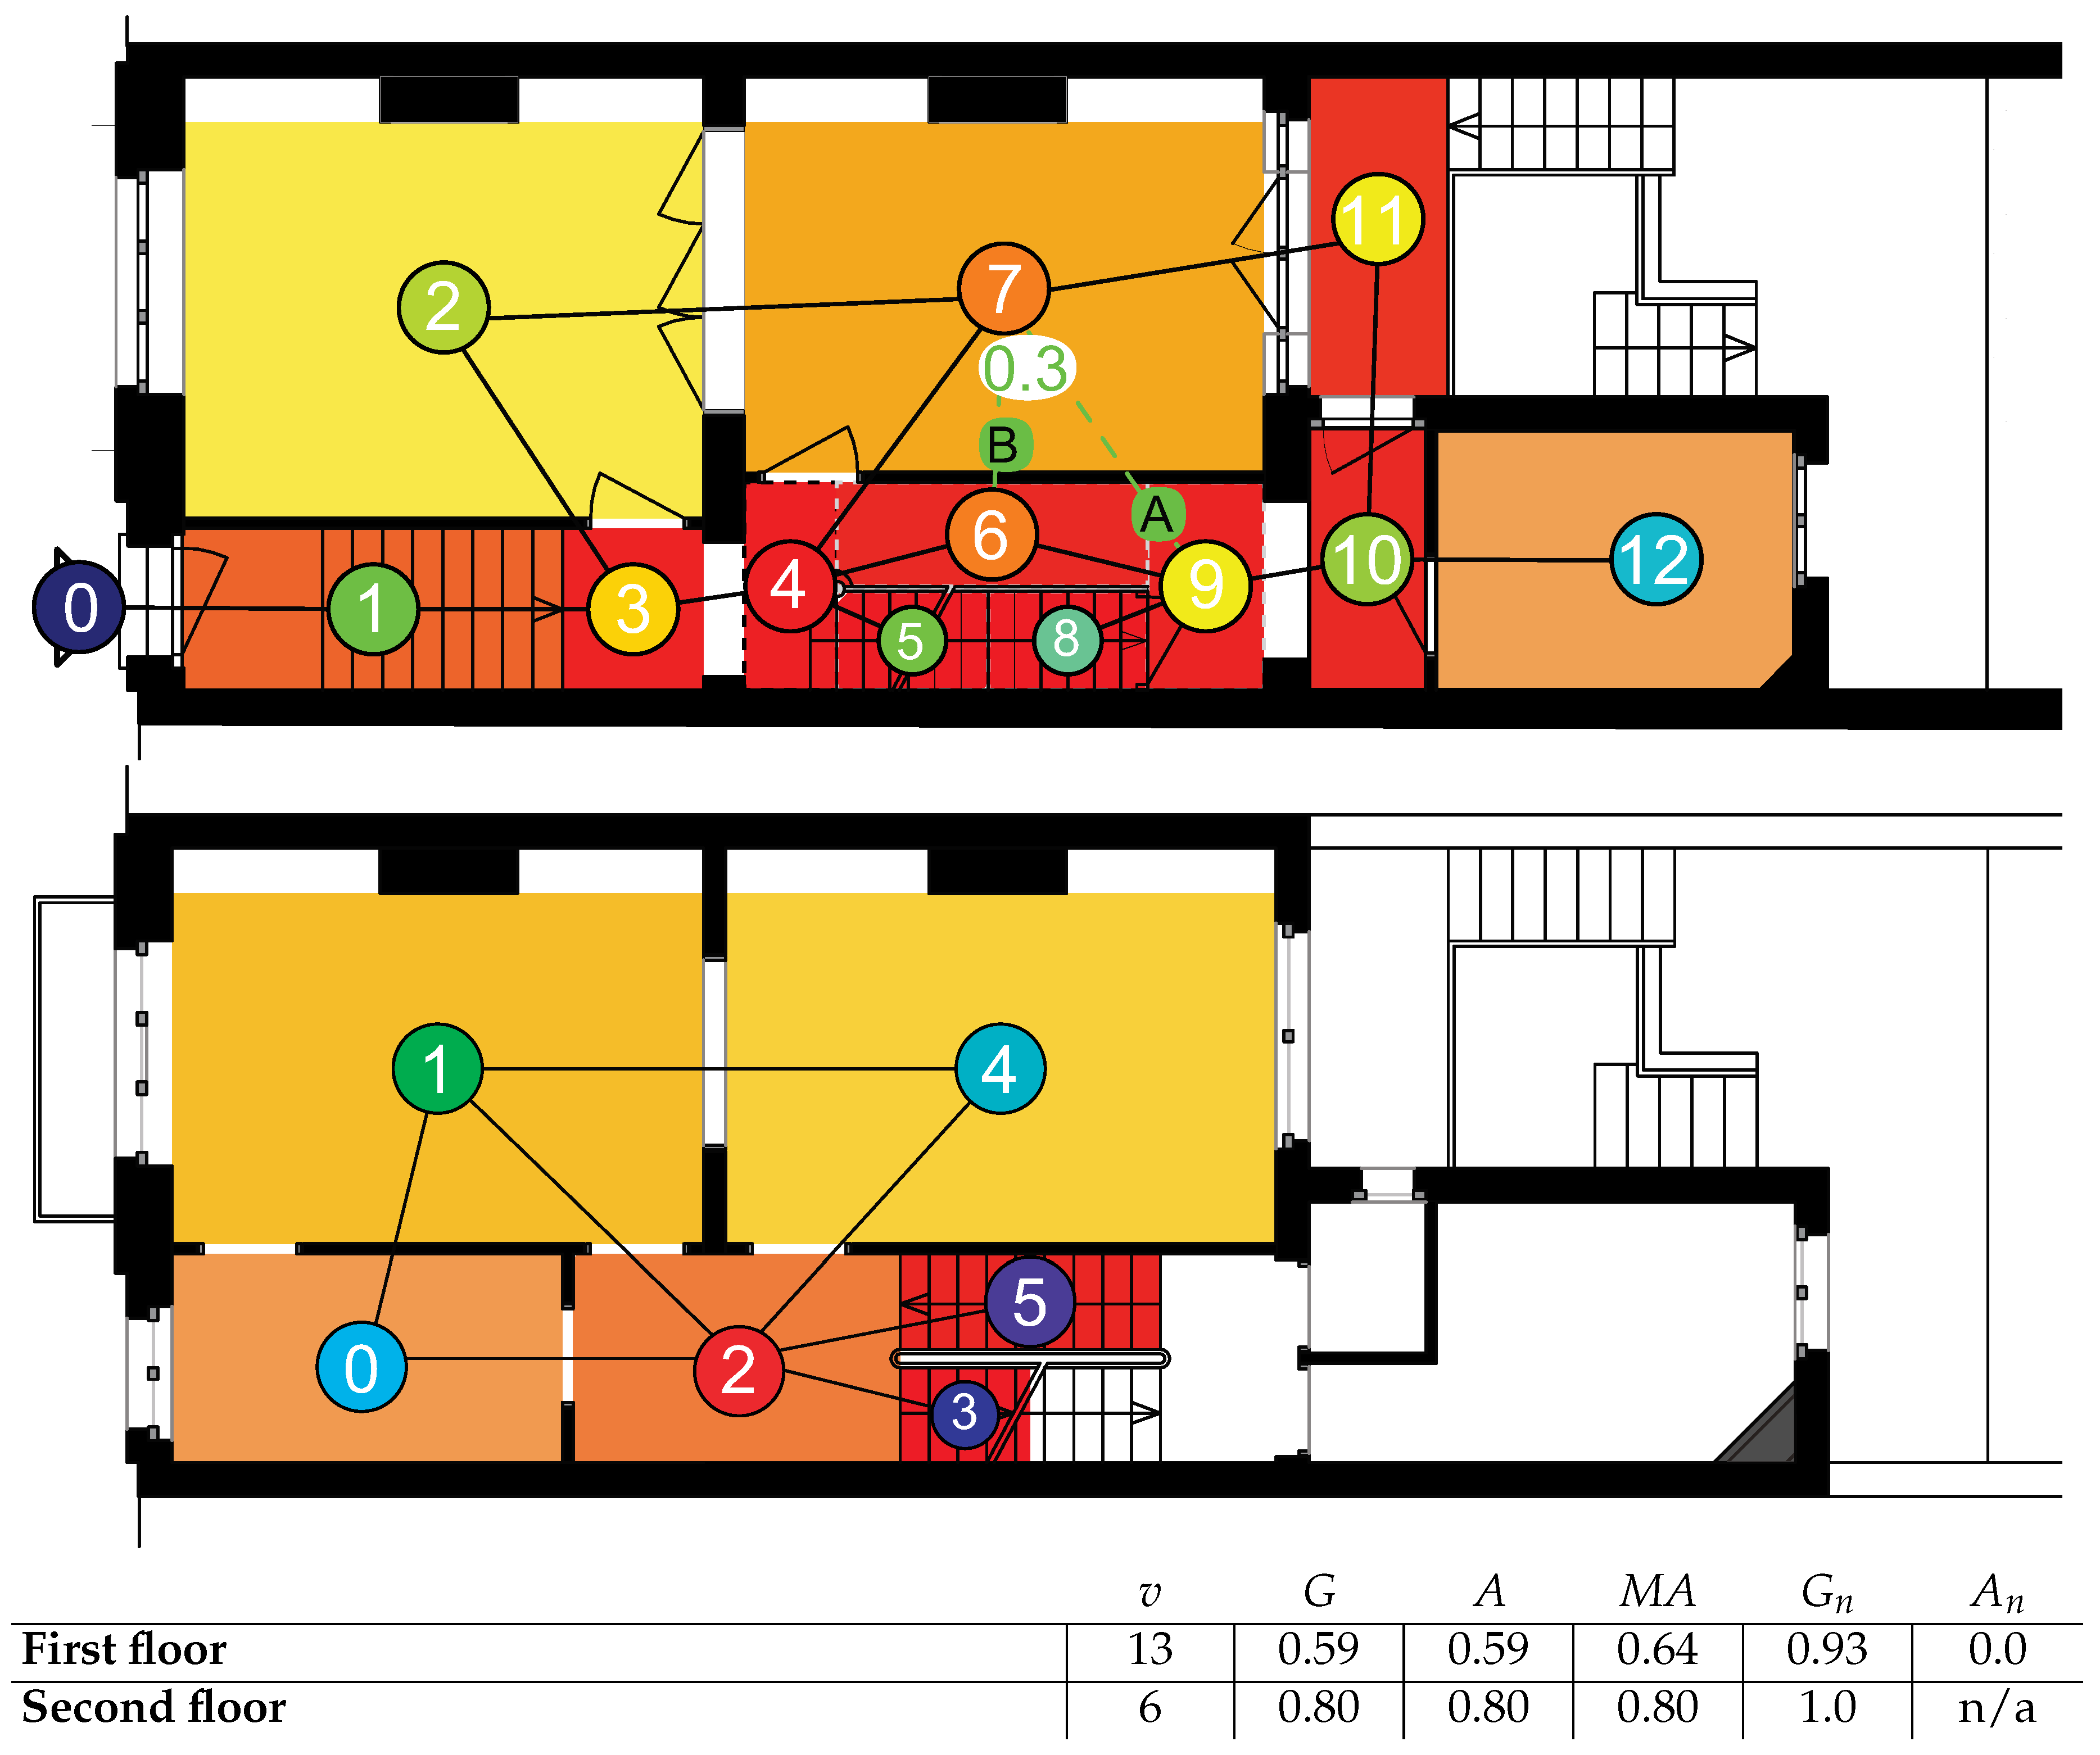
The first two layouts are floors of a nineteenth-century ‘gentry house’ (French: maison bourgeoise; Dutch: herenhuis), a ubiquitous Belgian housing type. In Belgium, gentry houses are commonly considered to be highly general buildings. Figure 3 shows the SAGA analyses of the first two floors of a typical gentry house [35]—note that analyses are always done per floor level, by convention. Gentry houses reflect the lifestyle of the bourgeoisie in nineteenth-century Belgium, and had to support various household functions. While originally built for upper class families and their staff, today they have often been converted into apartment units, student housing, office spaces, or small commercial businesses, or still serve as a single-family dwelling. In Brussels, this building type represents about 25% of the residential housing stock—[35], authors’ calculation.
A gentry house layout is organised perpendicularly to the street, featuring a circulation zone with staircases on one side, and two or three adjacent and connected spaces on the other. As a result, its spatial configuration typically has a high number of rings. While this is evident in the ground floor plan layout, its Generality score of 0.59 is not remarkably high, likely because this entry level floor has several linear connections to other levels. Worth noting is that this floor has an A of zero; there are only two walls that could be opened up, but their permeability rating is too low to influence ATD calculations. The spatial configuration of a gentry house is very specific, and has little opportunity for adaptation.
The SAGA indicator scores for the second floor illustrate the gentry house’s defining feature in terms of Generality: all rooms of this standard plan are fully interconnected, resulting in a G, A, and MA value of 0.8. A typical house has two to four of such floors. There is no measurable Adaptability, as the access graph equals the adjacency graph (stairwells are impermeable by convention). For the same reason, the G is 1.0. This highly permeable plan layout, together with other characteristics—such as non-specialised rooms with ample surface areas, French doors, and good daylighting—helps to explain the highly versatile use of this building type.
5.2. Apartments Redesigned for Change
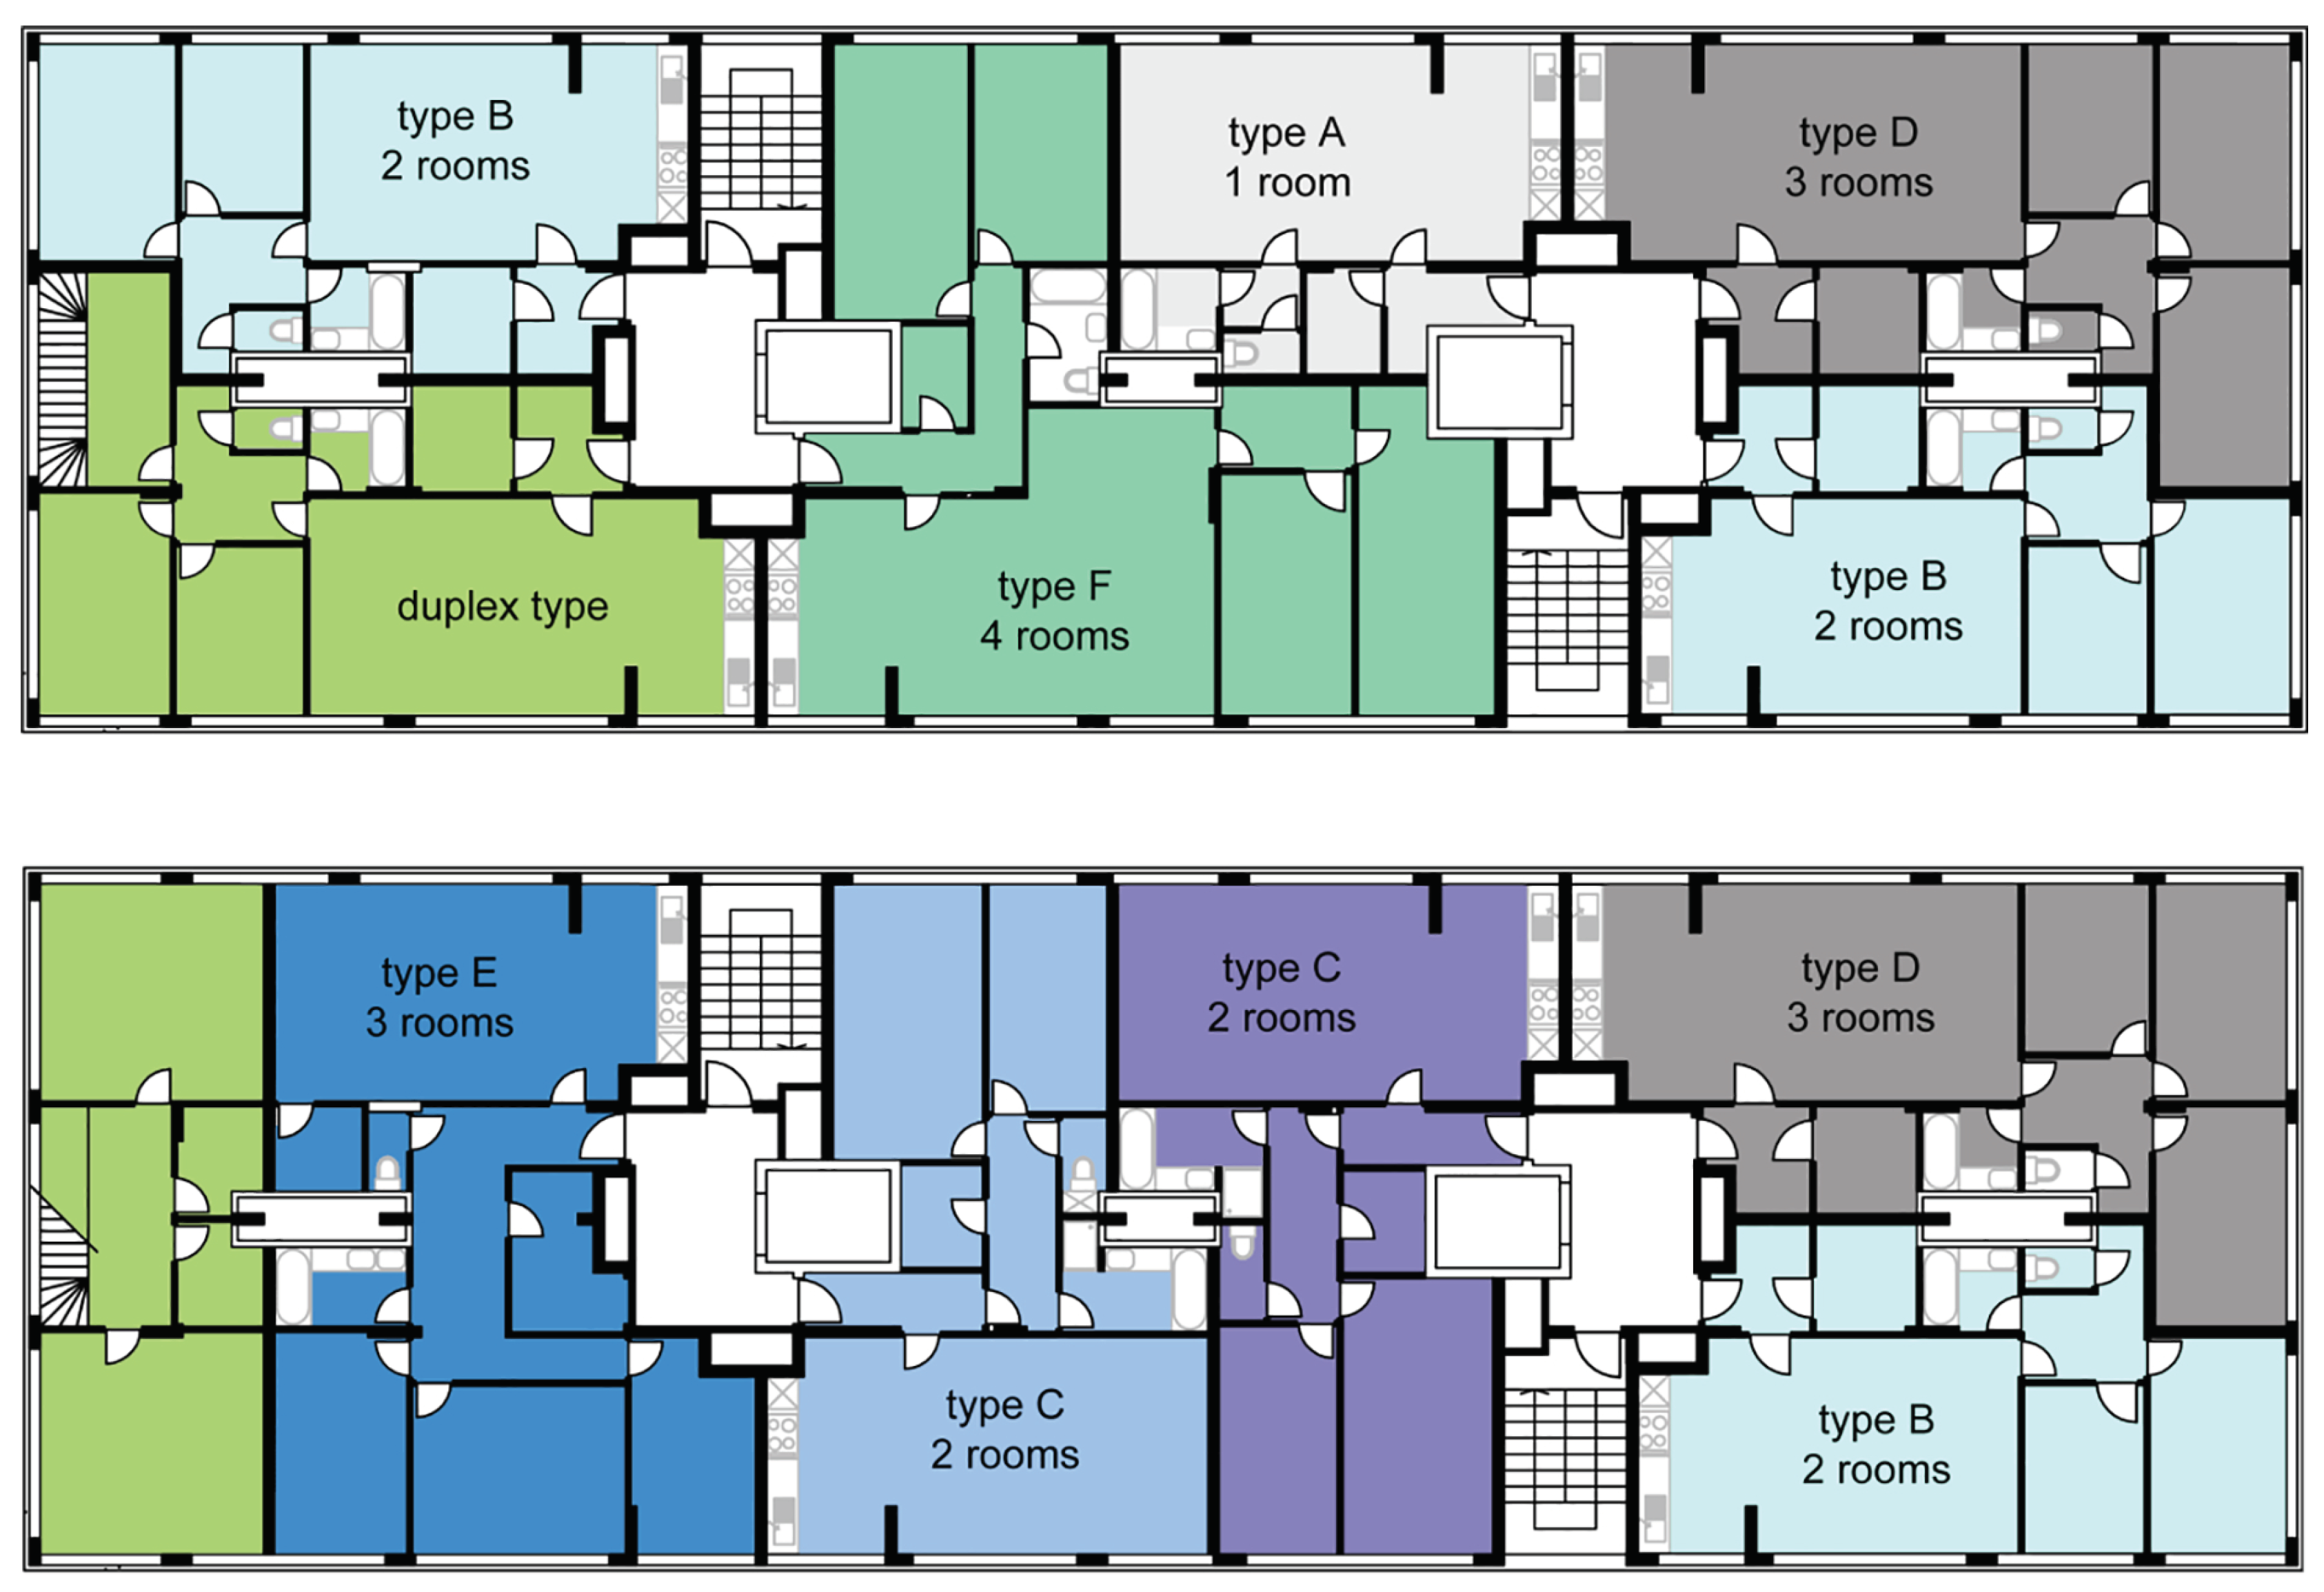
The next four layouts are apartment units from a proposal to refurbish a medium-rise social housing block, built in 1972, to improve its adaptability. Developed by Paduart [36], a key feature of this proposal is the use of removable and reusable walls, fully designed for disassembly. Figure 4 shows all units of Paduart’s proposed ‘redesign for change’; in this paper, we only discuss the SAGA scores of unit E (highest G), unit F (lowest G), unit A (lowest G), and a redesigned alternative version of unit A that improves its Generality.
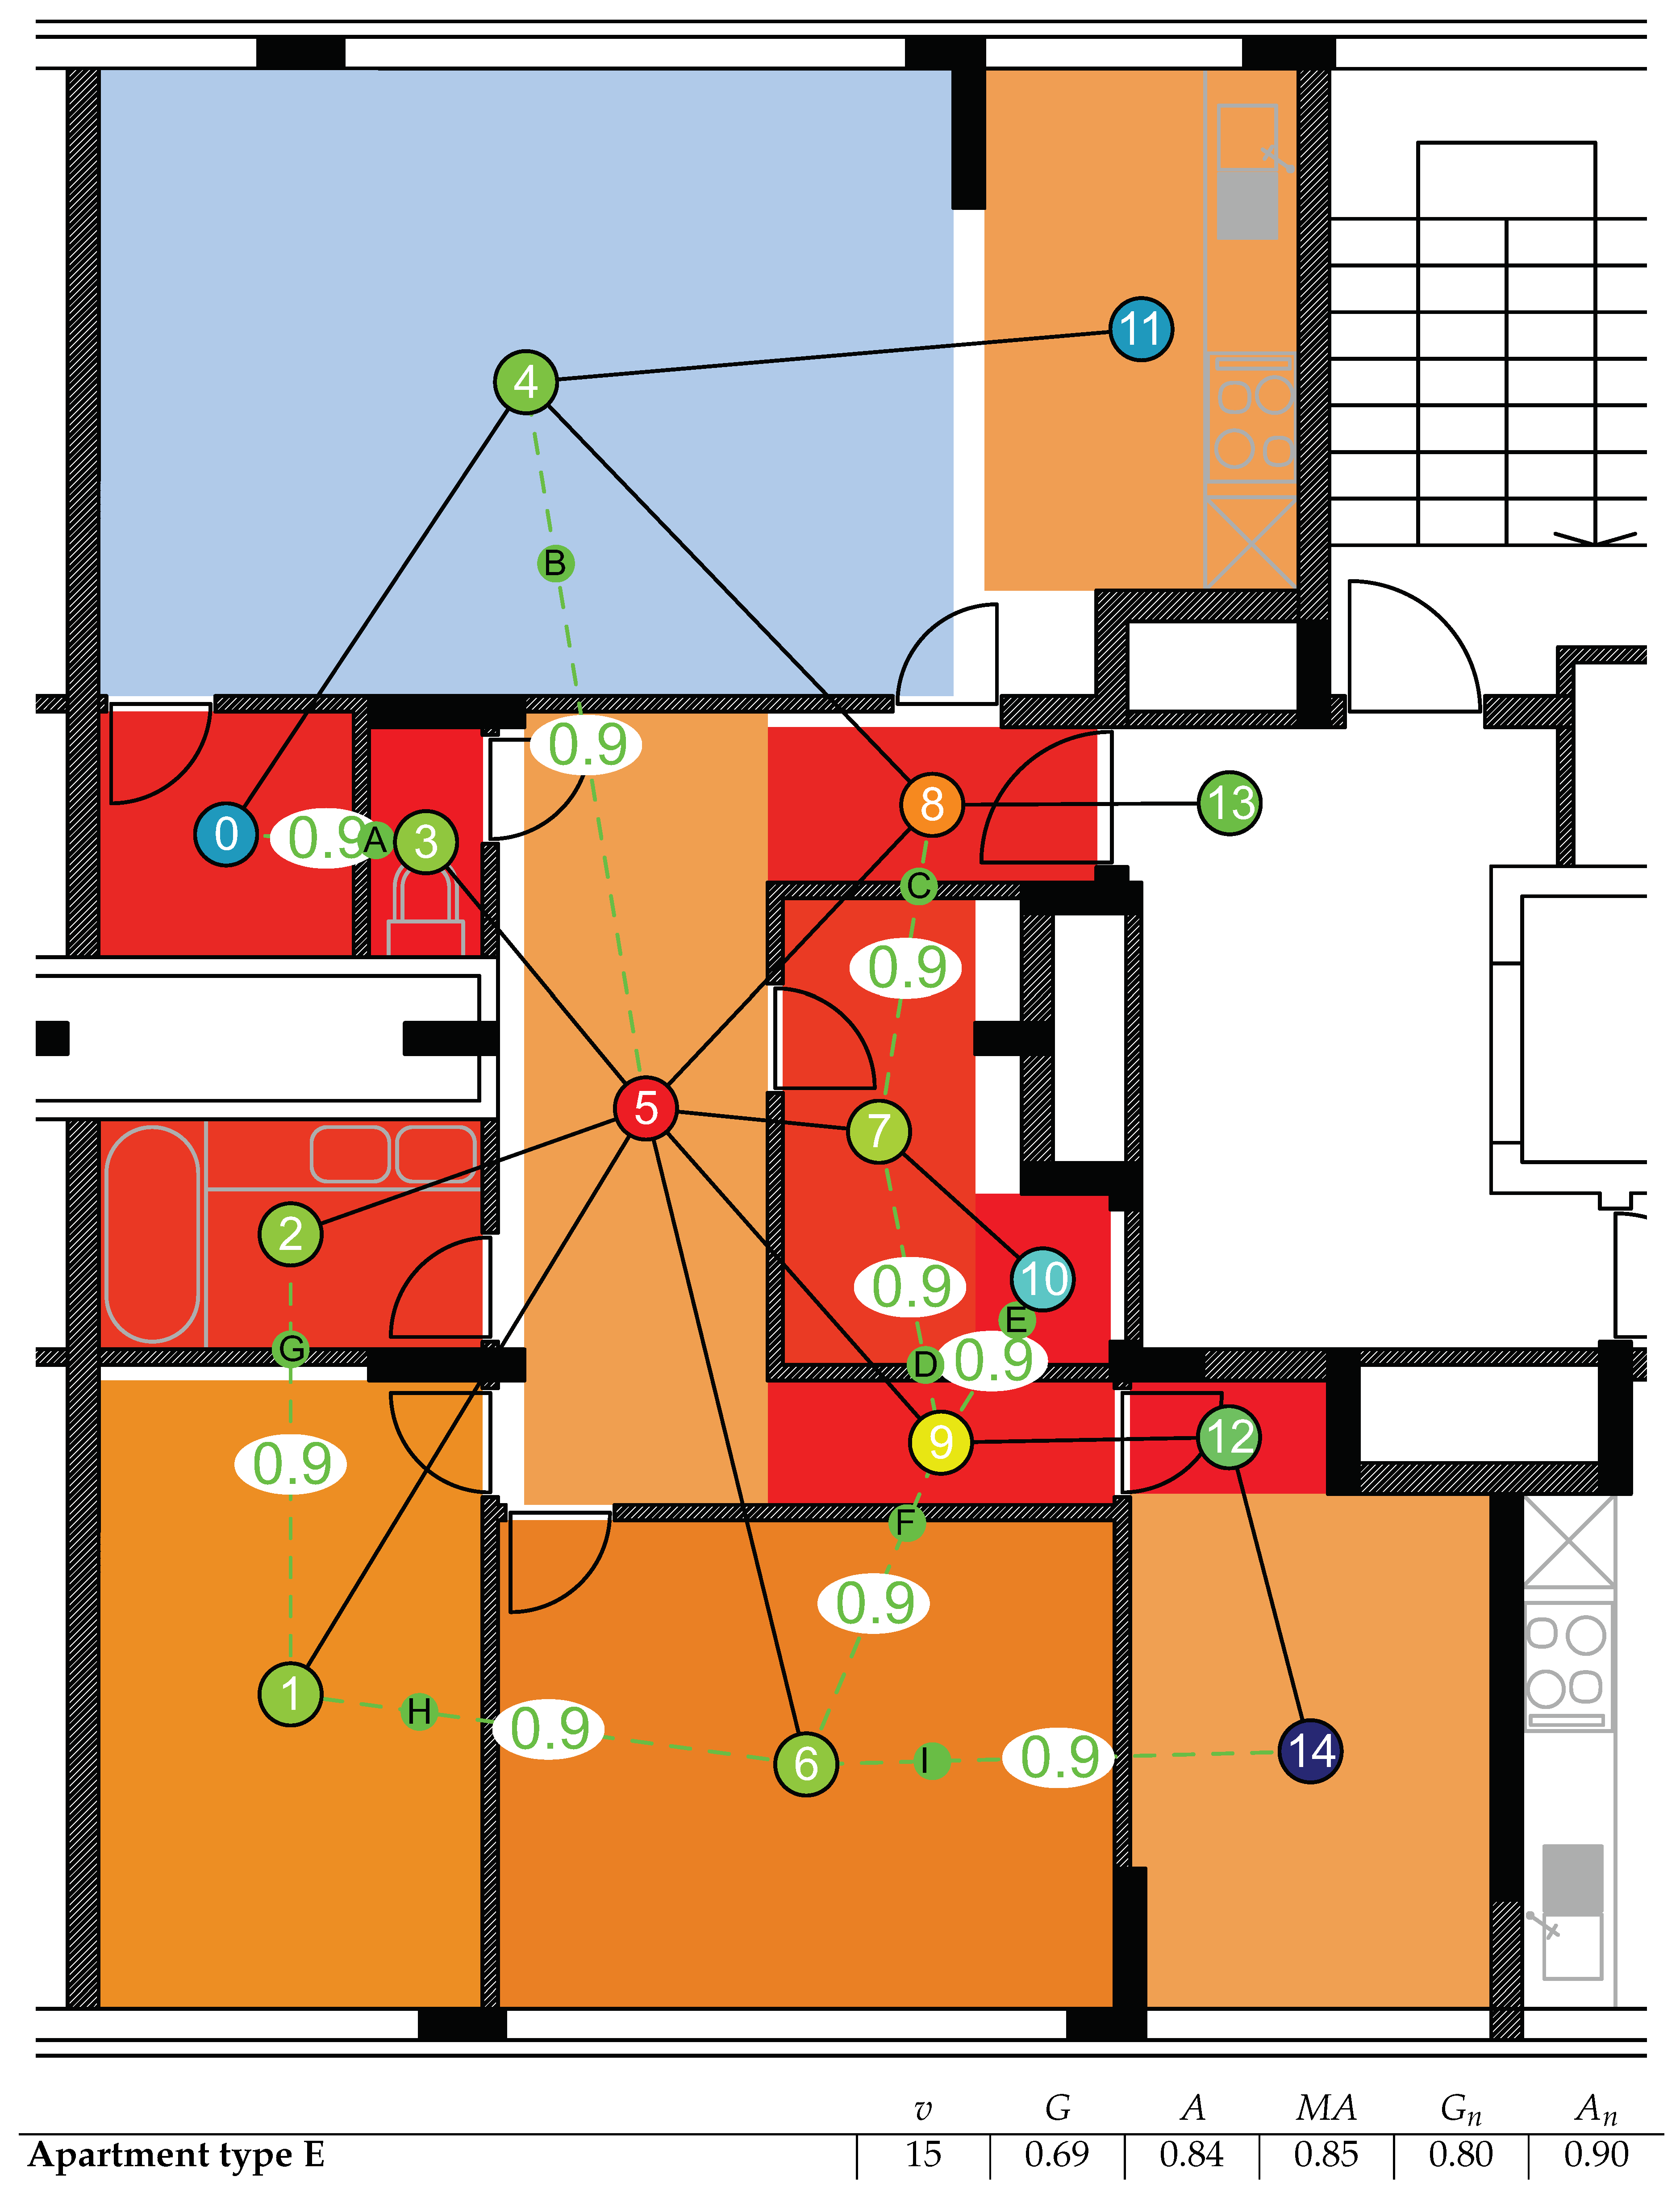
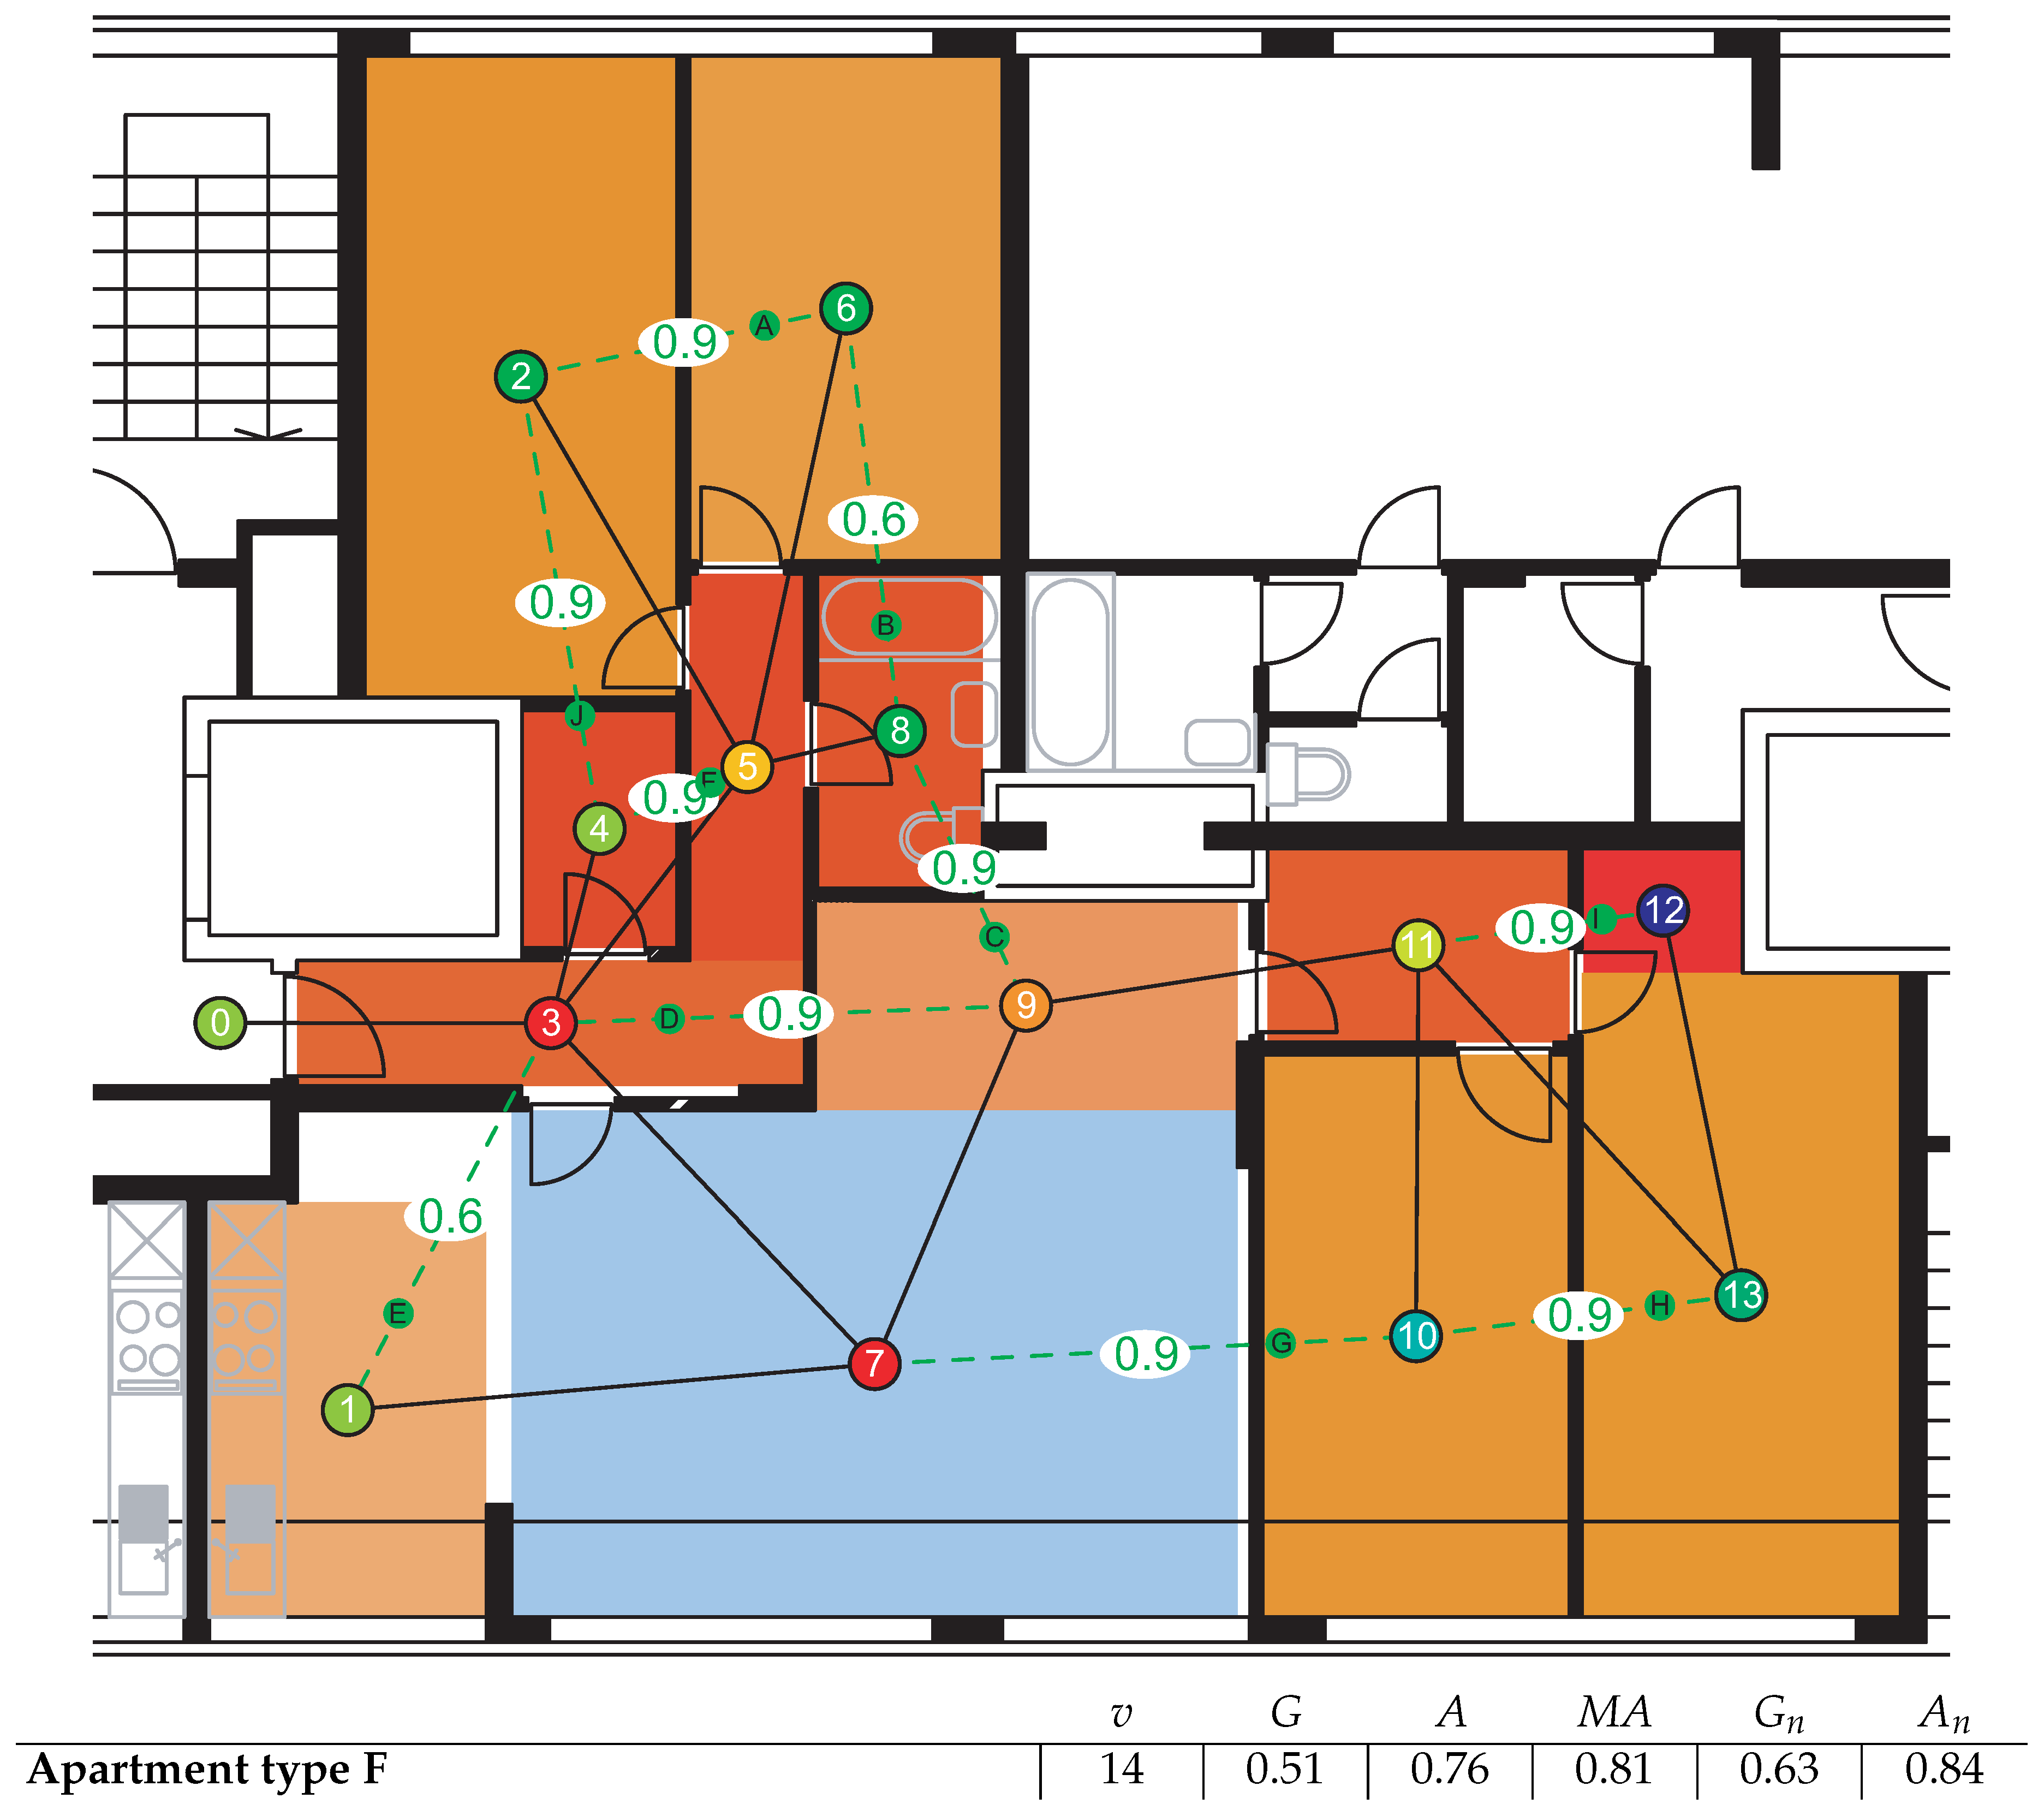
Apartment E (Figure 5) has the highest Generality of all the apartment types in the set (G = 0.69). All the spaces or functional clusters are connected to a neutral U-shaped hallway. Hence, spaces can be accessed independently, making the spatial configuration more permeable. Unit E is also the most Adaptable (A = 0.84). Because the kitchen, bathroom, toilet, and laundry have been directly connected to service risers, none of the nine potential new connections have a reduced permeability rating due to plumbing. The apartment layout achieves 80% of its Generality (G = 0.8), and 90% of its Adaptability (A = 0.9). Per comparison, Apartment F (Figure 6), which has a similar graph size, has the lowest Generality in the set (G = 0.51), but a relatively high Adaptability and Normalised Adaptability (0.76 and 0.84, respectively) due to the removable walls.
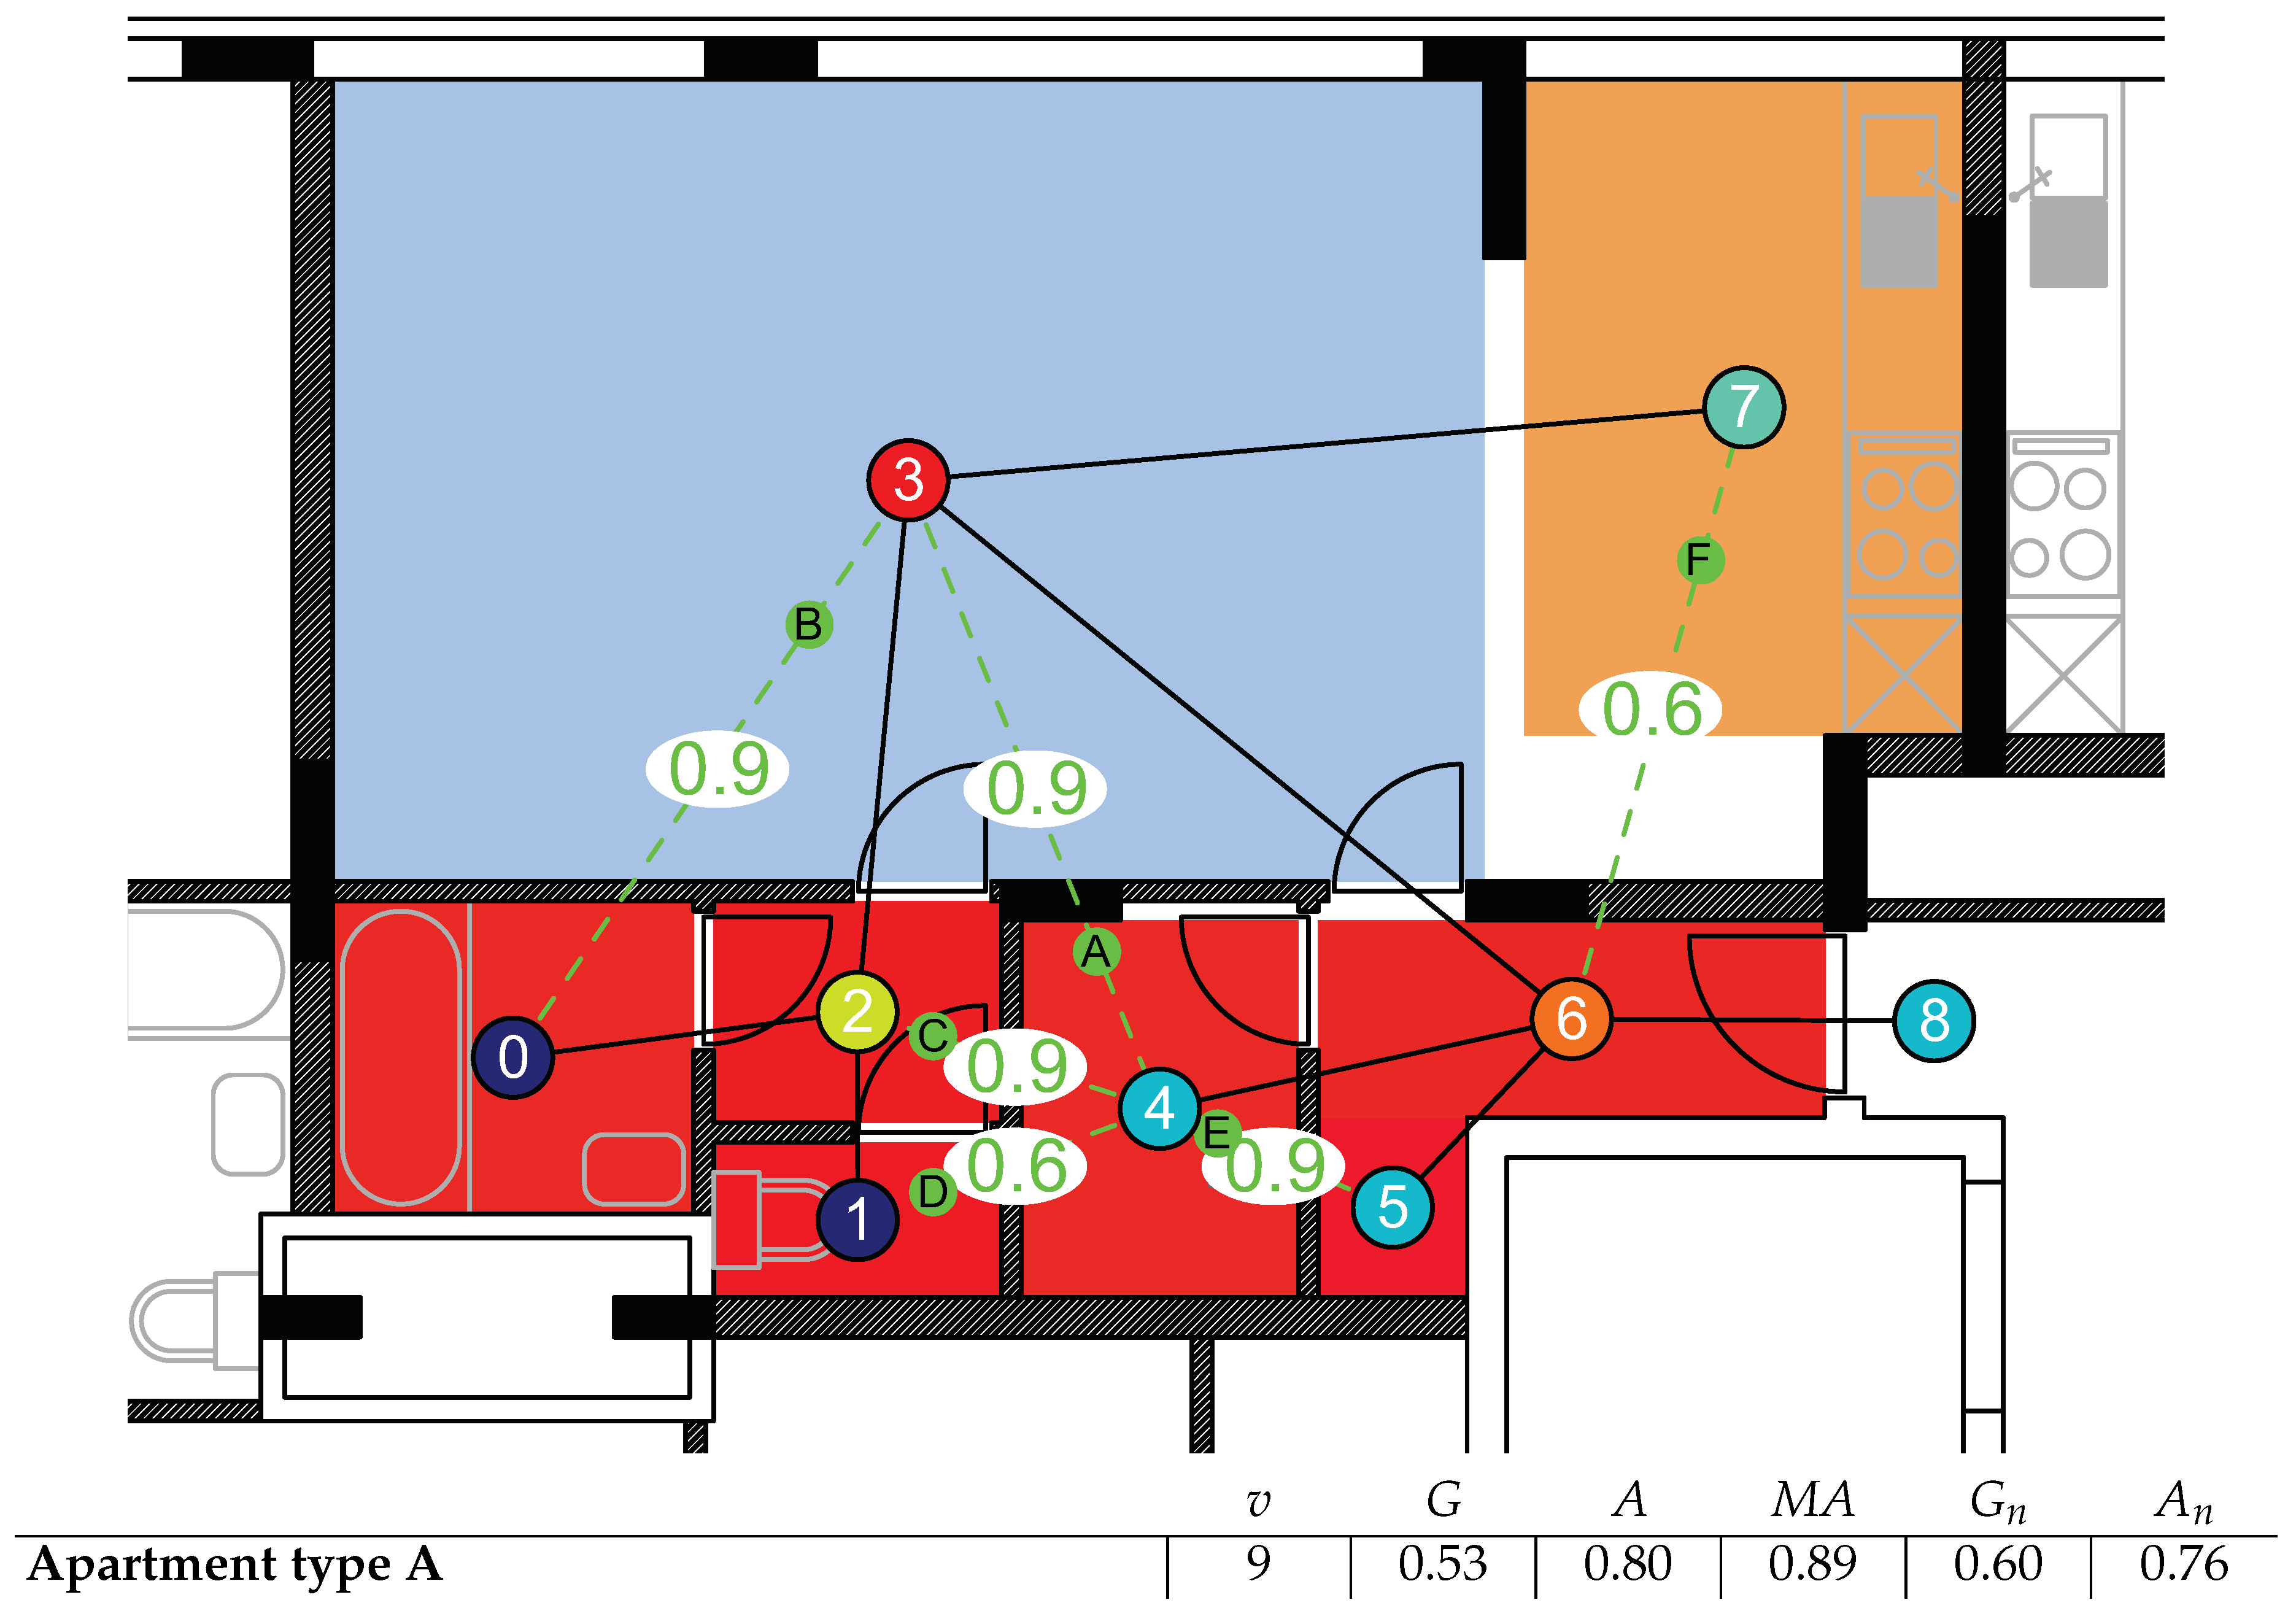
Figure 7 shows the SAGA analysis of apartment type A—a studio apartment. Its plan graph has the lowest Normalised Generality score (0.6) and the second lowest Generality (0.53) in the set. Almost all probabilities are 0.9 because all walls are removable (designed for disassembly), but the wall between the laundry and the toilet (edge D) contains plumbing (probability 0.6), and the wall between the hallway and kitchen is a demountable dividing wall (probability 0.6). Unit A has a low Generality score because the plan is mostly linear: the spaces in the back (toilet and bathroom, node 1 and 0) or the front (hallway and laundry, node 6, 5 and 4) are only connected through the large living space (node 3). However, Apartment A also has the highest Maximum Adaptability value in the set (0.89), indicating that Generality could be improved significantly.
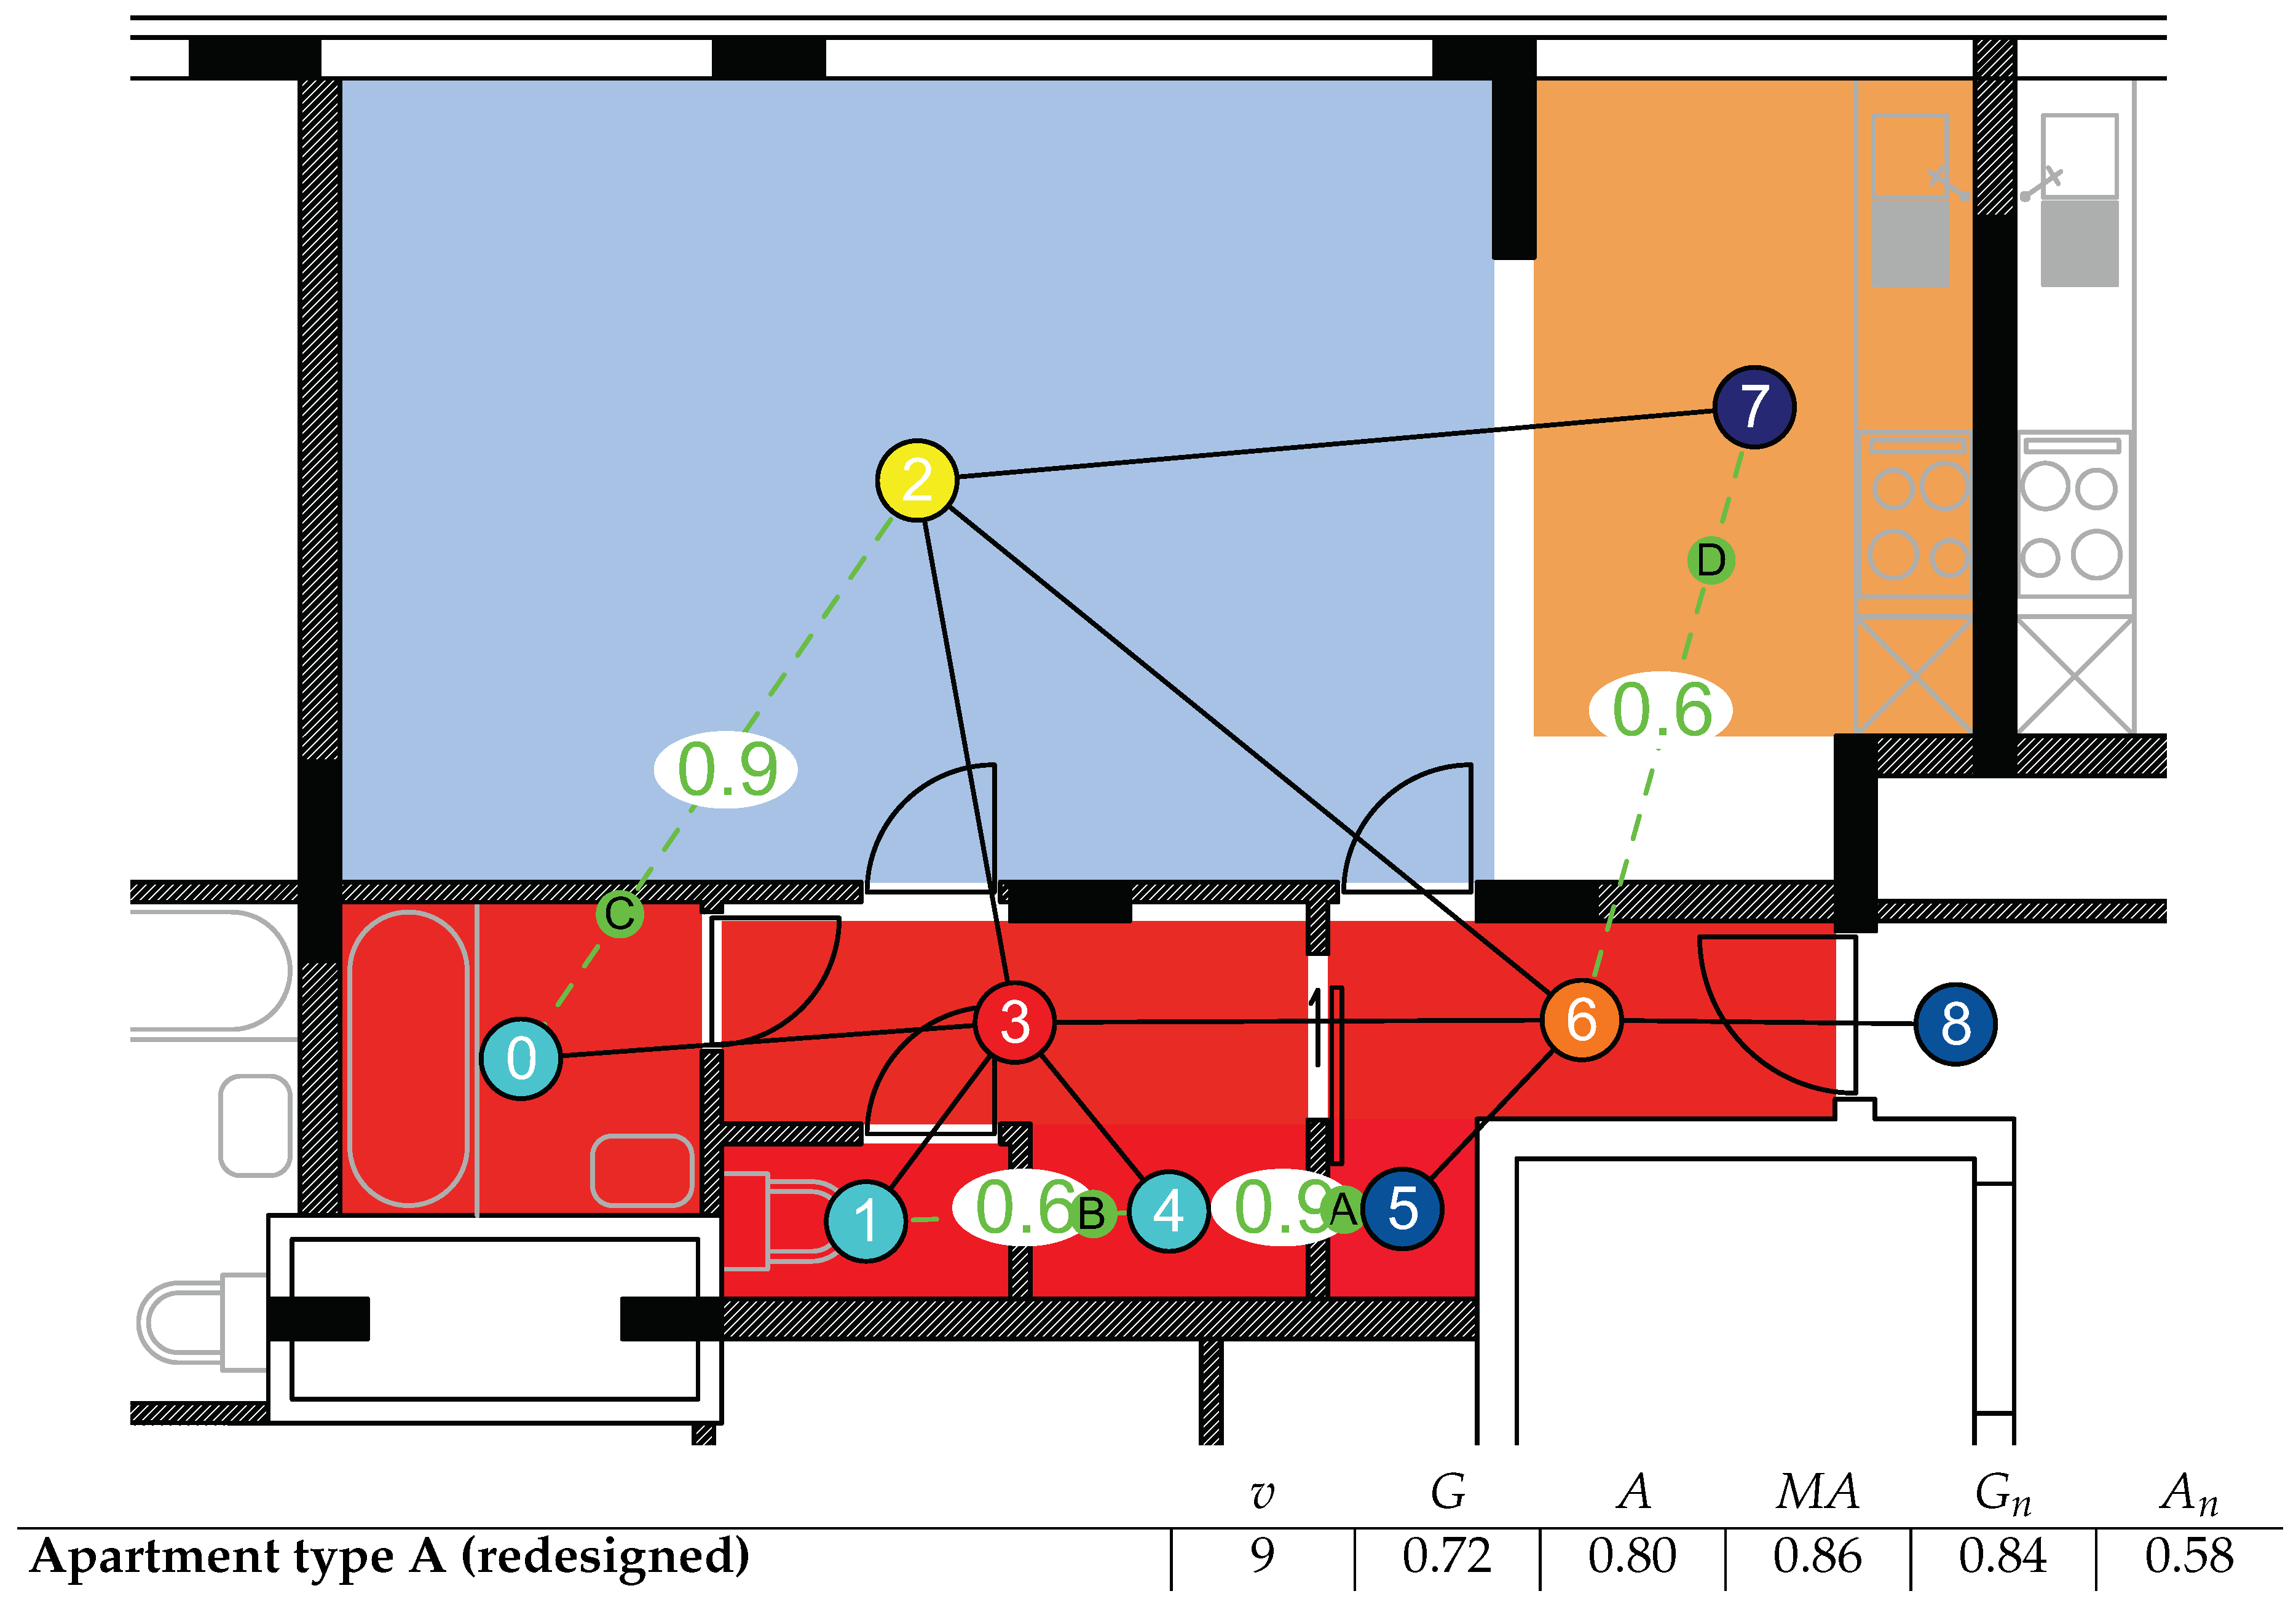
Figure 8 shows an alternative layout for Apartment A, designed to improve its Generality. It extends the hallway through the laundry, linking up to the toilet and bathroom. The living space (blue) becomes accessible from two points, and the bathroom area can be accessed independently. The separate laundry is replaced by ceiling high storage along this extended hallway. A sliding door in the hallway gives users the option to shift between the less permeable layout of Apartment A, and the more permeable redesign. The rings introduced in this variant drastically increase G and G (to 0.72 and 0.84, respectively; both the respective highest values in the set). Also note the decline of Normalised Adaptability; there are less opportunities for adaptation in a general plan layout (as was the case in the gentry house). Nevertheless, the redesign of apartment type A demonstrates how a relatively small intervention (the removal of one key wall) can generate a significant increase in Generality.
6. Conclusions and Future Work
In this paper, we presented and illustrated SAGA, which is likely the first method to systematically quantify the generality and adaptability of building layouts using a combination of unweighted and weighted graphs. For that purpose, we introduced several indicators. SAGA has four important strengths. Firstly, it manages to quantify holistic design properties as a set of mathematically reproducible assessment indicators. Secondly, SAGA calculations are fast and do not require significant expertise or expert judgement, which lowers the threshold to evaluate a building’s capacity to support change. Moreover, as the method is computational, it can be fully automated (e.g. within a Building Information Modelling environment). Automation could reduce human effort and error, but also enable data-driven assessment approaches. Thirdly, the method unifies the concepts of generality and adaptability in one mathematical framework, uncovering a direct relation between both, making them comparable. Fourthly, its indicators work both at the graph level, to evaluate the entire building layout, and the vertex level, to evaluate sub-parts of the layout.
The fourth strength translates to two main areas of application for SAGA. Firstly, its global indicators can be used to compare large sets of plan graphs (e.g. through sorting, ranking, clustering, …), or to map or plan generality and adaptability throughout a large building or a neighbourhood. As explained in the introduction, the latter was the reason for SAGA’s development [3]. Secondly, SAGA can be used for per-node analysis. Individual plans can be analysed to explain how local configurational features influence the global indicator scores. Hence, SAGA could also be a tool to inform design, allowing architects to improve the generality and adaptability of (parts of) their plan layouts. For example, SAGA can be used to calculate in which parts of a unit the use of removable walls would have the highest impact (i.e. highest increase in Generality).
Despite its novel features and strengths, there are several aspects that need to be improved or further developed. Firstly, the robustness of the method needs to be tested more thoroughly by applying SAGA to large numbers of floor plans, from diverse building types. We demonstrated the theoretical logic behind the main premise, that permeability is a measure for the potential number of uses of a building layout, and have illustrated our premise with a selection of cases. Although this level of validation is representative of the current state of adaptability assessment modelling [8], a systematic analysis of a large set of cases will help to validate the universal applicability of the method (by testing the basic hypotheses experimentally and empirically), to benchmark the indicators, and to establish a frame of reference to help interpret scores.
Secondly, the method should go beyond analysing spatial configurations, and needs to encompass more aspects of generality and adaptability. We see SAGA as a spatial assessment framework that will eventually feature a range of assessment modules; the results presented in this paper are the first step in its development. Additional indicator modules could address other aspects that determine generality and adaptability, such as floor surface area sizes (consult [16] for an initial version), wall permeability and related material reuse potential, the routing of technical services, wheelchair accessibility, or horizontal and vertical extendibility. All these examples could be measured using graph-based indicators.
Finally, SAGA’s capacity to inform urban planning and architectural design practice ought to be explicitly studied and demonstrated.
Author Contributions
Conceptualisation, P.H.; methodology, P.H.; software, P.H.; formal analysis, P.H.; investigation, P.H.; writing—original draft preparation, P.H.; writing—review and editing, P.H., W.D., B.T., Y.D.W. and N.D.T.; visualisation, P.H.; supervision, N.D.T., Y.D.W., B.T. and W.D.; project administration, N.D.T. and Y.D.W.; funding acquisition, Y.D.W., N.D.T., W.D, P.H. and B.T.
Funding
Part of this research was funded by VITO (the Flemish Institute for Technological Research). Part of this research was conducted at the Future Cities Laboratory at the Singapore-ETH Centre, which was established collaboratively between ETH Zürich and Singapore’s National Research Foundation (FI370074016) under its Campus for Research Excellence and Technological Enterprise program.
Acknowledgments
The authors would like to thank many reviewers for their constructive feedback. The first author would like to thank Anne Paduart for use of the building layouts she developed. The first author was a doctoral researcher at the Vrije Universiteit Brussel and VITO when the SAGA method was first developed.
Conflicts of Interest
The authors declare no conflict of interest. The funders had no role in the design of the study; in the collection, analyses, or interpretation of data; in the writing of the manuscript, or in the decision to publish the results.
Abbreviations
The following abbreviations are used in this manuscript:
| SAGA | Spatial Assessment of Generality and Adaptability |
| ATD | Aggregated Total Depth |
| P | Permeability |
| JPG | Justified Plan Graph |
| TD | Total Depth |
| G | Generality |
| A | Adaptability |
| MA | Maximum Adaptability |
| G | Normalised Generality |
| A | Normalised Adaptability |
| acc | access graph |
| adj | adjacency graph |
| wadj | weighted adjacency graph |
| v | number of graph vertices |
| e | number of graph edges |
References
- Slaughter, E.S. Design strategies to increase building flexibility. Build. Res. Inf. 2001, 29, 208–217. [Google Scholar] [CrossRef]
- Taipale, K. Challenges and ways forward in the urban sector. In Sustainable Development in the 21st Century (SD21); Technical report; United Nations Department of Economic and Social Affairs (UNDESA): New York, NY, USA, 2012. [Google Scholar]
- Herthogs, P. Enhancing the Adaptable Capacity of Urban Fragments: A Methodology to Integrate Design for Change in Sustainable Urban Projects. Ph.D. Thesis, Vrije Universiteit Brussel, Brussels, Belgium, 2016. [Google Scholar]
- Hamdi, N. Housing without Houses: Participation, Flexibility, Enablement; Van Nostrand Reinhold: New York, NY, USA, 1991. [Google Scholar]
- Heidrich, O.; Kamara, J.; Maltese, S.; Re Cecconi, F.; Dejaco, M.C. A critical review of the developments in building adaptability. Int. J. Build. Pathol. Adapt. 2017, 35, 284–303. [Google Scholar] [CrossRef]
- Geraedts, R.P.; Remøy, H.T.; Hermans, M.H.; Van Rijn, E. Adaptive capacity of buildings: A determination method to promote flexible and sustainable construction. In Proceedings of the 25th World Congress of Architecture—Architecture Otherwhere, Durban, South Africa, 3–7 August 2014; pp. 1054–1068. [Google Scholar]
- Osman, A.; Herthogs, P.; Davey, C. Are Open Building Principles Relevant in the South African Housing Sector? CSIR Investigations and Analysis of Housing Case Studies for Sustainable Building Transformation. In Proceedings of the International Conference on Management and Innovation for a Sustainable Built Environment, Delft, The Netherlands, 19–23 June 2011. [Google Scholar]
- Rockow, Z.R.; Ross, B.; Black, A.K. Review of methods for evaluating adaptability of buildings. Int. J. Build. Pathol. Adapt. 2018. [Google Scholar] [CrossRef]
- Brand, S. How Buildings Learn: What Happens after They’re Built; Penguin: London, UK, 1995. [Google Scholar]
- Hillier, B.; Hanson, J. The Social Logic of Space; Cambridge University Press: Cambridge, UK, 1984. [Google Scholar]
- Schmidt, R., III; Austin, S. Adaptable Architecture: Theory and Practice; Routledge: Abingdon, UK, 2016. [Google Scholar]
- Steadman, J.P. Architectural Morphology: An Introduction to the Geometry of Building Plans; Pion Limited: London, UK, 1983. [Google Scholar]
- Hillier, B. Space Is the Machine: A Configurational Theory of Architecture; Space Syntax: London, UK, 2007. [Google Scholar]
- Hanson, J. Decoding Homes and Houses; Cambridge University Press: Cambridge, UK, 2003. [Google Scholar]
- Ostwald, M.J. The Mathematics of Spatial Configuration: Revisiting, Revising and Critiquing Justified Plan Graph Theory. Nexus Netw. J. 2011, 13, 445–470. [Google Scholar] [CrossRef]
- Herthogs, P.; Paduart, A.; Denis, F.; Tunçer, B. Evaluating the generality and adaptability of floor plans using the SAGA method: A didactic example based on the historical shophouse and gentry house types. In Proceedings of the UIA 2017 Seoul World Architects Congress, Seoul, Korea, 7–10 September 2017. [Google Scholar]
- Herthogs, P.; De Temmerman, N.; De Weerdt, Y. Assessing the generality and adaptability of building layouts using justified plan graphs and weighted graphs: A proof of concept. In Proceedings of the Central Europe towards Sustainable Buildind, Prague, Czech Republic, 26–28 June 2013; Hájek, P., Tywoniak, J., Lupíšek, A., Růžička, J., Sojková, K., Eds.; Grada Publishing for Faculty of Civil Engineering, Czech Technical University in Prague: Prague, Czech Republic, 2013; pp. 992–998. [Google Scholar]
- Leupen, B. Polyvalence, a concept for the sustainable dwelling. Nord. J. Archit. Res. 2006, 19, 24–31. [Google Scholar]
- Manum, B. Apartment Layouts and Domestic Life: The Interior Space and Its Usability. Ph.D. Thesis, Oslo School of Architecture and Design, Oslo, Norway, 2006. [Google Scholar]
- Manum, B. The Advantage of Generality: Dwellings’ Potential for Housing Different Ways of Living. In Proceedings of the 7th International Space Syntax Symposium, Stockholm, Sweden, 8–11 June 2009; Koch, D., Marcus, L., Steen, J., Eds.; School of Architecture and the Built Environment KTH: Stockholm, Sweden, 2009; pp. 069.1–069.14. [Google Scholar]
- Priemus, H. Wonen—Kreativiteit en Aanpassing: Onderzoek naar Voorwaarden voor Optimale Aanpassingsmogelijkheden in de Woningbouw. Ph.D. Thesis, TU Delft, Delft, The Netherlands, 1968. [Google Scholar]
- Behbahani, P.A.; Gu, N.; Ostwald, M.J. Using Graphs to Capture Spatio-Visual Relations: Expanding the properties considered in Discursive Grammar. In Proceedings of the 47th International Conference of the Architectural Science Association, Hong Kong, China, 13–16 November 2013; pp. 187–196. [Google Scholar]
- Eloy, S. A Transformation Grammar-Based Methodology for Housing Rehabilitation: Meeting Contemporary Functional and ICT Requirements. Ph.D. Thesis, Universidade Técnica de Lisboa, Lisbon, Portugal, 2012. [Google Scholar]
- Eloy, S.; Duarte, J. A transformation-grammar-based methodology for the adaptation of existing housetypes: The case of the ‘rabo-de-bacalhau’. Environ.Plan. B Plan. Des. 2015, 42, 775–800. [Google Scholar] [CrossRef]
- Garrison, W.L.; Marble, D.F. The Structure of Transportation Networks; Technical Report TR 62-11; U.S. Army Transportation Research Command: Fort Detrick, MD, USA, 1962. [Google Scholar]
- Rhinoceros. Rhinoceros (Version 5) Software. Seattle: Robert McNeel & Associates. 2018. Available online: https://www.rhino3d.com/ (accessed on 1 November 2018).
- Grasshopper. Grasshopper (Version 1.0) Software. Seattle: Robert McNeel & Associates. 2018. Available online: https://www.grasshopper3d.com/ (accessed on 1 November 2018).
- Schaffranek, R.; Vasku, M. Space Syntax for Generative Design: on the application of a new tool. In Proceedings of the Ninth International Space Syntax Symposium, Seoul, Korea, 31 October–3 November 2013; Kim, Y.O., Park, H.T., Seo, K.W., Eds.; Sejong University Press: Seoul, Korea, 2013; pp. 050:1–050:12. [Google Scholar]
- Sileryte, R.; Cavic, L.; Beirao, J.N. Automated generation of versatile data model for analyzing urban architectural void. Comput. Environ. Urban Syst. 2017, 66, 130–144. [Google Scholar] [CrossRef]
- Miranda Carranza, P. Convex maps, some basic concepts and a new method to generate them. In Architectural Morphology: Investigative Modelling and Spatial Analysis; KTH Royal Institute of Technology: Stockholm, Sweden, 2013; pp. 1–6. [Google Scholar]
- Denis, F.; Vandervaeren, C.; De Temmerman, N. Using Network Analysis and BIM to Quantify the Impact of Design for Disassembly. Buildings 2018, 8, 113. [Google Scholar] [CrossRef]
- Akinade, O.O.; Oyedele, L.O.; Bilal, M.; Ajayi, S.O.; Owolabi, H.A.; Alaka, H.A.; Bello, S.A. Waste minimisation through deconstruction: A BIM based Deconstructability Assessment Score (BIM-DAS). Resour. Conserv. Recycl. 2015, 105, 167–176. [Google Scholar] [CrossRef]
- Livesey, G.E.; Donegan, A. Addressing normalisation in the pursuit of comparable integration. In Proceedings of the 4th International Space Syntax Symposium, London, UK, 17–19 June 2002; Hanson, J., Ed.; University College London: London, UK, 2003; pp. 64.1–64.10. [Google Scholar]
- Park, H.T. Before integration: A critical review of integration measure in space syntax. In Proceedings of the 5th International Space Syntax Symposium, Delft, The Netherlands, 13–17 June 2005; van Nes, A., Ed.; TU Delft: Delft, The Netherlands, 2005; pp. 555–572. [Google Scholar]
- B3RetroTool. Fiche Explicative: Maison Bourgeoise D’Avant-Guerres. Explanatory Sheet. 2016. Available online: https://www.brusselsretrofitxl.be/wp-content/uploads/2016/07/12_maison_bourgeoise_avant-guerres.pdf (accessed on 8 April 2019).
- Paduart, A. Re-Design for Change. A 4 Dimensional Renovation Approach towards a Dynamic and Sustainable Building Stock. Ph.D. Thesis, Vrije Universiteit Brussel, Brussels, Belgium, 2012. [Google Scholar]
Figure 1.
Plan graphs (below each plan layout) are graph representations of spatial configurations. The relations between the individual spaces (a, b, and c) in each case affect the overall spatial configuration of the plan layout. The Total Depth is listed next to each vertex.
Figure 1.
Plan graphs (below each plan layout) are graph representations of spatial configurations. The relations between the individual spaces (a, b, and c) in each case affect the overall spatial configuration of the plan layout. The Total Depth is listed next to each vertex.

Figure 2.
The SAGA method uses three related plan graphs to determine Generality, Adaptability, and Maximum Adaptability, which are proportional to the permeability of their respective plan graphs. Permeability can be expressed as the inverse of Aggregated Total Depth (ATD). For each of the graphs, the TD is listed above each node.

Figure 3.
SAGA analysis of two floors of a 19th century gentry house.

Figure 4.
Overview of the seven unit types in Paduart’s refurbishment proposal. Image by Paduart [36], used with permission.
Figure 4.
Overview of the seven unit types in Paduart’s refurbishment proposal. Image by Paduart [36], used with permission.

Figure 5.
SAGA analysis of apartment type E.

Figure 6.
SAGA analysis of apartment type F.

Figure 7.
SAGA analysis of apartment type A.

Figure 8.
SAGA analysis of apartment type A, redesigned for Generality by the authors.


Table 1.
Step-by-step overview of the SAGA method.
| Step 1: determine the plan’s spaces | ||
| Apply a modified convex mapping rule-set. | ||
| Step 2: construct three permeability plan graphs | ||
| access graph | weighted adjacency graph | adjacency graph |
| () | () with permeability scores | () |
| Step 3: calculate the Aggregated Total Depth (ATD) | ||
| ATD | ATD | ATD |
| (vertex depth) | (shortest path) | (vertex depth) |
| Step 4: normalise ATD to take into account graph size and relative permeability | ||
| The Permeability (P) of a plan graph is: | ||
| Generality (G) | Adaptability (A) | Maximum Adaptability (MA) |
| is the P of the | is the P of the | is the P of the |
| Step 5: normalize G and A relative to MA | ||
| Normalised Generality (G): | Normalised Adaptability (A): | |
Table 2.
Provisional values for wall permeability ratings (or probabilities) and modifiers.
| Permeability Rating | |
| 0.3 | reinforced concrete wall |
| 0.6 | brick wall |
| 0.9 | removable wall (Designed for Disassembly) |
| Modifier | |
| −0.3 | embedded plumbing |
| −0.3 | load-bearing |
| −0.3 | unit-dividing wall |
© 2019 by the authors. Licensee MDPI, Basel, Switzerland. This article is an open access article distributed under the terms and conditions of the Creative Commons Attribution (CC BY) license (http://creativecommons.org/licenses/by/4.0/).
Share and Cite
MDPI and ACS Style
Herthogs, P.; Debacker, W.; Tunçer, B.; De Weerdt, Y.; De Temmerman, N. Quantifying the Generality and Adaptability of Building Layouts Using Weighted Graphs: The SAGA Method. Buildings 2019, 9, 92. https://doi.org/10.3390/buildings9040092
AMA Style
Herthogs P, Debacker W, Tunçer B, De Weerdt Y, De Temmerman N. Quantifying the Generality and Adaptability of Building Layouts Using Weighted Graphs: The SAGA Method. Buildings. 2019; 9(4):92. https://doi.org/10.3390/buildings9040092
Chicago/Turabian StyleHerthogs, Pieter, Wim Debacker, Bige Tunçer, Yves De Weerdt, and Niels De Temmerman. 2019. "Quantifying the Generality and Adaptability of Building Layouts Using Weighted Graphs: The SAGA Method" Buildings 9, no. 4: 92. https://doi.org/10.3390/buildings9040092
Note that from the first issue of 2016, this journal uses article numbers instead of page numbers. See further details here.