Article

Quantifying Energy Reduction and Thermal Comfort for a Residential Building Ventilated with a Window-Windcatcher: A Case Study

by
Shouib Nouh Ma’bdeh
1,
Odi Fawwaz Alrebei
2,
Laith M. Obeidat
1,
Tamer Al-Radaideh
3,
Katerina Kaouri
4 and
Abdulkarem I. Amhamed
2,*
1
College of Architecture and Design, Jordan University of Science and Technology, Irbid 3030, Jordan
2
Qatar Environment and Energy Research Institute, Hamad Bin Khalifa University, Doha 34110, Qatar
3
School of Architecture and Design, Virginia Polytechnic Institute and State University, Blacksburg, VA 24061, USA
4
School of Mathematics, Cardiff University, Cardiff CF24 4AG, UK
*
Author to whom correspondence should be addressed.
Buildings 2023, 13(1), 86; https://doi.org/10.3390/buildings13010086
Submission received: 26 September 2022 / Revised: 3 November 2022 / Accepted: 8 November 2022 / Published: 29 December 2022
(This article belongs to the Special Issue Metrology for Living Environment)

Abstract

:
Previous studies on window-windcatchers have shown their effectiveness in capturing the prevailing wind and redirecting it into a building, increasing the actual-to-required ventilation ratio by 9%, above what is required by the American Society of Heating, Refrigerating, and Air-Conditioning Engineers (ASHRAE). However, the effect of implementing the proposed system on energy performance, energy costs, and thermal comfort has not been studied. Therefore, here, we investigate and test the implementation of the window-windcatcher on a typical residential building, using a validated DesignBuilder model. Compared to the base case (no window-windcatcher), the total annual energy consumption of the entire building ( E tot , b ), and consequently the cost, is reduced by approximately 23.3% (i.e., from 18,143 kWh/year to 13,911 kWh/year) when using the window-windcatcher. The total annual reduction in thermal discomfort hours is estimated to be 290 h, which corresponds to an average monthly reduction of approximately 24 h.

1. Introduction

Heating, ventilation, and air conditioning (HVAC) account for a significant share of the global building energy use [1,2]. In 2019, building cooling only accounted for 20% of the worldwide energy consumption [3,4]. This led to the creation and implementation of limits and regulations to maximize energy efficiency [1] and to ensure economic and environmental sustainability [2] in the building sector. Therefore, it became vital to implement sustainable techniques that not only allow energy savings during the lifespan of the building but also maximize the use of materials, in this way, reducing environmental consequences during construction or destruction [3]. The first phases of a building’s design are regarded as one of the most influential on its energy performance [4].
Typically, architects, civil engineers and designers employ solutions that decrease energy use and regulate heat transmission [5]. According to Granadeiro, Duarte, et al. [6], the building envelope substantially impacts its energy performance. Numerous research studies on building envelope optimization variables for minimizing energy consumption have been conducted [7,8,9,10]. According to Su [11], the building design parameters impacting more on energy consumption are the ratio between the building envelope size and volume, the ratio of windows to walls, and the utilization of thermal mass. Also, in [12,13] it is shown that the opening area of the windows and their position significantly affect overall energy use.
In a related context, HVAC systems for sustaining interior environmental comfort, including heating, cooling, and ventilation, account for 60% of the building sector’s energy use. In addition to their substantial energy consumption, these active systems have several adverse consequences on health and well-being [14]. Studies have revealed, for instance, that residents of actively air-conditioned buildings might be at a higher infection risk from SARS-CoV-1 and MERS-CoV [15]. Individuals may spend up to 90% of their time indoors and better indoor air quality (IAQ) is essential for their health, well-being, and productivity [16]. Consequently, developing and implementing passive design solutions in the built environment, such as passive heating, passive cooling, passive ventilation, and daylighting is a multifaceted, multidisciplinary endeavor. Strategies for passive design minimize energy use and greenhouse gas emissions. Therefore, slowing down or reducing the effects of undesirable occurrences, such as global warming, has benefits for the environment and human health, well-being, and productivity. Additionally, a passive technique provides economic and other advantages, such as energy savings, reduced building maintenance costs, and lower healthcare expenses [6,7].
Here, we focus on natural ventilation and its effects on thermal comfort and energy performance of a multifamily residential building. Natural (passive) ventilation occurs when fresh air enters a room and polluted air leaves and it is caused by air pressure differences between the inside and outside of a building (momentum-induced airflow) or air density variations (buoyancy effect) [7,11].
In multifamily dwellings, implementing good natural ventilation is difficult because the conditions for achieving it, such as sufficient air inflow and outflow, may be limited or nonexistent. This difficulty arises mainly due to the conventional spatial typology of such residential structures, which often consists of few or no outside walls on opposing sides of the residential unit [8]. Utilizing natural phenomena for the ventilation, heating, and cooling of buildings has led to the development and implementation of passive systems and approaches that vary in size, performance, needs, and settings. These systems can be employed on their own or combined, to accomplish many passive design objectives. Examples of passive ventilation systems are the Trombe wall, a double skin facade, a solar chimney, solar walls, an atrium, a wind tower, a windcatcher and fenestration [7,12].
Here, we continue studying a novel window-windcatcher, a passive ventilation system that can enhance indoor air quality and improve indoor thermal quality by passively utilizing renewable wind energy [17,18,19]. Windcatchers are an effective passive design strategy for semi-arid regions, with a long history of achieving harmony between the built environment and surroundings [20,21,22]. However, there are many limitations inherent in a windcatcher, such as its centrality, its large size, and the limitations on future expansion of the building [22,23,24,25,26,27,28]. Alrebei et al. [28] proposed a novel window-windcatcher that can overcome these limitations. Computational Fluid Dynamics (CFD) were used in [28] to analyze the airflow for this novel window-windcatcher (Figure 1) but energy consumption, thermal discomfort, and CO2 emissions were not analyzed; these are analysed here. The proposed windcatcher consists of four rotatable vertical louvers (fins) that can be adjusted according to the prevailing wind direction and connected to two horizontal planes. The curved element spans from a point near the last fin in the group into the right internal corner of the two planes [28]. The main purpose of the window-windcatcher is to capture the prevailing wind and pass it on indoors to enhance natural ventilation.
As reported by Alrebei et al. [28], the proposed windcatcher overcomes the traditional windcatcher’s centrality requirement, dividing it into smaller devices mounted on the building’s façade as part of the window assembly. This change enables the future use of the building’s roof and removes any other geometrical or spatial restrictions of future expansion. In addition, due to its small size, the minimum wind speed required, compared to a conventional windcatcher, is smaller since the distance the air will travel from outside to inside is shorter. Another advantage of the proposed windcatcher is that, since it is mounted on the window, the window opening ratio could be adjusted to control the volumetric airflow entering the room.
In [28], the effectiveness of the windcatcher in capturing the prevailing wind and redirecting it indoors was investigated, in three different cities, using CFD. The system enhanced the ventilation rate and increased the heat loss rate ( H l o s s = c p . m ˙ . Δ T , where c p is the air specific capacity, m ˙ is the air mass flow rate, and Δ T is the temperature difference between the internal and external domains). The actual-to-required ventilation ratio was found to increase by 9%, which was above the requirement of the American Society of Heating, Refrigerating, and Air-Conditioning Engineers (ASHRAE). More information related to the ventilation and cooling performance of the window-windcatcher can be found in [28].
However, the effect of implementing the proposed windcatcher on a real building has not been tested in terms of energy performance and thermal comfort until now. Here, we, thus, investigate and test the implementation of the novel windcatcher proposed in [28], on a typical multistory residential building located in Amman, Jordan, in terms of energy performance and thermal comfort. In the simulations, the windcatcher will be fitted on all the windows of each apartment, and yearly predictions will be generated.

2. Materials and Methods

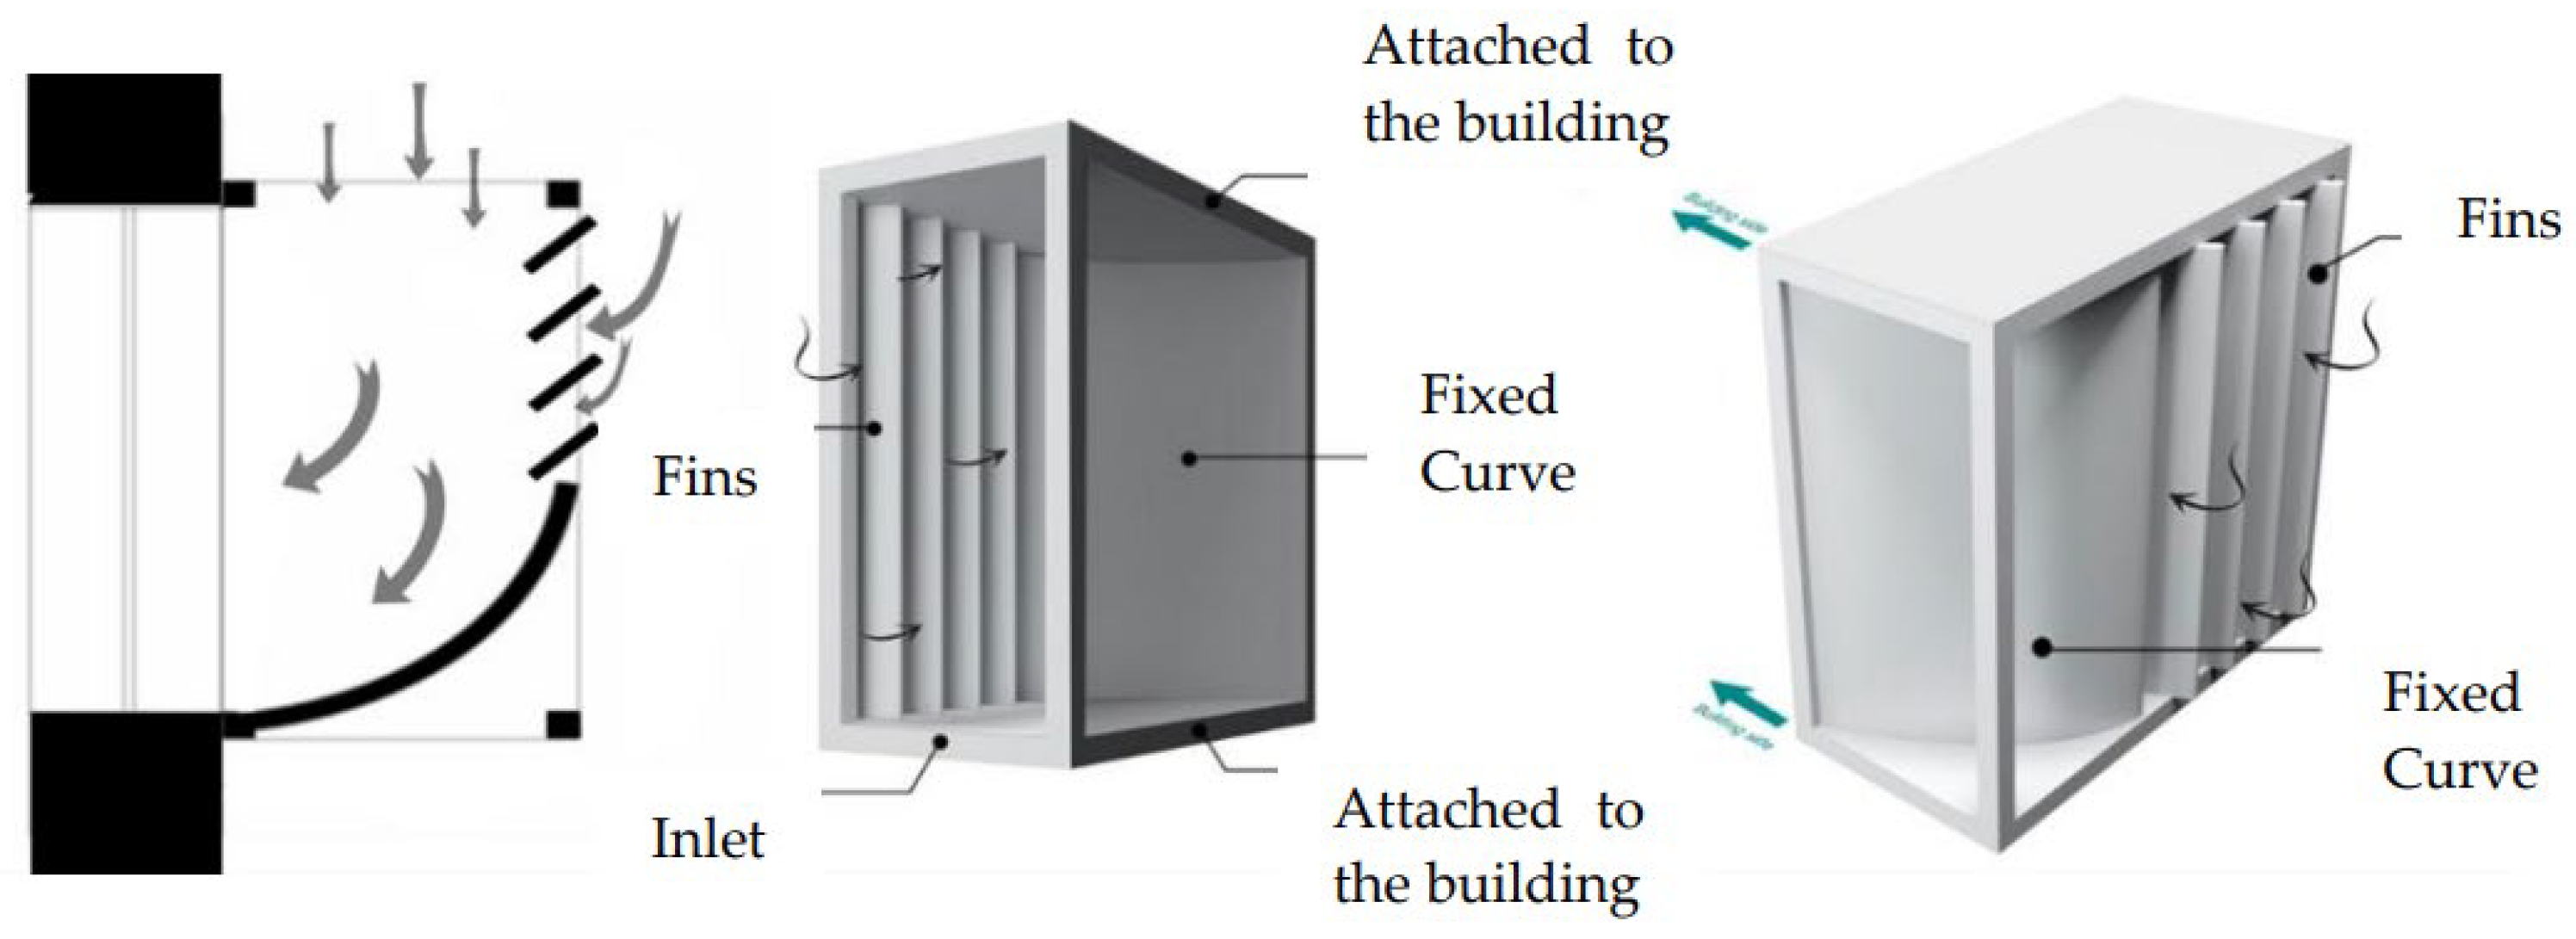
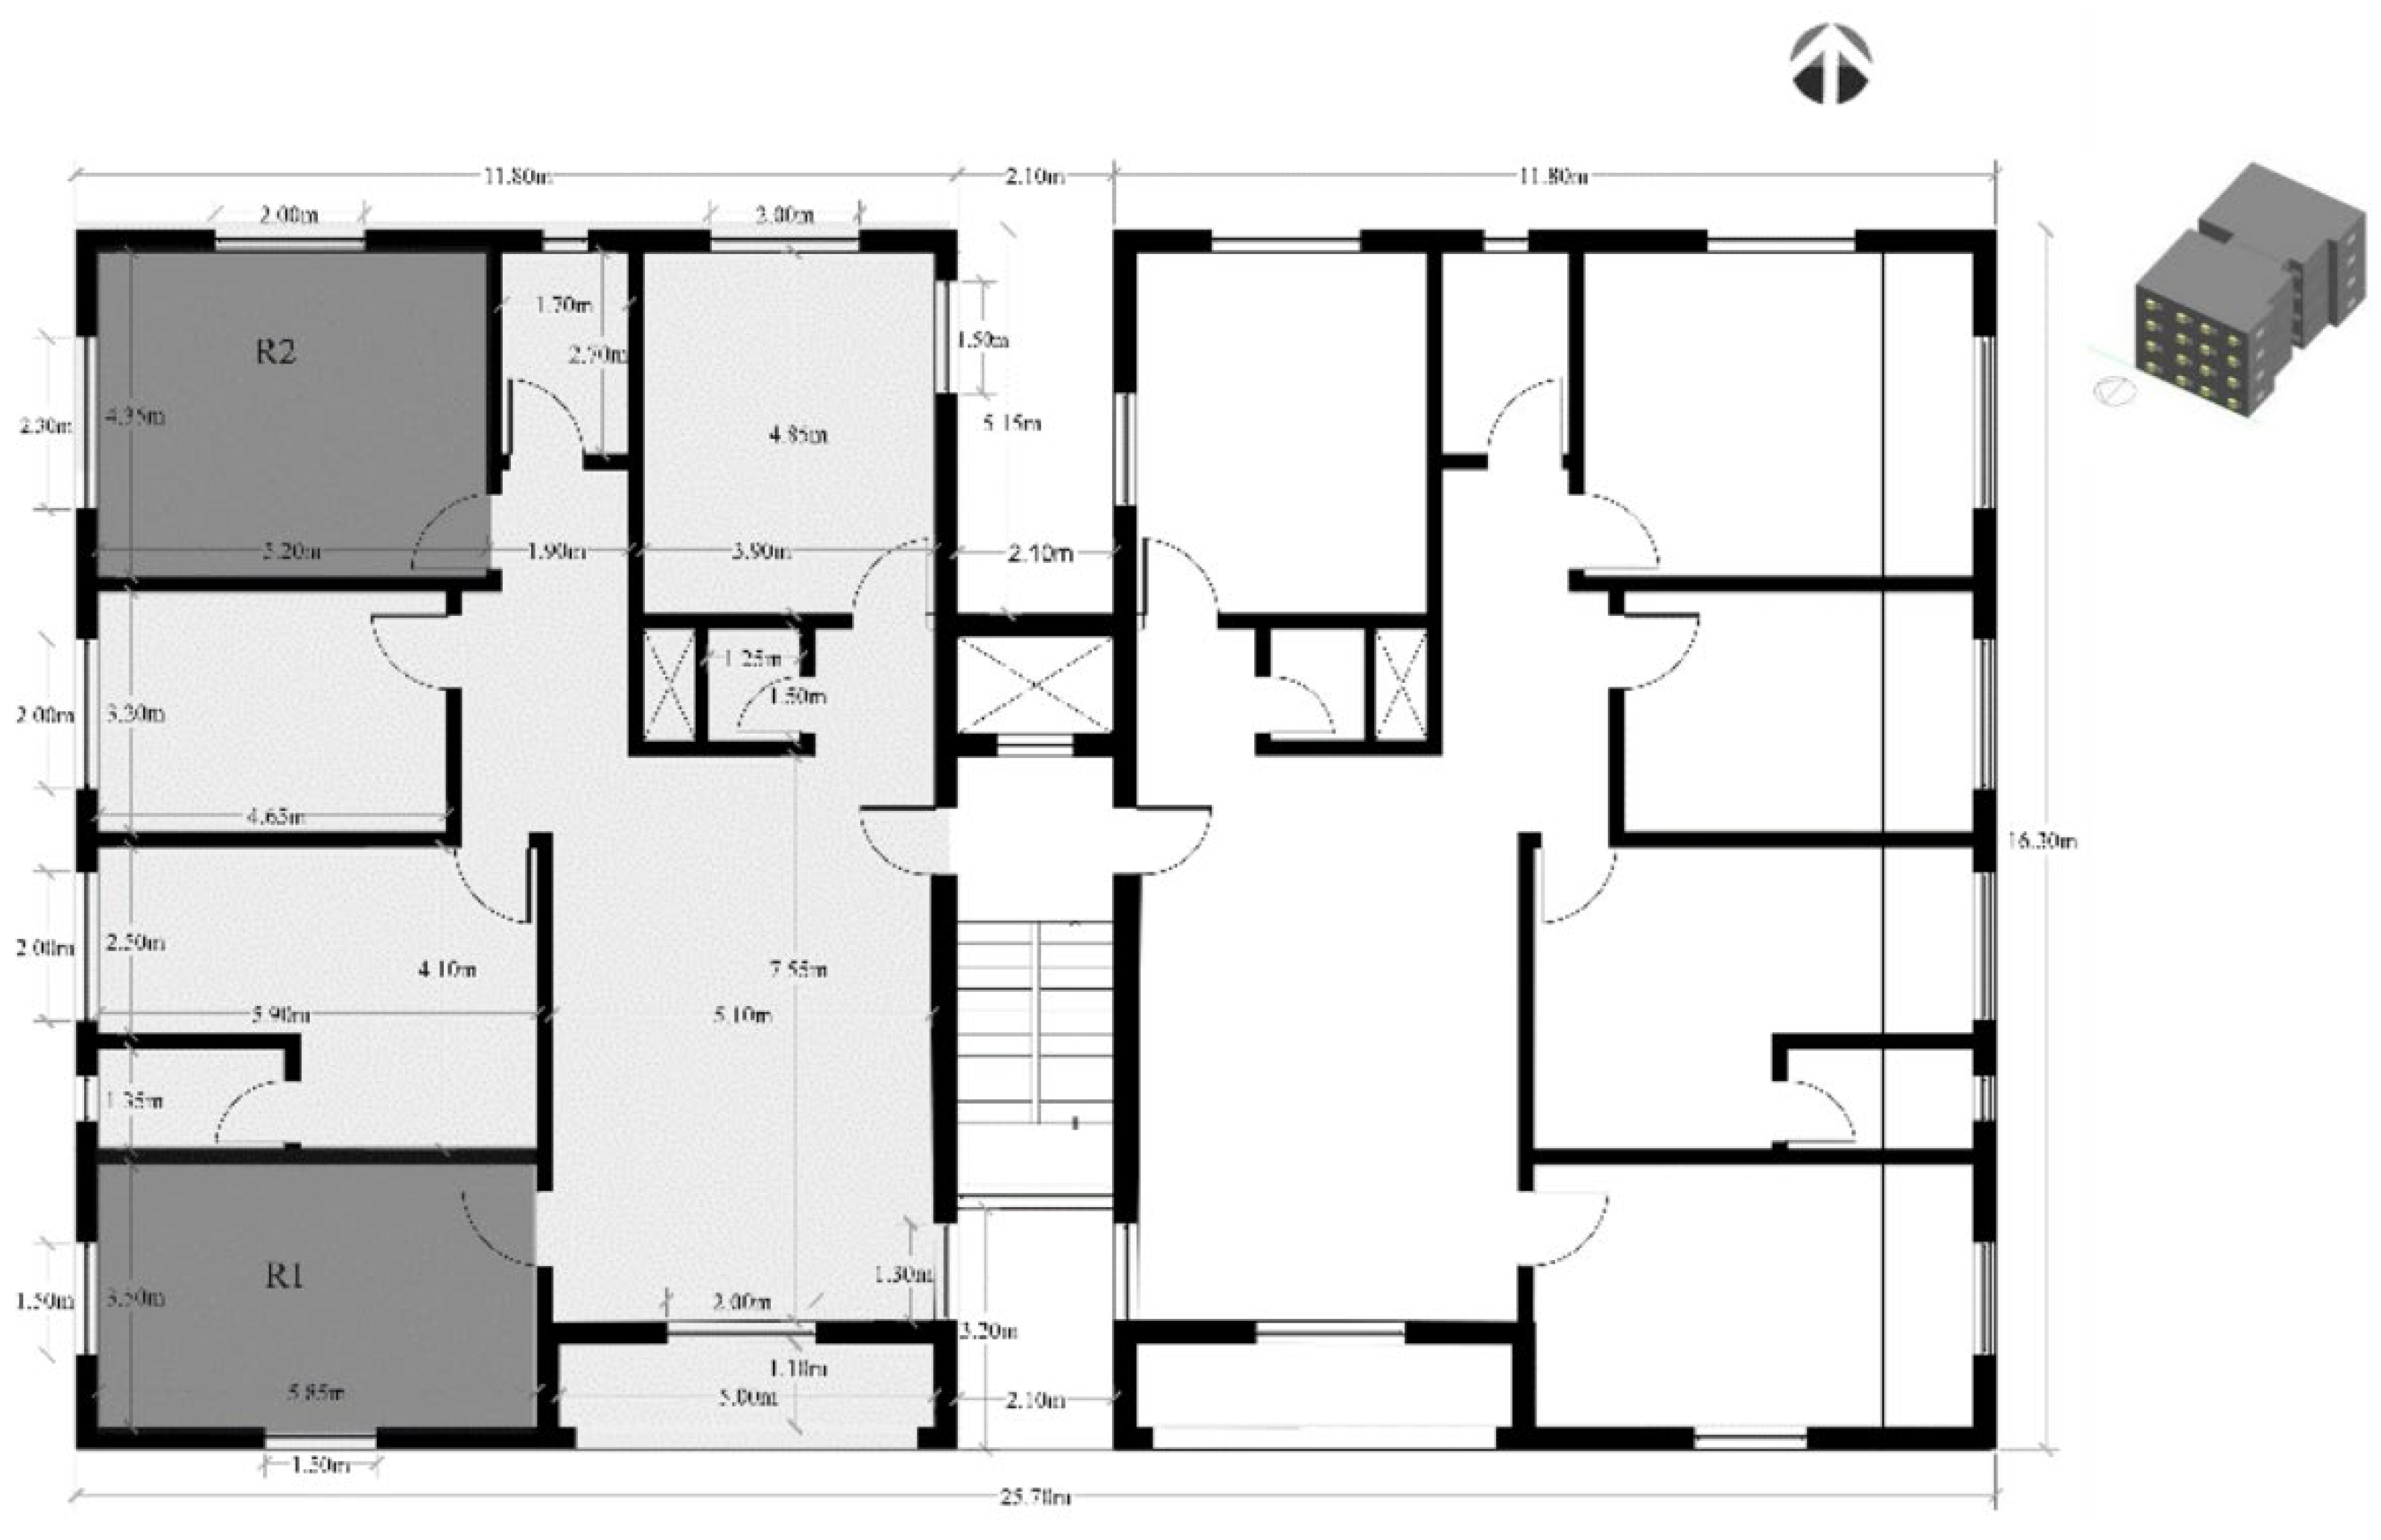
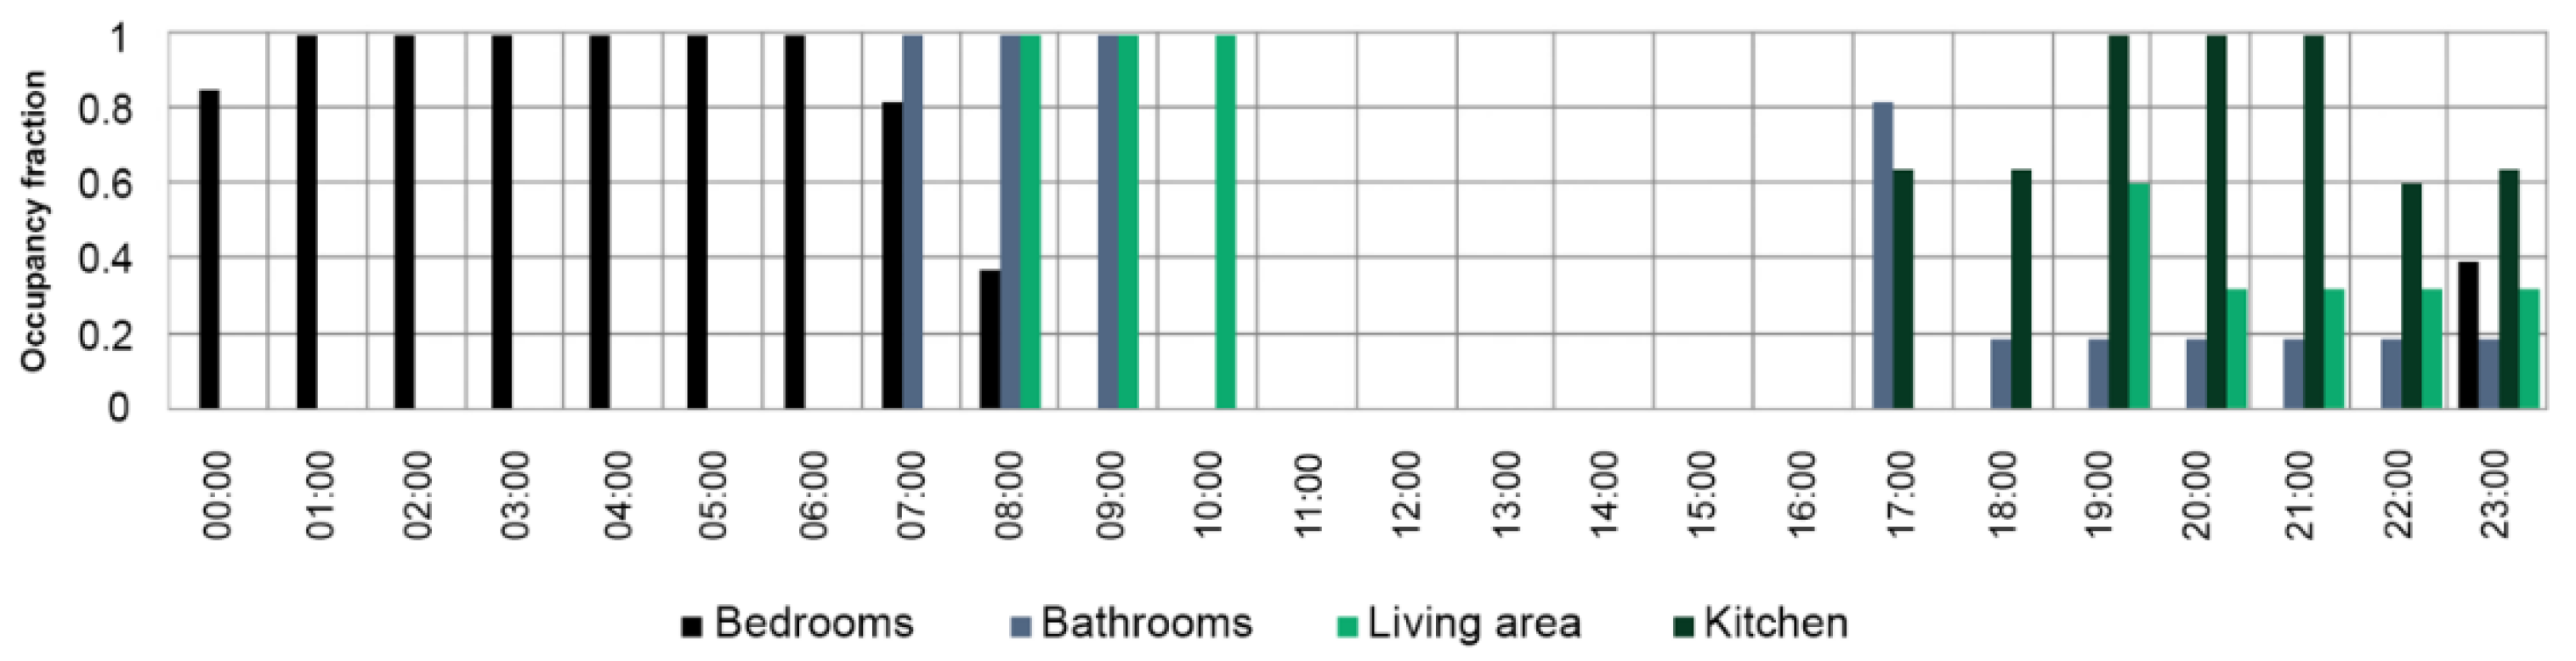
2.1. Case Study Description

A multistory residential building consisting of eight apartments, representing a common building type in Amman, Jordan, was selected as the base case here (BC). The selected building represents a common multistory residential building, in terms of construction materials, floor layout, area, building form, orientation, and characteristics of the architectural elements such as window size, area, and glazing systems. The building has four floors, with two apartments on each floor. Each apartment’s floor area is 165 m2, with a ceiling height of 2.70 m. Each apartment has three exposed façades to the outdoors, as shown in Figure 2.
The simulation software DesignBuilder was used in this study to investigate the implementation of the proposed windcatcher on a multistorey building [29,30,31,32,33,34,35]. The software uses actual weather data and considers various environmental factors depending on the hourly weather data, such as clear and overcast sky conditions, amount of solar energy, wind speed, and direction.
DesignBuilder is a widely used energy simulation software by professionals, such as architects and building service engineers. It has a comprehensive user interface to the EnergyPlus dynamic thermal simulation software.
The accuracy and the validation of the software were proven by the Building Energy Simulation TEST (BESTest) procedure developed by the International Energy Agency and considered by the American Department of Energy and the international community to evaluate building energy simulation programs’ capabilities [28,29].
The high accuracy of the software has also been demonstrated in experiments. We performed annual energy and thermal comfort analysis for each apartment, in 30-min intervals in order to ensure a good accuracy of our results.
A three-dimensional model of the BC and the proposed windcatcher was created using DesignBuilder. The building construction details for common Jordanian buildings and specifications, were used in Table 1. The space use schedule and the internal heat gain are indicated in Table 2, representing a typical life pattern. The operation schedule used in the simulations is illustrated in Figure 3.
Since the window-windcatcher is designed to increase the ventilation rate and reduce the cooling energy consumption [28], this study reports only the cooling consumption and does not take into consideration the effect of the window-windcatcher in reducing the energy demand of heating because the window-windcatcher is designed to be shut down when heating is required [28].

2.2. Model Validation

To validate the simulation results, the indoor air temperatures of the living room in BC were recorded in two different apartments for two typical weeks in summer and winter while the apartment was occupied. One datalogger was installed in each apartment. An Extech SD800 datalogger was mounted 1.2 m above the floor area in the middle of the living room. The datalogger has an accuracy of 0.8 °C, and the measurements were recorded in 15-min intervals. There was very good agreement between the recorded results and the simulations, with an average error of 2–4%, during the whole period. The software has been utilized in several studies in the field of building energy analysis (i.e., [35,36,37,38,39,40,41,42,43]).

3. Results

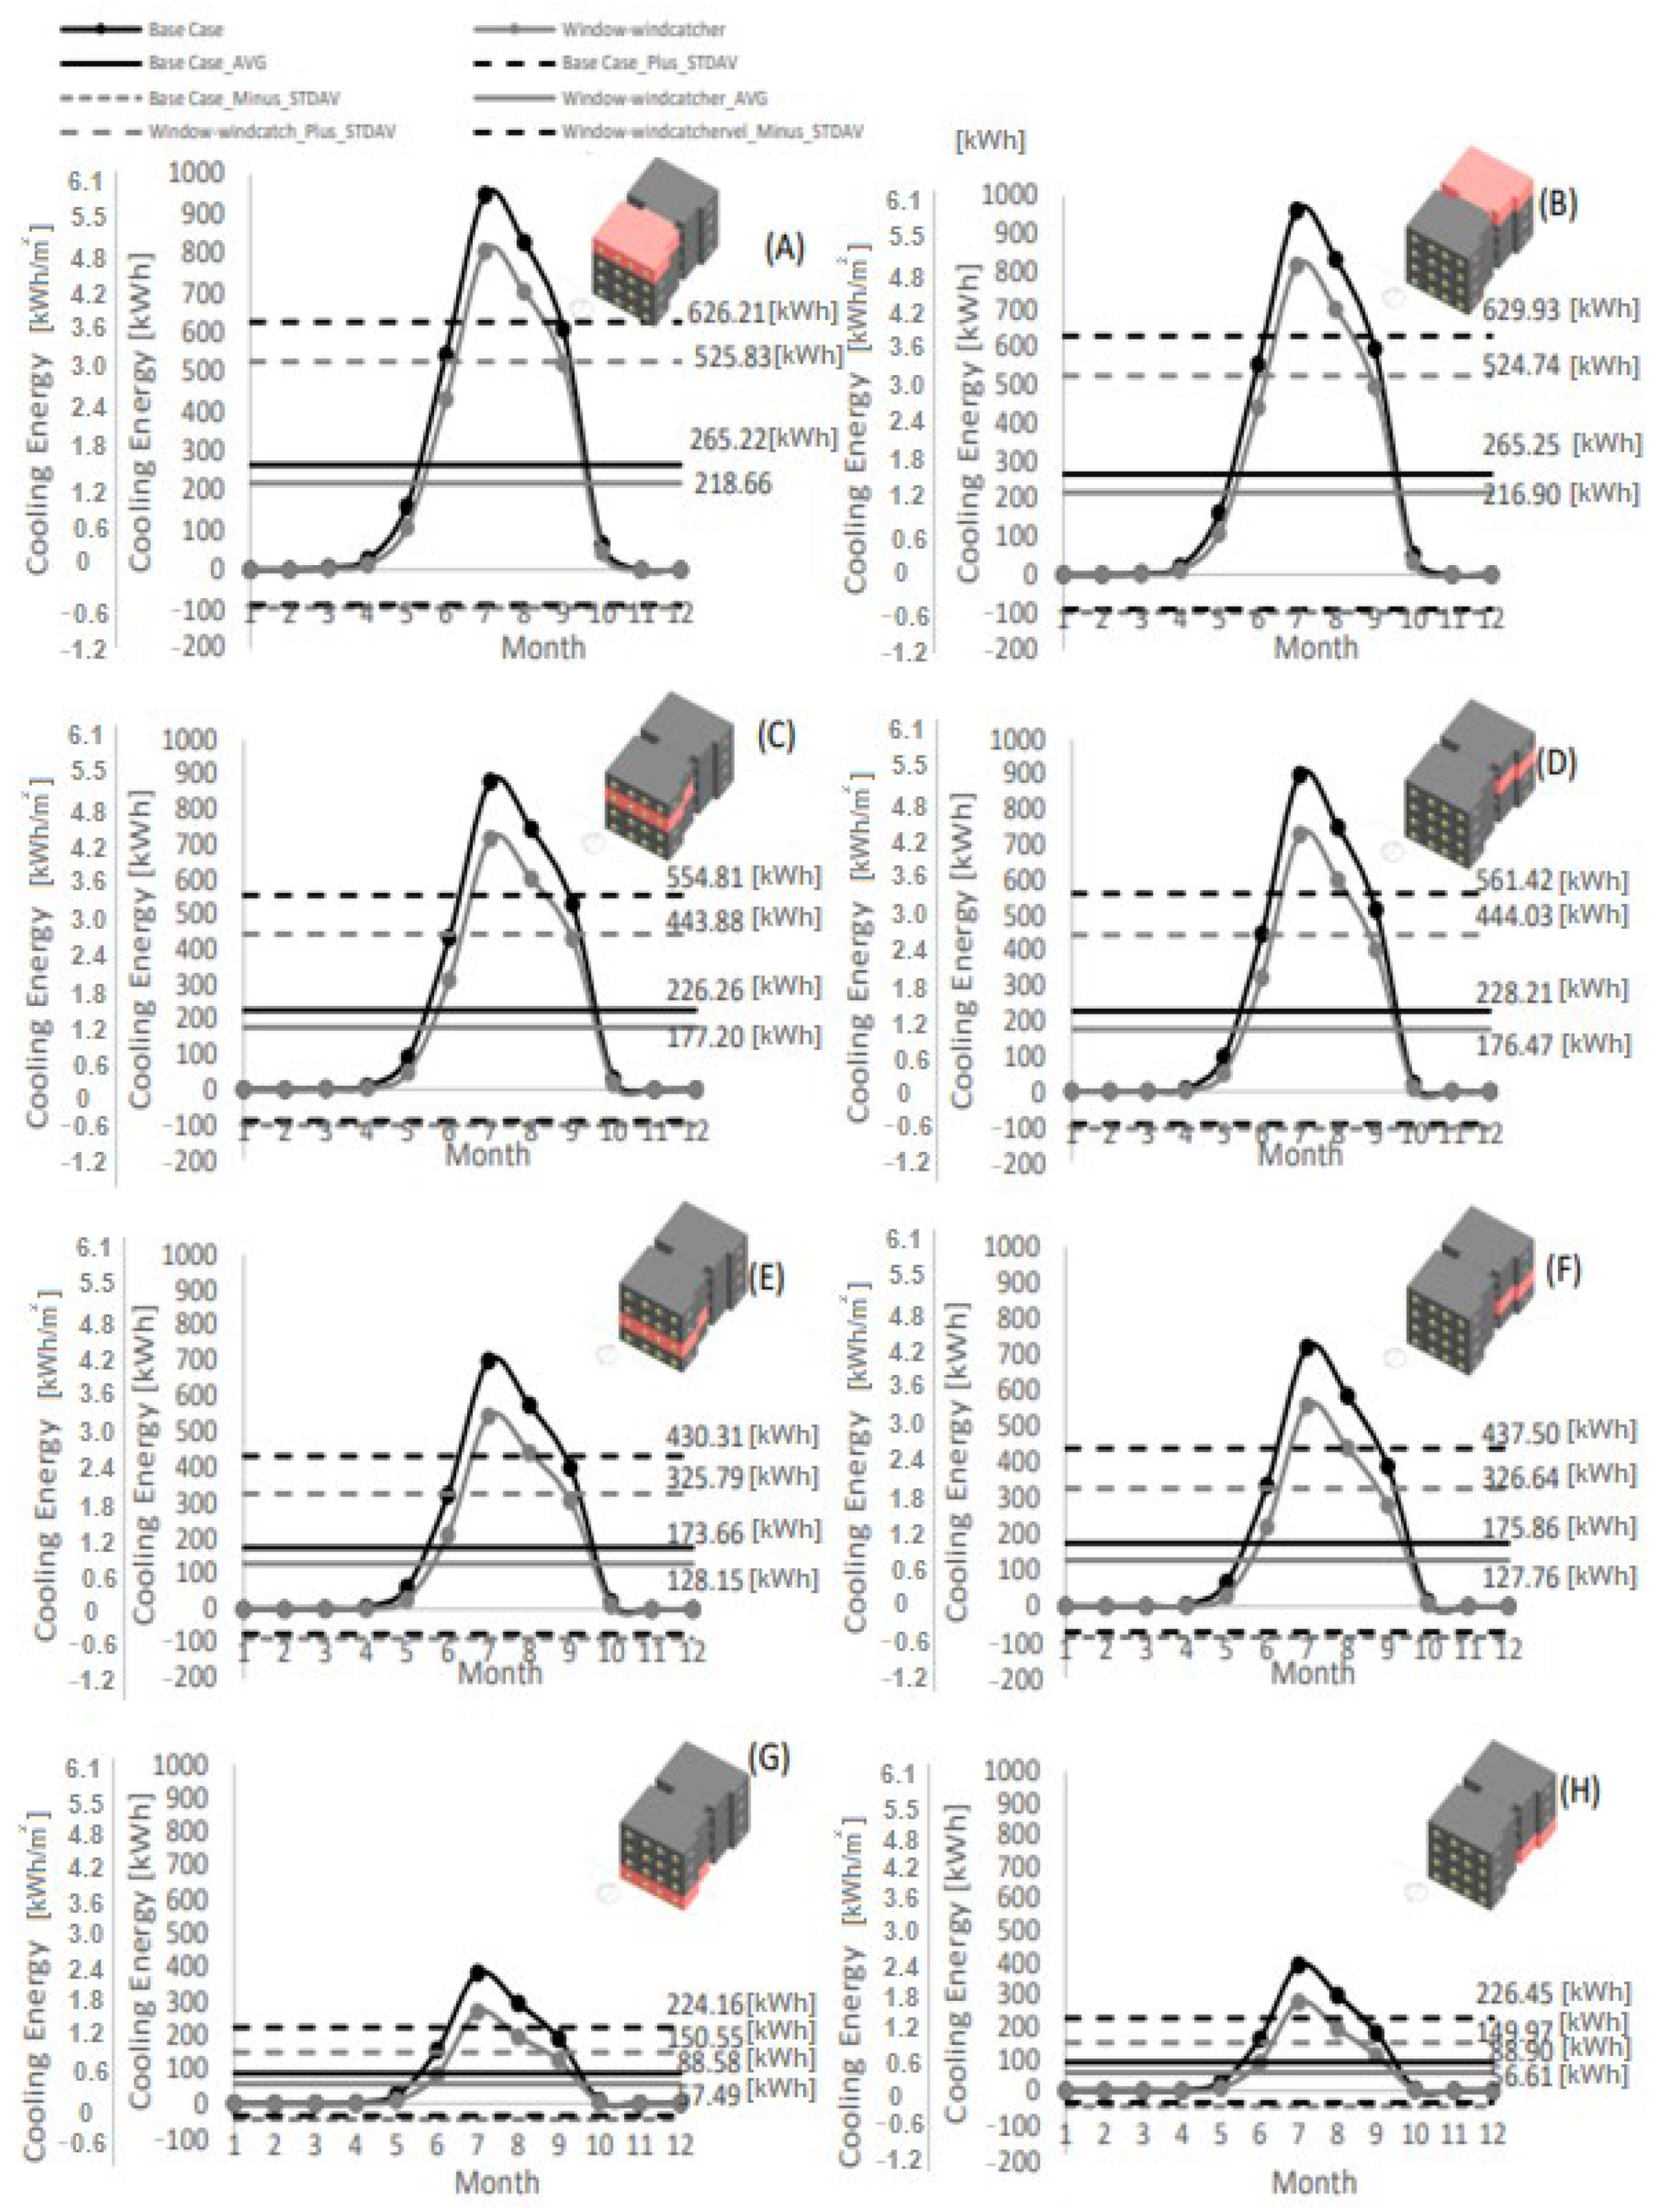
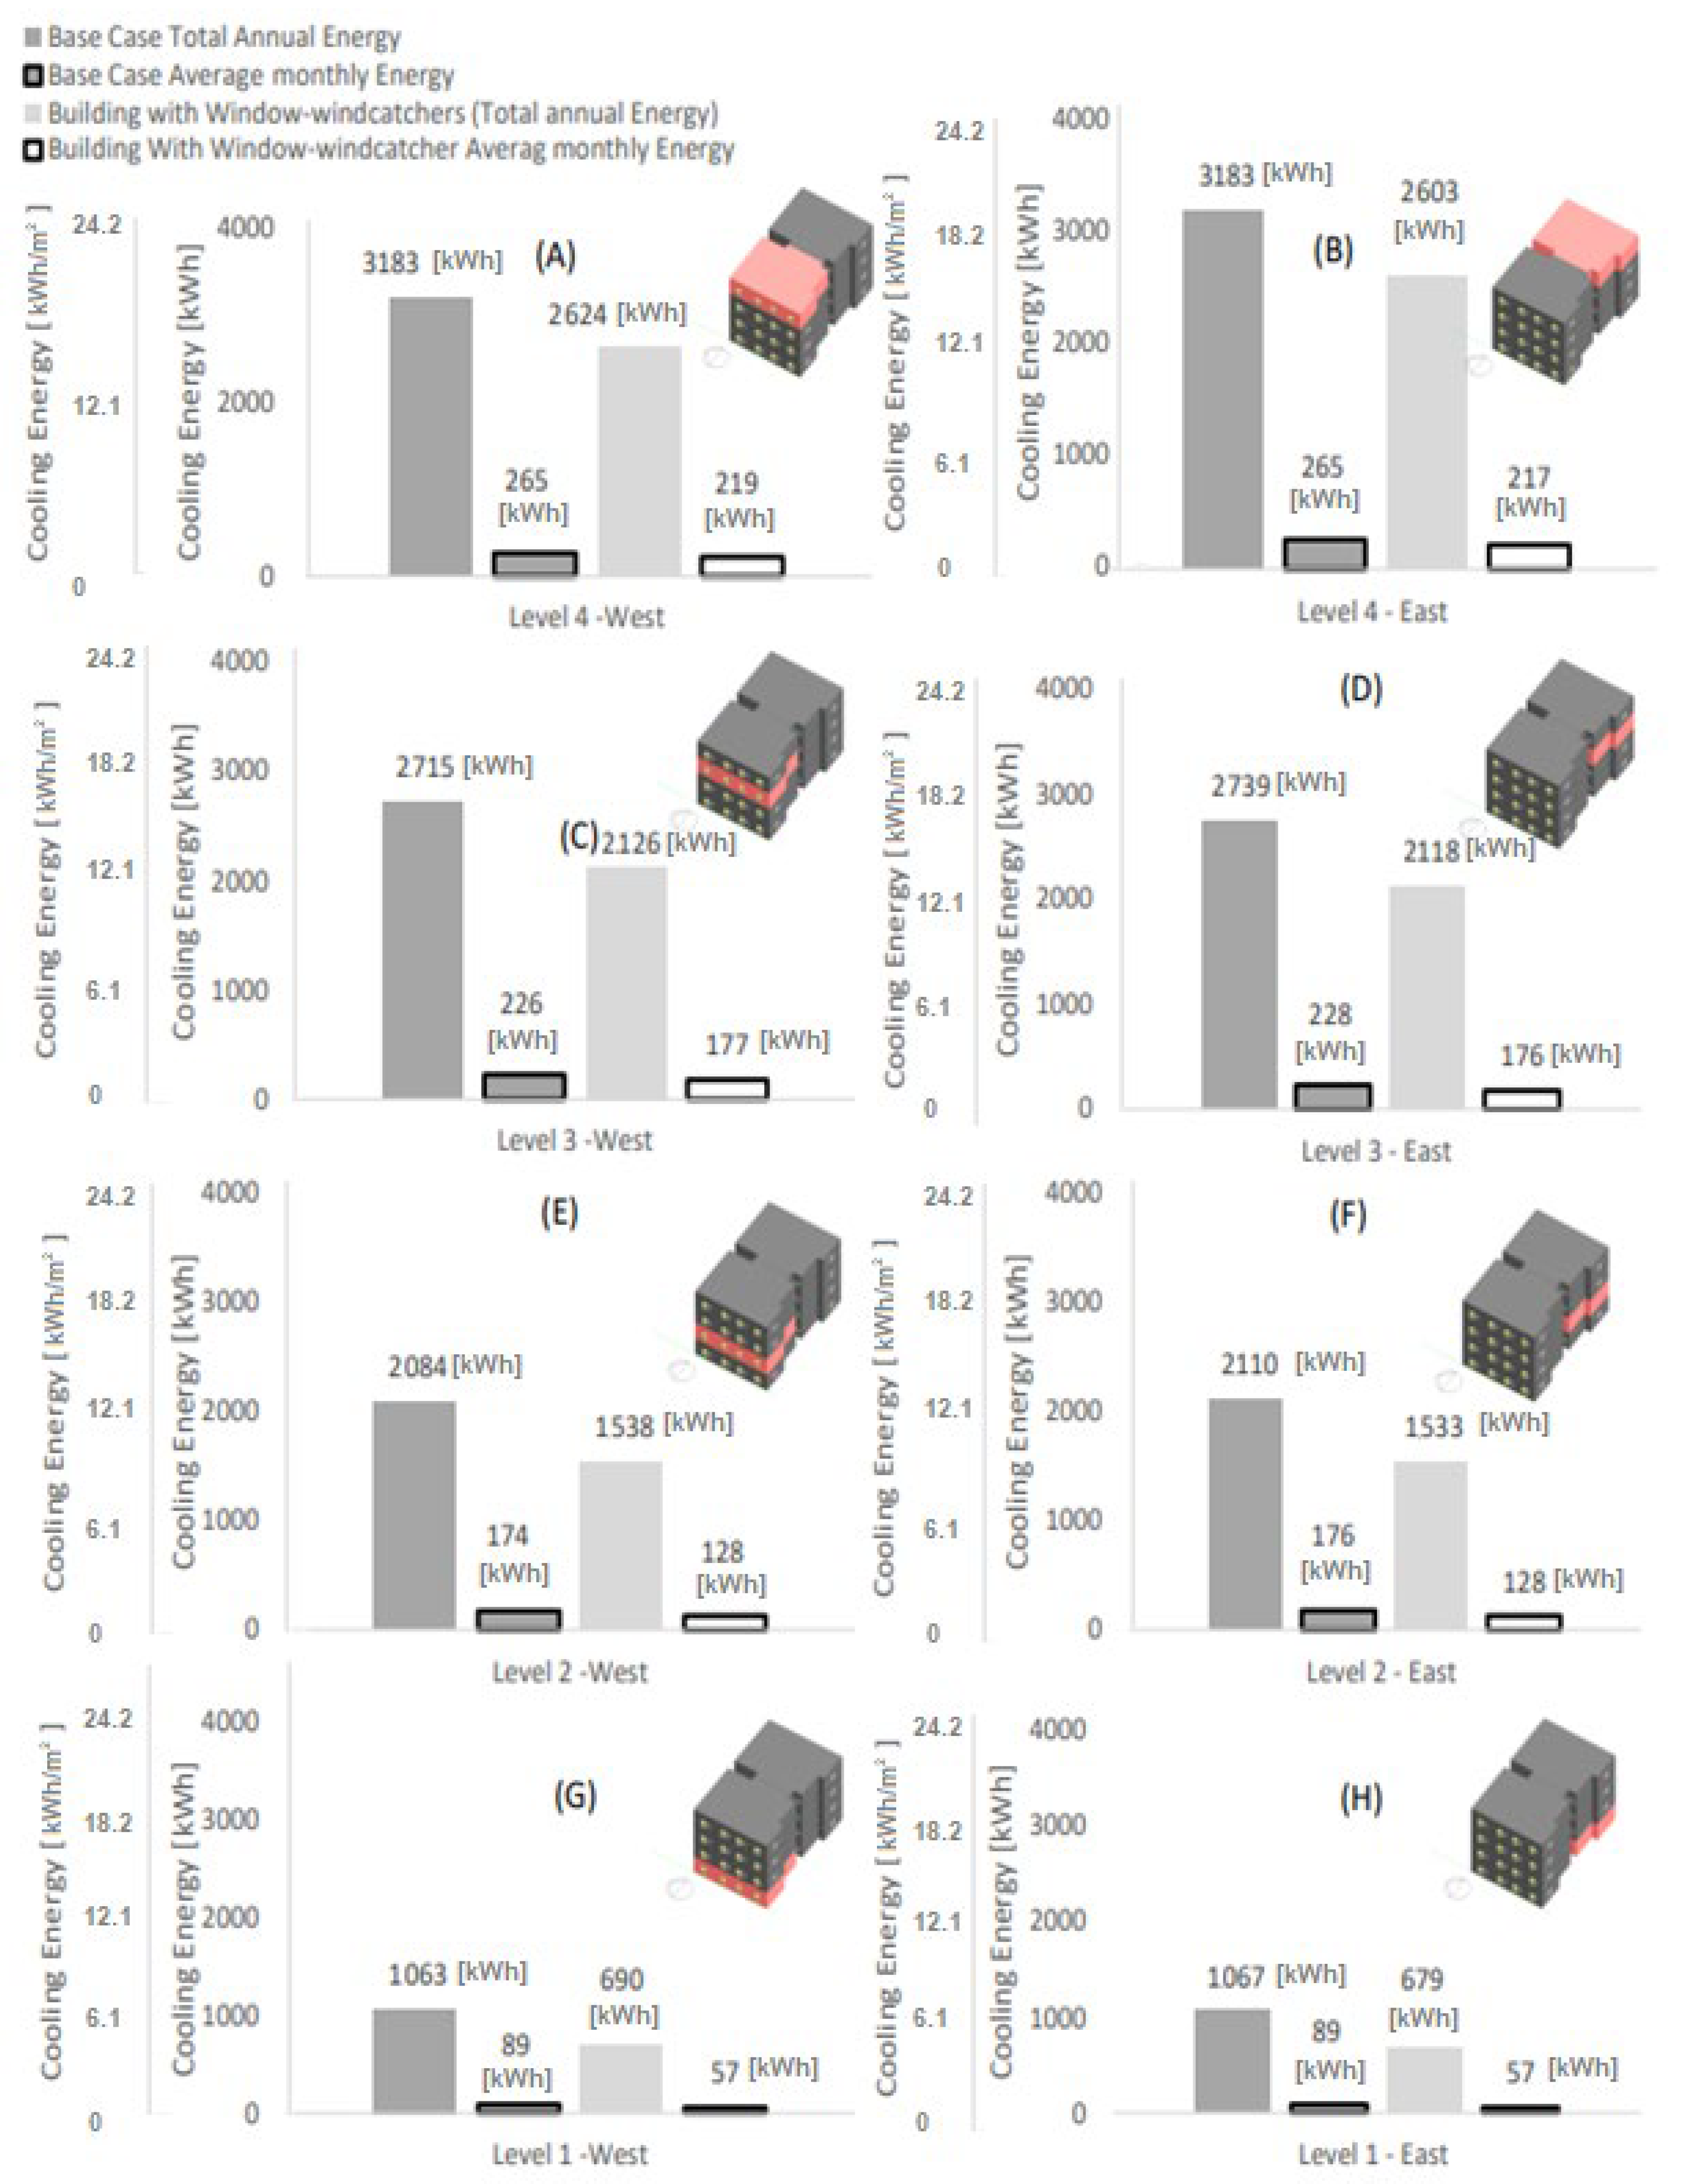
3.1. The Energy Performance of Each Unit of the Building

Figure 4 shows the monthly breakdown of the cooling energy consumption for each unit in the building. The energy patterns follow a spikelike pattern, with a peak in July. All the units within the building follow this pattern. The cooling energy patterns follow the natural monthly atmospheric temperature patterns.
Comparing the east side to the west side of the building, we note that the energy patterns are similar. We find that the energy consumption is lower for units on lower floors. This could be explained by the insulation effect created by the upper floors, which act as an insulation layer, reducing the heat transferred into the building. As the altitude of a unit decreases, the unit is insulated by more floors, which decreases the cooling energy demand. Without the window-windcatcher, the highest average monthly cooling energy consumption ( E ¯ i ) is found to be for the fourth floor, with an average monthly cooling energy consumption of 265.25 kWh/month and 265.22 kWh/month for the east and west units, respectively. This is followed by the third, second, and first floor (with an average monthly cooling energy consumption of 226.26 kWh/month, 173.66 kWh/month, and 88.58 kWh/month, respectively) for the west-side units (226.21 kWh/month, 175.86 kWh/month, 88.90 kWh/month, respectively) and for the east-side units. We conclude that the window-windcatcher successfully reduces the cooling energy demand for all the units within the building.
The average monthly cooling energy consumption of the west side of the building for the fourth, third, second, and first floors has been reduced by approximately 47, 49, 48, and 61 kWh/month compared to the case with no windcatcher, respectively (this corresponds to 17.7, 21.6%, 27.6% and 68% reduction, respectively). Similar reduction rates are found for the east side of the building. As indicated in Figure 4, although the cooling energy decreases as the altitude decreases, the effect of the window-windcatcher on reducing the energy consumption becomes more significant as the altitude of the unit decreases. The standard deviation of the monthly cooling energy consumption ( σ E , i )has been estimated for each unit to predict how much the energy consumption varies around the monthly average rate.
Figure 4 shows the corresponding E ¯ i + σ E , i and E ¯ i σ E , i , and each unit is labelled with the interval by which most monthly energy consumption is limited.
For the window-windcatcher, the E ¯ i + σ E , i for the west-side units for the fourth, third, second, and first floors is 626.21 kWh, 554.81 kWh, 430.31 kWh, and 224.16 kWh, respectively. A similar value for E ¯ i + σ E , i is found for the east-side units (i.e., for the fourth, third floor, second, and first floors, 629.93 kWh, 561.42 kWh, 437.50 kWh, and 226.45 kWh, respectively). Naturally, as the E ¯ i is reduced using the window-windcatcher, the corresponding σ E , i + E ¯ i limit is reduced accordingly (i.e., for the west-side units on the fourth, third, second, and first floors, E ¯ i + σ E , i is 525.83 kWh, 443.88 kWh, 325.79 kWh, and 150.50 kWh, respectively. For the east-side units, the corresponding E ¯ i + σ E , i is 524.74 kWh, 444.03 kWh, 326.64 kWh, and 149.97 kWh, respectively.
Figure 5 quantifies the annual total and average energy consumption of each building unit ( E t o t , i , E ¯ i ) with and without a window-windcatcher. As shown in Figure 5A, the annual total energy of the west side of the building ( E t o t , i ) on the fourth floor is approximately 3183 kWh/year and 2624 kWh/year without and with the window-windcatcher, respectively. Thus, the annual corresponding energy reduction due to the window-windcatcher ( E r , i ) for this unit is approximately 559 kWh/year, which corresponds to an approximately 18% reduction.
For the west-side units on the third, second, and first floors, the total annual cooling energies ( E t o t , i ) have been reduced from 2715 kWh/year, 2084 kWh/year, and 1063 kWh/year to 2126 kWh/year, 1538 kWh/year, and 690 kWh/year, respectively, using the window-windcatcher. The corresponding energy reductions ( E r , i ) for the third, second, and first floors are 589 kWh/year, 546 kWh/year, and 373 kWh/year, respectively. These energy reductions correspond to a 21.7%, 26.2%, and 35.1% reduction in the total annual energy consumption, respectively.
For the east-side units on the fourth, third, second, and first floors, the total annual cooling energies ( E t o t , i ) have been reduced from 3183 kWh/year, 2739 kWh/year, 2110 kWh/year, and 1067 kWh/year to 2603 kWh/year, 2118 kWh/year, 1553 kWh/year, and 679 kWh/year, respectively, using the window-windcatcher. The corresponding energy reductions ( E r , i ) for the fourth, third, second, and first floors are 580, 621, 557, and 388 kWh/year, respectively. These energy reductions account for 18.2%, 22.7%, 26.4%, and 36.4% of the total annual energy consumption (east-side units on the fourth, third, second, and first floors, respectively).
We conclude that the window-windcatcher is capable of reducing the cooling energy consumption, by up to 36.4% (i.e., for the east-side unit on the first floor) and with a minimal reduction of 18.0% (for the west-side unit in the fourth floor).

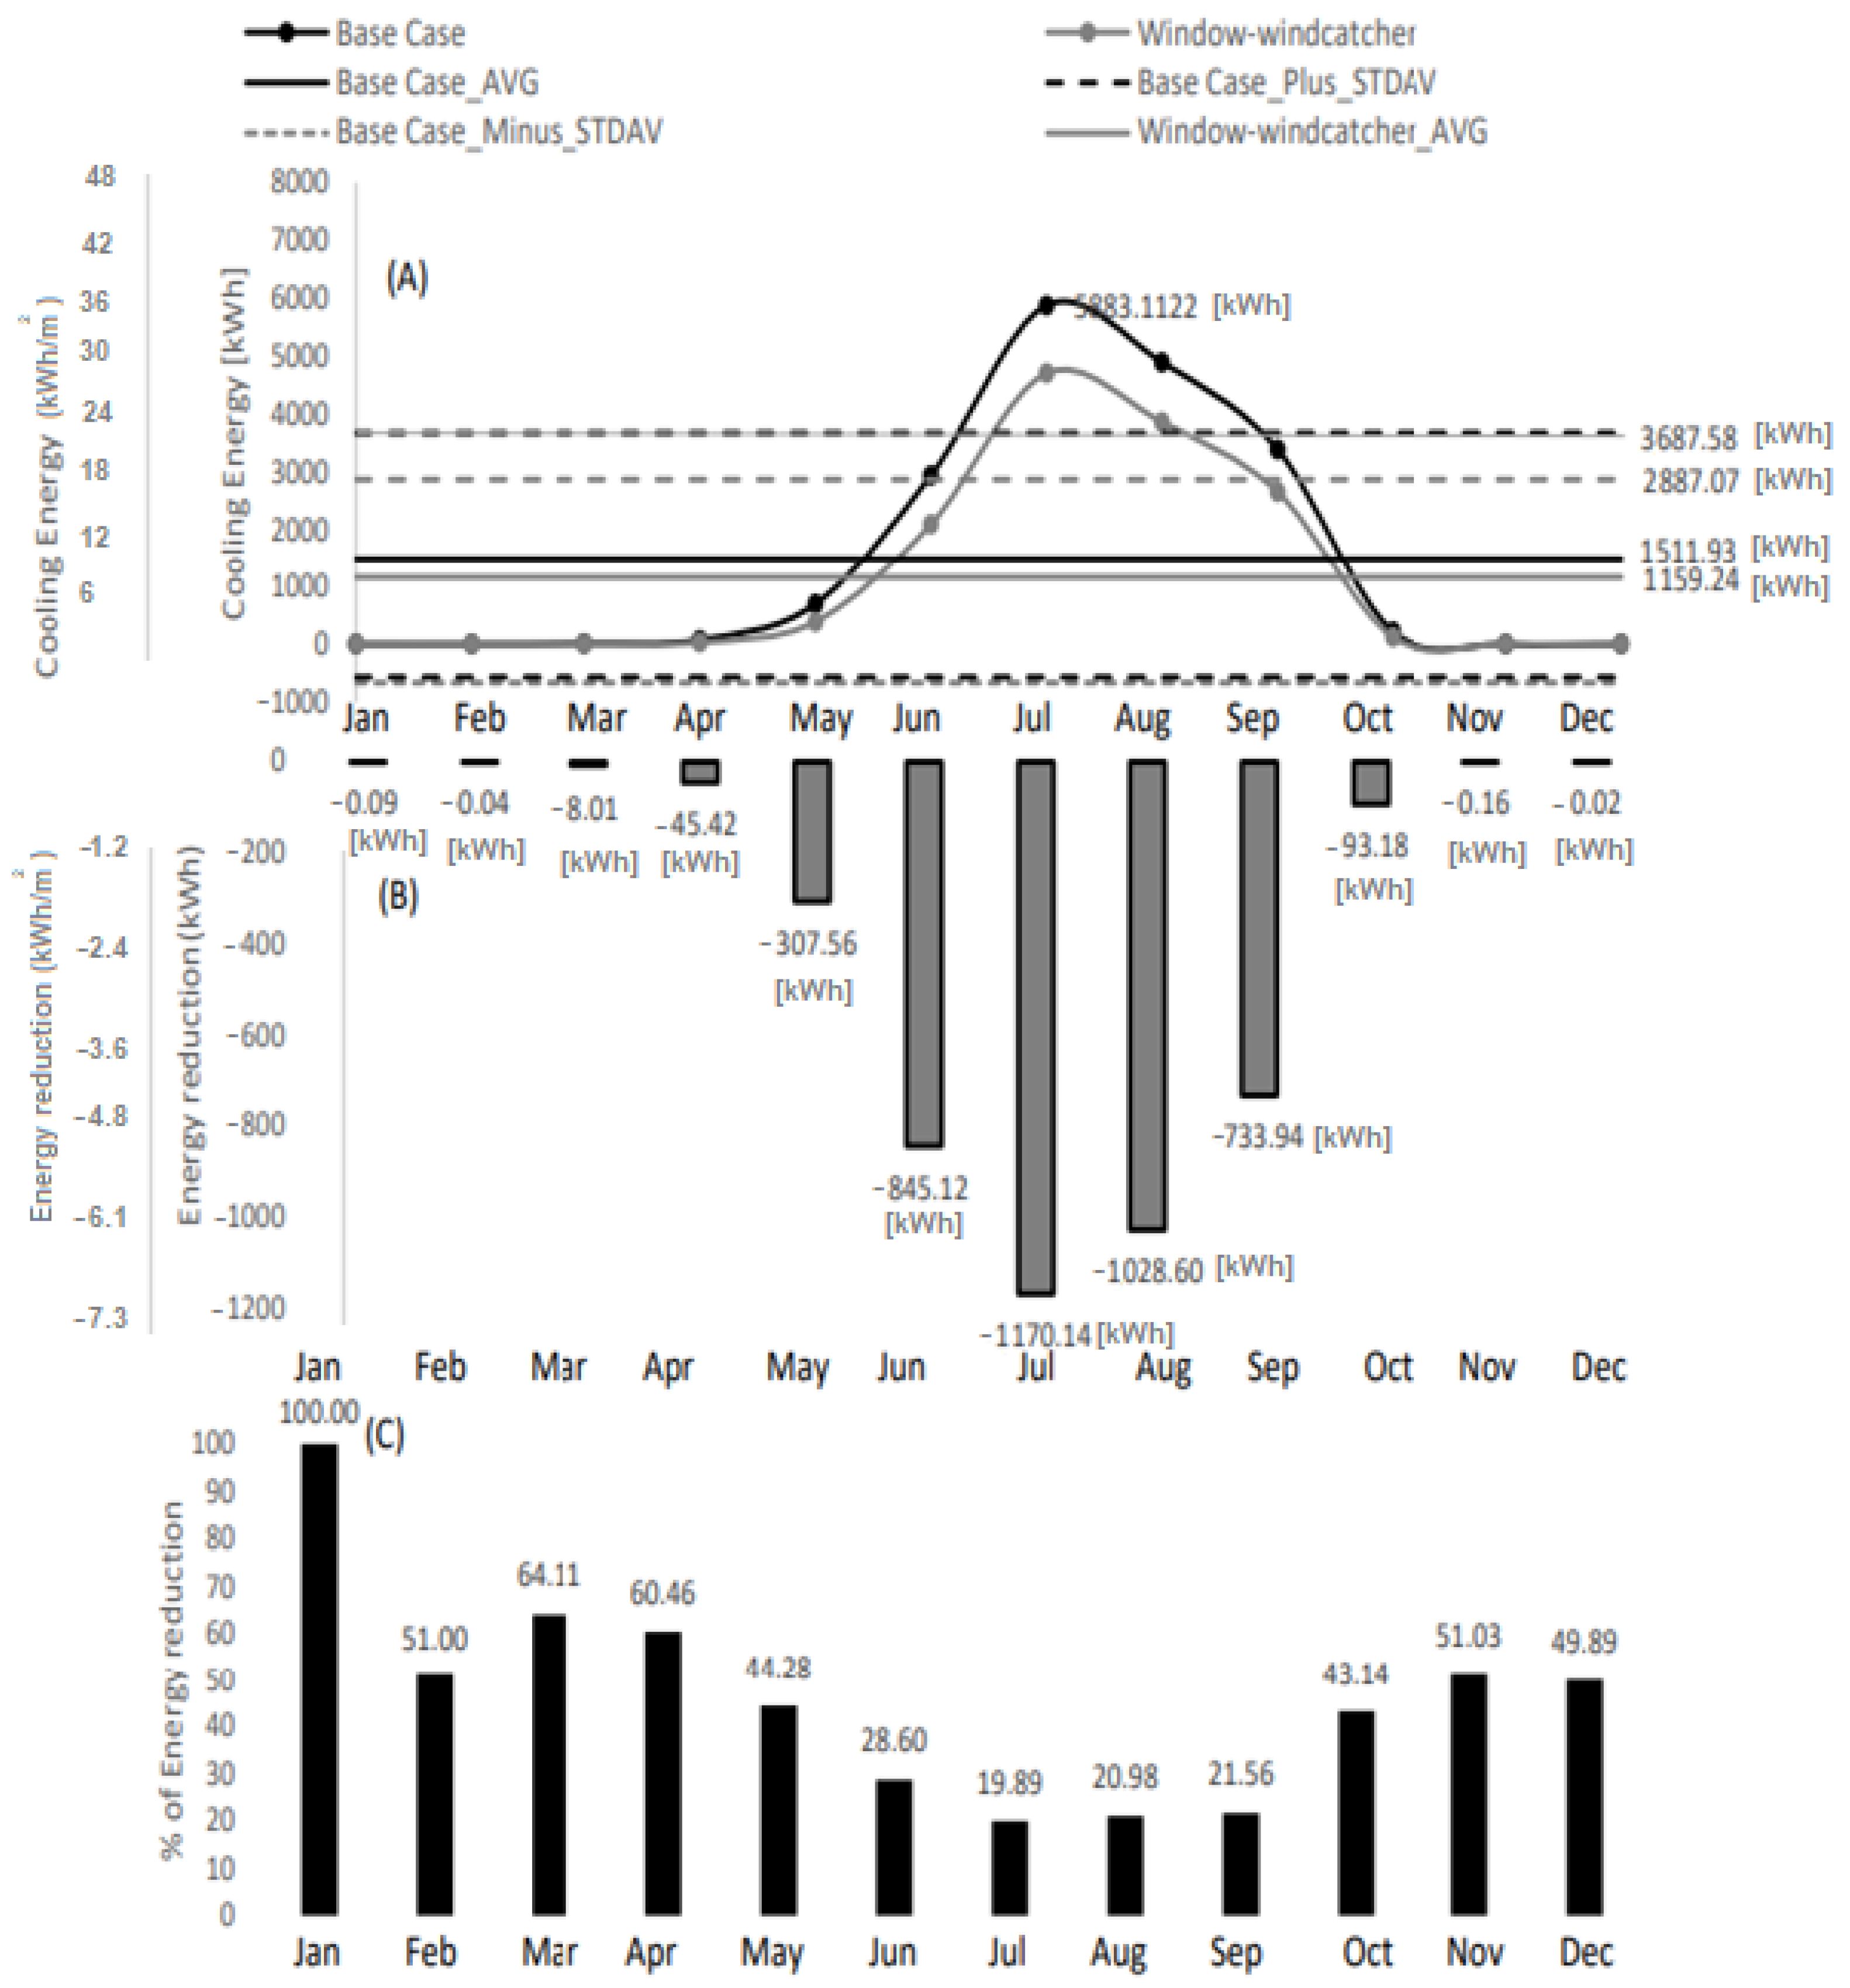
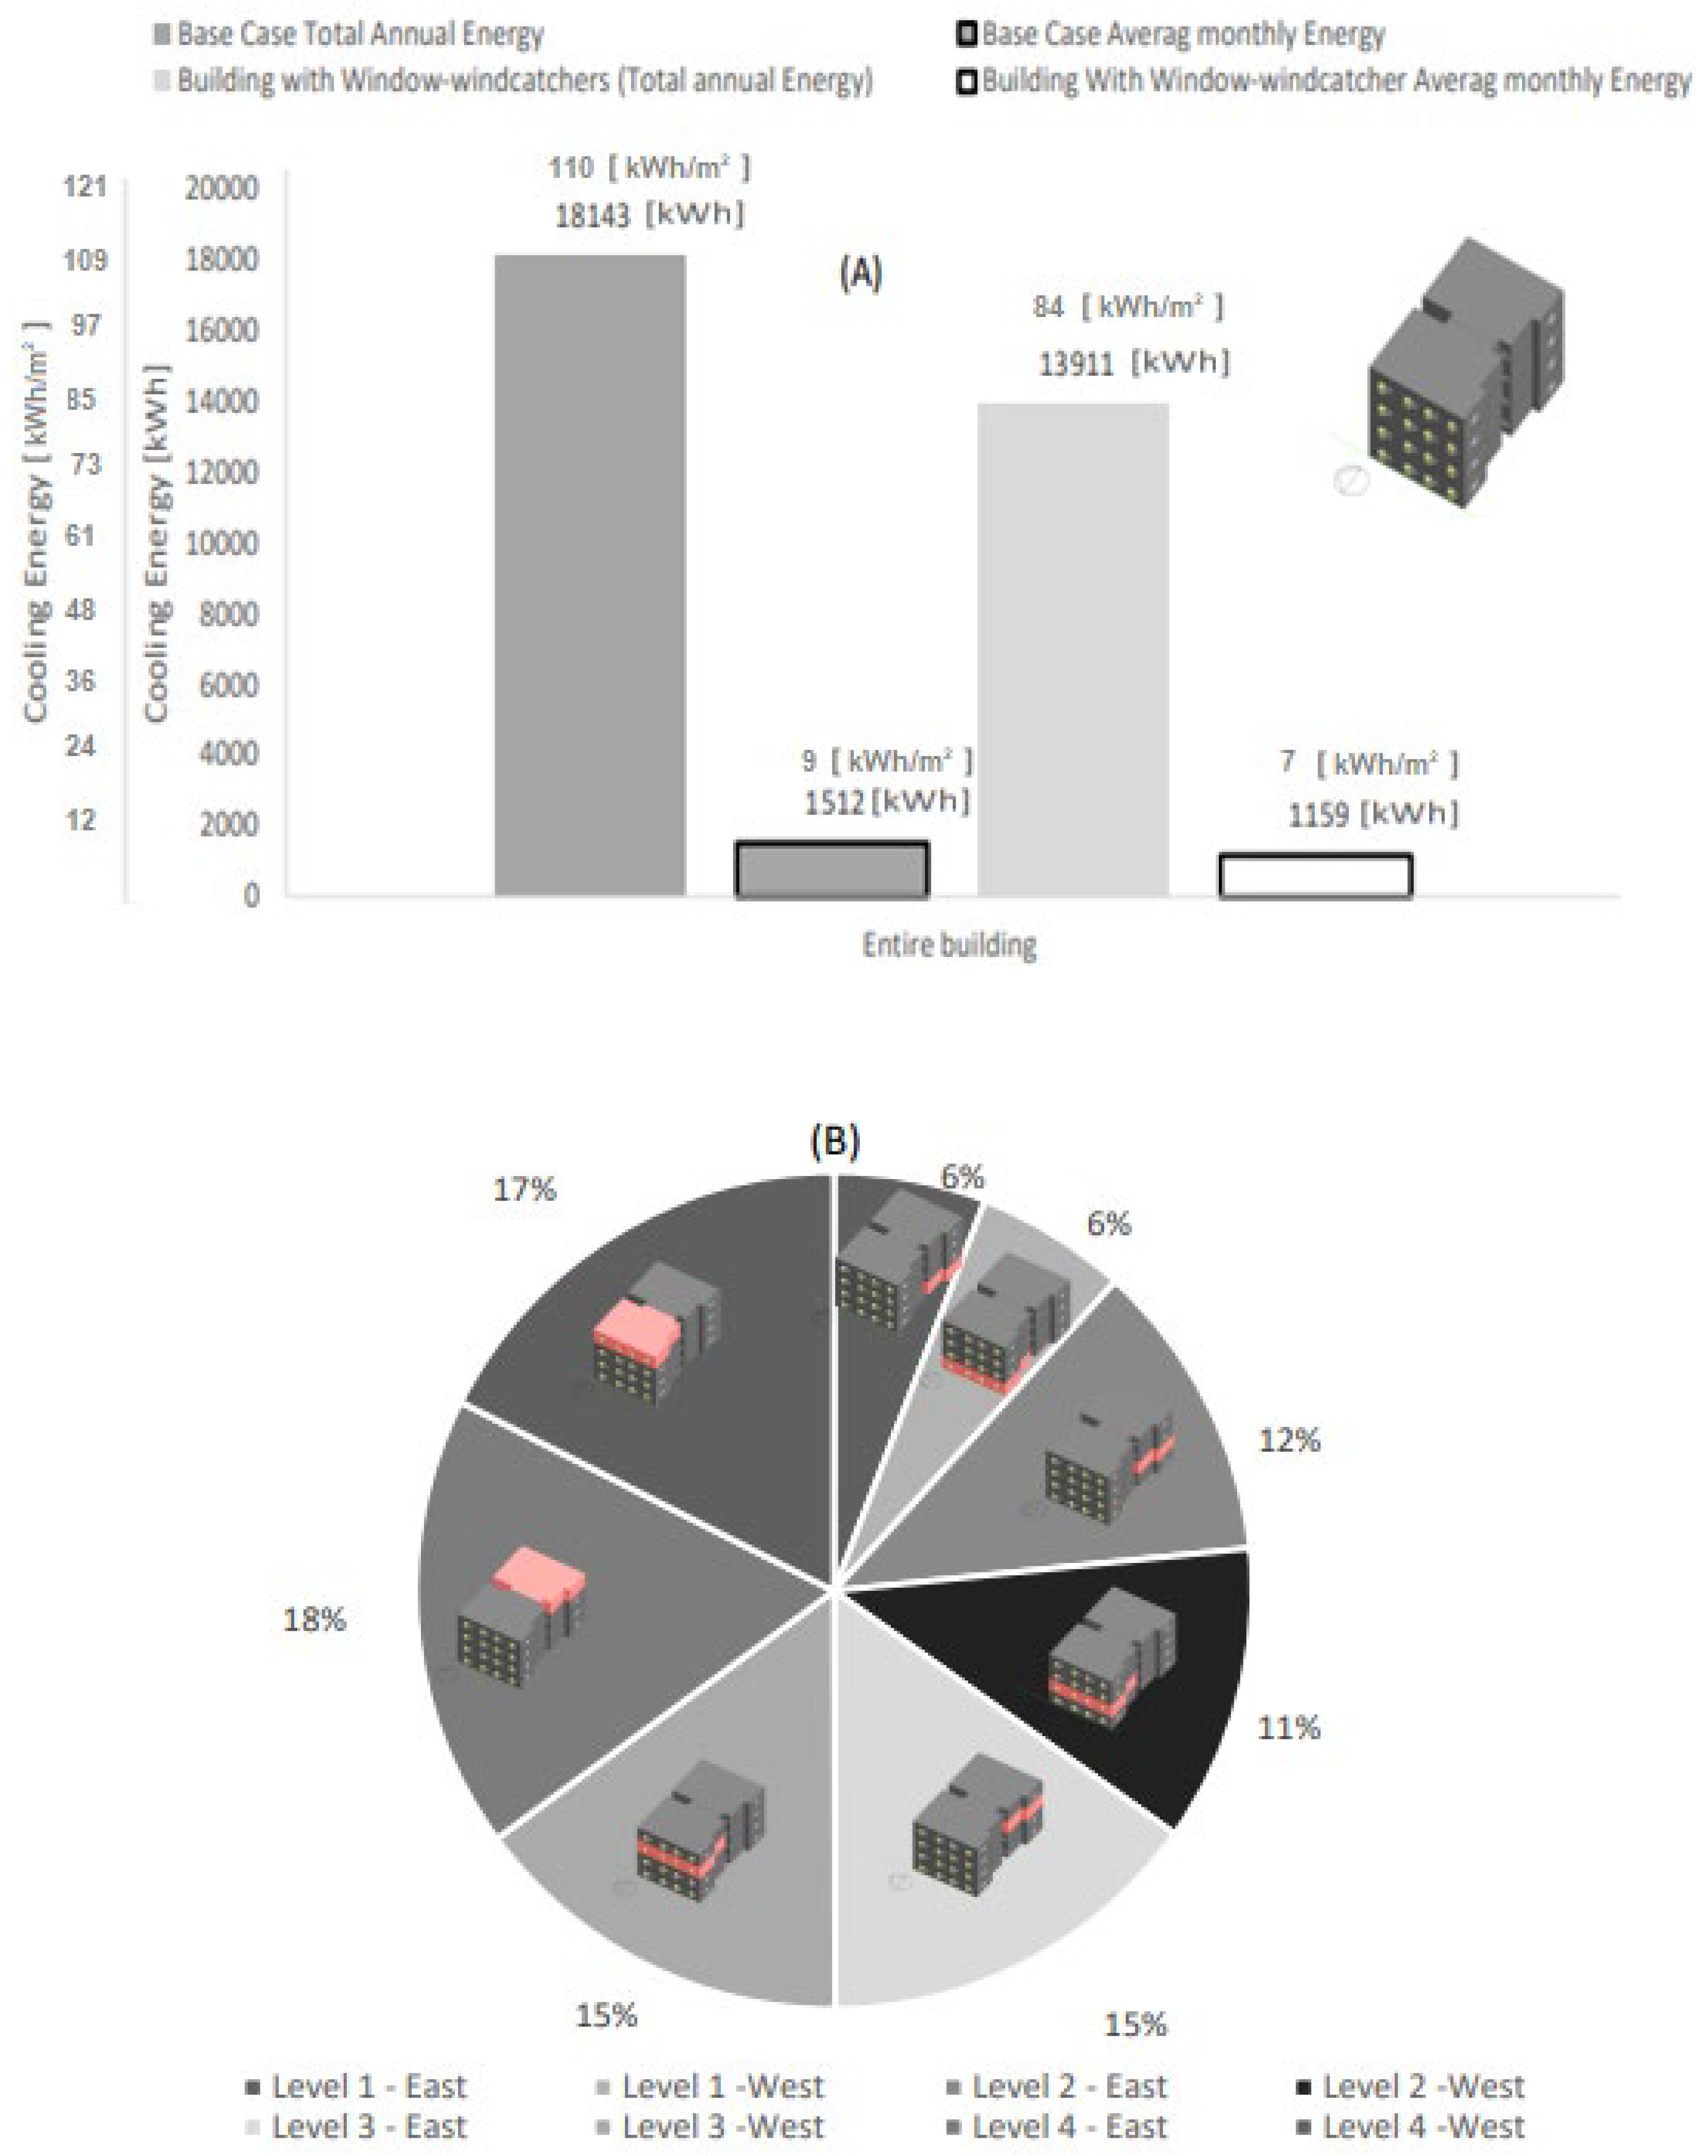
3.2. The Energy Performance of the Entire Building

Once the energy performance of each unit in the building has been estimated (Section 3.1), the overall monthly performance of the entire building is quantified in this section, throughout the year. Figure 6A shows the monthly cooling energy consumption and the average monthly energy consumption of the entire building, E b and E ¯ b , respectively.
In addition, the standard deviation of the monthly cooling energy consumption, σ E b , has been estimated for the entire building to predict how the level of energy consumption varies from the monthly average rate. The corresponding E ¯ b + σ E b and E ¯ b σ E b values for the entire building are shown in Figure 6A to label the interval in which most monthly energy consumption is limited.
Since the monthly energy consumption patterns for all the units, ( E i , follows a spikelike trend, the pattern of the monthly energy consumption of the entire building, E b , is described in a likewise trend. The energy consumption peaks in July, at approximately 5900 kWh/month and 4700 kWh/month without and with window-windcatchers, respectively. The average monthly energy consumption of the entire building is approximately 1159 kWh/month and 1512 kWh/month for the base case and for the building with window-windcatchers, respectively. With the window-windcatchers, the E ¯ b + σ E b is approximately 2887 kWh/month, which is lower than that for the base case by 800 kWh/month (   E ¯ b + σ E b for the base case is 3688 kWh/month).
Figure 6B quantifies the monthly reduced amounts of energy using the window-windcatcher compared to the base case (without the window-windcatcher) for the entire building ( E r b ). The highest reduction is in July, at approximately 1170 kWh. This is followed by August, June, September, May, October, and April with an E r b of 1028 kWh/month, 845kWh/month, 734 kWh/month, 307 kWh/month, 93 kWh/month, and 45 kWh/month, respectively.
In July, the reduction in the cooling energy using the window-windcatcher is approximately 19.9%, as seen in Figure 4C. Similarly, in August, June, September, May, October, and April, the reduction is 20.98%, 28.6%, 21.56%, 44.28%, 43.14, and 60.46%, respectively. The reduction of energy for the other months is negligible because cooling energy is not necessary and is not, typically, used in these relatively cool months (January, February, March, November, and December).
Figure 7A quantifies the annual total and average energy consumptions of the entire building ( E t o t , b , E ¯ b ) of the base case and for the case with a window-windcatcher. Compared to the base case, the total annual energy consumption of the entire building ( E t o t , b ) is reduced from 18,143 kWh/year to 13,911 kWh/year using the window-windcatcher. Compared to the base case, the corresponding average energy consumption of the entire building ( E ¯ b ) is reduced from 1512 kWh/month to 1159 kWh/month, using the window-windcatcher. As previously mentioned, the required cooling energy decreases as the altitude decreases due to the insulation effect created by the upper floors, reducing the heat transferred into the building. This effect was quantified in Figure 7B, which shows the percentage of cooling energy consumption for each unit with respect to the entire building (18–17%, 15%, 11–12%, and 6% for each unit in the fourth, third, second and first floors, respectively).
Once the monthly cooling energy consumption of the entire building ( E b ) was estimated (Figure 6), a techno-economic evaluation was performed using the energy consumption prices reported in [1] (0.1 USD/kWh). As shown in Figure 8A, for the base case, the cooling costs of the entire building in July, August, September, June, May, and October are USD 588, USD 490, USD 340, USD 295.5, USD 69.5, and USD 22, respectively. For the case of the window-windcatcher, the cooling costs of the entire building in July, August, September, June, May, and October are USD 471, USD 387, USD 267, USD 210, USD 39., and USD 12., respectively, Figure 8A. As shown in Figure 6B, compared to the base case, the total annual cooling cost and the average monthly cooling costs have been reduced using the window-windcatcher from USD 1814 to USD 1391 and from USD 151 to USD 116, respectively. This corresponds to a reduction of approximately 23.3%, compared to the base case as seen in Figure 8C.

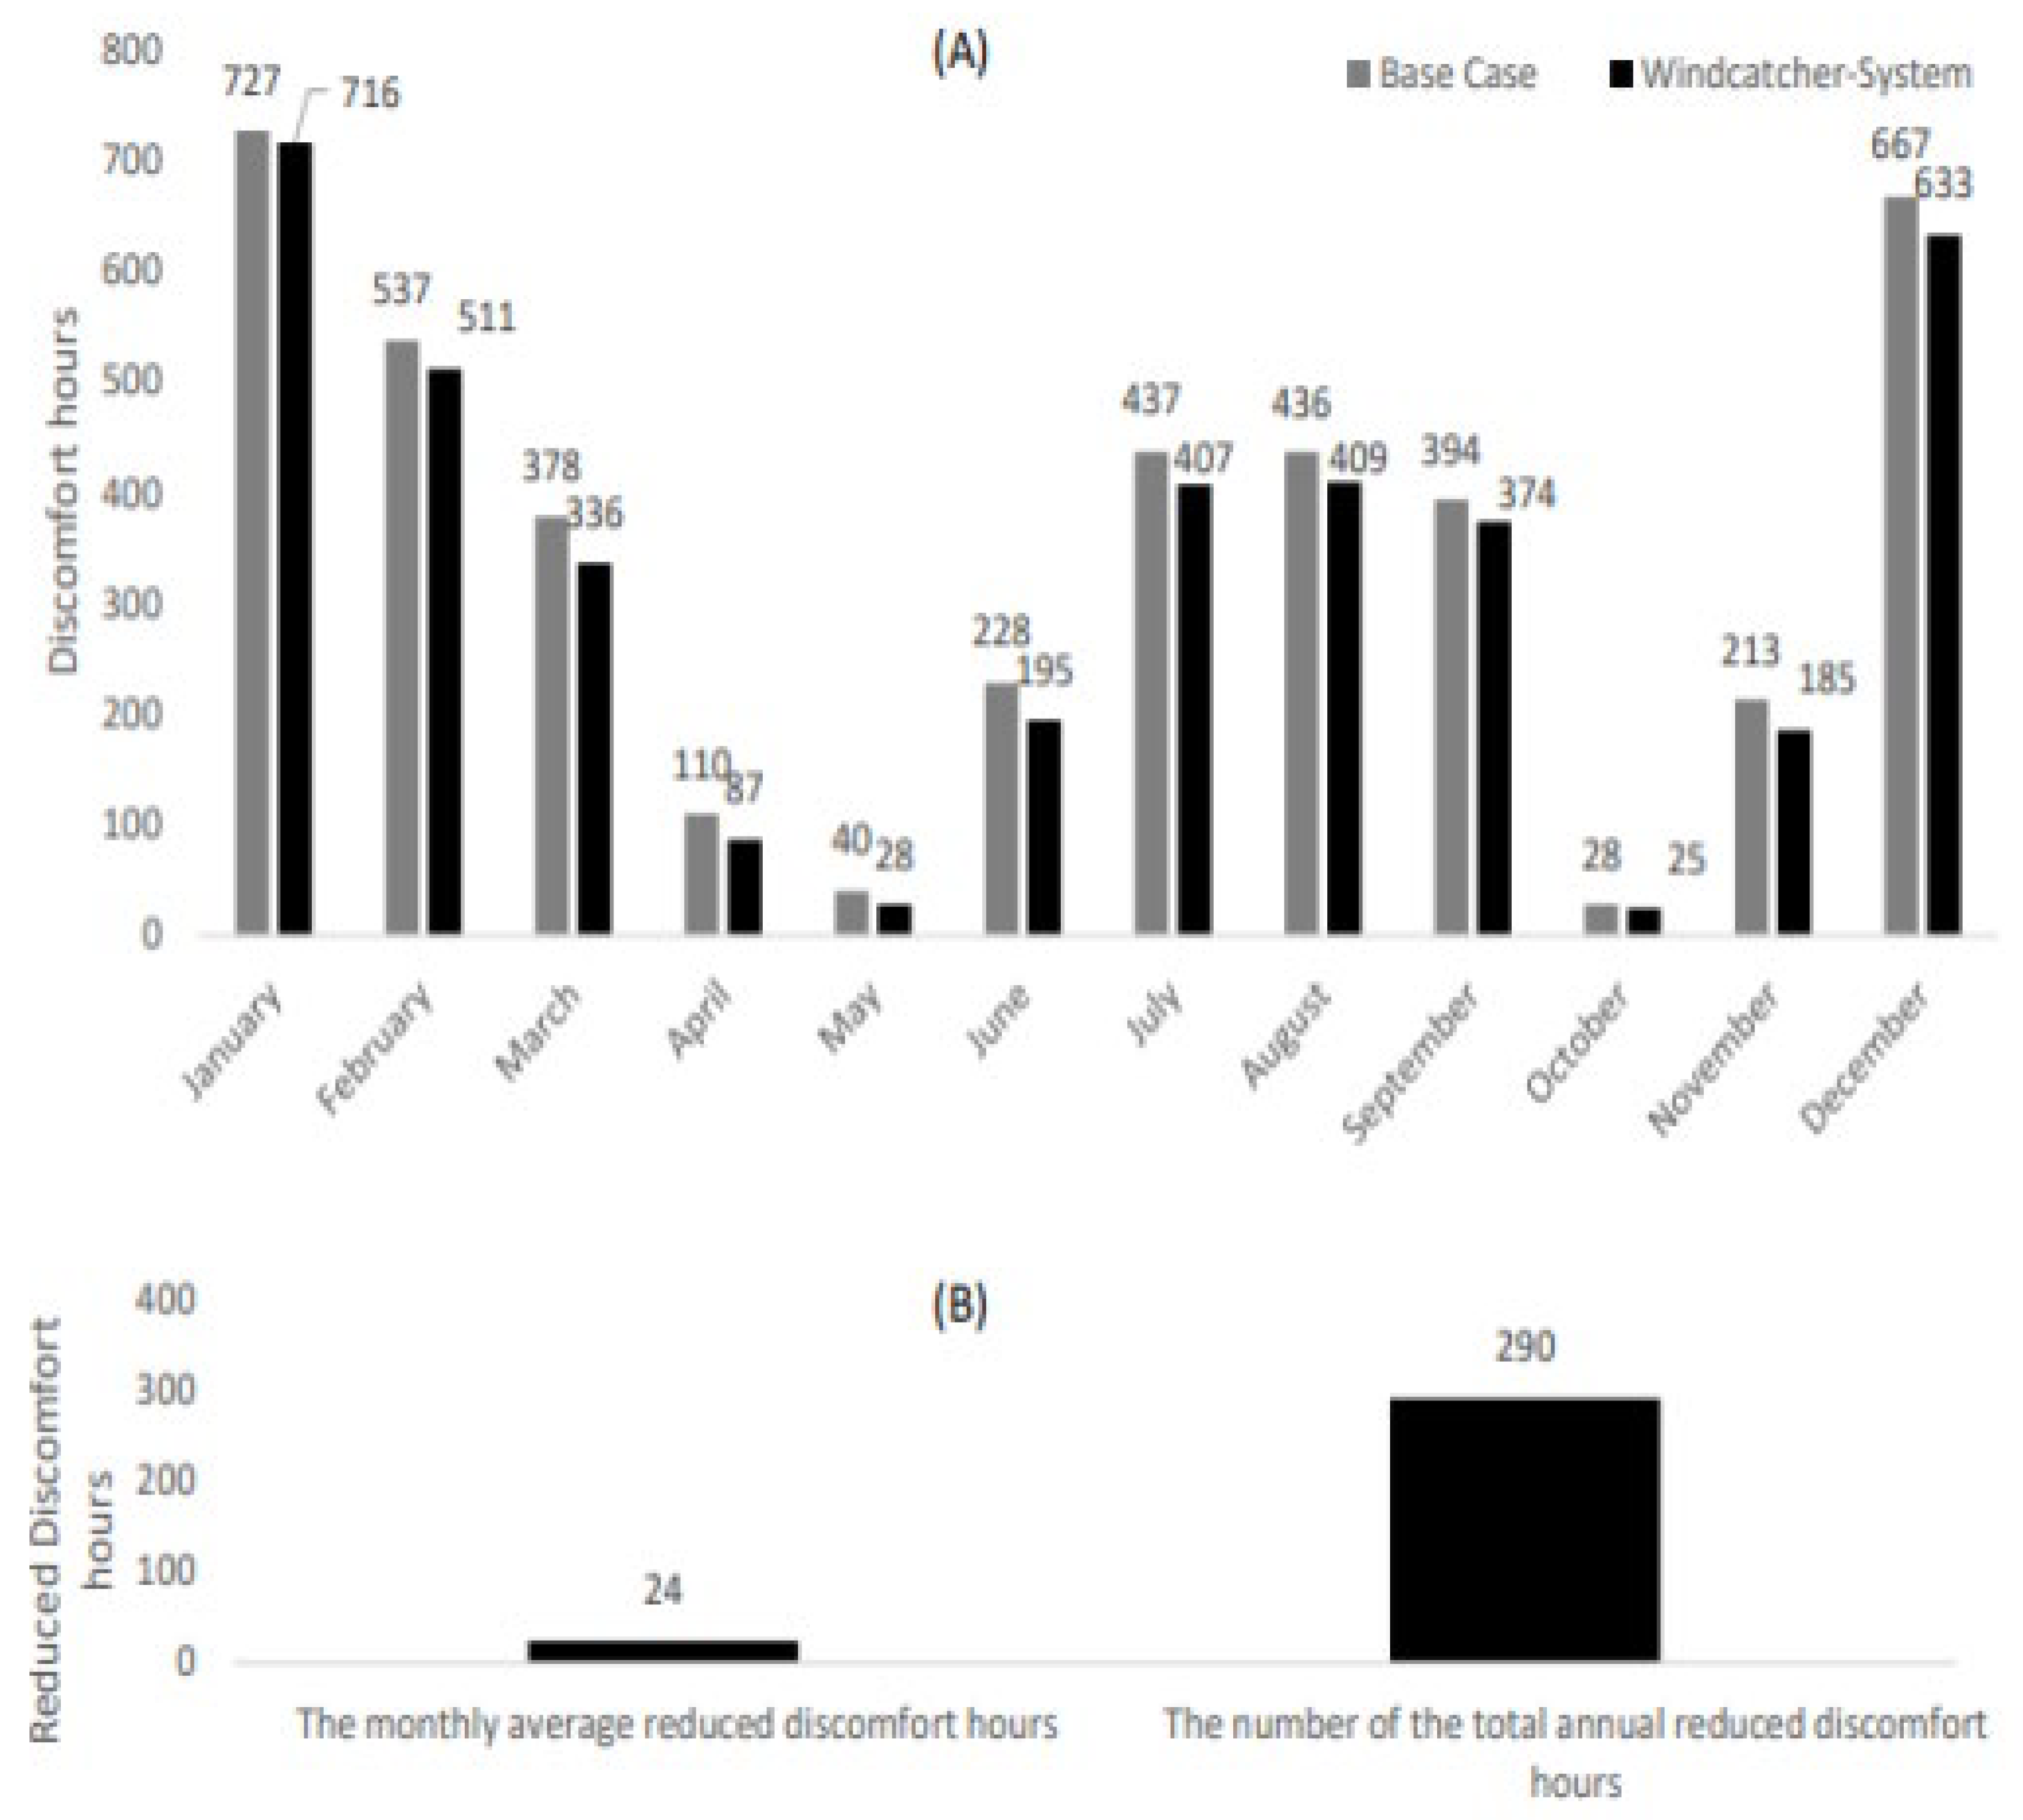
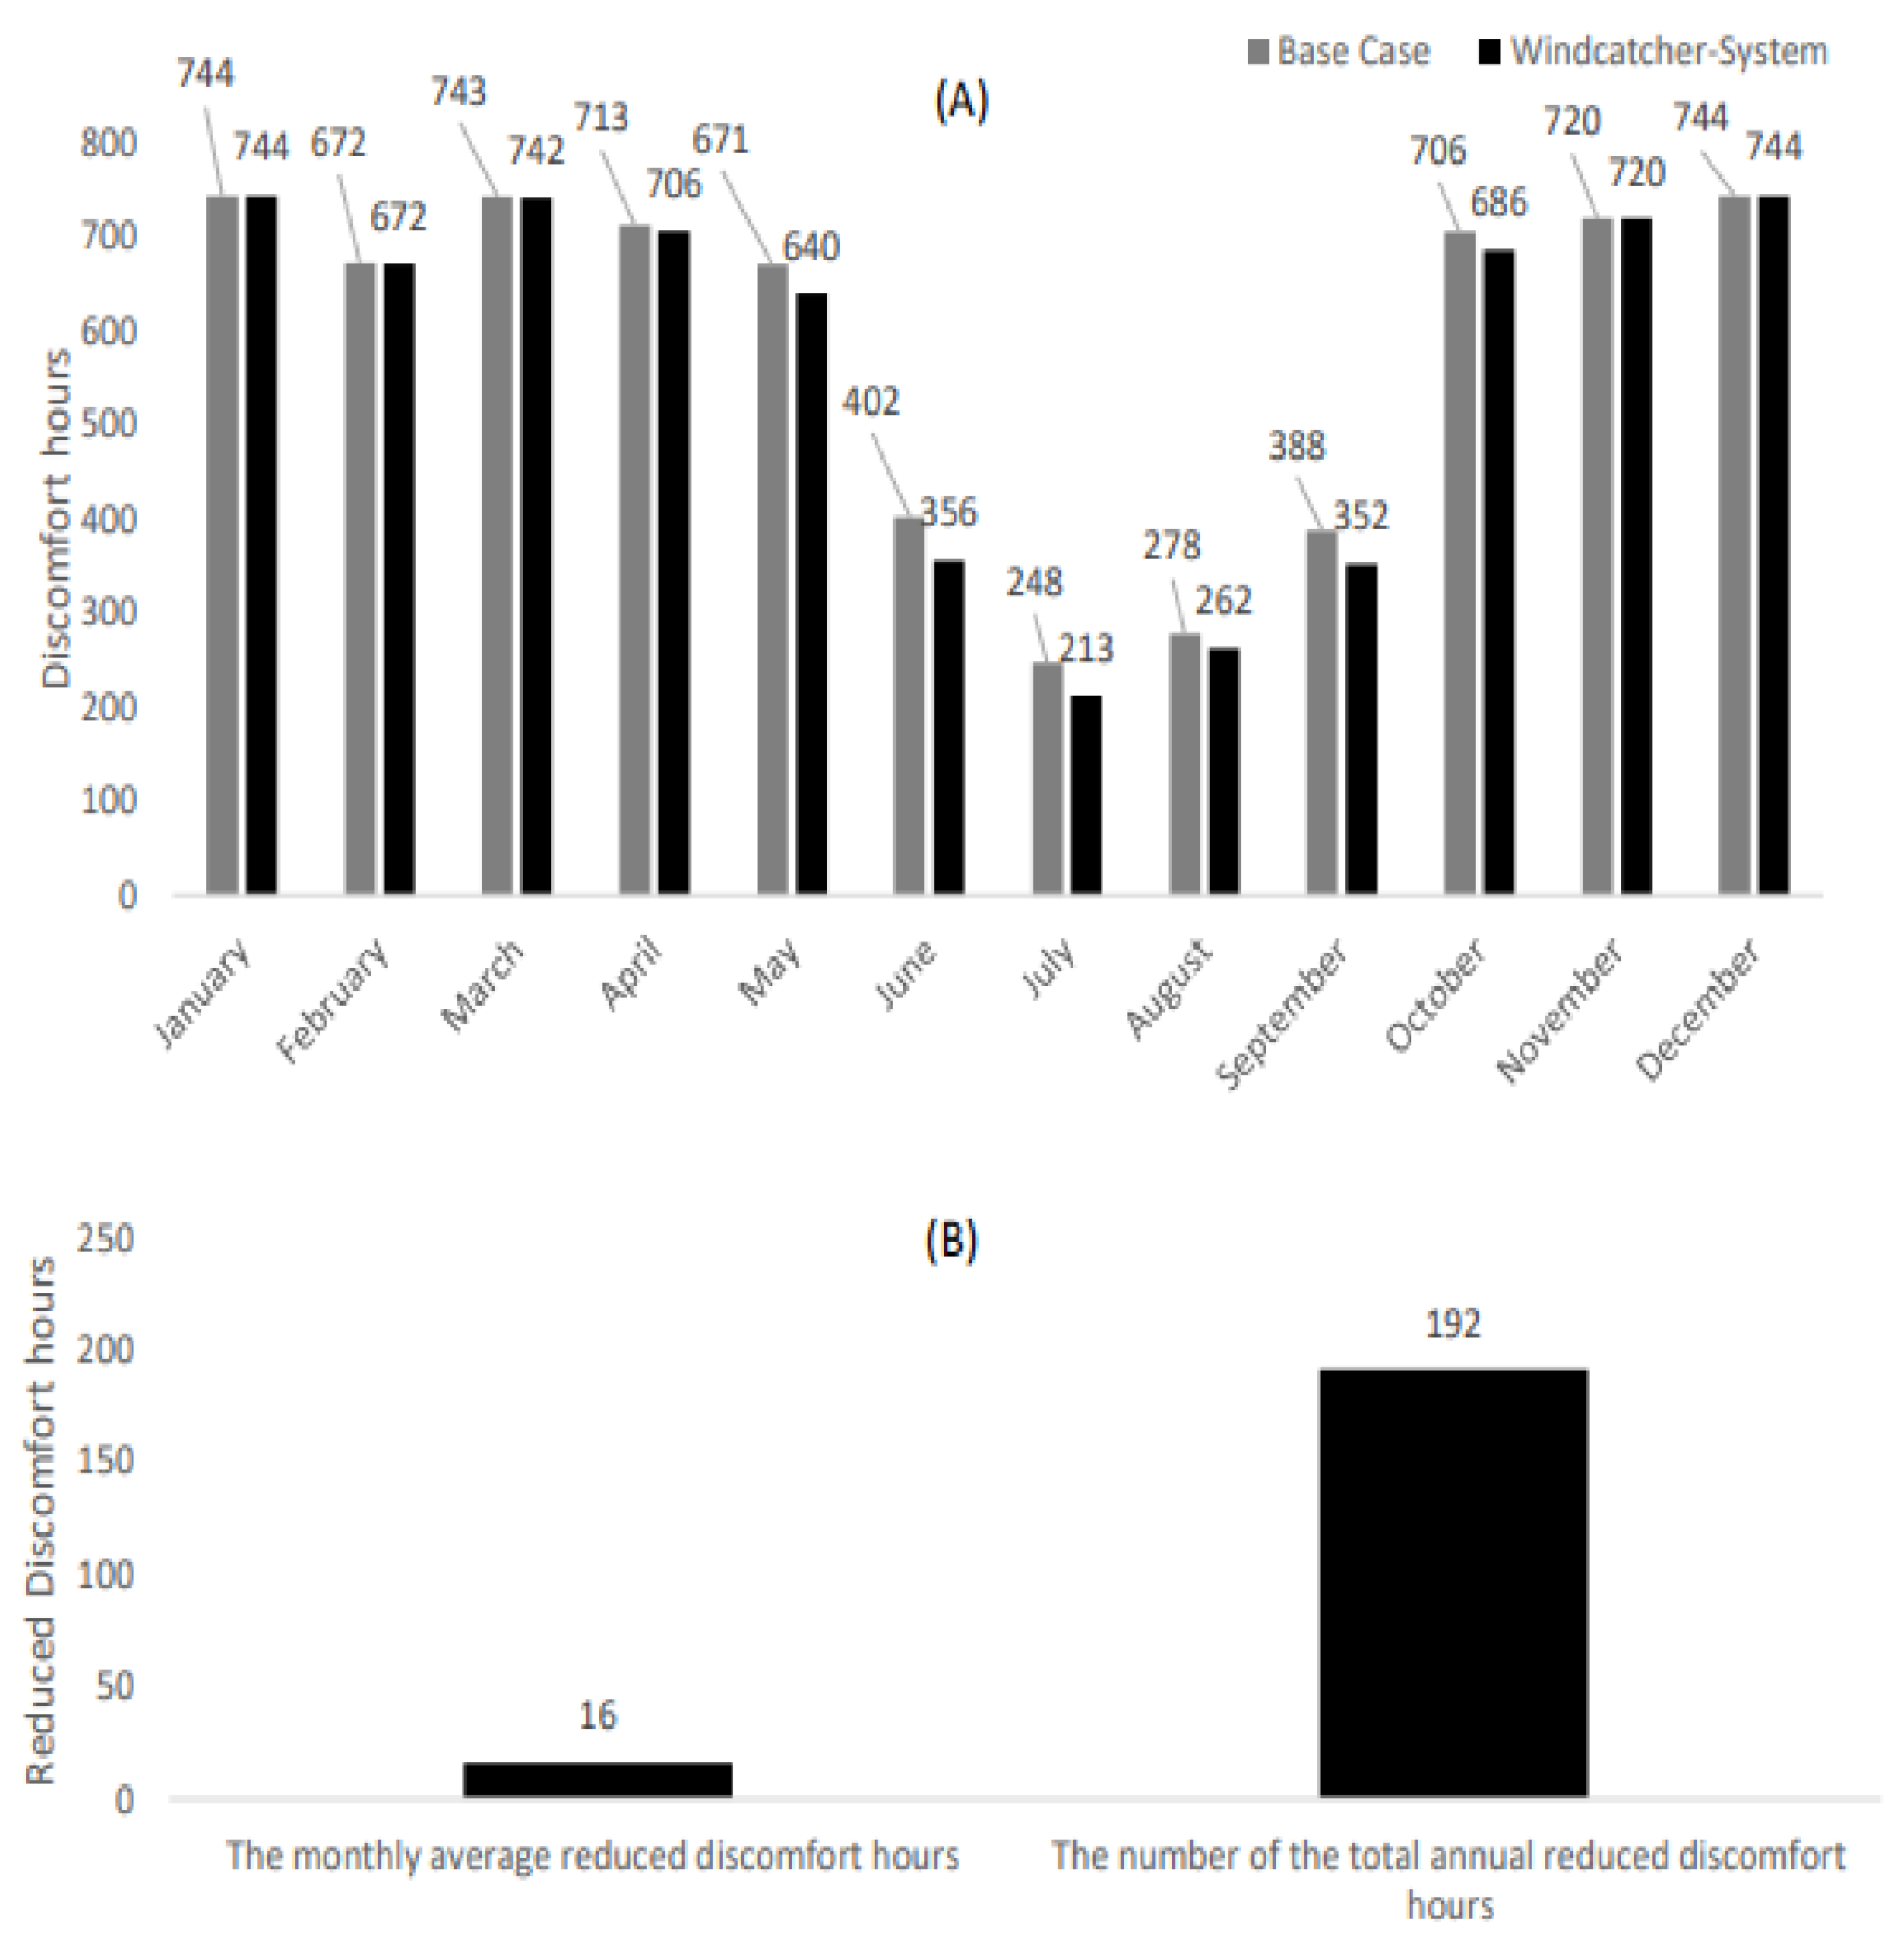
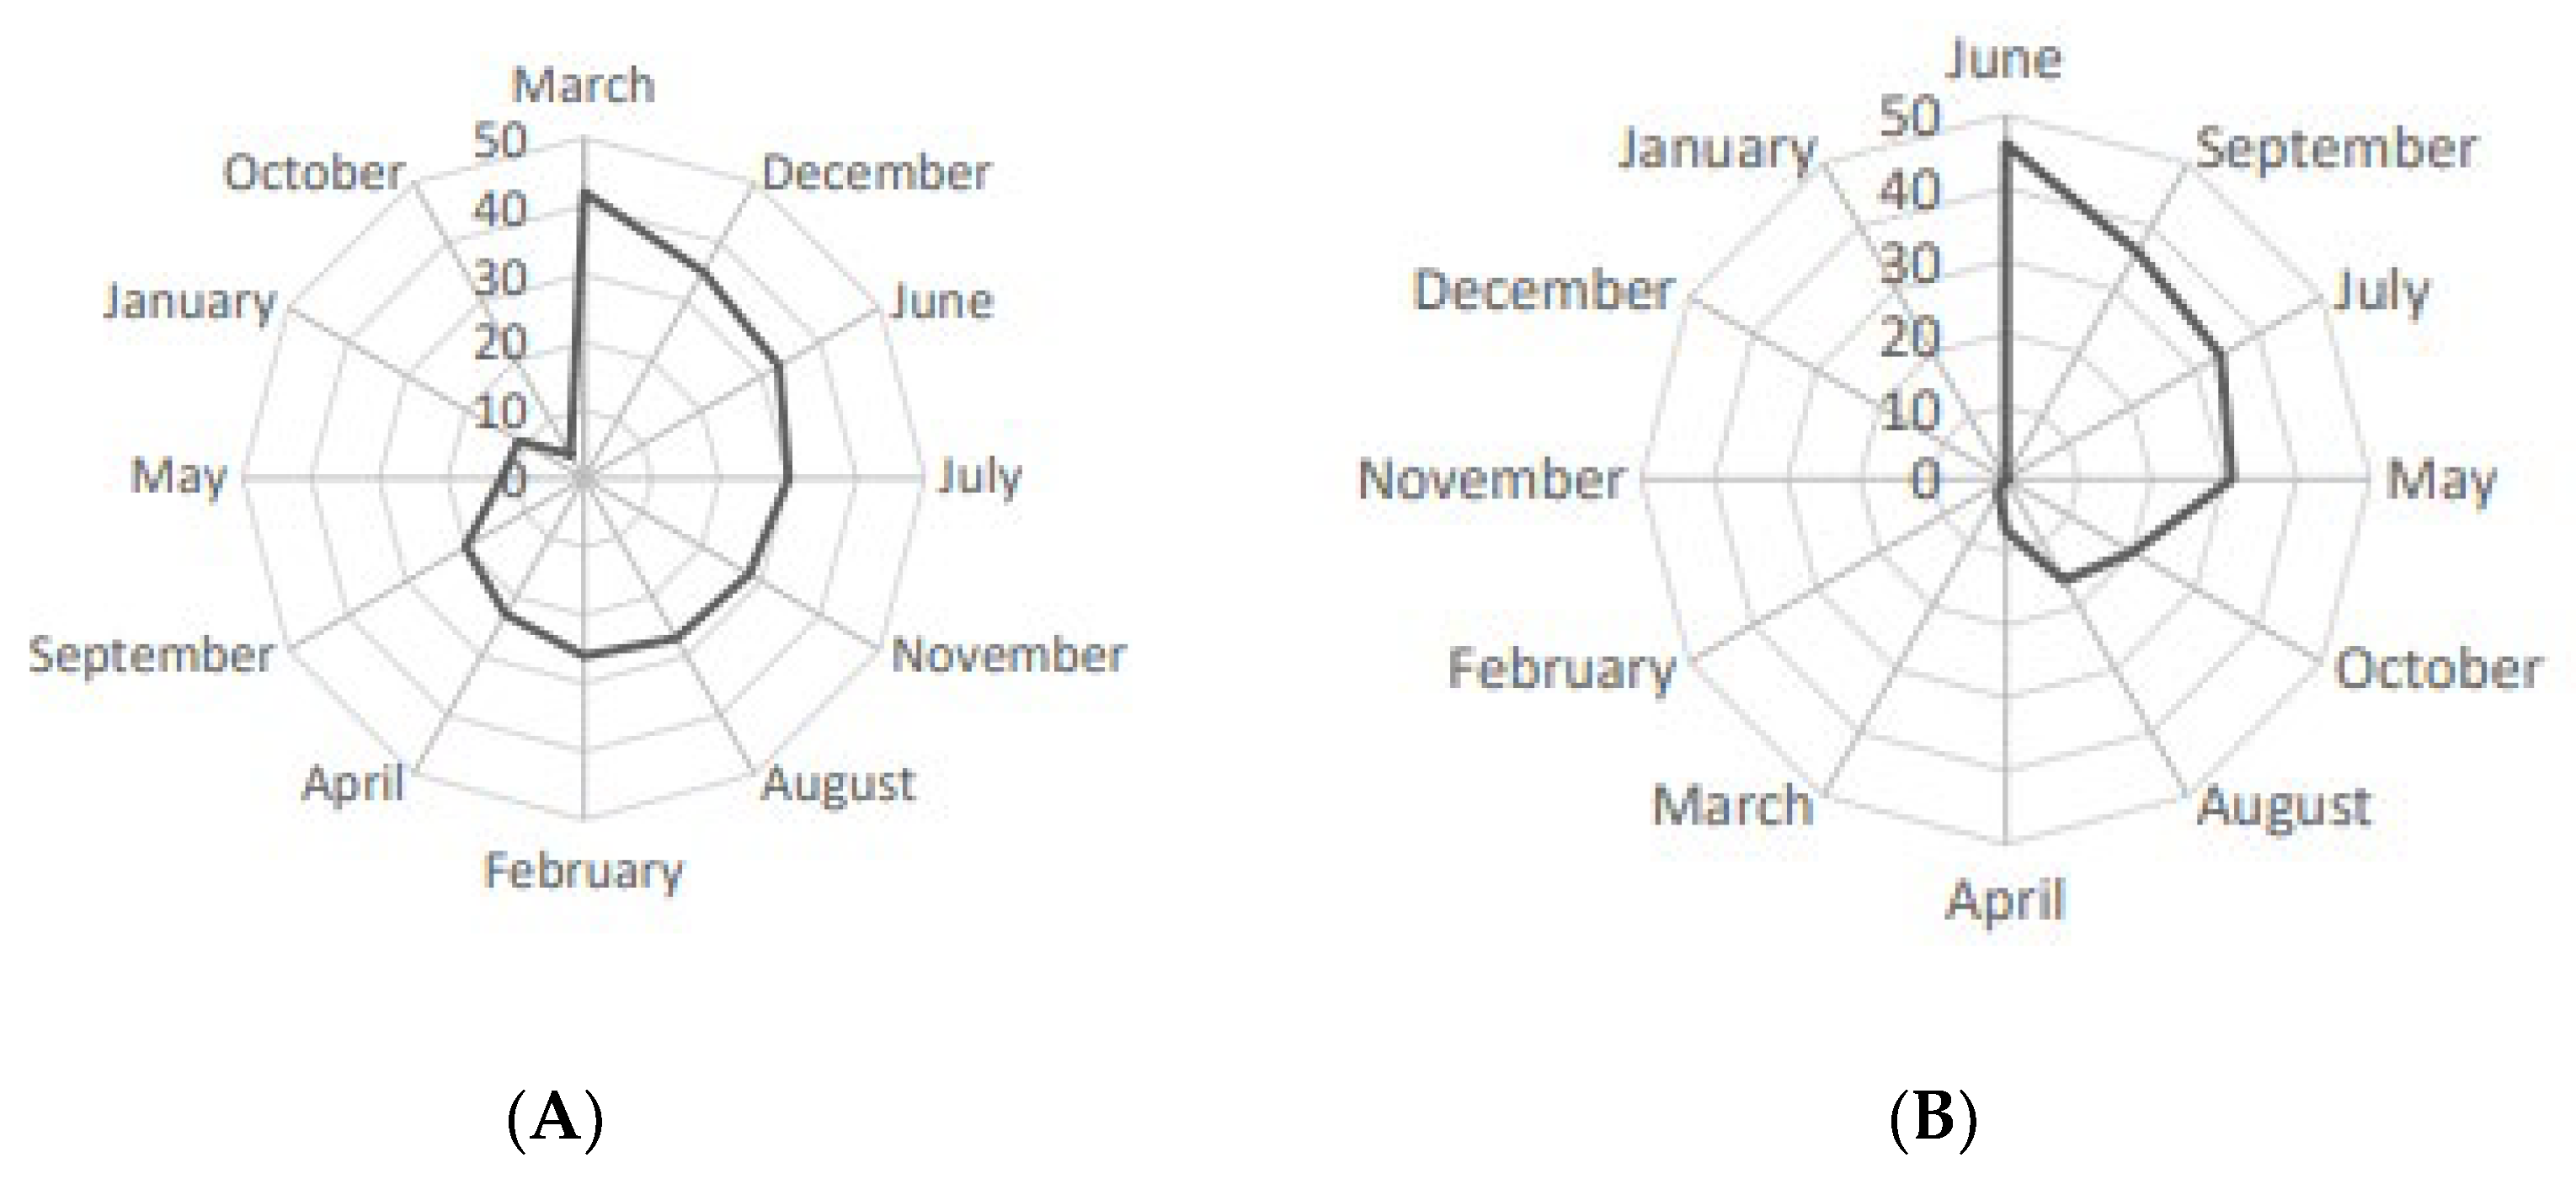
3.3. Thermal Comfort

Figure 9 shows the monthly breakdown of the number of thermal discomfort hours for the entire building for both cases of study (base case and with window-windcatcher) using winter clothes. In general, it can be said that the window-windcatcher has managed to reduce the number of discomfort hours throughout the entire year compared to the base case.
As shown in Figure 9A, using winter clothing, and for the entire building, the highest reduction in thermal discomfort hours is estimated to be in March, with 42 h, compared to the base case. This is followed by December, June, July, November, August, February, April, September, May, and January, respectively. As shown in Figure 9B, with winter clothing, the total annual reduction in thermal discomfort hours is estimated to be 290 h, and the average monthly reduction is approximately 24 h. As shown in Figure 10B, the reduction in thermal discomfort hours using a window-windcatcher is smaller with summer clothing since the total annual reduction is estimated to be 192 h, and the average monthly reduction in discomfort hours approximately 16 h.
With summer clothing, the highest reduction in the discomfort hours is found to be in June, with 46 h of reduced discomfort hours, compared to the base case. This is followed by September, July, May, October, August, April, and March (Figure 11).

4. Discussion

This study examined and tested the effects of fitting window-windcatchers on a typical, multistorey residential building in Jordan, in regards to energy efficiency and thermal comfort. Using Designbuilder, we analysed, for each building unit the monthly energy performance and its annual energy performance, and for the entire building, the monthly energy performance, and the annual energy performance. The entire building’s thermal comfort performance was also studied.
For the monthly energy consumption performance of each unit, the patterns of the cooling energy consumption were observed to follow the natural monthly atmospheric temperature patterns (a spikelike pattern with a peak in July). It was shown that the energy patterns on the east and west units of the building are comparable. We also found that as as a unit’s altitude decreases, the energy consumption also decreases. This may be explained by the insulation effect produced by the upper floors, which serve as an additional layer of insulation, reducing the amount of heat transferred into the building. The window-windcatcher was successful in lowering the cooling energy requirements for all building units. In comparison to the base case (no windcatchers), the average cooling energy consumption of the west side of the fourth, third, second, and first floors decreased by about 47 kWh/month, 49 kWh/month, 48 kWh/month and 61 kWh/month, respectively. Similar reduction rates were found for the units on the east side of the building. In general, even though the cooling energy use decreases with the unit’s altitude, the window-windcatcher’s ability to reduce energy consumption increases as the unit’s altitude decreases.
The window-windcatcher reduces the annual cooling energy consumption by up to 36.4% (east-side unit, first floor) and with a minimum reduction percentage of 18.x%, (west-side unit, fourth floor).
The largest reduction, in the entire building’s monthly energy consumption, E r b —approximately 1170 kWh/month—was observed in July. This was followed by August, June, September, May, October, and April, respectively, with equal to 1028 kWh, 845 kWh, 734 kWh, 307 kWh, 93 kWh, and 45 kWh, respectively.
In July, the window-windcatcher saved 19.9% of the building’s energy use (we found this by estimating the energy use that would have been required to maintain the same temperature). Similarly, the reduction percentage in August, June, September, May, October, and April was 21.0%, 28.6%, 21.6%, 44.3%, 43.1%, and 60.5%, respectively. Since cooling energy is typically, not required during these relatively cool months, the reduction of energy for the remaining months was minimal.
For the entire building’s monthly energy consumption, in July, there was a reduction of about 1170 kWh, compared to the base case (without the window-windcatcher). This was followed by August, June, September, May, October, and April, respectively, with E r b equal to 1028 kWh, 845 kWh, 734 kWh, 307 kWh,93 kWh, and 45 kWh, respectively.
In July, the reduction in the cooling energy using the window-windcatcher was approximately 19.9%. Similarly, in August, June, September, May, October, and April, the reduction percentages were 20.98%, 28.6%, 21.56%, 44.28%, 43.14%, and 60.46%, respectively. The reduction of energy for the remaining months was negligible since cooling is not typically used in these relatively cool months (January, February, March, November, and December).
For the base case, the monthly cooling costs of the entire building in July, August, September, June, May, and October were USD 588, USD 490, USD 340, USD 295.5, USD 69.45, and USD 22, respectively. With the window-windcatchers, the monthly cooling costs of the entire building in July, August, September, June, May, and October were USD 471, USD 387, USD 267, USD 210, USD 38.71, and USD 12, respectively.
For the total annual energy consumption of the entire building ( E t o t , b ) was reduced from 18,143 kWh/year to 13,911 kWh/year, using the window-windcatcher. The corresponding average energy consumption of the entire building ( E ¯ b ) was reduced from 1512 kWh/month to 1159 kWh/month using the window-windcatcher.
Compared to the base case, the total annual cooling cost and the average monthly cooling costs were reduced using the window-windcatcher from USD 1814 to USD 1391 and USD 151 to USD 116, respectively. This corresponds to a 23% cost reduction.
As far as thermal comfort is concerned, in general, we found that the window-windcatcher manage to reduce the number of discomfort hours throughout the entire year. With winter clothing, the total annual reduction in discomfort hours was estimated to be 290 h, and the average monthly reduction in discomfort hours approximately 24 h. The reduction in discomfort hours using a window-windcatcher is less with summer clothing with the total annual reduction in discomfort hours estimated to be 192 h, and the average monthly reduction in discomfort hours approximately 16 h.

5. Conclusions

In [28] Alrebei et al. have demonstrated the effectiveness of a window-windcatcher, as a passive ventilation technique, in capturing the prevailing wind and redirecting it into indoor spaces. For the novel windcatcher proposed in [28] it was shown, using CFD, that it increased the actual-to-required ventilation ratio by 9%, which is above the requirement by ASHRAE [REF]. However, the impact of window-windcatchers on energy performance, energy costs, and thermal comfort, however, was not researched previously. Therefore, using a DesignBuilder model, the study here investigated and tested the application of window-windcatchers (as a passive ventilation technique) on a typical multistorey, residential building. The DesignBuilder model was validated with data collected inside the building. It was found that the window-windcatchers, applied to all units of the building, reduced the building’s overall annual energy consumption from 18,143 kWh to 13,911 kWh, a reduction of approximately 23.3%. The window-windcatcher resulted in an associated reduction in total and average monthly cooling costs from USD 1814 to USD 1391 and from USD 151 to USD 116, respectively. The estimated total annual reduction in thermal discomfort hours was 290 h, and the estimated average monthly reduction in thermal discomfort hours was, correspondingly, approximately 24 h. Future studies could analyze the impact on the indoor air temperature of the different building units, in addition to the ventilation rate. In addition, the effect of the various surrounding elements, such as neighboring buildings and other issues, could be studied for more detailed results.

Author Contributions

Conceptualization, S.N.M., O.F.A., L.M.O., T.A.-R. and A.I.A.; methodology, S.N.M., O.F.A., L.M.O., T.A.-R. and A.I.A.; software, S.N.M., O.F.A., L.M.O., T.A.-R. and A.I.A.; validation, S.N.M., O.F.A., L.M.O., T.A.-R. and A.I.A.; formal analysis, S.N.M., O.F.A., L.M.O., T.A.-R. and A.I.A.; investigation, S.N.M., O.F.A., L.M.O., T.A.-R. and A.I.A.; resources, S.N.M., O.F.A., L.M.O., T.A.-R. and A.I.A.; data curation, S.N.M., O.F.A., L.M.O., T.A.-R. and A.I.A.; writing—original draft preparation, S.N.M., O.F.A., L.M.O., T.A.-R. and A.I.A.; writing—review and editing S.N.M., O.F.A., L.M.O., T.A.-R., K.K. and A.I.A.; visualization, S.N.M., O.F.A., L.M.O., T.A.-R., K.K. and A.I.A.; supervision, S.N.M., O.F.A., L.M.O., T.A.-R. and A.I.A.; project administration, S.N.M., O.F.A., L.M.O., T.A.-R. and A.I.A.; funding acquisition, S.N.M., O.F.A., L.M.O., T.A.-R. and A.I.A. All authors have read and agreed to the published version of the manuscript.

Funding

This publication was made possible by NPRP 13 Grant No. NPRP13S-0203-200243 from the Qatar National Research Fund (a member of the Qatar Foundation). The findings herein reflect the work and are solely the responsibility of the authors.

Institutional Review Board Statement

Not applicable.

Informed Consent Statement

Not applicable.

Data Availability Statement

Not applicable.

Conflicts of Interest

The authors declare no conflict of interest.

Nomenclature

E i The monthly cooling energy consumption for the unit i   [kWh/month]
E ¯ i The average monthly cooling energy consumption for the unit i   [kWh/month]
E t o t , i The annual total cooling energy consumption for the unit i [kWh/year]
E r , i The energy reduction due to the window-windcatcher compared to the base case for the unit i [kWh/month]
E b The monthly cooling energy consumption for the entire building [kWh/month]
E ¯ b The average monthly cooling energy consumption for the entire building [kWh/month]
E r b The monthly energy reduction due to the window-windcatcher compared to the base case for the entire building [kWh/month]
E t o t , b The annual total cooling energy consumption for the unit i [kWh/year]
σ E , i The standard deviation of the monthly cooling energy consumption from the average monthly cooling energy consumption for the unit i [kWh/month]
σ E b The standard deviation of the monthly cooling energy consumption from the average monthly cooling energy consumption for the entire building [kWh/month]

References

  1. Lim, T.; Yim, W.S.; Kim, D.D. Evaluation of Daylight and Cooling Performance of Shading Devices in Residential Buildings in South Korea. Energies 2020, 13, 4749. [Google Scholar] [CrossRef]
  2. El-Darwish, I.; Gomaa, M. Retrofitting strategy for building envelopes to achieve energy efficiency. Alex. Eng. J. 2017, 56, 579–589. [Google Scholar] [CrossRef] [Green Version]
  3. Balaban, O.; Puppim de Oliveira, J.A. Sustainable buildings for healthier cities: Assessing the co-benefits of green buildings in Japan. J. Clean. Prod. 2017, 163, S68–S78. [Google Scholar] [CrossRef]
  4. Cruz, C.O.; Gaspar, P.; de Brito, J. On the concept of sustainable sustainability: An application to the Portuguese construction sector. J. Build. Eng. 2019, 25, 100836. [Google Scholar] [CrossRef]
  5. Granadeiro, V.; Duarte, J.P.; Correia, J.R.; Leal, V.M. Building envelope shape design in early stages of the design process: Integrating architectural design systems and energy simulation. Autom. Constr. 2013, 32, 196–209. [Google Scholar] [CrossRef]
  6. Méndez Echenagucia, T.; Capozzoli, A.; Cascone, Y.; Sassone, M. The early design stage of a building envelope: Multi-objective search through heating, cooling, and lighting energy performance analysis. Appl. Energy 2015, 154, 577–591. [Google Scholar] [CrossRef]
  7. Werner, S. European space cooling demands. Energy 2016, 110, 148–156. [Google Scholar] [CrossRef]
  8. Davies, M.; Oreszczyn, T. The unintended consequences of decarbonizing the built environment: A UK case study. Energy Build. 2012, 46, 80–85. [Google Scholar] [CrossRef] [Green Version]
  9. Dowd, R.M.; Mourshed, M. Low carbon Buildings: Sensitivity of Thermal Properties of Opaque Envelope Construction and Glazing. Energy Procedia 2015, 75, 1284–1289. [Google Scholar] [CrossRef] [Green Version]
  10. Košir, M.; Gostiša, T.; Kristl, Ž. Influence of architectural building envelope characteristics on energy performance in Central European climatic conditions. J. Build. Eng. 2018, 15, 278–288. [Google Scholar] [CrossRef]
  11. Gui, X.-C.; Ma, Y.T.; Chen, S.Q.; Ge, J. The methodology of standard building selection for residential buildings in hot summer and cold winter zone of China based on architectural typology. J. Build. Eng. 2018, 18, 352–359. [Google Scholar] [CrossRef]
  12. Su, B. The impact of passive design factors on house energy efficiency. Archit. Sci. Rev. 2011, 54, 270–276. [Google Scholar] [CrossRef]
  13. Wei, Y.; Ding, W. Building façade opening evaluation using integrated energy simulation and automatic generation programs. Archit. Sci. Rev. 2015, 58, 205–220. [Google Scholar]
  14. De Dear, R.J.; Leow, K.G.; Foo, S.C. Thermal comfort in the humid tropics: Field experiments in air conditioned and naturally ventilated buildings in Singapore. Int. J. Biometeorol. 1991, 34, 259–265. [Google Scholar] [CrossRef]
  15. Mohamad, A.; Becerik-Gerber, B.; Hoque, S.; O’Neill, Z.; Pedrielli, G.; Wen, J.; Wu, T. Ten questions concerning occupant health in buildings during normal operations and extreme events including the COVID-19 pandemic. Build. Environ. 2021, 188, 107480. [Google Scholar] [CrossRef]
  16. Gonçalo, M.; Ferreira, C.R.; Pitarma, R. Indoor Air Quality Assessment Using a CO2 Monitoring System Based on Internet of Things. J. Med. Syst. 2019, 43, 67. [Google Scholar] [CrossRef]
  17. Kaminska, A. Impact of Building Orientation on Daylight Availability and Energy Savings Potential in an Academic Classroom. Energies 2020, 13, 4916. [Google Scholar] [CrossRef]
  18. Jomehzadeh, F.; Nejat, P.; Calautit, J.K.; Yusof, M.B.M.; Zaki, S.A.; Hughes, B.R.; Yazid, M.N.A.W.M. A review on windcatcher for passive cooling and natural ventilation in buildings, Part 1: Indoor air quality and thermal comfort assessment. Renew. Sustain. Energy Rev. 2017, 70, 736–756. [Google Scholar] [CrossRef]
  19. Chen, W.-H.; You, F. Sustainable building climate control with renewable energy sources using nonlinear model predictive control. Renew. Sustain. Energy Rev. 2022, 168, 112830. [Google Scholar] [CrossRef]
  20. Rao, N.D.; Wilson, C. Advancing energy and well-being research. Nat. Sustain. 2022, 5, 98–103. [Google Scholar] [CrossRef]
  21. Chenari, B.; Carrilho, J.D.; da Silva, M.G. Towards sustainable, energy-efficient and healthy ventilation strategies in buildings: A review. Renew. Sustain. Energy Rev. 2016, 59, 1426–1447. [Google Scholar] [CrossRef]
  22. Ma’bdeh, S.N.; Al-Zghoul, A.; Alradaideh, T.; Bataineh, A.; Ahmad, S. Simulation study for natural ventilation retrofitting techniques in educational classrooms—A case study. Heliyon 2020, 6, e05171. [Google Scholar] [CrossRef]
  23. Qabbal, L.; Younsi, Z.; Naji, H. An indoor air quality and thermal comfort appraisal in a retrofitted university building via low-cost smart sensor. Indoor Built Environ. 2022, 31, 586–606. [Google Scholar] [CrossRef]
  24. Zhang, H.; Yang, D.; Tam, V.W.; Tao, Y.; Zhang, G.; Setunge, S.; Shi, L. A critical review of combined natural ventilation techniques in sustainable buildings. Renew. Sustain. Energy Rev. 2021, 141, 110795. [Google Scholar] [CrossRef]
  25. Ahmed, T.; Kumar, P.; Mottet, L. Natural ventilation in warm climates: The challenges of thermal comfort, heatwave resilience and indoor air quality. Renew. Sustain. Energy Rev. 2021, 138, 110669. [Google Scholar] [CrossRef]
  26. Al-Hemiddi, N.A.; Megren Al-Saud, K.A. The effect of a ventilated interior courtyard on the thermal performance of a house in a hot–arid region. Renew. Energy 2001, 24, 581–595. [Google Scholar] [CrossRef]
  27. Reyes, V.A.; Moya, S.L.; Morales, J.M.; Sierra-Espinosa, F.Z. A study of air flow and heat transfer in building-wind tower passive cooling systems applied to arid and semi-arid regions of Mexico. Energy Build. 2013, 66, 211–221. [Google Scholar] [CrossRef]
  28. Fawwaz Alrebei, O.; Obeidat, L.M.; Ma’bdeh, S.N.; Kaouri, K.; Al-Radaideh, T.; Amhamed, A.I. Window-Windcatcher for Enhanced Thermal Comfort, Natural Ventilation and Reduced COVID-19 Transmission. Buildings 2022, 12, 791. [Google Scholar] [CrossRef]
  29. De la Torre, S.; Yousif, C. Evaluation of chimney stack effect in a new brewery using DesignBuilder-EnergyPlus software. Energy Procedia 2014, 62, 230–235. [Google Scholar] [CrossRef] [Green Version]
  30. Taleb, H.M.; Sharples, S. Developing sustainable residential buildings in Saudi Arabia: A case study. Appl. Energy 2011, 88, 383–391. [Google Scholar] [CrossRef]
  31. Baharvand, M.; Hamdan, A.; Abdul, M. DesignBuilder verification and validation for indoor natural ventilation. J. Basic Appl. Sci. Res. JBASR 2013, 3, 8. [Google Scholar]
  32. Bangalee, M.Z.I.; Miau, J.J.; Lin, S.Y. Computational techniques and a numerical study of a buoyancy-driven ventilation system. Int. J. Heat Mass Transf. 2013, 65, 572–583. [Google Scholar] [CrossRef]
  33. Mabdeh, S.; Ahmad, S.; Alradaideh, T.; Bataineh, A. Low-cost ventilation strategies to improve the indoor environmental quality by enhancing the natural ventilation in multistory residential buildings. Period. Eng. Nat. Sci. PEN 2020, 8, 2045–2067. [Google Scholar]
  34. Fawwaz, A.O.; Obeidat, B.; Abdallah, I.A.; Darwish, E.F.; Amhamed, A. Airflow dynamics in an emergency department: A CFD simulation study to analyse COVID-19 dispersion. Alex. Eng. J. 2022, 61, 3435–3445. [Google Scholar] [CrossRef]
  35. Bushra, O.; Alrebei, O.F.; Abdallah, I.A.; Darwish, E.F.; Amhamed, A. CFD Analyses: The Effect of Pressure Suction and Airflow Velocity on Coronavirus Dispersal. Appl. Sci. 2021, 11, 7450. [Google Scholar]
  36. Erdem, C.; Sher, F.; Sadiq, H.; Cuce, P.M.; Guclu, T.; Besir, A.B. Sustainable ventilation strategies in buildings: CFD research. Sustain. Energy Technol. Assess. 2019, 36, 100540. [Google Scholar]
  37. Giannissi, S.G.; Hoyes, J.R.; Chernyavskiy, B.; Hooker, P.; Hall, J.; Venetsanos, A.G.; Molkov, V. CFD benchmark on hydrogen release and dispersion in a ventilated enclosure: Passive ventilation and the role of an external wind. Int. J. Hydrogen Energy 2015, 40, 6465–6477. [Google Scholar] [CrossRef]
  38. Guo, W.; Liang, S.; He, Y.; Li, W.; Xiong, B.; Wen, H. Combining EnergyPlus and CFD to predict and optimize the passive ventilation mode of medium-sized gymnasium in subtropical regions. Build. Environ. 2022, 207, 108420. [Google Scholar] [CrossRef]
  39. Calautit, J.K.; O’Connor, D.; Tien, P.W.; Wei, S.; Pantua, C.A.J.; Hughes, B. Development of a natural ventilation windcatcher with passive heat recovery wheel for mild-cold climates: CFD and experimental analysis. Renew. Energy 2020, 160, 465–482. [Google Scholar] [CrossRef]
  40. O’Connor, D.; Calautit, J.K.S.; Hughes, B.R. A review of heat recovery technology for passive ventilation applications. Renew. Sustain. Energy Rev. 2016, 54, 1481–1493. [Google Scholar] [CrossRef]
  41. Lechowska, A.; Szczepanik-Ścisło, N.; Schnotale, J.; Stelmach, M.; Pyszczek, T. CFD modelling of transient thermal performance of solar chimney used for passive ventilation in a building. In IOP Conference Series: Materials Science and Engineering; IOP Publishing: Bristol, UK, 2018; Volume 415, p. 012049. [Google Scholar]
  42. Flaga-Maryanczyk, A.; Schnotale, J.; Radon, L.; Was, K. Experimental measurements and CFD simulation of a ground source heat exchanger operating at a cold climate for a passive house ventilation system. Energy Build. 2014, 68, 562–570. [Google Scholar] [CrossRef]
  43. Luo, Z.; Li, Y. Passive urban ventilation by combined buoyancy-driven slope flow and wall flow: Parametric CFD studies on idealized city models. Atmos. Environ. 2011, 45, 5946–5956. [Google Scholar] [CrossRef]
Figure 1. Window-windcatcher details. From the left: top-down plan, interior view, and external view of the system.
Buildings 13 00086 g001
Figure 2. Case study-floor plan.
Buildings 13 00086 g002
Figure 3. Operation schedule of the case study unit.
Buildings 13 00086 g003
Figure 4. The monthly breakdown of the cooling energy consumption for each unit in the building. The west-side units on the 4th, 3rd, 2nd, and 1st floors are labeled (A,C,E) and (G), respectively. The east-side units on the 4th, 3rd, 2nd, and 1st floors are labeled (B,D,F) and (H), respectively.
Buildings 13 00086 g004
Figure 5. The annual total and average energy consumption for each unit in the building. The west-side units on the 4th, 3rd, 2nd, and 1st floors are labeled (A,C,E) and (G), respectively. The east-side units on the 4th, 3rd, 2nd, and 1st floors are labeled (B,D,F) and (H), respectively.
Buildings 13 00086 g005
Figure 6. (A) The monthly cooling energy consumption and the average monthly energy consumption of the entire building ( E b and E ¯ b ); (B) the monthly reduction in energy use using the window-windcatcher compared to the base case (no window-windcatcher) for the entire building ( E r b ); (C) the reduced cooling energy percentage using the window-windcatcher compared to the base case.
Buildings 13 00086 g006
Figure 7. (A) The annual total and average energy consumption of the entire building ( E t o t , b , E ¯ b ); (B) the percentage of cooling energy consumption for each unit with respect to the entire building.
Buildings 13 00086 g007
Figure 8. (A) The monthly cooling costs of the entire building; (B) the total annual cooling cost and the average monthly cooling cost of the entire building; (C) the percentage of cost reduction using the window-windcatcher compared to the base case.
Buildings 13 00086 g008
Figure 9. Using winter clothing: (A) the monthly breakdown of thermal discomfort hours; (B) the total annual and monthly average reduction in discomfort hours, for the entire building.
Buildings 13 00086 g009
Figure 10. Using summer clothing: (A) the monthly breakdown of the number of thermal discomfort hours; (B) the total annual and monthly average number of reduced discomfort hours, for the entire building.
Buildings 13 00086 g010
Figure 11. The number of reduced thermal discomfort hours, with the window-windcatcher, for: (A) winter clothing; and (B) summer clothing.
Buildings 13 00086 g011
Table 1. This specification of the construction materials of typical residential buildings.
ElementMaterialThickness (cm)U Value (W/m2 K)
External wallsStone50.79
Concrete10
Insulation3
Concrete Block10
Plaster2
Internal partitionsPlaster21.90
Concrete Block10
Plaster2
Internal FloorCeiling Tiles0.31.20
Mortar3
Sand7
Water insulation0.5
Reinforced Concrete25
Plaster2
RoofGravel31.30
Inclined Concrete5
Water insulation0.5
Reinforced Concrete20
Plaster2
WindowsAluminum Frame with a single glazing system0.65.70
Table 2. Input data for the modelling software.
ParameterValueType of Value
Family Size6 membersConstant
Metabolic rate0.8 metAverage
Summer clothing0.5 cloConstant
Infiltration Rate0.26 achConstant
Occupants80 W/personConstant based on operation schedule
Lighting5 W/m2Constant based on operation schedule
Appliances10 W/m2Constant based on operation schedule
Winter Clothing1.0 cloConstant
Disclaimer/Publisher’s Note: The statements, opinions and data contained in all publications are solely those of the individual author(s) and contributor(s) and not of MDPI and/or the editor(s). MDPI and/or the editor(s) disclaim responsibility for any injury to people or property resulting from any ideas, methods, instructions or products referred to in the content.

