
Summary of Data Farming

1
Blue Canopy Group, 11091 Sunset Hills Road, Suite 777, Reston, VA 20190, USA
2
Airbus Defence and Space, Claude-Dornier-Str., Immenstaad 88090, Germany
*
Author to whom correspondence should be addressed.
†
These authors contributed equally to this work.
Axioms 2016, 5(1), 8; https://doi.org/10.3390/axioms5010008
Submission received: 7 January 2016
/
Revised: 9 February 2016
/
Accepted: 15 February 2016
/
Published: 1 March 2016
(This article belongs to the Special Issue Data Farming: Mathematical Foundations and Applications)
Abstract
:Data Farming is a process that has been developed to support decision-makers by answering questions that are not currently addressed. Data farming uses an inter-disciplinary approach that includes modeling and simulation, high performance computing, and statistical analysis to examine questions of interest with a large number of alternatives. Data farming allows for the examination of uncertain events with numerous possible outcomes and provides the capability of executing enough experiments so that both overall and unexpected results may be captured and examined for insights. Harnessing the power of data farming to apply it to our questions is essential to providing support not currently available to decision-makers. This support is critically needed in answering questions inherent in the scenarios we expect to confront in the future as the challenges our forces face become more complex and uncertain. This article was created on the basis of work conducted by Task Group MSG-088 “Data Farming in Support of NATO”, which is being applied in MSG-124 “Developing Actionable Data Farming Decision Support for NATO” of the Science and Technology Organization, North Atlantic Treaty Organization (STO NATO).
1. State of the Art in Data Farming
Data Farming is a process that has been developed to support decision-makers by answering questions that are not currently addressed. Data farming uses an inter-disciplinary approach that includes modeling and simulation, high performance computing, and statistical analysis to examine questions of interest with large number of alternatives. Data farming allows for the examination of uncertain events with numerous possible outcomes and provides the capability of executing enough experiments so that both overall and unexpected results may be captured and examined for insights.
In 2010, the NATO Research and Technology Organization started the three-year Modeling and Simulation Task Group “Data Farming in Support of NATO” to assess and document the data farming methodology to be used for decision support. This article relies heavily on the results of this task group, designated MSG-088. It includes a summary of the six realms of data farming and the two case studies performed during the course of MSG-088.
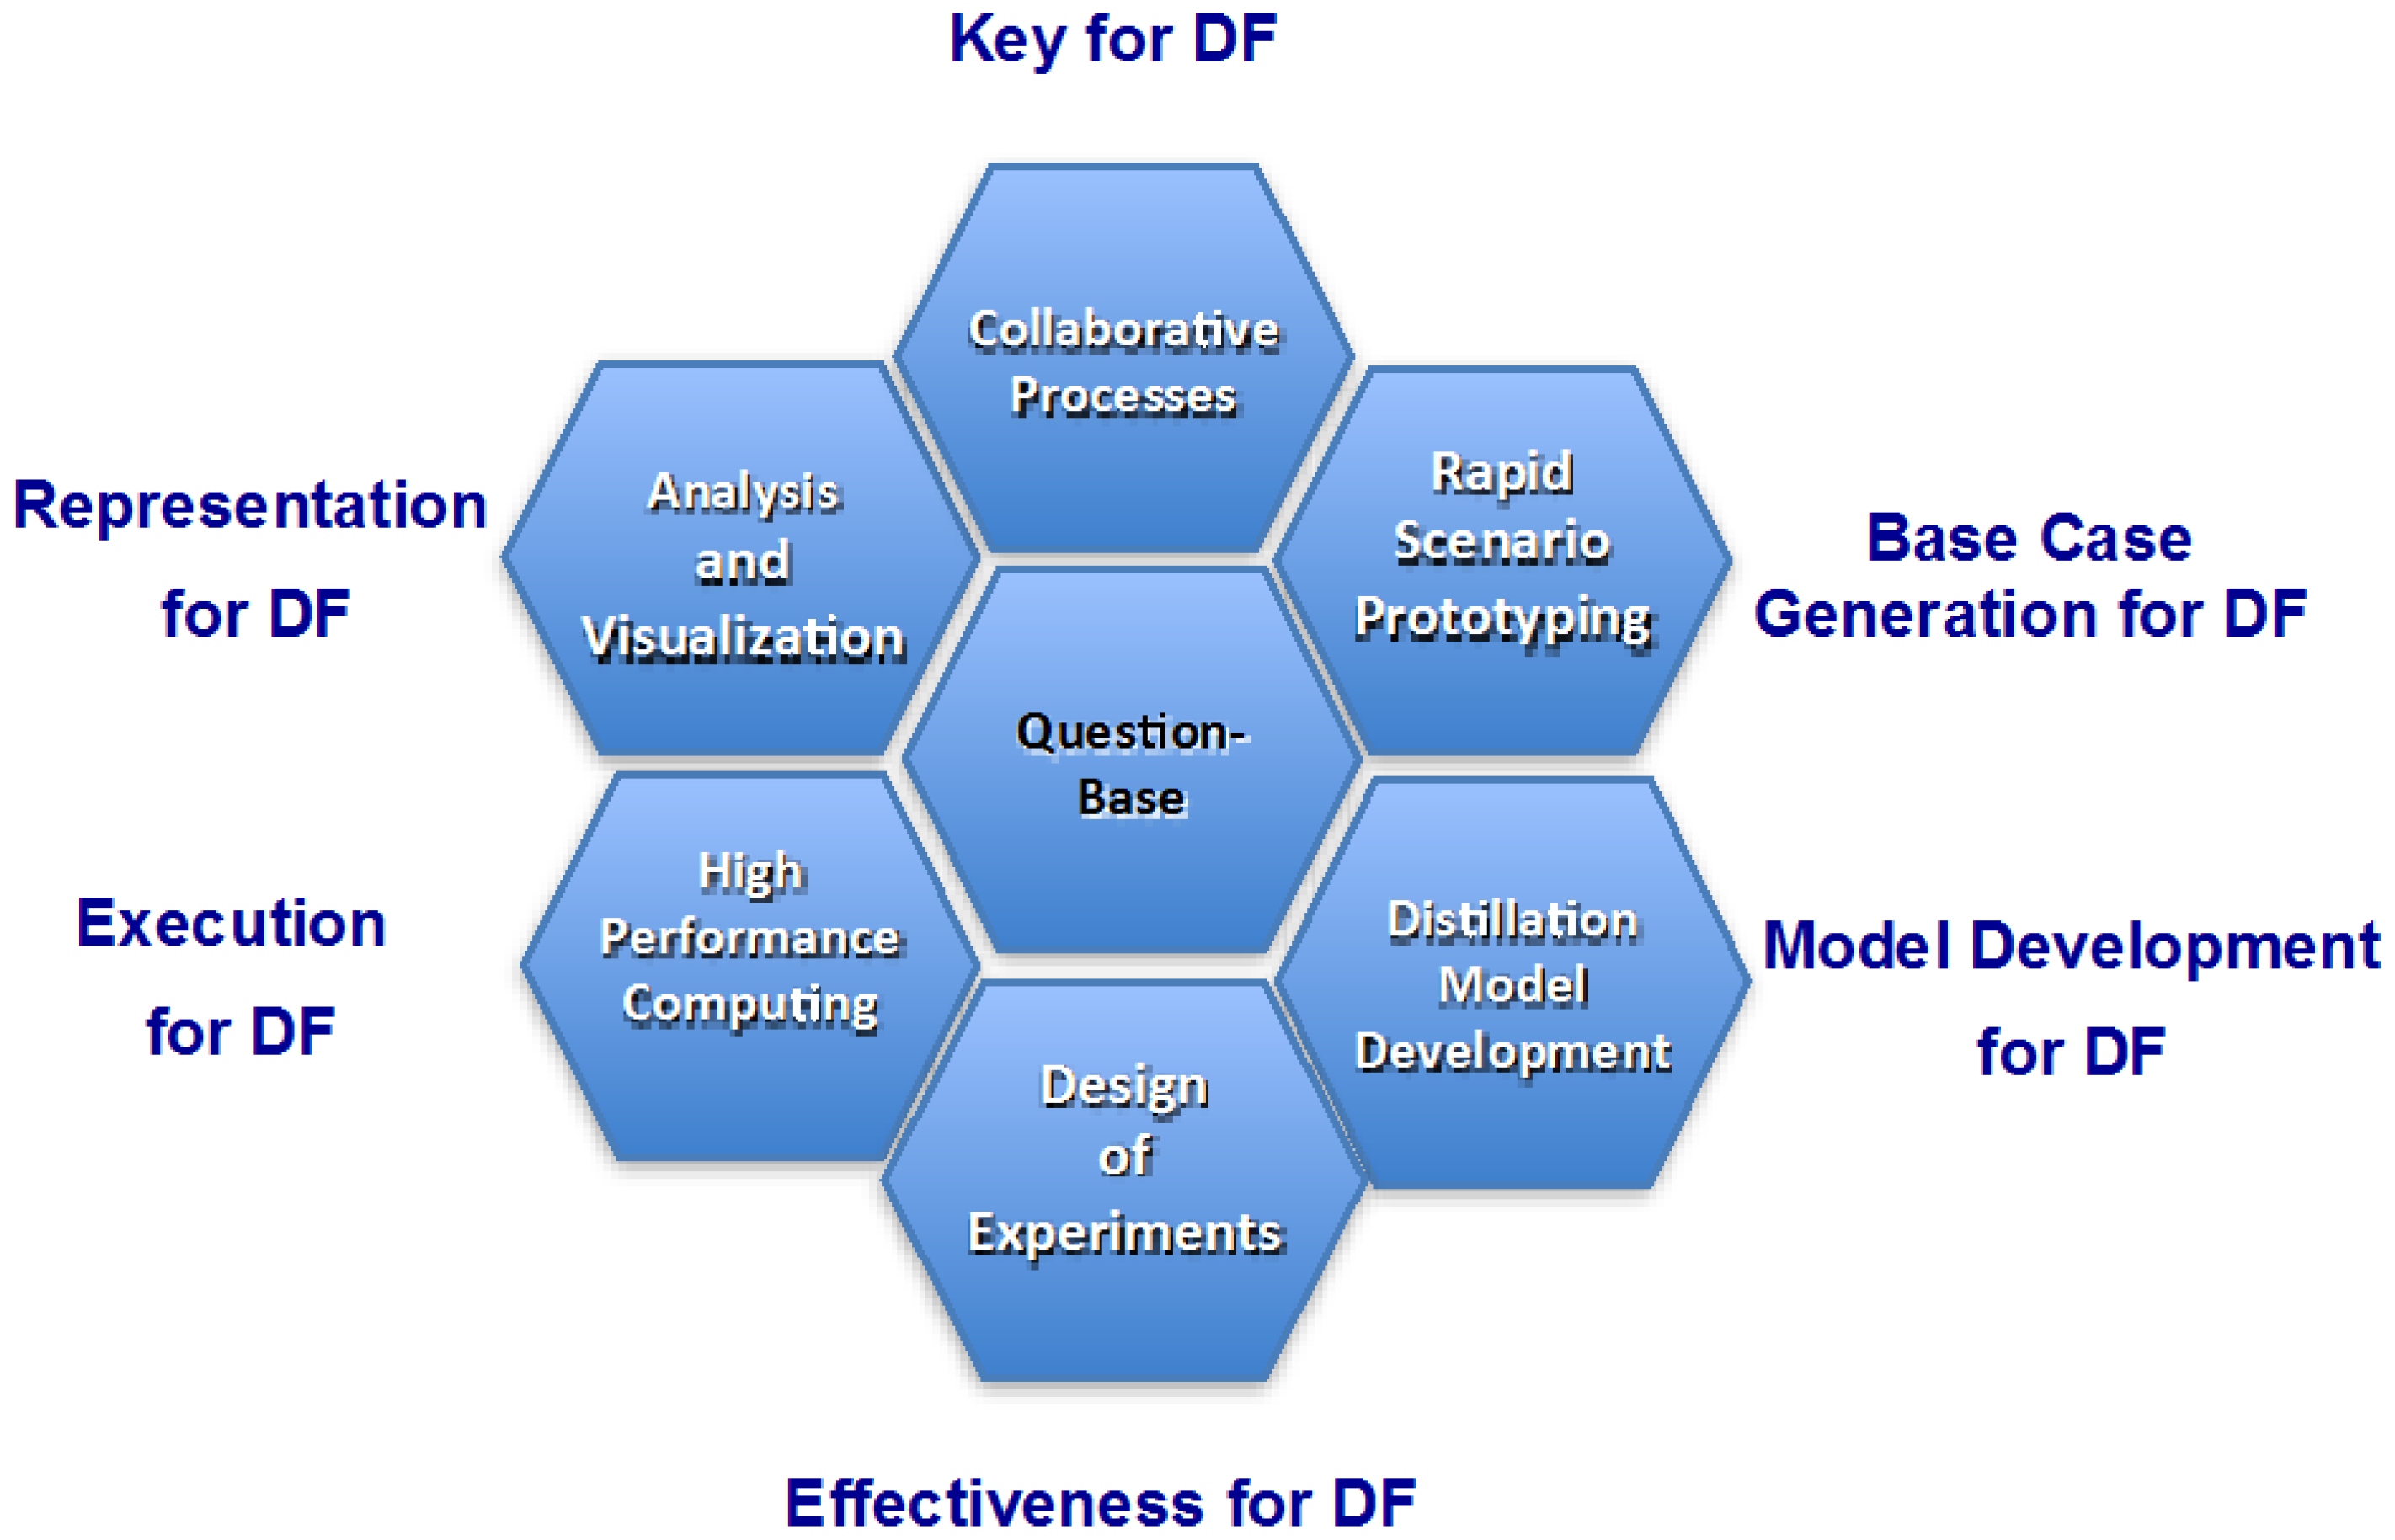
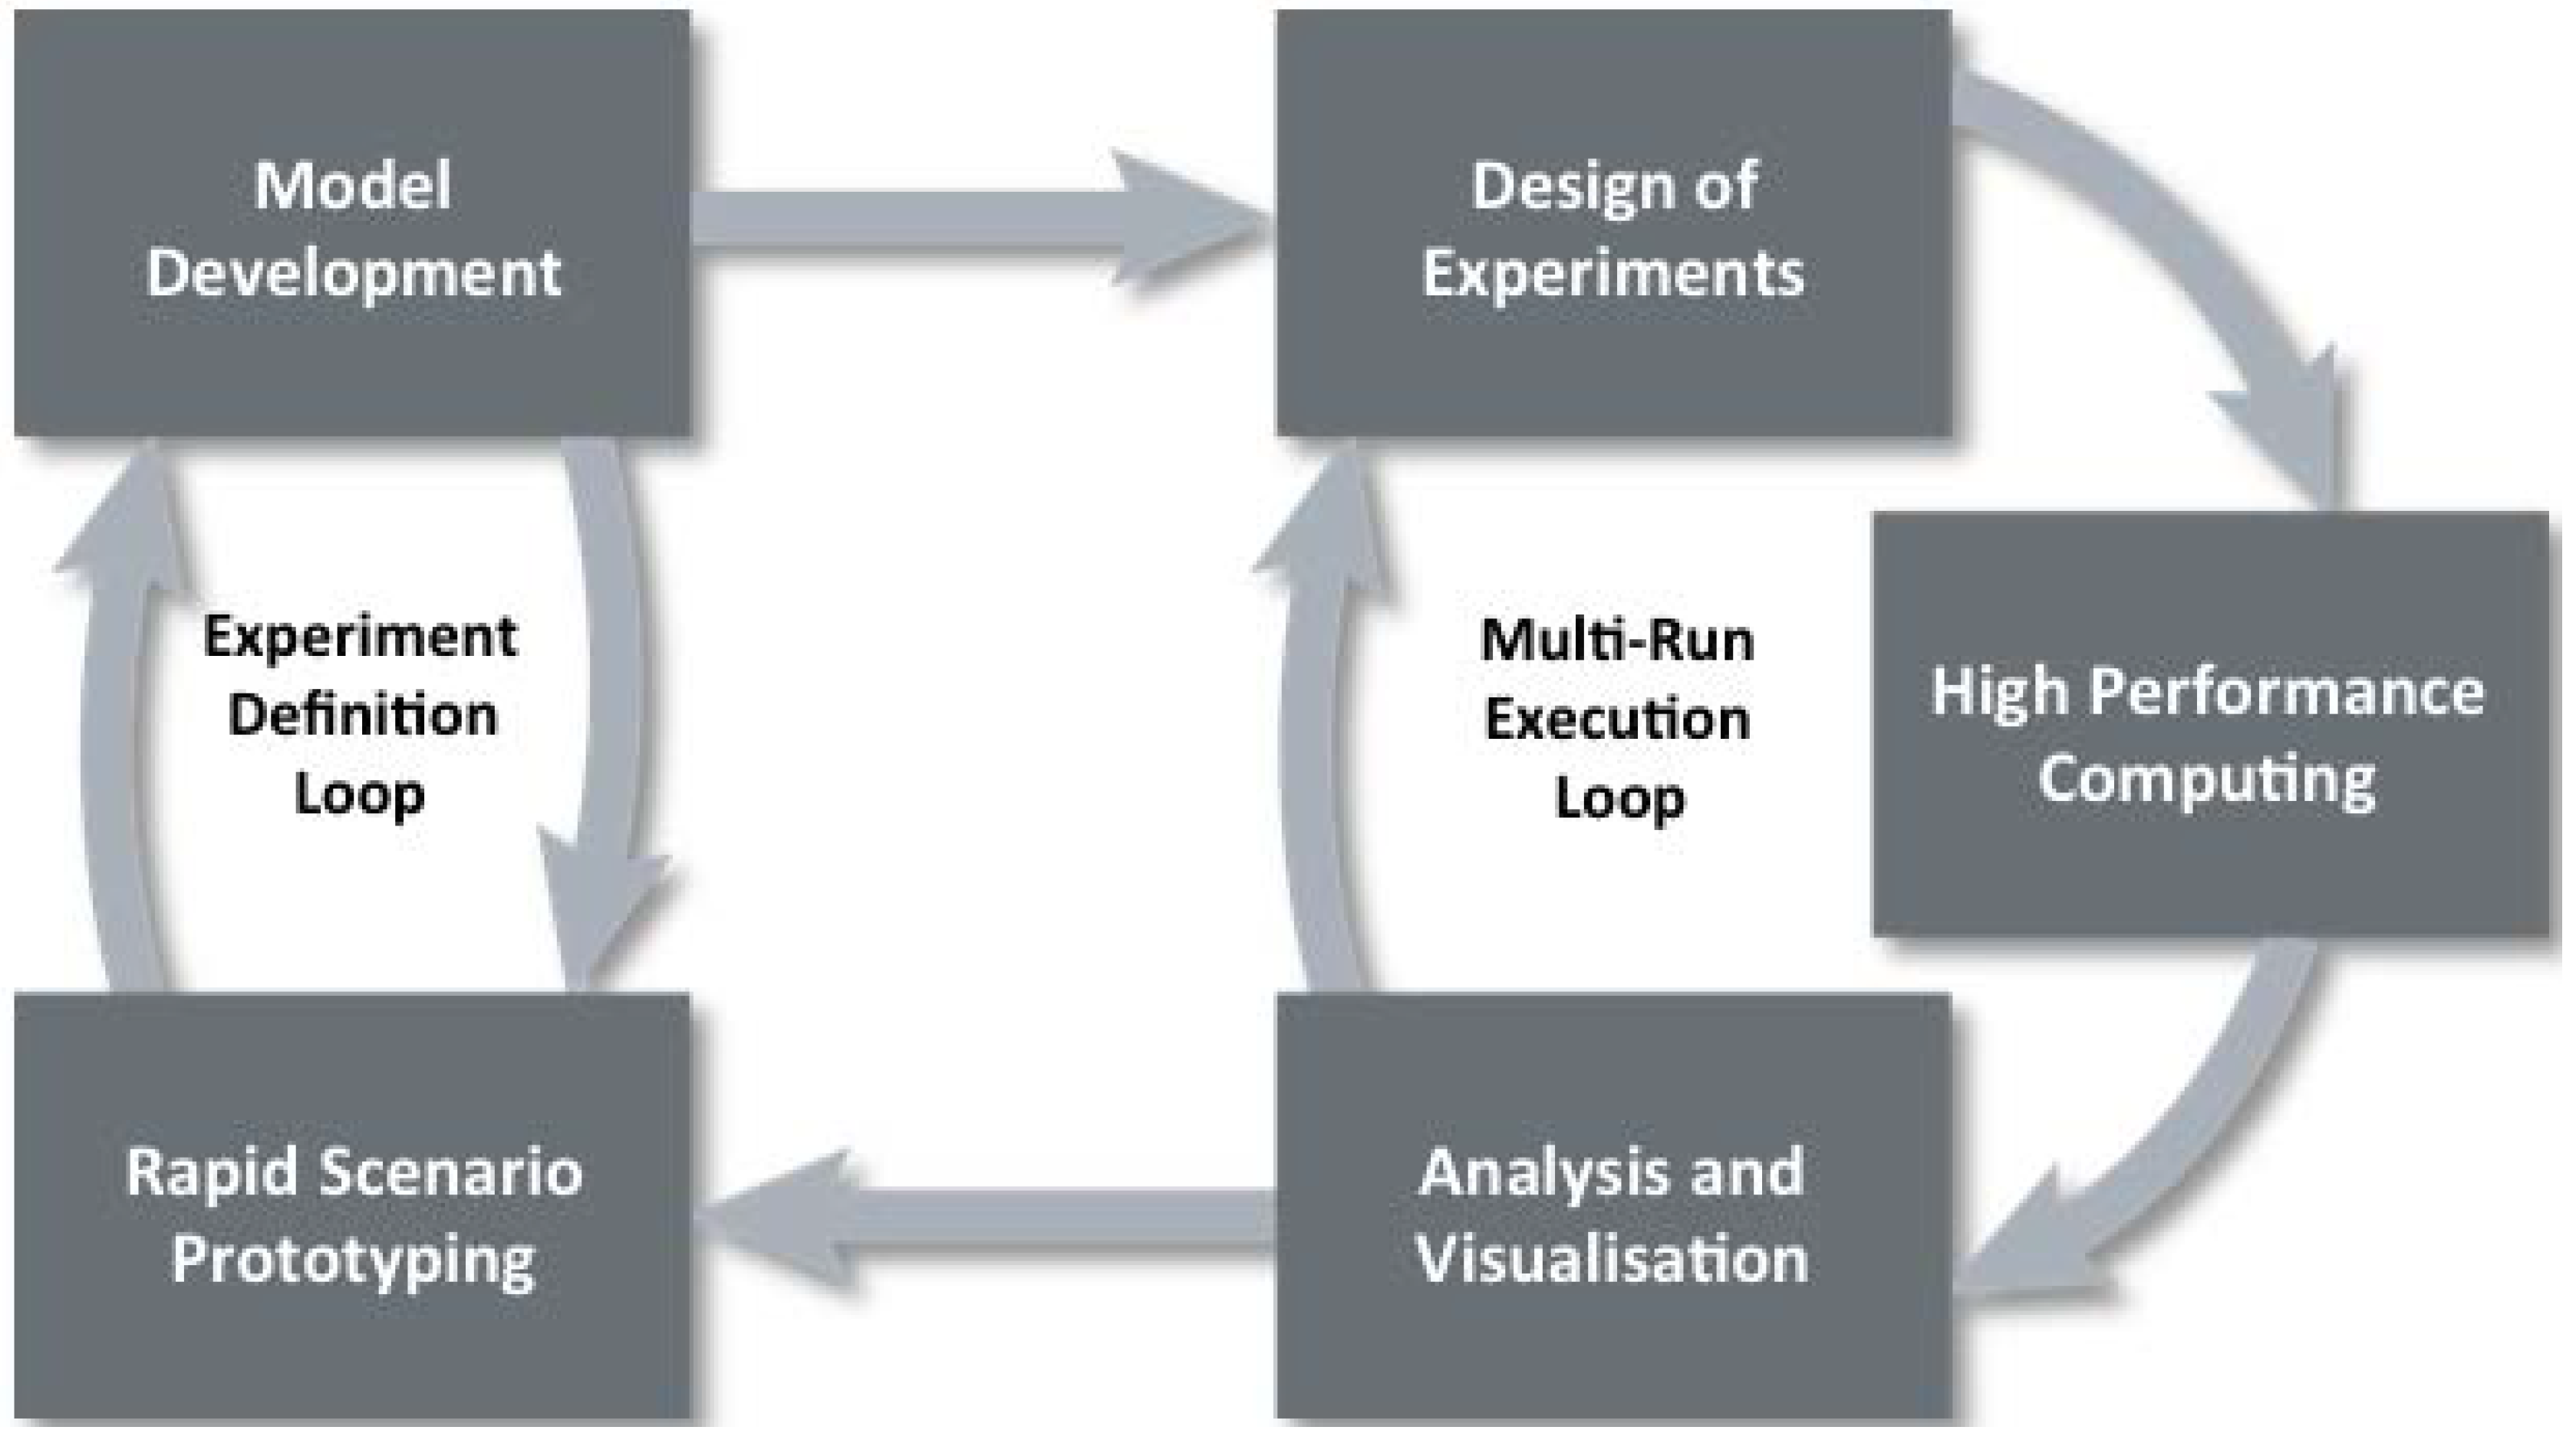
Data farming uses an iterative approach. The first realm, rapid prototyping, works with the second realm, model development, iteratively in an experiment definition loop. A rapidly prototyped model provides a starting point in examining the initial questions and the model development regimen supports the model implementation, defining the resolution, scope, and data requirements. The third realm, design of experiments, enables the execution of a broad input factor space while keeping the computational requirements within feasible limits. High performance computing, realm four, allows for the execution of the many simulation runs, which is both a necessity and a major advantage of data farming. The fifth realm, analysis and visualization, involves techniques and tools for examining the large output of data resulting from the data farming experiment. The final realm, collaborative processes, underlies the entire data farming process and these processes will be described in detail in this paper.
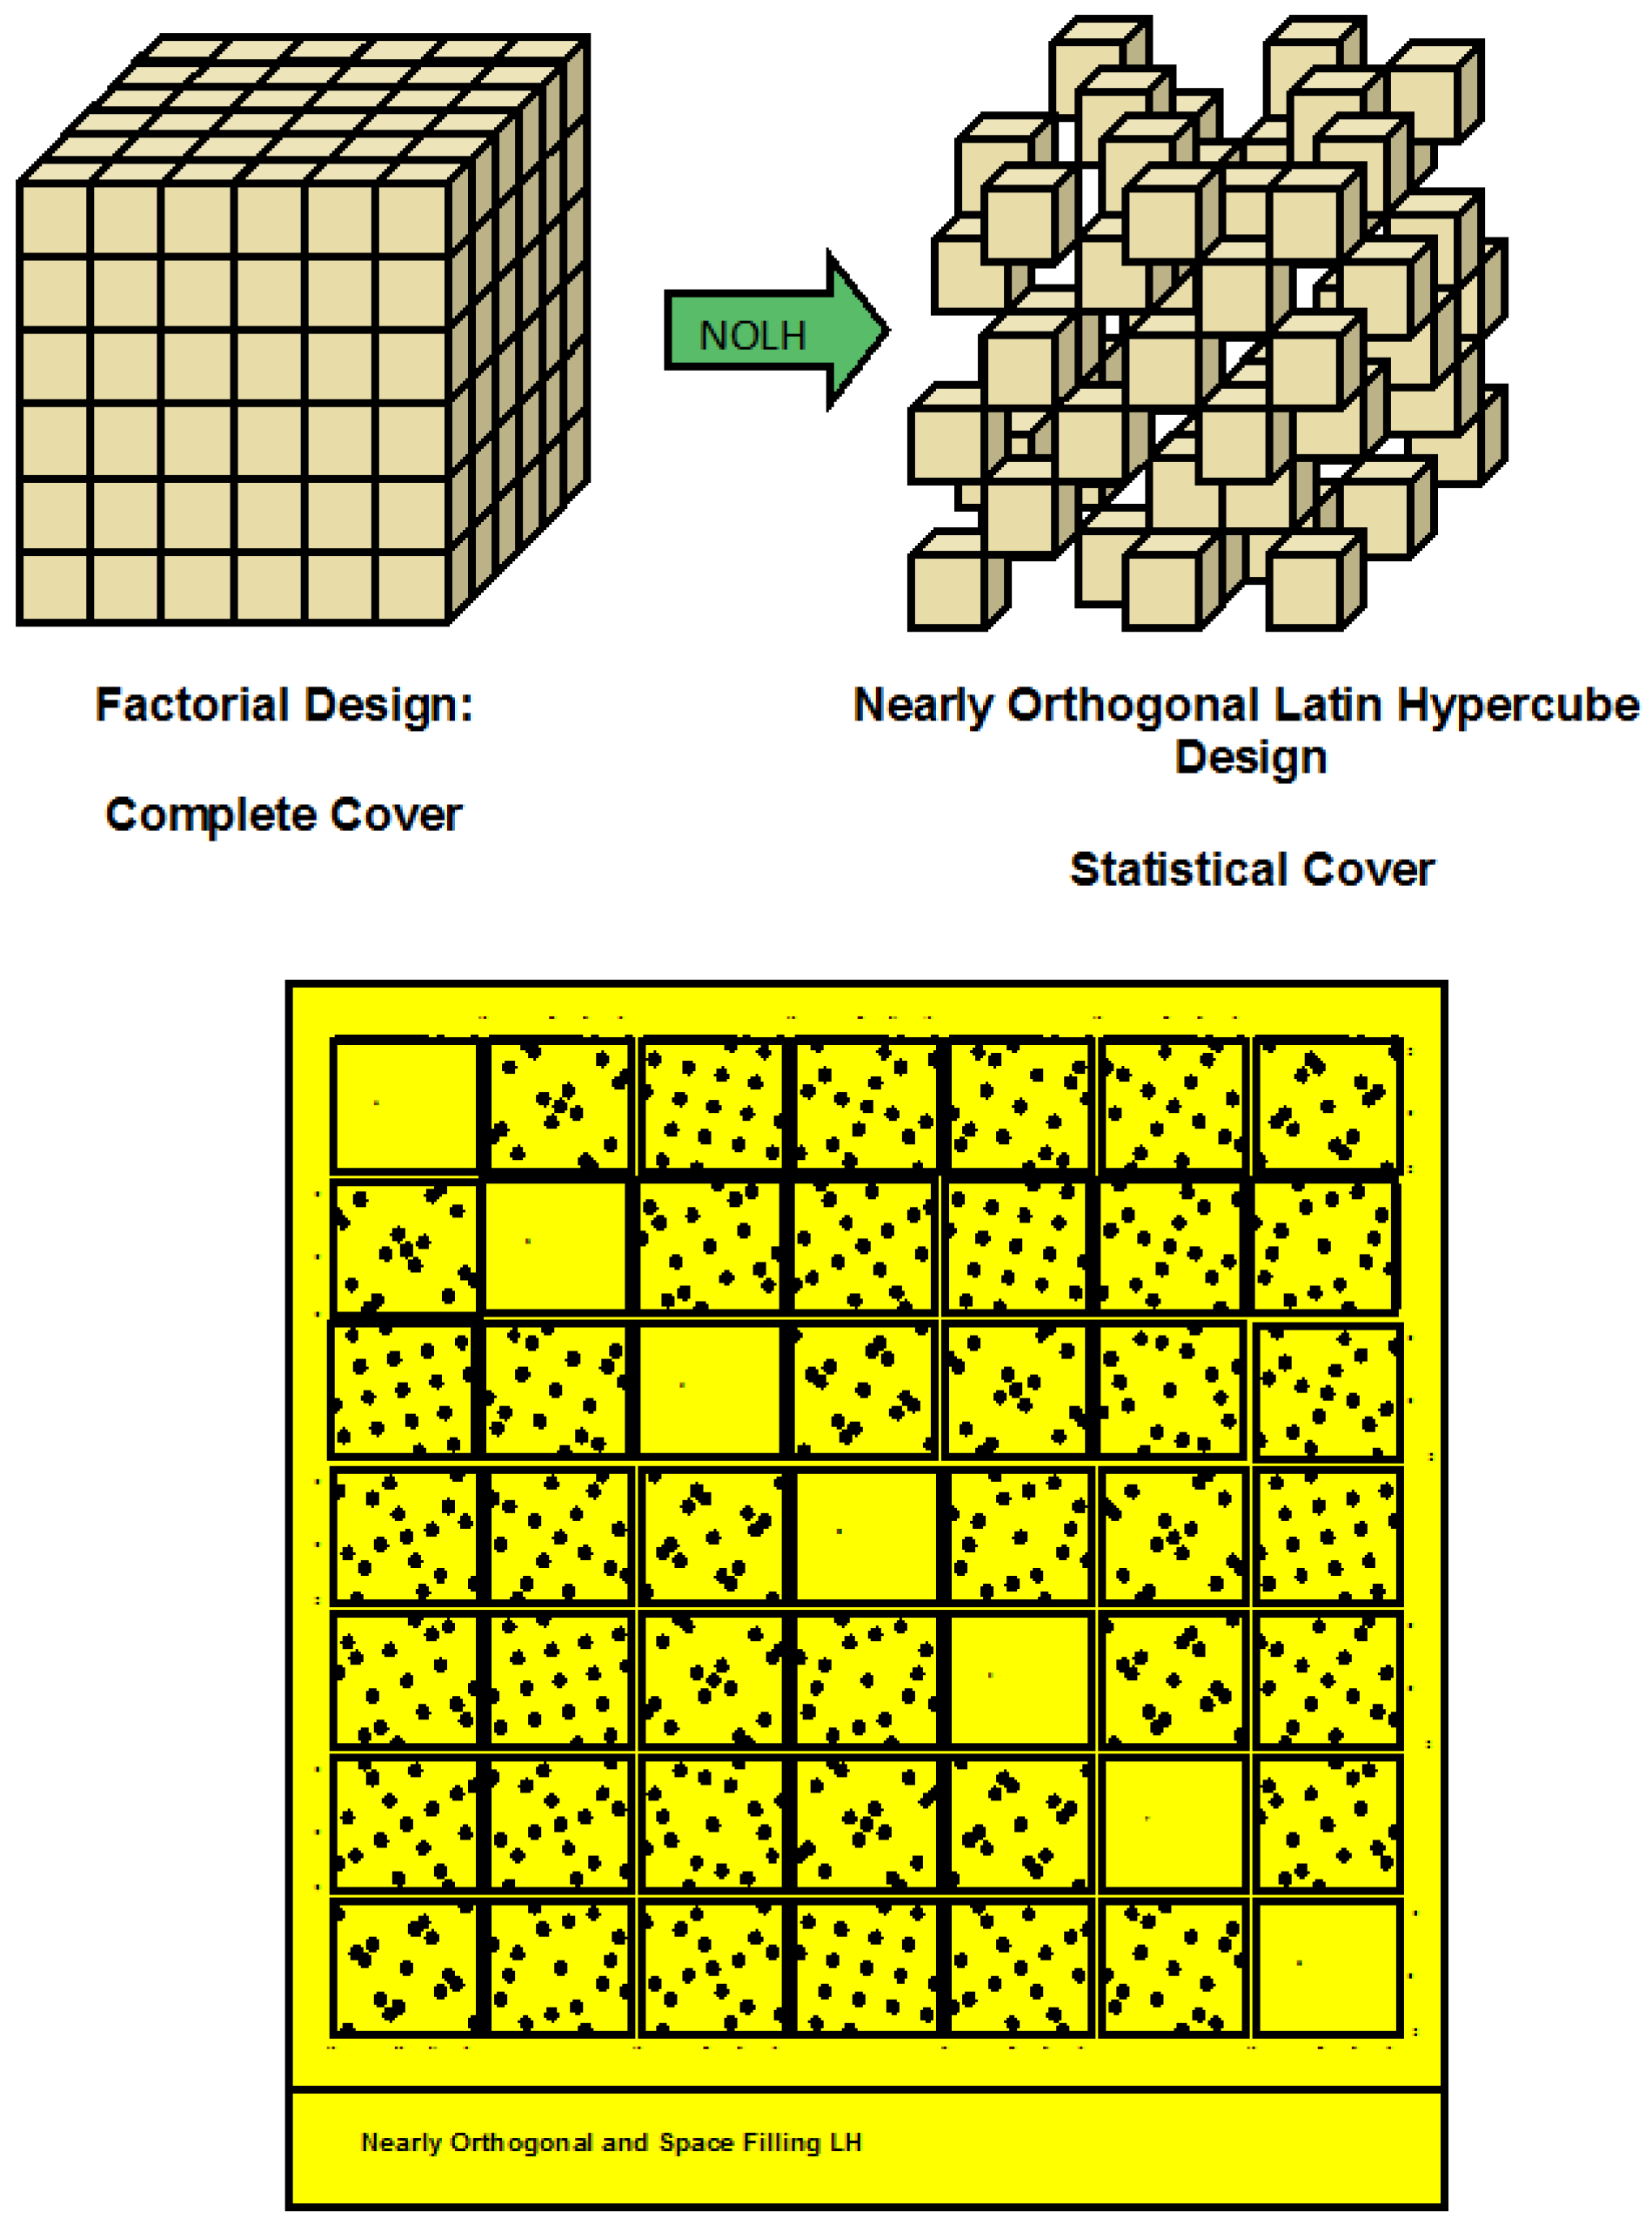
Figure 1 arranges the 6 realms of data farming with the key properties around a question base. It is a sequential process starting with rapid prototyping and ending with analysis and visualization—historically the 6 realms developed in a different order. All activities started out with modeling and high performance computing support with the goal to answer decision-makers’ questions. Feasibility was the initial driver. From the beginning, collaboration was the key—all work on the realms took place in international collaboration contexts and all working groups were multi-disciplinary and, if possible, international. Analysis and visualization efforts were developed to make the enormous amount of result data understandable. As the process matured, Rapid Scenario Prototyping was the starting point of the process. The final realm developed was Design of Experiments. From a complete covering of the parameter space, we went to a statistical covering, making Data Farming more efficient. The combination of the six collaborating realms of the process of Data Farming is unique.
The Humanitarian Assistance/Disaster Relief case study performed during MSG-088 will be described, including several courses of action where hundreds of alternatives were examined for each course of action. The scenario was a coastal earthquake disaster with embarked medical facilities; the primary objective being to limit the total number of fatalities. In addition, the Force Protection case study, a data farming experiment with several courses of action and thousands of alternatives, was performed during MSG-088. Using the scenario developed, operational military questions were examined in a joint NATO environment.
In summary, the essence of data farming is that it is first and foremost a question-based approach. The basic question, repeatedly asked in different forms and in different contexts, is: What if? Data farming engages an iterative process and enables a refinement of questions as well as obtaining answers and insight into the questions. Harnessing the power of data farming to apply it to our questions is essential to provide support not currently available to NATO decision-makers. This support is critically needed in answering questions inherent in the scenarios we expect to confront in the future as the challenges our forces face become more complex and uncertain.
2. Introduction
Data Farming is a process that has been developed to support decision-makers by answering questions that are not currently addressed. Data farming uses an inter-disciplinary approach that includes modeling and simulation, high performance computing, and statistical analysis to examine questions of interest with large number of alternatives. Data farming allows for the examination of uncertain events with numerous possible outcomes and provides the capability of executing enough experiments so that both overall and unexpected results may be captured and examined for insights. Harnessing the power of data farming to apply it to our questions is essential to providing support not currently available to decision-makers. This support is critically needed in answering questions inherent in the scenarios we expect to confront in the future as the challenges our forces face become more complex and uncertain.
Data farming is an iterative team process. Figure 2 shows the iterative process as a loop of loops with five of the six realms of data farming depicted. The sixth, collaboration, underlies the entire process and emphasizes the importance of the team aspect of data farming.
Since the term was coined in 1997 [2], the essence of data farming is that it is first and foremost a question-based approach. The basic question repeatedly asked in different forms and different contexts is: What if? Data farming enables a refinement of questions as well as obtaining answers and insight into the questions. From 1998 to 2006, data farming developed along with a project funded by the US called Project Albert, which quickly grew into an international effort where each member nation funded the national efforts and where the iterative nature of data farming was documented over these years [3,4,5,6,7]. Development of data farming continued after Project Albert officially ended through sponsored work, again in an international community, using the methods, and the Data Farming Community has met for workshops that continue to be held about twice a year, where there have been application teams and methodology development teams, and in both, various mathematical approaches have been used in performing data farming (see the proceedings of the workshops in [8]). Most recently, workshop 30 was held in Catania, Italy in February 2016.
In 2010, the NATO Research and Technology Organization started the three-year Modeling and Simulation Task Group called “Data Farming in Support of NATO” to assess and document the data farming methodology to be used for decision support [9]. This paper summarizes the completed work of this task group, designated MSG-088 [1]. In this paper, we heavily use [10] and also [11], which summarize the full body of work of [1] to describe the six realms of data farming and the two case studies performed during the course of MSG-088. In this paper, we do supplement the work in [10] with elaboration based on [1] and also our experience from being involved in the data farming community from the inception of the term Data Farming in August 1997. In order to try to give proper credit to the authors and sources of [1], we list references [12,13,14,15,16,17,18,19,20,21,22,23,24,25,26,27,28,29,30,31,32,33,34,35,36,37,38,39,40,41,42,43,44,45,46,47,48,49,50,51,52,53,54,55,56,57,58].
3. Rapid Scenario Prototyping
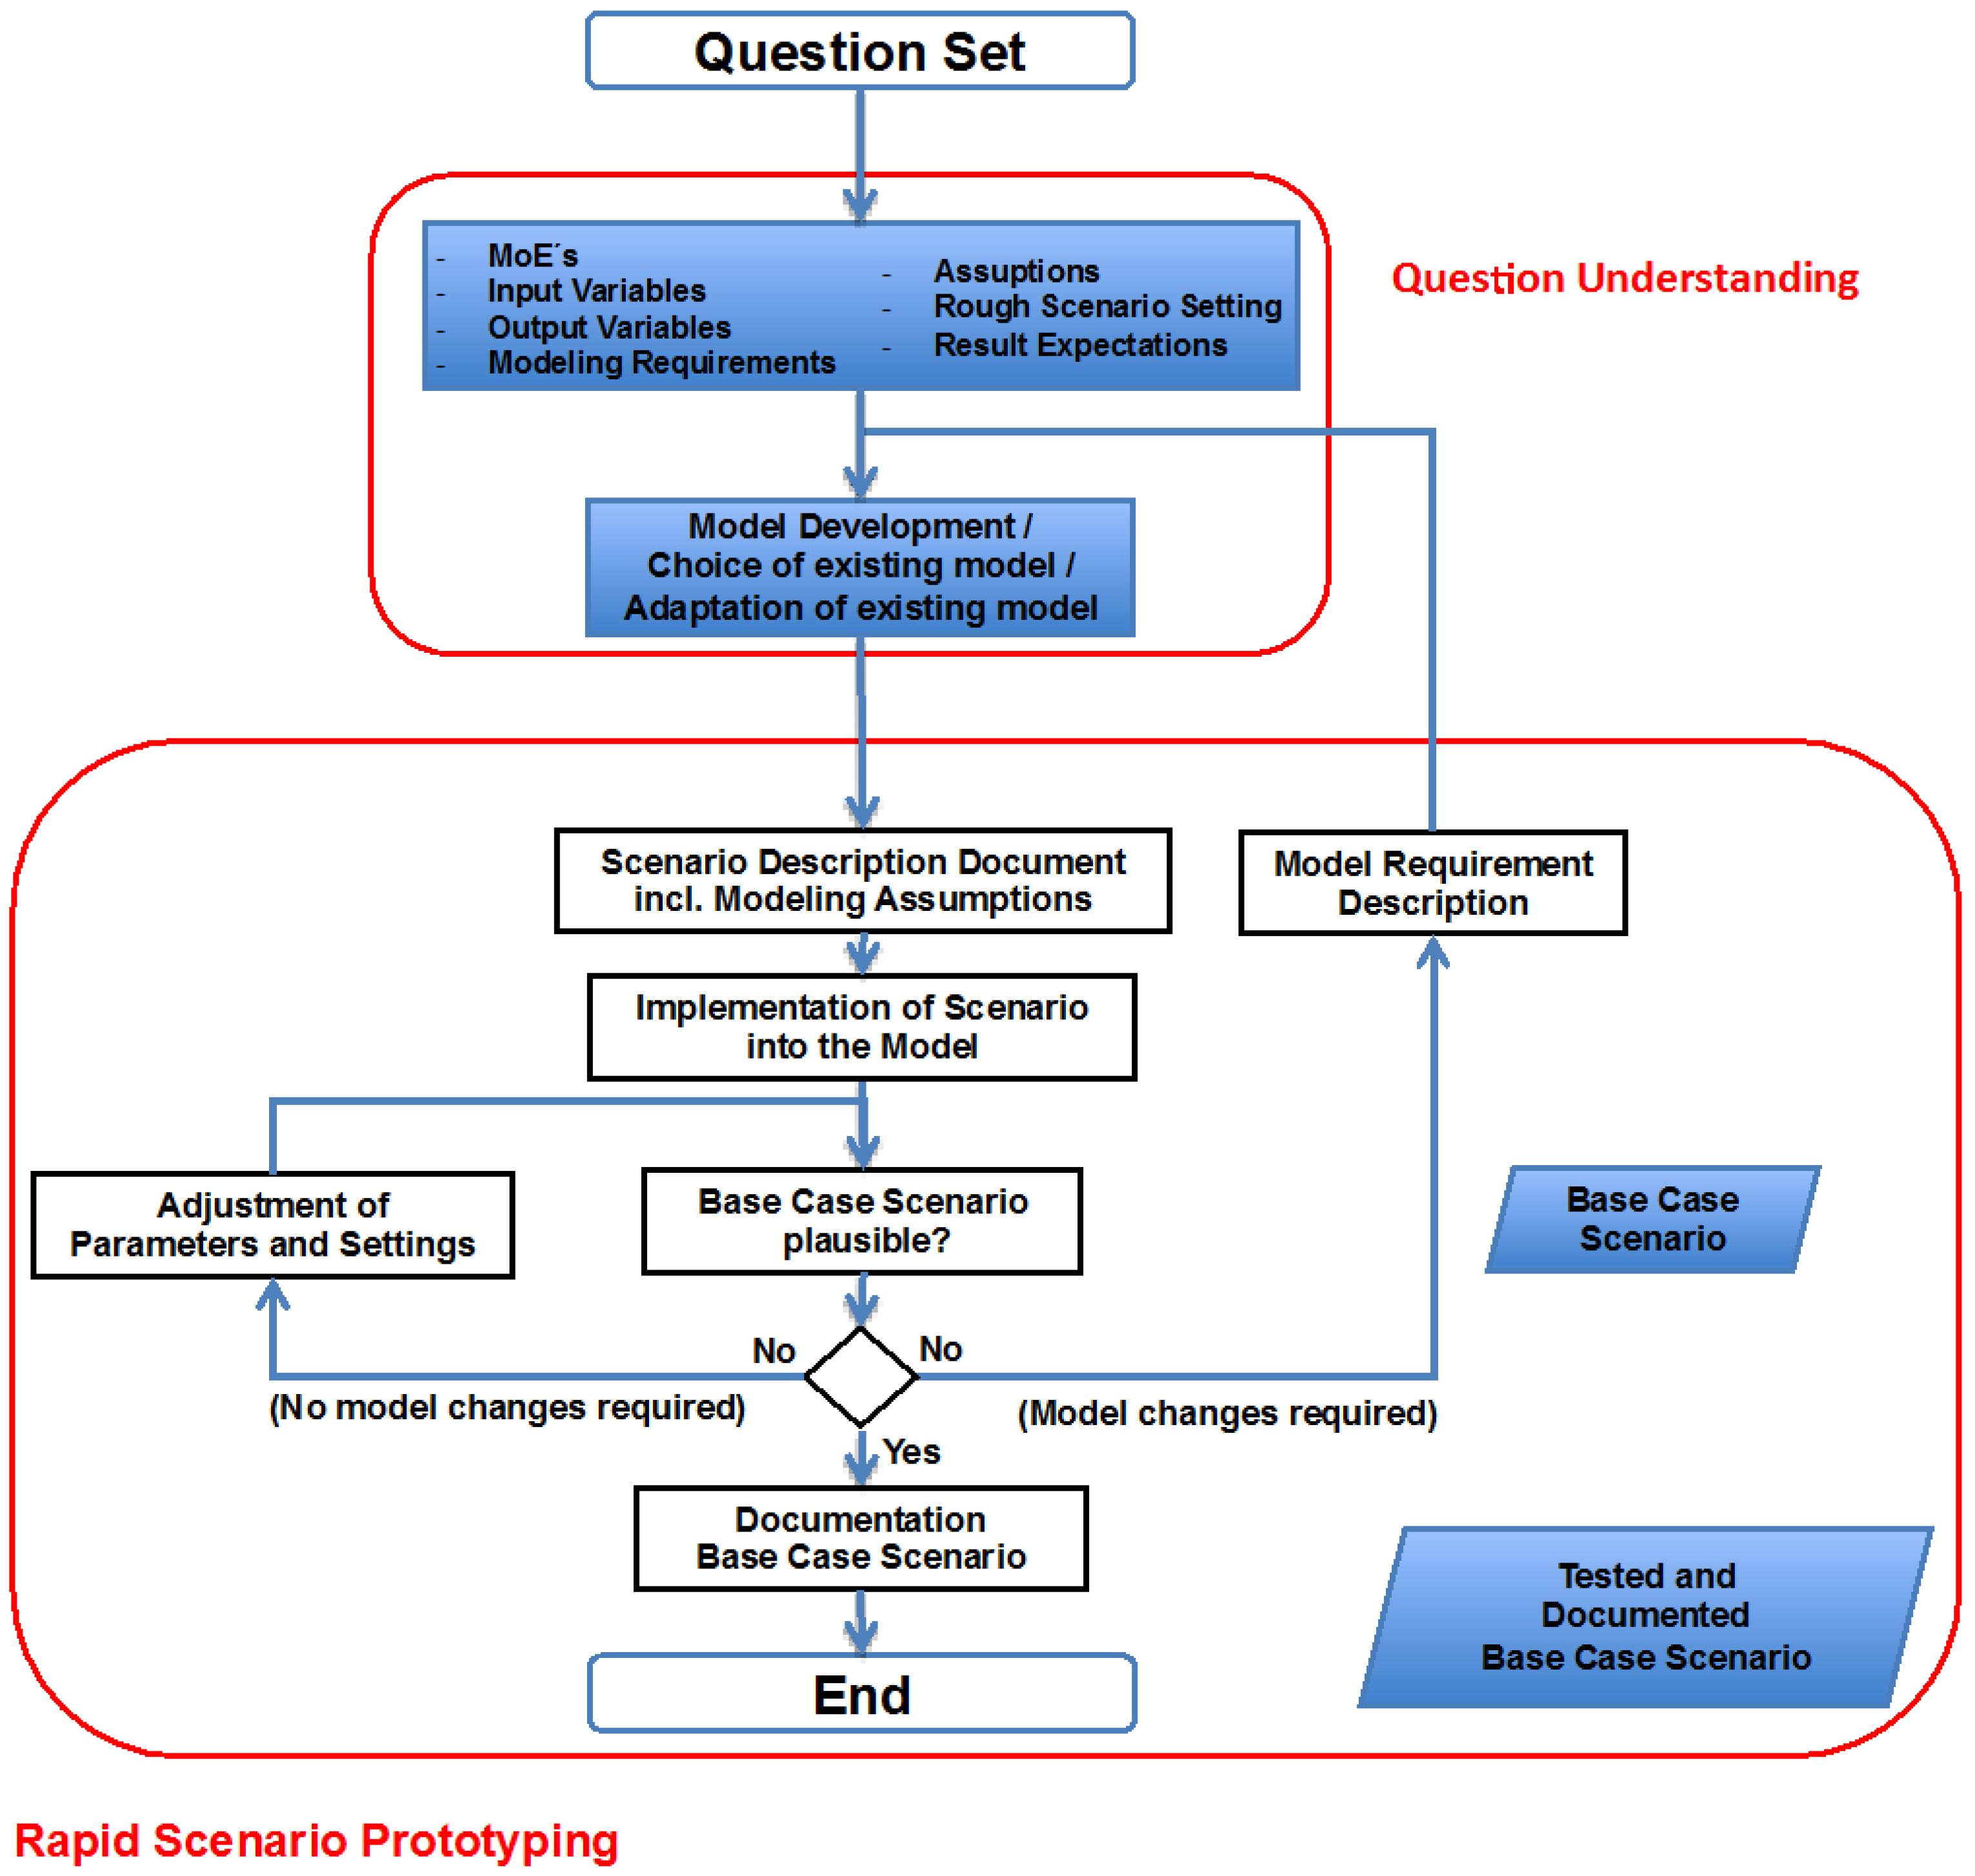
The model development and the rapid prototyping realms together make up the experiment definition loop in Figure 3. As such, they work hand-in-hand with each other and we could choose either realm to begin our detailed description of data farming—with some slight preference for starting with rapid scenario prototyping, because here the model is chosen and specified. Thus, the rapid scenario prototyping process is a good place to start our discussion.
As with the data farming process in general, the rapid scenario prototyping should always be within the context of the questions to be answered. These questions have to be prepared in such a way that simulation can help to find answers and to get insights. The most important step here is to define measurements to be collected by means of simulation together with required input and output data for the simulation. In most cases, this step already requires some rough ideas about the scenario settings. Thus, this realm simply represents the initial formation of the basics of a scenario to be simulated.
The analysis team should make several decisions on the specifics and the resolution of the required simulation model. The analysis team should consider what kind of data is required for the analysis and how to collect these data. Many abstractions and assumptions within the modeling process have to be made and documented. A simulation model then must be chosen and if necessary, adapted to the requirements of the specific analysis. If a suitable simulation model is not available, a new model has to be developed. All of the above is, as shown in Figure 3, a prerequisite of the actual RSP (rapid scenario prototyping) process, which starts with drafting a more detailed description of the scenario settings together with all the assumptions made so far. Once the scenario is drafted, it can be instantiated into a simulation model and the realm of model development is described in the next section [1].
The analysis team faces many challenges during the RSP process that are similar to the challenges found in a code of best practice of simulation based analyses [13]. The following aspects, presented in the following “checklist”, need to be considered to help in meeting the challenges in this area. Because each analyst in a multidisciplinary team with highly collaborative efforts has different needs and opinions, which may change depending on the question at hand, the checklist is not necessarily presented in any particular order.
- Scenario implementation without analysis question: A common problem if analysis team and model experts work separately. In addition, a common malpractice is to build a model, implement a scenario and then to ask: “Which question can we answer now?” This leads to adjustment of questions to the tool and often to answers nobody needs.
- Wrong model for the question: Common causes of this problem might be that someone ordered the use a specific model or that the analyst is familiar with a certain model and wants to use only this model or that only one model is available for usage. Using a “wrong” model clearly limits the amount and scope of insight we can expect from the analysis. The analysis team has to communicate this to the client (decision-maker). It might be necessary to adjust the questions, to refocus the analysis or to stop the analysis project in order to avoid getting useless results.
- Data not available or of bad quality: Data problems often lead to additional assumptions. Sometimes during model development, data “dummies” are used to test the model and later left in as parameters. If this is not known or forgotten, it can lead to wrong conclusions or recommendations.
- Bad or missing model documentation: The model documentation should answer the question “How are things modeled?” It is obvious that bad or missing model documentation seriously impedes a useful scenario implementation. Model documentation cannot replace the model expert, but there is no model expert without model documentation; again, a serious threat for the success of the whole analysis project!
- SMEs not available: This is certainly a kill-criterion for a successful analysis. During RSP, SME knowledge is needed to implement and test the scenario. For the usefulness and acceptance of analysis results, the involvement of SMEs is essential.
- Model expert not available: Even a good model documentation cannot replace an experienced model expert, because model expert means much more than being able to handle the simulation model. Knowing how things are modelled in the model is the crucial part here. The model expert is not only necessary for implementing and testing the scenario, but also later for interpreting simulation results together with analysts and SMEs.
- Too much detail in modeling: The art of modeling is to get the level of abstraction right. Too much detail in the scenario will make it nearly impossible to extract the relevant information and to come to valid conclusions pertaining to the problem area. The analysis team has to withstand the temptation to put more and more details into the model and the scenario. The required level of detail should be determined by the analysis questions only.
- Not enough detail in modeling: If the model or the scenario is not detailed enough, the analysis will not reveal the kind of insights we hope for. Much thought has to be spent in the starting phase of the analysis to get the right level of abstraction.
- Missing possibilities for editing the scenario settings: Suitable editors should be available to implement and adjust scenario settings. This is not only important to save time, but also to better involve SMEs in this process. An example might be an editor to create or change rule sets for agents in the simulation model. Parameters or data hardcoded into the model often create the necessity to construct work-arounds.
- Missing equipment or software: An effective RSP requires the right tools. Insufficient support in this area leads to more time-consuming and inefficient processes. A common example is the need to generate or manipulate terrain databases for the simulation system.
- Question changes during RSP process: Whenever an analysis question changes, the analysis team has to check the implications on all the aspects of the analysis, including the model and scenario, otherwise the analysis work might be invalid and the findings useless.
- Exaggerated Political Correctness: The scenario description within RSP used as a basis for scenario implementation should be separated and distinguished from more general scenario context descriptions, which often include many more domains like historical development of the situation. The RSP scenario description should strongly focus on the investigation of the analysis question, otherwise other influences might reduce the usability of the scenario for the analysis.
- Model still under development: It is not uncommon that a model still under development is chosen for the analysis. In this case, it is important to use a specified version of the model (“freeze the model”) for the analysis; otherwise, simulation output might change due to the influence of new model features without being aware of this cause.
- MOE/input data/output data not defined: Scenario implementation and testing should take the required simulation input and output data as well as the MOE into account, otherwise the analysis project will re-enter the RSP sooner than expected.
- Insufficient time for RSP: Rapid is relative. The analysis team should not underestimate the time necessary to implement and test the scenario. Insufficient time can lead to a low quality base case scenario, which will lead to low quality analysis results.
- Assumptions not documented: Assumptions and development of assumptions can have a large impact on the interpretation of simulation results. Different groups need a common understanding, and if the assumptions are documented there may be less room for error.
- Reality not reflected sufficiently in scenario (“Working on the wrong model”): The simulation will still produce numbers, which we can analyze, and statistical insights can be visualized. We can even draw conclusions and give recommendations but they might not be applicable or even dangerous. This shows that involvement of SMEs is essential during the whole RSP process.
- Simulation produces unwanted effects not present in the real world: This aspect might be caused by model errors, work-arounds or modeling errors during scenario implementation. Such effects oftentimes remain undiscovered until the analysis of the data farming results or until the interpretation of these results. For example, in the Humanitarian Assistance case study in [1], some initial incorrect coding of hospital ship capacity led to no difference in effectiveness when there should have been. These unwanted effects can be dangerous if they are never discovered, because they can lead to wrong conclusions as a result of the whole analysis project.
4. Distillation Model Development
As stated in the previous section, the model development realm works hand-in-hand with the rapid scenario prototyping realm in the experiment definition loop on the left side of Figure 2. The fundamental output of this loop is a scenario instantiated in a working model that captures the essence of a question and that can be sent to the multi-run execution loop of the data farming process. Of course, more insight into the question, refinement of the question, and/or deeper examination of the question may be enabled later through a return to the experiment definition loop later in the process.
The model development subgroup of MSG-088 pursued the task of providing basic characteristics of data farmable simulation systems, such as general technical requirements for simulation systems that are used for data farming. We investigated possible application areas of data farmable simulation systems and studied technical concepts within modeling. The group documented some of the most important system contributions made by each member nation. The following is a very short description of the models:
- MANA (Map Aware Non-uniform Automata) is an agent-based, time-stepped, distillation model developed by the New Zealand Defence Technology Agency (DTA) for the New Zealand Defence Force. The model was built on the idea that overly detailed models are not helpful in finding robust system settings for desired battlefield outcomes because they are too focused on extraneous issues. MANA, and therefore models only the essential details of a scenario and tries to create a complex adaptive system that mimics real-world factors of combat. The agents are map aware, meaning that the map serves as the agent's impression of its environment. This modeling environment has a relatively easy GUI, allows for quicker scenario development, and is capable of data farming.
- Pythagoras is a multi-sided agent-based model (ABM) created to support the growth and refinement of the U.S. Marine Corps Warfighting Laboratory’s Project Albert. Anything with a behavior can be represented as an agent. The interaction of the agents and their behaviors can lead to unexpected or emerging group behaviors, which is the primary strength of this type of modeling approach. As Pythagoras has grown in capability, it has been applied to a wide variety of tactical, operational and campaign level topics in conventional and irregular warfare.
- ITSimBw is a multi-agent simulation system designed to simulate and analyze military operations in asymmetric warfare. The core abilities are data farming, optimization and analysis. It is designed to adapt to different military scenarios scalable in time, space and functionality. Therefore, several so called “Szenarkits” were developed to cover certain question-driven surveys inspired by the German Bundeswehr.
- PAXSEM is an agent-based simulation system developed in Germany for sensor-effector simulations (ABSEM) on the technical and tactical level that can be used for high performance data farming experimentation. PAXSEM addresses combat-oriented questions as well as questions relevant to peace support operations. For being able to take into account civilians in military scenarios, PAXSEM also contains a psychological model that can be used to model civilians in an adequate way. Civilians in PAXSEM behave according to the current status of certain motives, such as fear, anger, obedience, helpfulness or curiosity (PAX). According to the motivational strength of these human factors, the civilian agent will choose and execute certain actions.
- SANDIS is a novel military operational analysis tool developed in Finland and used by Finnish Defence Forces (FDF) for comparative combat analysis from platoon to brigade level. In addition, it can be used to study the lethality of indirect fire, since it includes a high-resolution physics-based model for fragmenting ammunition. SANDIS has also been used for analyses of medical evacuation and treatment. The software is based on Markovian combat modeling and fault logic analysis.
- ABSNEC is a simulation system developed in Canada that is able to represent realistic force structures with tiered C2 architectures, as well as human factors such as stress, fear, and other factors towards the analysis of battle outcomes in network operations. In addition, the simulation system provides flexibility to users in creating customized algorithms that define network agents in route control and bandwidth capacity assignment in the communication network.
- RSEBP is a simulation-based decision support system developed in Sweden for evaluation of operational plans for expeditionary operations. The system simulates a blue forces operational plan against a scenario of red and green group actors. This system uses a special form of data farming based on A*-search, a tree of alternative plan actions, where a full plan instance corresponds to one data input point.
- C2WS is a command and control simulation system developed in Sweden. The system models all levels from combat up to operational levels. It can be used for planning, procurement, and training/exercises. This system does not currently use data farming; it may be extended to include data farming under a data farming wrapper.
In addition to the models listed above, especially for the Data Farming developed, all agent based model development environments can be used to rapidly develop a model appropriate to the actual question base. Furthermore, we documented existing model practices for data farming obtained from experiments with applications within each nation. In addition, the group identified and documented the overall scope of applications and the real world domains that can be addressed using data farming methodology with the existing models. Space constraints prohibit us from discussing all of this work, but in the remainder of this section, we will summarize our recommendations regarding model development in data farming applications.
When developing models, both modeling and subject matter experts should be present. Rapid scenario prototyping provides model requirements for model development. For example, it is important to do one thing well, such as creating aggregated models that combine simple models instead of building single monolithic models, whenever possible. The more independent models are from each other, the better the potential results. Thus, one needs to encourage modularization and clear separation of different models, including development practices for using models of different aggregation level and scope.
Reusability of models is also an important topic. To achieve good reusability, models should be loosely coupled and be interoperable. We need to make models interoperable with other models and easily data farmable. Interoperability is achieved when input and output variables of a model are properly exposed and documented. Existing standards of the modeling and simulation community should therefore be applied wherever applicable.
Furthermore, model calculations and results should be exactly repeatable. For example, any random number generators in models should have their seed values exposed as input variables, so that simulations can be repeated. Good standards require appropriate validation of models. To be useful, they need to reflect reality at the correct level of approximation. In addition, data validation should be properly documented and provided.
User interfaces should be clearly separated from calculation engines. This makes it easier to reuse the models. For example, in high performance computer applications, simulation systems are often used without a graphical interface. Also, model verification should be made as easy as possible. To ensure that the models work properly, they should have an extensive test suite that can be run through. In case of problems, simulation systems should provide a transparent state of their inner workings to make investigation and problem fixing easy.
Whenever possible, it is recommended to provide supporting software with the simulation systems. Complex models, especially those dealing with complex input parameters, need supporting software. This supporting software should also be provided with the simulation systems, using similar good software practices. Because even the most accurate and efficient model is useless without information on how to use it, documentation of models and their validation has to be done properly. Finally, openness should be encouraged; the source code should be provided with the model when possible given other constraints [1].
5. Design of Experiments
Design of experiments is one of the three realms of data farming in the multi-run execution loop. Along with the realms of high performance computing and analysis and visualization, the realm of design of experiments allows us to perform multiple runs to gain simulation results over a wide landscape of possibilities. The full MSG-088 report describes the methodology in the design of experiments related to data farming and documents currently available designs in this area, but here we simply give a broad overview of design of experiments.
Simulation models have many inputs or parameters (factors) that can be changed to explore alternatives. A designed experiment is a carefully chosen set of combinations of these inputs, called design points, under which the simulation model will be run.
Changing the factors all at once limits your insights. It will allow you to see whether or not this changes the responses, but you will not be able to tell why the changes occur. For example, if mission effectiveness improves when you equip a squad with better sensors and better weapons, you will not know whether it is the weapon or the sensor that has the most impact.
Changing the factors one at a time also limits your insights. If the squad gets a very small improvement from a better weapon, a very small improvement from a better sensor, but a large improvement from both, you will not be able to identify this interaction (or synergistic effect) if the experimental design does not involve factors for both the weapon and the sensor.
Changing the factors in a brute force way, by looking at all possible combinations, is impractical or impossible, except for extremely simplistic simulations with only a handful of factors. If you have 100 sensors, each of which can be turned on or off, there are 2100 possible sensor configurations. Even printing these alternatives would take millions of years on the world’s fastest supercomputers.
Design of experiments helps overcome the curse of dimensionality, while letting you achieve a broad variety of insights about your simulation model’s performance. It provides smarter ways of setting up the experiment that facilitate follow-on analysis and visualization of results in a reasonable amount of time. The type of design used in an experiment dictates the output data that will be generated and collected in a simulation experiment. It also impacts the analysis and visualization methods that can be used in the analysis of simulation output data [1].
Figure 4 shows, in two very simplified representations, the complete covering of the parameter space on one side, and the statistical covering of the parameter space on the other side.
6. High Performance Computing
The main task of the high performance computing (HPC) subgroup of MSG-088 was to document best practices and the lessons learned by the member nations in their pursuit of implementing an HPC environment for data farming. In addition, the subgroup documented those individual member nations’ environments. This documentation appears in the full MSG-088 report. Here, we will summarize the realm of high performance computing within the loop of loops that make up the data farming process.
HPC consists of both hardware and software resources. HPC systems can be configured as a single supercomputer with thousands of processors, as a network of clustered computers, or even as a single powerful desktop computer with multi-core processors. The hardware on these systems includes processors, memory, networking hardware, and disk storage. HPC software includes, among other things: the operating system; underlying or supporting software, which provides the environment to execute the model; and the data farming software, which enables running instances of the model across the HPC systems’ “compute units”. By generating and managing each of the model runs over a set of design points or input sets, the data farming software provides the infrastructure “glue” that “sticks together” the model, its set of inputs, the design, and the HPC resources.
The main purpose of HPC in the context of data farming is to provide the means to execute a data farming experiment. Other purposes of HPC are for use in analysis and visualization of the output and for generating designs used in future data farming experiments. Given the large number of model runs conducted in a typical data farming experiment, HPC facilitates performing the experiment in a timely manner as well as supporting the storage and analysis of huge volumes of output. From a purely computational perspective, there are six elements involved in a data farming experiment:
- 1
- A “data farmable” model (we use the term “model” generically; it can refer to any computational model or simulation).
- 2
- A set of model inputs, generically called the “base case”.
- 3
- A specification of your experiment (the set of factors in your design and a mechanism for finding and setting those in the set of model inputs).
- 4
- A set of HPC resources, both software and hardware, needed to execute a model “instance”.
- 5
- The data farming software.
- 6
- A set of model outputs.
The first five elements are required to begin execution of the data farming experiment; the final element is the product or the results of the data farming experiment. Basically, the process proceeds as follows: for each “design point” in the design, the data farming software creates and executes a compute “task” or “job”, where that task consists of creating a set of model inputs using the base case as a template; executing the model with that modified input set; and collecting and storing the model output for that design point. Other tasks may include collecting and staging the raw output for further analysis and visualization, additional post-processing of the output, or automated analysis of the output [1].
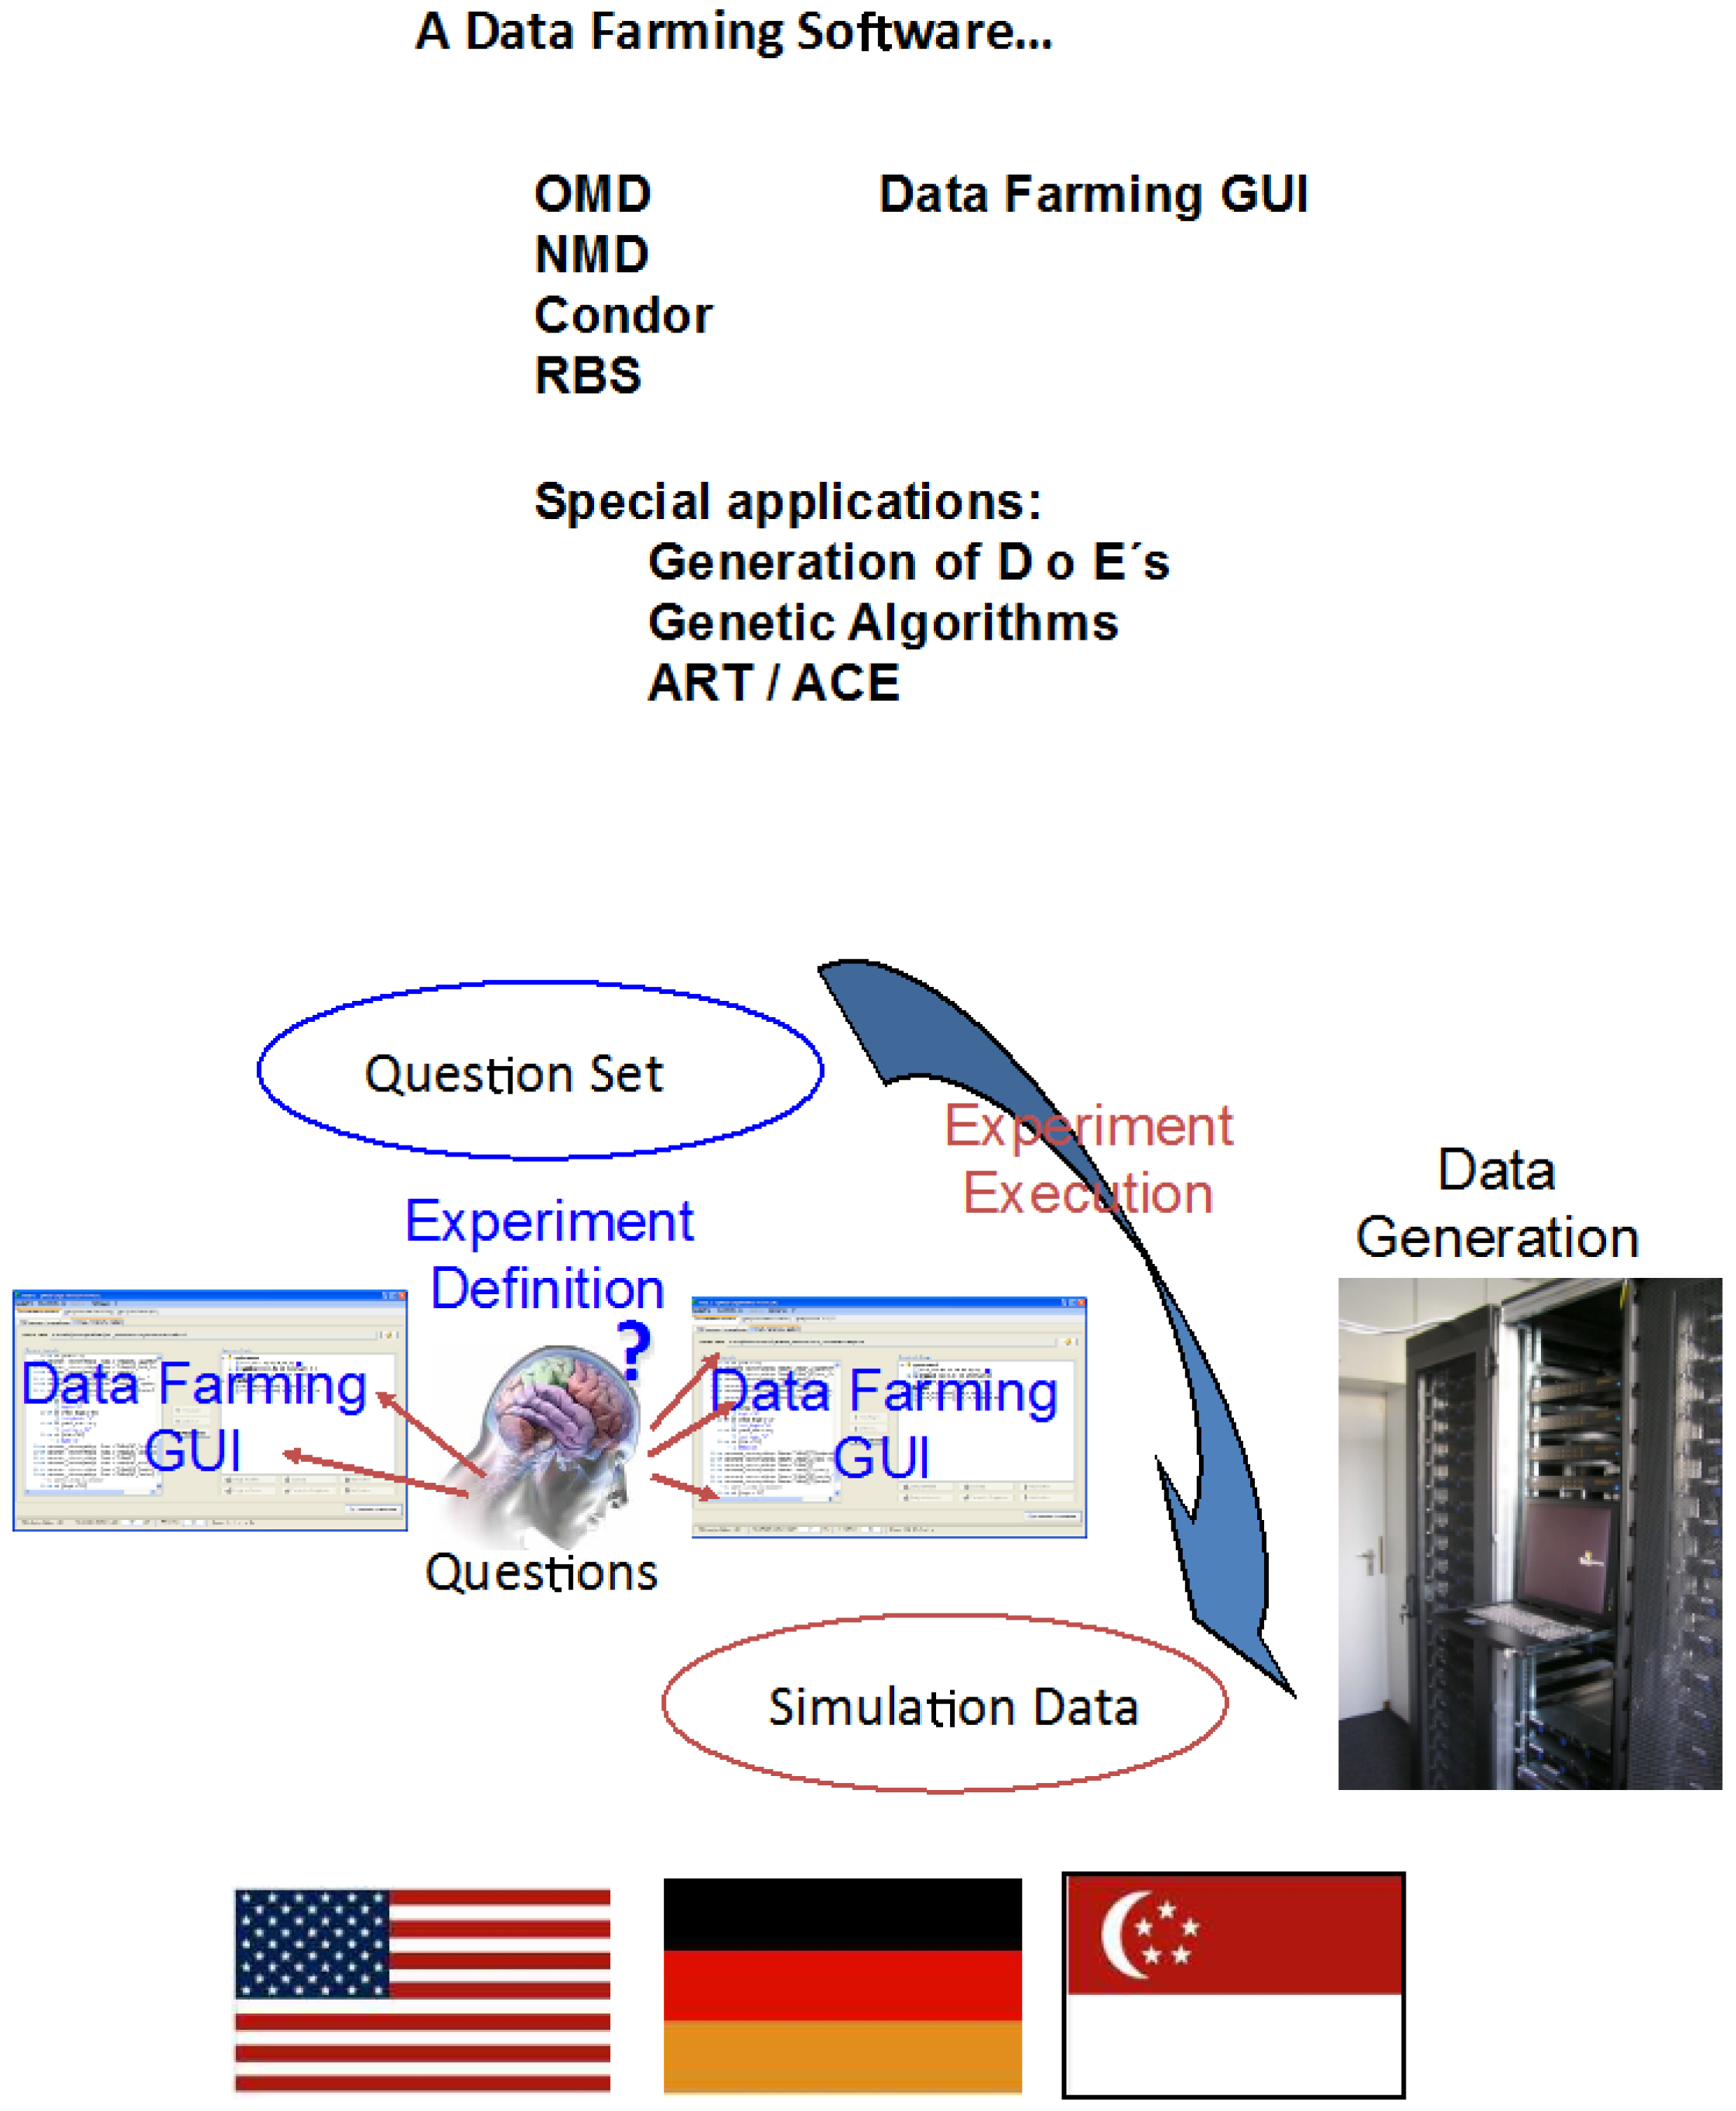
The top portion of Figure 5 refers to Data Farming software in a Data Farming GUI. The remainder of the figure shows a sketch of the path from the question base to simulation results and finally the contributing nations.
7. Analysis and Visualization
We define analysis as the process of examining data that is produced by data farming processes using statistical, summarization and presentation techniques to highlight useful information, extract conclusions, and support decision-making. Visualization is a collection of graphical and visual analysis techniques used to optimize and speed the process of exploring data, conveying understanding, and presenting in data farming processes. Much of the current usage of analysis and visualization in the data farming process has been the analytic examination of multiple replicate and excursion model outputs and we describe this usage in the full report. Here, we will give some of the high level conclusions regarding the realm of analysis and visualization from MSG-088.
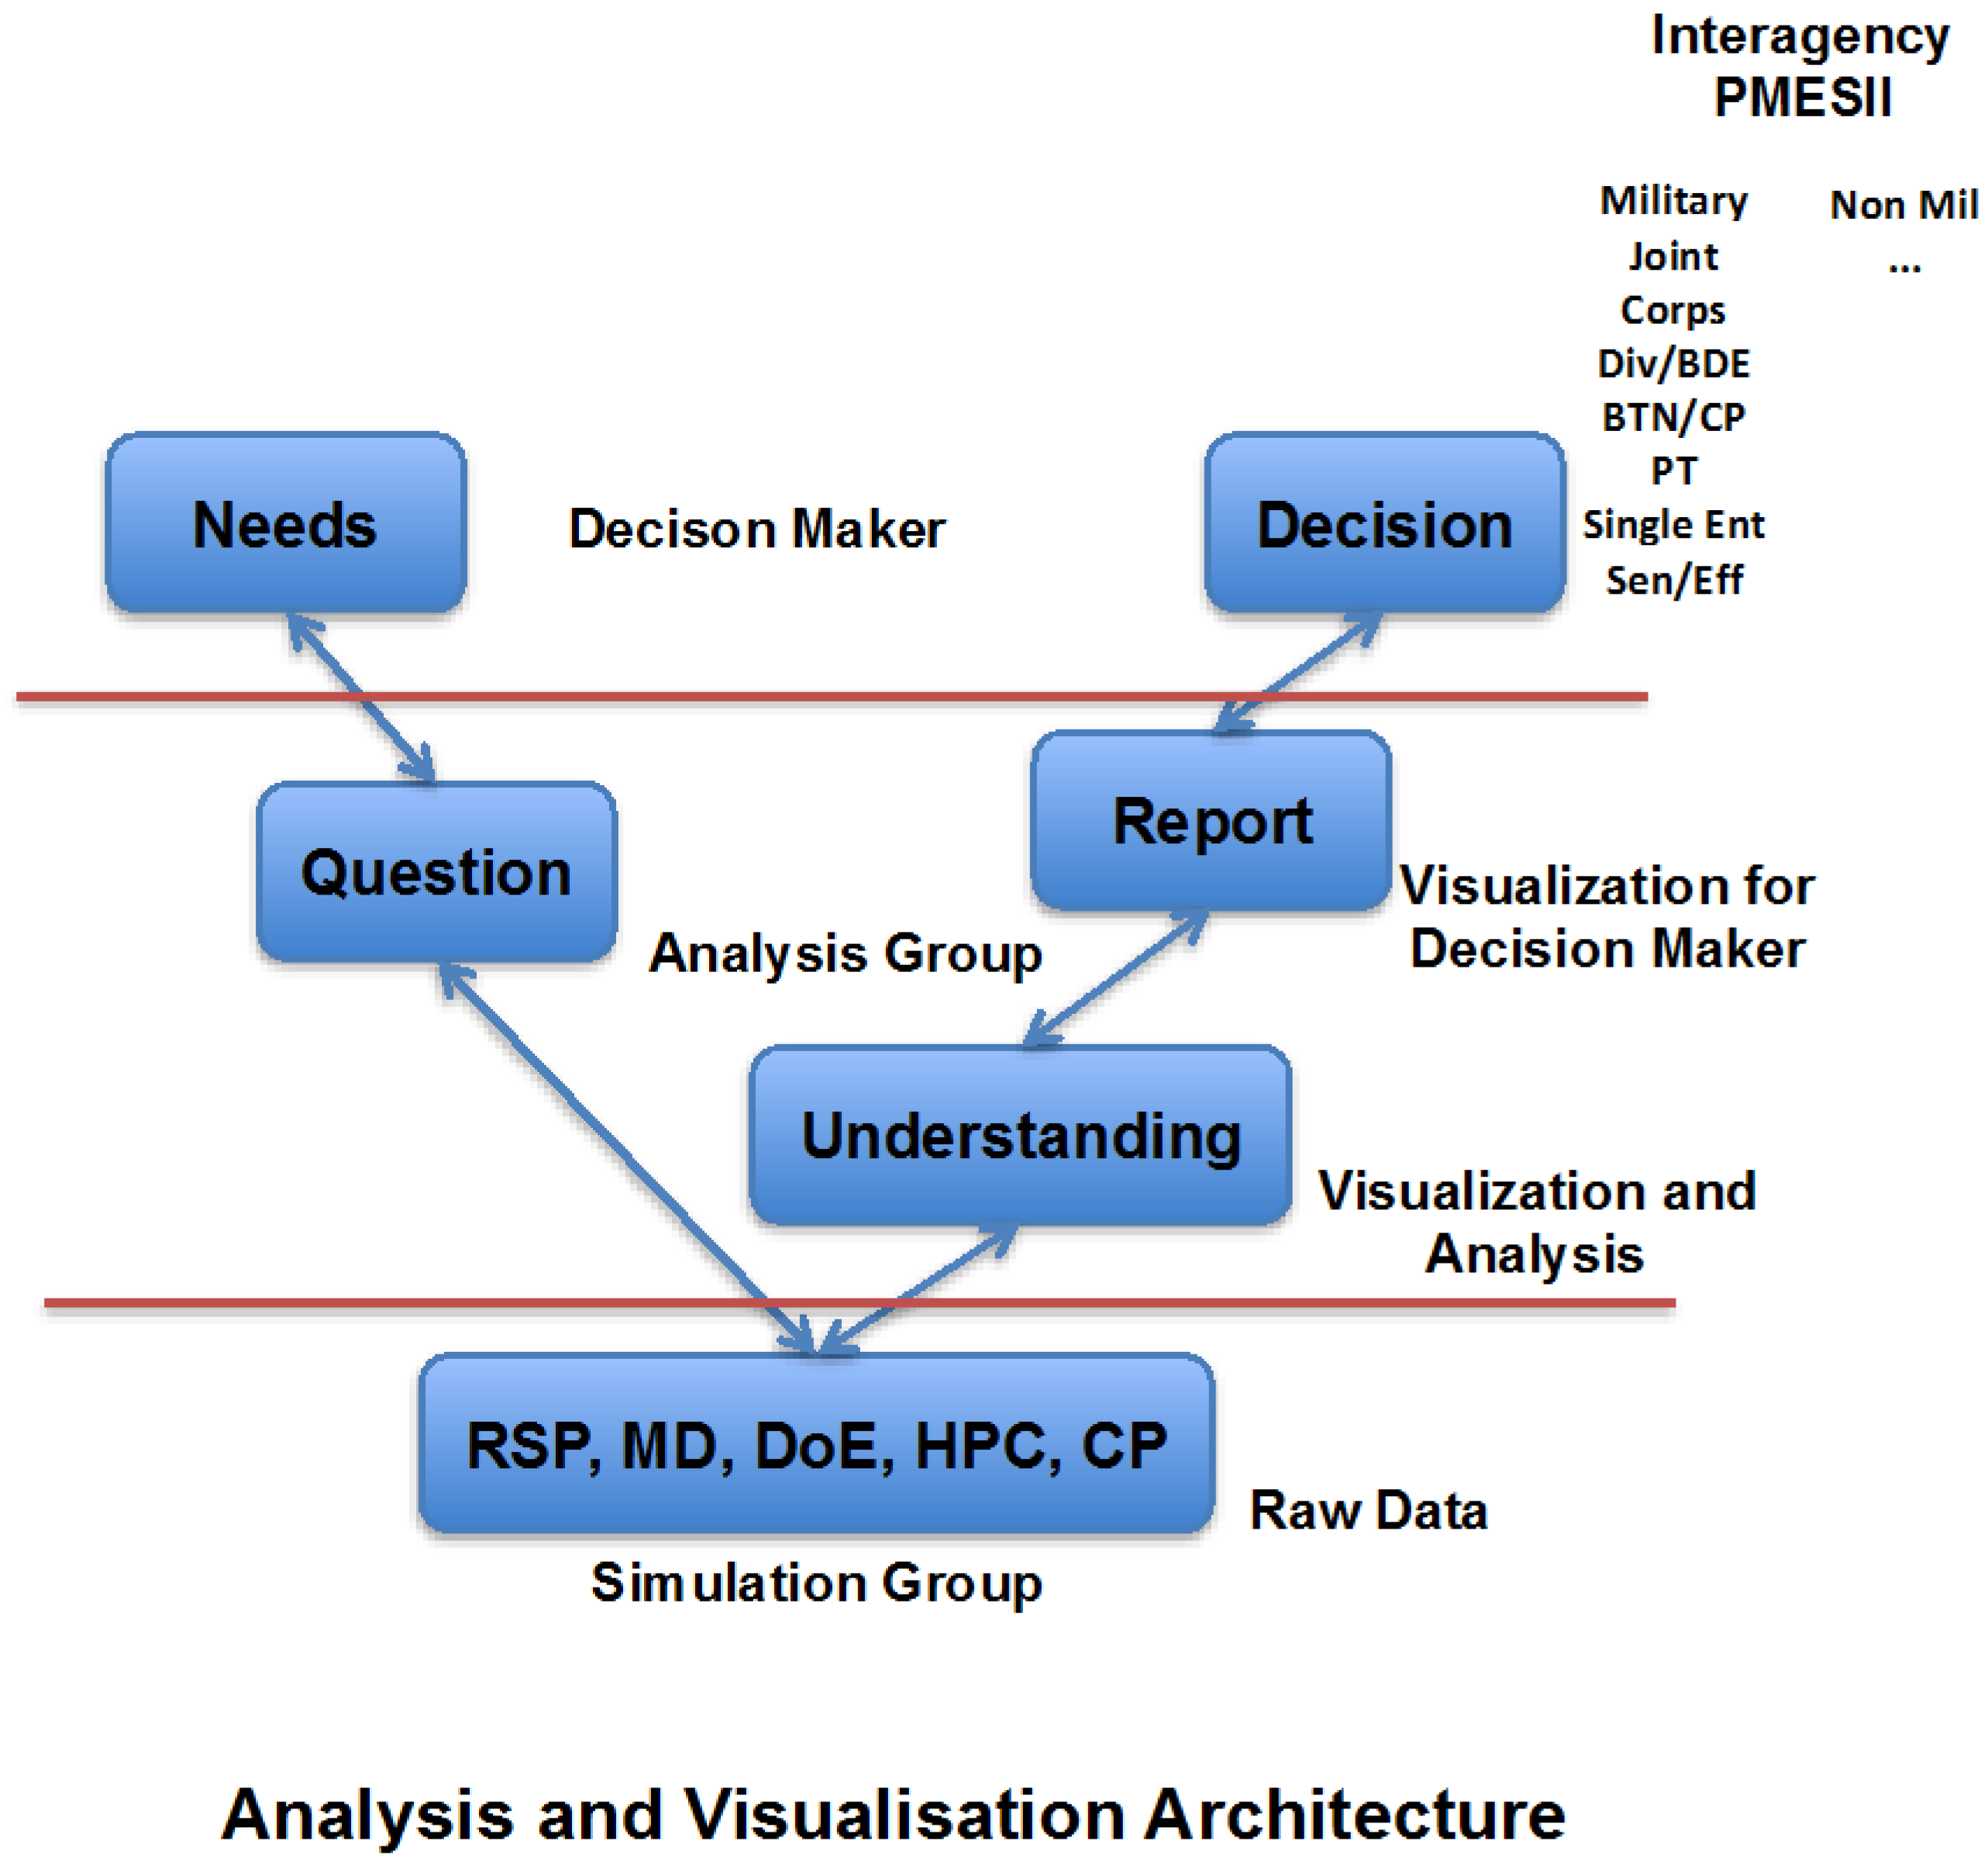
In order to exploit the potentially huge data output from the high performance computing execution of the design of experiments, highly effective analysis techniques must be employed. Statistical analysis and visualization can be used to discern whether data has useful, meaningful value and can aid in the translation of data into information useful in making progress in understanding possible answers to the questions at hand. Figure 6 shows an architecture for the three types of stakeholders: decision-makers, modelers and analysts for any level of decision-making. Every stakeholder has his own needs in analysis and visualization and finally representation of the data output.
Visualization consists of analyzing the simulation output data using appropriate techniques as well as presenting the results to the decision-making authorities. Even with a smart design of experiments, simulation experiments can create huge volumes of multi-dimensional data that require sophisticated data analysis and visualization techniques.
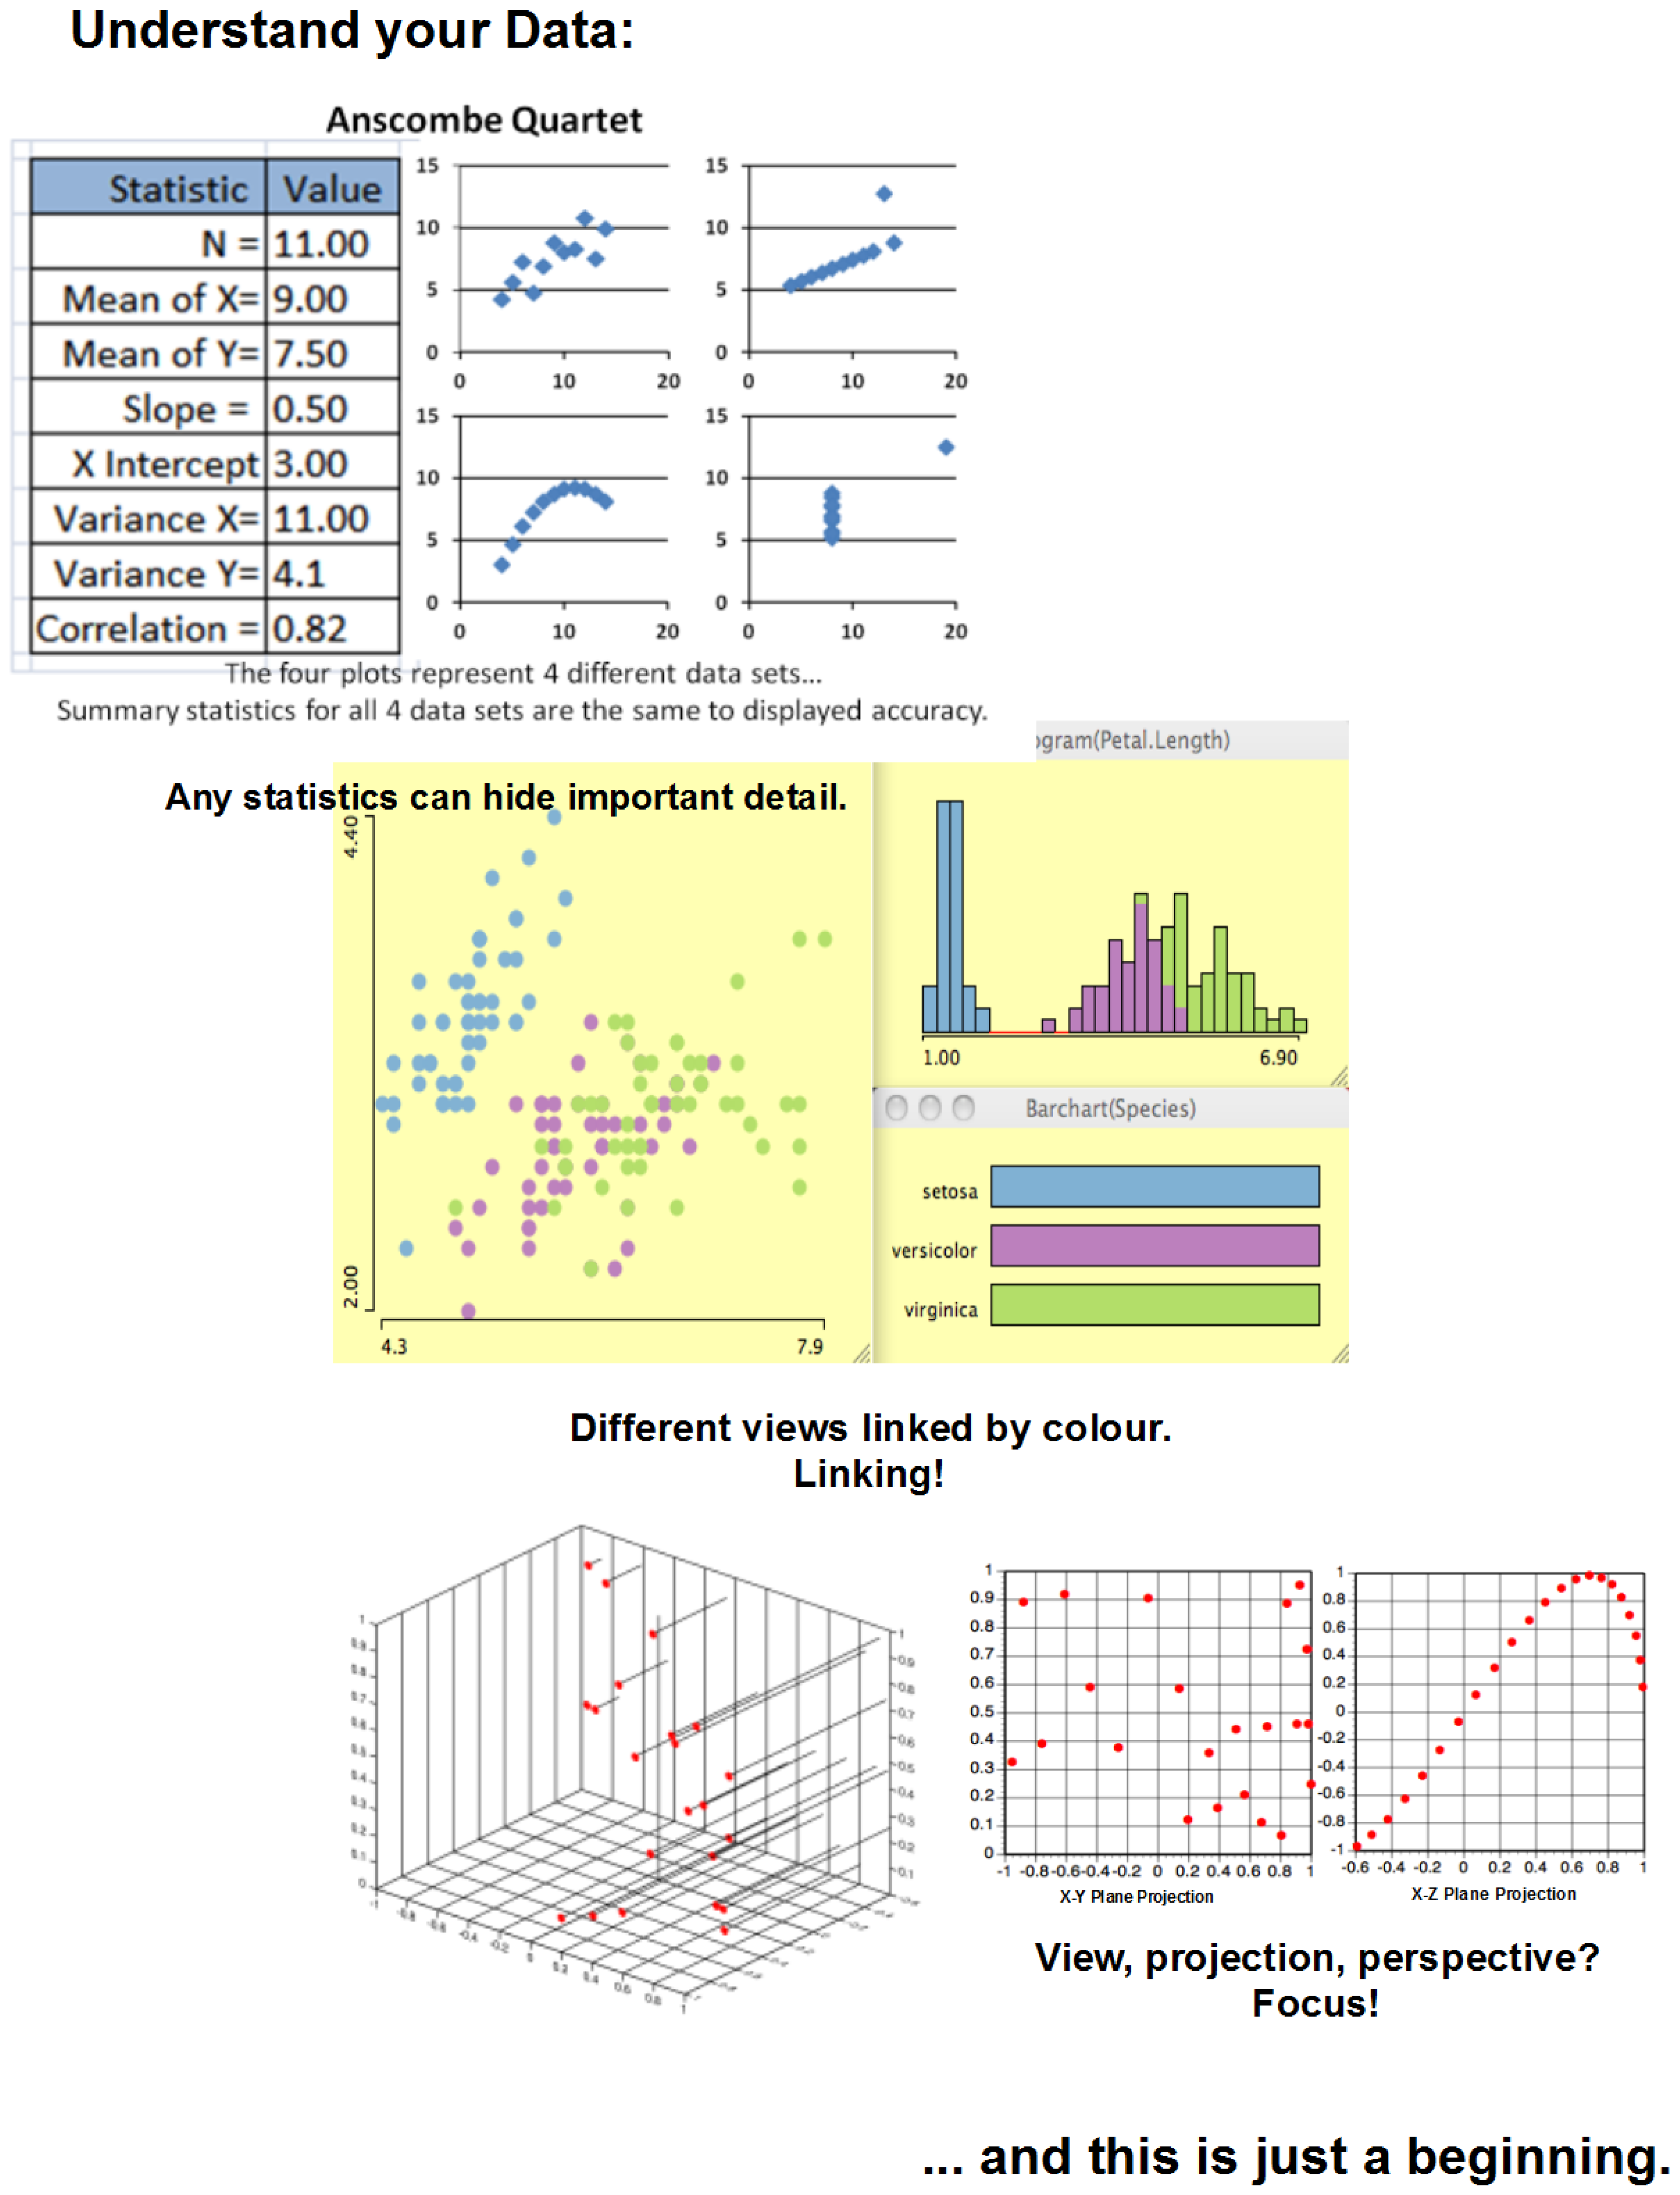
The ability to use multiple techniques gives us the ability to explore, investigate, and answer the questions posed. Every technique has strengths and limitations; therefore, especially for high-dimensional data sets, use of a family of techniques is preferable to the use of a single technique. The key here is the understanding of the data. Figure 7 shows an example of different views on a data set.
As stated earlier, data farming gives us the ability to map the landscape of possibilities and discover outliers. These outliers should always be considered and only be eliminated for appropriate reasons. Using various analysis and visualization techniques, these outliers can also be investigated as a separate cohort of the data. The full MSG-088 report describes analysis and visualization techniques and technologies that have been used in this pursuit of both examination of the full landscape of possibilities as well as discovering the surprises that can often lead to important additional support for decision-makers [1]. In addition, the report provides a basic strategy for the analysis and visualization of HPC experimental outputs by asking the following top ten questions (to ask with reference to the experimental results) and delivers multiple techniques with complementary capabilities to answer these questions.
- Question 1: What was the spread of the responses over the entire experiment?
- Question 2: How much random variation was observed just over the random replications?
- Question 3: Were there any outliers?
- Question 4: Were the responses correlated?
- Question 5: Which factors were most influential?
- Question 6: Were there any significant interactions?
- Question 7: What were the interesting regions and threshold values?
- Question 8: Are any of your results counter-intuitive?
- Question 9: Which configurations were most robust?
- Question 10: Are there any configurations that satisfy multiple objectives?
8. Collaboration
The spirit of collaboration is the key tenet of data farming. It underlies the loop of loops in Figure 2 and holds within it much of the power of data farming. Throughout the development of data farming and the formation of the data farming community, people from all attending nations have openly shared experiences and expertise. One focus for collaborative efforts has been and continues to be the international workshops. The first international workshop took place in 1999 at the Maui High Performance Computing Center. The first 4 workshops were methodology driven, dealing with complex adaptive systems modeling and agent based representation, with statistical experiment design and experiment evaluation. The subsequent workshops were application driven; contributions to the overall advancement of data farming took place in the development of simulation models, scenarios within the models, and computer clusters to run the models an audacious number of times.
The real work is in making progress on important questions and the real secret is the combination of military subject matter experts and highly knowledgeable and multi-disciplinary scientists. This special mix of personnel has been the hallmark of the international workshops and this mix has promoted much networking opportunity. It has been a dynamic combination to have data farming work teams headed up by a person who really knows and cares about the question (e.g., a military officer who knows that the answers may have an impact on both mission success and lowering casualties) and supported by men and women with technical prowess who can leverage the tools available.
The collaboration subgroup of MSG-088 documented the following aspects of the collaborative processes in data farming: defining the characteristics and dimensions of collaboration in data farming, collaboration within and between the realms in data farming, collaboration of the people, collaboration of the data farming results, application of collaboration tools. This information can be found in the full report as well as information on the current status of data farming in the attending nations and ideas about the future development of data farming [1].
9. Humanitarian Assistance/Disaster Relief Case Study
Trends and current military missions ask for new capabilities. Modeling and simulation (M&S) makes an essential contribution to support military decision-makers when developing and evaluating conceptual fundamentals regarding tactical and operational proceedings. In that context, the NATO Modeling and Simulation Group MSG-88 conducted case studies to illustrate the benefits of the experimentation method data farming. In the case study Humanitarian Assistance/Disaster Relief, the simulation model Sandis, which was developed by the Finnish Defence Forces Technical Research Centre, was used in conjunction with the data farming process to explore medical logistics and casualty evacuation questions for an earthquake scenario in a coastal region. Data farming was used here as an analysis process, where thousands of simulations were conducted to test a variety of potential improvement ideas for practices as well as resources.
The following questions were explored in this case study:
- How do the distribution of medical resources and evacuation chains affect the loss of life?
- Where can the response be improved and where are the bottlenecks?
- What are the probability distributions for different triage classes over time under various conditions?
- What are the effects of changes in coordination, capacity, and resource distribution on triage classes/loss of life?
- How would better allocation of transportation resources affect the performance measures?
- What if improved ship-to-shore assets are available? What are the implications regarding this greater capacity on coordination, evacuation/treatment, and kinds of resources available?
As documented in the full MSG-088 report, the six realms of data farming were employed and allowed for an exploration of these questions. Medical facilities were embarked on ships and different courses of action and many alternatives were simulated in a joint NATO environment in response to the casualties caused by the earthquake. Variables included the number and capacity of treatment facilities (ships, hospitals, collection points), the arrival times of the ships, the capacity of transports to ships, and the speed of ground transportation. Nine different iterations of the data farming multi-execution loop were performed in the course of the work, which together included simulations of thousands of alternatives.
The remaining details are in the final MSG-088 report, but the basic conclusion was that data farming is a good process to model highly variable HA/DR situations and test a wide variety of potential improvement ideas for practices as well as resources. This capability may be quite useful as several large recent disasters have demonstrated that significant improvement is needed in HA/DR planning and procedures, e.g., transporting aid to Haiti following the 2010 earthquake. NATO, with its common role as a coordinating agency, is in a position to make a significant impact in HA/DR practice and data farming may be quite useful in this regard [1].
10. Force Protection Case Study
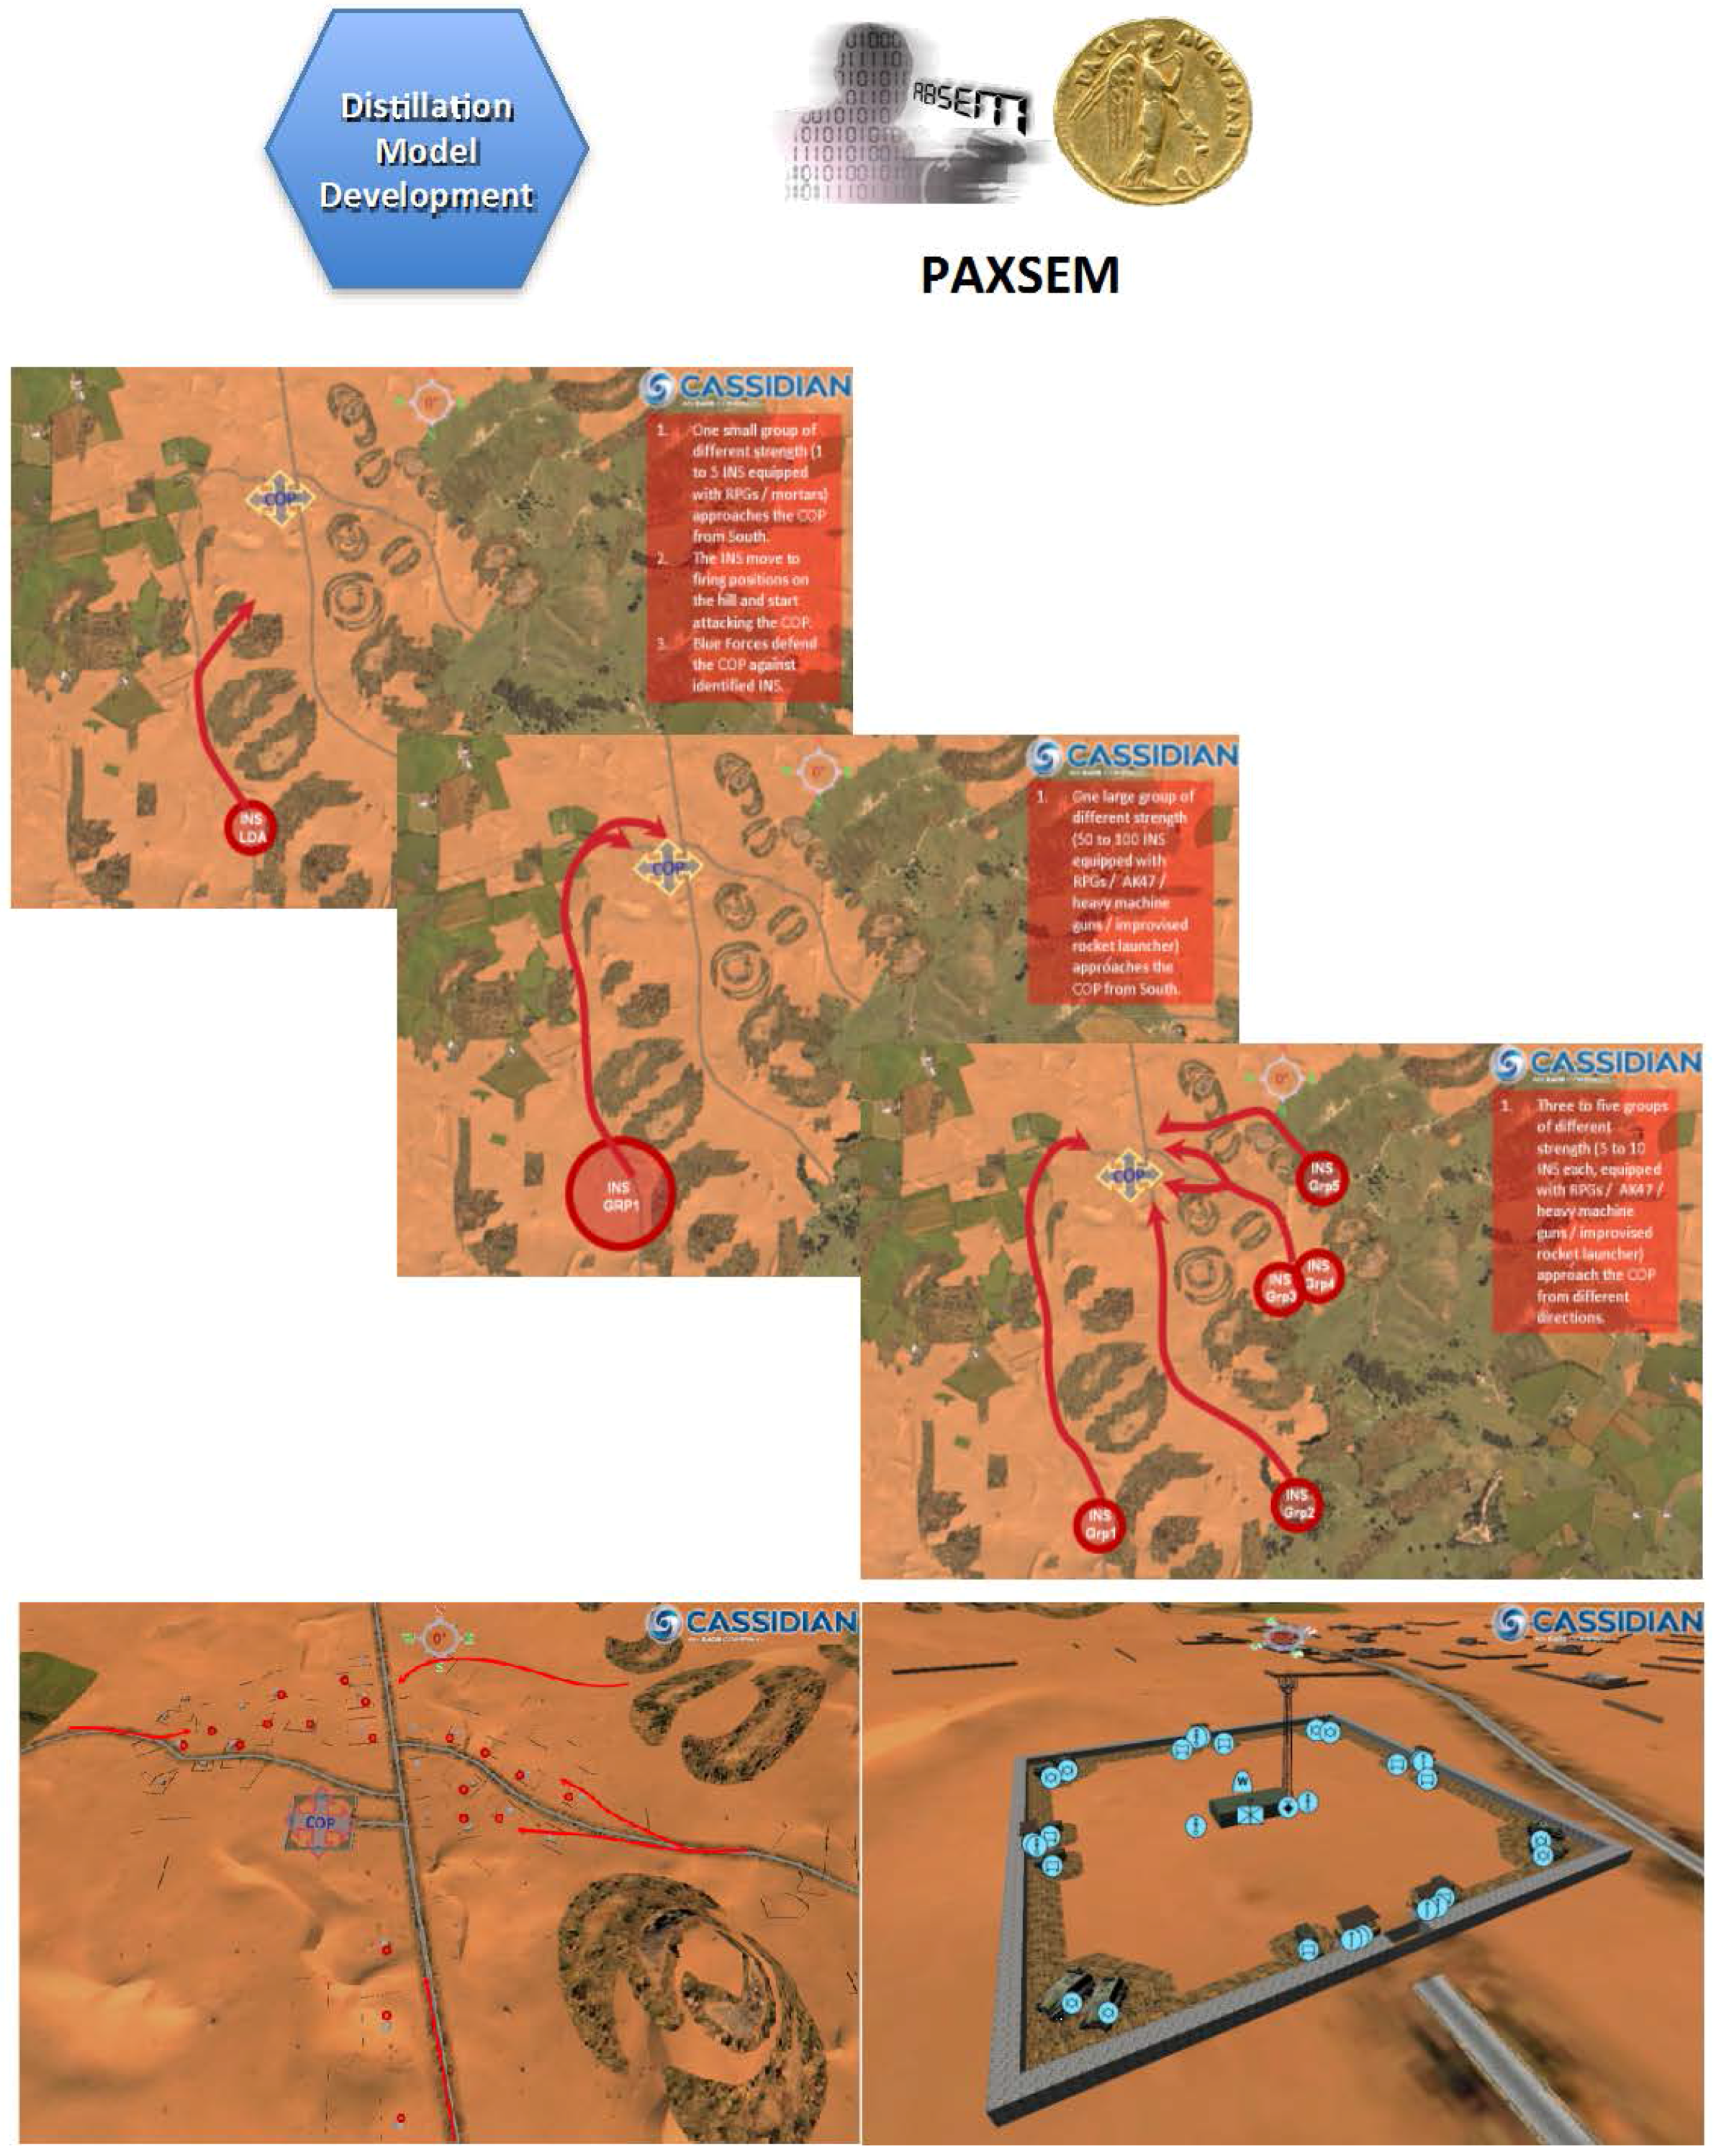
A second case study allowed for the examination of questions in the area of Force Protection. In this case study, the agent-based simulation model PAXSEM, which was developed for the Bundeswehr to support procurement and answering operational questions, was used in conjunction with the data farming process to find a robust configuration of a combat outpost in different kinds of threat scenarios. Figure 8 sketches the modeling part in PAXSEM: Model adaptations and improvements were made to meet the question base. Different scenario settings are depicted. The necessary systems and behaviors were embedded into the model.
Data farming was used here and thousands of simulations were conducted to check assumptions, to gain new insights, and to obtain more robust statements on opportunities and risks of specific combat outpost configurations.
This case study, also documented in [10], shows a successful implementation of the data farming process for a realistic operational question set to support operational decision-making in an Armed Forces Staff. The work was comprised of an integrated team of subject matter experts with experience and specific knowledge in the fields of modeling and simulation, design of experiments and military operations.
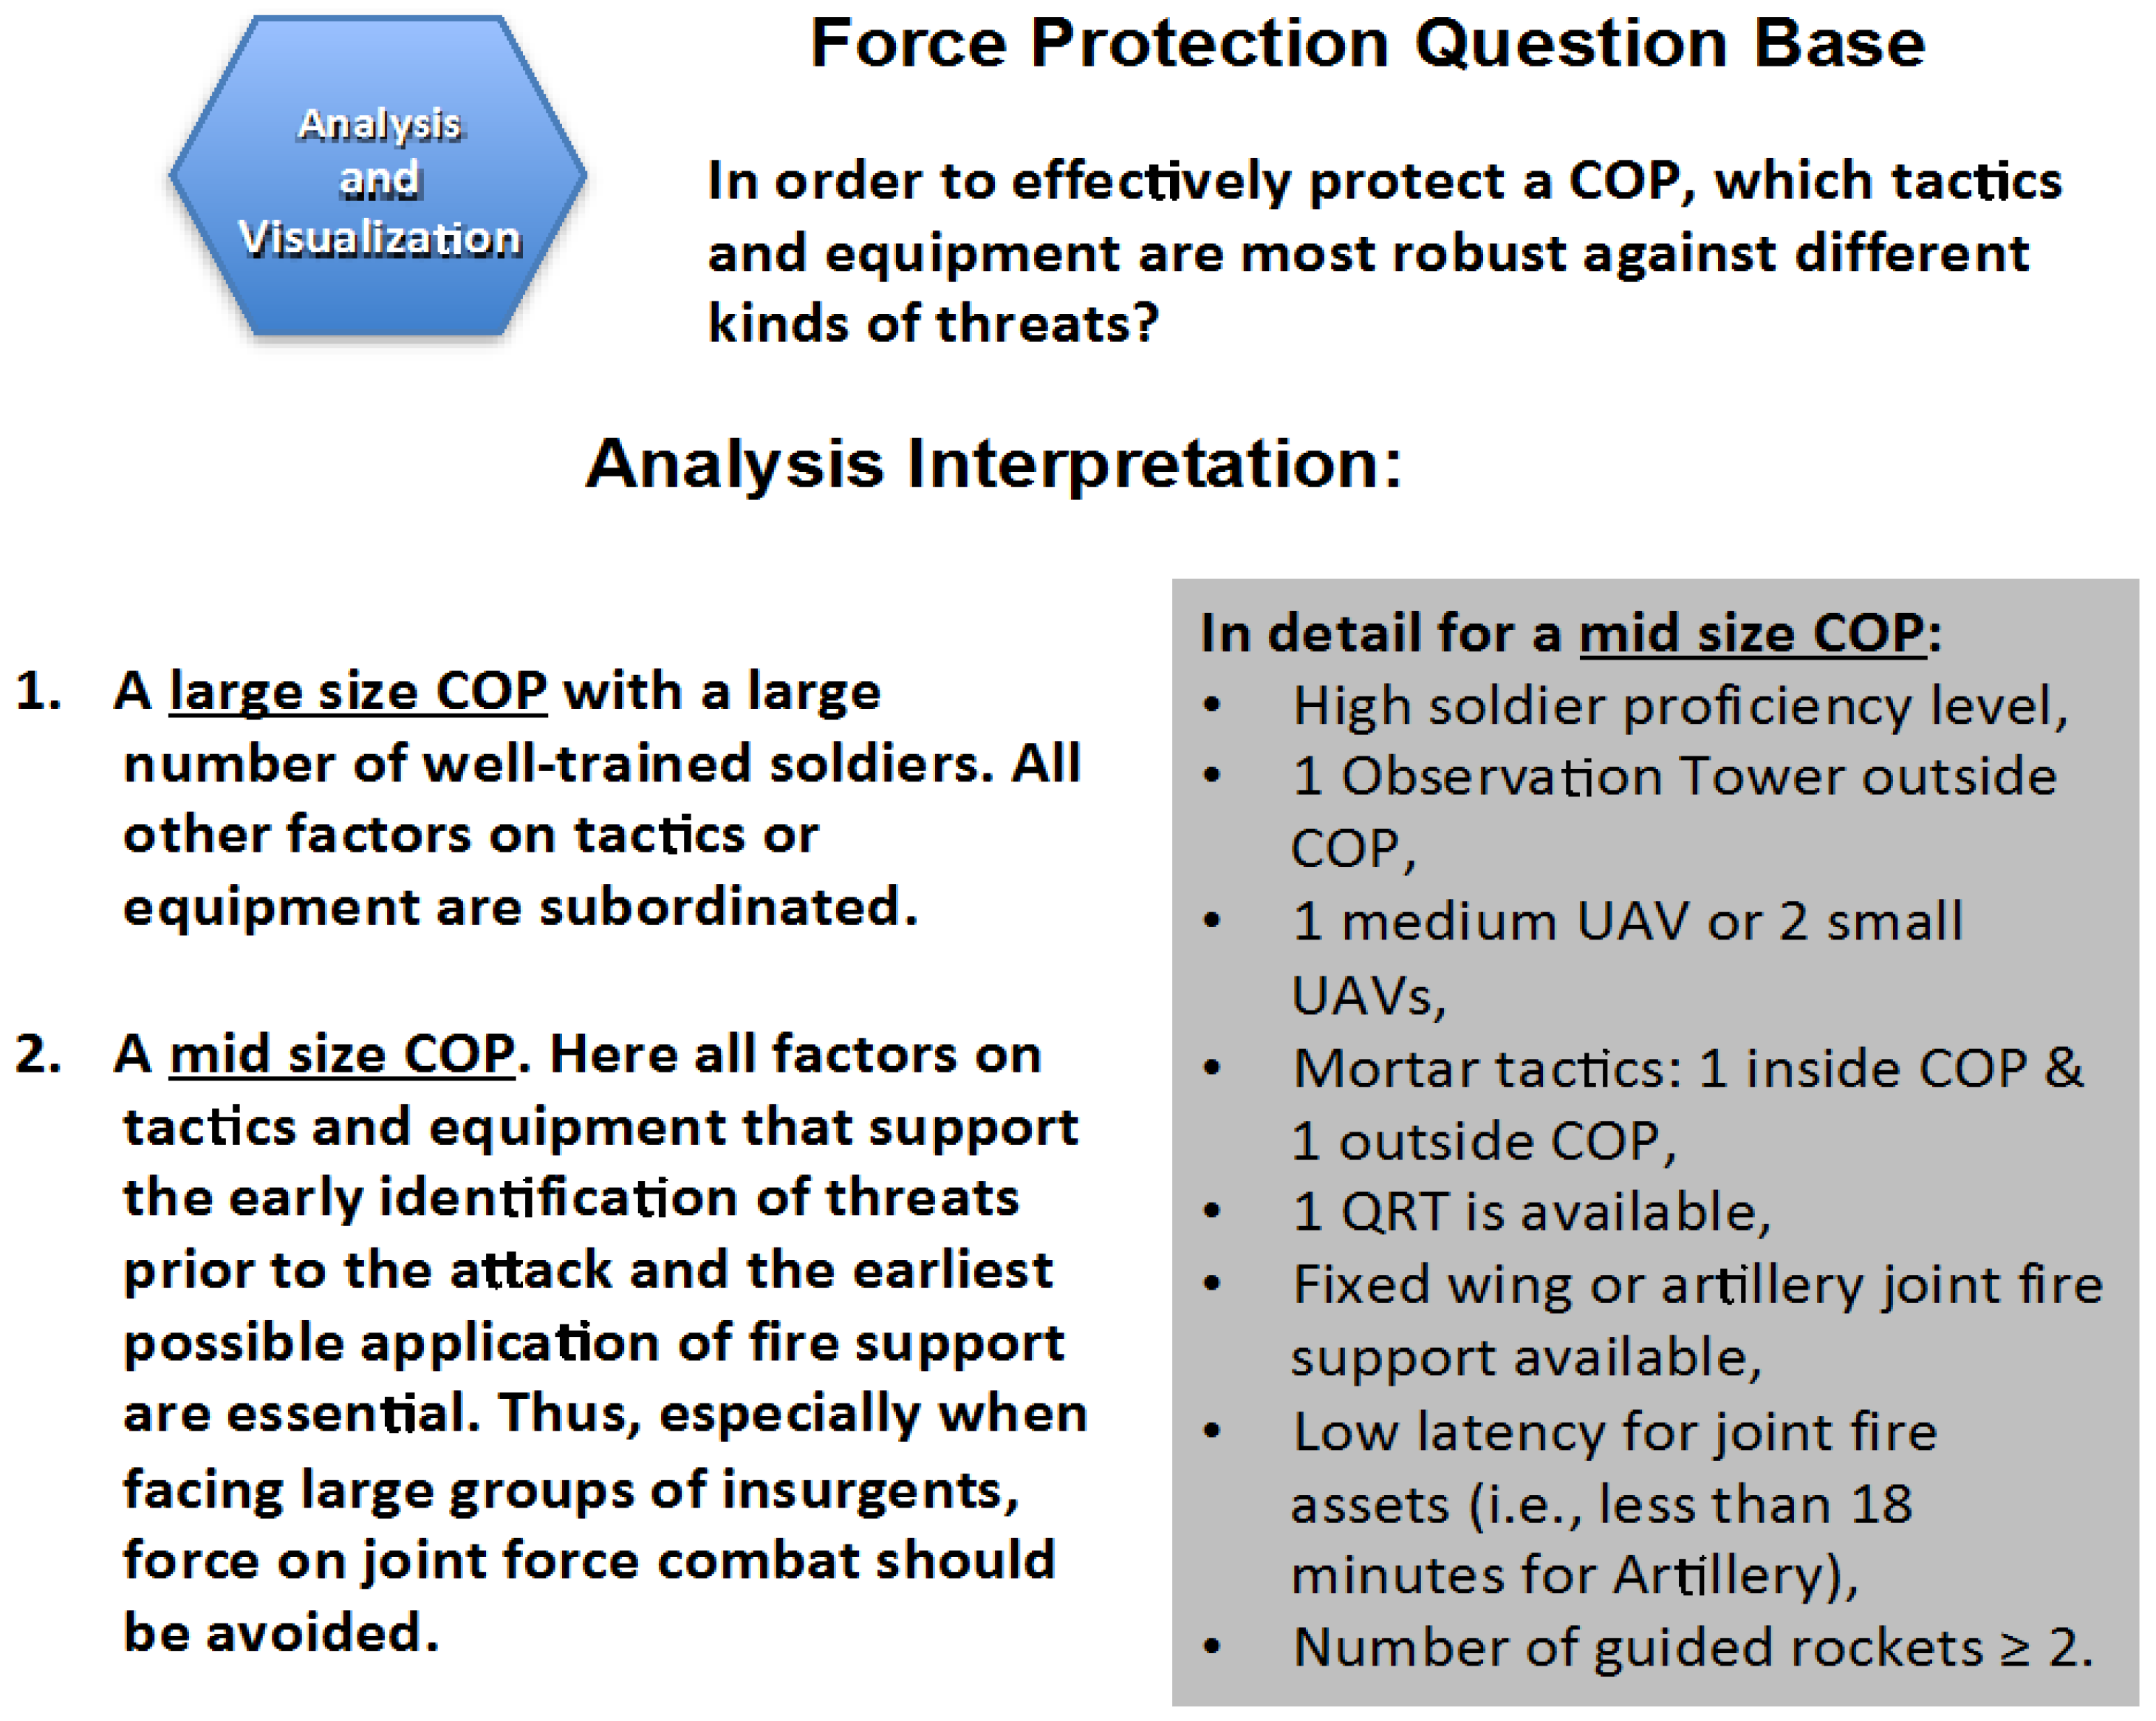
The overall question was “In order to effectively protect a Combat Outpost (COP), which tactics/equipment are most robust against different kinds of threats?” This question was answered via the analysis of the results of a large number of simulated configurations in a tactical scenario that develops over time. The relevant input parameters as well as the necessary measurements of effectiveness were determined and a newly developed experimental design helped to decrease the overall number of possible configurations to a manageable size. Within the given parameter ranges of all possible COP configurations, two different classes of COP configurations were identified to be effectively robust against the different kinds of threats. Figure 9 is an overview of these results.
Overall, all six realms of data farming were integrated: collaborative processes, rapid scenario prototyping, model development, high performance computing, design of experiments, and data analysis and visualization, showing the possibilities as well as the limitations of this approach. This case study also supports our recommendation to military leaders to consider the support of data farming analyses for their decisions [1].
Acknowledgments
This article was created on the basis of work completed by Task Group MSG-088 ” Data Farming in Support of NATO” which is currently being applied in MSG-124 “Developing Actionable Data Farming Decision Support for NATO” of the Science and Technology Organization, North Atlantic Treaty Organization (STO NATO). In particular, we would like to acknowledge the authors of the final report of MSG-088, on which this paper is based.
Author Contributions
Gary Horne coined the term Data Farming in 1997, has led the data farming community including directing Project Albert (under US congressional funds for 8 years) and the 30 workshops that have taken place since then. He chaired MSG-088, the recently completed NATO task group which codified the data farming methodology. Klaus-Peter Schwierz participated with many of his colleagues of his advisory active department for the Federal Armed Forces of Germany on this task group and many other data farming efforts since the year 1999. This paper is the joint effort of both authors who have collaborated a great deal over the years. These collaborative efforts includes the development of the methodology and presenting the research in international conferences (i.e., Winter Sim Conferences and NATO Modeling and Simulation Conferences) and presenting Data Farming for Newcomers on many occasions which describes the history and illustrates the methods of data farming, most recently presented at International What-if? Workshop 30 in Catania, Italy on 8 February 2016.
Conflicts of Interest
Original copyrighted material resides in NATO MSG-088.
References and Notes
- Horne, G.; Åkesson, B.; Meyer, T.; Anderson, S.; Narayanan, F.; Bottiger, M.; Chong, N.E.; Britton, M.; Ng, K.; Bruun, R.; et al. MSG-088 Data Farming in Support of NATO; Final Report; NATO Science and Technology Office (STO): Paris, France, March 2014. [Google Scholar]
- Horne, G. Data Farming: A Meta-Technique for Research in the 21st Century; Naval War College: Newport, RI, USA, 1997. [Google Scholar]
- Horne, G. Maneuver warfare distillations: Essence not verisimilitude. In Proceedings of the 1999 Winter Simulation Conference, Phoenix, AZ, USA, 5–8 December 1999; Farrington, A., Nembhard, H.B., Sturrock, D.T., Evans, G.W., Eds.; pp. 1147–1151.
- Horne, G.; Leonardi, M. Maneuver Warfare Science 2001; Marine Corps Combat Development Command: Quantico, VA, USA, 2001. [Google Scholar]
- Horne, G.; Meyer, T. Data farming: Discovering Surprise. In Proceedings of the 2004 Winter Simulation Conference, Savannah, GA, USA, 7–10 December 2004; Ingalls, R., Rossetti, M.D., Smith, J.S., Peters, B.A., Eds.; Institute of Electrical and Electronics Engineers, Inc.: Piscataway, NJ, USA; pp. 171–180.
- Horne, G.; Meyer, T. Data farming: Discovering surprise. In Proceedings of the 2005 Winter Simulation Conference, Orlando, FL, USA, 4 December 2005.
- Hoffman, F.; Horne, G. Maneuver Warfare Science; United States Marine Corps Project Albert: Quantico, VA, USA, 1998. [Google Scholar]
- Meyer, T.; Horne, G. Scythe, the Proceedings and Bulletin of the International Data Farming Community. Available online: http://www.datafarming.org (accessed on 1 January 2016).
- Horne, G. MSG-088 Data Farming in Support of NATO. In MSG-088 Program of Work; NATO Research and Technology Office (RTO): Paris, France, 2010. [Google Scholar]
- Horne, G.; Seichter, S. Data Farming Support to NATO: A summary of MSG-088 work. In Proceedings of the MSG-111 Symposium, Paper Number 14, Sydney, Australia, 17 October 2013.
- Seichter, S. MSG-088 Data Farming in Support of NATO: Case Study Force Protection. In Proceedings of the MSG-111 Symposium, Paper Number 17, Sydney, Australia, 18 October 2013.
- University of Bundeswehr, Leitfaden simulationsgestützte Analysen in der Bundeswehr, Code of best practice of simulation based analyses in the German Armed Forces, Institute for Technology of Intelligent Systems, Center of Transformation of the Bundeswehr, Munich, 2011.
- Kallfass, D.; Schlaak, T. NATO MSG-088 Case study results to demonstrate the benefit of using Data Farming for military decision support. In Proceedings of the 2012 Winter Simulation Conference, Berlin, Germany, 9–12 December 2012.
- Sanchez, S.M. Work smarter, not harder: Guidelines for designing simulation experiments. In Proceedings of the 2006 Winter Simulation Conference, Monterey, CA, USA, 3–6 December 2006; Perrone, L.F., Wieland, F.P., Liu, J., Lawson, B.G., Nicol, D.M., Fujimoto, R.M., Eds.; Institute of Electrical and Electronic Engineers, Inc.: Piscataway, NJ, USA; pp. 47–57.
- Choo, C.S.; Chua, C.L.; Low, S.; Ong, D. A co-evolutionary approach for military operational analysis. In Proceedings of the World Summit on Genetic and Evolutionary Computation, Shanghai, China, 12–14 June 2009.
- McCourt, R.; Ng, K. Enhanced network modelling in ABSNEC. In Proceedings of the International Simulation Multi-Conference, Orlando, FL, USA, 11–15 April 2010; pp. 537–544.
- Ng, K.; Rempel, M. ABSNEC—An agent-based system for network enabled capabilities/operations—I. In Proceedings of the International Simulation Multi-Conference, IEEE Catalogue No. CFP0974, Istanbul, Turkey, 13–16 July 2009.
- McCourt, R.; Ng, K.; Mitchell, R. A Canadian approach towards network enabled capabilities. In Proceedings of the International Defence & Homeland Security Simulation Workshop, Rome, Italy, 12–14 September 2011.
- McCourt, R.; Ng, K.; Mitchell, R. An agent based approach towards network-enabled capabilities—I: Simulation validation & illustrative examples. J. Def. Model. Simul. 2012. [Google Scholar] [CrossRef]
- Moradi, F.; Schubert, J. Modelling a simulation-based decision support system for effects-based planning. In Proceedings of the NATO Symposium on Use of M&S in: Support to Operations, Irregular Warfare, Defence Against Terrorism and Coalition Tactical Force Integration (MSG-069), Brussels, Belgium, 15–16 October 2009; NATO Research and Technology Organisation: Neuilly-sur-Seine, France, 2009; pp. 1–14. [Google Scholar]
- Schubert, J.; Moradi, F.; Asadi, H.; Hörling, P.; Sjöberg, E. Simulation-based decision support for effects-based planning. In Proceedings of the 2010 IEEE International Conference on Systems, Man and Cybernetics (SMC 2010), Istanbul, Turkey, 10–13 October 2010; IEEE: Piscataway, NJ, USA, 2010; pp. 636–645. [Google Scholar]
- Schubert, J.; Asadi, H.; Harrysson, F.; Hörling, P.; Kamrani, F.; Kylesten, B.; Linderhed, A.; Moradi, F.; Sjöberg, E. Real-Time Simulation Supporting Effects-Based Planning 2008–2010—Final Report; Swedish Defence Research Agency: Stockholm, Sweden, 2010. [Google Scholar]
- Cioppa, T.M.; Lucas, T.W.; Sanchez, S.M. Military Applications of Agent-based Simulations. In Proceedings of the 2004 Winter Simulation Conference, Washington, DC, USA, 5–8 December 2004; Ingalls, R.G., Rossetti, M.D., Smith, J.S., Peters, B.A., Eds.; Institute for Electrical and Electronic Engineers: Piscataway, NJ, USA, 2004; pp. 171–180. [Google Scholar]
- Kleijnen, J.P.C.; Sanchez, S.M.; Lucas, T.W.; Cioppa, T.M. A user’s guide to the brave new world of designing simulation experiments. Inf. J. Comput. 2005, 17, 263–289. [Google Scholar] [CrossRef] [Green Version]
- Sanchez, S.M. Robust design: Seeking the best of all possible worlds. In Proceedings of the 2000 Winter Simulation Conference, Orlando, FL, USA, 10–13 December 2000; Joines, J.A., Barton, R.R., Kang, K., Fishwick, P.A., Eds.; Institute of Electrical and Electronics Engineers: Piscataway, NJ, USA, 2000; pp. 69–76. [Google Scholar]
- Sanchez, S.M.; Lucas, T.W. A two-phase screening procedure for simulation experiments. In Proceedings of the 2005 Winter Simulation Conference, Orlando, FL, USA, 4–7 December 2005; Kuhl, M.E., Steiger, N.M., Armstrong, F.B., Joines, J.A., Eds.; Institute of Electrical and Electronics Engineers: Piscataway, NJ, USA, 2005; pp. 223–230. [Google Scholar]
- Sanchez, S.M.; Sanchez, P.J. Very large fractional factorial and central composite designs. ACM Trans. Model. Comput. Simul. 2005, 15, 362–377. [Google Scholar] [CrossRef] [Green Version]
- Sanchez, S.M.; Wan, H. Work smarter, not harder: A tutorial on designing and constructing simulation experiments. In Proceedings of the 2012 Winter Simulation Conference, Berlin, Germany, 9–12 December 2012; Laroque, C., Himmelspach, J., Pasupathy, R., Rose, O., Urmacher, A.M., Eds.; Institute of Electrical and Electronics Engineers: Piscataway, NJ, USA, 2012. [Google Scholar]
- Sanchez, S.M.; Moeeni, F.; Sanchez, P.J. So many factors, so little time Simulation experiments in the frequency domain. Int. J. Prod. Econ. 2006, 103, 149–165. [Google Scholar] [CrossRef] [Green Version]
- Sanchez, S.M.; Wan, H.; Lucas, T.W. Two-phase screening procedure for simulation experiments. ACM Trans. Model. Comput. Simul. 2009, 19. [Google Scholar] [CrossRef]
- Sanchez, S.M.; Lucas, T.W.; Sanchez, P.J.; Nannini, C.J.; Wan, H. Designing Large Scale Simulation Experiments, with Applications to Defense and Homeland Security; Hinkelmann, K., Ed.; Wiley: Hoboken, NJ, USA, 2012. [Google Scholar]
- Sanchez, S.M. Better than a petaflop: The power of efficient experimental design. In Proceedings of the 2008 Winter Simulation Conference, Miami, FL, USA, 7–10 December 2008; Hill, R.R., Mönch, L., Rose, O., Jefferson, T., Fowler, J.W., Mason, S.J., Eds.; Institute of Electrical and Electronics Engineers: Piscataway, NJ, USA, 2008; pp. 73–84. [Google Scholar]
- Lucas, T.W.; Sanchez, S.M.; Sanchez, P.J.; Law, A.; Seagren, C.; McDonald, M.L.; Upton, S.C. The Joint Strike Fighter Program’s Integrated Training Center (ITC) Model: Supporting Model Verification and Validation and Improving Analysis; Naval Postgraduate School: Monterey, CA, USA, 2012. [Google Scholar]
- McDonald, M. A Brief Introduction to Analyzing the Result of Data Farming: Top Ten Questions to Ask of Your Experiment Results; Naval Postgraduate School: Monterey, CA, USA, 2010. [Google Scholar]
- Meyer, T.; McDonald, M.; Upton, S.; Middleton, D.; Holland, T.; Lewis, K.; Schaub, H.; Freire, F.; Bouwens, C. Applying social network analysis to data farming of agent-based models. In Proceedings of the International Data Farming Workshop 20, Monterey, CA, USA, March 2010; Naval Postgraduate School: Monterey, CA, USA, 2010. [Google Scholar]
- Meyer, T.; Pfeiffer, V.; Luotsinen, L.; Silwood, N.; Moore, T. Using social network analysis to enhance data farming analysis. In Proceedings of the International Data Farming Workshop 23, Team 6 Outbrief, Riihimäki, Finland, 23 September 2011.
- Meyer, T. Command and control and Project Albert: Red Orm and modeling a common operating picture (COP). In Maneuver Warfare Science; Horne, G., Johnson, S., Eds.; USMC Combat Development Command: Quantico, VA, USA, 2001. [Google Scholar]
- Brandstein, A.; Horne, G. Asymmetric evolutions and revolutions in military analysis. In The Cornwallis Group II: Analysis for and of the Resolution of Conflict, The Canadian Peacekeeping Press of the Lester B; Pearson Canadian International Peacekeeping Training Centre: Cornwallis Park, NS, Canada, 1998. [Google Scholar]
- Henscheid, Z.; Middleton, D.; Bitinas, E. Pythagoras: An Agent-Based Simulation Environment. In Proceedings of the International Data Farming Workshop 13, Scheveningen, The Netherlands, 2006.
- Brandstein, A. Operational synthesis: Supporting the maneuver warrior. In Proceedings of the 2nd Annual Defense Planning & Analysis Society Symposium, Rosslyn, VA, USA, 1999.
- Horne, G.; Schwierz, K. Data Farming Around the World. In Proceedings of the 2008 Winter Simulation Conference, Miami, FL, USA, 7–10 December 2008.
- Horne, G.; Schwierz, K. Data Farming Around the World Overview. In Proceedings of the The Cornwallis Group XIV: Analysis of Societal Conflict and Counter Insurgency, Vienna, Austria, 6–9 April 2009.
- Lawler, M. Data Farming Cultivates New Insights; Signal, International Journal of the Armed Forces Communications and Electronics Association: Fairfax, VA, USA, 2005. [Google Scholar]
- McDonald, M. The use of agent-based modeling and data farming for planning system of systems tests in joint environments. In Proceedings of the 76th Military Operations Research Society Symposium, New London, CT, USA, June 2008.
- McDonald, M. Training Tutorial: A Brief Introduction to Analyzing the Result of Data Farming: Top Ten Questions to Ask of Our Simulation Results. In Presented at MSG-088 Meeting 2, Alexandria, VA, USA, December 2010.
- Meyer, C.; Davis, S. It’s Alive; Ernst and Young Center for Business Innovation: Cambridge, MA, USA, 2003. [Google Scholar]
- Meyer, T. Training Tutorial: Visualization and Data Farming. In Presented at MSG-088 Meeting 2, Alexandria, VA, USA, December 2010.
- Sanchez, S.; Lucas, T. Tutorial: Exploring the World of Agent-based Simulations: Simple models, Complex Analyses. In Proceedings of the 2002 Winter Simulation Conference, San Diego, CA, USA, 8–11 December 2002; Yucesan, E., Chen, C.H., Snowdon, J.L., Charnes, J.M., Eds.; pp. 116–126.
- Sanchez, S. Training Tutorial: Breakthroughs in Simulation Studies: Making Our Models Work for Us. In Presented at MSG-088 Meeting 2, Alexandria, VA, USA, December 2010.
- Schwierz, K. Chronicle of data farming: The story of success. In Proceedings of the IDFW 16, Monterey, CA, USA, July 2008.
- Upton, S. User’s Guide: OldMcData, the Data Farmer, Version 1.0; United States Marine Corps Project Albert: Quantico, VA, USA, 2004. [Google Scholar]
- Choo, C.S.; Ng, E.C.; Ang, C.K.; Chua, C.L. Systematic data farming: An application to a military scenario. In Proceedings of Army Science Conference 2006, Orlando, FL, USA, 27–30 November 2006.
- Vieira, H., Jr.; Sanchez, S.M.; Kienitz, K.H.; Belderrain, M.C.N. Improved efficient, nearly orthogonal, nearly balanced mixed designs. In Proceedings of the 2006 Winter Simulation Conference, Monterey, CA, USA, 3–6 December 2006; Jain, S., Creasey, R.R., Himmelspach, J., White, K.P., Fu, M., Eds.; Institute of Electrical and Electronics Engineers, Inc.: Piscataway, NJ, USA, 2011. [Google Scholar]
- Lappi, E.; Åkesson, B.M.; Mäki, S.; Pajukanta, S.; Stenius, K. A model for simulating medical treatment and evacuation of battle casualties. In Proceedings of the 2nd Nordic Military Analysis Symposium, Stockholm, Sweden, 17–18 November 2008.
- Hämäläinen, J.S. Using Sandis Software Combined with Data Farming to Analyze Evacuation of Casualties from the Battlefield. In the Proceedings of the 4th International Sandis Workshop; Defence Forces Technical Research Centre: Riihimäki, Finland, 2011. [Google Scholar]
- Åkesson, B.; Pettersson, V. Mathematical Modeling and Simulation of Medical Treatment and Evacuation of Battle Casualties. In the Proceedings of the 4th International Sandis Workshop; Defence Forces Technical Research Centre: Riihimäki, Finland, 2011. [Google Scholar]
- Åkesson, B.; Horne, G.; Mässeli, K.; Narayanan, F.; Pakkanen, M.; Shockley, J.; Upton, S.; Yildirim, Z.; Yigit, A. MSG-088 Data farming Case Study on Humanitarian Assistance/Disaster Relief. In the Scythe, Proceedings and Bulletin of the International Data Farming Community, Riihimäki, Finland, March 2012.
- Lappi, E. Computational Methods for Tactical Simulation. Ph.D. Thesis, National Defence University, Helsinki, Finland, 2012. [Google Scholar]
Figure 1.
The 6 realms of data farming around a question base.

Figure 2.
Data farming “loop of loops” [1].
Figure 2.
Data farming “loop of loops” [1].

Figure 3.
Rapid scenario prototyping process [1].
Figure 3.
Rapid scenario prototyping process [1].

Figure 4.
Complete covering and statistical covering of the parameter space. Two simplified representations.
Figure 4.
Complete covering and statistical covering of the parameter space. Two simplified representations.

Figure 5.
Data Farming software, the experiment execution loop, and contributing nations.

Figure 6.
Three types of stakeholders for analysis and visualization of data: decision-makers, modelers, and analysts.
Figure 6.
Three types of stakeholders for analysis and visualization of data: decision-makers, modelers, and analysts.

Figure 7.
Understand your data.

Figure 8.
Screenshots of the force protection scenario.

Figure 9.
Result interpretation for the force protection scenario.

© 2016 by the authors; licensee MDPI, Basel, Switzerland. This article is an open access article distributed under the terms and conditions of the Creative Commons by Attribution (CC-BY) license (http://creativecommons.org/licenses/by/4.0/).
Share and Cite
MDPI and ACS Style
Horne, G.; Schwierz, K.-P. Summary of Data Farming. Axioms 2016, 5, 8. https://doi.org/10.3390/axioms5010008
AMA Style
Horne G, Schwierz K-P. Summary of Data Farming. Axioms. 2016; 5(1):8. https://doi.org/10.3390/axioms5010008
Chicago/Turabian StyleHorne, Gary, and Klaus-Peter Schwierz. 2016. "Summary of Data Farming" Axioms 5, no. 1: 8. https://doi.org/10.3390/axioms5010008
Note that from the first issue of 2016, this journal uses article numbers instead of page numbers. See further details here.