
The Spatial Variation of Dust Particulate Matter Concentrations during Two Icelandic Dust Storms in 2015

 ,
,
Abstract
:
1. Introduction
2. Experiments
2.1. Instrumentation and Measurement Setup
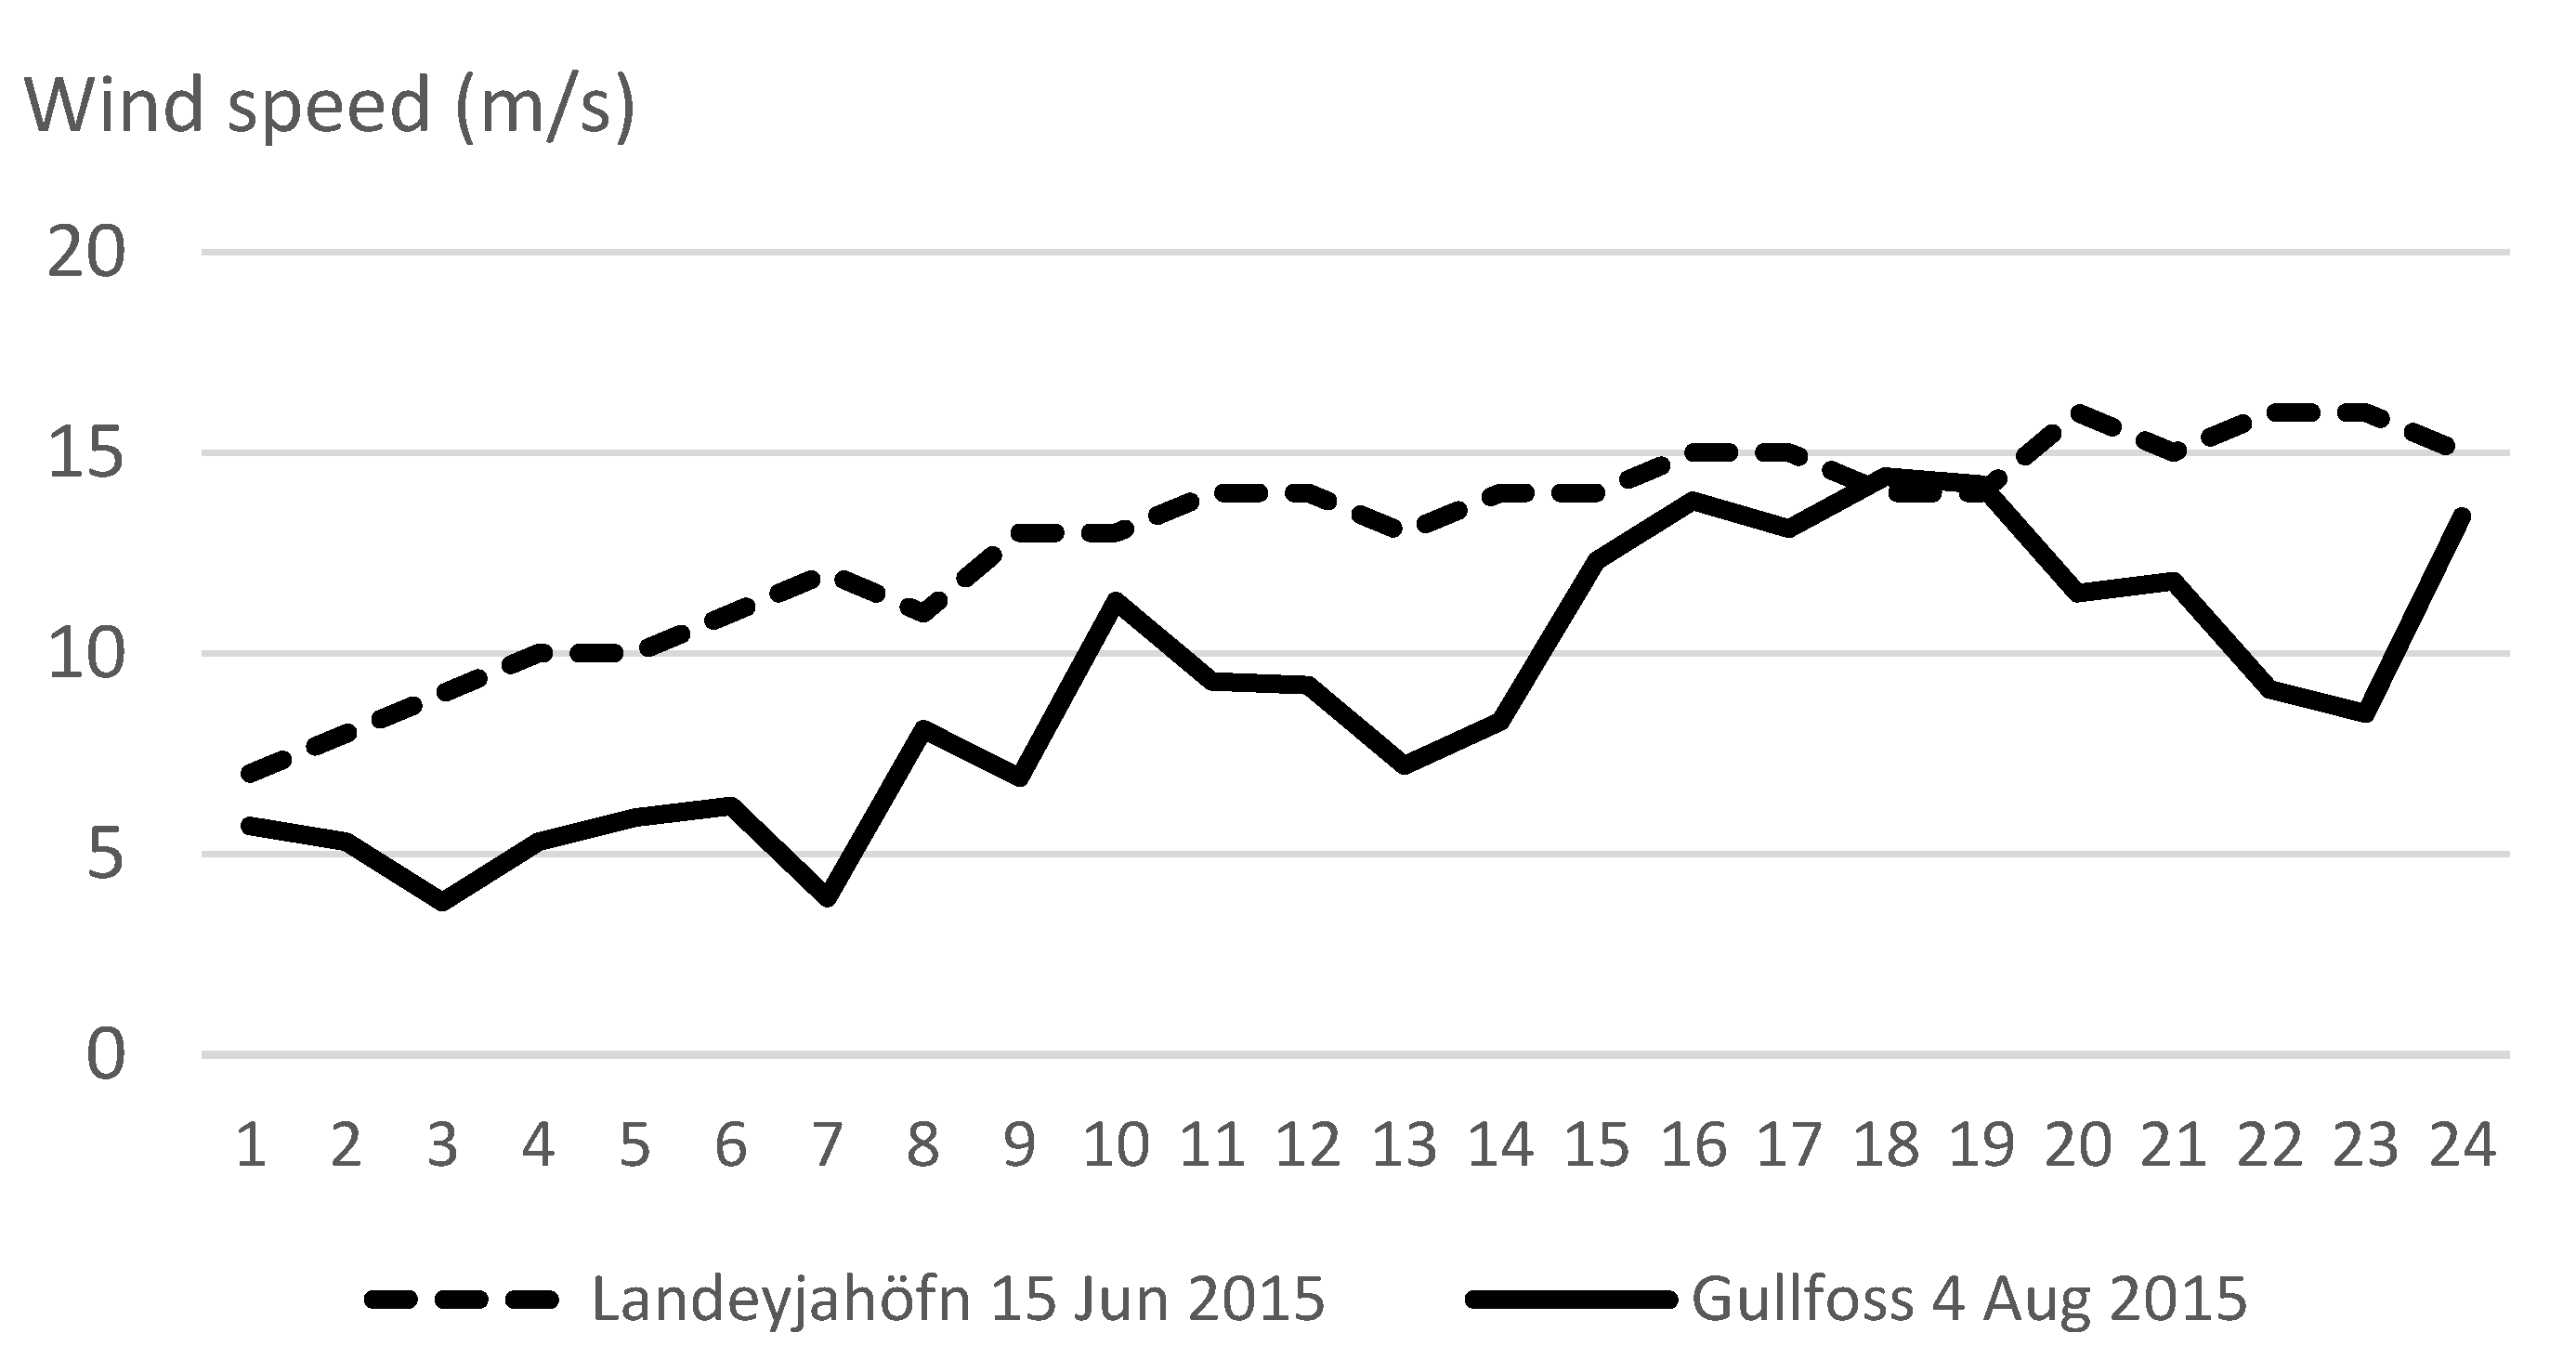
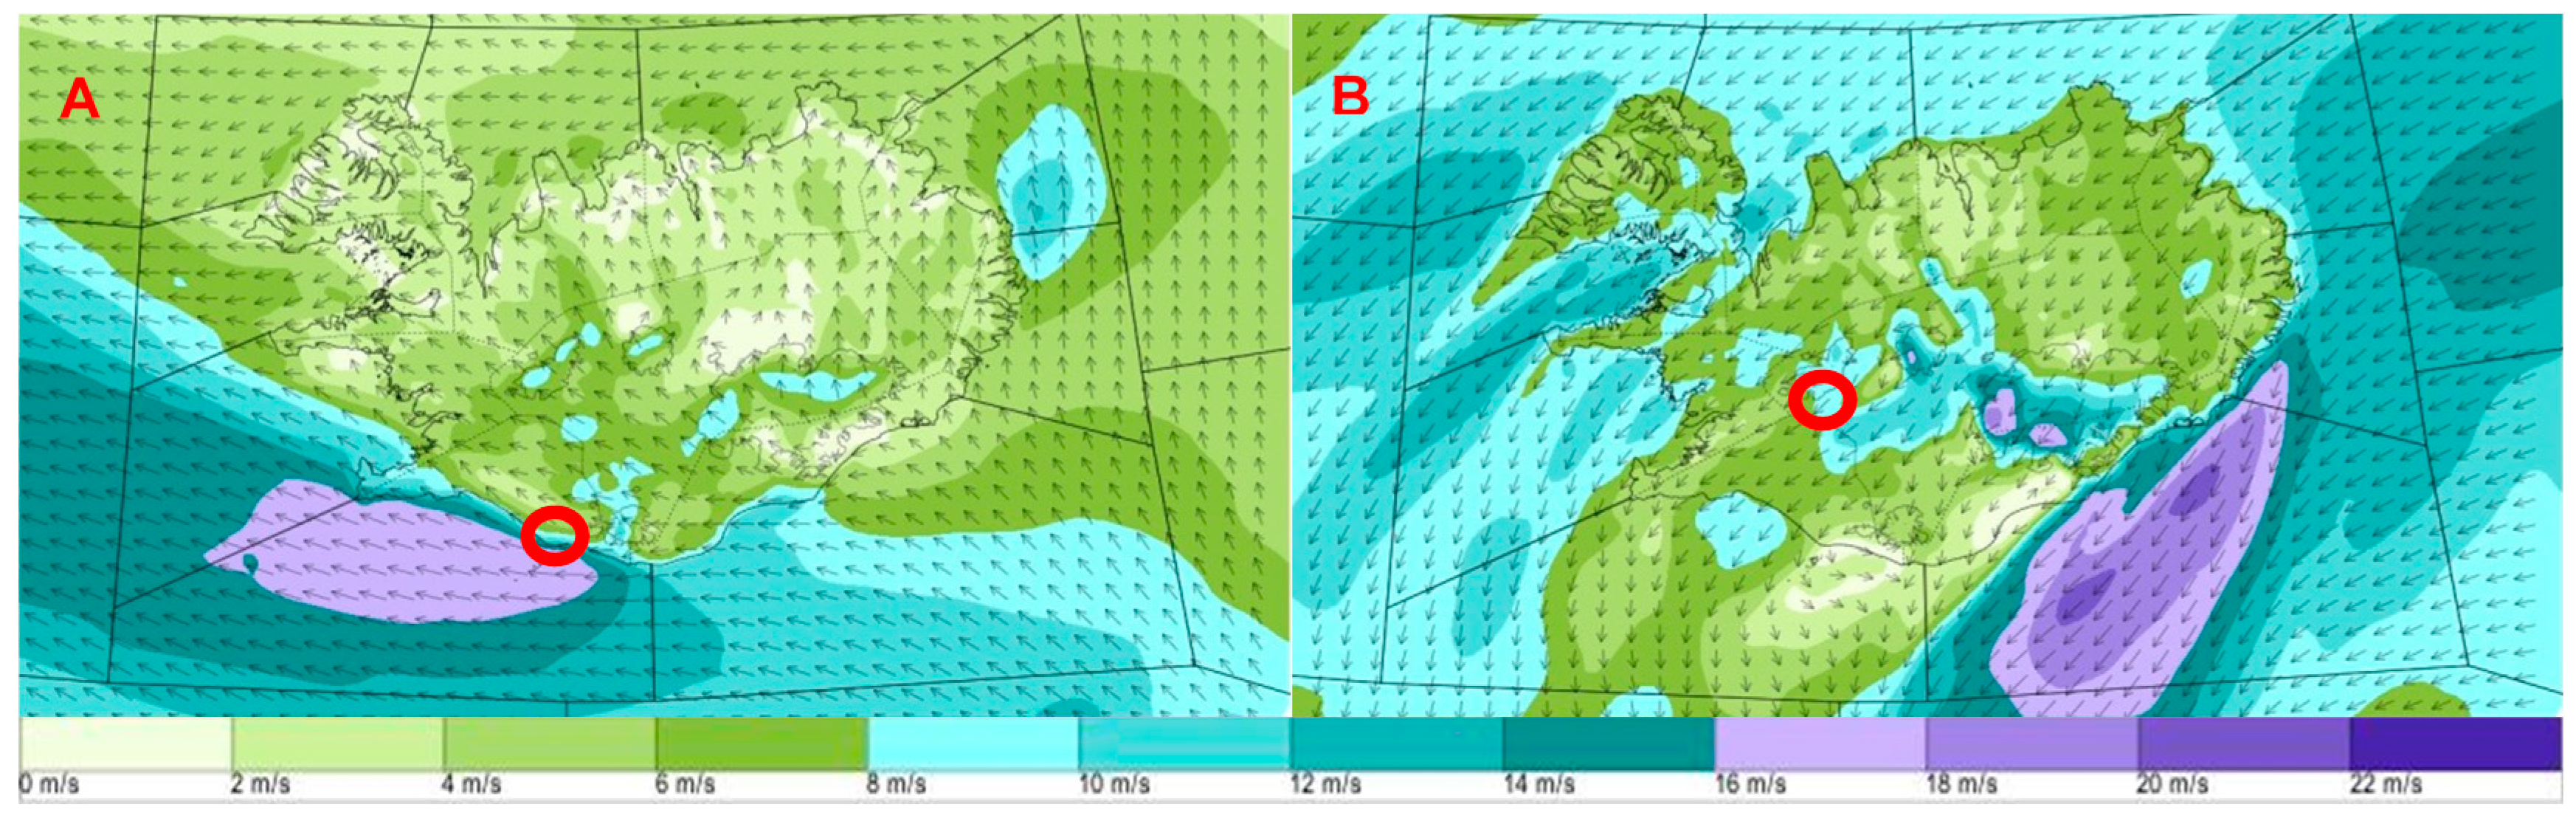
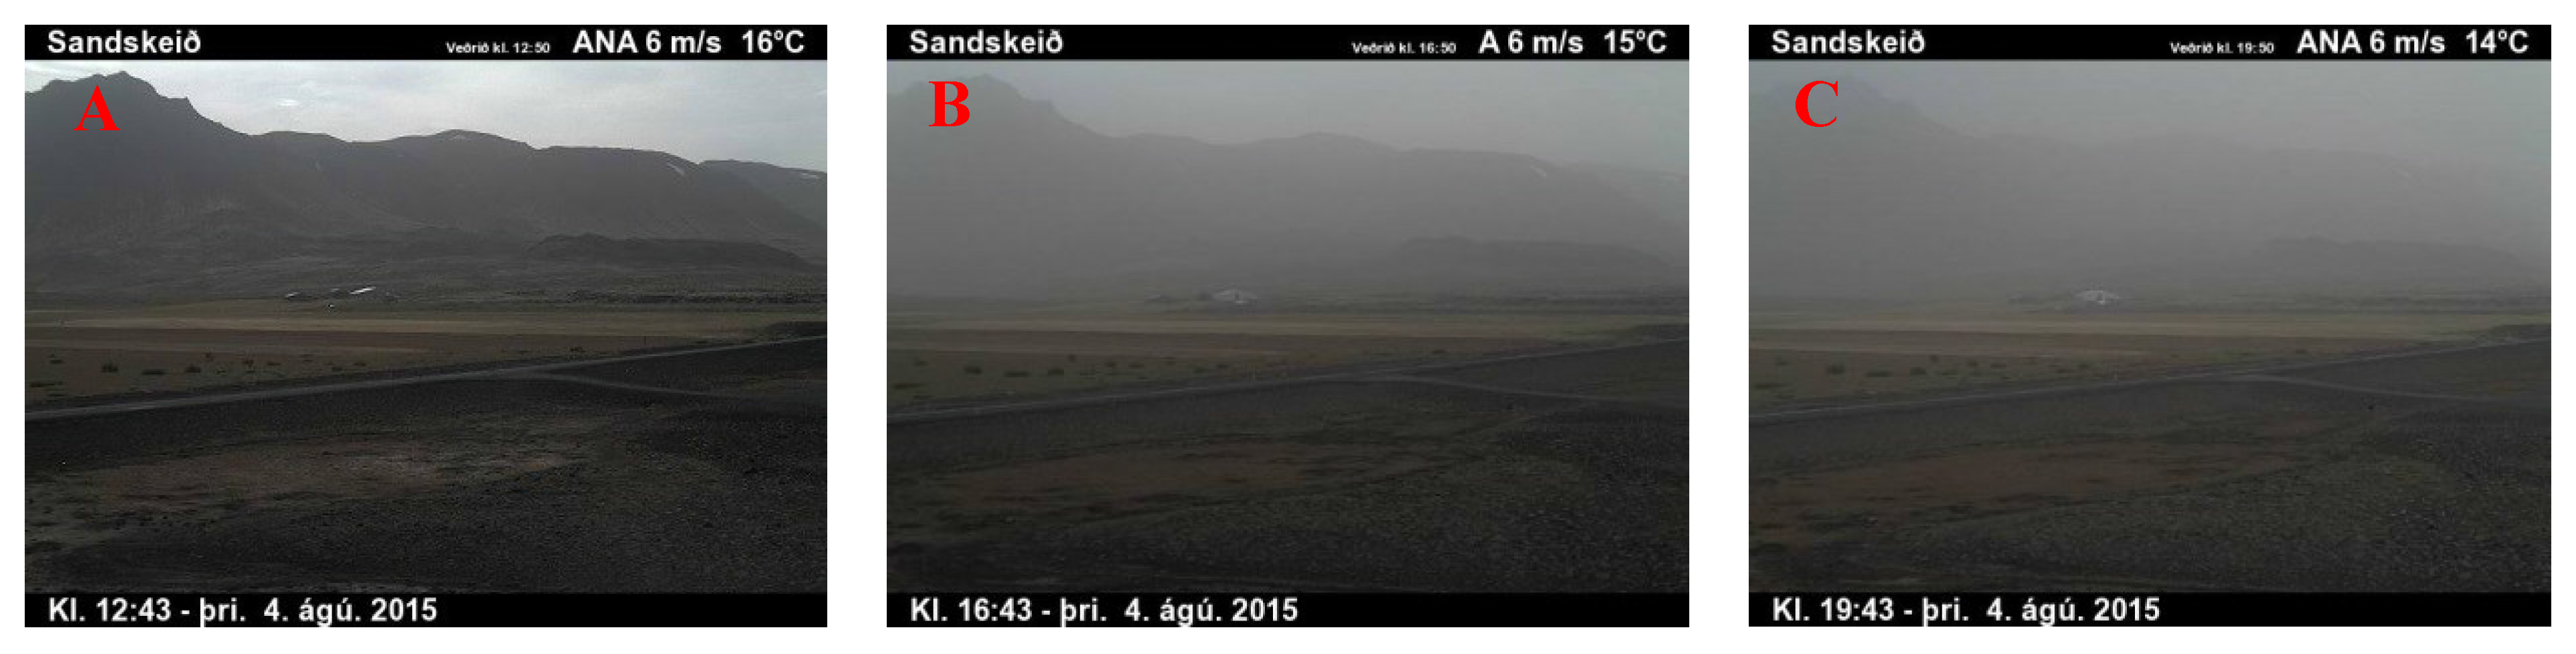
2.2. Meteorological Conditions and Transport of Dust
3. Results and Discussion
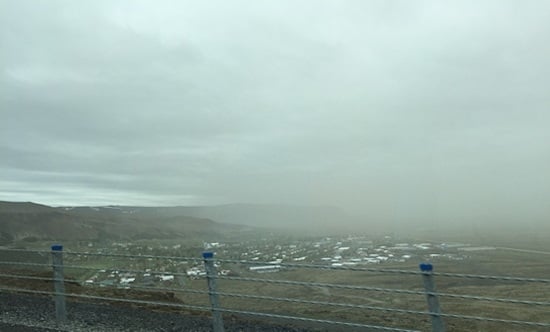
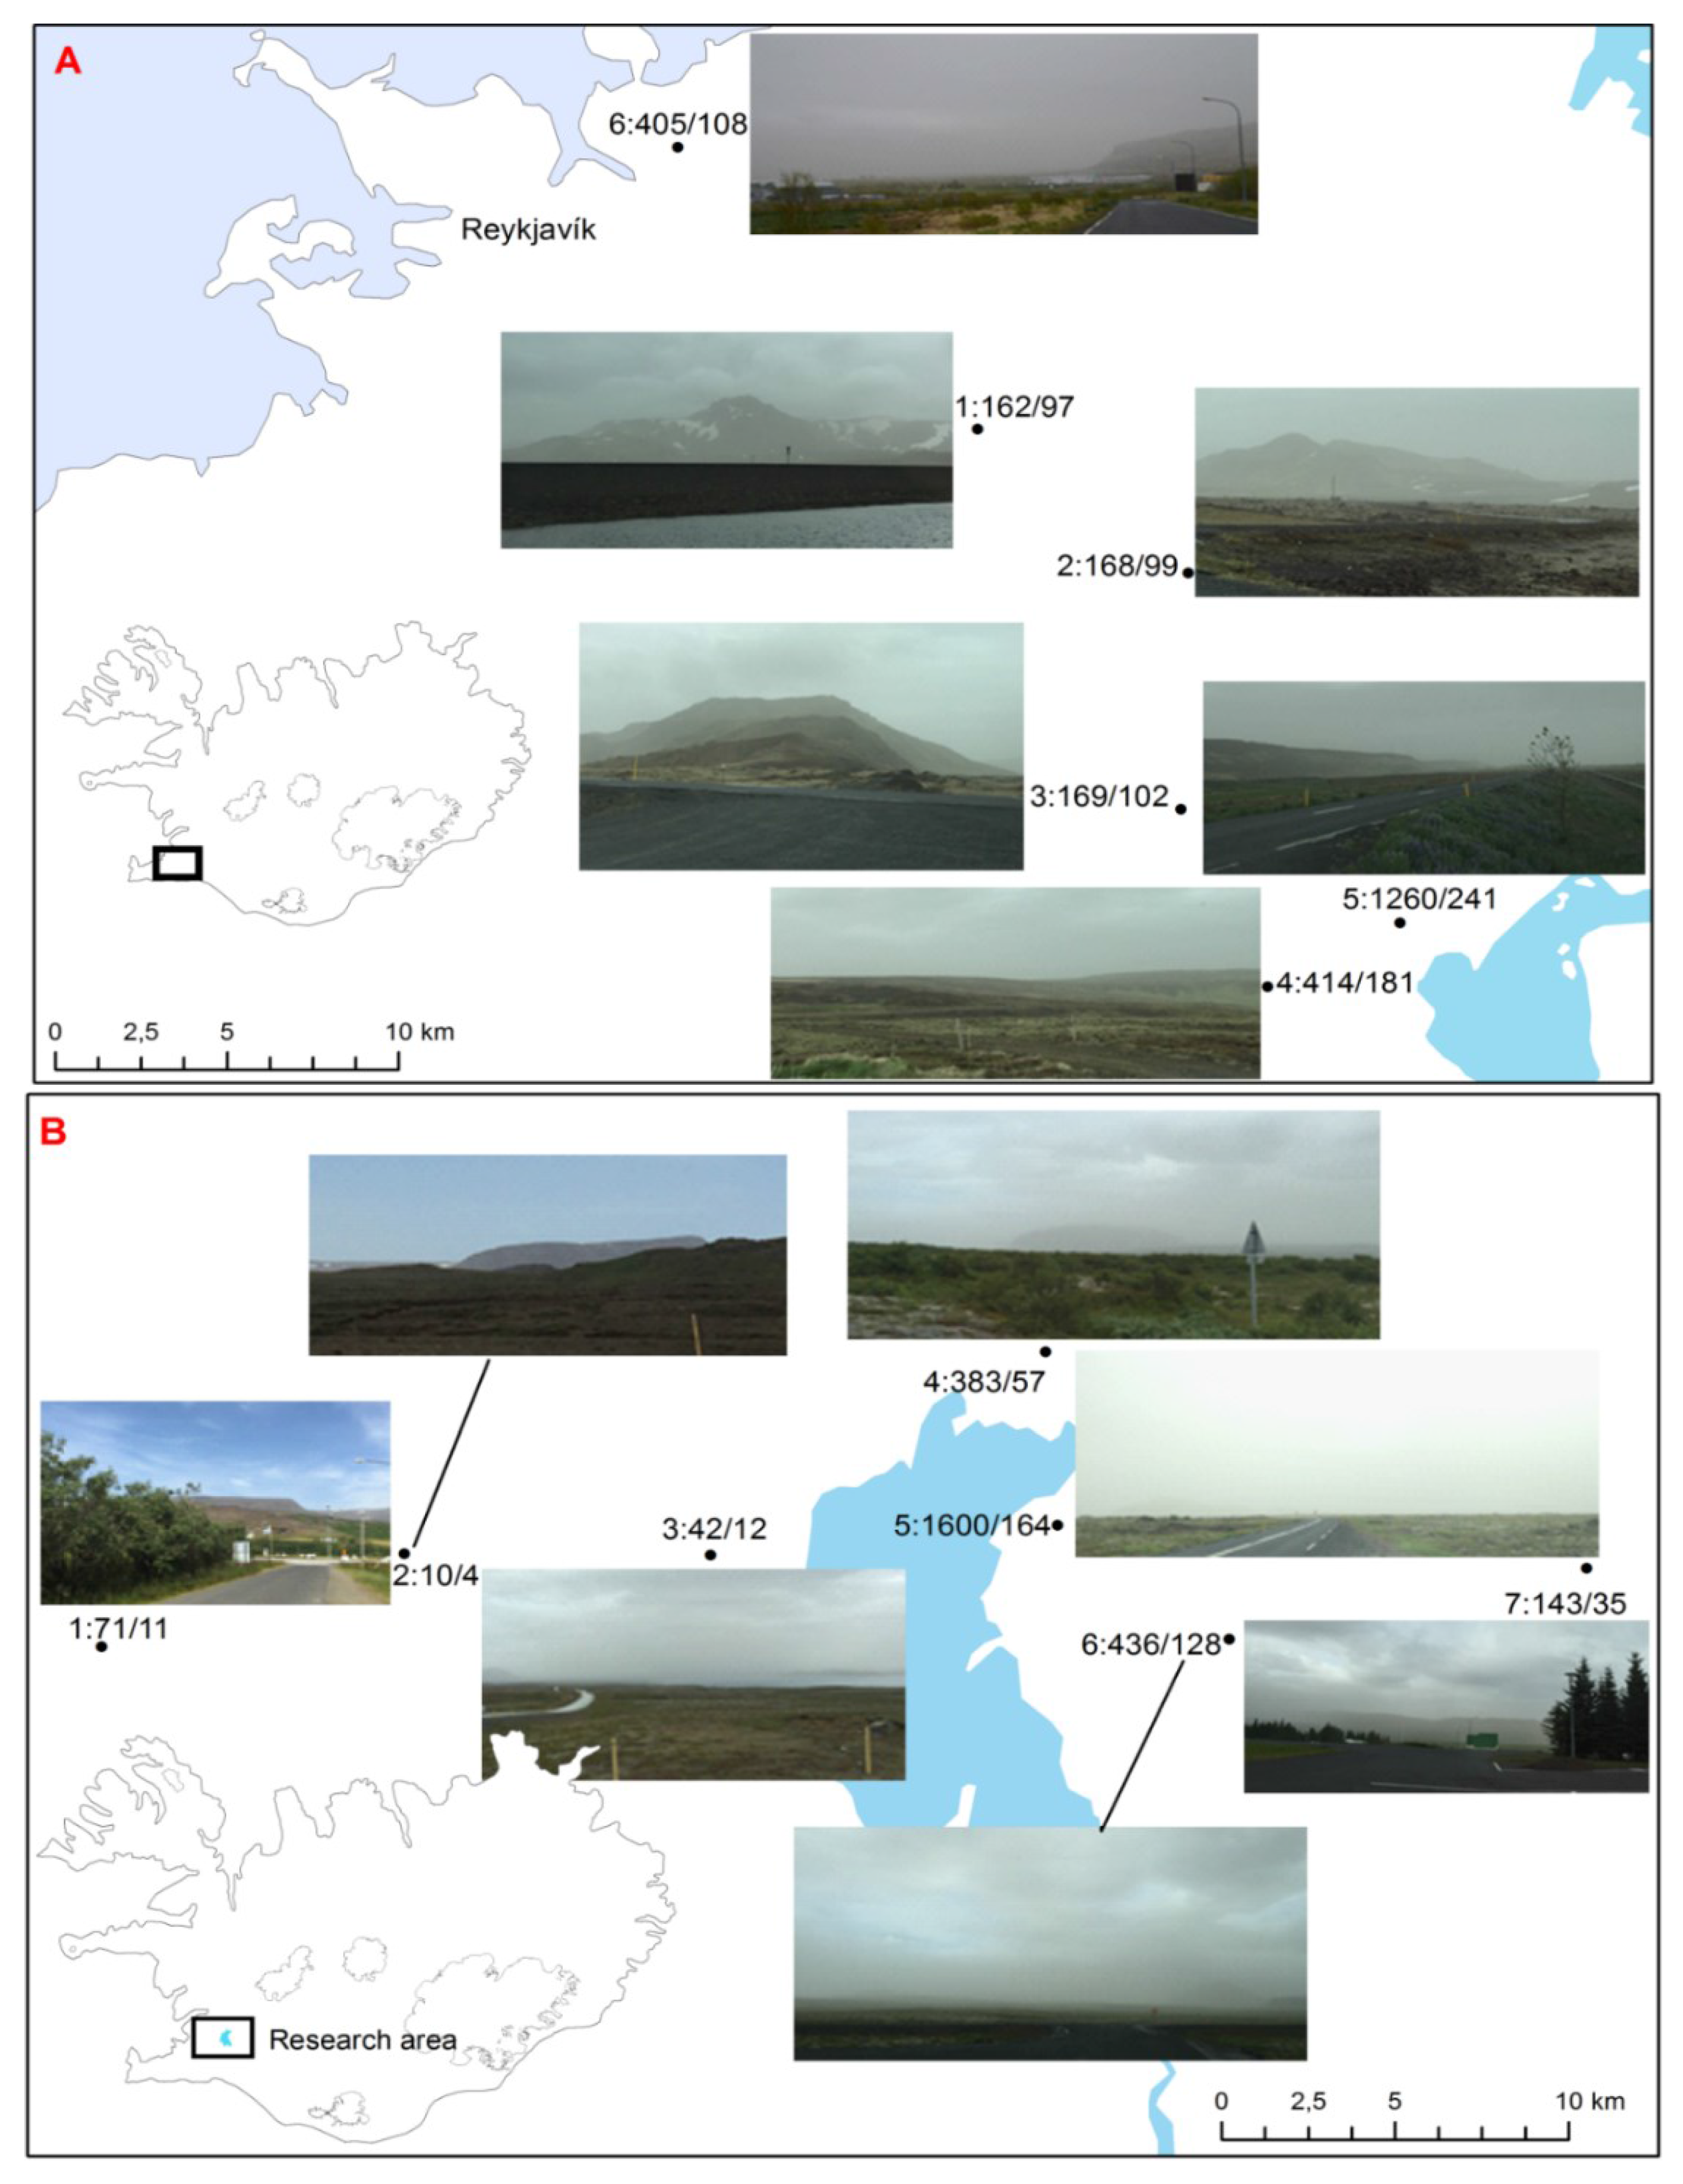
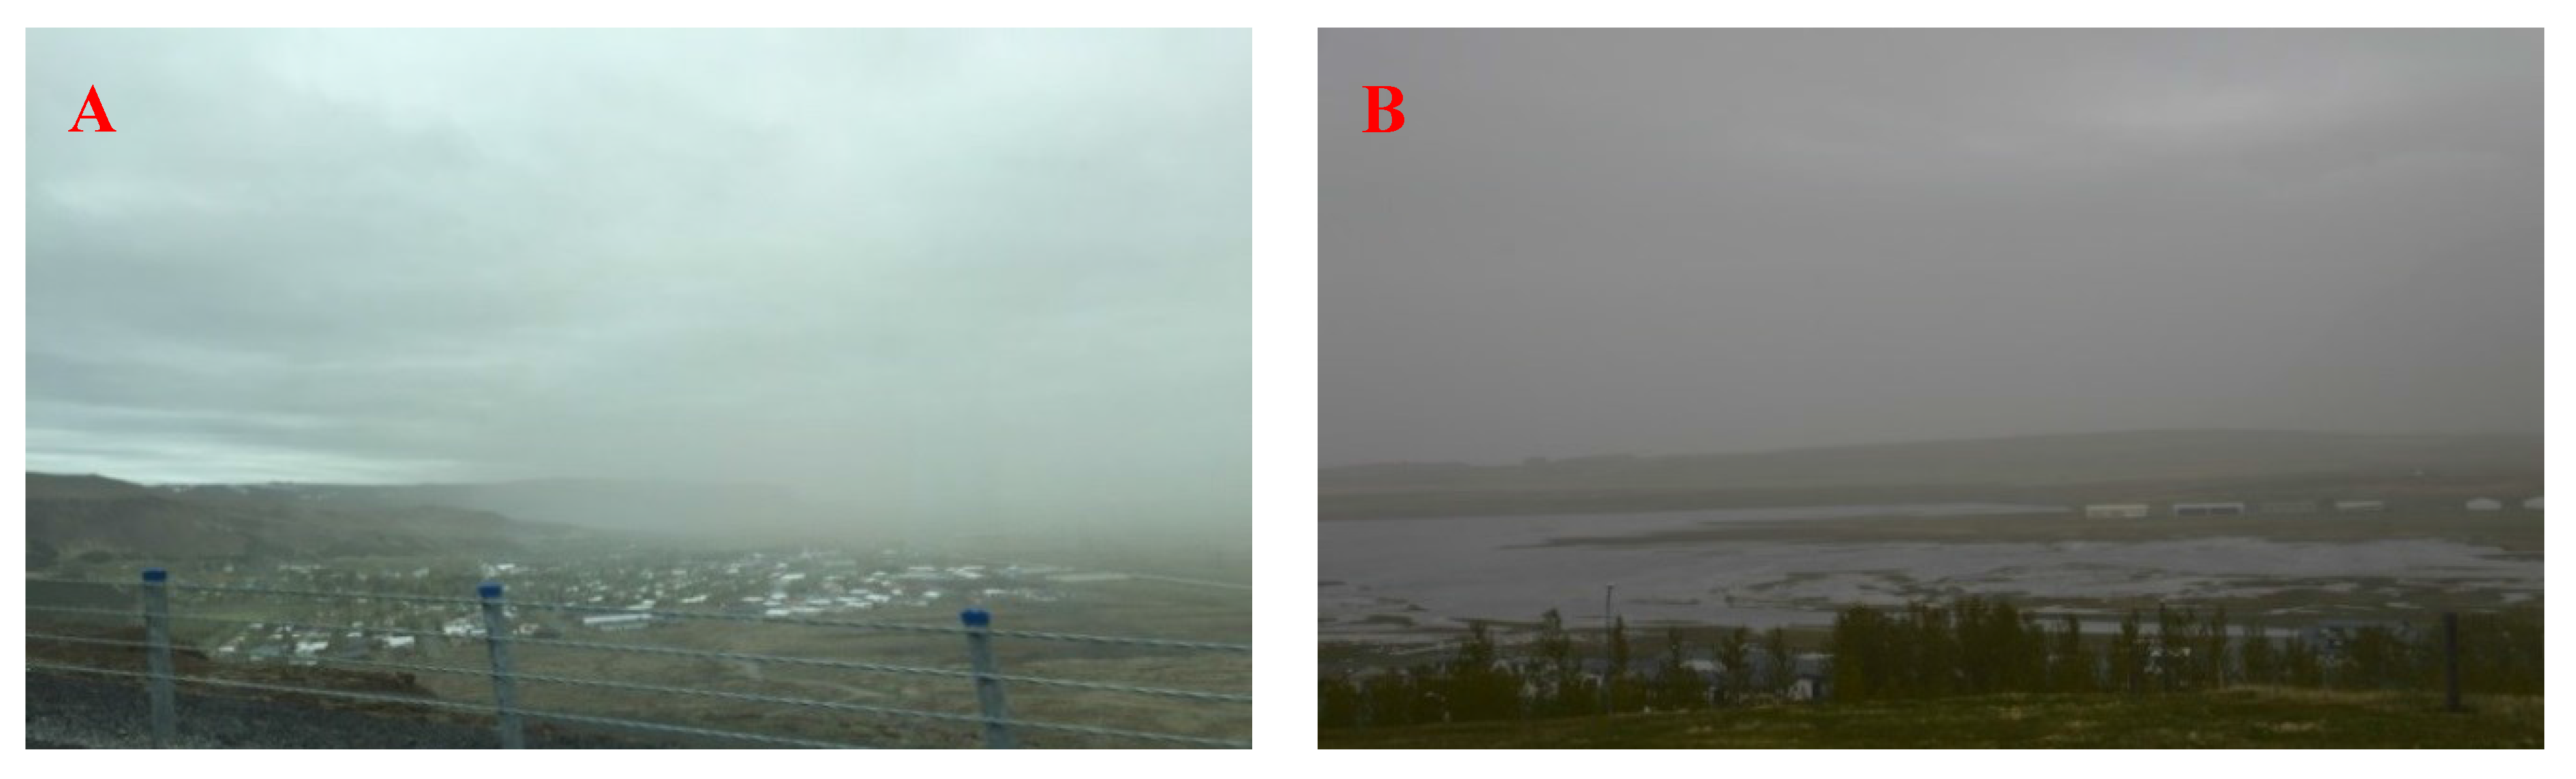
3.1. Dust Concentrations and Visibility
3.2. Size Partitioning of the PM Components of Icelandic Dust
4. Conclusions
Acknowledgments
Author Contributions
Conflicts of Interest
Abbreviations
| PM | Particulate matter |
| EAI | Environmental Agency of Iceland |
| IRCA | Icelandic road and coastal administration |
References
- Perez, L.; Tobias, A.; Querol, X.; Künzli, N.; Pey, J.; Alastuey, A. Coarse particles from Saharan dust and daily mortality. Epidemiology 2008, 19, 800–807. [Google Scholar] [CrossRef] [PubMed]
- Karanasiou, A.; Moreno, N.; Moreno, T.; Viana, M.; de Leeuw, F.; Querol, X. Health effects from Sahara dust episodes in Europe: Literature review and research gaps. Environ. Int. 2012, 47, 107–114. [Google Scholar] [CrossRef] [PubMed]
- Mallone, S.; Stafoggia, M.; Faustini, A.; Gobbi, G.P.; Marconi, A.; Forastiere, F. Saharan dust and associations between particulate matter and daily mortality in Rome, Italy. Environ. Health Perspect. 2011, 119, 1409–1414. [Google Scholar] [CrossRef] [PubMed]
- Stafoggia, M.; Zauli-Sajani, S.; Pey, J.; Samoli, E.; Alessandrini, E.; Basagaña, X.; Cernigliaro, A.; Chiusolo, M.; Demaria, M.; Díaz, J.; et al. Desert dust outbreaks in southern Europe: Contribution to daily PM10 concentrations and short-term associations with mortality and hospital admissions. Environ. Health Perspect. 2015, 124, 4. [Google Scholar] [CrossRef] [PubMed]
- Hyewon, L.; Ho, K.; Yasushi, H.; Youn-Hee, L.; Seungmuk, Y. Effect of Asian dust storms on daily mortality in seven metropolitan cities of Korea. Atmos. Environ. 2013, 79, 510–517. [Google Scholar] [CrossRef]
- The World Health Organization. Health Effects of Particulate Matter, Policy Implications for Countries in Eastern Europe, Caucasus and Central Asia; WHO Regional Publications European Series: Copenhagen, Denmark, 2013; p. 15. [Google Scholar]
- Pandolfi, M.; Tobias, A.; Alastuey, A.; Sunyer, J.; Schwartz, J.; Lorente, J.; Pey, J.; Querol, X. Effect of atmospheric mixing layer depth variations on urban air quality and daily mortality during Saharan dust outbreaks. Sci. Total Environ. 2014, 494–495, 283–289. [Google Scholar] [CrossRef] [PubMed]
- Krewski, D.; Jerrett, M.; Burnett, R.T.; Ma, R.; Hughes, E.; Shi, Y.; Turner, M.C.; Pope, C.A.; Thurston, G.; Calle, E.E.; et al. Extended follow-up and spatial analysis of the American Cancer Society study linking particulate air pollution and mortality. Res. Rep. Health Eff. Inst. 2009, 140, 5–114. [Google Scholar] [PubMed]
- Perez, N.; Pey, J.; Querol, X.; Alastuey, A.; Lopez, J.M.; Viana, M. Partitioning of major and trace components in PM10, PM2.5 and PM1 at an urban site in Southern Europe. Atmos. Environ. 2008, 42, 1677–1691. [Google Scholar] [CrossRef]
- Shahsavani, A.; Naddafi, K.; Jafarzade Haghighifard, N.; Mesdaghinia, A.; Yunesian, M.; Nabizadeh, R.; Arahami, M.; Sowlat, M.; Yarahmadi, M.; Saki, H.; et al. The evaluation of PM10, PM2.5, and PM1 concentrations during the Middle Eastern Dust (MED) events in Ahvaz, Iran, from April through September 2010. J. Arid Environ. 2012, 77, 72–83. [Google Scholar] [CrossRef]
- Carbone, C.; Decesari, S.; Paglione, M.; Giulianelli, L.; Rinaldi, M.; Marinoni, A.; Cristofanelli, P.; Didiodato, A.; Bonasoni, P.; Fuzzi, S.; et al. 3-year chemical composition of free tropospheric PM1 at the Mt. Cimone GAW global station—South Europe—2165 m a.s.l. Atmos. Environ. 2014, 87, 218–227. [Google Scholar] [CrossRef]
- Colls, J.; Tiwary, A. Air Pollution Measurement, Modelling and Mitigation, 3rd ed.; Routledge: London, UK; New York, NY, USA, 2010. [Google Scholar]
- Mahowald, N.M.; Albani, S.; Kok, J.F.; Engelstaeder, S.; Scanza, R.; Ward, S.; Flanner, M.G. The size distribution of desert dust aerosols and its impact on the Earth system. Aeol. Res. 2014, 15, 53–71. [Google Scholar] [CrossRef]
- Arnalds, O.; Dagsson-Waldhauserova, P.; Olafsson, H. The Icelandic volcanic aeolian environment: Processes and impacts—A review. Aeol. Res. 2016, 20, 176–195. [Google Scholar] [CrossRef]
- Nickling, W.G. Eolian sediment transport during dust storms: Slims River Valley, Yukon Territory. Can. J. Earth Sci. 1978, 15, 1069–1084. [Google Scholar] [CrossRef]
- Dornbrack, A.; Stachlewska, I.S.; Ritter, C.; Neuber, R. Aerosol distribution around Svalbard during intense easterly winds. Atmos. Chem. Phys. 2010, 10, 1473–1490. [Google Scholar] [CrossRef] [Green Version]
- Lancaster, N.; Nickling, W.G.; Gillies, J.A. Sand transport by wind on complex surfaces: Field studies in the McMurdo Dry Valleys, Antarctica. J. Geophys. Res. 2010, 115. [Google Scholar] [CrossRef]
- Crusius, J.; Schroth, A.W.; Gasso, S.; Moy, C.M.; Levy, R.C.; Gatica, M. Glacial flour dust storms in the Gulf of Alaska: Hydrologic and meteorological controls and their importance as a source of bioavailable iron. Geophys. Res. Lett. 2011, 38. [Google Scholar] [CrossRef]
- Bullard, J.E. Contemporary glacigenic inputs to the dust cycle. Earth Surf. Proc. Land. 2013, 38, 71–89. [Google Scholar] [CrossRef]
- Lamy, F.; Gersonde, R.; Winckler, G.; Esper, O.; Jaeschke, A.; Kuhn, G.; Ullermann, J.; Martinez-Garcia, A.; Lambert, F.; Kilian, R. Increased dust deposition in the Pacific Southern Ocean during glacial periods. Science 2014, 343, 403–407. [Google Scholar] [CrossRef] [PubMed]
- Arnalds, O.; Thorarinsdottir, E.F.; Thorsson, J.; Dagsson-Waldhauserova, P.; Agustsdottir, A.M. An extreme wind erosion event of the fresh Eyjafjallajokull 2010 volcanic ash. Nat. Sci. Rep. 2013, 3, 1257. [Google Scholar] [CrossRef] [PubMed]
- Dagsson-Waldhauserova, P.; Arnalds, O.; Olafsson, H. Long-term frequency and characteristics of dust storm events in Northeastern Iceland (1949–2011). Atmos. Environ. 2013, 77, 117–127. [Google Scholar] [CrossRef]
- Dagsson-Waldhauserova, P.; Arnalds, O.; Olafsson, H. Long-term variability of dust events in Iceland (1949–2011). Atmos. Chem. Phys. 2014, 14, 13411–13422. [Google Scholar] [CrossRef]
- Thorsteinsson, T.; Gisladottir, G.; Bullard, J.; McTainsh, G. Dust storm contributions to airborne particulate matter in Reykjavík, Iceland. Atmos. Environ. 2011, 45, 5924–5933. [Google Scholar] [CrossRef]
- The World Health Organization. Air Quality Guidelines Global Update 2005. In Proceedings of the Report on a Working Group Meeting, Bonn, Germany, 18–20 October 2005.
- The Environment Agency of Iceland. Air Quality in Iceland. Available online: http://ust.is/the-environment-agency-of-iceland/ (accessed on 14 February 2016).
- Dagsson-Waldhauserova, P.; Arnalds, O.; Olafsson, H.; Skrabalova, L.; Sigurdardottir, G.; Branis, M.; Hladil, J.; Skala, R.; Navratil, T.; Chadimova, L.; et al. Physical properties of suspended dust during moist and low-wind conditions in Iceland. Icel. Agric. Sci. 2014, 27, 25–39. [Google Scholar]
- Dagsson-Waldhauserova, P.; Arnalds, O.; Olafsson, H.; Hladil, J.; Skala, R.; Navratil, T.; Chadimova, L.; Meinander, O. Snow-dust storm: A case study from Iceland, 7 March 2013. Aeol. Res. 2015, 16, 69–74. [Google Scholar] [CrossRef]
- Baratoux, D.; Mangold, N.; Arnalds, O.; Bardintzeff, J.M.; Platevoet, B.; Gregorie, M.; Pinet, P. Volcanic sands of Iceland—Diverse origins of Aeolian sand deposits revealed at Dyngjusandur and Lambahraun. Earth Surf. Proc. Land 2011, 36, 1789–1808. [Google Scholar] [CrossRef]
- Carlsen, H.K.; Gislason, T.; Forsberg, B.; Meister, K.; Thorsteinsson, T.; Johannsson, T.; Finnbjornsdottir, R.; Oudin, A. Emergency hospital visits in association with volcanic ash, dust storms and other sources of ambient particles: A time-series study in Reykjavík, Iceland. Int. J. Environ. Res. Public Health 2015, 12, 4047–4059. [Google Scholar] [CrossRef] [PubMed] [Green Version]
- Blechschmidt, A.-M.; Kristjansson, J.E.; Olafsson, H.; Burkhart, J.F.; Hodnebrog, Ø. Aircraft-based observations and high-resolution simulations of an Icelandic dust storm. Atmos. Chem. Phys. 2012, 12, 7949–7984. [Google Scholar] [CrossRef]
- Branis, M.; Hovorka, J. Performance of a photometer DustTrak in various indoor and outdoor environments. In Proceedings of the Abstracts of the 2005 Evaluations and Assessment Conference (EAC 2005), Ghent, Belgium, 28 September–10 October 2005; p. 535.
- Wallace, L.A.; Wheeler, A.J.; Kearney, J.; Van Ryswyk, K.; You, H.; Kulka, R.H.; Rasmussen, P.E.; Brook, J.R.; Xu, X. Validation of continuous particle monitors for personal, indoor, and outdoor exposures. J. Expo. Sci. Environ. Epidemiol. 2011, 21, 49–64. [Google Scholar] [CrossRef] [PubMed]
- The Icelandic Road and Coastal Administration. Road, Web Cameras. Available online: http://www.road.is/travel-info/web-cams/ (accessed on 4 August 2015).
- Pey, J.; Rodríguez, S.; Querol, X.; Alastuey, A.; Moreno, T.; Putaud, J.P.; Van Dingenen, R. Variations of urban aerosols in the western Mediterranean. Atmos. Environ. 2008, 42, 9052–9062. [Google Scholar] [CrossRef]
- Theodosi, C.; Grivas, G.; Zarmpas, P.; Chaloulakou, A.; Mihalopoulos, N. Mass and chemical composition of size-segregated aerosols (PM1, PM2.5, PM10) over Athens, Greece: Local versus regional sources. Atmos. Chem. Phys. 2011, 11, 11895–11911. [Google Scholar] [CrossRef]
- Arnalds, O.; Olafsson, H.; Dagsson-Waldhauserova, P. Quantification of iron rich volcanogenic dust emissions and deposition over ocean from Icelandic dust sources. Biogeosciences 2014, 11, 6623–6632. [Google Scholar] [CrossRef]
- Lundgren, D.A.; Hlaing, D.N.; Rich, T.A.; Marple, V.A. PM10/PM2.5/PM1.0 data from a trichotomous sampler. Aerosol Sci. Tech. 1996, 25, 353–357. [Google Scholar] [CrossRef]
- Claiborn, C.S.; Finn, D.; Larson, T.; Koenig, J. Windblown dust contributes to high PM2.5 concentrations. J. Air Waste Manag. Assoc. 2000, 50, 1440–1445. [Google Scholar] [CrossRef] [PubMed]
- Speranza, A.; Caggiano, R.; Margiotta, S.; Summa, V.; Trippett, S. A clustering approach based on triangular diagram to study the seasonal variability of simultaneous measurements of PM10, PM2.5 and PM1 mass concentration ratios. Arab. J. Geosci. 2016, 9, 132. [Google Scholar] [CrossRef]
- Gomišček, B.; Hauck, H.; Stopper, S.; Preining, O. Spatial and temporal variation of PM1, PM2.5, PM10 and particle number concentration during the AUPHEP-project. Atmos. Environ. 2004, 38, 3917–3934. [Google Scholar] [CrossRef]
- Li, C.-S.; Lin, C.-H. PM1/PM2.5/PM10 Characteristics in the urban atmosphere of Taipei. Aerosol Sci. Technol. 2002, 36, 469–473. [Google Scholar] [CrossRef]
- Todd, M.C.; Washington, R.; Martins, J.V.; Dubovik, O.; Lizcano, G.; M’Bainayel, S.; Engelstaedter, S. Mineral dust emission from the Bodélé Depression, northern Chad, during BoDEx 2005. J. Geophys. Res. 2007, 112. [Google Scholar] [CrossRef]
- Kaskaoutis, D.G.; Rashki, A.; Houssos, E.E.; Goto, D.; Nastos, P.T. Extremely high aerosol loading over Arabian sea during June 2008: The specific role of the atmospheric dynamics and Sistan dust storms. Atmos. Environ. 2014, 94, 374–384. [Google Scholar] [CrossRef]


| PM1 Average | PM2.5 Average | PM4 Average | PM10 Average | Total (PM15) Average | PM1/PM10 Ratio | PM2.5/PM10 Ratio | PM1/PM2.5 Ratio | PM1/PM4 Ratio | PM4/PM10 Ratio | PM10/PM15 Ratio | |
|---|---|---|---|---|---|---|---|---|---|---|---|
| Storm 1 | |||||||||||
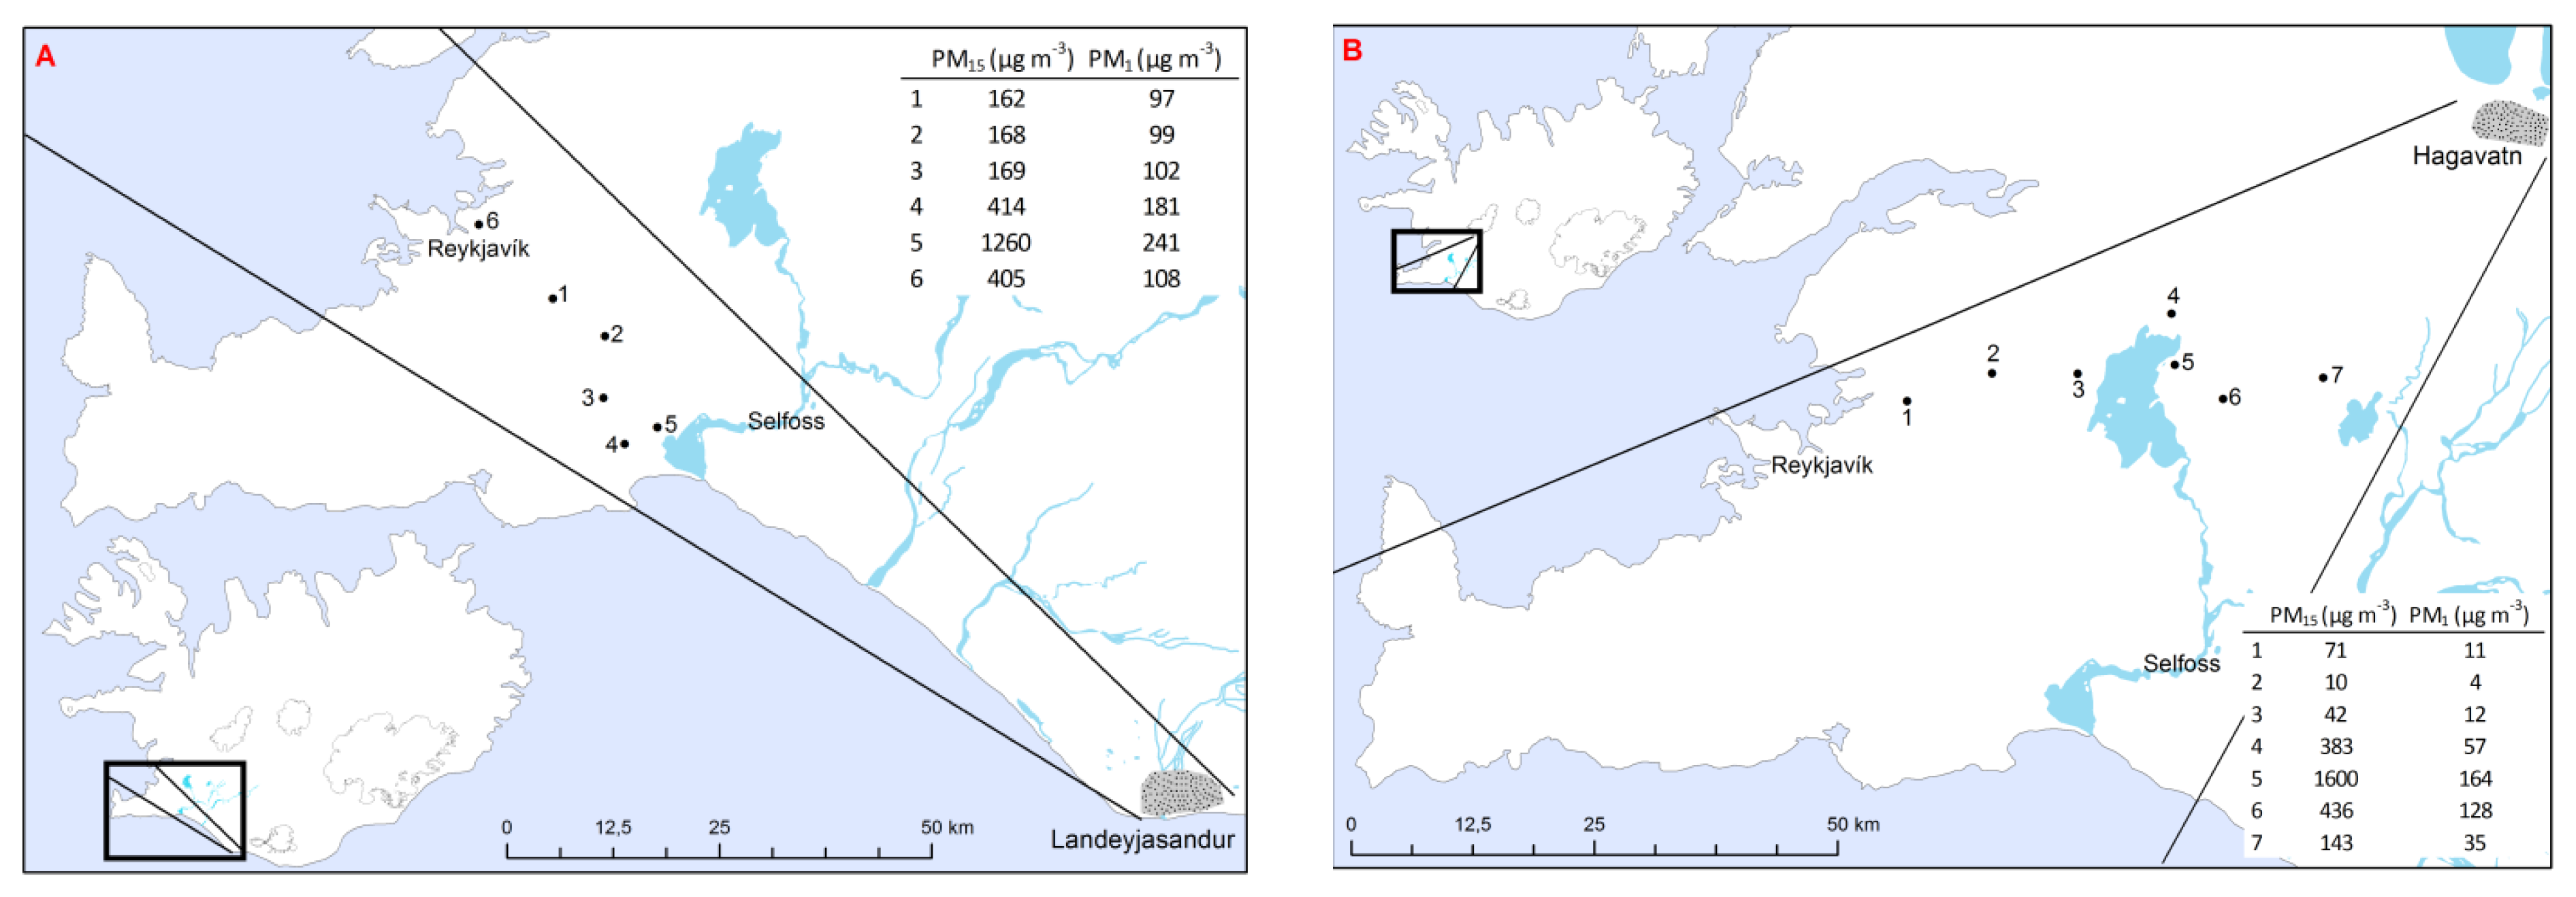
| 1 | 97 | 109 | 130 | 158 | 162 | 0.61 | 0.69 | 0.89 | 0.75 | 0.82 | 0.98 |
| 2 | 99 | 110 | 130 | 158 | 168 | 0.63 | 0.70 | 0.90 | 0.76 | 0.82 | 0.94 |
| 3 | 102 | 114 | 137 | 163 | 169 | 0.63 | 0.70 | 0.89 | 0.74 | 0.84 | 0.96 |
| 4 | 181 | 201 | 248 | 354 | 414 | 0.51 | 0.57 | 0.90 | 0.73 | 0.70 | 0.86 |
| 5 | 241 | 263 | 322 | 583 | 1260 | 0.41 | 0.45 | 0.92 | 0.75 | 0.55 | 0.46 |
| 6 | 108 | 118 | 142 | 224 | 405 | 0.48 | 0.53 | 0.92 | 0.76 | 0.63 | 0.55 |
| Storm 2 | |||||||||||
| 1 | 11 | 12 | 14 | 29 | 71 | 0.48 | 0.53 | 0.92 | 0.76 | 0.63 | 0.55 |
| 2 | 4 | 4 | 5 | 7 | 10 | 0.38 | 0.41 | 0.92 | 0.79 | 0.48 | 0.41 |
| 3 | 12 | 13 | 16 | 29 | 42 | 0.57 | 0.57 | 1.00 | 0.80 | 0.71 | 0.70 |
| 4 | 57 | 61 | 74 | 162 | 383 | 0.41 | 0.45 | 0.92 | 0.75 | 0.55 | 0.69 |
| 5 | 164 | 174 | 206 | 486 | 1600 | 0.35 | 0.38 | 0.93 | 0.77 | 0.46 | 0.42 |
| 6 | 128 | 140 | 177 | 318 | 436 | 0.34 | 0.36 | 0.94 | 0.80 | 0.42 | 0.30 |
| 7 | 35 | 39 | 48 | 87 | 143 | 0.40 | 0.44 | 0.91 | 0.72 | 0.56 | 0.73 |
© 2016 by the authors; licensee MDPI, Basel, Switzerland. This article is an open access article distributed under the terms and conditions of the Creative Commons Attribution (CC-BY) license (http://creativecommons.org/licenses/by/4.0/).
Share and Cite
Dagsson-Waldhauserova, P.; Magnusdottir, A.Ö.; Olafsson, H.; Arnalds, O. The Spatial Variation of Dust Particulate Matter Concentrations during Two Icelandic Dust Storms in 2015. Atmosphere 2016, 7, 77. https://doi.org/10.3390/atmos7060077
Dagsson-Waldhauserova P, Magnusdottir AÖ, Olafsson H, Arnalds O. The Spatial Variation of Dust Particulate Matter Concentrations during Two Icelandic Dust Storms in 2015. Atmosphere. 2016; 7(6):77. https://doi.org/10.3390/atmos7060077
Chicago/Turabian StyleDagsson-Waldhauserova, Pavla, Agnes Ösp Magnusdottir, Haraldur Olafsson, and Olafur Arnalds. 2016. "The Spatial Variation of Dust Particulate Matter Concentrations during Two Icelandic Dust Storms in 2015" Atmosphere 7, no. 6: 77. https://doi.org/10.3390/atmos7060077