
Impact of Vehicle Fleet Modernization on the Traffic-Originated Air Pollution in an Urban Area—A Case Study


1
Systems Research Institute, Polish Academy of Sciences, 01-447 Warsaw, Poland
2
Warsaw School of Information Technology (WIT), 01-447 Warsaw, Poland
*
Author to whom correspondence should be addressed.
Atmosphere 2021, 12(12), 1581; https://doi.org/10.3390/atmos12121581
Submission received: 18 October 2021
/
Revised: 16 November 2021
/
Accepted: 26 November 2021
/
Published: 27 November 2021
(This article belongs to the Special Issue Air Pollution at the Urban and Regional Level: Sources, Sinks, and Transportation)
Abstract
:The main subject of this paper is an analysis of the influence of changes in the air pollution caused by road traffic, due to its modernization, on the air quality in Warsaw conurbation, Poland. Using the Calpuff model, simulations of the yearly averaged concentrations of NOx, CO, PM10, and PM2.5 were performed, together with an assessment of the population exposure to individual pollutions. Source apportionment analysis indicates that traffic is the main source of NOx and CO concentrations in the city atmosphere. Utilizing the Euro norms emission standards, a scenario of vehicle emission abatement is formulated based on the assumed general vehicle fleet modernization and transition to Euro 6 emission standards. Computer simulations show a reduction in NOx concentrations attributed to emission mitigation of passenger cars, trucks and vans, and public transport buses, respectively. On the other hand, improving air quality in terms of CO concentrations depends almost exclusively on gasoline vehicle modernization. The implementation of the considered scenario causes an adequate reduction in the population exposure and related health effects. In particular, implementation of the scenario discussed results in a 47% reduction (compared with the baseline value) in the attributable yearly deaths related to NOx pollution. In spite of a substantial contribution of vehicle traffic to the overall PM pollution, modernization of the fuel combustion causes only minor final effects because the dominant share of PM pollution in Warsaw originates from the municipal sector and the transboundary inflow.
1. Introduction
Air pollution remains the main environmental health risk in Europe, especially in urban conurbations, where many inhabitants suffer from poor air quality. The source apportionment analysis reveals [1,2] that in many cities, the transportation system is the dominating emission category in urban air quality degradation. Road traffic contributes to negative health effects mainly by primary nitrogen oxide (NOx) pollution, but also via the primary and secondary components of particulate matter. In many cities, the European air quality standards established by the Ambient Air Quality Directive [3,4] or Air Quality Guidelines [5] are regularly exceeded. While PM pollutions originate from various categories of sources (with a minor contribution of traffic to the primary emission), NO2 concentrations almost exclusively originate from road traffic. Moreover, NO2 pollution in urban conurbations is mainly due to emissions from diesel vehicles [6,7]. Traffic is also an important source of the resuspended, coarse fractions of PM10. Hence, recently published European studies assessed the effects of traffic policies, intended to reduce concentrations of the above species in large cities.
Numerous earlier urban scale studies addressed emissions of the road transport pollutants, where potential traffic-related scenarios are discussed to abate NOx or CO pollutions. Examples are CO pollution in Copenhagen [8]; CO pollution in Luxembourg [9]; integrated NO2 and CO analysis for Turin [10]; integrated analysis including human exposure and emission abatement techniques for London [11] or [12]. Some recent studies [7,13,14] consider various NOx emission abatement scenarios, based on the implementation of Euro 6 emission standards in urban traffic for gasoline and diesel vehicles. Scenario analysis was applied to assess the effects of traffic policies, intended to reduce NO2 concentrations in eight European cities [15]. Very important and useful in such an approach is the Urban NO2 Atlas report [6], where the traffic emission characteristics for 30 European cities are presented, broken down into diesel and gasoline vehicles and 6 Euro emission standards.
Characteristics of the transportation system in Warsaw given in [6] were utilized by Holnicki et al. [16], who discussed the complex improvement of air quality by vehicle fleets and municipal sector modernizations. Aside from traffic, the municipal sector is another dominant emission category contributing to air quality degradation in Warsaw [16]. This study investigates the possible improvement of the environmental quality in the Warsaw conurbation by reducing traffic-related pollution as a result of implementing low-emission technologies (represented by the Euro norms) in vehicle fleets operating in Warsaw. As a result of emission abatement scenarios, improvements in air quality and the related public health indexes are assessed.
Warsaw suffers from high concentrations of air pollutants that characterize the urban environment, which is also quite common for other European conurbations. Among them are particulate matter, sulfur- and nitrogen oxides, carbon monoxide, and polycyclic aromatic hydrocarbons. Traffic-induced emission is one of the dominating categories of air pollution. The number of vehicles registered in the conurbation has steadily increased, particularly in the last decade [17,18]. The traffic-originated emissions are mainly responsible for concentrations of NOx, CO, and PM10, the last mainly via the resuspended coarse fraction [16,19]. In particular, high NOx and PM10 annual mean concentrations during the last decade exceed the WHO limits [7,20]. Road traffic also contributes to the overall concentrations of PM2.5 and the highly toxic benzo[a]pyrene (B[a]P), but to a lesser extent, because the dominant share of these pollutants is attributed to the municipal sector, mainly due to coal combustion.
As shown below, the final environmental effect of the traffic emission abatement obviously depends on the number of driving vehicles, but also on the vehicle fleet structure and technology applied for emission reduction (cf. Tables S1–S3). The above factors are included in the analysis of the emission limitation scenario, which is presented in the next section. To fully assess environmental benefits arising from the implementation of the discussed solutions, the reference data for the year 2012 are chosen, prior to the baseline state.
2. Methods
Dispersion of atmospheric pollutants in Warsaw conurbation was assessed using the Gaussian regional model CALPUFF, along with the CALMET meteorological preprocessor. Spatial maps of the annual average concentrations of the major air pollutants were obtained in order to determine areas where the permissible concentration levels of individual pollutants were exceeded and to identify the sources responsible for the exceedances.
In order to assess the real impact of the transport sector on air quality and to quantify the advantage of implementing the technology of low-emission vehicles, four categories of sources were considered in the total emission field [16,20]: (a) high energy point sources (24), (b) other industrial point sources (3880), (c) linear sources of the road network (7285), and (d) municipal area sources (6962). The external (transboundary) inflow of pollutants was included via boundary conditions of the forecasting model. The emission data used in computer simulations were adopted from the official database of the Mazovian Voivodship Inspectorate of Environment Protection.
For calculation of the pollutant’s concentrations, the Warsaw metropolitan area (about 520 km2 within administrative boundaries) was digitized with a homogeneous 0.5 km × 0.5 km grid. For the discretized emission data, the resulting concentrations were calculated in 2248 elementary mesh receptors. Calculations performed for emission and meteorological data in the year 2012 generated the final pollution amount, which was used as a baseline for emission scenario analysis.
The resulting concentration maps show the spatial distributions of the main pollutants. They also indicate which pollutants exceed the limit values and which violations are critical. The linear structure of the CALPUFF model allowed us to indicate the emission categories responsible for standard violations. Moreover, it was possible to quantify the share of an individual emission category in the total concentration at a given receptor point or in a city district (source apportionment). This is important for implementing an emission abatement strategy to improve the city’s air quality. Results presented in [16] show that the annual mean concentrations of NOx, PM10, PM2.5, and B(a)P exceed in some districts the limit values prescribed by the WHO (30 μg/m3, 40 μg/m3, 20 μg/m3, 1 ng/m3, respectively).
Subsequently, some scenarios for reducing road traffic emissions were developed, in which implementation of Euro 6 emission standards for the selected categories of vehicles was considered. Construction of NO2 emission scenarios was based on the results presented in [6], where the NO2 emission rates per fuel and Euro standards for 30 cities are collected using the national emission data. The yearly emission volume of each category was calculated as a product of yearly kilometers driven and the respective emission rate.
There was a significant difference in NOx emissions rate between diesel and gasoline vehicles, with definite domination of the former ones. This discrepancy was taken into account in the emission scenarios discussed below. In terms of fuel consumption by vehicle fleets in Warsaw, there was a significant prevalence of low emission standards (E0–E3), both for gasoline and diesel vehicles, similar to other Eastern European cities. Among them, the Warsaw transportation system and its emission properties were fully specified by the fleet composition, fuel type used, yearly distance driven, and emission rates connected with the Euro standards, depending on the vehicle production year. These characteristics, formulated for Warsaw vehicle fleet NOx emissions in the report [6] in graphical form, can be presented in the tabular form [16], presented below.
Table 1 presents the annual NO2 emissions in Warsaw, attributed to each fuel type and Euro standards. These data were used to assess the emission reduction rate connected with the emission policy scenarios for the transportation system, in particular those related to adapting the transportation emission rates to Euro 6 standards. Moreover, the policy of the Warsaw environmental protection authorities regarding public transport was taken into account. Implementation of the hybrid/LNG/CNG technology in the public transportation system was considered. Results presented in Section 3 suggest realistic emission reduction scenarios, which can significantly contribute to the conurbation air quality improvement.
3. Results—Emission Abatement Scenarios
3.1. The Nitrogen Oxide Pollution
As previously mentioned, road traffic is a dominating source responsible for NOx pollution in urban areas. As seen from Figure 1, the transportation sector in Warsaw contributes 77% to the overall NOx concentration, while among other emission categories, 10% comes from the area sources and 8% from the transboundary inflow.
The emission scenario considered in this study consisted of reducing the nitrogen oxides pollution by achieving ultimately the Euro 6 emission standards for passenger cars, including taxis (39% emission share), and vans and trucks (25% share), as well as the application of low-emission technologies in the urban transport buses (13% share).
Figure 1.
Source apportionment for NOx emissions.

The data listed in Table 1 were used to calculate the annual emission volume attributed to vehicle categories and Euro emission standards. In our study, we assumed Euro 3 emission standards for all pre-E4 vehicles, both diesel and gasoline, as the Euro 3 cars prevail among the older ones. This is a conclusion formulated in [16], that is, distances traveled in Poland by E3 vehicles visibly prevail starting from 2010. The Euro 6 emission standards were adopted as the target to be obtained by both vehicle categories. The share of the total NOx emission from the older (pre-E4) vehicle categories was 19% for gasoline and 59% for diesel vehicles (Table 1). It follows from the Euro emission standards (Tables S1 and S2) that the emission reduction rate, referring to the transition from E3 to E6, was 0.4 for gasoline vehicles and 0.16 for diesel vehicles, which enables determining the target NOx emissions for conversion from pre-E4 to E6 emission standards. Emission rates for E4–E6 vehicles were left unchanged. The above estimations showed that meeting the Euro 6 emission standards for passenger cars in Warsaw would reduce NOx emissions by about 60%, as compared with the baseline level.
Public transport buses have a 13% share of the total NOx emission (Figure 1). The city authorities have launched an initiative to replace the bus fleet with low-emission vehicles, and ultimately public transport will entirely be served by such vehicles (hybrid, LNG/CNG). Reduction in the NOx emission from this sector is estimated at 40–60% by experts from the Voivodship Inspectorate of Environmental Protection. Moreover, transition to Euro 5 emission standards by heavy-duty vehicles (25% share), according to Table S3 can also reduce the respective contribution of trucks and vans by approximately 60%. The emission abatement results in a reduction in the related inhabitants’ exposure, calculated as the averaged final concentration weighted by population density. The computed values of the exposure index are shown in all pollution concentration maps presented below.
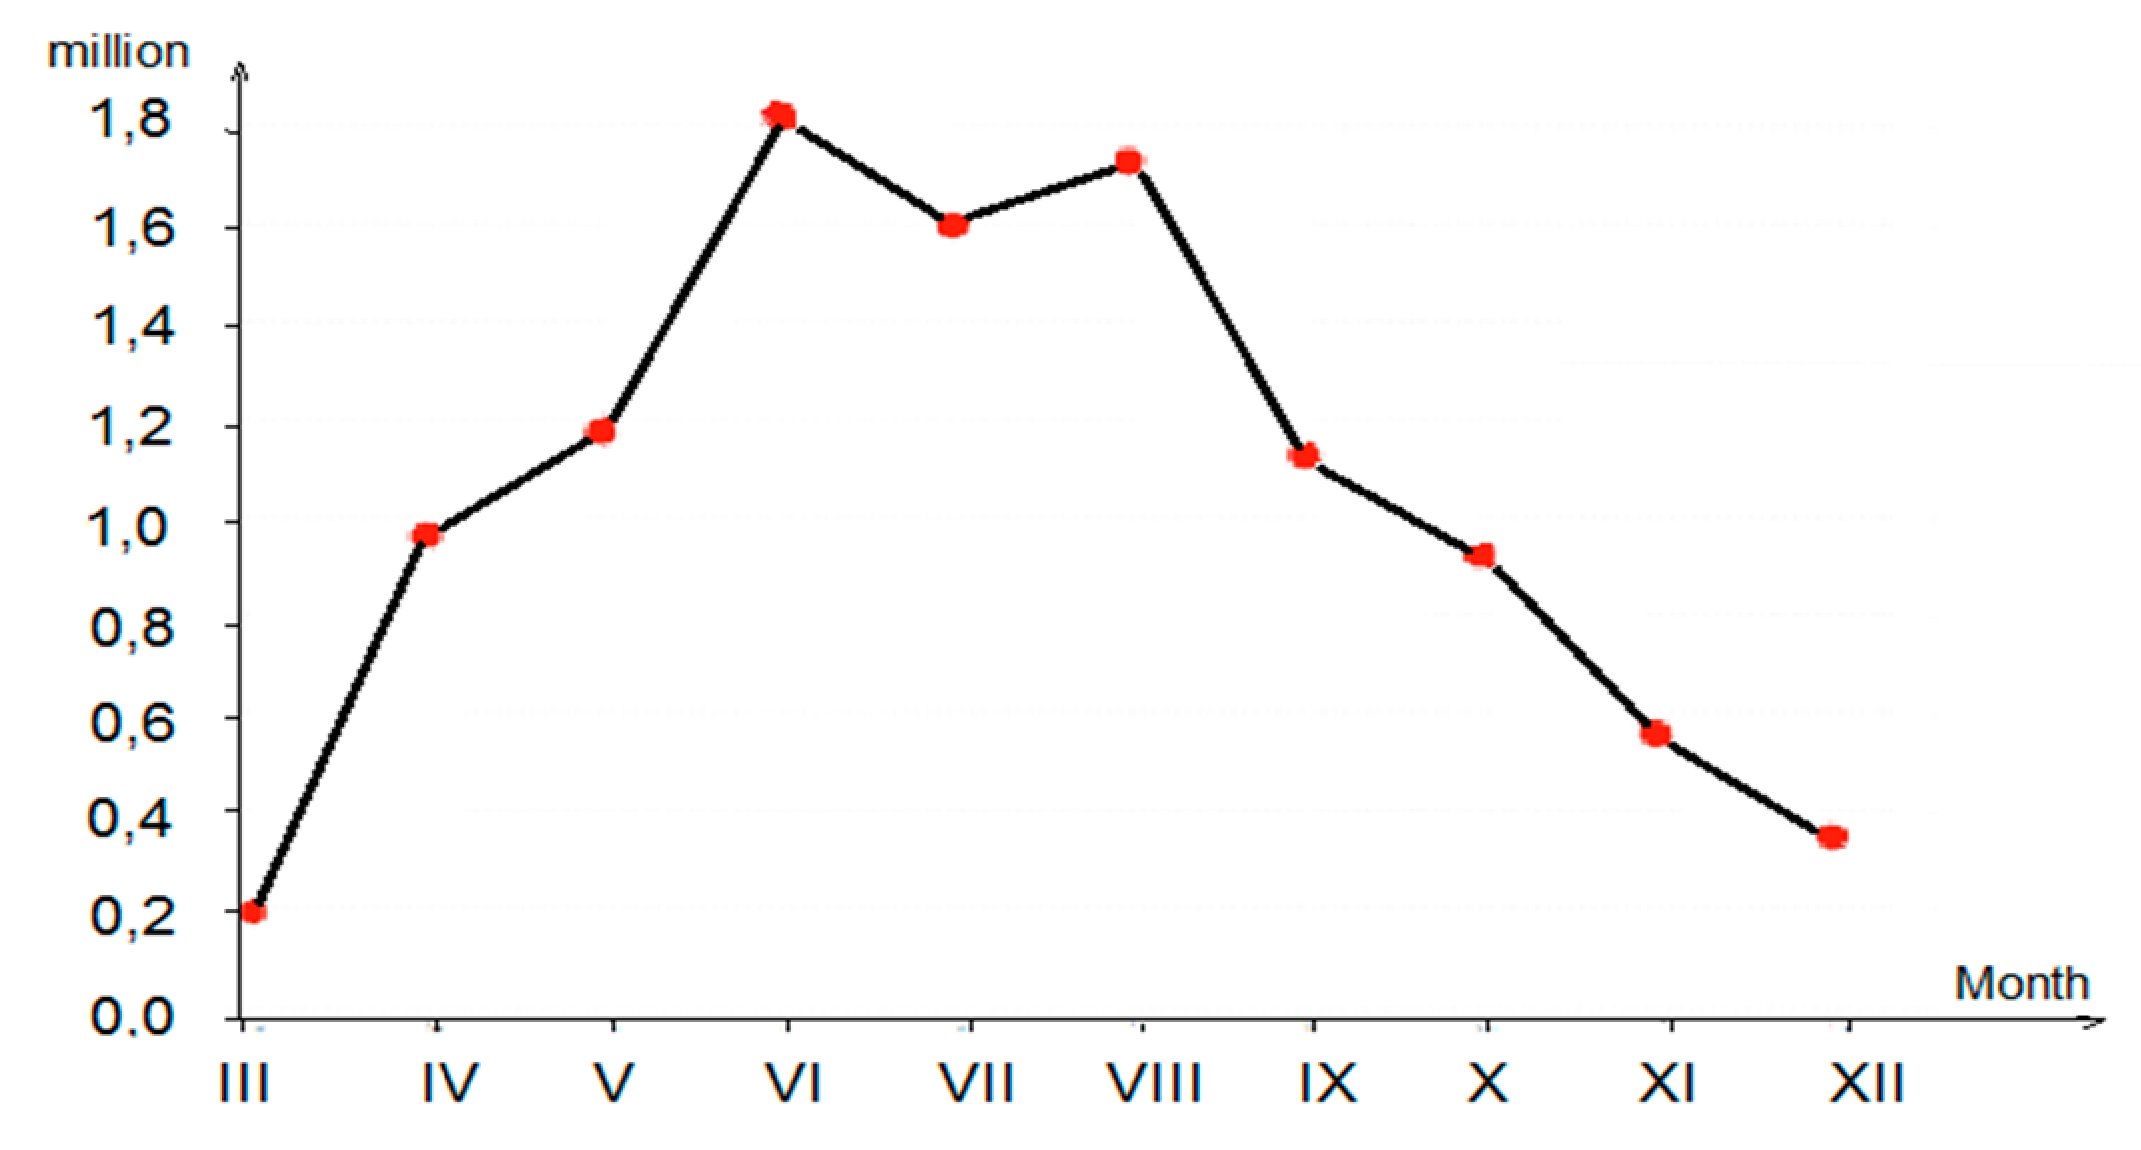
Bikes are increasingly replacing cars as a means of transportation to move around the city. There are currently about 75,000 bikes in Warsaw [21], including 12% of the public bike-sharing system (Veturillo and scooters). As shown in [22], 80% of cycling traffic in the city refers to transportation, communication, and mobility. Hence, some additional, although a rather slight improvement in air quality, can be obtained, taking into account the growing share of bicycles in urban transportation. Extensive measurements of this movement performed in Warsaw showed that during March–December (as the cycling is negligible during the first two months due to unfavorable Winter conditions), an average of 1.02 million bicycles per month are actively used (Figure 2). We further predict that the growing share of bicycle traffic gradually replaces passenger cars, proportionally to the distance traveled.
Assuming an average distance for daily travel/bike as 10 km (5 km as an average distance between home and destination) results in 300 km monthly and 3000 km yearly travel per bike, as biking is usually too difficult in the first two winter months. Hence, the total yearly distance traveled by bikes can be assessed as 3060 million km, of which 80% (2448 million km) can be attributed to urban transportation. This can be compared with the yearly distance traveled by passenger cars (Table 1), 160,789 million km. Hence, due to a partial replacement of vehicle traffic by cycling, the potential possibility to reduce NO2 emissions is 1.52%.
A slight improvement in urban air quality is also associated with the growing share of low-emission vehicles (hybrid/electric). In recent years, (2018/19), approximately 4300 [23] passenger cars of this type were registered in Warsaw. A comparison of this number with the total number of passenger cars in the city, estimated at around 1,200,000 vehicles [23], yields the percentage share of low-emission vehicles (and related emission reduction) of about 0.36%. Finally, both of the above effects can lead to about 1.9% abatement of NO2 emissions in the passenger car category.
3.2. Carbon Monoxide
The final distribution of NOx concentration in the city, corresponding to the adopted vehicle fleet emission scenario, is presented in Figure 3. The attached concentration maps show the effect of implementing the discussed scenarios for subsequent categories of vehicle fleets. The effect of cycling (included in Figure 3b) is minor. It reduces the maximum concentration by 0.7 μg/m3 and the population exposure by 0.2 μg/m3, respectively. The comparison of Figure 3a and Figure 3d maps shows that full implementation of Euro 6 emission standards decreases residents’ exposure to NOx pollution by almost 50%, while at the same time, the concentration limit value is slightly exceeded in only two receptors.
As shown in [16], CO concentrations strongly depend on vehicle traffic (share of 52%—traffic, 45%—transboundary inflow, 3%—local area sources), and any method of emission tightening will also help to reduce this very harmful pollution in the urban area. The CO vehicle emission profile fundamentally differs from that for NOx, and gasoline vehicles have a decidedly dominant share in CO emissions. This fact is also reflected in the Euro standards for CO emissions, as can be seen in Tables S1 and S2, where the transition from E3 to E6 emission standards denotes a significant reduction in CO emission for the gasoline vehicles and only a minor change for the diesel vehicles.
Adoption of Euro 6 as the target emission standards, in this case, implies a reduction in the baseline CO emissions by about 57% (cf. Table S1) for all pre-E4 gasoline vehicles. Maps in Figure 4 compare the reference distributions of the annual mean CO concentration and that which relates to the Euro 6 emission standards applied to passenger cars. The maps show a significant reduction in CO pollution, especially in the central districts.
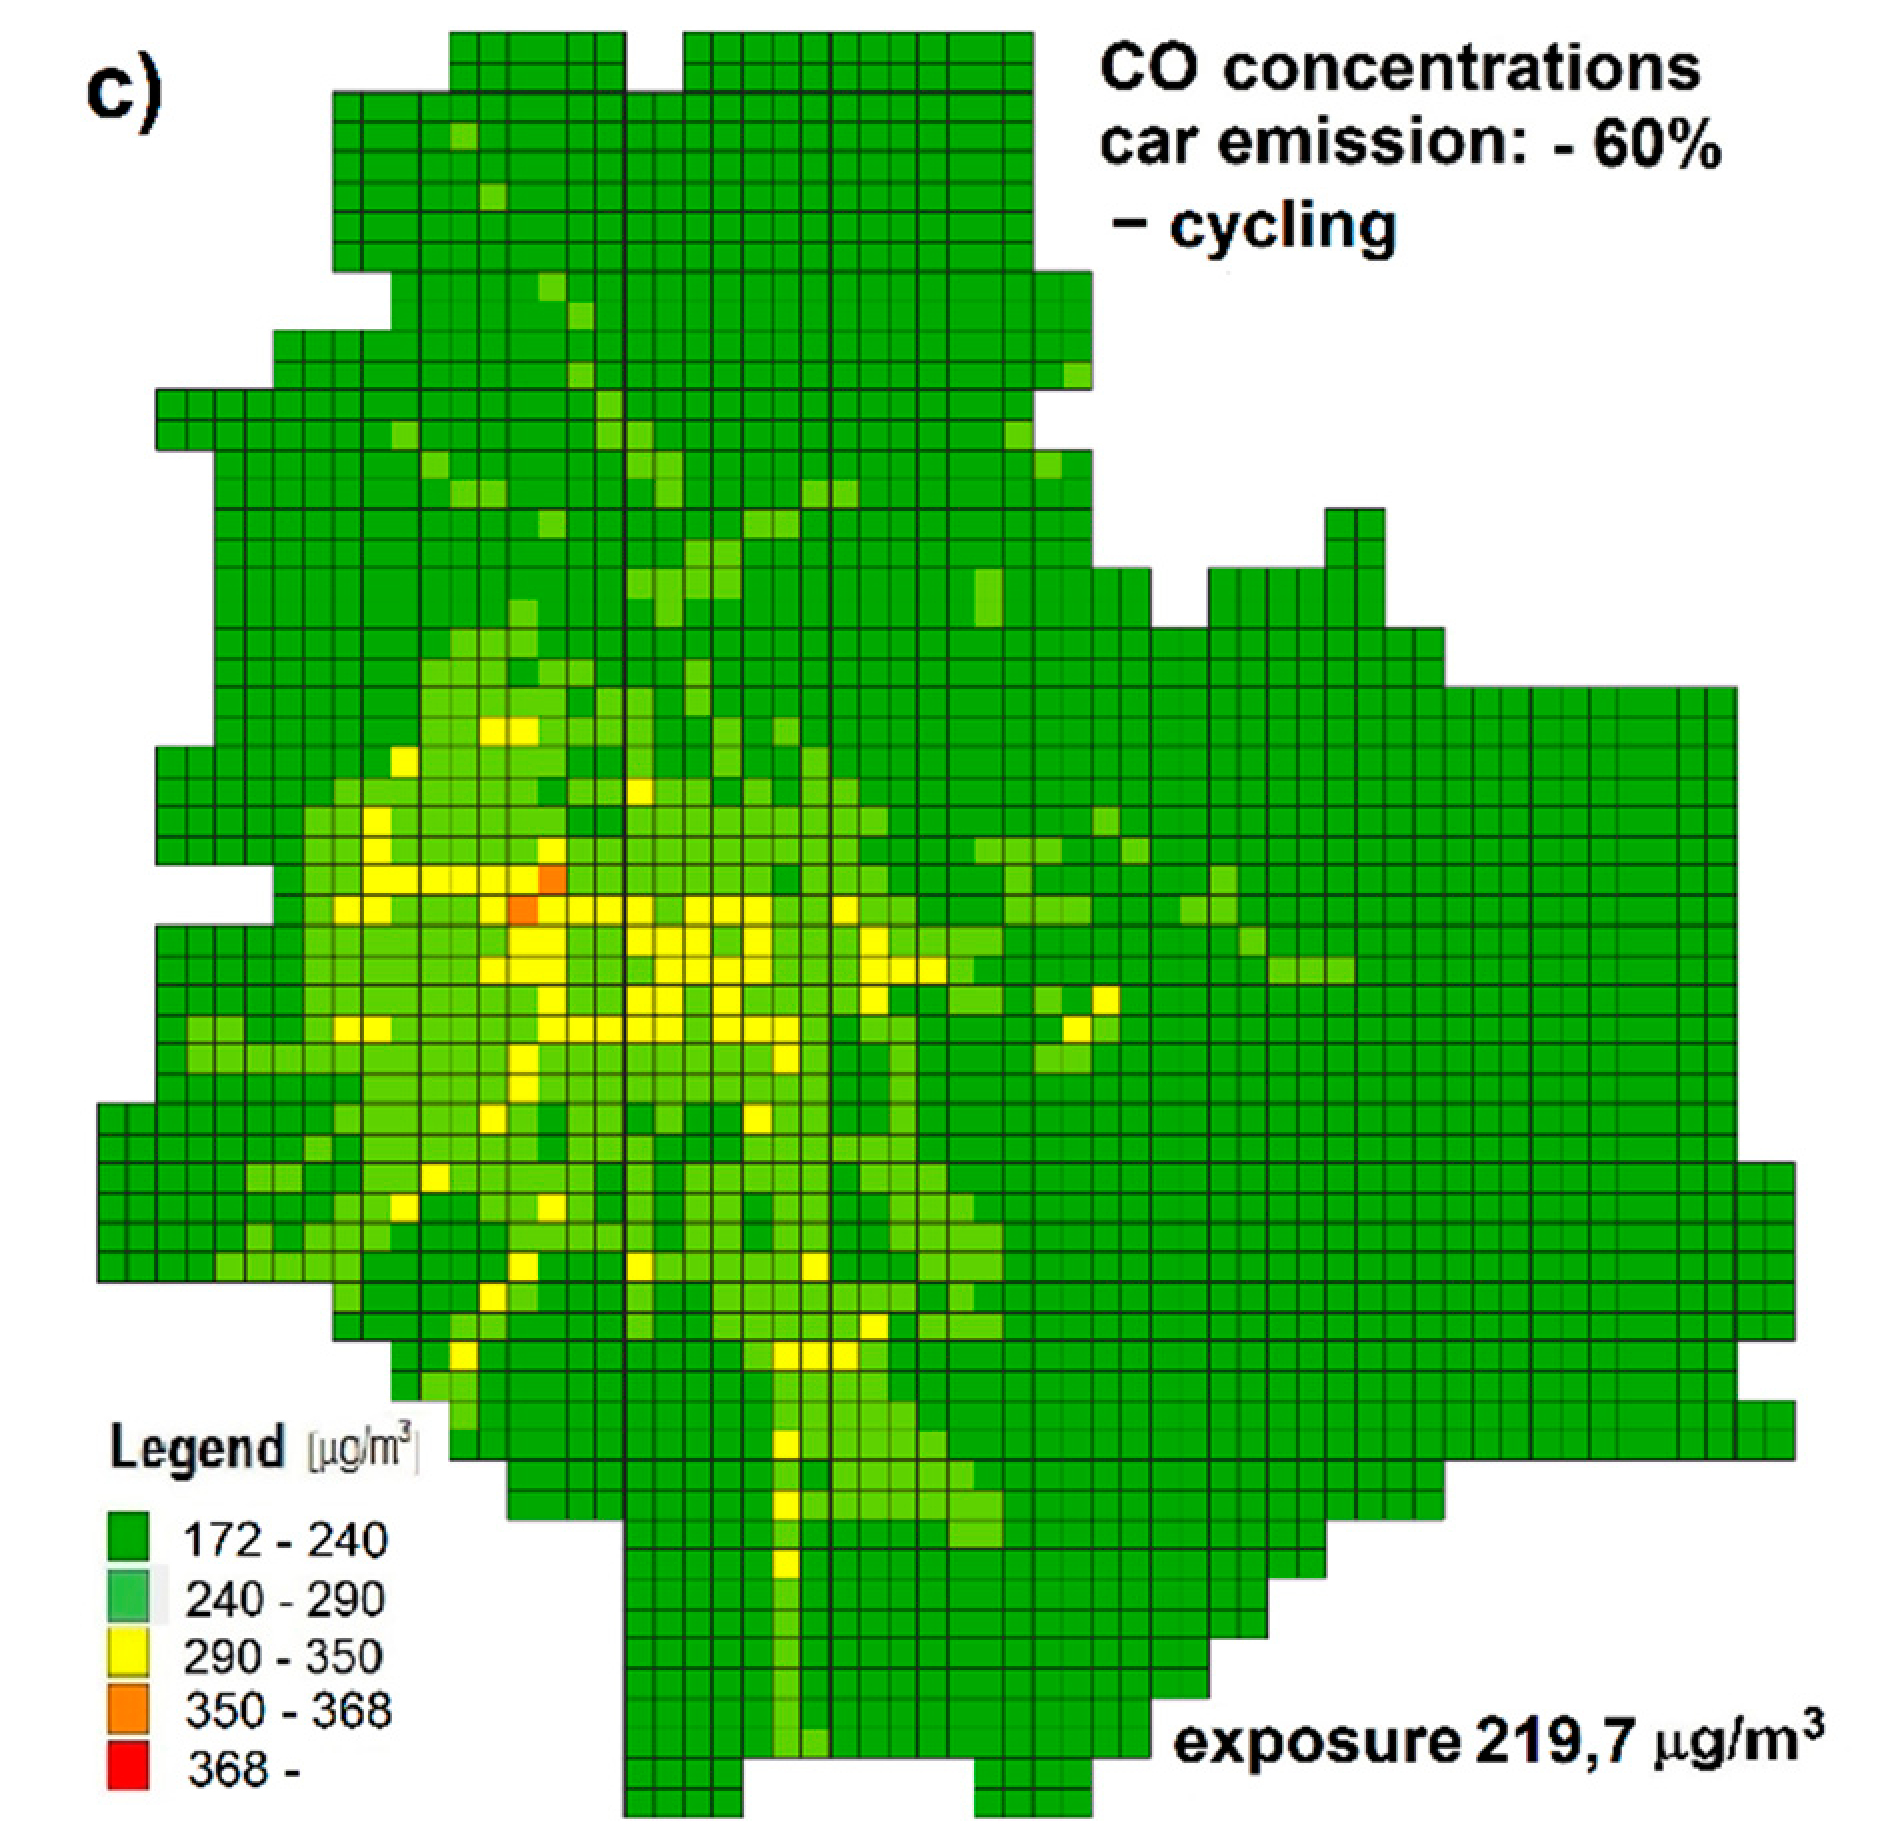
Since CO pollution attributed to line-source emission (52% share) comes almost exclusively from passenger (gasoline) car traffic, the final effect of substituting it by cycling is more evident than in the case of NOx pollution. Figure 4 presents the spatial maps of CO concentrations for baseline emissions (Figure 4a), for implemented Euro 6 emission standards in passenger cars (Figure 4b), and for the additional effect of increased cycling (Figure 4c). A significant improvement in the air quality here is mainly due to the high emission standards applied, but the partial replacement of car traffic by bicycles causes a visible reduction in maximum concentration by 8 μg/m3 and population exposure by 2.5 μg/m3. The respective reduction in CO concentration refers to the entire map, including the minimum value.
Figure 4.
(a) The baseline CO concentration; (b) +Euro 6 emission standards implemented for passenger car traffic; (c) +traffic partially substituted by cycling.
Figure 4.
(a) The baseline CO concentration; (b) +Euro 6 emission standards implemented for passenger car traffic; (c) +traffic partially substituted by cycling.


3.3. The Particulate Matter
As seen from [16], road traffic significantly contributes to the particulate matter pollution of an urban area, especially in the case of PM10 concentration (33%). However, in this case, implementation of the Euro 6 emission standards will bring only a slight improvement in air quality, for at least two reasons. First of all, PM10 pollution emitted by vehicles consists of two components: fraction emitted directly by moving vehicles (primary emission) and resuspended one (secondary emission). As for the rest of the pollution, it comes from all types of sources, including external inflow.
Measurements carried out in Warsaw (Table 2; [24]) revealed that the secondary emission of PM10 accounts for about 82% of the total volume. Moreover, the remaining 18% (primary emission) also consists of two components: emissions from fuel combustion and from friction (abrasion of tires, brake linings, etc.). As a result, fuel combustion has only about a 12% share in PM10 total emission. Hence, ultimately, implementation of the Euro 6 emission standards in passenger cars and busses can reduce concentration in the city only about 2–3% of PM10, with a minor improvement that can be seen only in the central districts.
Contributions of the primary and resuspended fractions of the final PM2.5 emissions are more balanced (compare Table 2), with the share of the fuel combustion being dominant. However, due to the relatively small contribution of vehicle traffic [20] to the overall PM2.5 pollution (below 8%), the final air quality improvement from implementing Euro 6 standards in the transportation sector is also minor (below 3%).
Since the use of cycling in urban transportation concerns a possible reduction in passenger car traffic only, the resulting impact on PM concentrations will be also minor. Assuming approximately 50% share of passenger cars in particulate matter emissions, utilizing cycling can reduce an average concentration, as well as the related population exposure, for PM10 by about 0.4–0.5%, and for PM2.5 by less than 0.1%. In the concentration maps, this will be visible as a slight reduction in the maximum value, compared with the baseline state (A similar effect can be seen in Figure 3b for NOx concentration).
As shown in [16], a significant reduction in PM concentrations, as well as B(a)P pollution, requires a decisive modernization of the municipal sector.
4. Discussion and Conclusions
The paper analyzed emission scenarios of vehicle fleet modernization in Warsaw, aimed at mitigation of the traffic-related air pollution and the related health impact. Similar to other Eastern European conurbations, road traffic in Warsaw has a large share of vehicles meeting only pre-E4 emission standards [6]. This means there is a significant potential for improving air quality through the implementation of low-emission technologies, which was confirmed (especially in the case of NOx concentrations) by the results presented in Section 3.
Regarding the pre-modernization impact of the transport sector on air quality degradation in the city, the total concentrations of NOx, PM10, PM2.5, B(a)P exceed the WHO limit values, while the CO limit is not exceeded. The contribution of individual vehicle categories (diesel or gasoline) varies depending on the type of pollution. Diesel engines definitely have a dominating contribution to NOx emissions. Gasoline passenger car emissions have the greatest impact on CO concentrations, as shown in Figure 4, where buses and other diesel vehicles have practically no impact. Hence, the modernization of passenger car fleets, particularly concerning diesel vehicles, will improve the urban air quality, mainly due to the significant reduction in NOx pollution (Figure 3). The development of bicycle transportation that replaces car transportation does not considerably improve the urban air quality. However, the impact of this change is slightly more visible in the case of CO concentration, as a result of the dominant impact of passenger cars on this type of pollution (Figure 4). Nevertheless, bicycling is beneficial for health [25,26,27]. In the long run, one can also expect a visible improvement in NOx pollution due to a clearly growing share of hybrid and electric vehicles.
As stated above, vehicles have a considerable share in PM10 pollution (33%), but the possible final effects of emission reduction are very small in this case. There are two reasons for this result: (a) low-emission vehicles (also hybrid/electric) reduce approximately 18% of vehicles’ primary emissions, compared with 82% of the secondary (resuspended) emissions; (b) only about 11% of the total emission is due to fuel combustion, while the rest comes from friction or resuspension (cf. Table 2). Hence, implementation of any low-emission technology can result in about a 2–3% reduction in final PM10 concentration, which is mainly visible in the city center. The basic fractions of PM2.5 emissions are more distributed (Table 2), but due to the rather small contribution of cars to the total PM2.5 pollution, the final result is also minor. However, a comprehensive effort toward the modernization of road vehicles, together with modernization of HDV diesel vehicles and buses by their replacement with low-emission ones leads to a considerable reduction in the pollution of nitrogen oxides (NOx), carbon monoxide (CO), and—although to a lesser extent—PMs, B(a)P, SOx, BaP, and C6H6. As a result, it undoubtedly contributes to the improvement in urban air quality.
An additional issue to address is the influence of the emission reduction on health effects. As indicated in [20,28], the total NOx pollution in Warsaw causes a substantial population health risk and is responsible for about 16% of the attributable deaths (non-accidental mortality), 14% of which is assigned directly to the traffic-originated pollution. Modernization of passenger vehicles, including buses, as well as trucks and vans, cause, respectively, a 23%, 35%, and 47% decrease in the inhabitants’ exposure to NOx. Proportionally, this means, respectively, a decrease of 87,133 and 179 attributable yearly deaths (out of the baseline 380). Despite the dominant influence of PM2.5 on the assigned mortality rates of residents (82%), the effect of vehicle fleet modernization, in this case, is minor, due to a small share of vehicles (~3%) against a massive impact of area-source pollution and transboundary inflow (share of 45%). A similar remark concerns also other pollutants related to road traffic that have an insignificant share in air pollution, such as B(a)P or SO2. This is due to the fact that the above pollutions are also emitted by the municipal sector, whose contribution is dominant. It is additionally increased due to a large share of external inflow from Warsaw surroundings. Hence, abatement of the municipal sector emission and transboundary inflow would help more in improving Warsaw air quality and decreasing population health risk. Implementation of the latter abatement policy is, however, more troublesome, also because the abatement of transboundary flow requires national authorities to be involved.
Supplementary Materials
The following are available online at https://www.mdpi.com/article/10.3390/atmos12121581/s1, Table S1. Euro Norms for the gasoline cars. Table S2. Euro Norms for the diesel cars. Table S3. Euro Norms for HDV diesel cars.
Author Contributions
Conceptualization, P.H.; methodology, P.H. and Z.N.; validation, P.H., Z.N. and A.K.; formal analysis, Z.N.; resources, A.K.; data curation, A.K.; writing—original draft preparation, P.H.; writing—review and editing, Z.N. All authors have read and agreed to the published version of the manuscript.
Funding
This research received no external funding.
Institutional Review Board Statement
Not applicable.
Informed Consent Statement
Not applicable.
Data Availability Statement
Not applicable.
Acknowledgments
Research conducted by Z. Nahorski was partially supported by the National Science Center, Poland under the Grant DEC-2018/30/Q/HS4/00764.
Conflicts of Interest
The authors declare no conflict of interest.
References
- EC. Urban Air Pollution–What Are the Main Sources across the World? 2015. Available online: https://ec.europa.eu/jrc/en/news/what-are-main-sources-urban-air-pollution (accessed on 20 November 2021).
- WHO. Database on Source Apportionment Studies for Particulate Matter in the Air (PM10 and PM2.5). 2015. Available online: https://www.who.int/quantifying_ehimpacts/global/source_apport/en/ (accessed on 20 November 2021).
- EC; AAQD. Directive 2008/50/EC of the European Parliament and of the Council of 21 May 2008 on Ambient Air Quality and Cleaner Air for Europe. 2008. Available online: https://eur-lex.europa.eu/eli/dir/2008/50/oj (accessed on 20 November 2021).
- EEA. Air Quality in Europe—2019 Report. EEA Report, No 10. 2019. Available online: https://www.eea.europa.eu/publications/air-quality-in-europe-2019 (accessed on 20 November 2021).
- WHO. Ambient (Outdoor) Air Pollution. 2018. Available online: https://www.who.int/news-room/fact-sheets/detail/ambient- (accessed on 20 November 2021).
- Degraeuwe, B.; Pisoni, E.; Peduzzi, E.; De Meij, A.; Monforti-Ferrario, F.; Bodis, K.; Mascherpa, A.; Astorga-Llorens, M.; Thunis, P.; Vignati, E. Urban NO2 Atlas (EUR 29943 EN); Publications Office of the European Union: Luxembourg, 2019. [Google Scholar]
- EC. Air Quality: Traffic Measures Could Effectively Reduce NO2 Concentrations by 40% in Cities. 2019. Available online: https://ec.europa.eu/jrc/en/news/air-quality-traffic-measures-could-effectively-reduce-no2-concentrations-40-europe-s-cities (accessed on 20 November 2021).
- Berkowicz, R.; Winther, M.; Ketzel, M. Traffic pollution modelling and emission data. Environ. Model. Softw. 2016, 21, 454–460. [Google Scholar] [CrossRef]
- Buchholz, S.; Krein, A.; Junk, J.; Heinemann, G.; Hoffmann, L. Simulation of Urban-Scale Air Pollution Patterns in Luxembourg: Contributing Sources and Emission Scenarios. Environ. Model. Assess. 2013, 18, 271–283. [Google Scholar] [CrossRef]
- Calori, G.; Clemente, M.; De Maria, R.; Finardi, S.; Lollobrigida, F.; Tinarelli, G. Air quality integrated modelling in Turin urban area. Environ. Model. Softw. 2006, 21, 468–476. [Google Scholar] [CrossRef]
- Mediavilla-Sahagún, A.; ApSimon, H.M. Urban scale integrated assessment for London: Which emission reduction strategies are more effective in attaining prescribed PM10 air quality standards by 2005? Environ. Model. Softw. 2006, 21, 501–513. [Google Scholar] [CrossRef]
- Rith, M.; Fillone, A.M.; Biona, J.B.M.M. Energy and environmental benefits and policy implications for private passenger vehicles in an emerging metropolis of Southern Asia–A case study of Metro Manila. Appl. Energy 2020, 275, 115240. [Google Scholar] [CrossRef] [PubMed]
- Pisoni, E.; Thunis, P.; Clappier, A. Application of the SHERPA source-receptor relationships, based on the EMEP MSC-W model, for the assessment of air quality policy scenarios. Atmos. Environ. X 2019, 4, 100047. [Google Scholar] [CrossRef]
- Thunis, P.; Degraeuwe, B.; Pisoni, E.; Ferrari, F.; Clappier, A. On the design and assessment of regional air quality plans: The SHERPA approach. J. Environ. Manag. 2016, 183, 952–958. [Google Scholar] [CrossRef] [PubMed]
- Degraeuwe, B.; Thunis, P.; Clappier, A.; Weiss, M.; Lefebvre, W.; Janssen, S.; Vranckx, S. Impact of passenger car NOx emissions on urban NO2 pollution–Scenario analysis for 8 European cities. Atmos. Environ. 2017, 171, 330–337. [Google Scholar] [CrossRef]
- Holnicki, P.; Kałuszko, A.; Nahorski, Z. Analysis of emission abatement scenario to improve urban air quality. Arch. Environ. Prot. 2021, 47, 103–114. [Google Scholar] [CrossRef]
- Available online: https://smoglab.pl/warszawa-ma-prawie-dwa-razy-wiecej-zarejestrowa-nych-pojazdow-na-km2-niz-krakow-wroclaw-i-berlin (accessed on 20 October 2019). (In Polish).
- Available online: https://www.auto-swiat.pl/wiadomosci/aktualnosci/czy-w-warszawie-naprawde-jest-wiecej-aut-niz-mieszkancow/4xqb44s (accessed on 20 September 2021). (In Polish).
- Kiesewetter, G.; Borken-Kleefeld, J.; Schöpp, W.; Heyes, C.; Thunis, P.; Bessagnet, B.; Terrenoire, E.; Gsella, A.; Amann, M. Modelling NO2 concentrations at the street level in the GAINS integrated assessment model: Projections under current legislation. Atmos. Chem. Phys. 2014, 14, 813–829. [Google Scholar] [CrossRef] [Green Version]
- Holnicki, P.; Tainio, M.; Kałuszko, A.; Nahorski, Z. Burden of mortality and disease attributable to multiple air pollutants in Warsaw, Poland. Int. J. Environ. Res. Public Health 2017, 14, 1359. [Google Scholar] [CrossRef] [PubMed] [Green Version]
- Available online: https://um.warszawa.pl/waw/rowery/-/pomiary-ruchu-rowerowego-2020-1 (accessed on 5 July 2021). (In Polish).
- Kwiatkowski, M.A.; Szymańska, D. Cycling policy in strategic documents of Polish cities. Environ. Dev. Sustain. 2021, 23, 10357–10377. [Google Scholar] [CrossRef]
- Available online: https://www.portalsamorzadowy.pl/wydarzenia-lokalne/warszawa-spadla-liczba-rejestracji-ale-rosnie-ilosc-samochodow-z-napedem-ekologicznym,252401 (accessed on 8 October 2020). (In Polish).
- Voivodship Inspectorate of Environment Protection. Report for the Year 2012. (WIOŚ 2012). Environment Quality in Mazovian Voivodship in the Year 2012. Available online: https://keep.eu/partners/6593/Voivodship-Inspectorate-of-EEN/ (accessed on 20 September 2021). (In Polish).
- Tainio, M.; de Nazelle, A.J.; Götschi, T.; Kahlmeier, S.; Rojas-Rueda, D.; Nieuwenhuijsen, M.J.; de Sá, T.H.; Kelly, P.; Woodcock, J. Can air pollution negate the health benefits of cycling and walking? Prev. Med. 2016, 87, 233–236. [Google Scholar] [CrossRef] [PubMed] [Green Version]
- Zapata-Diomedi, B.; Knibbs, L.D.; Ware, R.S.; Heesch, K.C.; Tainio, M.; Woodcock, J.; Veerman, J.L. A shift from motorised travel to active transport: What are the potential health gains for an Australian city? PLoS ONE 2017, 12, e0184799. [Google Scholar] [CrossRef] [PubMed] [Green Version]
- Giallouros, G.; Kouis, P.; Papatheodorou, S.I.; Woodcock, J.; Tainio, M. The long-term impact of restricting cycling and walking during high air pollution days on all-cause mortality: Health impact Assessment study. Environ. Int. 2020, 140, 105679. [Google Scholar] [CrossRef] [PubMed]
- Tainio, M. Burden of disease caused by local transport in Warsaw, Poland. J. Transp. Health 2015, 2, 423–433. [Google Scholar] [CrossRef] [PubMed] [Green Version]
Figure 2.
Annual distribution of bicycle traffic in Warsaw (bike/month) (y-axis) in the following months (x-axis) of the year 2019, based on street measurements [21].
Figure 2.
Annual distribution of bicycle traffic in Warsaw (bike/month) (y-axis) in the following months (x-axis) of the year 2019, based on street measurements [21].

Figure 3.
NOx concentrations: (a) baseline emission; (b) +Euro 6 emission standards in passenger cars (emission −60%, included bikes and hybrid/electric cars); (c) +bus emission reduction (−60%); (d) +Euro 5 emission standards met by trucks and vans (emission −60%).
Figure 3.
NOx concentrations: (a) baseline emission; (b) +Euro 6 emission standards in passenger cars (emission −60%, included bikes and hybrid/electric cars); (c) +bus emission reduction (−60%); (d) +Euro 5 emission standards met by trucks and vans (emission −60%).


Table 1.
Reference NO2 vehicle emissions in Warsaw per fuel and Euro emission standards.
| Euro Standard | Distance [km×106] | Emis. Rate [g/km] | Emission [kg × 103] | Share [%] | Share | |
|---|---|---|---|---|---|---|
| GASOLINE | E0 | 789 | 2.5 | 1974 | 2% | 17,000 (19%) |
| E1 | 15,789 | 0.45 | 7105 | 8% | ||
| E2 | 24,737 | 0.25 | 6184 | 7% | ||
| E3 | 11,579 | 0.15 | 1737 | 2% | ||
| E4–E6 | 13,684 | 0.1 | 1368 | 2% | 1368 | |
| emission | 18,368 | 21% | 18,368 | |||
| DIESEL | E0 | 6316 | 0.66 | 4168 | 5% | 52,742 (59%) |
| E1 | 25,789 | 0.73 | 18,826 | 22% | ||
| E2 | 24,211 | 0.8 | 19,368 | 22% | ||
| E3 | 11,579 | 0.83 | 96,11 | 11% | ||
| E4–E6 | 26,316 | 0.65 | 17,105 | 20% | 17,105 | |
| emission | 69,079 | 79% | 69,847 | |||
| TOTAL | 87,447 | 100% | ||||
Table 2.
Emissions of particulate matter from the transportation sector in Warsaw.
| Emission | PM10 | PM2.5 | |||
|---|---|---|---|---|---|
| [Mg/y] | [%] | [Mg/y] | [%] | ||
| Primary | Combustion | 554 | 11.5 | 471 | 41 |
| Abrasion | 308 | 6.5 | 104 | 9 | |
| Re-suspended | 3910 | 81.9 | 566 | 50 | |
| TOTAL | 4772 | 100 | 1141 | 100 | |
Publisher’s Note: MDPI stays neutral with regard to jurisdictional claims in published maps and institutional affiliations. |
© 2021 by the authors. Licensee MDPI, Basel, Switzerland. This article is an open access article distributed under the terms and conditions of the Creative Commons Attribution (CC BY) license (https://creativecommons.org/licenses/by/4.0/).
Share and Cite
MDPI and ACS Style
Holnicki, P.; Nahorski, Z.; Kałuszko, A. Impact of Vehicle Fleet Modernization on the Traffic-Originated Air Pollution in an Urban Area—A Case Study. Atmosphere 2021, 12, 1581. https://doi.org/10.3390/atmos12121581
AMA Style
Holnicki P, Nahorski Z, Kałuszko A. Impact of Vehicle Fleet Modernization on the Traffic-Originated Air Pollution in an Urban Area—A Case Study. Atmosphere. 2021; 12(12):1581. https://doi.org/10.3390/atmos12121581
Chicago/Turabian StyleHolnicki, Piotr, Zbigniew Nahorski, and Andrzej Kałuszko. 2021. "Impact of Vehicle Fleet Modernization on the Traffic-Originated Air Pollution in an Urban Area—A Case Study" Atmosphere 12, no. 12: 1581. https://doi.org/10.3390/atmos12121581
Note that from the first issue of 2016, this journal uses article numbers instead of page numbers. See further details here.