Key Features and Adverse Weather of the Named Subtropical Cyclones over the Southwestern South Atlantic Ocean

1
Instituto de Recursos Naturais (UNIFEI), Universidade Federal de Itajubá, Itajubá, MG 37500-903, Brazil
2
Departamento de Ciências Atmosféricas, Universidade de São Paulo (USP), São Paulo, SP 05508-090, Brazil
*
Author to whom correspondence should be addressed.
Atmosphere 2019, 10(1), 6; https://doi.org/10.3390/atmos10010006
Submission received: 12 November 2018
/
Revised: 14 December 2018
/
Accepted: 20 December 2018
/
Published: 27 December 2018
(This article belongs to the Special Issue Weather and Climate Extremes: Current Developments)
Abstract
:This work documents the main features of six subtropical cyclones occurred between the years 2010 and 2016 over the southwestern South Atlantic Ocean, near the Brazilian coast, which received names (with the exception of one) from the Brazilian Navy Hydrographic Center. The fine-resolution ERA5 reanalysis and rainfall estimates from the Tropical Rainfall Measuring Mission (TRMM) were used to describe the synoptic environment and the adverse weather conditions during the six events. The support of a small-amplitude trough at mid-levels or a cut-off low, weak vertical wind shear, and moisture flux convergence are the main features contributing to the subtropical cyclogenesis at the surface. On the other hand, sea surface temperature (SST) presents a secondary contribution since the cyclones develop over the ocean with a wide range of SST values (from 22.5 °C to 28.6 °C in the initial phase of cyclones). The six subtropical cyclones are less deep in the atmosphere column than the tropical ones and, unlike the extratropical cyclones, they have little or no westward tilt with an increase in height. The studied subtropical cyclones produced adverse weather conditions such as (a) strong winds (reaching 17 m·s−1 at 10 m high) for a long period occurring east/southeastward of the cyclone center, and (b) high amounts of rainfall along the southeastern coast of Brazil, where the accumulated rainfall varied between 170 to 350 mm, being in most cases higher than the monthly climatology. Over the continent, the Brazilian states of Rio de Janeiro and Espírito Santo were the most affected by the intense rainfall associated with the cyclones.
1. Introduction
Cyclones are one of the most studied atmospheric systems as they produce abrupt weather changes with great societal impacts and are a major factor in controlling the global climate [1]. Synoptic scale cyclones are normally classified as extratropical, subtropical, and tropical according to their physical characteristics [2,3]. In terms of the thermal structure, tropical cyclones have a warm core in all the troposphere, while extratropical cyclones have a cold core. On the other hand, subtropical (or hybrid) cyclones present a warm core at low levels, which is similar to the tropical cyclones, and a cold core at upper levels, as normally observed in the extratropical cyclones [4,5,6].
Although subtropical cyclones have been mentioned in the literature since the 1960s (e.g., Reference [7]), greater attention to these systems only occurred after Reference [4] had developed the Cyclone Phase Space (CPS) methodology to classify cyclone types. The CPS application has contributed to the identification of subtropical cyclones over different oceanic basins, as synthesized by Reference [8], and with this information some studies have investigated their precursors. According to the References [6,8,9,10,11,12,13], the genesis of the subtropical cyclones is generally associated with a weak cyclonic anomaly at the surface, which is dynamically supported by the presence of a trough or cut-off low at the mid-upper levels of the troposphere.
The attention of researchers and weather forecasters to the genesis of subtropical cyclones over the southwestern South Atlantic Ocean (SAO) was attracted with the occurrence of the first documented hurricane in March 2004 [14,15,16], called hurricane Catarina, once this system resulted from a tropical transition (an extratropical disturbance evolved to subtropical and after to a tropical cyclone). Until Catarina, little or no attention was given to the tropical development over the SAO due to unfavorable environmental conditions for tropical systems, i.e., the necessity of a sea surface temperature (SST) warmer than 26.5 °C and a weak vertical wind shear (lower than 8 m·s−1 between the 200 and 850 hPa vector winds) [7,15]. Although, climatologically, the SAO does not present these conditions, certain combinations of the atmospheric environment can propitiate them as occurred during Catarina. References [14,15] described that Catarina began as an extratropical cyclone moving east-southeastward off the Brazilian coast. When it encountered a dipole-blocking structure at mid-levels, which propitiated weak vertical wind shear, Catarina transitioned from an extratropical to a tropical storm. The blocking pattern, beyond favoring the conditions for the tropical transition of Catarina, also changed the basic flow at mid-upper levels (providing easterly winds) helping the westward movement of Catarina, in the direction of the southern Brazilian coast [14].
After Catarina, the first subtropical cyclone over the SAO that received a name was Anita, occurring in March 2010 [3,11,17,18]. References [11,12,13,14,15,16,17] studied the lifecycle of Anita and documented the presence of a dipole-blocking pattern at mid-upper levels, which provided weak vertical wind shear and, consequently, adequate conditions for the cyclone intensification. Moreover, Reference [11] suggested that Anita did not transition to a tropical cyclone near the Brazilian coast because its semi-stationary behavior contributed to both rainfall and the mix of the upper level layer of ocean that helped weaken the sea–air turbulent heat fluxes. Catarina and Anita encouraged the climatological study of the subtropical cyclones over the SAO in the following years (2012–2014). Reference [19] found a frequency of 1.2 systems per year, while Reference [6] obtained a frequency of 7.2 systems per year. This difference is explained by the less restrictive criteria applied by Reference [6] to identify the subtropical cyclones, i.e., Reference [6] did not impose the need of closed low at upper levels or the requirement of maximum wind at 925 hPa reaching 17 m·s−1 to characterize a subtropical cyclone. According to Reference [6], the subtropical cyclones are more frequent in the austral summer.
Both the Catarina and Anita names were attributed by an agreement among the meteorological centers from Brazil. In 2011, the Brazilian Navy Hydrographic Center established a list with official names, based on the Tupi Guarani indigenous language, for subtropical and tropical cyclones occurring over the SAO [20]. From 2010 to 2016, five subtropical cyclones were named by the Brazilian Navy Hydrographic Center: Arani (November 2011), Bapo (February 2015), Cari (March 2015), Deni (November 2016), and Eçaí (December 2016). All systems (including Anita) developed close to the southern/southeastern Brazilian coast, greatly influencing the weather conditions with intense winds and precipitation (as shown in Section 3). As until now, only Anita and Arani were documented [11,18], the purpose of this study was to describe the main synoptic features and associated adverse weather conditions during the lifecycle of these six subtropical cyclones. The analyses performed here use the new fine-horizontal-resolution ERA5 reanalysis and the Tropical Rainfall Measuring Mission (TRMM) rainfall estimates to characterize the synoptic environment and weather conditions during the lifecycle of the cyclones. The study is organized as follows: Section 2 describes the data and methodology. Section 3 presents the synoptic environment and the adverse weather conditions associated with the cyclones. Finally, the conclusions are in Section 4.
2. Data and Methodology
2.1. Data
As described in Table 1, we used data from two reanalyses (ERA5 and Climate Forecast System Reanalysis (CFSR)), and rainfall and brightness temperature estimates from satellites. ERA5, the fifth generation of the European Centre for Medium-Range Weather Forecasts (ECMWF) atmospheric reanalysis [21], was downloaded with a 0.3° horizontal grid every 6 h for atmospheric variables in pressure levels, and every 3 h for surface variables. Climate Forecast System Reanalysis [22] variables were obtained every 6 h with a resolution of 0.5°.
Satellite precipitation estimates from TRMM, version 3B42 [23], were employed to compute the precipitation associated with each cyclone. TRMM-3B42 has 0.25° of horizontal grid spacing and a time-frequency of 3 h. The cloudiness associated with the cyclones was shown through the brightness temperature obtained from the Gridded Satellite (GridSat-B1) data geostationary facilitates provided by the National Oceanic and Atmospheric Administration [24]. The Climate Data Record (CDR)-quality infrared window (IRWIN) methodology merges satellites (GOES, Meteosat, and GMS) by selecting the nadir-most observations for each grid point. These data are available every three hours on 0.07° of horizontal grid spacing for the period from 1980 to present.
2.2. Methods
2.2.1. Cyclone Tracking
The position every six hours of the subtropical cyclones was identified through the minima of relative vorticity obtained with the horizontal wind components at 925 hPa from ERA5 reanalysis. The relative vorticity allows identifying the circulation centers associated with the cyclones before their configuration (closed isobars) in the mean sea-level pressure [25].
2.2.2. Cyclone Classification
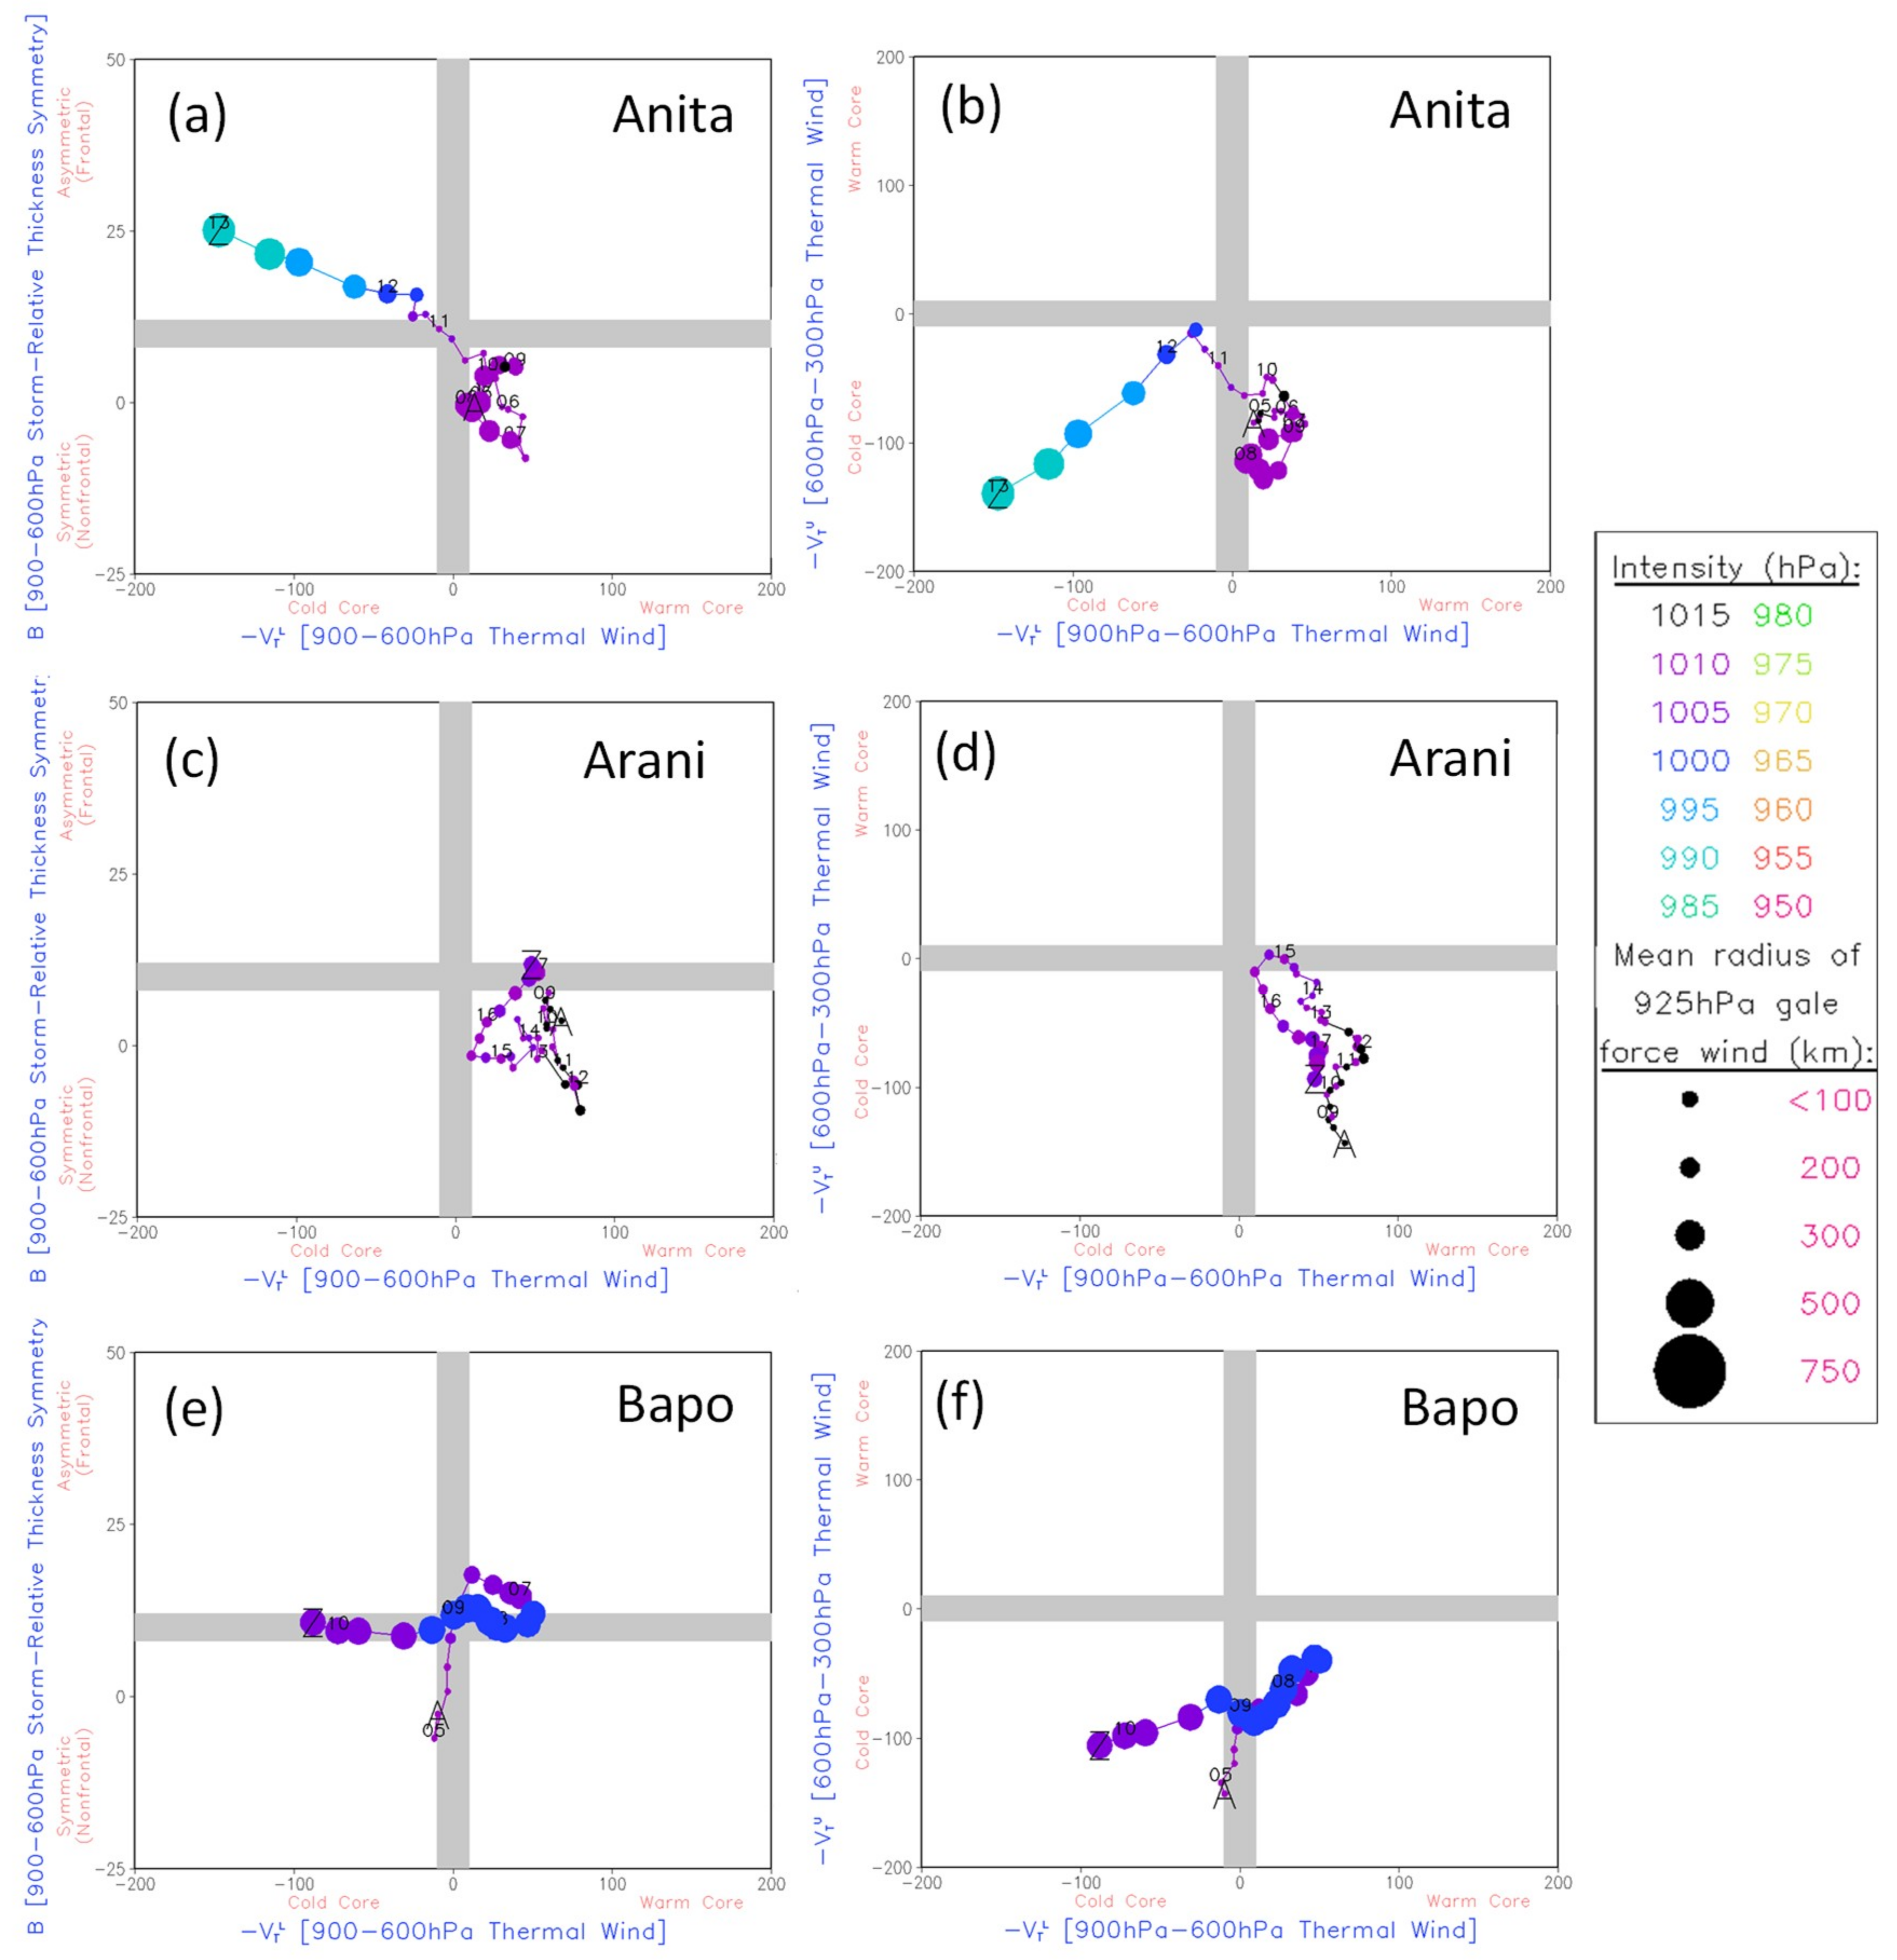
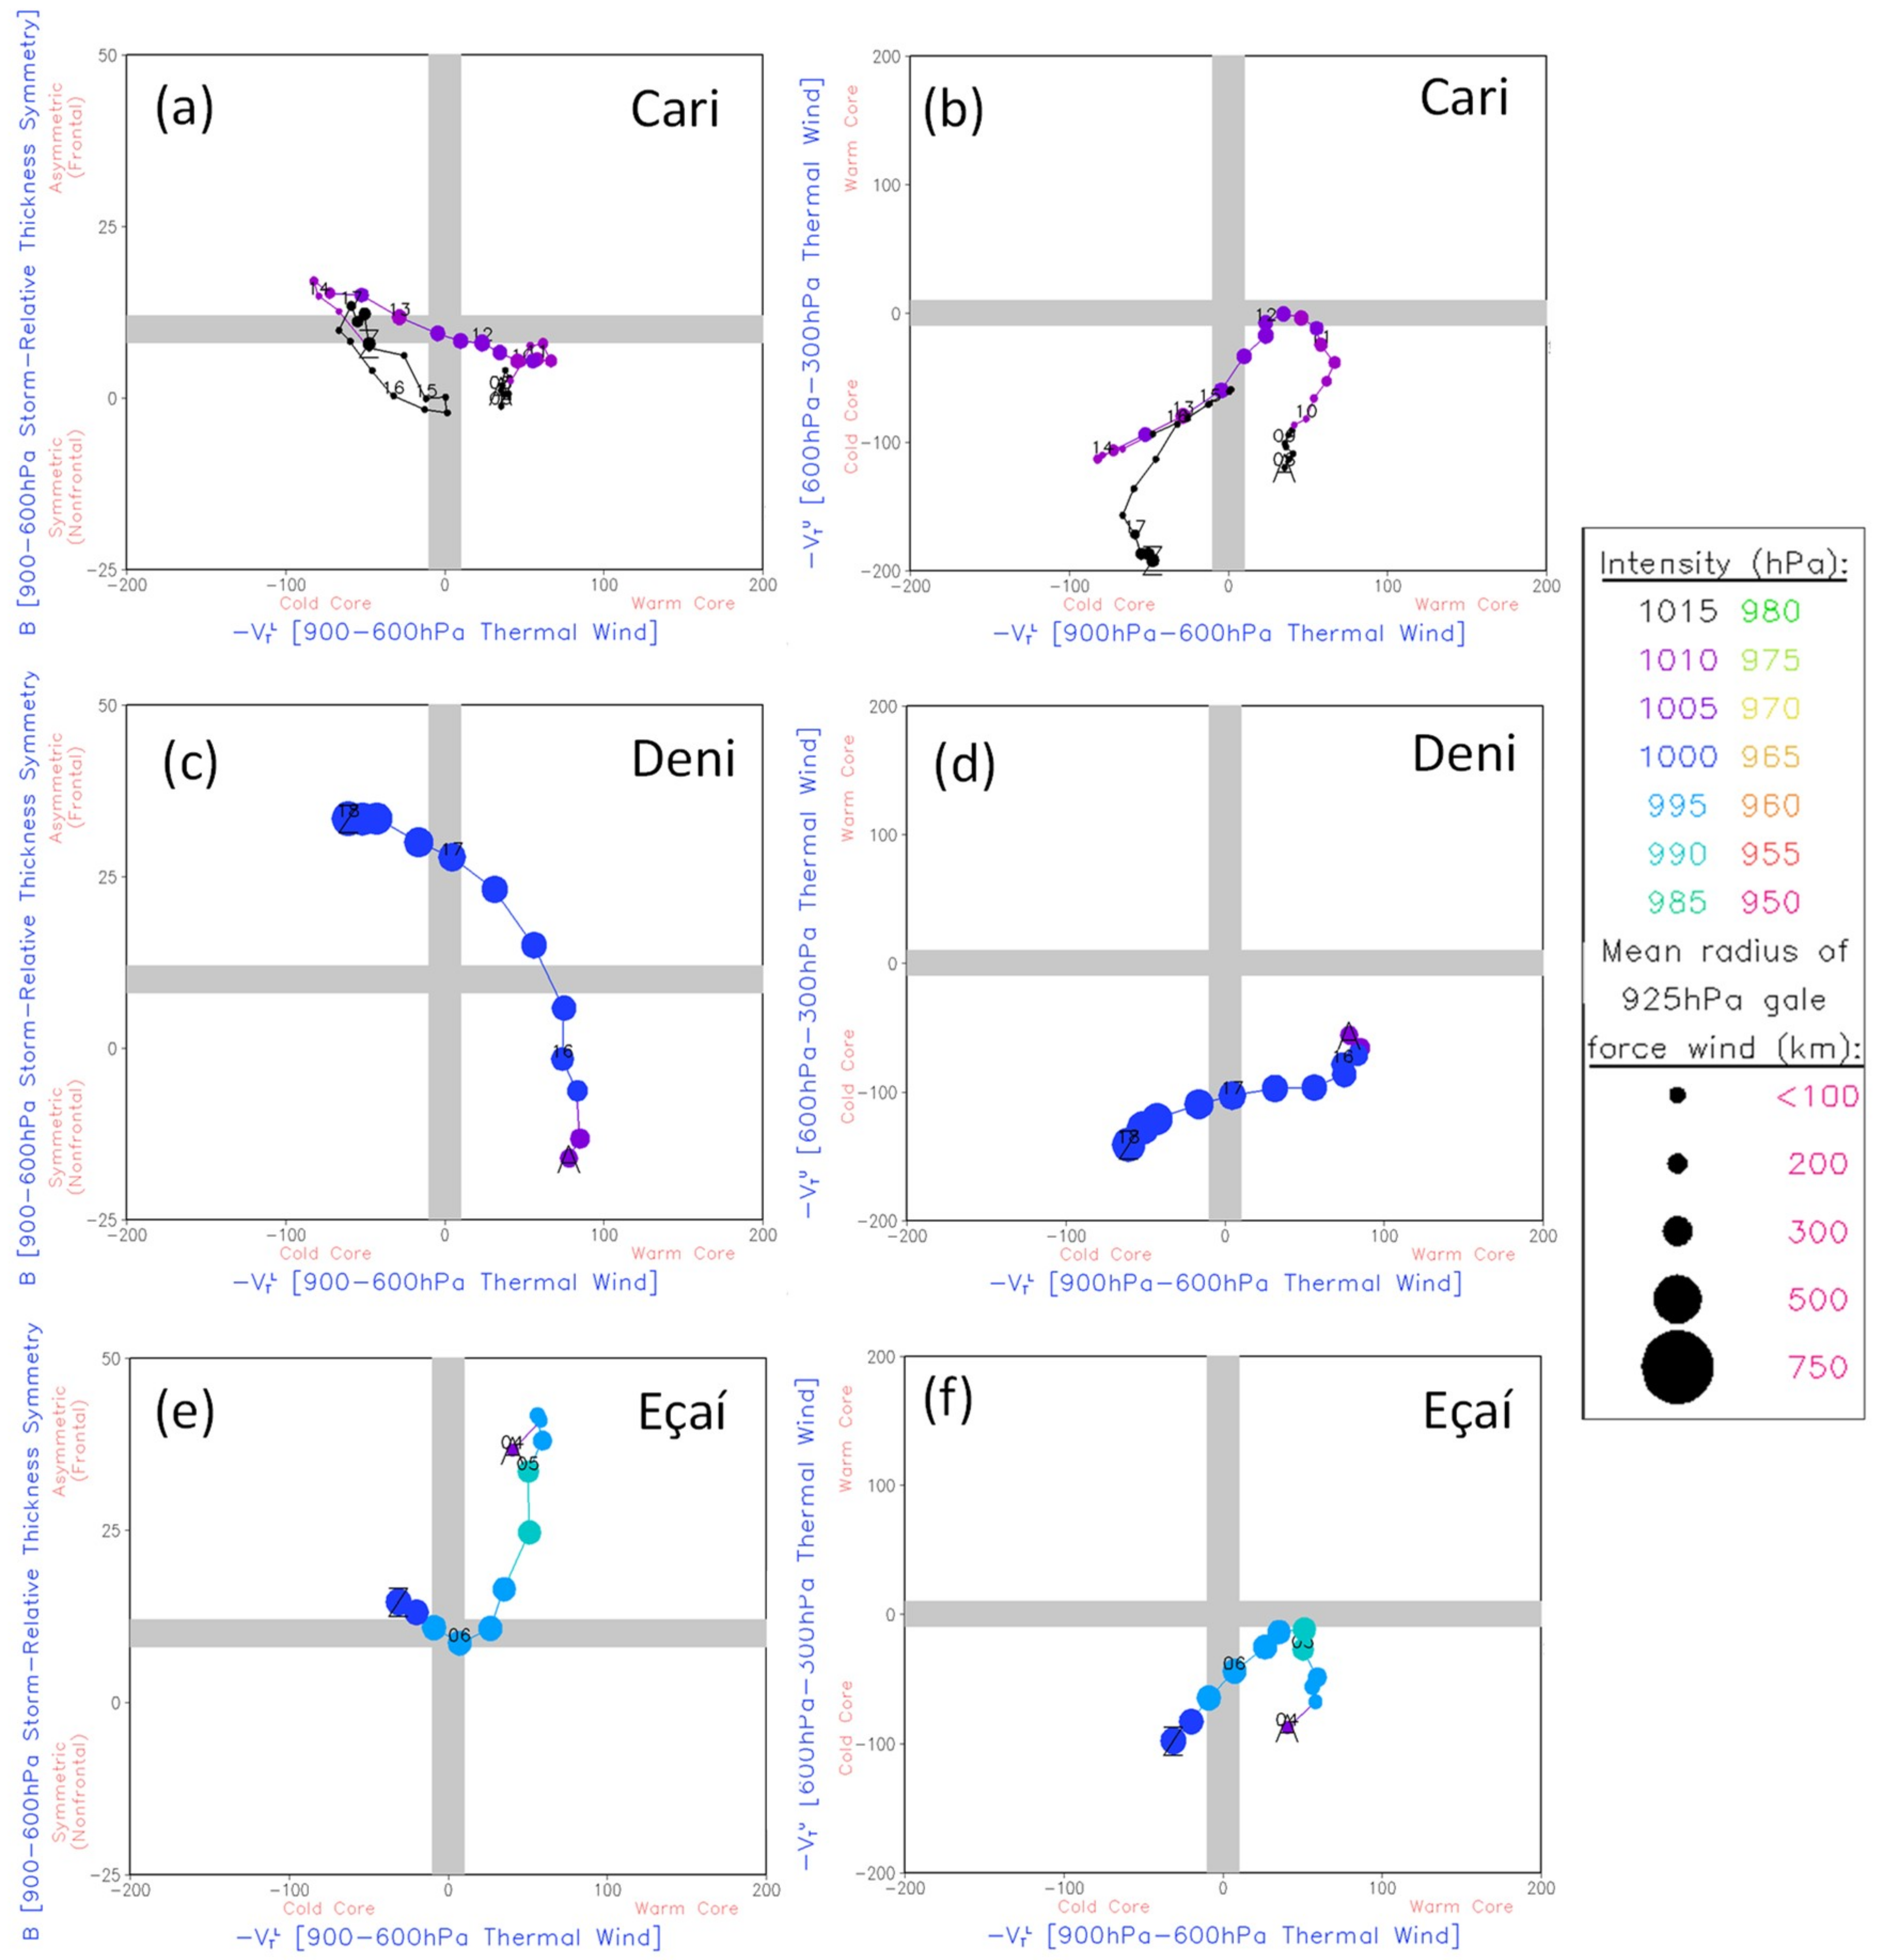
The six cyclones were characterized as subtropical using the Cyclone Phase Space (CPS) [4] parameters. CPS is an objective methodology, described in detail in References [4,6,8], which considers the thermal vertical structure to classify cyclone types. Three parameters are used in the CPS:thermal symmetry (B), and the low-level (–VTL) and upper-level (–VTU) thermal winds.. B measures the 900–600 hPa thickness difference between two semicircles (with a 500-km radius) centered in the surface low. For subtropical cyclones, the B threshold is −25 < B < 25 m. Thermal wind parameters are defined as the change in thickness between two pressure layers, i.e., 900–600 hPa (–VTL) and 600–300 hPa (–VTU). Thus, subtropical cyclones occur when the low-level warm core results in positive –VTL, while the cold core at upper levels results in negative –VTU. For the six studied cyclones, CPS parameters were computed based on the geopotential height of ERA5 and with the position of the cyclones (latitude, longitude, and date) obtained from the tracking procedure (Section 2.2.1).
2.2.3. Synoptic Analysis
Key synoptic features of the six subtropical cyclones during their genesis and maturity are discussed using different atmospheric and oceanic fields. As in Reference [13], the vertical wind shear (200 hPa minus 850 hPa) and the moisture content of the atmosphere were investigated, but using ERA5. Low values of vertical wind shear indicate a potential for the cloudiness organization in the subtropical cyclones [11,13], while the moisture content is also important for cloud formation and, indirectly, decreases the surface pressure. As the low values of vertical wind shear can be found in the regions of trough or cut-off low [11], to identify these systems, the geopotential height at 500 hPa was used.
More details related to the thermodynamic and dynamic properties of the cyclones were obtained through the vertical cross-sections of the relative vorticity and of the zonal departures of air temperature and geopotential height. As in the tropical cyclones, the transfer of energy from the ocean to the atmosphere should be important for the subtropical cyclone development, and this was investigated using the total heat fluxes (sensible plus latent) and the difference between SST and air temperature at 2 m high every 6 h.
2.2.4. Adverse Weather Conditions Caused by Subtropical Cyclones
Rainfall associated with cyclones was obtained by adding the accumulated precipitation every 3 h in a radius of 10° from the cyclone center. In this way, a map was produced showing the total precipitation following the cyclone trajectory. This methodology is similar to that of References [26,27]. The same idea was applied to calculate the time series of atmospheric variables (precipitation, latent (LH) and sensible (SH) heat fluxes, and maximum wind intensity at 925 hPa and 10 m high) following the cyclone trajectory, but we considered a radius of ~5° from the cyclone center (i.e., a box of 10° × 10° centered in the cyclones). In addition, the maximum wind at 925 hPa was also computed in a fixed box shown in Figure 1 and named RG1, once it is the region where Reference [6] found a high frequency of subtropical cyclones.
3. Results
3.1. Trajectory and CPS
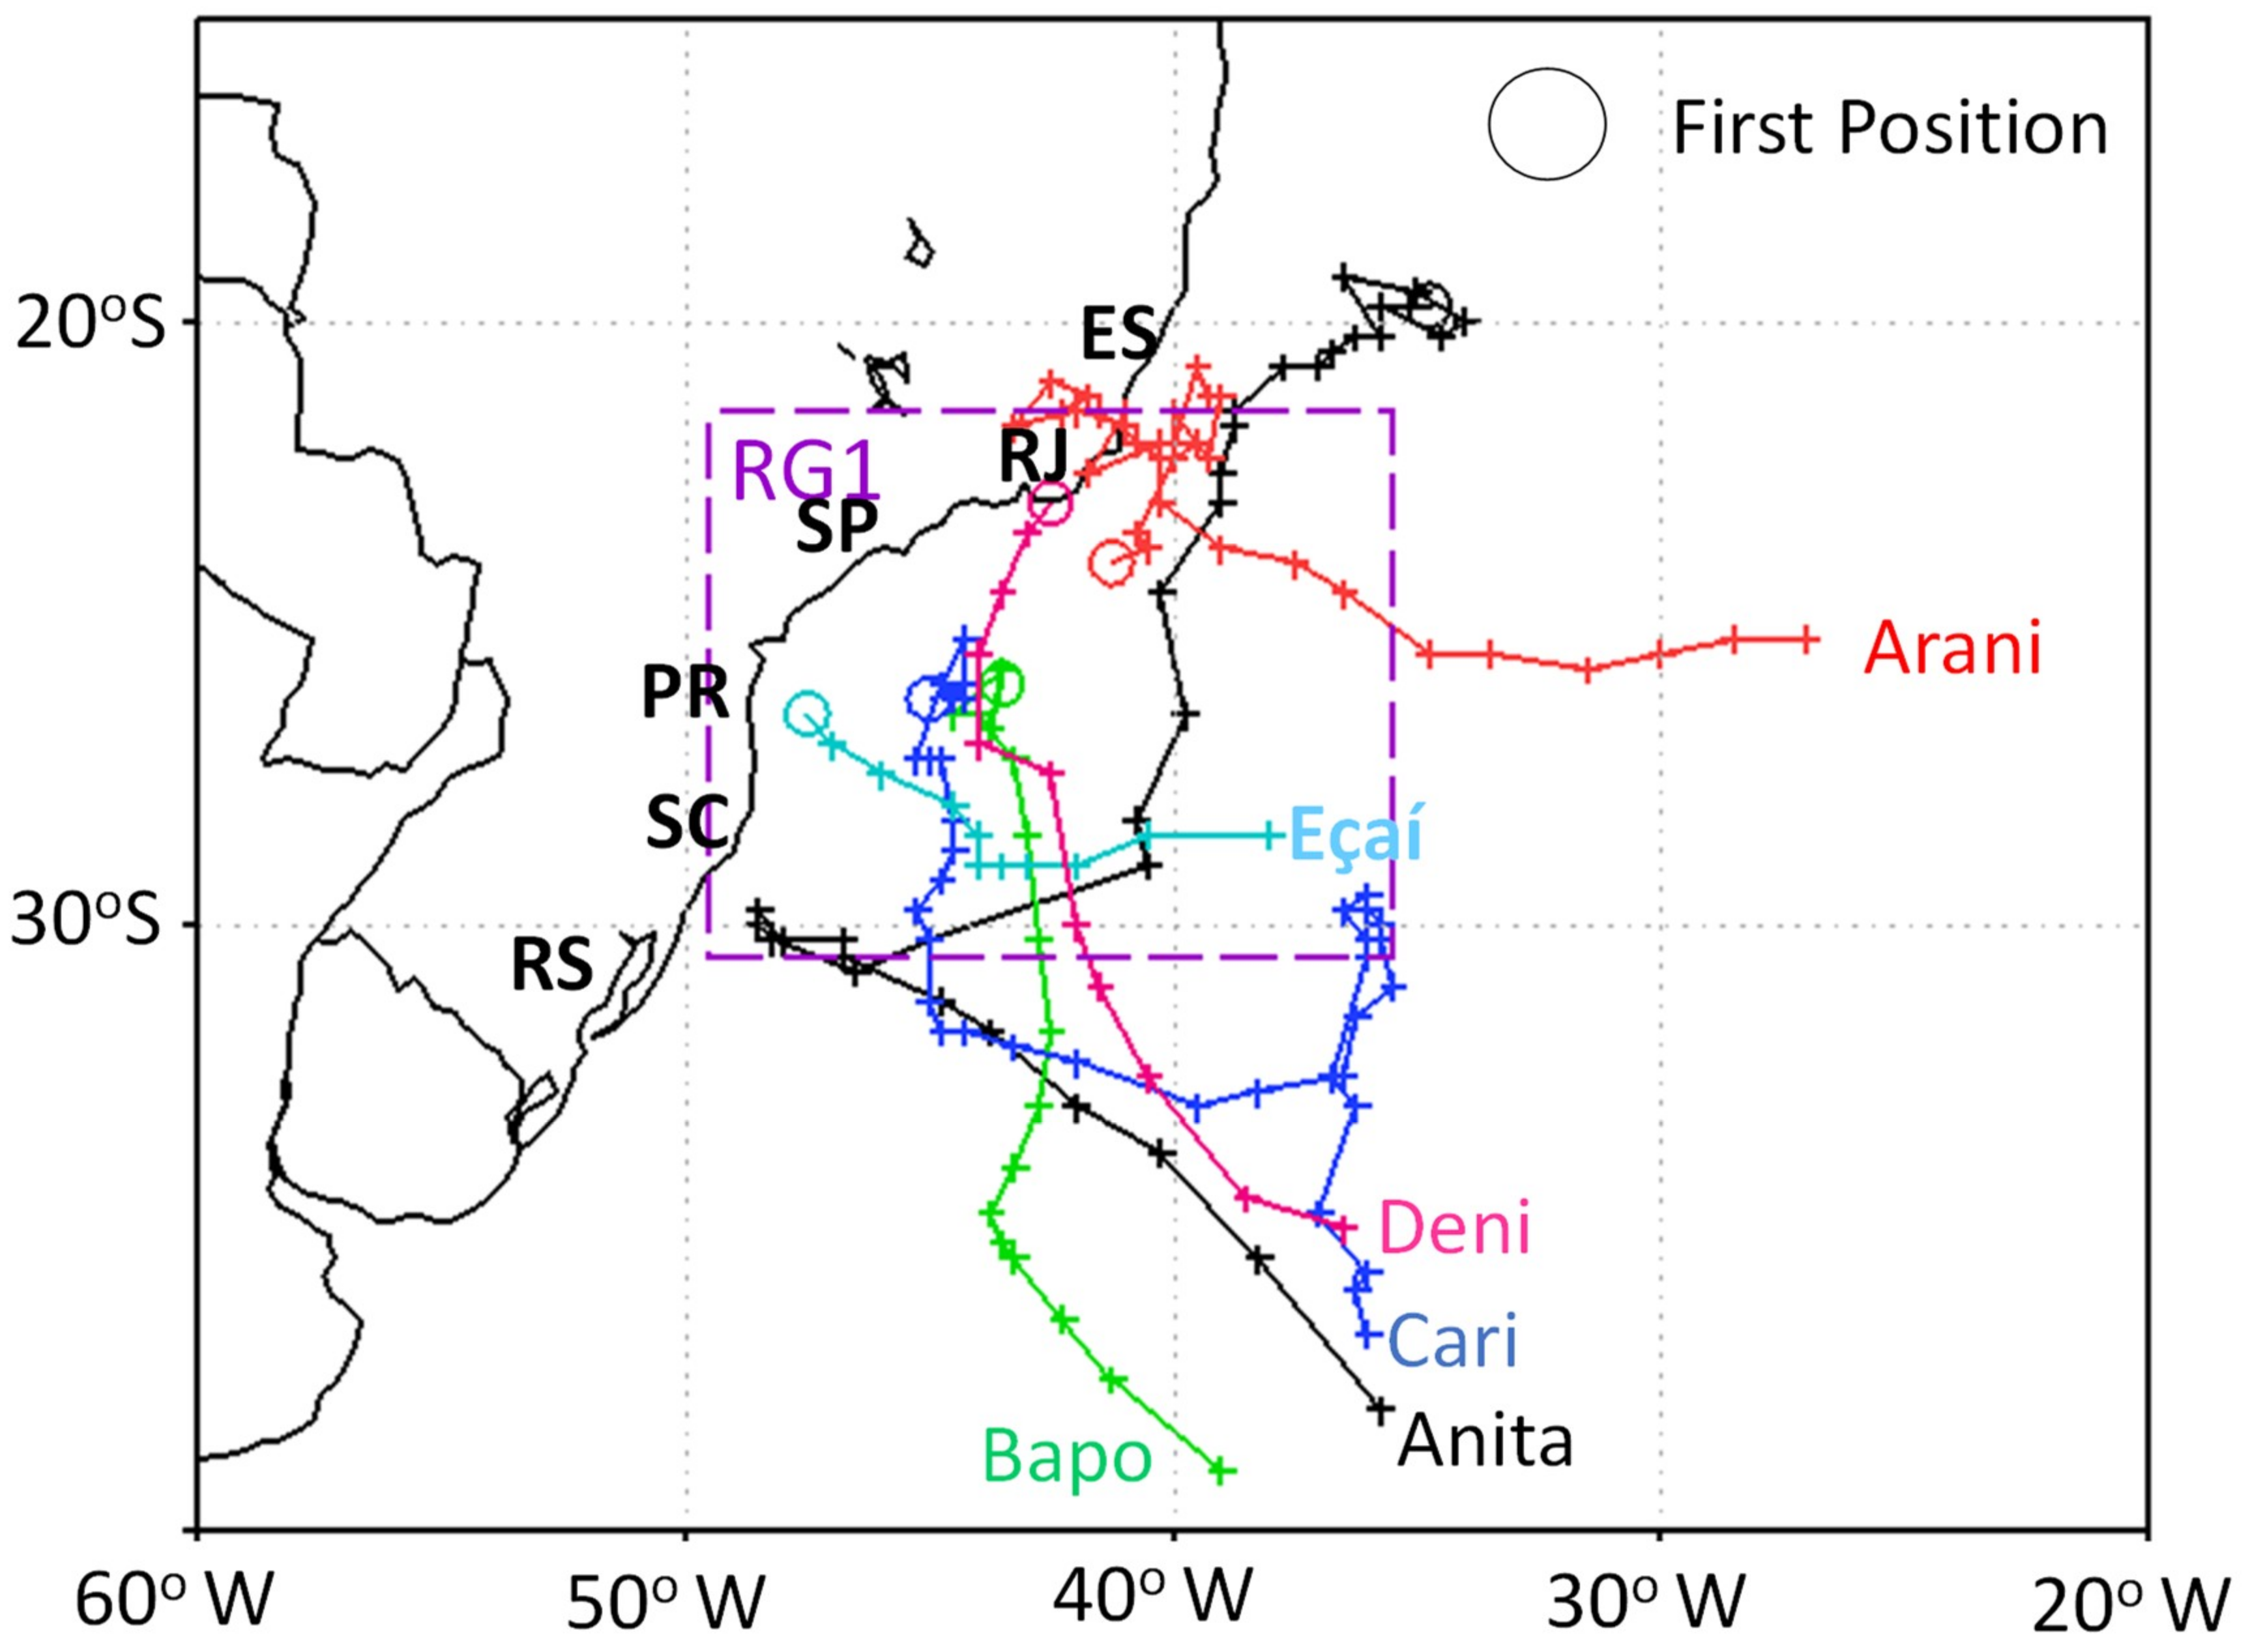
Figure 1 shows the trajectories of the six subtropical cyclones. All systems had their genesis northward of 30° south and near the southeastern/southern coast of Brazil. Moreover, these cyclones, except Anita, formed inside the RG1 (box of Figure 1), which is the region with the highest frequency of subtropical cyclones over the SAO [6]. The systems preferentially displaced to the south and southwest until the maturity phase. Only Arani displaced slightly northward during its initial phase. Some features of the six subtropical cyclones such as date of genesis, initial position (latitude and longitude), lifetime (days), and traveled distance (considering two metrics: the sum of the traveled distance every six hours, and the distance computed between the initial and final positions of the cyclone) are presented in Table 2. Cari had the longest lifetime (10 days) followed by Anita and Arani (9 days), while Deni and Eçaí had the shortest lifetime (3 days). Anita traveled the longest distance. All cyclones, except Eçaí, presented a semi-stationary characteristic, which is highlighted by the large difference between the traveled distances considering the displacement every 6 h and the distance from initial to final positions (Table 2).
While previous studies described the subtropical characteristics of Anita [11,17] and Arani [18] using CPS, in the other four subtropical cyclones, this feature was only declared by the Brazilian Navy Hydrographic Center. As there are no studies for these four systems, it is important to characterize the subtropical features of the six cyclones using the same methodology and reanalysis data. In this context, Figure 2 and Figure 3 present the CPS for each cyclone. As previously mentioned in Section 2, a cyclone is classified as subtropical if, in the CPS, −25 <B< 25 m, –VTL> 0, and–VTU < 0. These three features were observed in Figure 2 and Figure 3 from the genesis to the maturity of the six systems, but not in the final phase of five cyclones since they transitioned to extratropical cyclones (characterized by –VTL< 0). Only Arani was a pure subtropical cyclone during its entire lifecycle (Figure 2 c,d).
3.2. Synoptic Analysis
In order to assess the main features of the subtropical cyclones, we present the synoptic fields at the genesis and maturity phases of each system. Genesis is defined as the first synoptic time having a closed isobar in the mean sea-level pressure field, which occurs after that obtained using the relative vorticity criterion to identify the cyclones [25,28] shown in Table 2. The choice of the date based on pressure was due to the fact that the atmospheric fields are more organized than when there is only cyclonic circulation registered in the vorticity field. The mature phase is defined as the stage when the system presents the highest cyclonic relative vorticity vertically extended in the atmosphere column, a similar criterion used by Reference [18]. These genesis and maturity criteria indicate the same dates for the Anita and Arani lifecycle showed by References [11] and [18], respectively. Table 3 summarizes some features of the six cyclones in the genesis and maturity phases, calculated as the average in a 10° × 10° box centered in the cyclone.
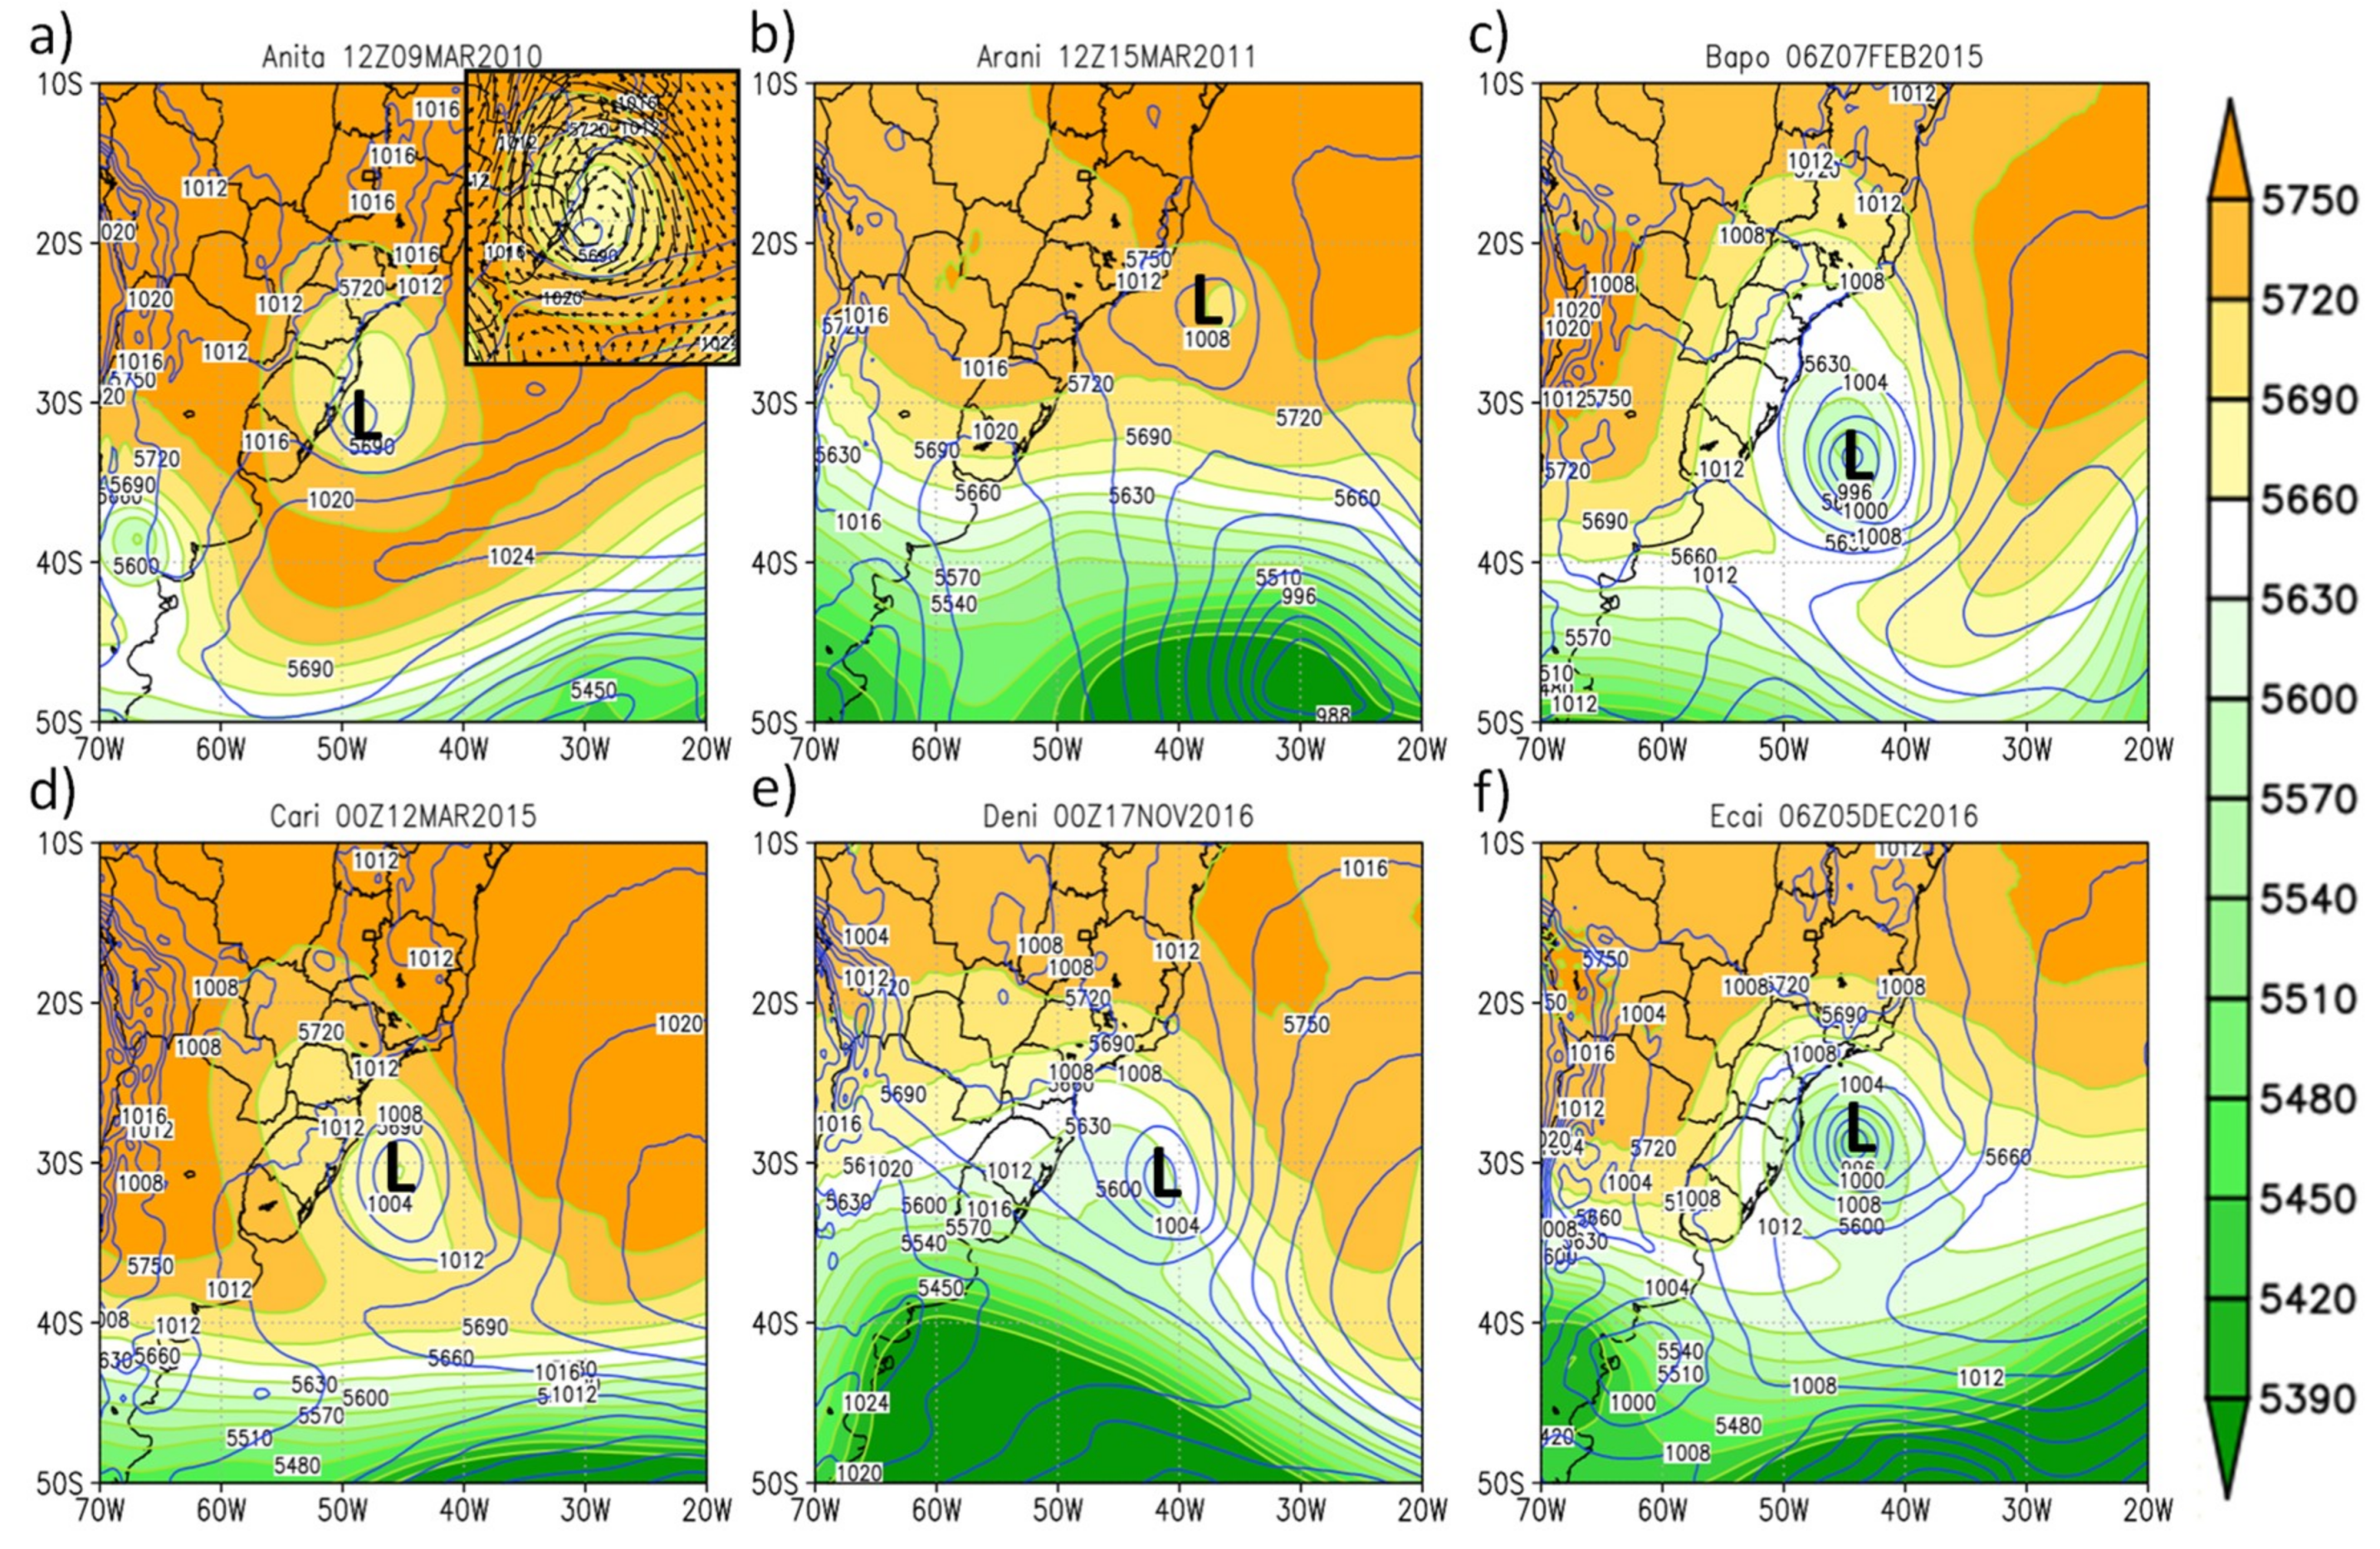
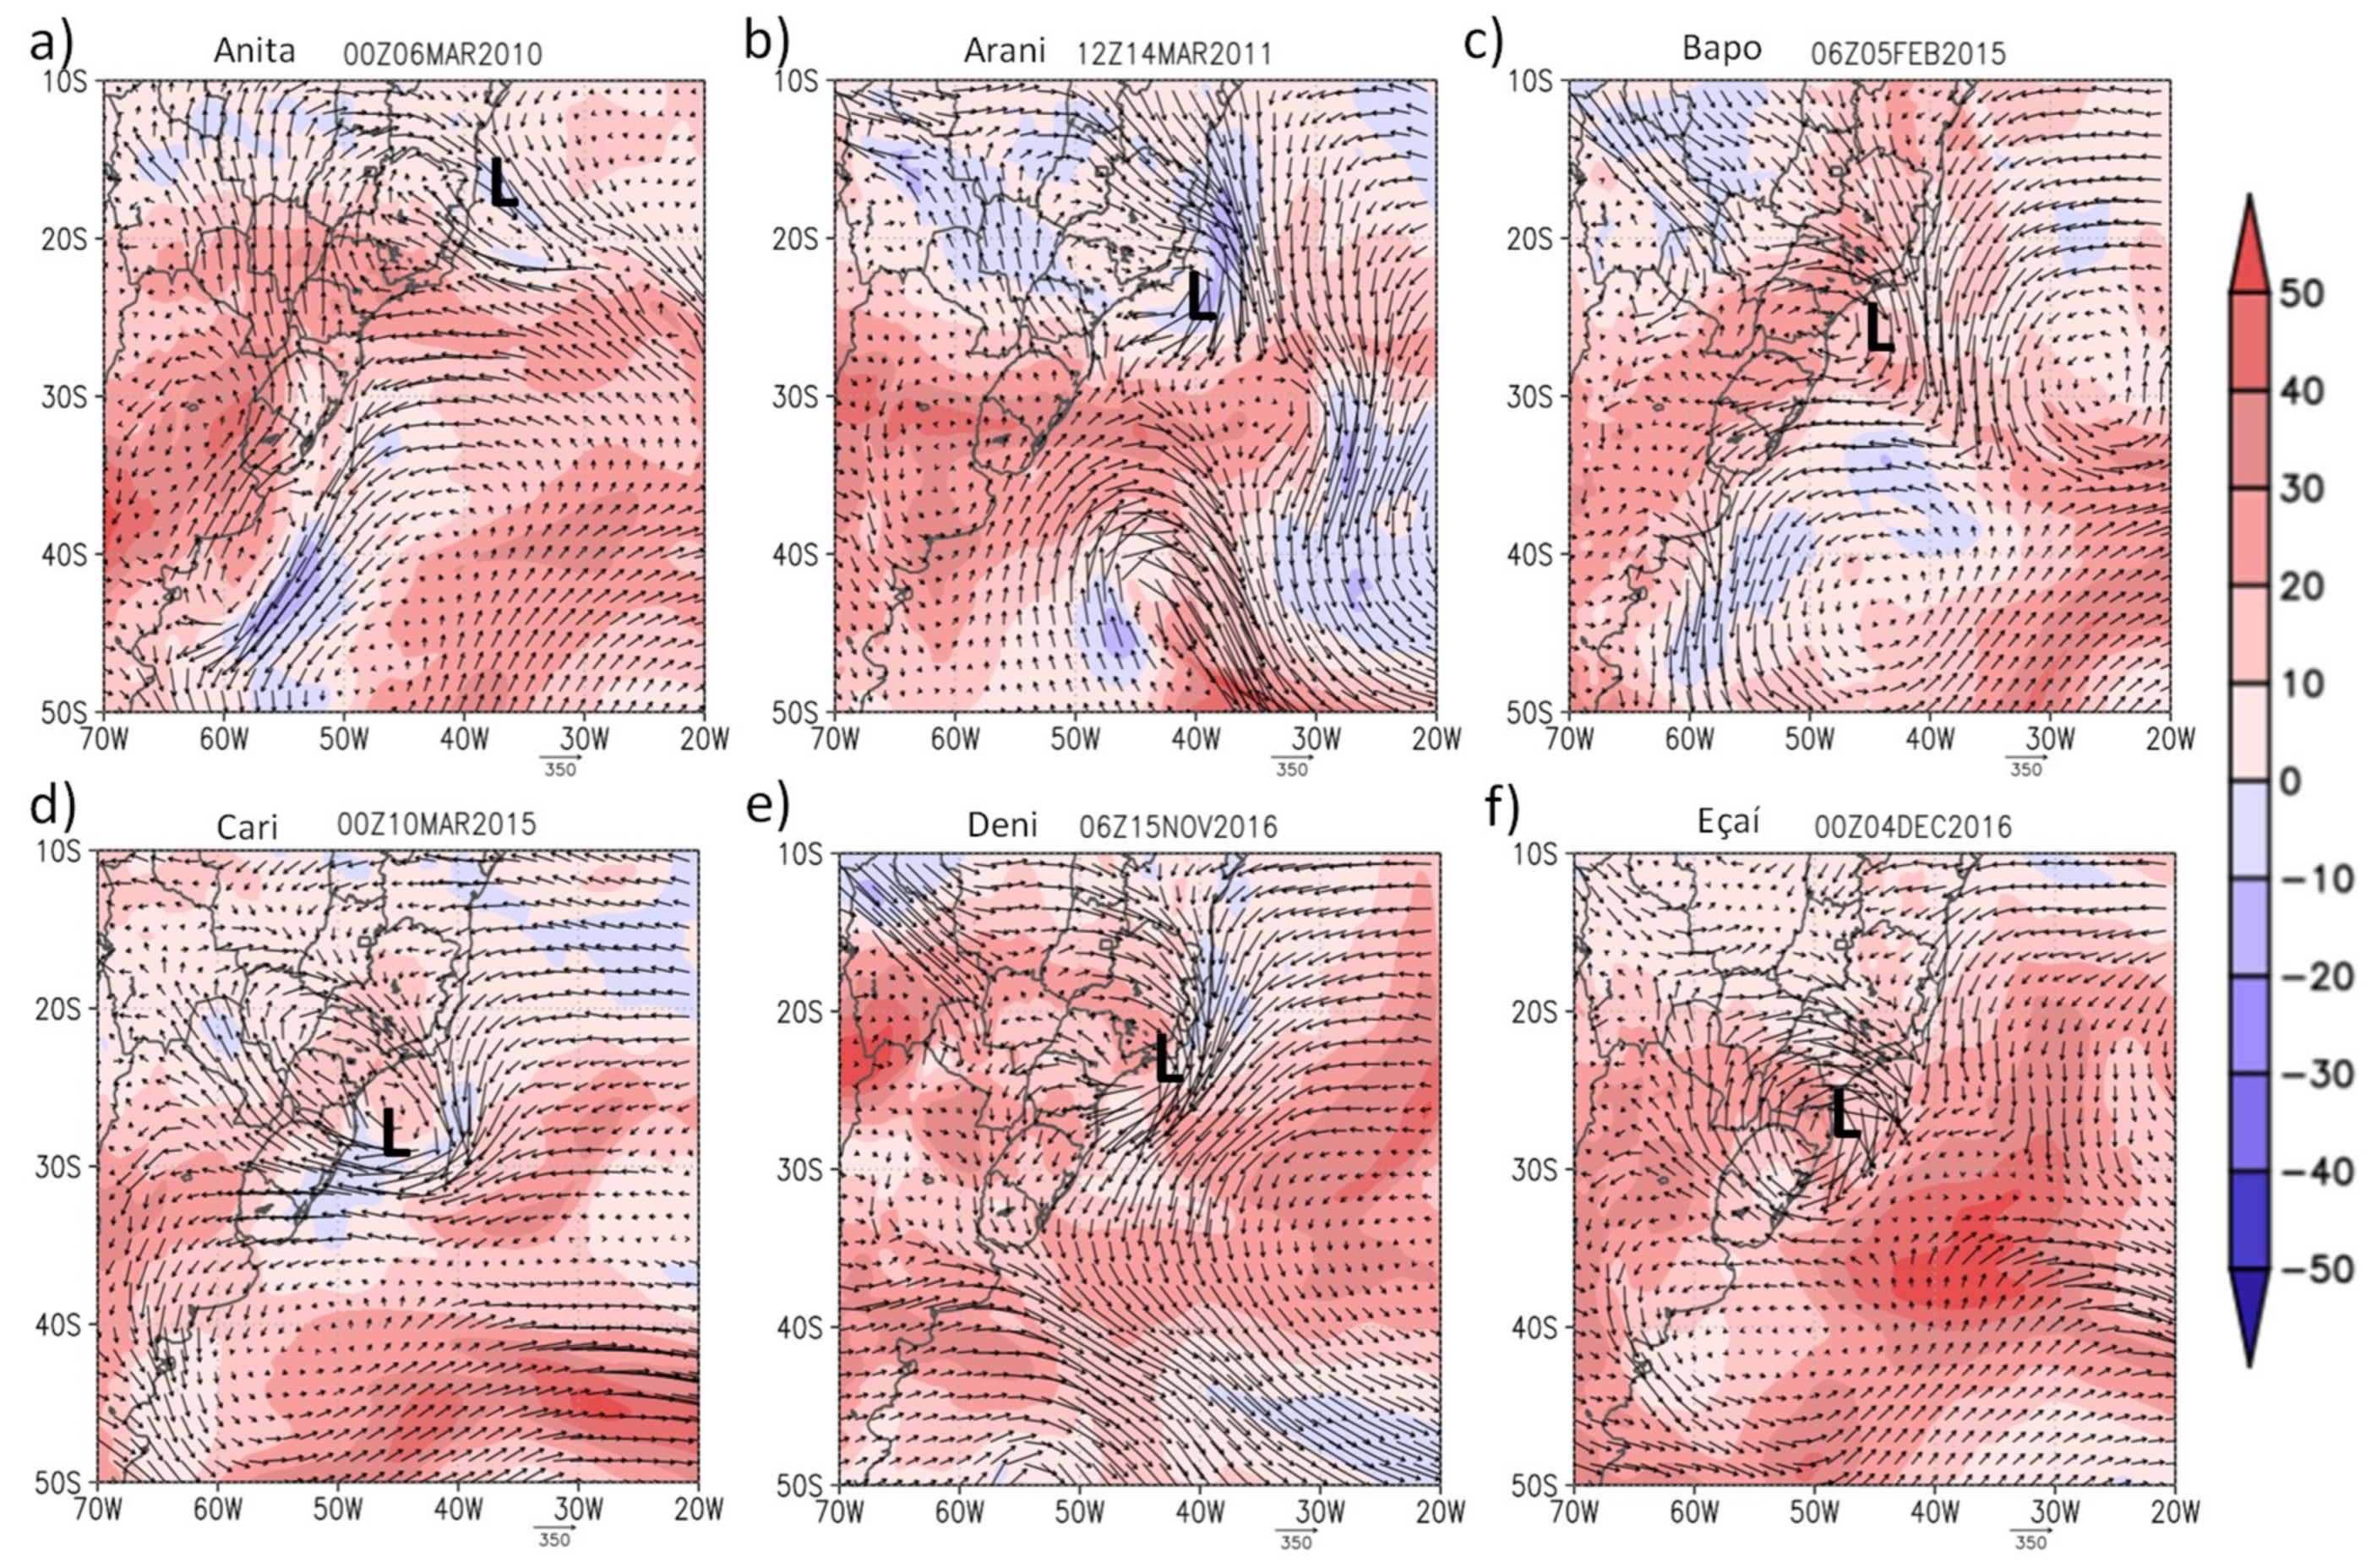
The genesis of the subtropical cyclones occurs under a small-amplitude trough at 500 hPa, as in Anita, Arani, Deni, and Eçaí, or in the presence of a cut-off low (more details in the next paragraph), as in Bapo and Cari (Figure 4). At the surface, the closed isobars are located under the eastern-southeastern side of the trough axes at 500 hPa, and the cyclones present weak intensity. The central pressure in Arani, Bapo, Deni, and Eçaí is 1008 hPa and, in Anita and Cari, it is 1012 hPa (Figure 4). Eastward-southeastward of the center of the cyclones there is a high pressure, which is connected to the subtropical anticyclone of the South Atlantic Ocean. This pattern helps to intensify the northeasterly wind on the eastern side of the surface cyclones.
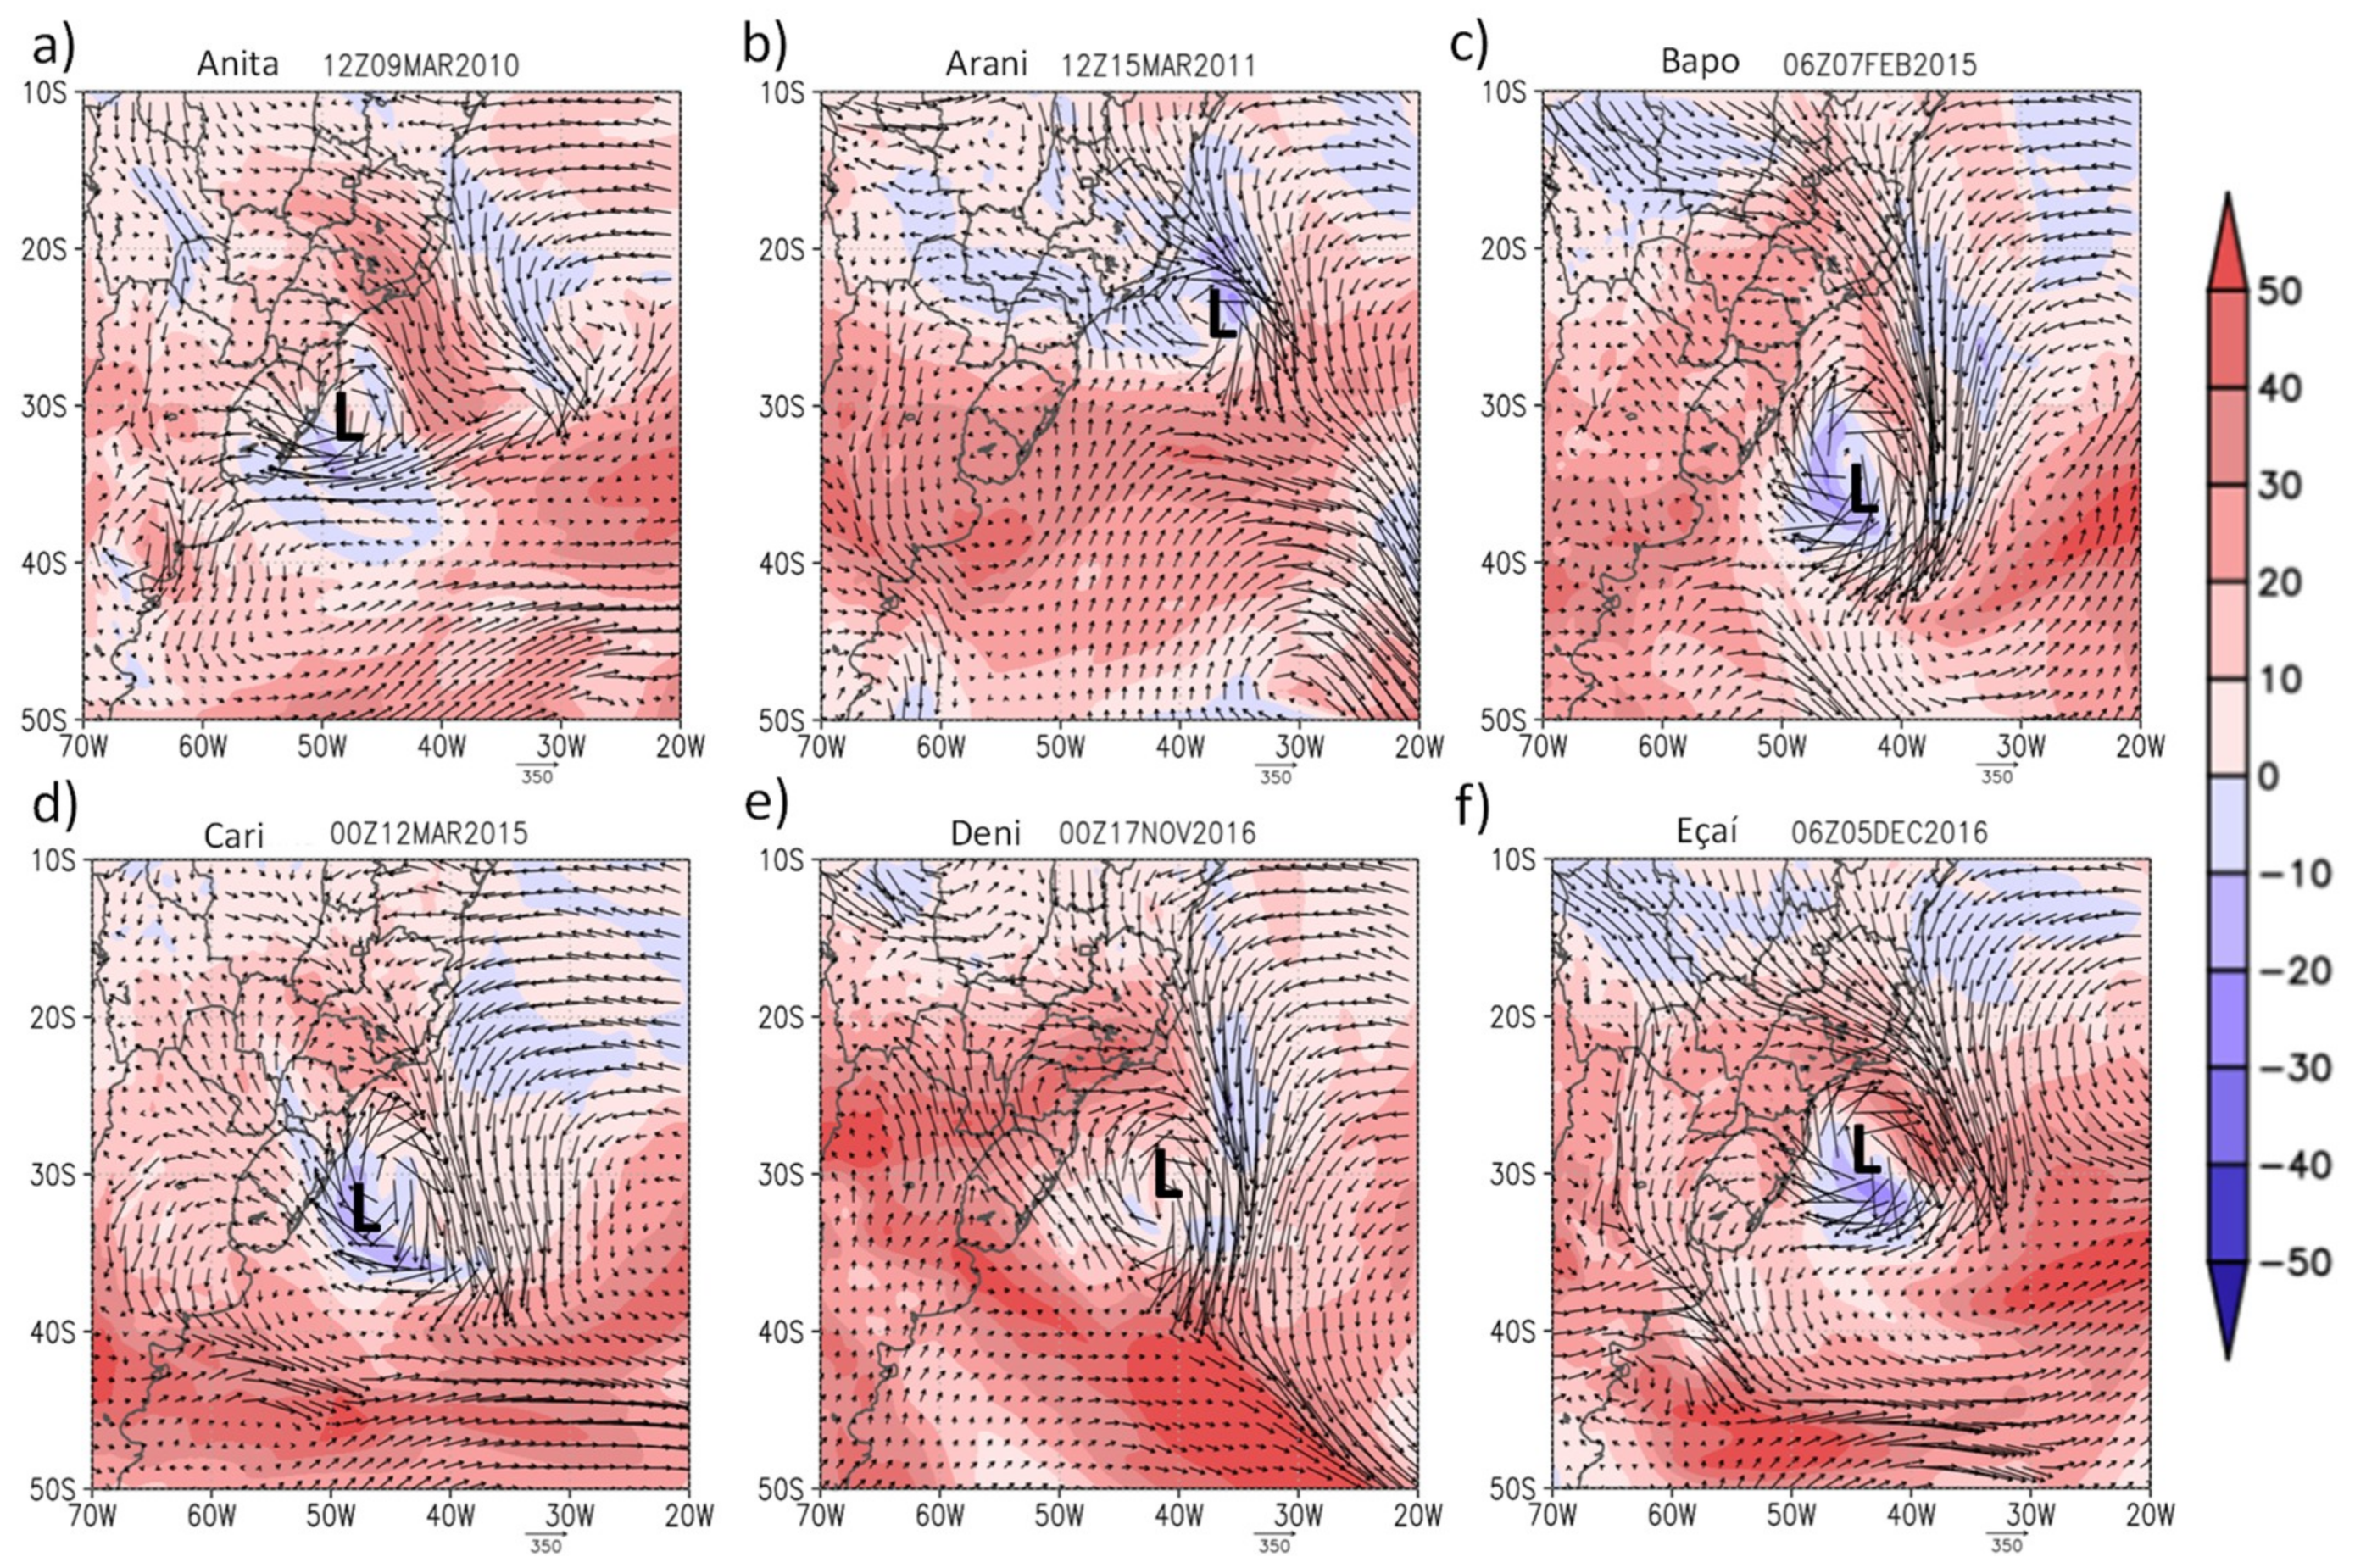
From genesis to maturity, the cyclones remain near the Brazilian coast (Figure 4 and Figure 5), and both troughs at mid-levels and the central pressure of the surface cyclones become deeper (Figure 5). Consequently, a cut-off low at 500 hPa develops inside the trough in the Anita and Eçaí events (Figure 5a,f), while those associated with Bapo and Cari intensify (Figure 5c,d). Cut-off lows are cold closed lows at upper-levels located on the equatorial side of the upper-level jets [29,30]. This last feature distinguishes cut-off lows from occluded extratropical cyclones that extend to the upper levels since the latter is located on the polar side of the upper-level jets. Here, the six subtropical cyclones developed northward of the strong westerlies at upper levels (although we did not show the winds, this feature can be inferred from the geopotential height in Figure 4 and Figure 5), in other words, in a region with weak horizontal temperature gradients. This pattern also characterizes one of the differences between extratropical and subtropical cyclones.
Cut-off lows are components of upper-level blocking patterns [14]. According to Reference [31], there are four configurations for blockings and, in three of them (dipole blocking or Rex blocking, omega blocking, and cut-off low blocking), the cut-off low is an intrinsic part and is located on the equatorial side of a high-pressure center. At 500 hPa, it is clear that Anita and Bapo in their maturity were involved in a pattern similar to dipole blocking (Figure 5a,c), while Cari and Eçaí were involved in a pattern that resembles cut-off low blocking (Figure 5d,f). On the other hand, Arani and Deni were coupled with a small-amplitude trough at 500 hPa (Figure 5b,e).
Independently of the blocking-pattern type, there is a higher-pressure region at the middle–upper levels around the cut-off low mainly in its southeastern sector, and this influences the circulation. As documented by Reference [14], in the transition region between the cut-off low and the high-pressure center in the dipole blocking, the circulation of these systems reduces the westerly wind intensity, or even changes the wind direction from west to east at mid-levels. An example of this atmospheric pattern is shown in Anita, where easterly winds are present at 500 hPa southward of the cut-off low (see the zoom in Figure 5a). Consequently, this new circulation feature influences the trajectory of the surface cyclones, imposing their displacement to the west/southwest or straight to the south. This occurred in Catarina [14], Anita [11], and is documented here (Figure 1) until the maturity phase of the other subtropical cyclones (only Arani displaced directly eastwards). Moreover, the circulation induced by middle–upper levels contributes to coupling the surface cyclone with the cut-off low promoting a barotropic environment (Figure 5a,c,d,f).
The atmospheric configuration at 500 hPa from the genesis (with a trough or a cut-off low) to the maturity (with a blocking pattern, except for Arani and Deni events) of the subtropical cyclones also contributed to the low values of vertical wind shear (Figure 6 and Figure 7). As shown in Figure 6, the cyclogenesis occurred in regions with lower vertical wind shear (200–850 hPa) than the climatological value of ~26 m·s−1 computed by Reference [15]. Anita, Arani, and Cari especially developed under vertical wind shear lower than 8 m·s−1 (Figure 6), which is considered an ideal threshold for the genesis of tropical cyclones [7]. During the maturity of the subtropical cyclones, the vertical wind shear changes to negative or intensifies the negative values observed in the genesis (Figure 6 and Figure 7). These negative values indicate more intense winds at low levels (850 hPa) than at upper levels (200 hPa), having great destructive potential (as also normally occurs in tropical storms), as shown in Section 3.3.
Low values of vertical wind shear provide a potential for the vertical organization of the cloudiness in the cyclones favoring pressure deepening [11,32]. According to Reference [32], in the literature, the effect of vertical wind shear on tropical cyclone intensity change is explained through “ventilation”. In this mechanism, heat and moisture at middle–upper levels are advected away from low-level circulation, preventing cyclone development. However, Reference [32] provided another explanation for the contribution of the vertical wind shear for cyclone development; in the presence of vertical wind shear (more intense winds at upper levels and less intense at lower levels), the potential vorticity associated with the vortex circulation is vertically tilted. To maintain the mass balance, it is necessary to increase mid-level temperature perturbation near the vortex center. Thus, the hypothesis is that the mid-level warming reduces the convective activity and inhibits the storm development. According to Reference [32], the effect of the vertical wind shear is due to tilting and stabilization. Summarizing, regardless of the physical process presented, the vertical wind shear needs to be weak to help the tropical cyclogenesis, and this can be reflected in the subtropical cyclones. In this context, we show that the troughs and/or cut-off lows (Figure 4 and Figure 5) are important to reduce the vertical wind shear (Figure 6 and Figure 7) and that the latter favors the organization of the convective clouds around the cyclone center (Figure 8). Therefore, it is implicit that there is latent heat release by condensation in the atmosphere, which in turn helps intensify upward motions and decrease the pressure at the surface.
Convection is an important process for transporting heat and moisture from near-surface layers to upper levels of the troposphere. According to References [33,34], moist convection is the primary driving force for tropical cyclone development. As the subtropical cyclones have some features similar to tropical ones, it is important to know their sources of heat and moisture. Before presenting our results, we summarize some important findings of the literature.
According to the potential intensity (EPI) theory of References [35,36,37,38], SST and tropopause temperature matter most in determining the upper limit of tropical cyclone intensity (wind speed and central pressure). In this theory, tropical cyclones are like a Carnot engine, in which entropy is acquired under the eye wall from latent and sensible heating fluxes and exported vertically to the colder tropopause. Hence, the surface-layer thermodynamic conditions have a crucial importance for tropical cyclone development. Latent and sensible heating fluxes are parameterized using bulk aerodynamic algorithms [39], which involve wind speed at 10 m high and a vertical temperature gradient (the difference between SST and air temperature at 2 m for sensible heat) and vertical moisture gradient (difference between specific humidity of saturation at the surface and specific humidity at 2 m for latent heat). The formulation indicates that the higher the wind velocity is, the higher the heat and moisture fluxes will be. These heat fluxes are also sensible to SST; for example, Reference [40] showed that changes of 1 °C in SST may provide heat fluxes with a difference of nearly 40%. On the other hand, Reference [41] discussed the role of latent and sensible heat fluxes in the instability of the boundary layer, in which enhanced fluxes lead to instability and contribute to vigorous convection. Other authors [42,43] emphasized that the tropical cyclones extract latent energy from the ocean through latent heating and release it into the atmosphere through the convective clouds. Thus, a part of the latent heat released acts to increase the kinetic energy of the system. In summary, we would like to emphasize that latent heat flux is a fundamental energy source for tropical cyclones and can be also important for subtropical cyclones.
For the subtropical cyclones studied here, the sources of heat and moisture are locally provided by latent (LH) and sensible (SH) heat fluxes or transported from remote areas. Considering the local source of SH, we show by the difference in SST and the 2-m air temperature (Table 3) that the cyclones develop in an environment where the sea is warmer than the air above. During the mature phase (Table 3), in some cyclones, this difference remains positive and, in others, it becomes negative, indicating colder SST than the atmosphere above (that would result from cloud cover and mixing in the upper layer of the sea, e.g., Reference [44]).
In terms of local moisture source, Table 3 indicates that Anita developed in a region with a mean LH of ~180 W·m−2, while Arani developed in a region with ~138 W·m−2. Lower LH averages (~100 W·m−2) occurred in the genesis of the other four cyclones. Except Anita, all the other cyclones had their genesis in an environment with LH close to the climatology of the RG1, which is ~100 W·m−2 in the summer and ~130 W·m−2 in the autumn [45]. It is an indicative that the remote moisture sources may have an important contribution to the subtropical cyclone development as previously discussed by Reference [46]. The role of external moisture sources has been emphasized in tropical [47] and extratropical [48,49] cyclogeneses. The moisture travels from its source to the cyclone region like a corridor in the lower atmosphere [48], which is called conveyor belt or atmospheric river. For extratropical cyclones, the atmospheric rivers contribute to deepening these systems by providing more water vapor for latent heat release [49].
As in Reference [49], we identified the remote moisture sources by vertically integrated moisture flux. Figure 6 shows that the convergence of the vertically integrated moisture flux is a common feature in the genesis region of the six cyclones, resulting from northwesterly winds from the continent and northeasterly winds from the eastern sector of the South Atlantic subtropical high. From genesis to maturity, there is an increase in the moisture flux convergence around the cyclones (Figure 7), which is favored by the intense winds as shown in Figure 8. These findings agree with Reference [46], which showed a strong contribution of the same remote moisture sources favoring the development of the subtropical cyclones in RG1. Both moisture sources (local LH and moisture flux convergence) are the fuel for cumulus convection, with consequent latent heat release by condensation. In the satellite images, the moister areas and, consequently, the cloudiness are characterized by the presence of large areas with low values of brightness temperature (white color) over the eastern/southern sides of the cyclones (Figure 8).
Although the wind intensity at 925 hPa was analyzed for the whole lifecycle of the six subtropical cyclones, it is only presented the maturity phase herein (Figure 8). During this phase, more intense winds in Anita, Cari, and Eçaí were observed in their southern sectors, while in Arani, Bapo, and Deni, such winds occurred in their eastern/southeastern sectors. The occurrence of stronger winds mainly in the southern and/or eastern sectors of the cyclones center agrees with previous studies that showed near-surface maxima winds far from the center of the subtropical cyclones [6,7,50]. Over the SAO, the location of intense winds in relation to the cyclone center is associated with greater horizontal pressure gradients due to the presence of the subtropical high eastward or a migratory anticyclone southward of the cyclones (Figure 4 and Figure 5).
From the previous analyses, it becomes evident that the weaker vertical wind shear than the climatology, the dynamic support of the small amplitude trough or a cut-off low at mid-levels, and the moisture flux convergence are the “ingredients” contributing to the subtropical cyclogenesis at the surface. As these systems develop in a wide range of SST, from 22.5 °C (Eçaí) to 28.6 °C (Anita), this indicates a secondary contribution of warm SST to the cyclogenesis (Table 3). The weak dependence of the subtropical cyclogenesis on the warm SST was also documented in the North Atlantic basin [5], the Mediterranean [12], and the South Atlantic Ocean [6]. These studies showed subtropical cyclone development over colder water than 26 °C, i.e., which is not favorable to tropical cyclones (26 °C is the threshold normally favoring hurricanes considered by Reference [51] and 26.5 °C by Reference [7]). According to Table 3, the SST during the maturity phase of the cyclones is colder than in the initial phase, which would result in cloud cover and the mixing of the upper layer of the sea due to strong winds and the upwelling process. As the six subtropical cyclones present a semi-stationary feature (Table 2), when they stay for a long time over the same area, the upwelling of colder water to the sea surface can occur [44]. Some studies [52,53] indicate that this cooling contributes to a decrease in the transference of SH from the ocean to the atmosphere, leading to a weakening of the tropical cyclones.
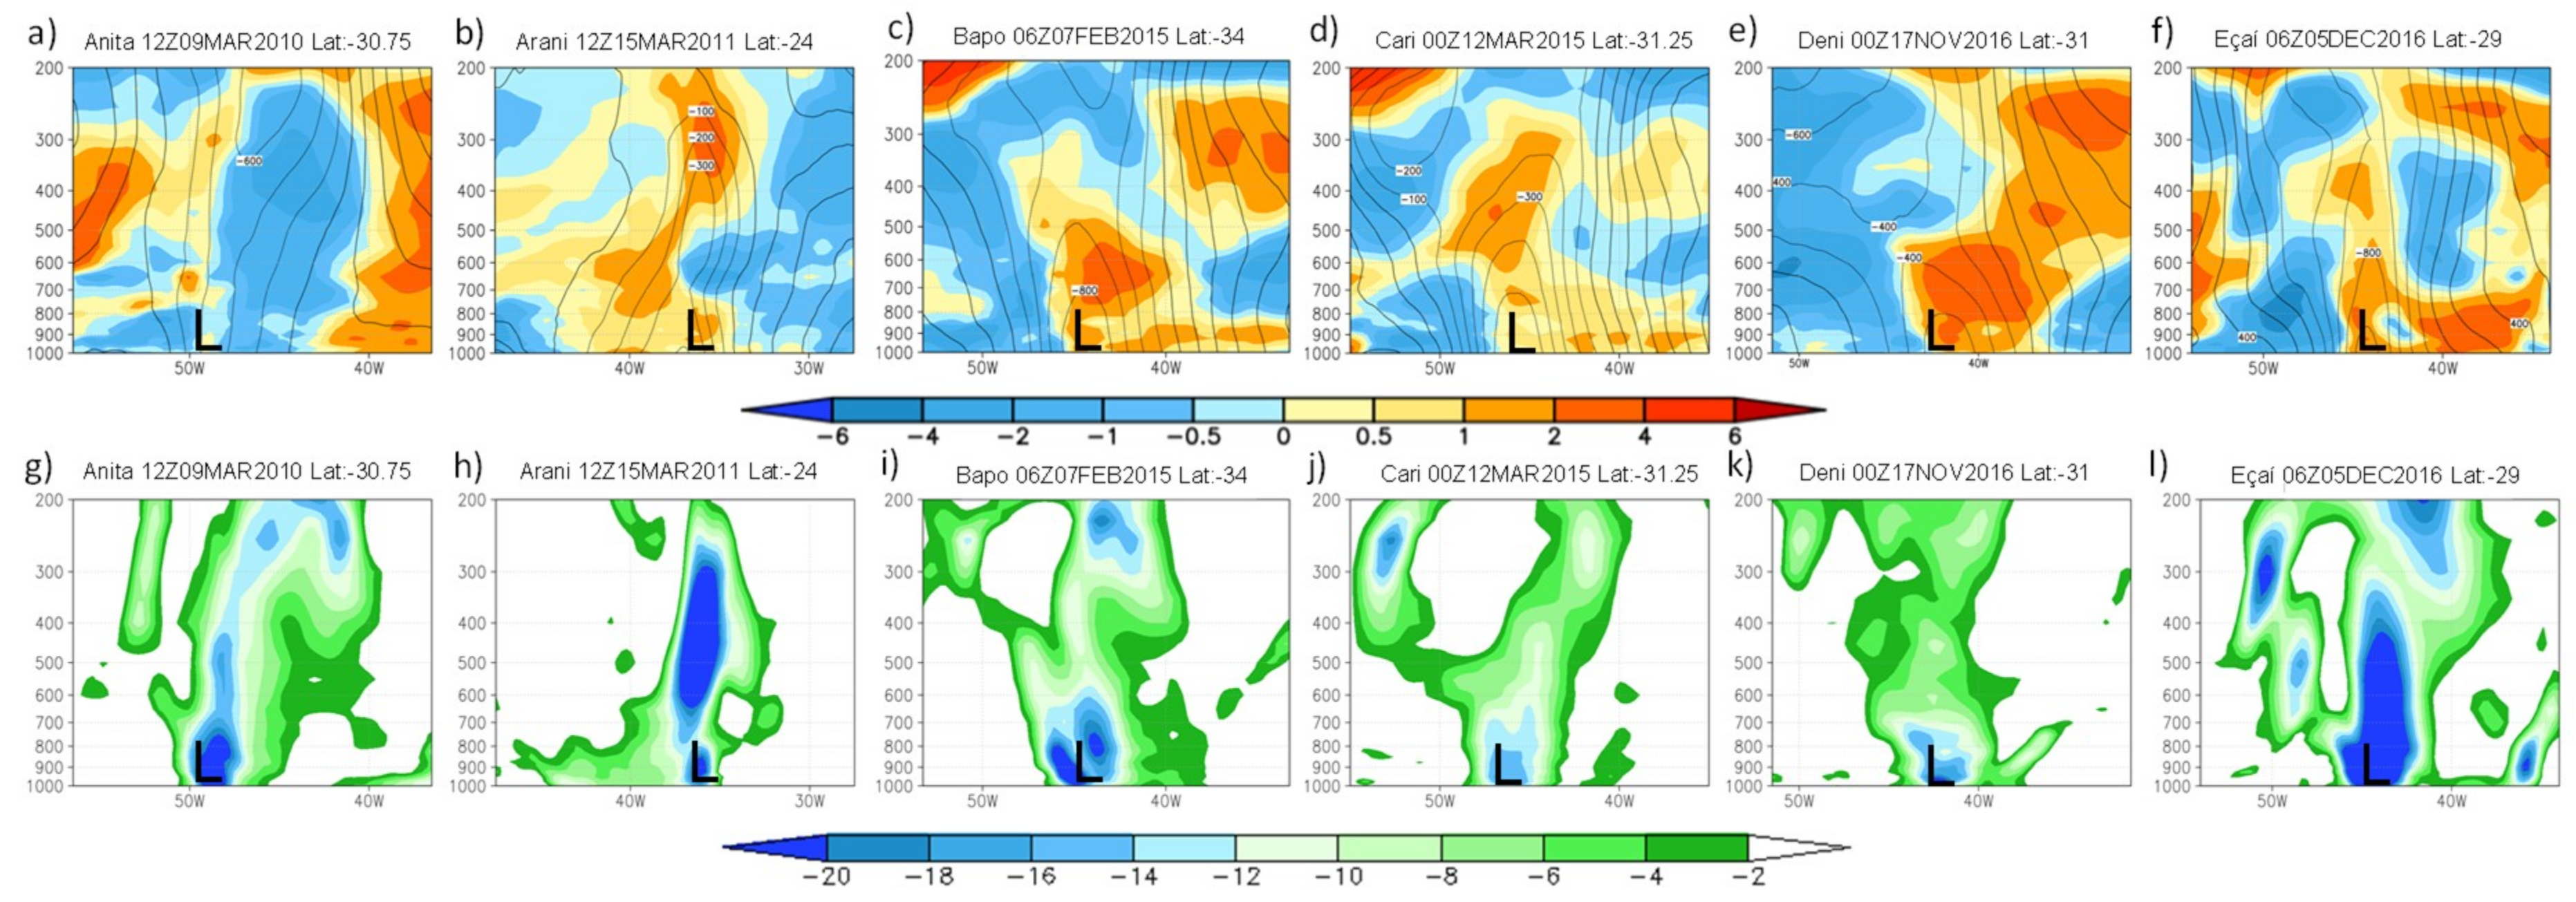
The vertical structure of the cyclones was analyzed through west–east vertical cross-sections based on the central latitude of these systems. In terms of thermal vertical structure, during the genesis of the subtropical cyclones the air temperature from near-surface until mid-levels was, in general, warmer than the zonal mean (data not shown). However, in some events (Arani, Cari, and Eçai) there was a near-surface thin layer of colder air than the zonal mean. This colder layer is also a feature documented in some tropical cyclones [54,55,56] and, in general, results from the following processes: initially, the convergence of low-level winds favors the transference of energy (latent and sensible heat fluxes) from the ocean to the adjacent atmosphere; on the other hand, since the energy is being removed from the sea surface, it becomes colder than the atmosphere above, and heat begins being transferred from the atmosphere to the sea, resulting in the cooling of the adjacent air layer on the sea. Another process contributing to the thin colder layer is the evaporation of both oceanic spray (due to the break of sea waves) and precipitation. It is important to mention that, as the colder temperatures occur in a very thin layer (below 900 hPa), they do not affect the B parameter shown in CPS, i.e., the thermal symmetry continues indicating a small difference in the geopotential height between the two sides from the cyclone center (Figure 2 and Figure 3).
Regarding the maturity phase (Figure 9), the near-surface thin layer of colder air disappears, and, in general, warmer air than the zonal mean predominates from the surface to mid/upper levels near the cyclone center, and colder air is found aloft in most events (Figure 9). Therefore, this pattern corresponds to the vertical structure of subtropical cyclones, which is different from that observed in extratropical (warm in the eastern and cold in the western side of the cyclones) and tropical cyclones (the center of the system is warmer than the surroundings).
When the subtropical cyclones reach maturity, a tube of intense cyclonic vorticity occupies most of the depth of the troposphere, from the surface to ~300 hPa (Figure 9). However, the more intense cyclonic vorticity is observed at low levels, with the exception of Arani (Figure 9h). Through the lifetime of the subtropical cyclones, the vorticity tube almost does not tilt, which is more characteristic of the tropical cyclones (see, e.g., Reference [18]). On the other hand, the vorticity tube is shallower (extending to ~400 hPa) than normally observed in tropical cyclones (extending more than 100 hPa).
3.3. Adverse Weather Conditions Caused by Subtropical Cyclones
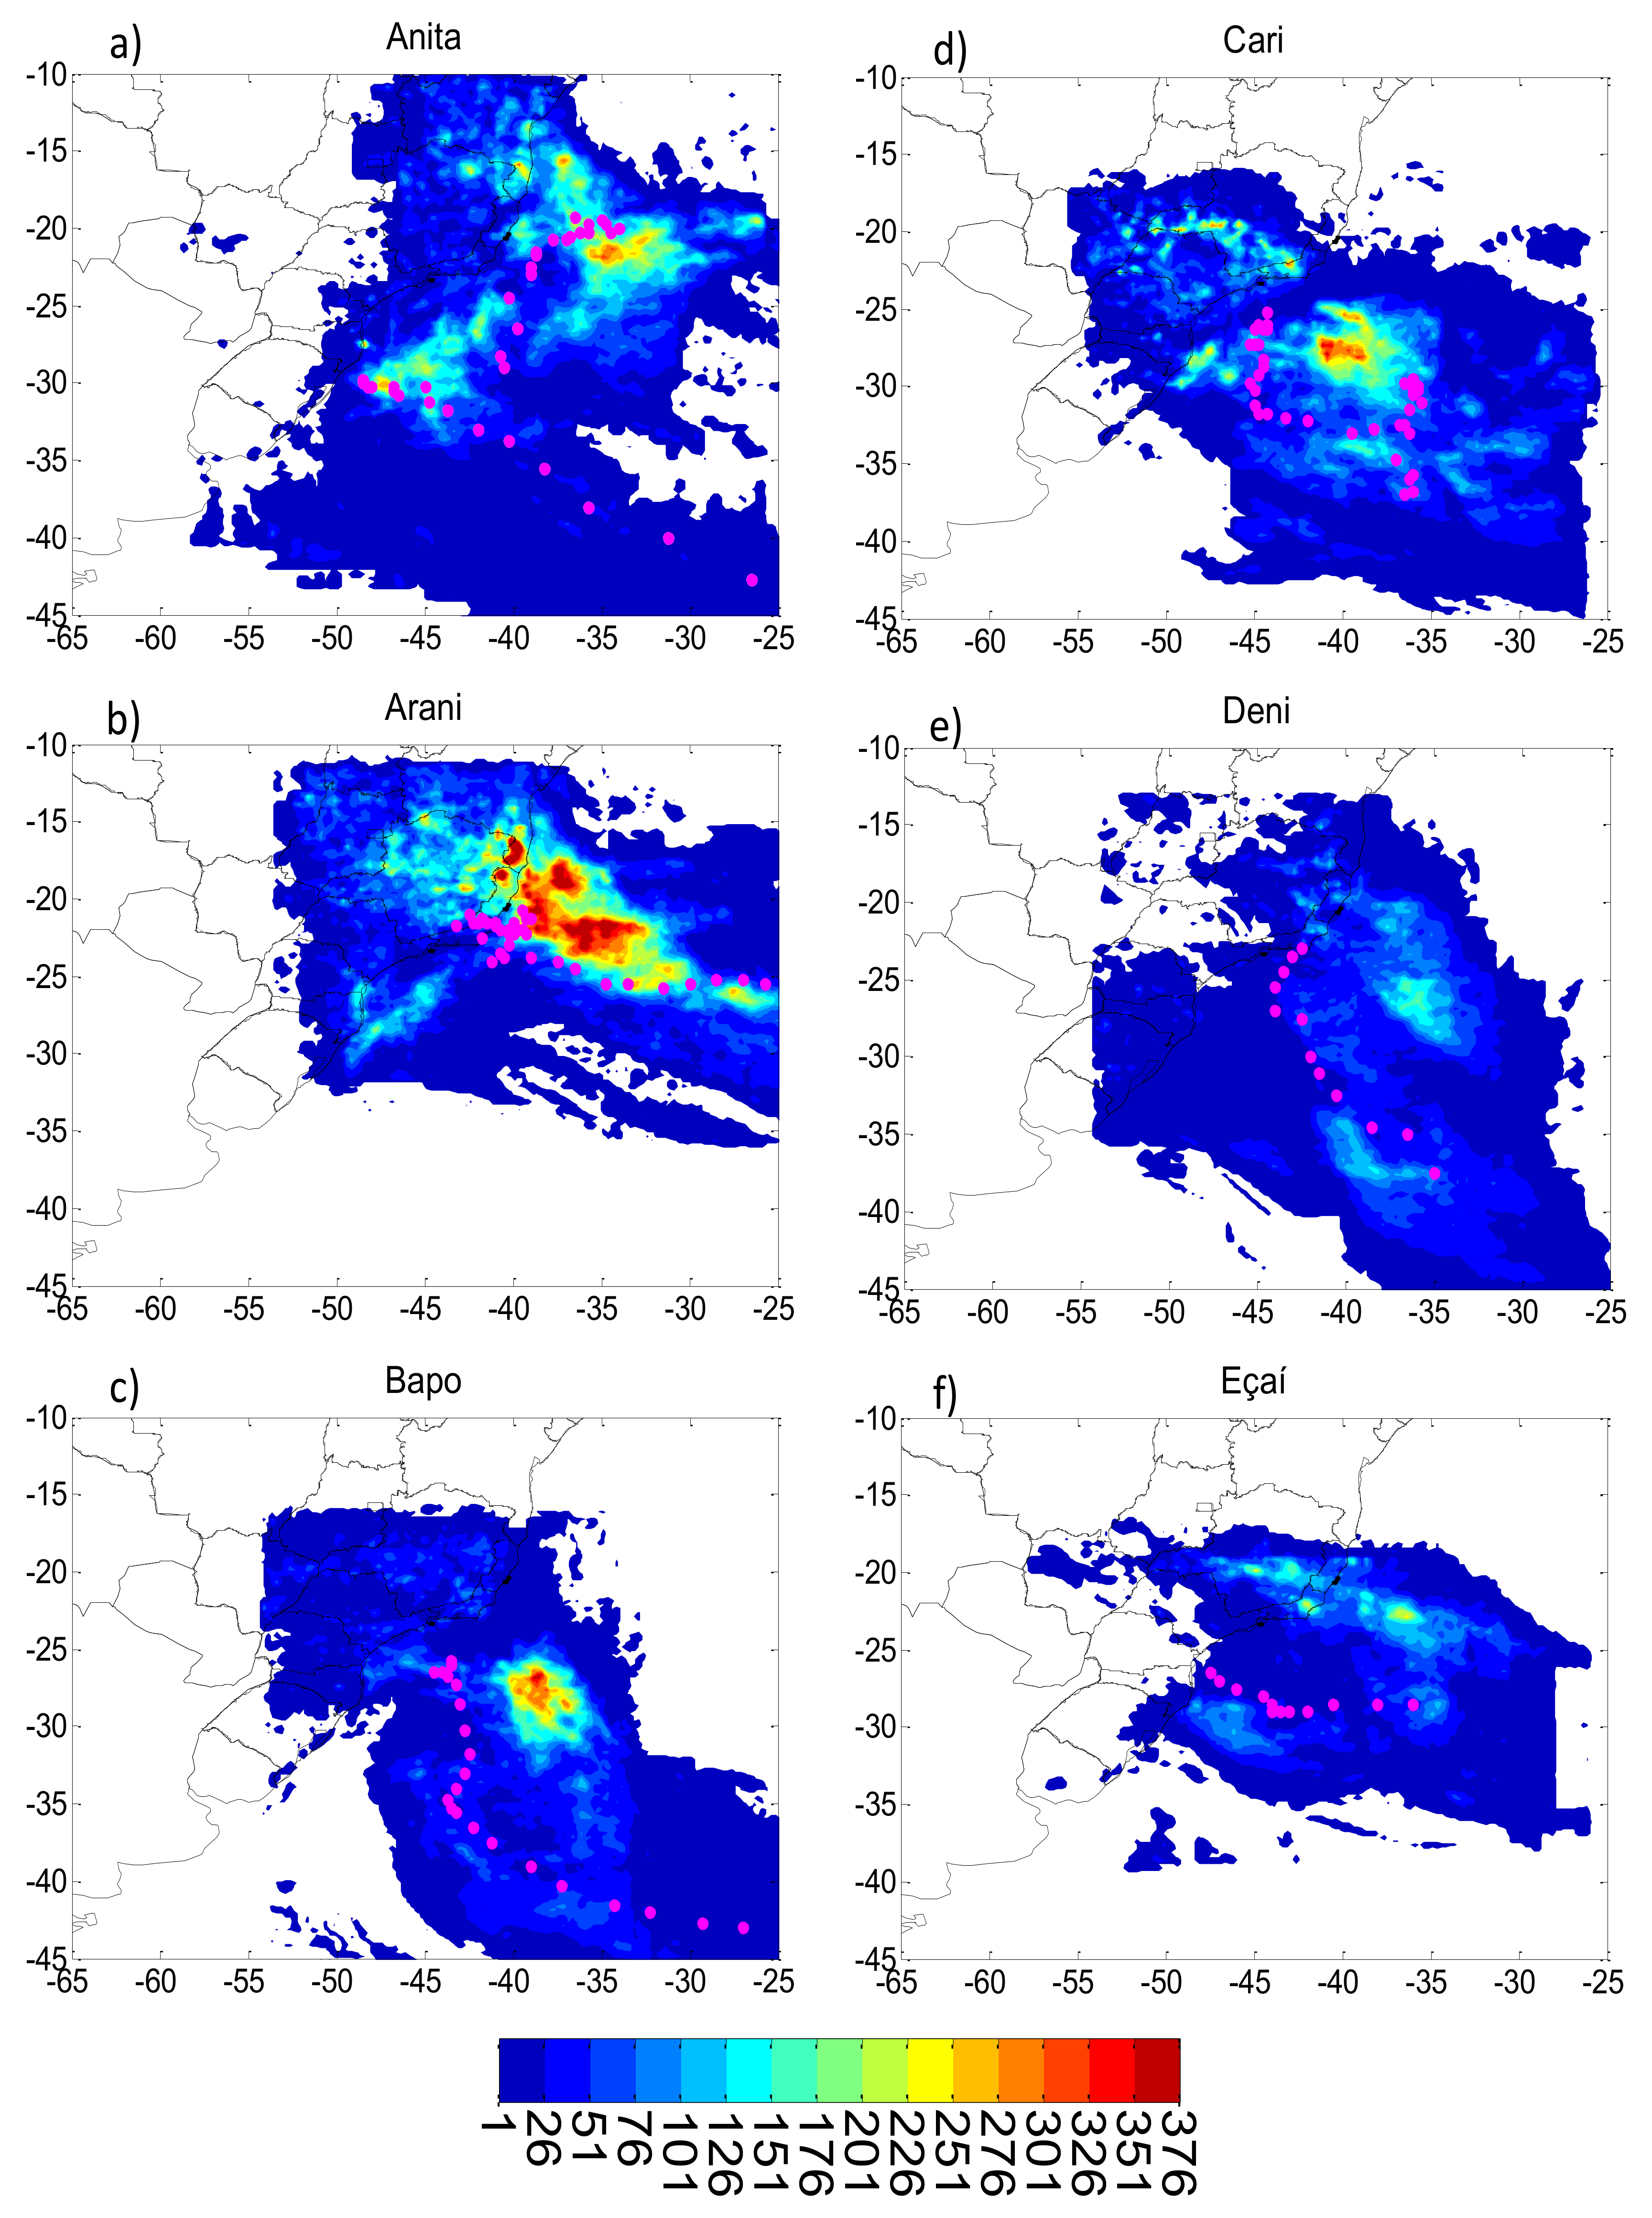
Subtropical cyclones can cause severe damage in the coastal regions due to heavy precipitation, strong winds, and storm surges. Moreover, over the ocean, they can generate high sea waves with negative consequences for navigation and offshore oil platforms. Figure 10 and Figure 11 show that the six subtropical cyclones produced great amounts of precipitation over coastal regions in southern/southeastern Brazil. Few works have documented the impact of subtropical cyclones on precipitation along the Brazilian coast. One of them described an extreme precipitation event over the Paraíba do Sul river basin (located in southeastern Brazil) in January 2000, which was associated with a cyclonic vortex with subtropical characteristics [57].
In order to highlight the extreme nature of the subtropical cyclones, the total precipitation associated with these systems was compared with the monthly precipitation climatology of the Brazilian states, from 1981 to 2010, available at the Meteorology National Institute of Brazil (http://www.inmet.gov.br/portal/index.php?r=clima/normaisclimatologicas).
Among the six cyclones, the highest precipitation total over the continent was caused by Arani once it moved close to the shore for a long period (Figure 10b). This system produced about 350 mm of precipitation in the state of Espírito Santo and in the south of the state of Bahia (~18–21° S), which represents more than the double of the 150 mm of the monthly climatology for November. The precipitation associated with Anita was great around the genesis area (eastward of Bahia and Espírito Santo states at ~20° S) and during the southwesterly cyclone displacement (eastward of Santa Catarina state at ~30° S; Figure 10a). Cari also produced a great amount of precipitation over the continent. Anita and Cari were also responsible for precipitation totals exceeding the monthly climatology. The precipitation climatology in March from the south of Bahia to Rio de Janeiro states is about 150 mm, and Anita caused ~230 mm in southern Bahia, while the same amount of rainfall was observed (~230 mm) in Rio de Janeiro during the Cari event. On the other hand, the precipitation caused by Eçaí (~170 mm) did not overestimate the December climatology of 250 mm over Rio de Janeiro, but was still intense since it occurred in only four days. Bapo and Deni produced more precipitation over the ocean than the continent (Figure 10). All cyclones studied here impacted Rio de Janeiro state, an important oil producer and tourist center in Brazil. Therefore, extreme events in this region can also cause negative impacts on the local economy.
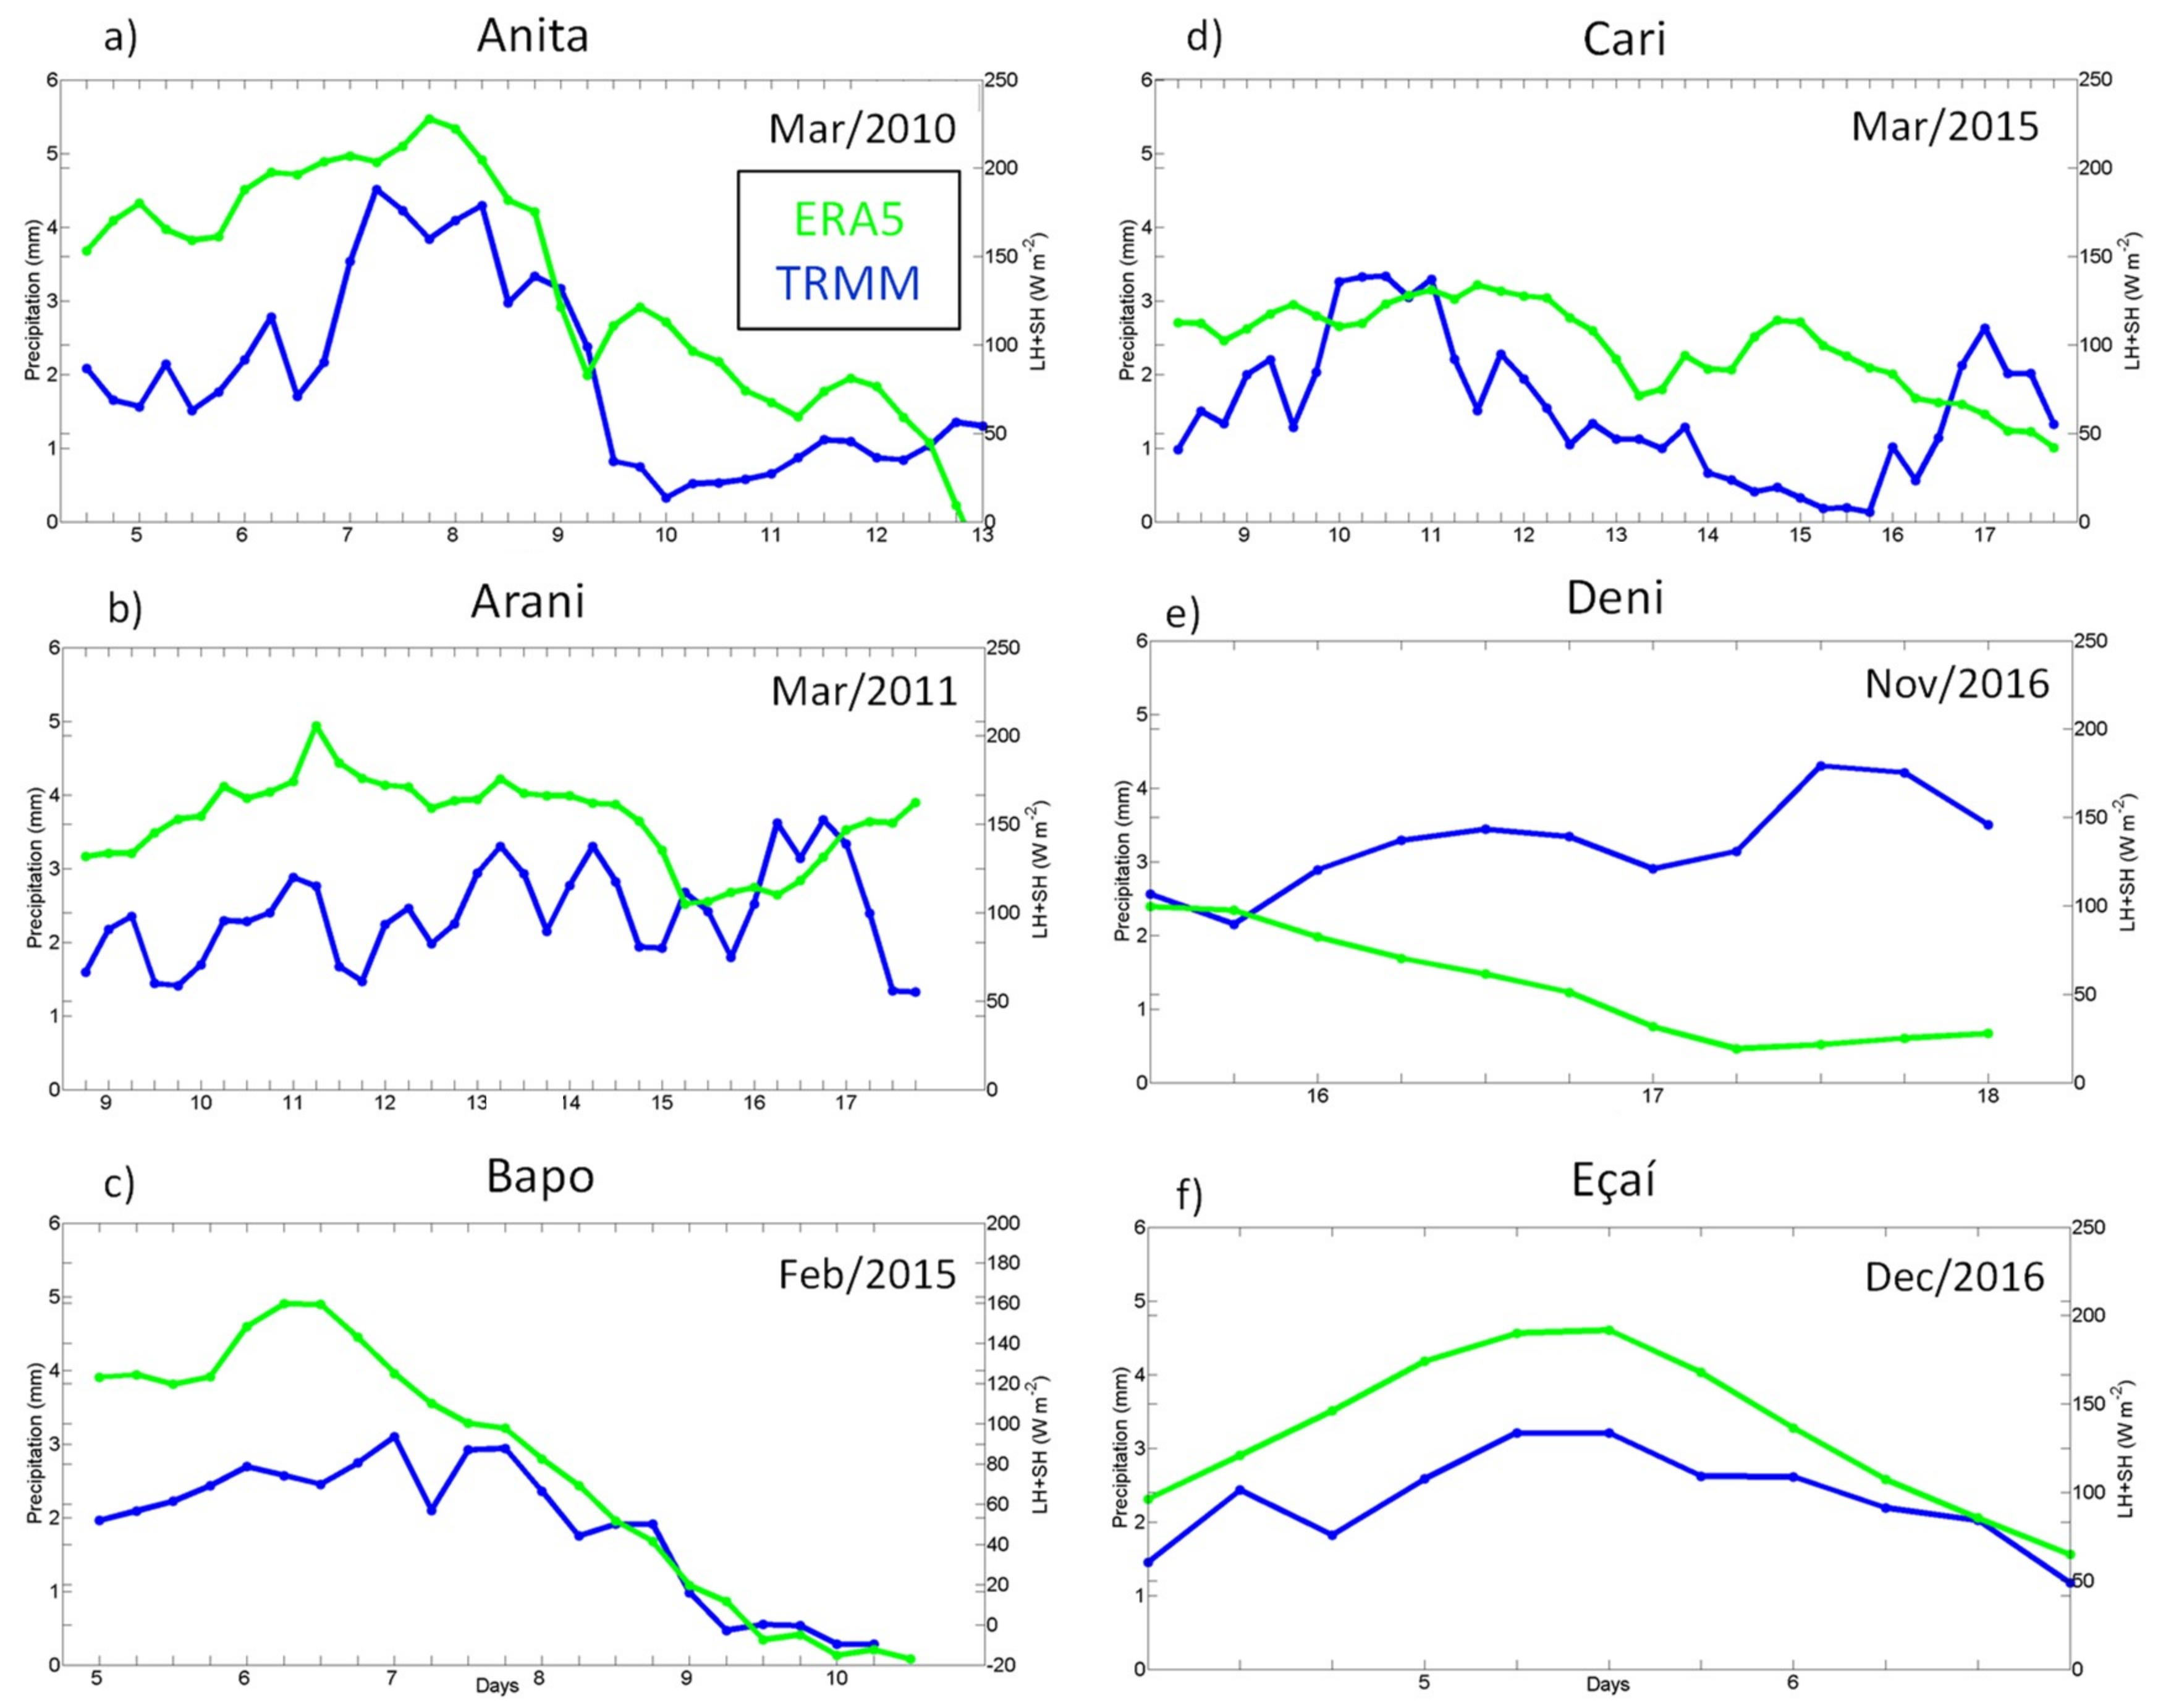
Figure 11 depicts the mean precipitation and the total near-surface heat fluxes (sensible plus latent heat) every 6 h following the cyclone trajectory. The time evolution for Anita, Bapo, and Eçaí shows the increase/decrease in rainfall occurring in phase with the increase/decrease in the surface heat fluxes. For Arani, Cari, and Deni, this connection did not occur. These time evolutions of both variables indicate that, in some events, the local moisture source is more important to organize the rainfall, while, in others, the non-local moisture sources are more important as reported in References [6,46]. For all events, until the maturity phase, the near total surface heat fluxes are, in general, higher than climatological values presented by References [45,58] (Figure 11). When considering Anita, Figure 11a shows that, until March 8, the near-surface turbulent heat fluxes were intense (~200 W·m−2) and, after, there was an abrupt decrease, which may have prevented the Anita transition to a tropical system as discussed by Reference [11].
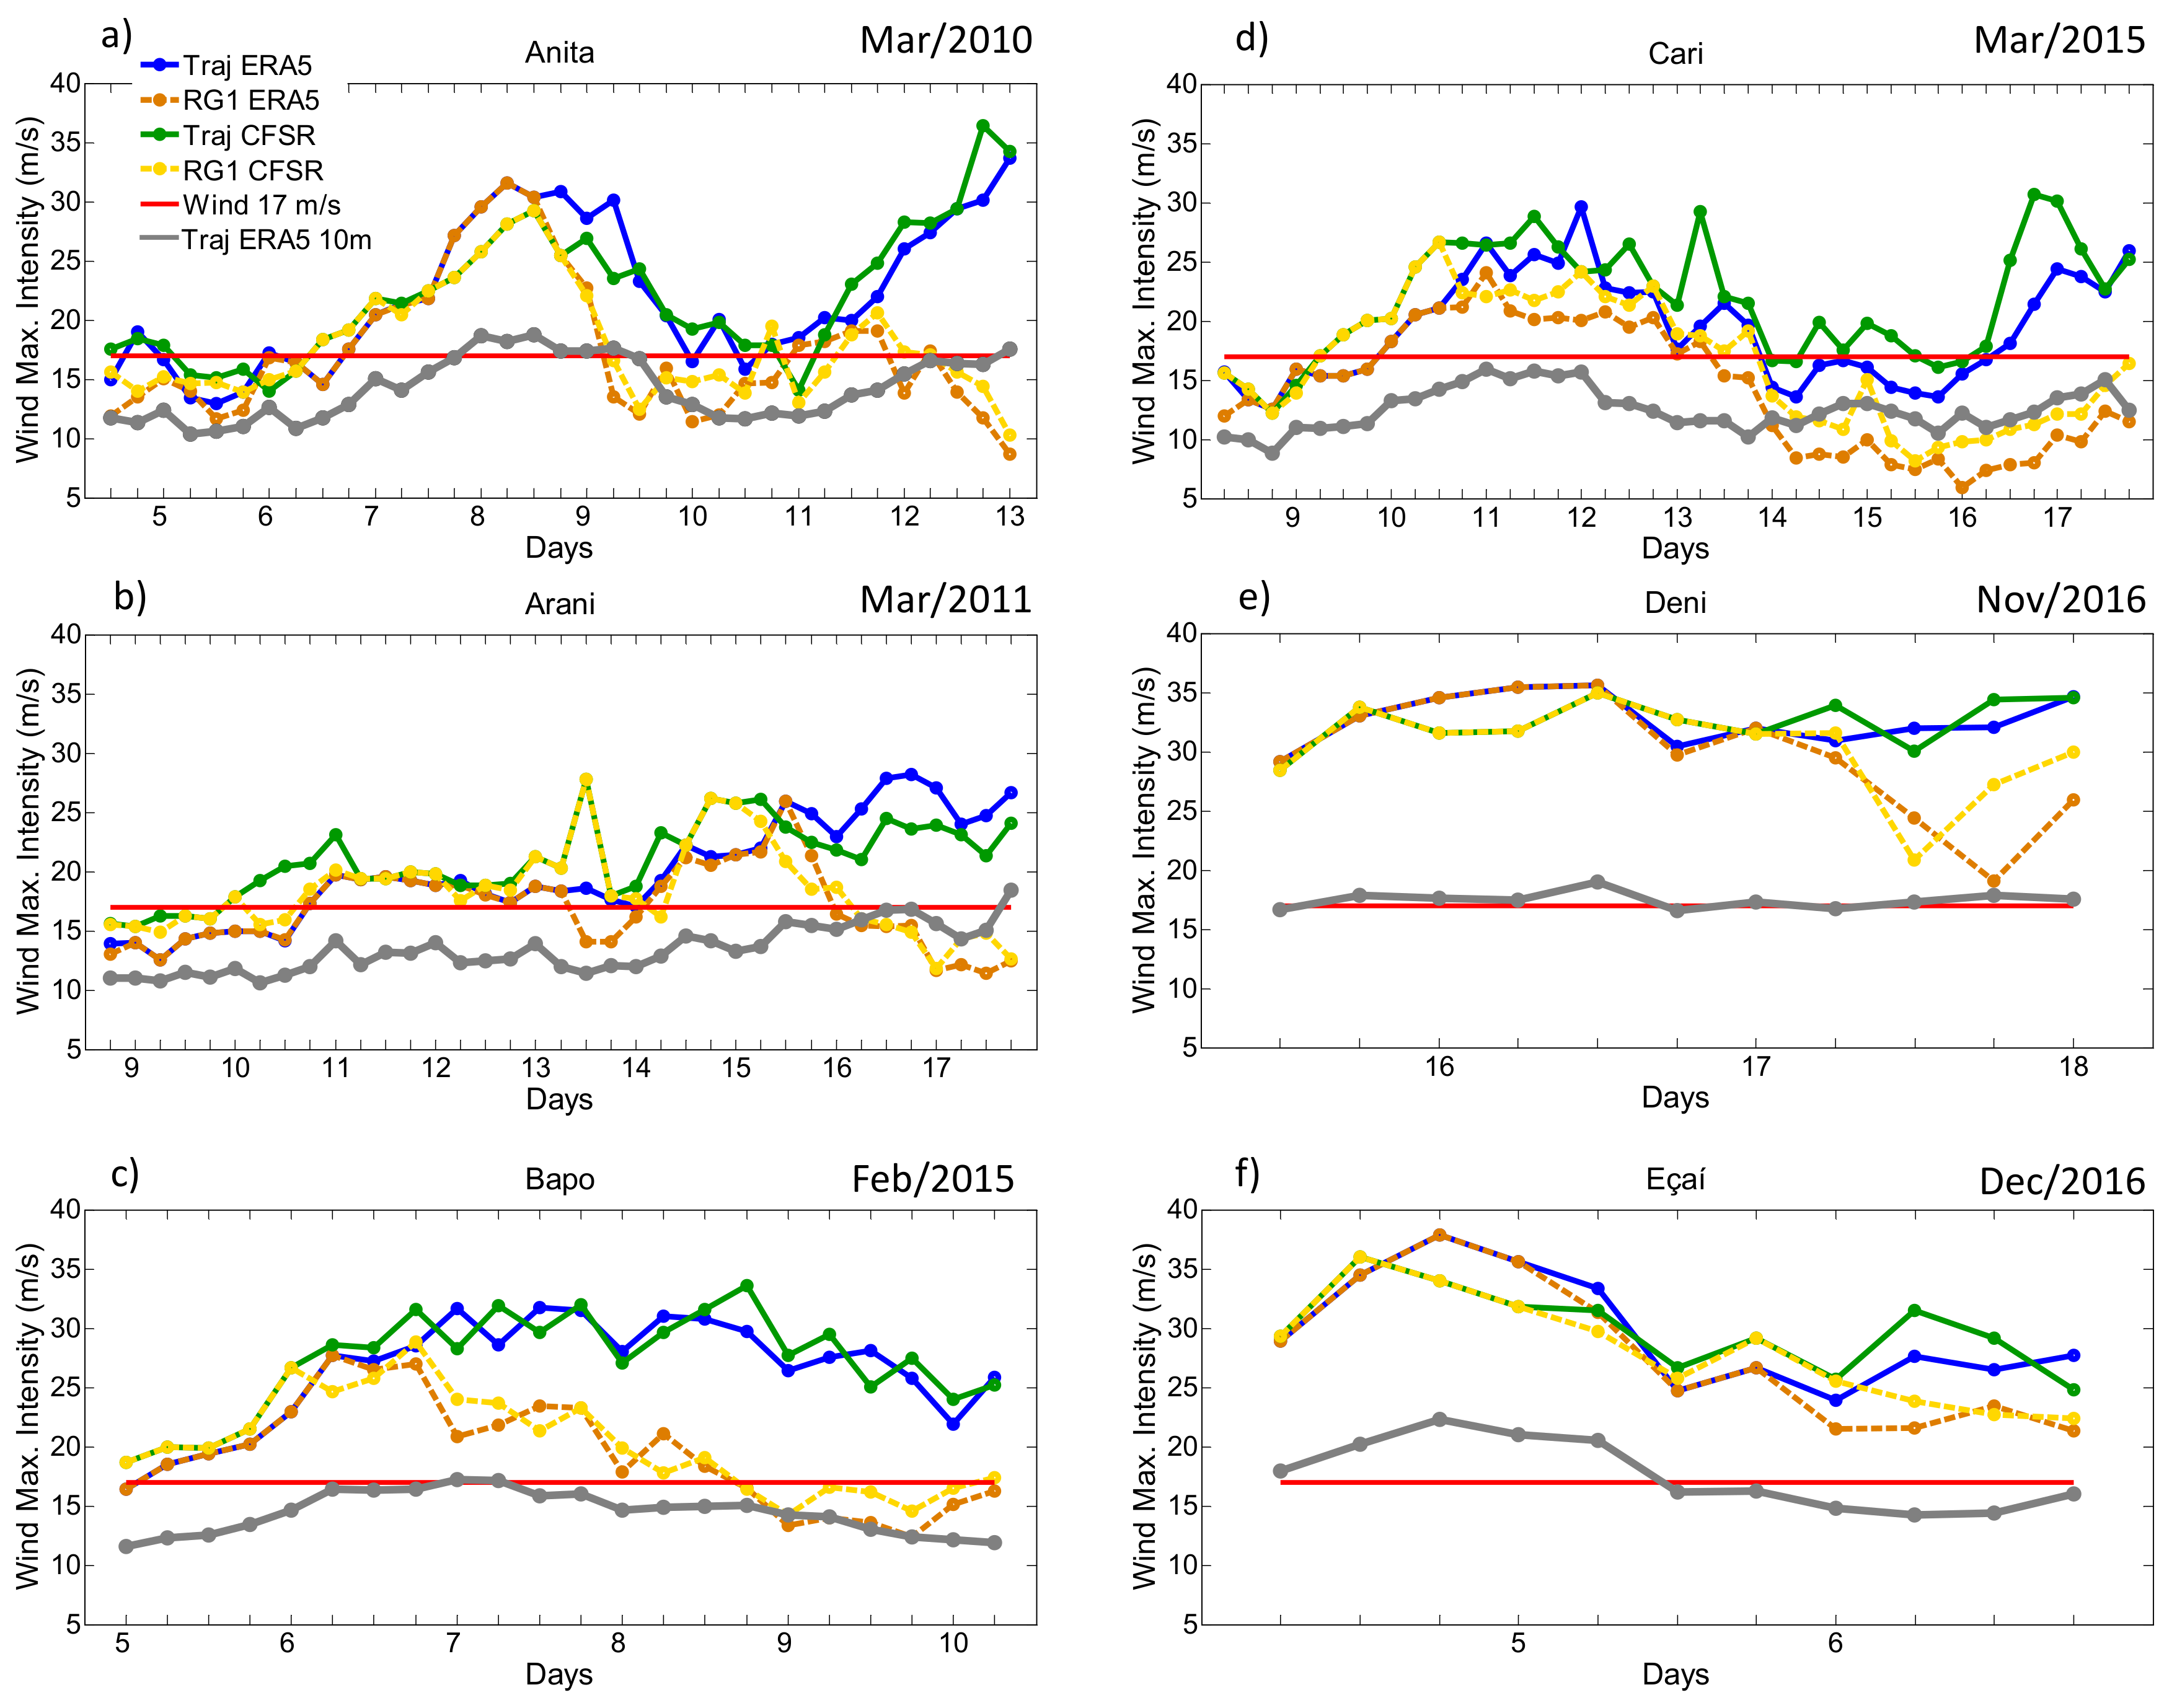
In the previous section, we presented the winds at 925 hPa. However, as the damages associated with cyclones occur near the surface, Figure 12 shows the maximum wind intensity following the cyclone center (Lagrangean analysis) for both 925 hPa and at 10 m high. The maximum wind intensity at 925 hPa in the RG1 (Eulerian analysis) is also shown in Figure 12.
Considering 925 hPa(Figure 12), it is clear that ERA5 and CFSR present similar wind intensity values, giving reliability to the wind estimates over the ocean. In both reanalyses, the lifecycle of the cyclones was characterized by strong maxima winds, exceeding 17 m·s−1 (for more than two days), which is the minimum threshold used to consider a cyclone as subtropical in some studies [5,19]. The similarities of wind intensity in the areas following cyclone center and RG1 in Figure 12 indicate the period when the cyclones were acting in RG1. In the last stages of their lifecycle, the wind intensity in RG1 decreased since the cyclones were distanced from that region (Figure 1), while winds remained intense along the cyclone trajectory. Bapo, Deni, and Eçaí sustained maxima winds above 30 m·s−1 for most of their lifecycles (Figure 12). The maxima winds at 10 m high following the cyclone trajectories present a similar time evolution to the wind at 925 hPa and, as expected, they are weaker, varying between 10 and 15 m·s−1. However, in some periods of the lifecycle of Anita and Eçaí, the winds reached 20 m·s−1. Although the subtropical cyclones present intense winds near the surface, they do not reach hurricane intensity (wind intensity higher than 33 m·s−1) as defined by the Saffir–Simpson scale (https://www.nhc.noaa.gov/aboutsshws.php?).
The strong winds and horizontal shears in the fine-resolution reanalysis result in strong relative vorticity minima at the center of the cyclones (figures not shown). The relative vorticity at 925 hPa in the initial phase of the cyclones (data not shown) ranged from −10 × 10−5 s−1 (Anita and Cari) to −50 × 10−5 s−1 (Eçaí). Considering the lifecycle of all cyclones, the strongest relative vorticity was observed in Eçaí at 18 Z on December 4 (−70 × 10−5 s−1) in ERA5 reanalysis (−50 × 10−5 s−1 in CFSR). This case presented the highest difference between the reanalyses. At this same date, the difference was ~3 hPa in the mean sea-level pressure.
In the initial phase, subtropical cyclones present mean sea-level pressure ranging from 1005 to 1010 hPa, except Eçaí, which presented 995 hPa (figures not shown). Although in Table 3 we used a criterion based on the relative vorticity to identify the maturity phase of the cyclones, in general. the maturity date coincides with the minimum value of mean sea-level pressure registered during the lifecycle of the cyclones. In the maturity stage, the cyclones are about 5 hPa deeper than in the genesis. However, this difference was doubled in Bapo and Cari.
4. Conclusions
A synoptic analysis and characterization of strong winds and heavy rainfall during six named subtropical cyclones over the SAO were presented hereinThe subtropical features of these cyclones were confirmed through CPS methodology. The synoptic analyses indicated that the genesis of the six cyclones had a dynamic support of a small-amplitude trough or a cut-off low at mid-levels, weaker vertical wind shear than the climatology, and moisture supply mainly by the moisture flux convergence (remote sources). SST had a secondary role for subtropical cyclones, once they developed over the sea showing a wide range of temperature (from 22.5 to 28.6 °C). In four of the six subtropical cyclones, a blocking pattern at mid-levels contributed to the initially southwestern displacement of the cyclones and for the decrease of the vertical wind shear (200–850 hPa), which in turn was an important condition for the atmosphere to organize the convection.
Subtropical cyclones impact the Brazilian coast with strong winds (that can reach 17 m·s−1 at 10 m high) and a large amount of precipitation along their trajectories. Intense rainfalls were registered along the southern/southeastern coast of Brazil, where the accumulated rainfall varied between 170 and 350 mm. In most of the events, these amounts of rainfall were higher than the monthly climatology in the east of southeast Brazil, with the most intense events mainly affecting the Rio de Janeiro and Espírito Santo Brazilian states.
The adverse and extreme events associated with subtropical cyclones draw attention to the need for a continuous monitoring of their development. In this way, the present study contributes to improving the knowledge of subtropical cyclones over the SAO and to warn of their potential to produce severe weather events. In a future study, it is planned to evaluate the ability of the operational weather forecasting systems in South America to forecast the subtropical cyclones’ strong winds and precipitation.
Author Contributions
D.M.d.O. organized the dataset and prepared the figures. M.S.R. and R.P.d.R. analyzed the results and wrote the paper.
Funding
CAPES Finance Code 001, CNPq, and FAPESP.
Acknowledgments
This work was financed in part by the Coordenação de Aperfeiçoamento de Pessoal de Nível Superior Brazil (CAPES) Finance Code 001, FAPESP (SANSAO–08/58101-9), and CNPq. The authors also thank the meteorological centers (ECMWF and NOAA) for providing the data used in this study.
Conflicts of Interest
The authors declare no conflict of interest.
References
- Peixoto, J.P.; Oort, A.H. Physics of Climate. Am. Inst. Phys. 1992, 173, 415–423. [Google Scholar] [CrossRef]
- Catto, J.L. Extratropical cyclone classification and its use in climate studies. Rev. Geophys. 2016, 54, 486–520. [Google Scholar] [CrossRef]
- Reboita, M.S.; Gan, M.A.; da Rocha, R.P.; Custódio, I.S. Surface Cyclones over Austral Latitudes: Part I-Bibliographic Review. Revista Brasileira de Meteorologia 2017, 32, 171–186. [Google Scholar] [CrossRef]
- Hart, R.E. A cyclone phase space derived from thermal wind and thermal asymmetry. Mon. Weather Rev. 2003, 131, 585–616. [Google Scholar] [CrossRef]
- Guishard, M.P.; Evans, J.L.; Hart, R.E. Atlantic Subtropical Storms. Part II: Climatology. J. Clim. 2009, 22, 574–3594. [Google Scholar] [CrossRef]
- Gozzo, L.F.; da Rocha, R.P.; Reboita, M.S.; Sugahara, S. Subtropical cyclones over the southwestern South Atlantic: Climatological aspects and case study. J. Clim. 2014, 27, 8543–8562. [Google Scholar] [CrossRef]
- Gray, W.M. Global view of the origin of tropical disturbances and storms. Mon. Weather Rev. 1968, 96, 669–700. [Google Scholar] [CrossRef]
- da Rocha, R.P.; Reboita, M.S.; Gozzo, L.F.; Dutra, L.M.M.; de Jesus, E.M. Subtropical cyclones over the oceanic basins: A review. Ann. N. Y. Acad. Sci. 2018, 1–19. [Google Scholar] [CrossRef] [PubMed]
- Holland, G.J.; McBride, J.L.; Smith, R.K.; Jasper, D.; Keenan, T.D. The BMRC Australian monsoon experiment: AMEX. Bull. Am. Meteorol. Soc. 1986, 67, 1466–1472. [Google Scholar] [CrossRef]
- Guishard, M.P. Atlantic Subtropical Storms: Climatology and Characteristics. Ph.D. Thesis, Pennsylvania State University, State College, PA, USA, 2006. [Google Scholar]
- Dias Pinto, J.R.; Reboita, M.S.; da Rocha, R.P. Synoptic and dynamical analysis of subtropical cyclone Anita (2010) and its potential for tropical transition over the South Atlantic Ocean. J. Geophys. Res. Atmos. 2013, 118, 870–883. [Google Scholar] [CrossRef]
- Tous, M.; Romero, R. Meteorological environments associated with medicane development. Int. J. Climatol. 2013, 33, 1–14. [Google Scholar] [CrossRef]
- Cavicchia, L.; Von Storch, H.; Gualdi, S. A long-term climatology of medicanes. Clim. Dyn. 2014, 43, 1183–1195. [Google Scholar] [CrossRef]
- Mctaggart-Cowan, R.; Bosart, L.F.; Davis, C.A.; Atallah, E.H.; Gyakum, J.R.; Emanuel, K.A. Analysis of Hurricane Catarina (2004). Mon. Weather Rev. 2006, 134, 3029–3053. [Google Scholar] [CrossRef]
- Pezza, A.B.; Simmonds, I. The First South Atlantic Hurricane: Unprecedented Blocking, Low Shear and Climate Change. Geophys. Res. Lett. 2005, 32, L15712. [Google Scholar] [CrossRef]
- Iwabe, C.M.N.; Reboita, M.S.; Camargo, R. Estudo de caso de uma situação atmosférica entre 12 e 19 de setembro de 2008, com algumas características semelhantes ao evento Catarina. Revista Brasileira de Meteorologia 2011, 26, 67–84. [Google Scholar] [CrossRef] [Green Version]
- Dutra, L.M.M.; daRocha, R.P.; Lee, R.W. Structure and evolution of subtropical cyclone Anita as evaluated by heat and vorticity budgets. Q. J. R. Meteorol. Soc. 2017, 143, 1539–1553. [Google Scholar] [CrossRef]
- Reboita, M.S.; Gan, M.A.; daRocha, R.P.; Custódio, I.S. Surface Cyclones over Austral Latitudes: Part II Cases Study. Revista Brasileira de Meteorologia 2017, 32, 509–542. [Google Scholar] [CrossRef]
- Evans, J.L.; Braun, A. A climatology of subtropical cyclones in the South Atlantic. J. Clim. 2012, 25, 7328–7340. [Google Scholar] [CrossRef]
- NORMAM 19/DHN. Normas da autoridade marítima para as atividade de Meteorologia Marítima. 2011. Available online: https://www.marinha.mil.br/dhn/sites/www.marinha.mil.br.dhn/files/normam/NORMAN-19-REV-1--Ed2018-CHM.pdf (accessed on 12 November 2018).
- Hersbach, H.; Dee, D. ERA5 reanalysis is in production. ECMWF Newsl. 2016, 147, 7. [Google Scholar]
- Saha, S.; Moorthi, S.; Wu, X.; Wang, J.; Nadiga, S.; Tripp, P.; Ek, M. The NCEP climate forecast system version 2. J. Clim. 2014, 27, 2185–2208. [Google Scholar] [CrossRef]
- Huffman, G.J.; Bolvin, D.T. TRMM and Other Data Precipitation Data Set Documentation; NASA: Greenbelt, MD, USA, 2013; Volume 28.
- Knapp, K.R. NOAA CDR Program; NOAA Climate Data Record (CDR) of Gridded Satellite Data from ISCCP B1 (GridSat-B1) Infrared Channel Brightness Temperature, Version 2; NOAA National Centers for Environmental Information: Asheville, NC, USA, 2014.
- Sinclair, M.R. An objective cyclone climatology for the Southern Hemisphere. Mon. Weather Rev. 1994, 122, 2239–2256. [Google Scholar] [CrossRef]
- Hawcroft, M.K.; Shaffrey, L.C.; Hodges, K.I.; Dacre, H.F. How much Northern Hemisphere precipitation is associated with extratropical cyclones? Geophys. Res. Lett. 2012, 39, L24809. [Google Scholar] [CrossRef]
- Reboita, M.S.; daRocha, R.P.; de Souza, M.R.; Llopart, M. Extratropical cyclones over the southwestern South Atlantic Ocean: HadGEM2-ES and RegCM4 projections. Int. J. Climatol. 2018, 38, 2866–2879. [Google Scholar] [CrossRef]
- Reboita, M.S.; da Rocha, R.P.; Ambrizzi, T.; Sugahara, S. South Atlantic Ocean Cyclogenesis Climatology Simulated by Regional Climate Model (RegCM3). Clim. Dyn. 2010, 35, 1331–1347. [Google Scholar] [CrossRef]
- Palmén, E.H.; Newton, C.W. Atmospheric Circulation Systems: Their Structure and Physical Interpretation; Academic Press: Cambridge, MA, USA, 1969; Volume 13. [Google Scholar]
- Nieto, R.; Sprenger, M.; Wernli, H.; Trigo, R.M.; Gimeno, L. Identification and Climatology of Cut-off Lows near the Tropopause. Ann. N. Y. Acad. Sci. 2008, 1146, 256–290. [Google Scholar] [CrossRef] [PubMed]
- COMET. Satellite Feature Identification: Blocking Patterns; University Corporation for Atmospheric Research: Boulder, CO, USA, 2009. [Google Scholar]
- DeMaria, M. The effect of vertical shear on tropical cyclone intensity change. J. Atmos. Sci. 1996, 53, 2076–2088. [Google Scholar] [CrossRef]
- Montgomery, M.T.; Farrell, B.F. Tropical cyclone formation. J. Atmos. Sci. 1993, 50, 285–310. [Google Scholar] [CrossRef]
- Zhang, F.; Sippel, J.A. Effects of moist convection on hurricane predictability. J. Atmos. Sci. 2009, 66, 1944–1961. [Google Scholar] [CrossRef]
- Emanuel, K.A. An air-sea interaction theory for tropical cyclones. Part I: Steady-state maintenance. J. Atmos. Sci. 1986, 43, 585–604. [Google Scholar] [CrossRef]
- Emanuel, K.A. The Maximum Intensity of Hurricanes. J. Atmos. Sci. 1988, 45, 1143–1155. [Google Scholar] [CrossRef] [Green Version]
- Emanuel, K.A. Sensitivity of tropical cyclones to surface exchange coefficients and a revised steady-state model incorporating eye dynamics. J. Atmos. Sci. 1995, 52, 3969–3976. [Google Scholar] [CrossRef]
- Bister, M.; Emanuel, K.E. Low frequency variability of tropical cyclone potential intensity: 1. Interannual to interdecadal variability. J. Geophys. Res. Atmos. 2012, 107, 1–15. [Google Scholar] [CrossRef]
- Zeng, X.; Zhao, M.; Dickinson, R.E. Intercomparison of Bulk Aerodynamic Algorithms for the Computation of Sea Surface Fluxes Using TOGA COARE and TAO Data. J. Clim. 1998, 11, 2628–2644. [Google Scholar] [CrossRef]
- Cione, J.J.; Uhlhorn, E.W. Sea surface temperature variability in hurricanes: Implications with Respect to Intensity Change. Mon. Weather Rev. 2003, 131, 1783–1796. [Google Scholar] [CrossRef]
- Kuo, Y.H.; Low-Nam, S.; Reed, R.J. Effects of surface energy fluxes during the early development and rapid intensification stages of seven explosive cyclones in the western Atlantic. Mon. Weather Rev. 1991, 119, 457–476. [Google Scholar] [CrossRef]
- Hogsett, W.; Zhang, D.L. Numerical simulation of Hurricane Bonnie (1998). Part III: Energetics. J. Atmos. Sci. 2009, 66, 2678–2696. [Google Scholar] [CrossRef]
- Ma, Z.; Fei, J.; Huang, X.; Cheng, X. The effects of ocean feedback on tropical cyclone energetics under idealized air-sea interaction conditions. J. Geophys. Res. Atmos. 2013, 118, 9778–9788. [Google Scholar] [CrossRef] [Green Version]
- Mei, W.; Pasquero, C.; Primeau, F. The effect of translation speed upon the intensity of tropical cyclones over the tropical ocean. Geophys. Res. Lett. 2012, 39, L07801. [Google Scholar] [CrossRef]
- Reboita, M.S.; da Rocha, R.P.; Ambrizzi, T.; Caetano, E. An assessment of the latent and sensible heat flux on the simulated regional climate over Southwestern South Atlantic Ocean. Clim. Dyn. 2010, 34, 873–889. [Google Scholar] [CrossRef]
- Gozzo, L.F.; da Rocha, R.P.; Gimeno, L.; Drumond, A. Climatology and numerical case study of moisture sources associated with subtropical cyclogenesis over the southwestern Atlantic Ocean. J. Geophys. Res.-Atmos. 2017, 122, 5636–5653. [Google Scholar] [CrossRef]
- Fritz, C.; Wang, Z. Water Vapor Budget in a Developing Tropical Cyclone and Its Implication for Tropical Cyclone Formation. J. Atmos. Sci. 2014, 71, 4321–4332. [Google Scholar] [CrossRef]
- Zhu, Y.; Newell, R.E. Atmospheric rivers and bombs. Geophys. Res. Lett. 1994, 21, 1999–2002. [Google Scholar] [CrossRef]
- Zhang, Z.; Ralph, F.M.; Zheng, M. The Relationship between Extratropical Cyclone Strength and Atmospheric River Intensity and Position. Geophys. Res. Lett. 2018. [Google Scholar] [CrossRef]
- Simpson, R.H. Evolution of the Kona storm a subtropical cyclone. J. Meteorol. 1952, 9, 24–35. [Google Scholar] [CrossRef]
- Trenberth, K.E.; Shea, D.J. Atlantic hurricanes and natural variability in 2005. Geophys. R. Lett. 2006, 33. [Google Scholar] [CrossRef] [Green Version]
- Glenn, S.M.; Miles, T.N.; Seroka, G.N.; Xu, Y.; Forney, R.K.; Yu, F.; Kohut, J. Stratified coastal ocean interactions with tropical cyclones. Nat. Commun. 2016, 7, 10887. [Google Scholar] [CrossRef] [PubMed] [Green Version]
- Scoccimarro, E.; Fogli, P.G.; Reed, K.A.; Gualdi, S.; Masina, S.; Navarra, A. Tropical cyclone interaction with the ocean: The role of high-frequency (subdaily) coupled processes. J. Clim. 2017, 30, 145–162. [Google Scholar] [CrossRef]
- Hawkins, H.F.; Imbembo, S.M. The structure of a small, intense hurricane-Inez, 1966. Mon. Weather Rev. 1976, 104, 418–442. [Google Scholar] [CrossRef]
- Hawkins, H.F.; Rubsam, D.T. Hurricane Hilda, 1964. Mon. Weather Rev. 1968, 96, 617–663. [Google Scholar] [CrossRef]
- Kidder, S.Q.; Goldberg, M.D.; Zehr, R.M.; Demaria, M.; Purdom, J.F.W.; Velden, C.S.; Grody, N.C.; Kusselson, S.J. Satellite analysis of tropical cyclones using the Advanced Microwave Sounding Unit (AMSU). Bull. Am. Meteorol. Soc. 2000, 81, 1241–1259. [Google Scholar] [CrossRef]
- Brasiliense, C.S.; Dereczynski, C.P.; Satyamurty, P.; Chou, S.C.; da Silva Santos, V.R.; Calado, R.N. Synoptic analysis of an intense rainfall event in Paraíba do Sul river basin in southeast Brazil. Meteorol. Appl. 2018, 25, 66–77. [Google Scholar] [CrossRef]
- Wainer, I.; Taschetto, A.; Soares, J.; de Oliveira, A.P.; Otto-Bliesner, B.; Brady, E. Intercomparison of heat fluxes in the South Atlantic. Part I: The seasonal cycle. J. Clim. 2003, 16, 706–714. [Google Scholar] [CrossRef]
Figure 1.
Trajectory of the six named subtropical cyclones based on the minima of relative vorticity at 925 hPa. The circle indicates the first position of each system. The purple box defines the southeastern coast of Brazil called RG1. The acronyms RS, SC, PR, SP, RJ, and ES indicate the Brazilian states, respectively, Rio Grande do Sul, Santa Catarina, Paraná, São Paulo, Rio de Janeiro, and Espírito Santo.

Figure 2.
Cyclone Phase Space (CPS) of Anita, Arani, and Bapo. (a,c,e): The left column presents the parameters B versus –VTL; (b,d,f): the right column presents the parameters –VTL versus –VTU. A and Z indicate, respectively, the first and the last time of the cyclone lifecycle. The circle size indicates the mean radius of the wind gale force at 925 hPa (17 m·s−1) and the colors are the sea-level pressure values (see scale in the right of figure). Positions at 0000 Z are labeled with the day.

Figure 3.
CPS of Cari, Deni, and Eçaí. (a,c,e): the left column presents the parameters B versus –VTL; (b,d,f): the right column the parameters –VTL versus –VTU. A and Z indicate, respectively, the first and the last time of the cyclone lifecycle. The circle size indicates the mean radius of the wind gale force at 925 hPa (17 m·s−1) and the colors are the sea-level pressure values (see scale in the right of figure). Positions at 0000 Z are labeled with the day.

Figure 4.
Geopotential height (m) at 500 hPa (shaded and green line) and mean sea-level pressure (hPa; blue lines) during the genesis phase of the six subtropical cyclones: (a) Anita, (b) Arani, (c) Bapo, (d) Cari, (e) Deni and (f) Eçaí. L indicates the surface low-pressure center and the red dashed lines show the trough axis at 500 hPa.

Figure 5.
Geopotential height (m) at 500 hPa (shaded and green lines) and sea-level pressure (hPa; blue lines) in the maturity phase of the six subtropical cyclones: (a) Anita, (b) Arani, (c) Bapo, (d) Cari, (e) Deni and (f) Eçaí. L indicates the surface low-pressure center. In panel (a), a zoomed-in region in the cut-off low area to highlight the easterly winds at 500 hPa is also shown.

Figure 6.
Vertical wind shear (m·s−1) in the layer 200–850 hPa (200 minus 850 hPa; shaded) and the vertically integrated horizontal moisture flux (vectors in kg·m−1·s−1; black lines) at the genesis of the six subtropical cyclones: (a) Anita, (b) Arani, (c) Bapo, (d) Cari, (e) Deni and (f) Eçaí.
Figure 6.
Vertical wind shear (m·s−1) in the layer 200–850 hPa (200 minus 850 hPa; shaded) and the vertically integrated horizontal moisture flux (vectors in kg·m−1·s−1; black lines) at the genesis of the six subtropical cyclones: (a) Anita, (b) Arani, (c) Bapo, (d) Cari, (e) Deni and (f) Eçaí.

Figure 7.
Vertical wind shear (m·s−1) in the layer 200–850 hPa (200 minus 850 hPa; shaded) and the vertically integrated horizontal moisture flux (vectors in kg·m−1·s−1; black lines) at the maturity phase of the six subtropical cyclones: (a) Anita, (b) Arani, (c) Bapo, (d) Cari, (e) Deni and (f) Eçaí.

Figure 8.
Brightness temperature near 11 microns (K) and intensity and direction of the wind at 925 hPa (m·s−1) for the maturity phase of the six named subtropical cyclones over the South Atlantic Ocean (SAO): (a) Anita, (b) Arani, (c) Bapo, (d) Cari, (e) Deni and (f) Eçaí.
Figure 8.
Brightness temperature near 11 microns (K) and intensity and direction of the wind at 925 hPa (m·s−1) for the maturity phase of the six named subtropical cyclones over the South Atlantic Ocean (SAO): (a) Anita, (b) Arani, (c) Bapo, (d) Cari, (e) Deni and (f) Eçaí.

Figure 9.
Top: vertical cross-section of zonal departure of air temperature (°C, shaded) and geopotential height (m, black lines). Bottom: vertical cross-section of cyclonic relative vorticity (× 10−5 s−1) for cyclone maturity phase: (a,g) Anita, (b,h) Arani, (c,i) Bapo, (d,j) Cari, (e,k) Deni, and (f,l) Eçaí. Zonal departure was computed considering 10° east–west from the cyclone center. L indicates the cyclone center.

Figure 10.
Accumulated precipitation (mm) during the lifecycle of the subtropical cyclones: (a) Anita, (b) Arani, (c) Bapo, (d) Cari, (e) Deni and (f) Eçaí. Circles in pink color indicate the cyclone position every 6 h.
Figure 10.
Accumulated precipitation (mm) during the lifecycle of the subtropical cyclones: (a) Anita, (b) Arani, (c) Bapo, (d) Cari, (e) Deni and (f) Eçaí. Circles in pink color indicate the cyclone position every 6 h.

Figure 11.
Mean precipitation (mm, blue line) and total (latent plus sensible) heat fluxes (W·m−2, green line) every 6h registered in a region of 10° × 10° area following the center of the cyclones (Lagrangean analysis): (a) Anita, (b) Arani, (c) Bapo, (d) Cari, (e) Deni and (f) Eçaí. For the total heat fluxes only the values over the ocean were considered.

Figure 12.
Maximum wind intensity (m·s−1) at 925 hPa every 6 h in a region of 10° × 10° following the cyclone center (Lagrangean analysis) for ERA5 (blue line) and Climate Forecast System Reanalysis (CFSR; green line) and maximum wind intensity in RG1 (Eulerian analysis) for ERA5 (orange line) and CFSR (yellow line): (a) Anita, (b) Arani, (c) Bapo, (d) Cari, (e) Deni and (f) Eçaí. The maximum 10-m winds following the cyclone center are also presented for ERA5 (grey line). The horizontal red line indicates the intensity of 17 m·s−1, which is a threshold used by Reference [19] to consider a cyclone as subtropical at 925 hPa.


Table 1.
Description of the dataset used in the study..
| Variables | Horizontal Resolution | Source |
|---|---|---|
| Air temperature (K), relative humidity (%), geopotential (m2·s−2), wind componemts (m·s−1) from 1000 hPa to 30 hPa every 6 h | 0.3° × 0.3° | ERA5/ECMWF https://www.ecmwf.int/en/forecasts/datasets/reanalysis-datasets/era5 Hersbach and Dee (2016) |
| Near-surface latent (LH) and sensible (SH) heat flux (W·m−2), sea surface temperature (K), 10-m wind (m·s−1) and mean sea-level pressure (hPa) every 3 h | ||
| Mean sea-level pressure (hPa) and winds at 10-m and 925 hPa every 6 h | 0.5° × 0.5° | CFSR/NCEP https://rda.ucar.edu/datasets/ds093.1/ Saha et al. (2014) |
| Precipitation (mm) every 3 h | 0.25° × 0.25° | TRMM-3B42 https://disc2.gesdisc.eosdis.nasa.gov/data//TRMM_RT/TRMM_3B42RT.7/ Huffman and Bolvin (2015) |
| Brightness temperature near 11 microns (K) every 3 h | 0.07° × 0.07° | GridSat-B1/NOAA https://www.ncdc.noaa.gov/gridsat/ Knapp et al. (2014) |
Table 2.
Characteristics of the six named subtropical cyclones over the South Atlantic Ocean (SAO). Dates of genesis and cyclolysis, and coordinates of the initial position were based on the cyclonic relative vorticity at 925 hPa.
Table 2.
Characteristics of the six named subtropical cyclones over the South Atlantic Ocean (SAO). Dates of genesis and cyclolysis, and coordinates of the initial position were based on the cyclonic relative vorticity at 925 hPa.
| Cyclone | Date of Genesis (Date of Cyclolysis) | Initial Position | Lifetime (Days) | Traveled Distances (km) | ||
|---|---|---|---|---|---|---|
| Latitude | Longitude | Sum of the Distances at Every 6 h | From the First to Last Position | |||
| Anita | 06Z 4 Mar 2010 (00Z 13 Mar 2010) | −19.75 | −34.75 | 9 | 5361 | 2674 |
| Arani | 12Z 8 Mar 2011 (18Z 17 Mar 2011) | −24.00 | −41.25 | 9 | 3769 | 1725 |
| Bapo | 18Z 4 Fev 2015 (06Z 10 Fev 2015) | −26.00 | −43.50 | 6 | 3395 | 2622 |
| Cari | 00Z 8 Mar 2015 (18Z 17 Mar 2015) | −26.25 | −45.00 | 10 | 3300 | 1441 |
| Deni | 00Z 15 Nov 2016 (00Z 18 Nov 2016) | −23.00 | −42.50 | 3 | 2031 | 1766 |
| Eçaí | 00Z 4 Dez 2016 (18Z 6 Dez 2016) | −26.50 | −47.50 | 3 | 1267 | 1156 |
Table 3.
Date of genesis (time of the first close isobar in the sea-level pressure field) and maturity (time of the most intense cyclonic relative vorticity in the vertical column) and box mean (10° × 10° of latitude by longitude from the cyclone center) of the variables (sea surface temperature (SST), near-surface latent (LH) and latent plus sensible heat fluxes (LH+SH), and difference between SST and air temperature at 2 m) for each subtropical cyclone. Values during the maturity phase are in parentheses.
| Cyclone | Genesis (Maturity) | SST (°C) | SST−Tair (°C) | LH (W·m−2) | LH + SH (W·m−2) |
|---|---|---|---|---|---|
| Anita | 00Z06Mar2010 (12Z09Mar2010) | 28.6 (24.7) | 2.0 (0.9) | 180.8 (110.4) | 197.5 (121.3) |
| Arani | 12Z14Mar2011 (12Z15Mar2011) | 26.8 (26.6) | 1.1 (0.9) | 137.8 (103.6) | 151.8 (111.5) |
| Bapo | 06Z05Feb2015 (06Z07Feb2015) | 26.0 (22.8) | 1.4 (0.3) | 108.1 (96.4) | 119.6 (100.3) |
| Cari | 00Z10Mar2015 (00Z12Mar2015) | 26.1 (25.0) | 1.1 (0.6) | 102.6 (118.3) | 111.8 (126.4) |
| Deni | 06Z15Nov2015 (12Z17Nov2015) | 23.3 (19.9) | 0.5 (−0.5) | 95.1 (33.9) | 99.6 (25.2) |
| Eçaí | 00Z04Dec2016 (06Z05Dec2016) | 22.5 (21.7) | 0.4 (1.1) | 94.1 (172.1) | 96.2 (191.8) |
© 2018 by the authors. Licensee MDPI, Basel, Switzerland. This article is an open access article distributed under the terms and conditions of the Creative Commons Attribution (CC BY) license (http://creativecommons.org/licenses/by/4.0/).
Share and Cite
MDPI and ACS Style
Reboita, M.S.; Da Rocha, R.P.; Oliveira, D.M.d. Key Features and Adverse Weather of the Named Subtropical Cyclones over the Southwestern South Atlantic Ocean. Atmosphere 2019, 10, 6. https://doi.org/10.3390/atmos10010006
AMA Style
Reboita MS, Da Rocha RP, Oliveira DMd. Key Features and Adverse Weather of the Named Subtropical Cyclones over the Southwestern South Atlantic Ocean. Atmosphere. 2019; 10(1):6. https://doi.org/10.3390/atmos10010006
Chicago/Turabian StyleReboita, Michelle Simões, Rosmeri Porfírio Da Rocha, and Débora Martins de Oliveira. 2019. "Key Features and Adverse Weather of the Named Subtropical Cyclones over the Southwestern South Atlantic Ocean" Atmosphere 10, no. 1: 6. https://doi.org/10.3390/atmos10010006
Note that from the first issue of 2016, this journal uses article numbers instead of page numbers. See further details here.