Using Post-Harvest Waste to Improve Shearing Behaviour of Loess and Its Validation by Multiscale Direct Shear Tests


1
School of Civil Engineering, Xi’an University of Architecture and Technology, Xi’an 710055, China
2
Shaanxi Key Laboratory of Geotechnical and Underground Space Engineering (XAUAT), Xi’an 710055, China
*
Author to whom correspondence should be addressed.
Appl. Sci. 2019, 9(23), 5206; https://doi.org/10.3390/app9235206
Submission received: 19 October 2019
/
Revised: 25 November 2019
/
Accepted: 27 November 2019
/
Published: 29 November 2019
(This article belongs to the Special Issue Soil Erosion: Dust Control and Sand Stabilization)
Abstract
:Featured Application
The research work highlights the great potential of application of loess-PHW mixtures to loess erosion control and slope stabilization.
Abstract
Loess and PHW (post-harvest waste) are easily accessible in the Chinese Loess Plateau and have been widely applied to construction of residential houses that have been inhabited for decades under the effect of freeze-thaw cycles. Although many researchers have recognised that the addition of fibers to loess soil is effective in preventing soil erosion and stabilising slopes, a consensus on this claim has not been reached yet. This study investigates the shearing behaviour of the loess-PHW mixture using small-scale and large-scale direct shear (SSDS and LSDS) tests. Four typical shear stress versus horizontal displacement curves from the multiscale direct shear tests are recognised where one is featured with strain-softening shape and the other three with a strain-hardening shape. Two out of the three curves with strain-hardening shape show a gradual increase in the shear stress at additional and larger displacements, respectively, in which some factor starts to have an influence on the shearing behaviour. Comparisons of the shear strength measured in SSDS and LSDS are made, indicating that there are differences between SSDS and LSDS. The effect of PHW addition on shear strength is assessed in order to determine the optimal dosage. The improvement of shear strength is attributed to the effect of particle inter-locking, resulting from the addition of PHW to loess specimens, and takes effect as the water content surpassed a threshold, i.e., >14%, that facilitates particle rearrangement. Particle-box interaction behaviour is assessed at the same time, and the findings satisfactorily address the main cause of the gradual increase in shear stress following the curve inflection point. The improved shearing behaviour proves the ability of the loess-PHW mixture to resist the seepage force and consequently stratum erosion.
1. Introduction
Since rapid urbanisation has significantly impacted surrounding environments [1,2,3,4,5,6,7], environment-friendly construction material may ease the impacts despite many advanced technologies available for environmental protection [8,9,10,11,12]. The strength and microstructure properties of spent coffee grounds (CG) stabilised with rice husk ash (RHA) were investigated, which are organic wastes derived from agricultural products [13,14,15]. The results have shown that elevated temperature curing of up to 90 days was deemed the key to secure the strength development of CG-RHA geopolymers. Belhadj et al. [16] performed an experimental work to assess the influence of the addition of barley straw on the physico-mechanical properties and the microstructure of a concrete consisting only of sand as the main aggregate. The addition of barley straw to the sand concrete greatly improved its thermo-physical properties. On the other hand, significant improvements have also been measured in other properties, such as flexural strength, lightness, deformability, ductility, and toughness, notwithstanding that a decrease in the mechanical strength and an increase in the dimensional variations have been recorded. To solve the problems raised, several treatments were tested for improving the properties of the optimal composition of the studied lightweight concrete, and the barley straws treated with hot water showed good improvements in the flexural strength of the composite. Additionally, the hot water treatment led to acceptable results in the thermal characteristics although the density of the composite did not increase much compared to the concrete containing the untreated barley straws [17].
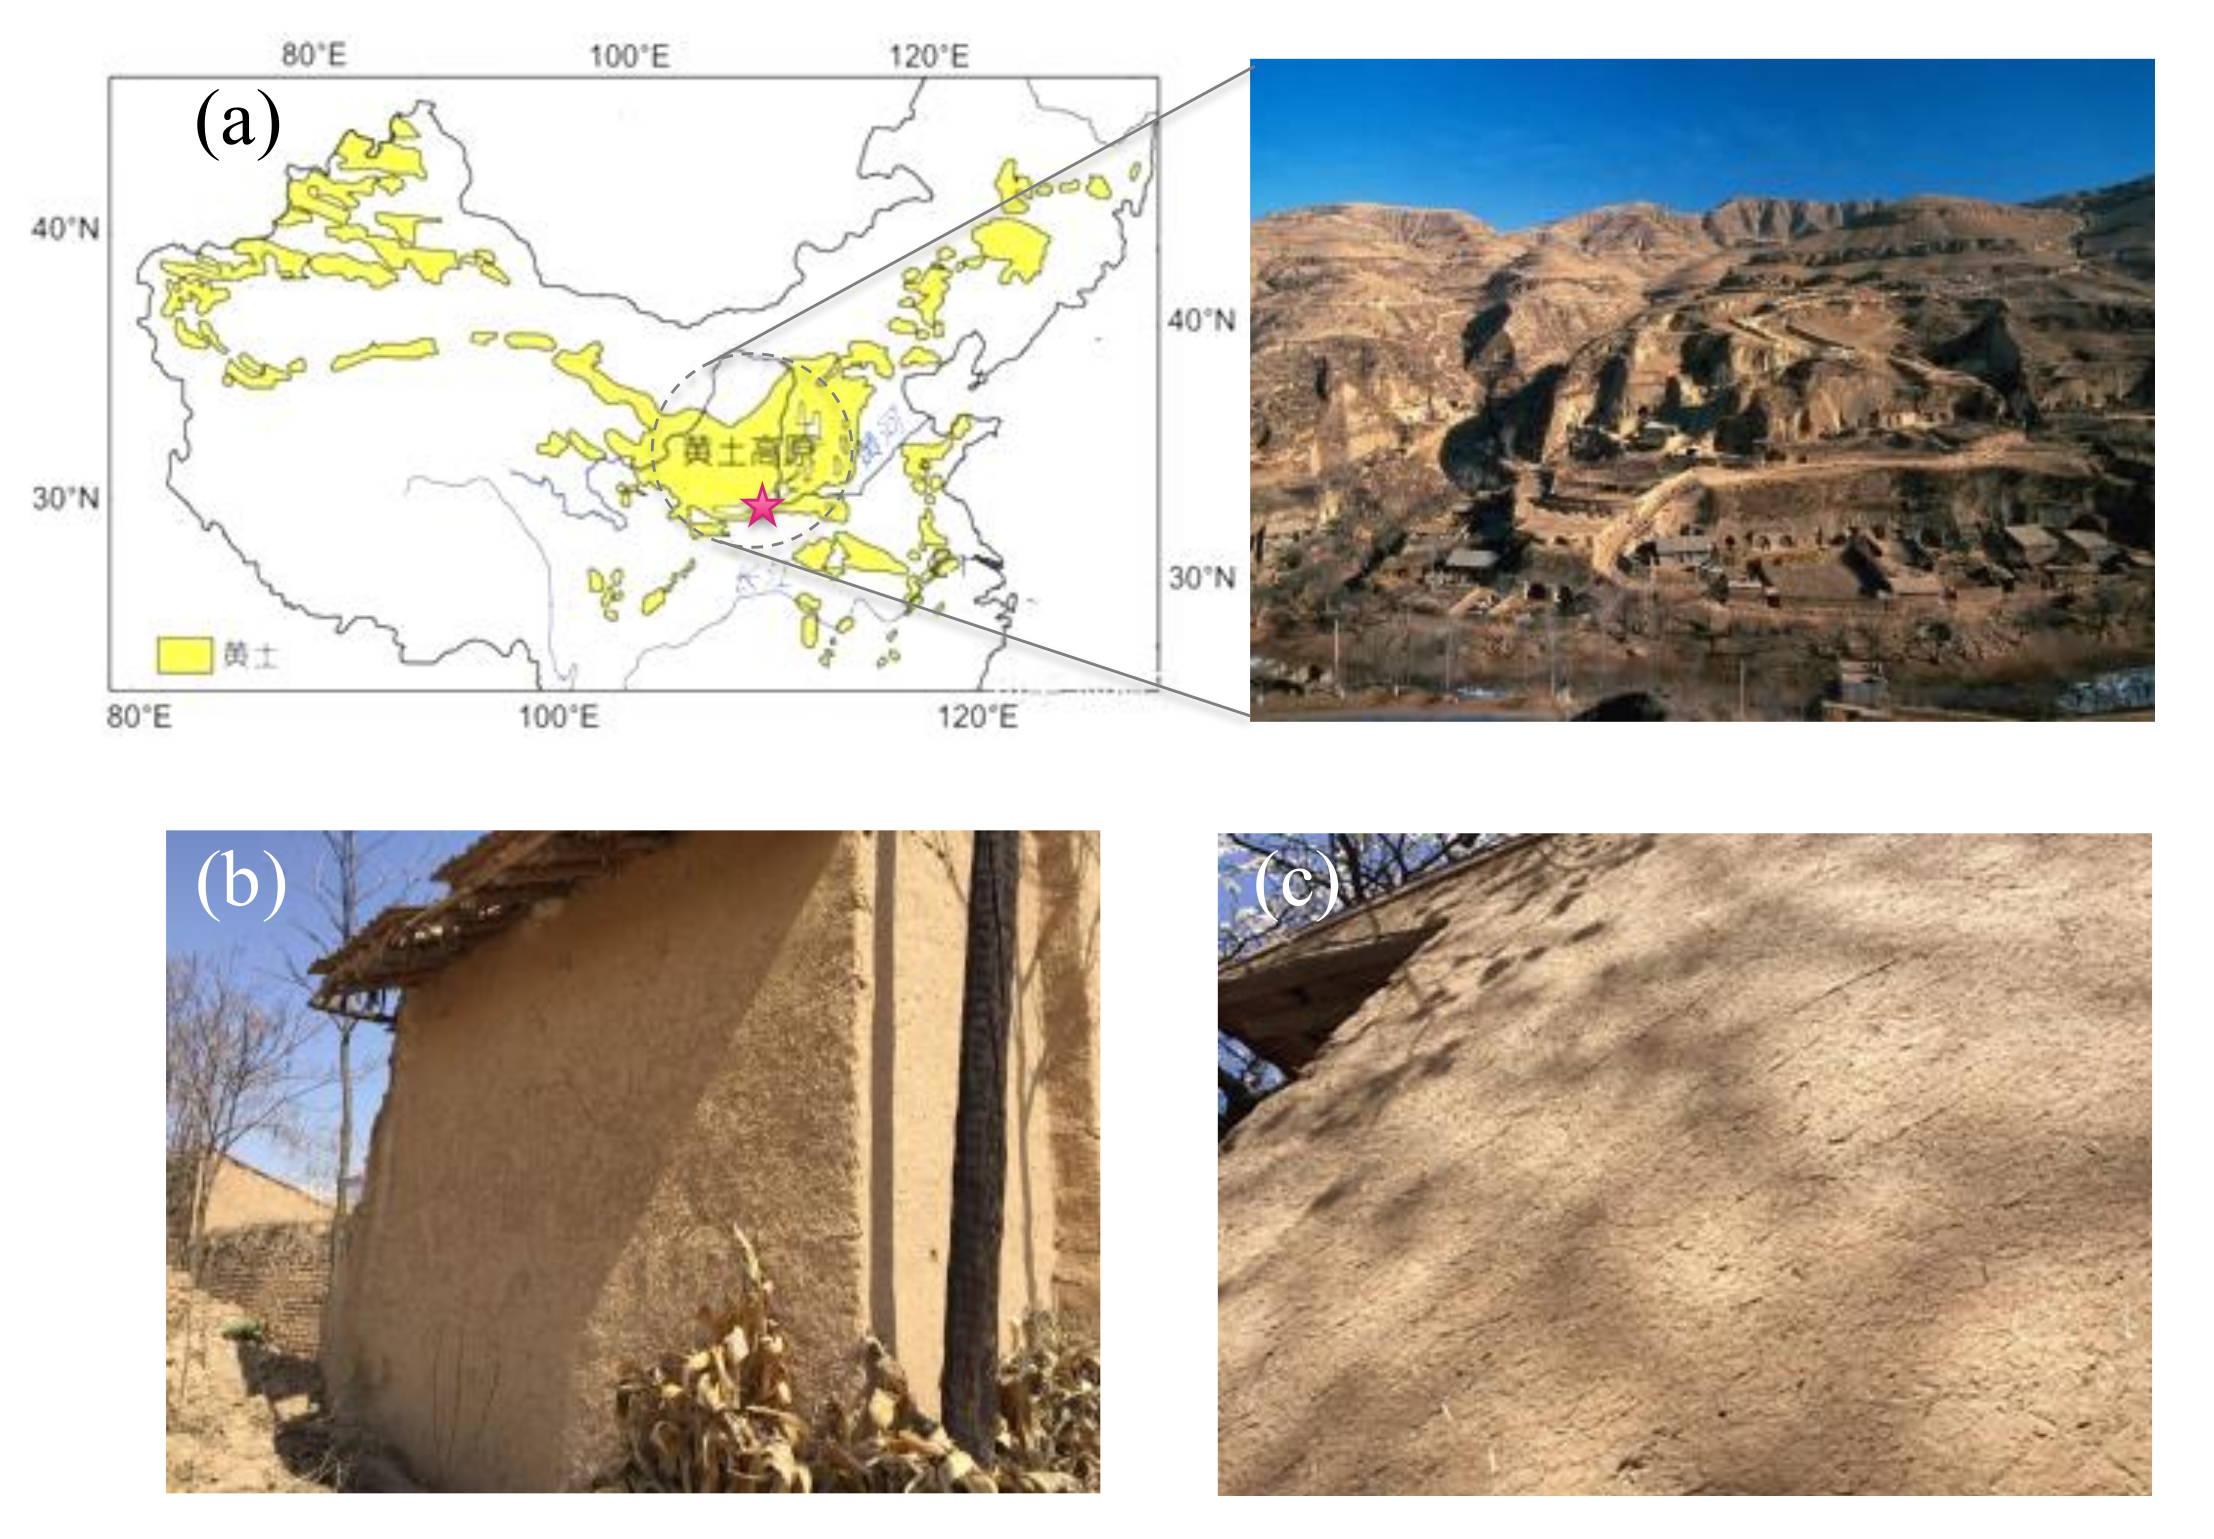
Loess soils are aeolian deposits containing primarily silt-sized soil particles. The wind-blown depositional process of loess formation, however, promotes development of a relatively loose soil structure prone to changes in hydro-mechanical load conditions [18]. The silt particles are thus easily eroded by seepage or wind. Tabarsa et al. (2018) [19] investigated the effectiveness of the loess stabilisation using nanoclay both in the laboratory and in the field at the Gonbad dam site, considering various fractions of nanoclay ranging from 0.2% to 3% by mass. The field test section with 2% nanoclay showed the highest erosion resistance, while the laboratory specimens exhibited the same general trends in behaviour. The cost for the use of nanoclay, however, may be an issue as it is subjected to a limited budget, which also indicates restricted applicability. More and more natural hazards were associated with the loess soil in northwest of China because of its metastable structure and wetting-induced collapse deformation [20,21,22,23,24,25]. Most natural hazards were initiated by soil erosion caused by expansion of agricultural activities resulting from rapid population growth in the region [26,27]. This widespread engineering problem led to various scales of catastrophic slope sliding including shallow and deep landslides [28,29]. Recently, plant roots were used for preventing soil erosion [30,31,32,33] and stabilising slopes [34,35,36]. A similar idea was also applied to residential houses built with straw bale containing post-harvest waste (termed PHW hereafter), such as wheat straw and corn cob, and loess soil on the Chinese Loess Plateau. Field investigations have shown that the residential houses were utilised over decades under the effect of freeze-thaw cycles (Figure 1) [37]. The phenomena motivate this study to investigate how the addition of PHW to the slightly cemented loess improves its shear strength properties. The direct shear (DS) method has been deemed to be a quick and economic manner for estimating soil shear strength. Previous studies on direct shear have shown that shear boxes of different size may not lead to similar shear stress-horizontal displacement curve, but shear strength [38,39,40]. In spite of the fact that recently the effects of straw and biochar amendments on chemical activities in the loess plateau of China have been studied [41,42], to the authors’ knowledge no studies have been performed to assess the significance of test size and PHW dosage to the shear strength of the slightly cemented loess soils. One study objective is to compare the shearing behaviour of the loess-PHW mixture specimens measured in large-scale and small-scale direct shear (LSDS and SSDS) tests with the loess specimens. The other objective is to determine the optimal dosage of PHW that matters most to the ability of the loess-PHW mixture to resist the seepage force and consequently stratum erosion.
2. Materials and Methods
2.1. Loess-Post-Harvest Waste (PHW) Mixture Specimens
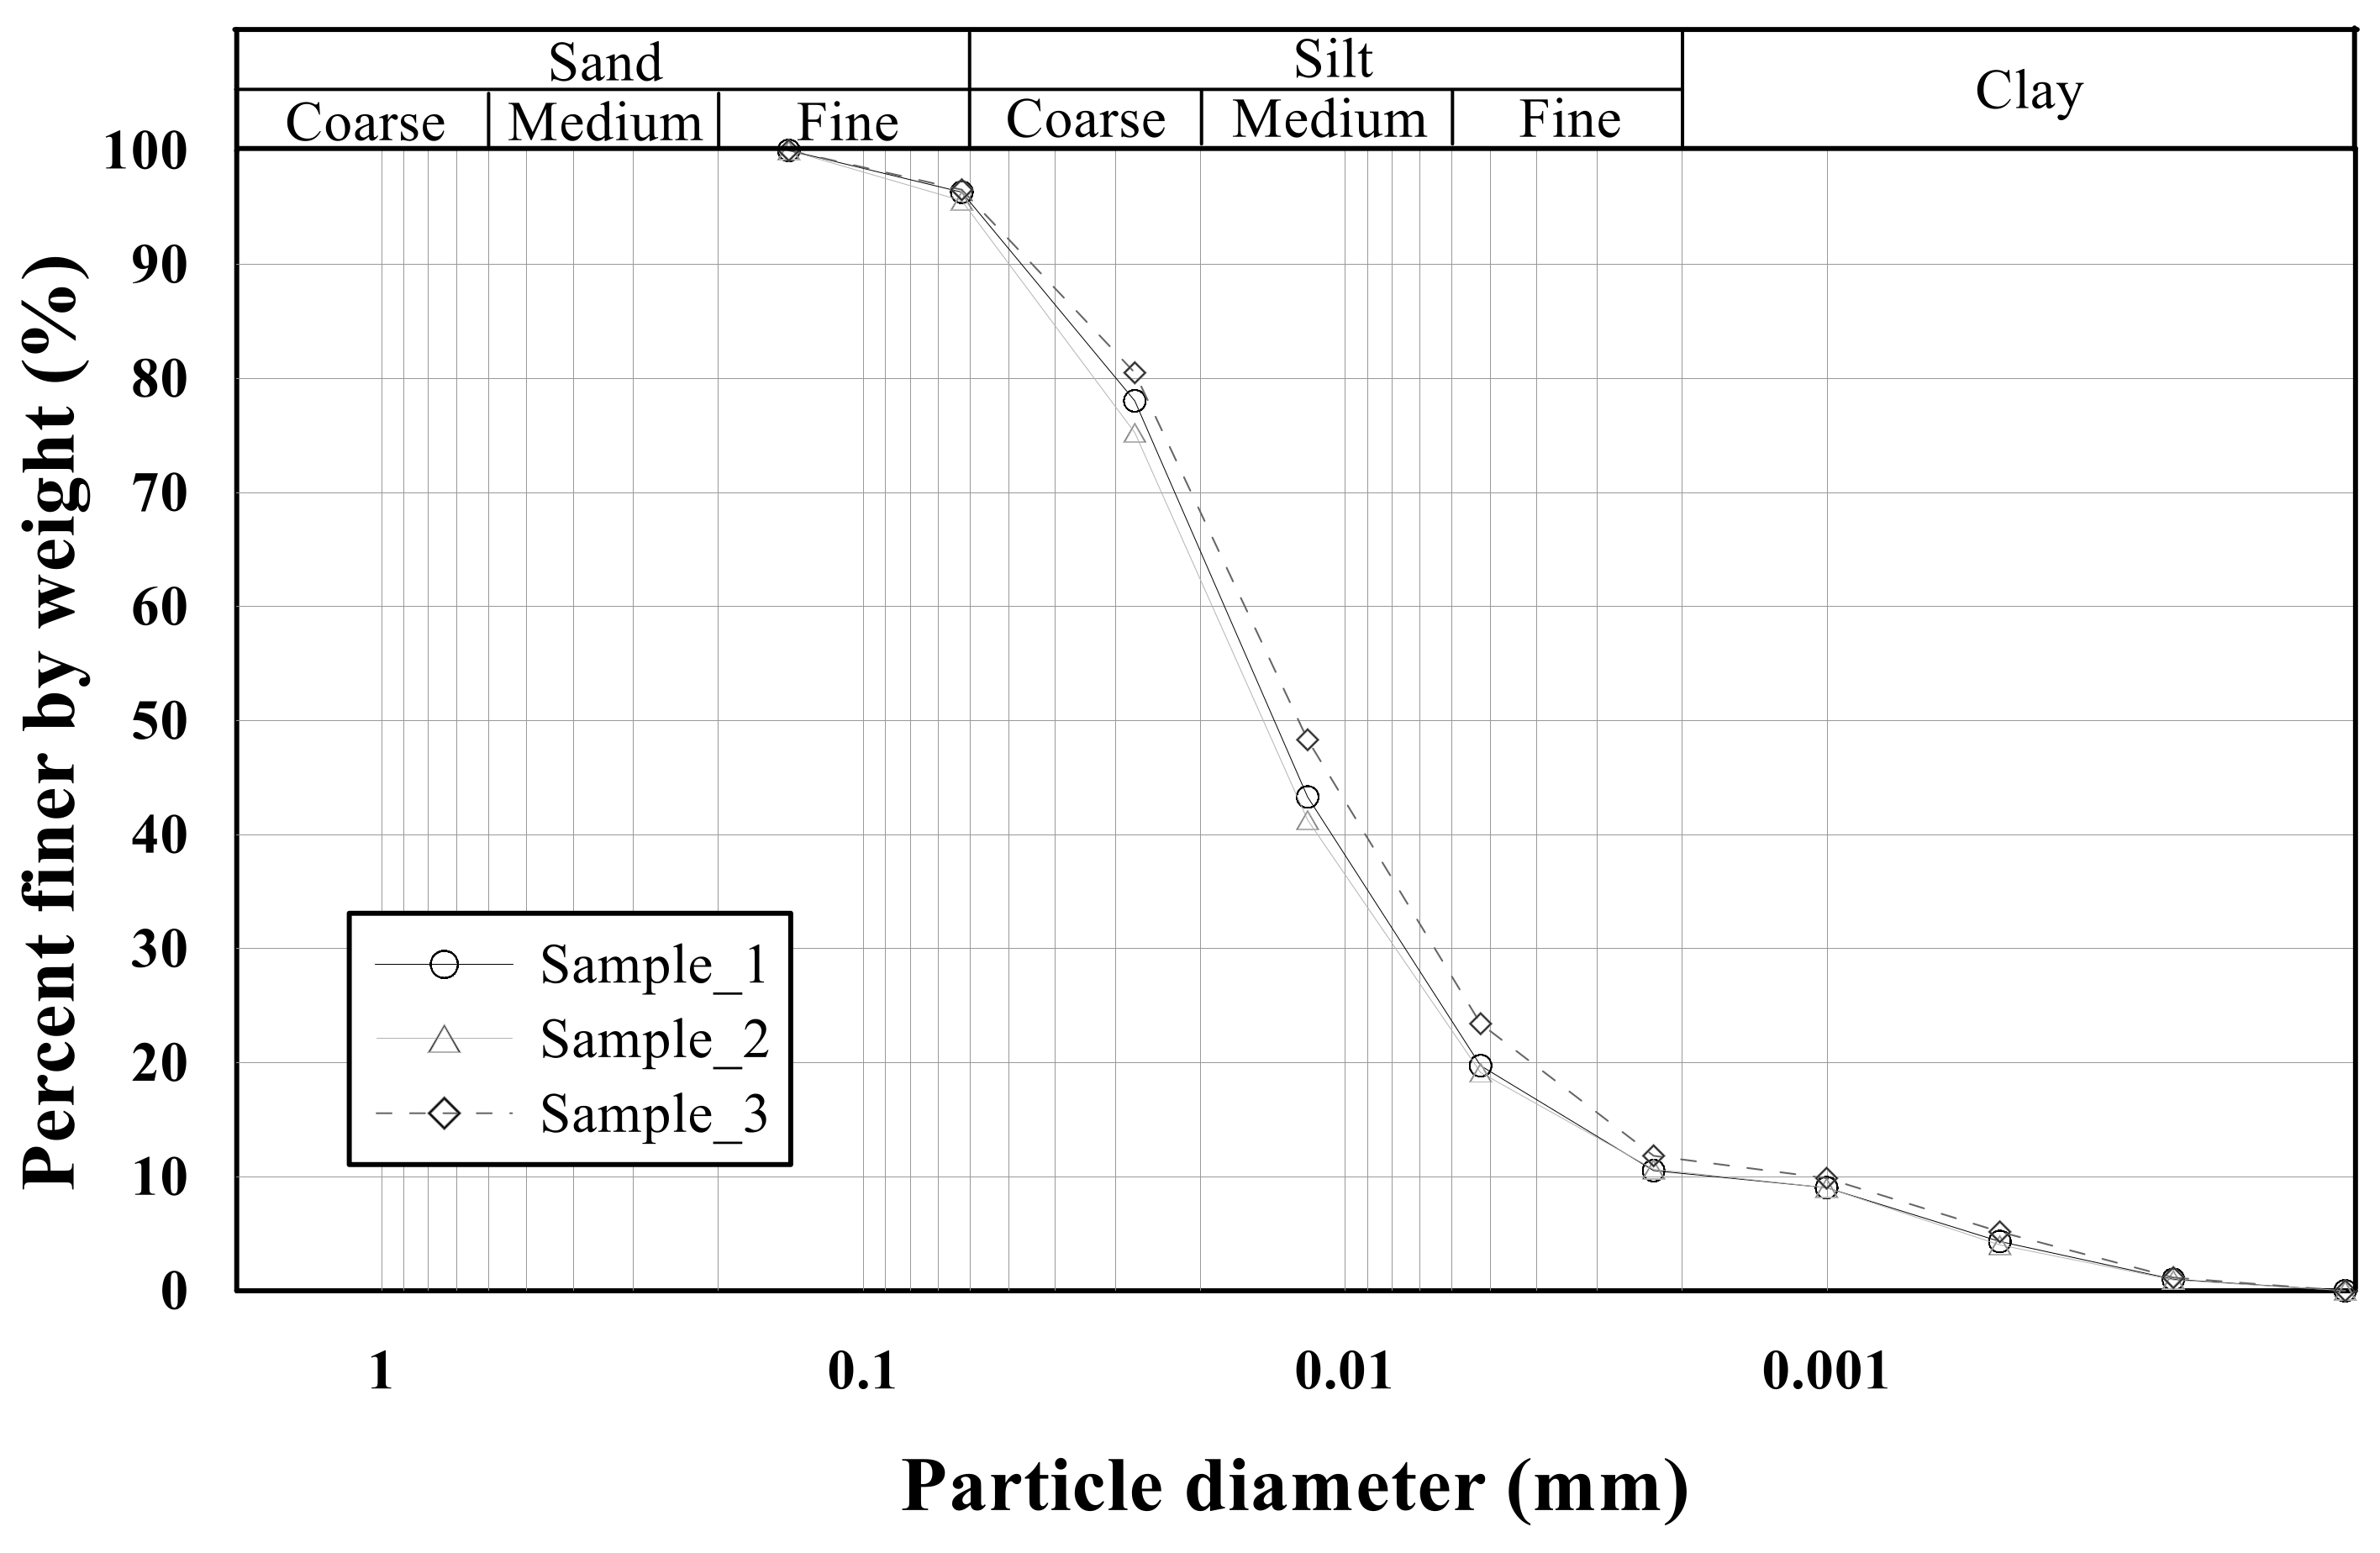
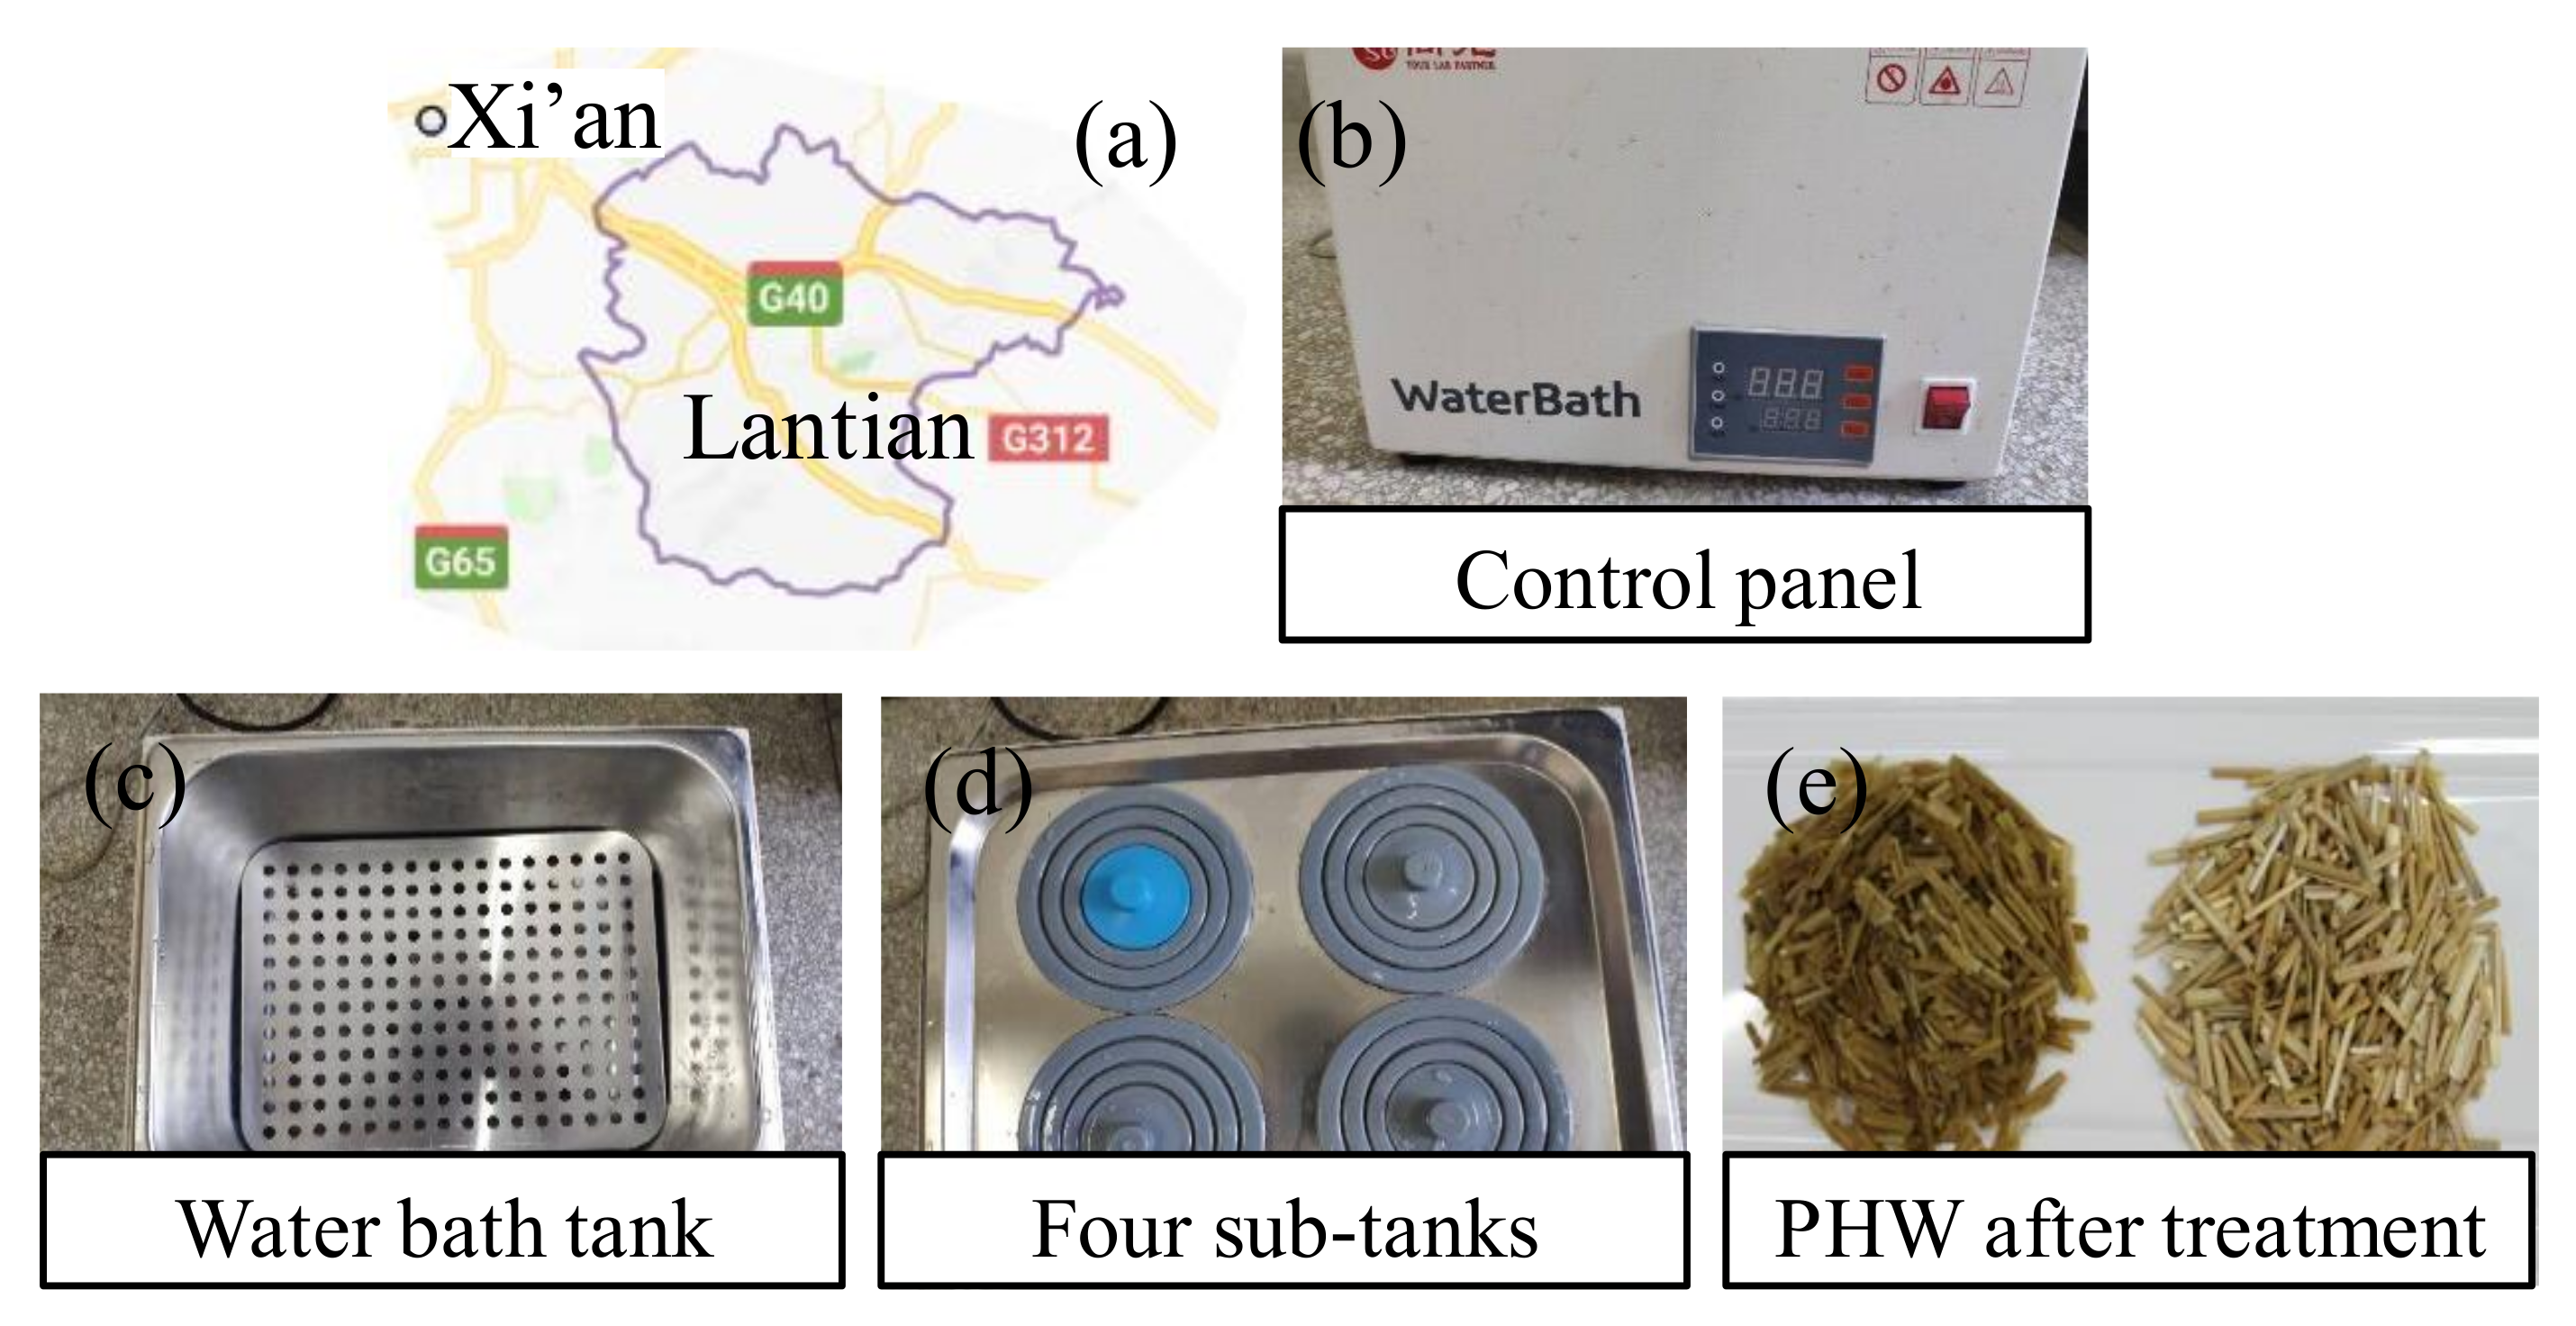
Approximately 1 m3 of loess soil material from one sampling spot, Lantian, located in the Chinese Loess Plateau was retrieved for specimen preparation. The retrieved material passing the No. 4 sieve (4.75-mm opening) was used ensuring that the ratio of box length to maximum particle size was at least 10 and that the ratio of box thickness to maximum particle size was at least 6 [43]. The dry unit weight γd of 13.72 kN/m3 from the Standard Proctor test result was used for controlling compaction of specimens. The physical properties are summarised in Table 1. The particle-size distribution curves are shown in Figure 2. The material classifies as low plasticity silt (ML). The grading characteristics vary greatly with the uniformity coefficient Cu ranging from 9.26 to 15.26 although the majority of the material shares a common USCS (Unified Soil Classification System) designation. There were three block samples prepared at the designed water contents ω, i.e., 14%, 18% and 22%, respectively. Subsequently each sample was blended with the PHW treated with hot water (Figure 3) [44] and placed in a sealed container. The %PHWs by weight, while preparing the loess-PHW specimens, were equal to 0.3, 0.45, 0.6 and 0.75 respectively in SSDS and LSDS.
2.2. Small-Scale Direct Shear Tests
We sheared 45 loess-PHW mixture specimens in the SSDS tests using a circular shear box of 61.8 mm in diameter and 20 mm in height. The SSDS tests were performed under normal pressures 100 kPa, 200 kPa and 300 kPa, respectively. The loess-PHW mixtures were compacted in the shear box in one single lift by tamping the top with a steel tamper. All the tests were conducted at a constant shearing rate of 0.8 mm/min to a maximum horizontal displacement (HD) of 7 mm. Measurements of HD and shear force were recorded by an industrial computer.
2.3. Large-Scale Direct Shear Tests
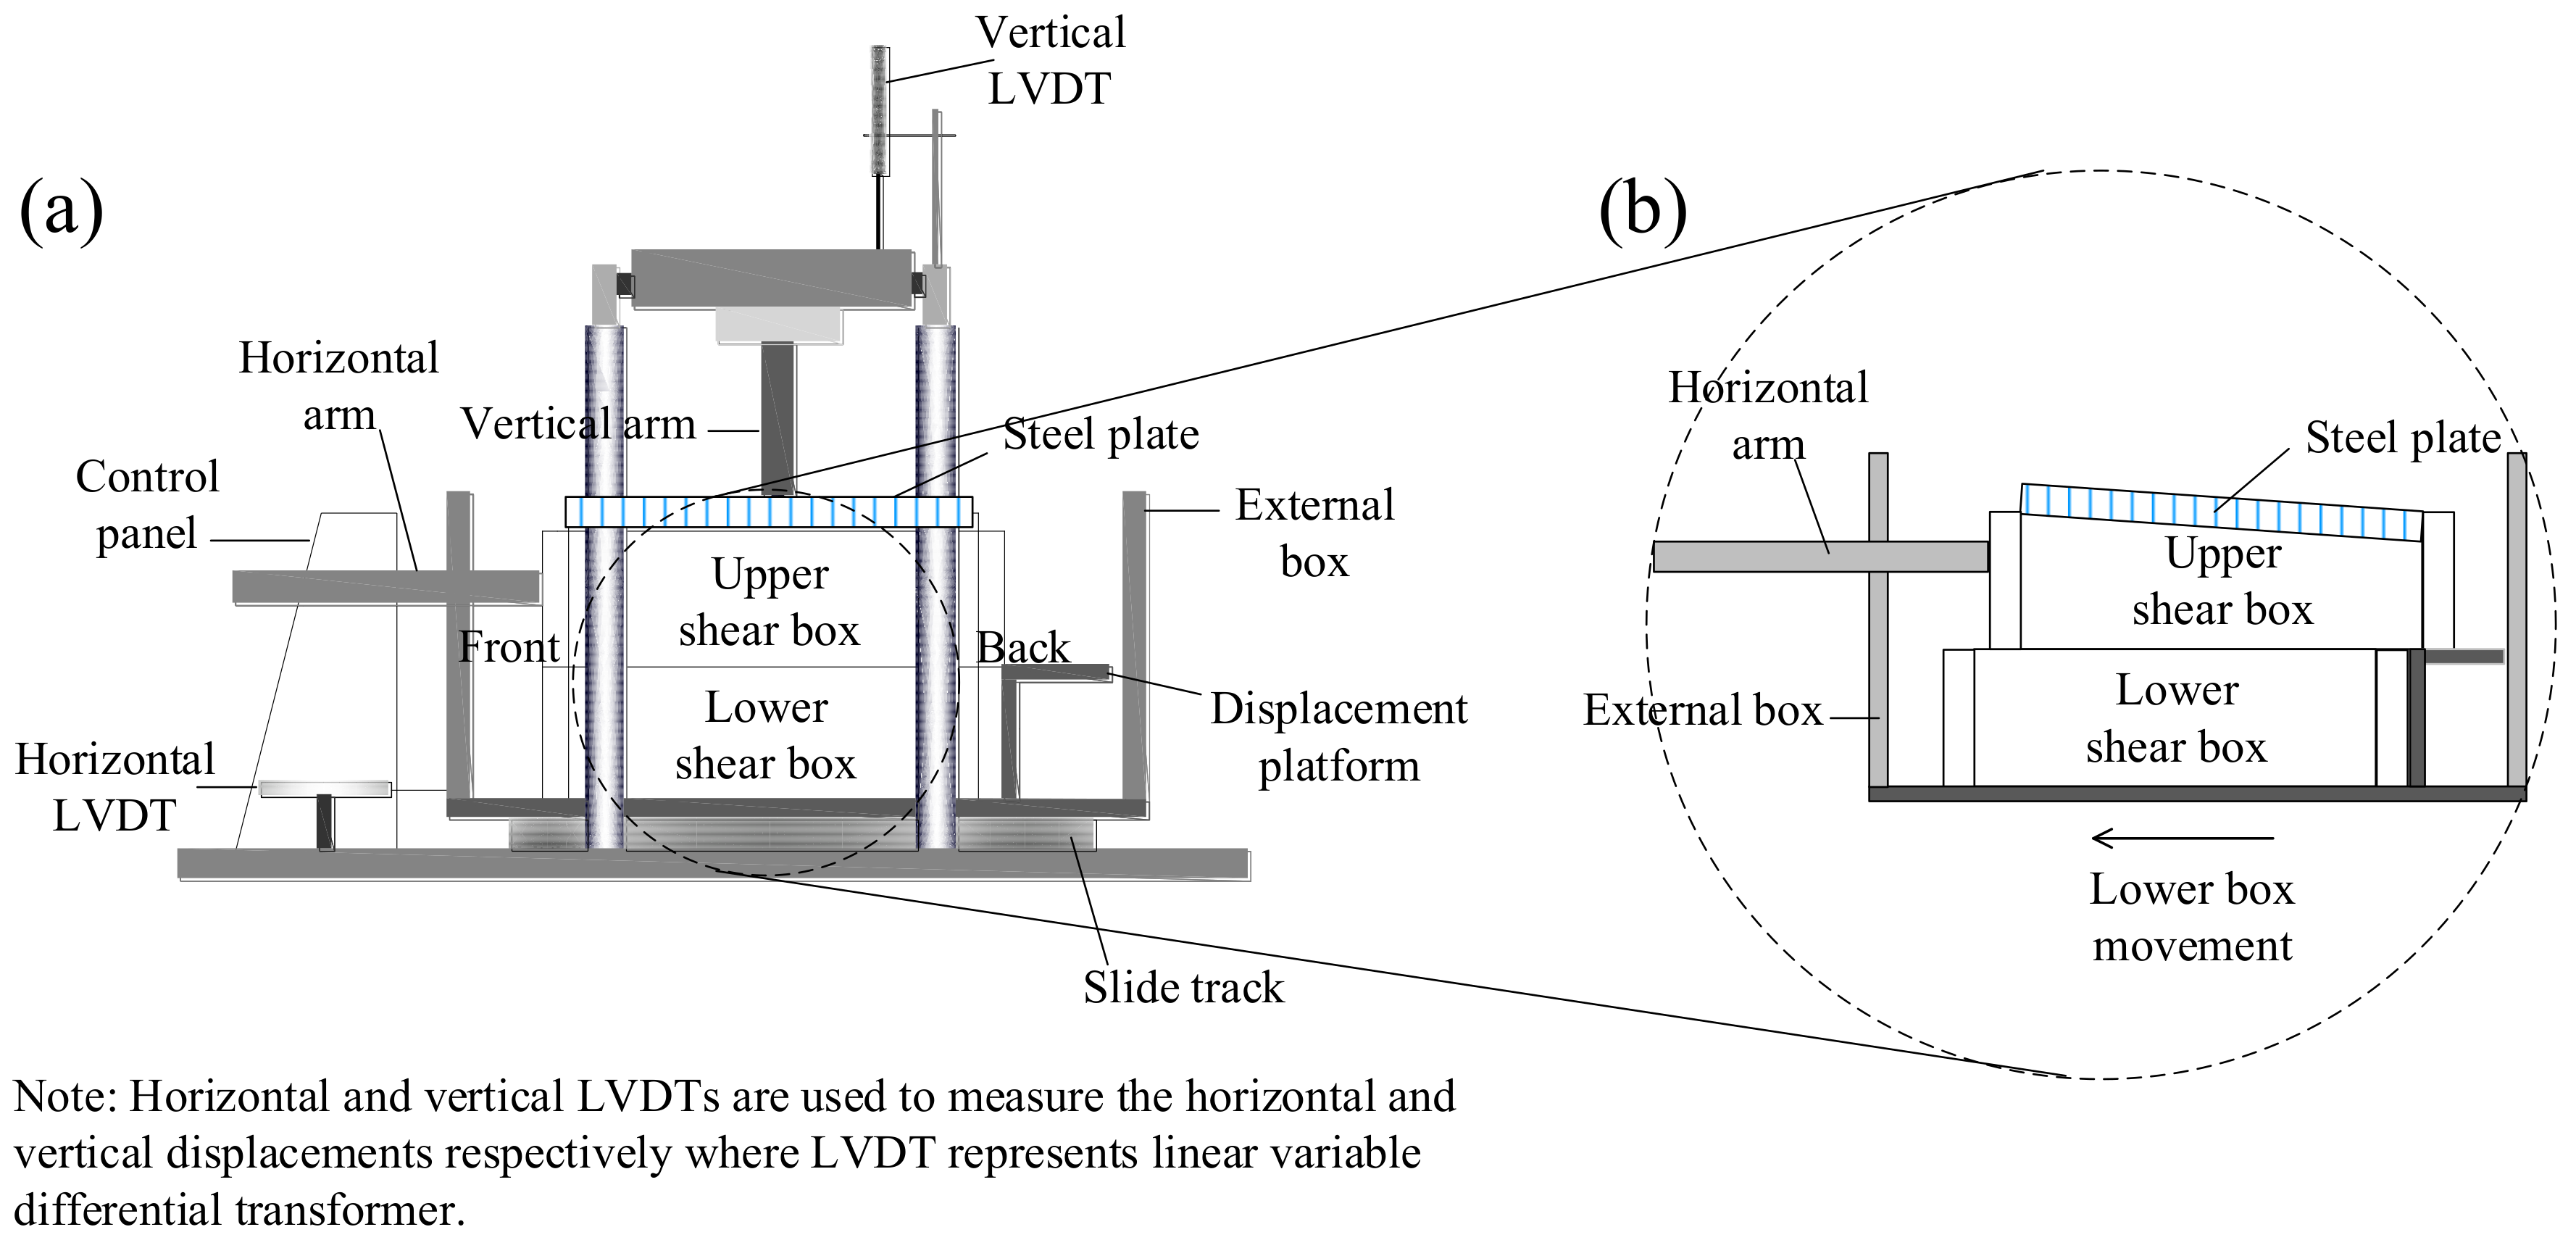
We sheared 27 loess-PHW mixture specimens in the LSDS tests using a square shear box (Figure 4). The shear box of 300 mm in width contains a 100-mm thick specimen. The loess-PHW mixtures were compacted following the same procedure as described for SSDS. Each mixture was sheared under normal pressures of 100 kPa, 200 kPa and 300 kPa, respectively. The applied normal pressures were manipulated by introducing a feedback-controlled pressure regulator. The prepared specimens were sheared at a rate of 0.8 mm/min to a maximum HD of 50 mm. Since the lower half of the shear box was bolted to the external box, a stepper motor that displaces the external box was used to control the HD. Measurements were also recorded for all the LSDS tests.
2.4. Repeatability of Direct Shear Methods
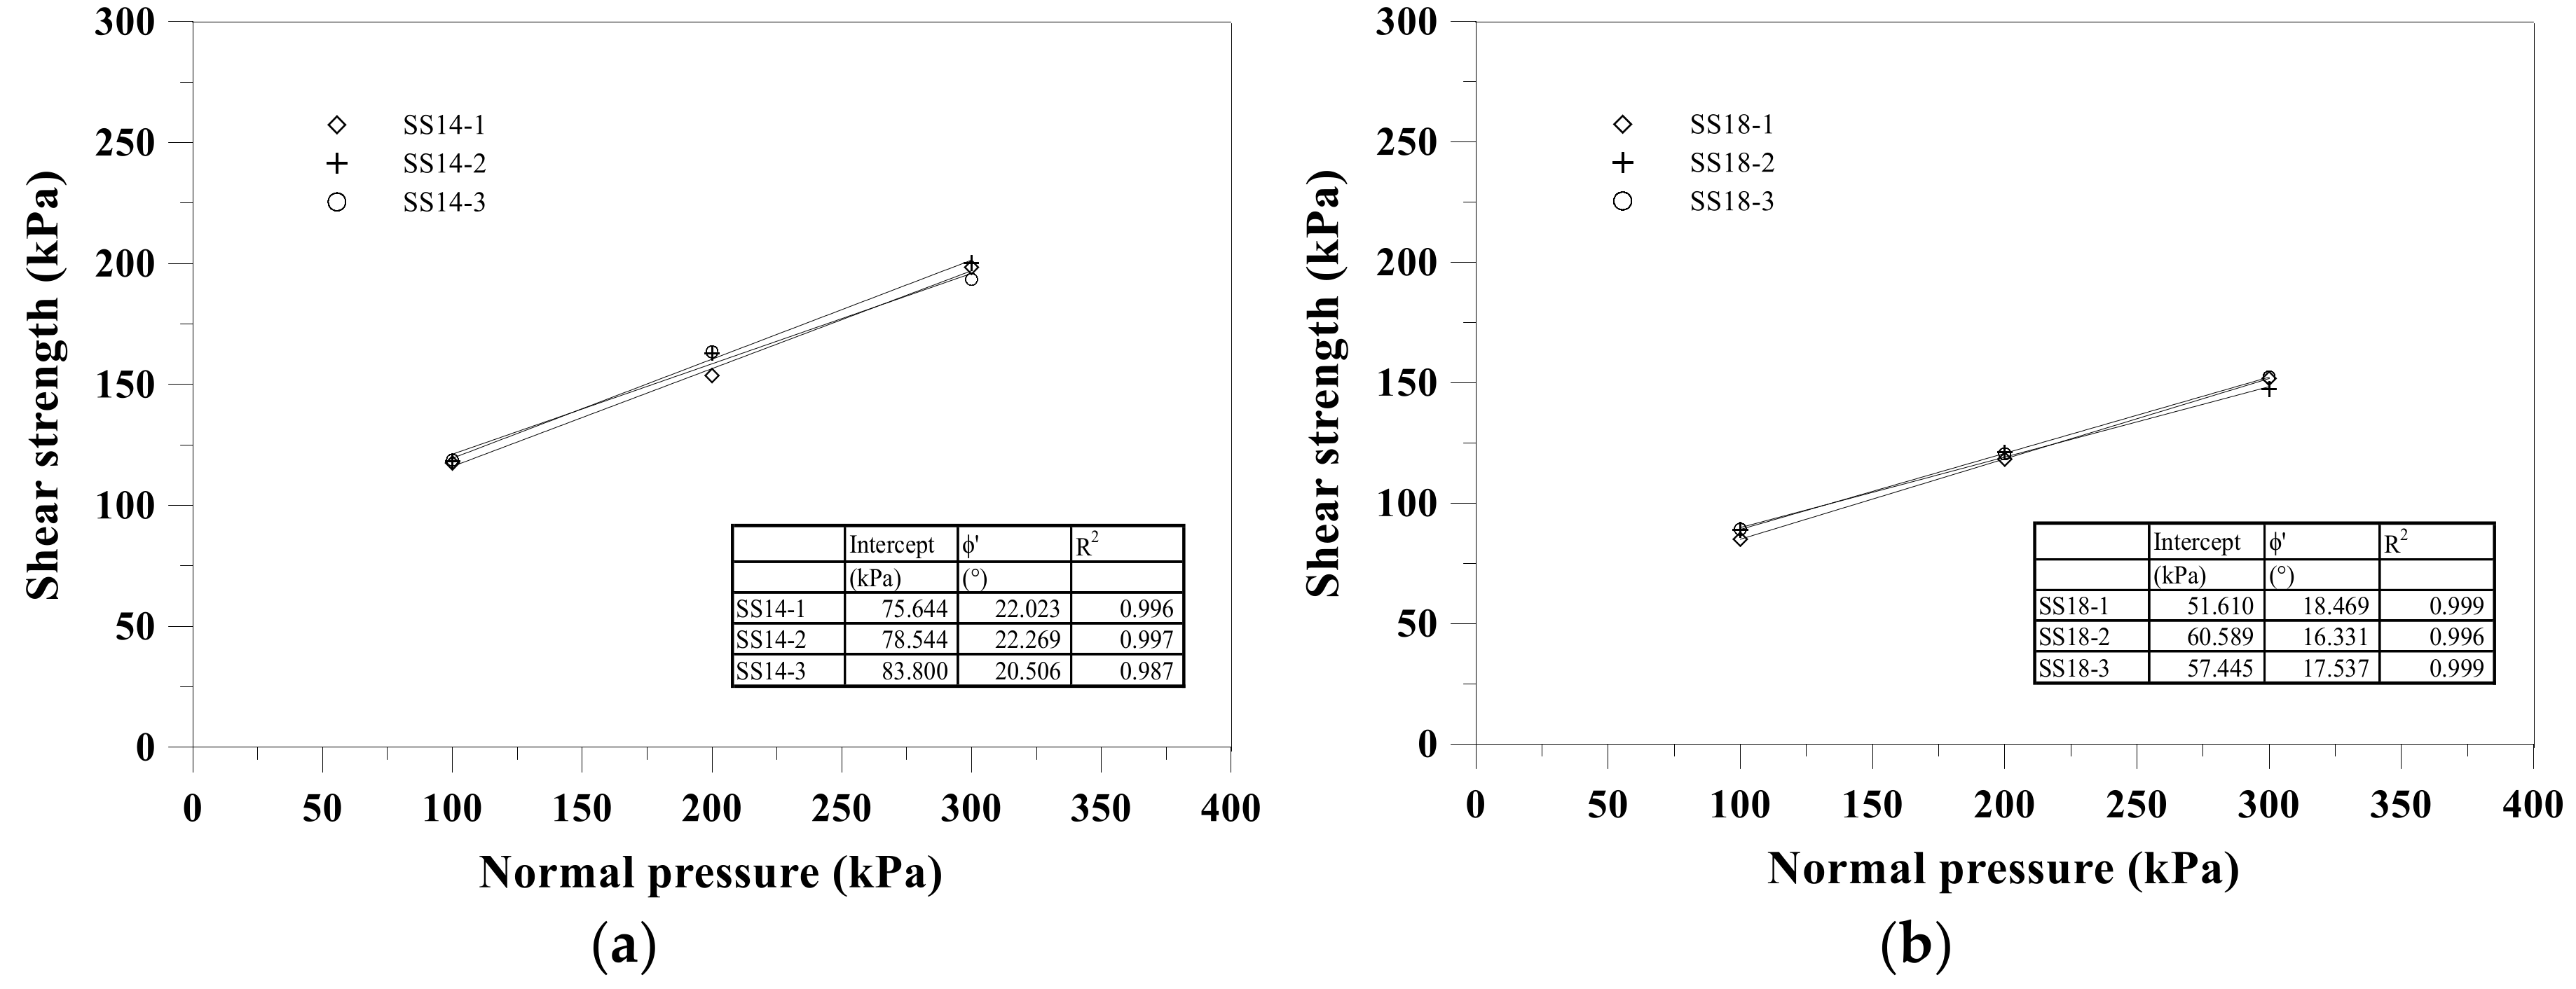
Test repeatability has been deemed as the key to verify the effectiveness of the testing method adopted. Repeatability of the direct shear test was verified by performing six replicate tests. The six replicate tests on loess with %PHW equal to 0 were performed using the SSDS apparatus. The failure envelopes shown in Figure 5 from the replicate tests are similar. Shear strength parameters and coefficients of determination are summarised in Table 2. The ϕ’ value varies from 16.3° to 22.3°, with an average of 19.5° and a standard deviation of 2.2°. The c value varies from 51.61 to 83.80 kPa, with an average of 67.94 kPa and a standard deviation of 11.93.
3. Results and Discussion
3.1. Definition of Failure
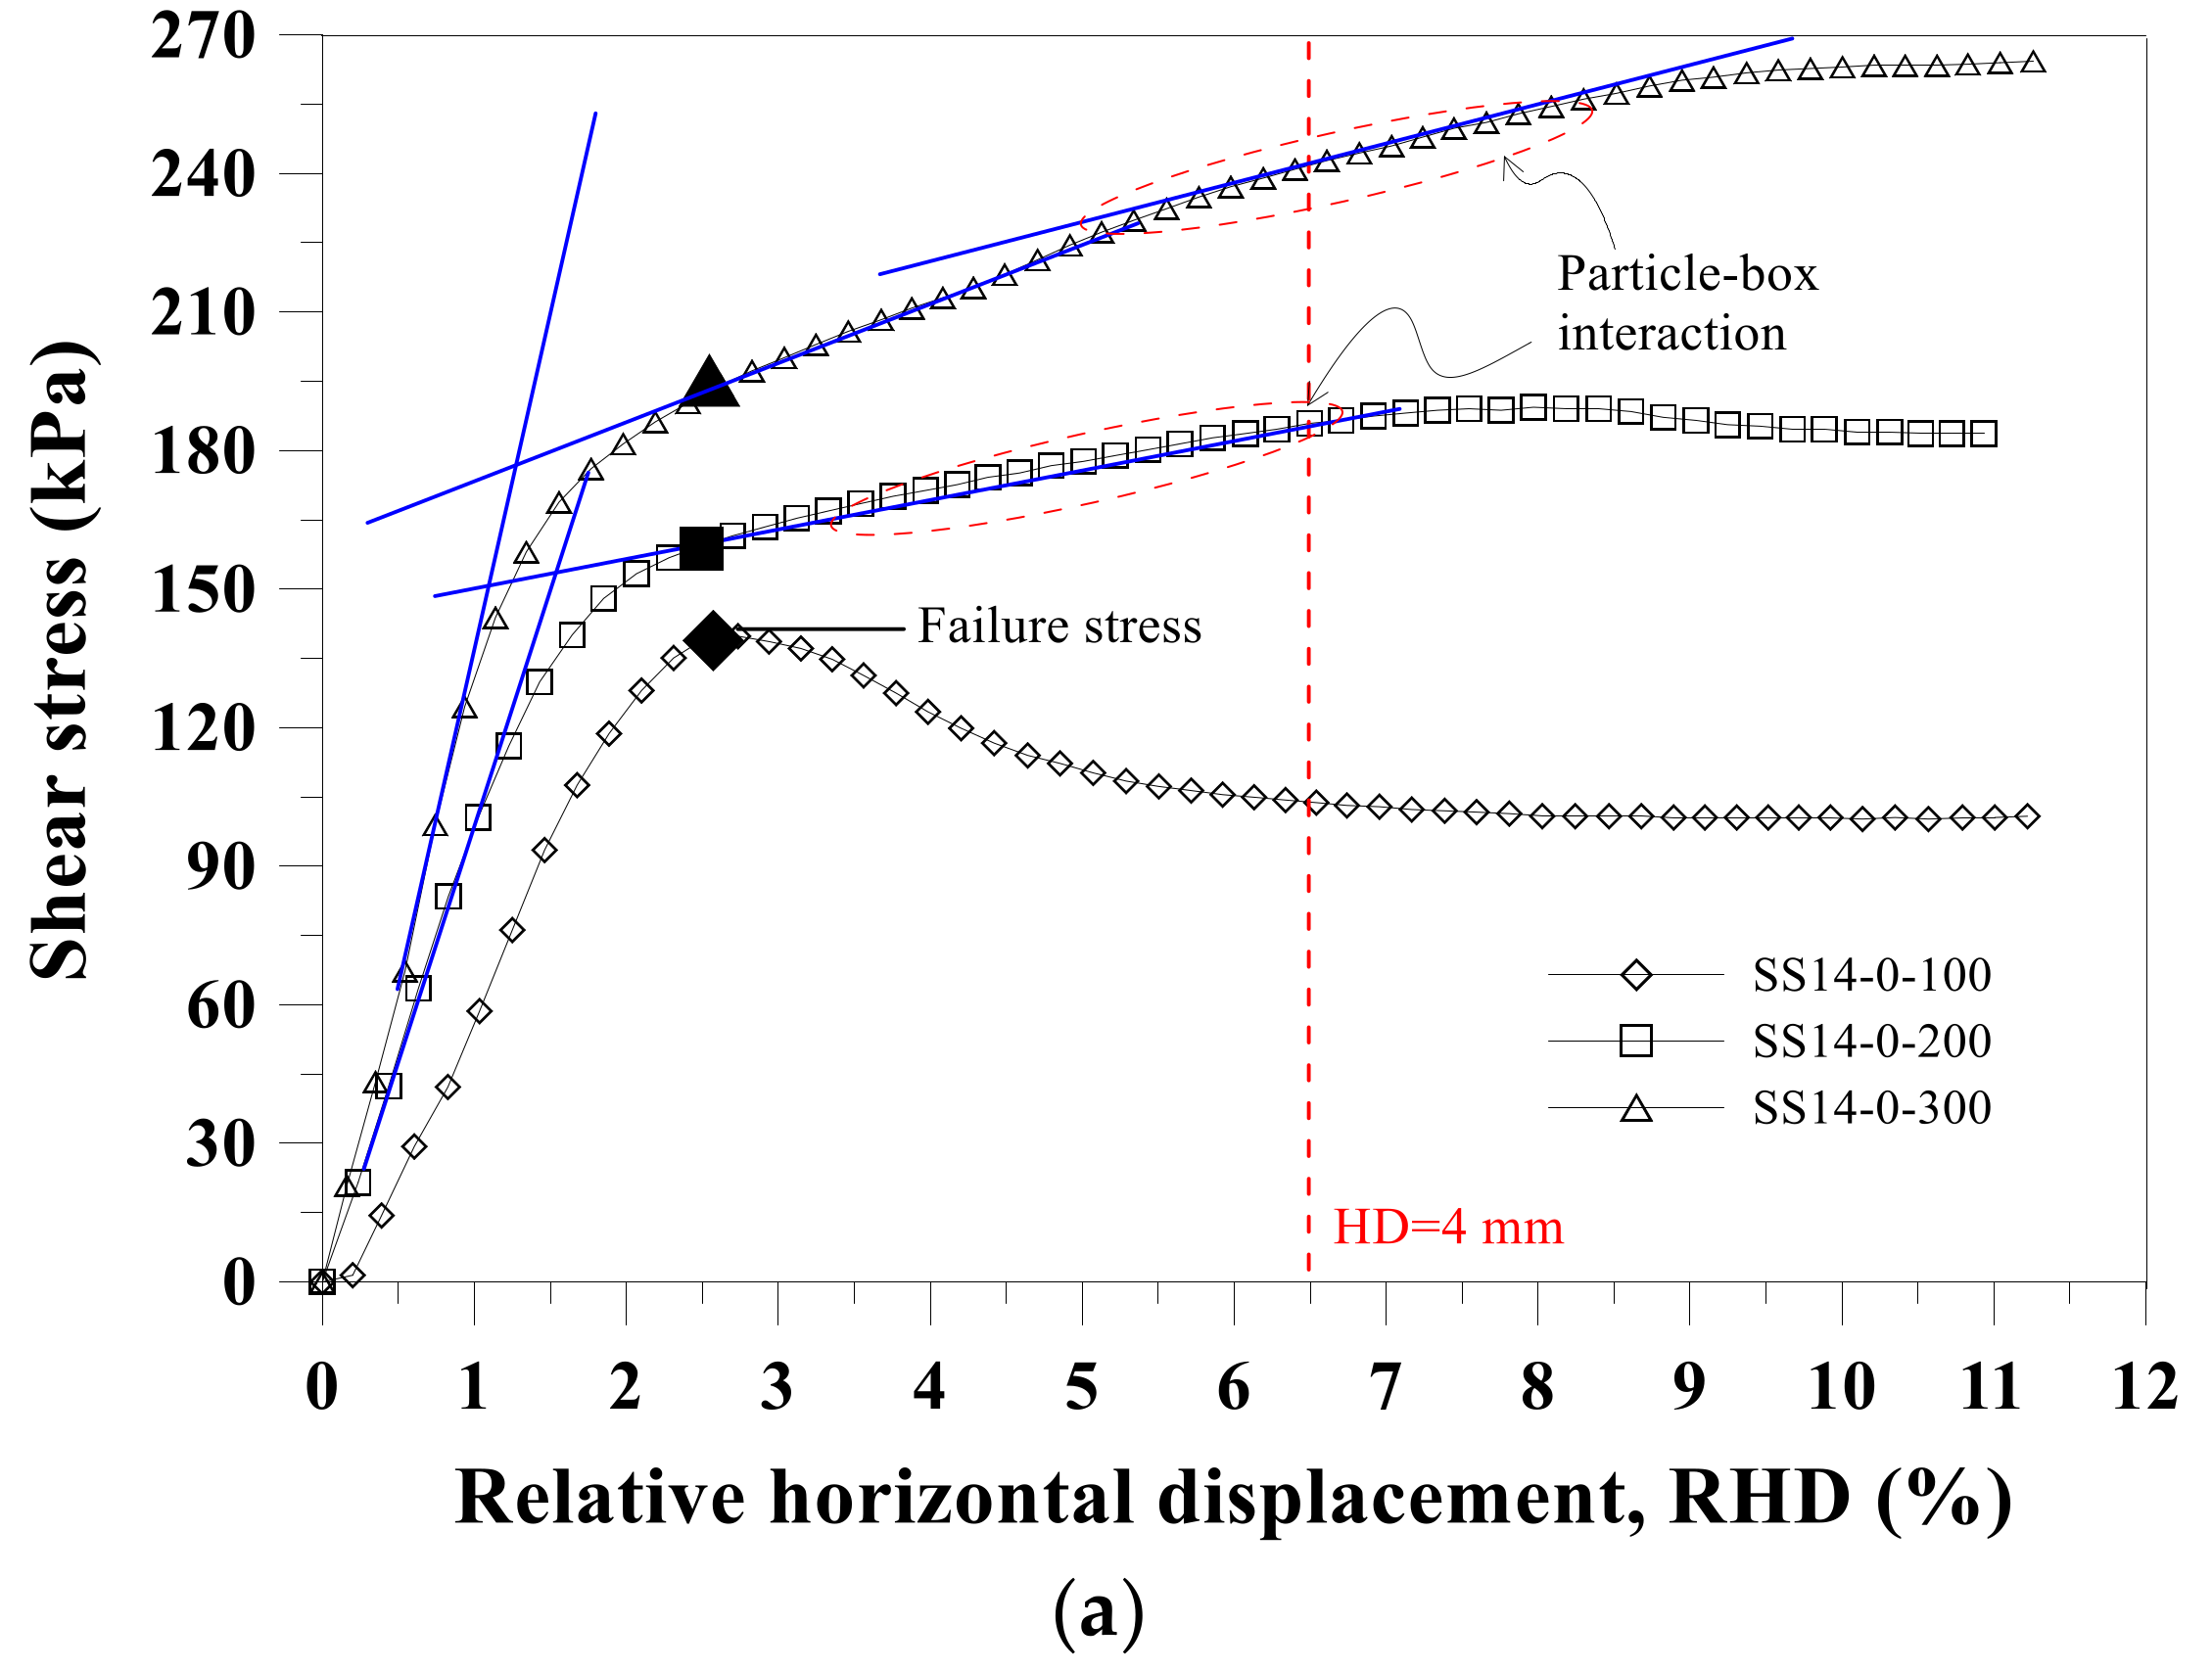
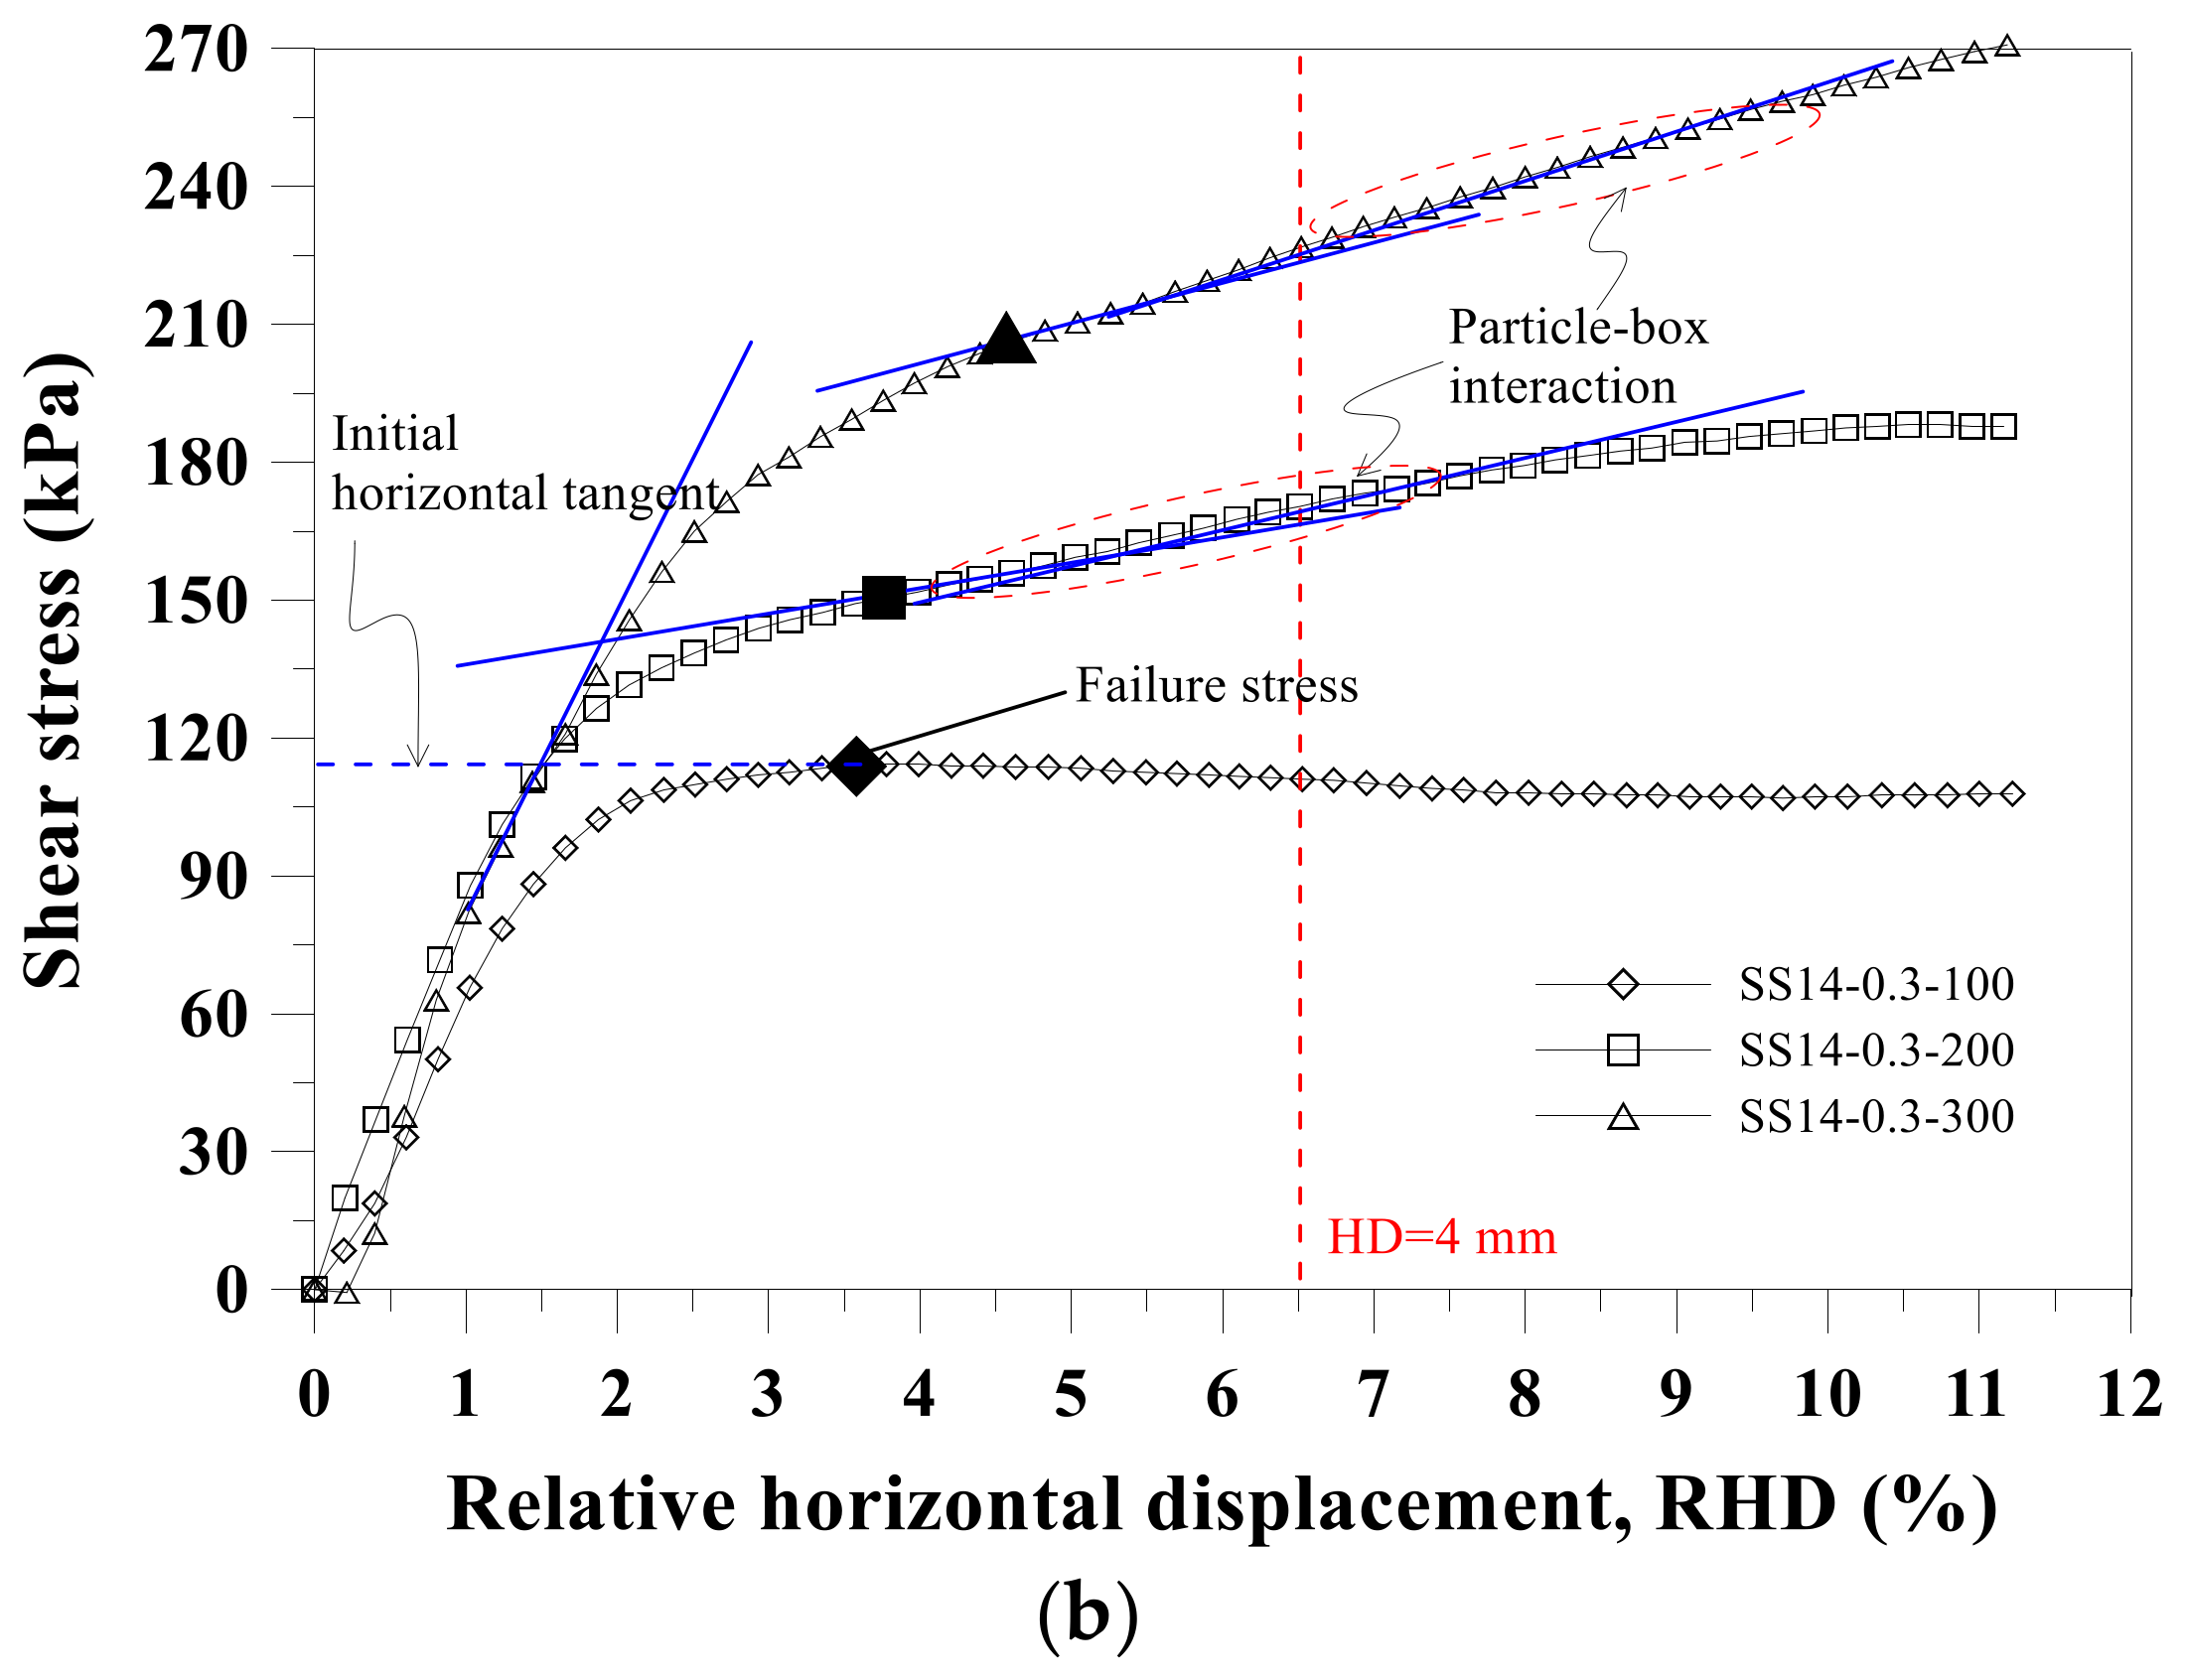
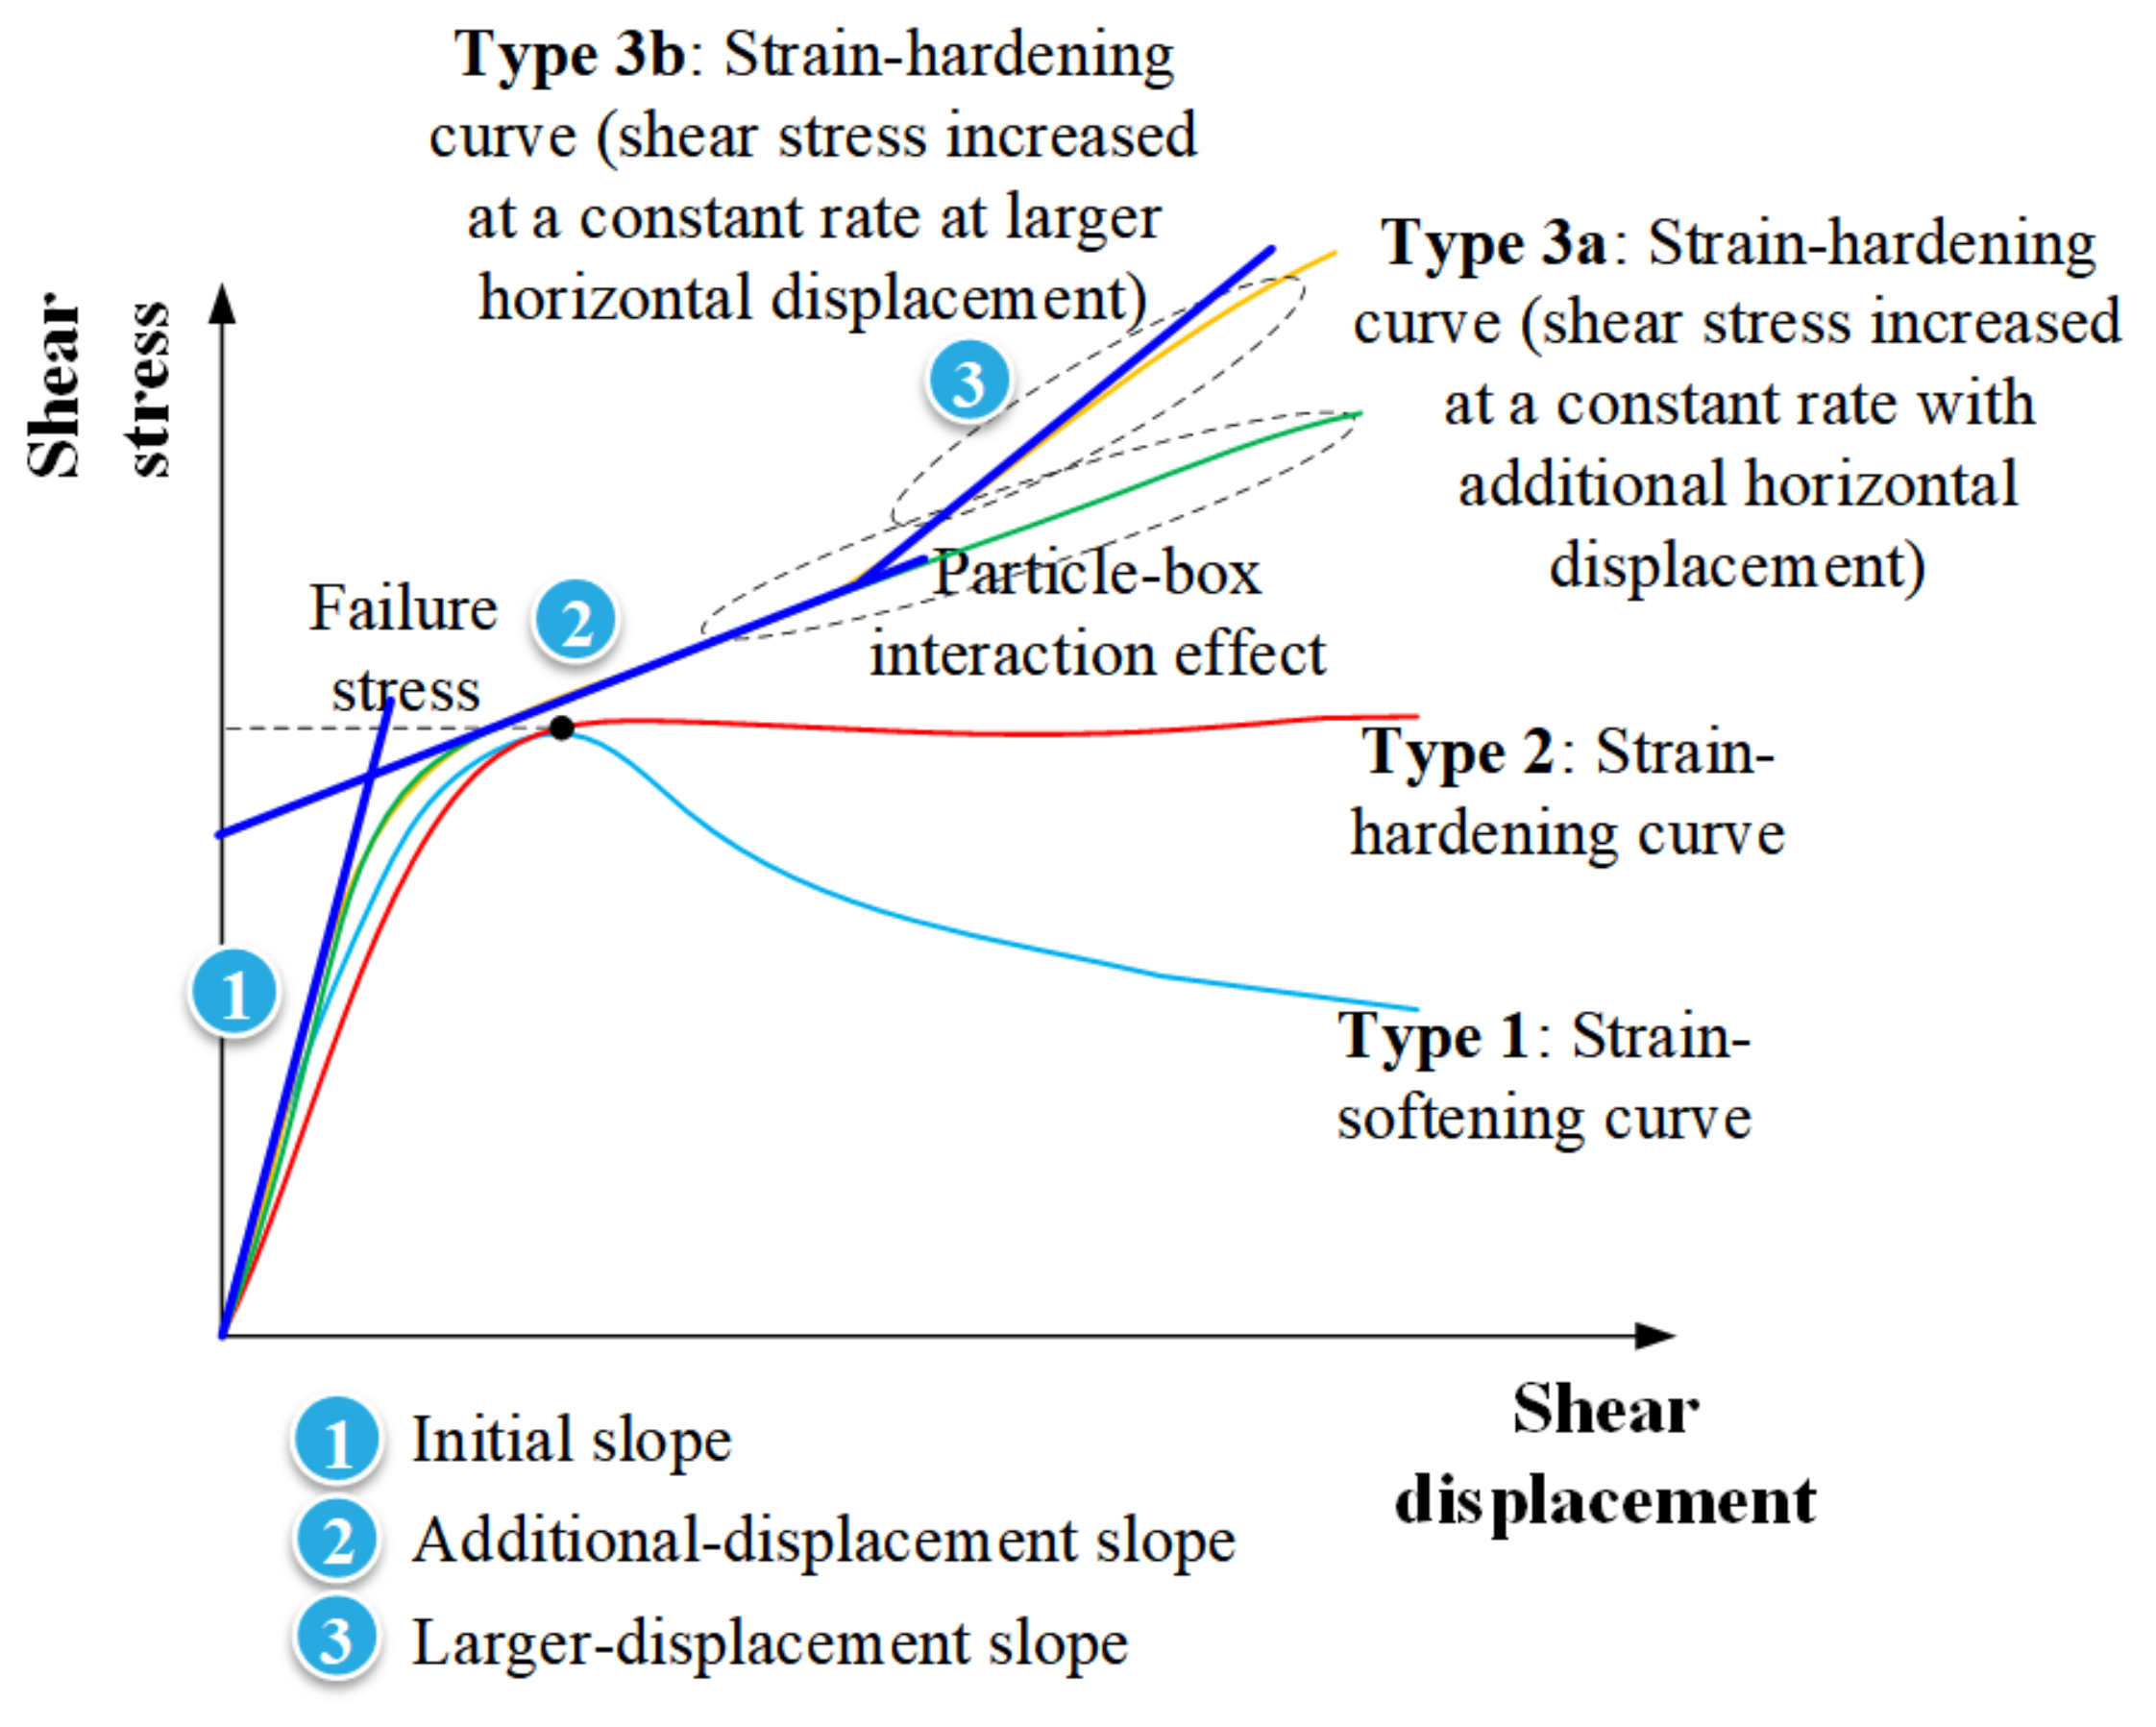
Due to limited space, only some of the SSDS and LSDS results are presented. The HD in DS tests was normalized to specimen diameter, termed the relative horizontal displacement (RHD) hereafter, for the sake of easy comparison. Figure 6 shows the relationships between the shear stress and the RHD for the SSDS tests, while Figure 7 shows the relationships between the shear stress and the RHD for the LSDS tests. Generally, the shear stress versus the RHD relationships for the SSDS tests can be categorised into strain-softening curve (Type 1) and strain-hardening curve (Types 2 and 3) (Figure 8). Shear stress increasing to a peak value and then gradually decreasing with increasing horizontal displacement was categorised into Type 1 (Figure 6a). In the case shear stress increasing to an ultimate value and then remaining essentially constant with increasing horizontal displacement was categorised into Type 2 (Figure 6b). Type 3 comprised two sub-types. Type 3a can be described as shear stress increasing to the curve inflection point where some factor starts to have influence on the shearing behaviour and then gradually increasing at a constant rate with additional horizontal displacement. Type 3b was similar to Type 3a, but followed by a gradual increase in shear stress at another constant rate with larger horizontal displacement. The gradual increases in shear stress observed in Type 3 were most likely attributed to the effect of particle-box interaction, as discussed subsequently. It is evident that Type 1, Type 2 and Type 3a were characterised by two distinguished curve slopes, initial slope and additional-displacement slope and that Type 3b was characterised by three distinguished slopes; that are, initial slope, additional-displacement slope and larger-displacement slope. In Type 3a and Type 3b for which no distinct peak stress was available, a suggested criterion of 4 mm HD (i.e., 6.5% RHD) [44] to determine the failure stress still had some distance from the onset of the tangent line, which also indicated an inappropriate criterion for determining the failure stress. Thus, the failure stress for Type 1 and Type 2 was defined using the peak stress and the horizontal tangent line, respectively, and from the onset of the tangent line, resulting from the additional-displacement slope, for Type 3a and Type 3b.
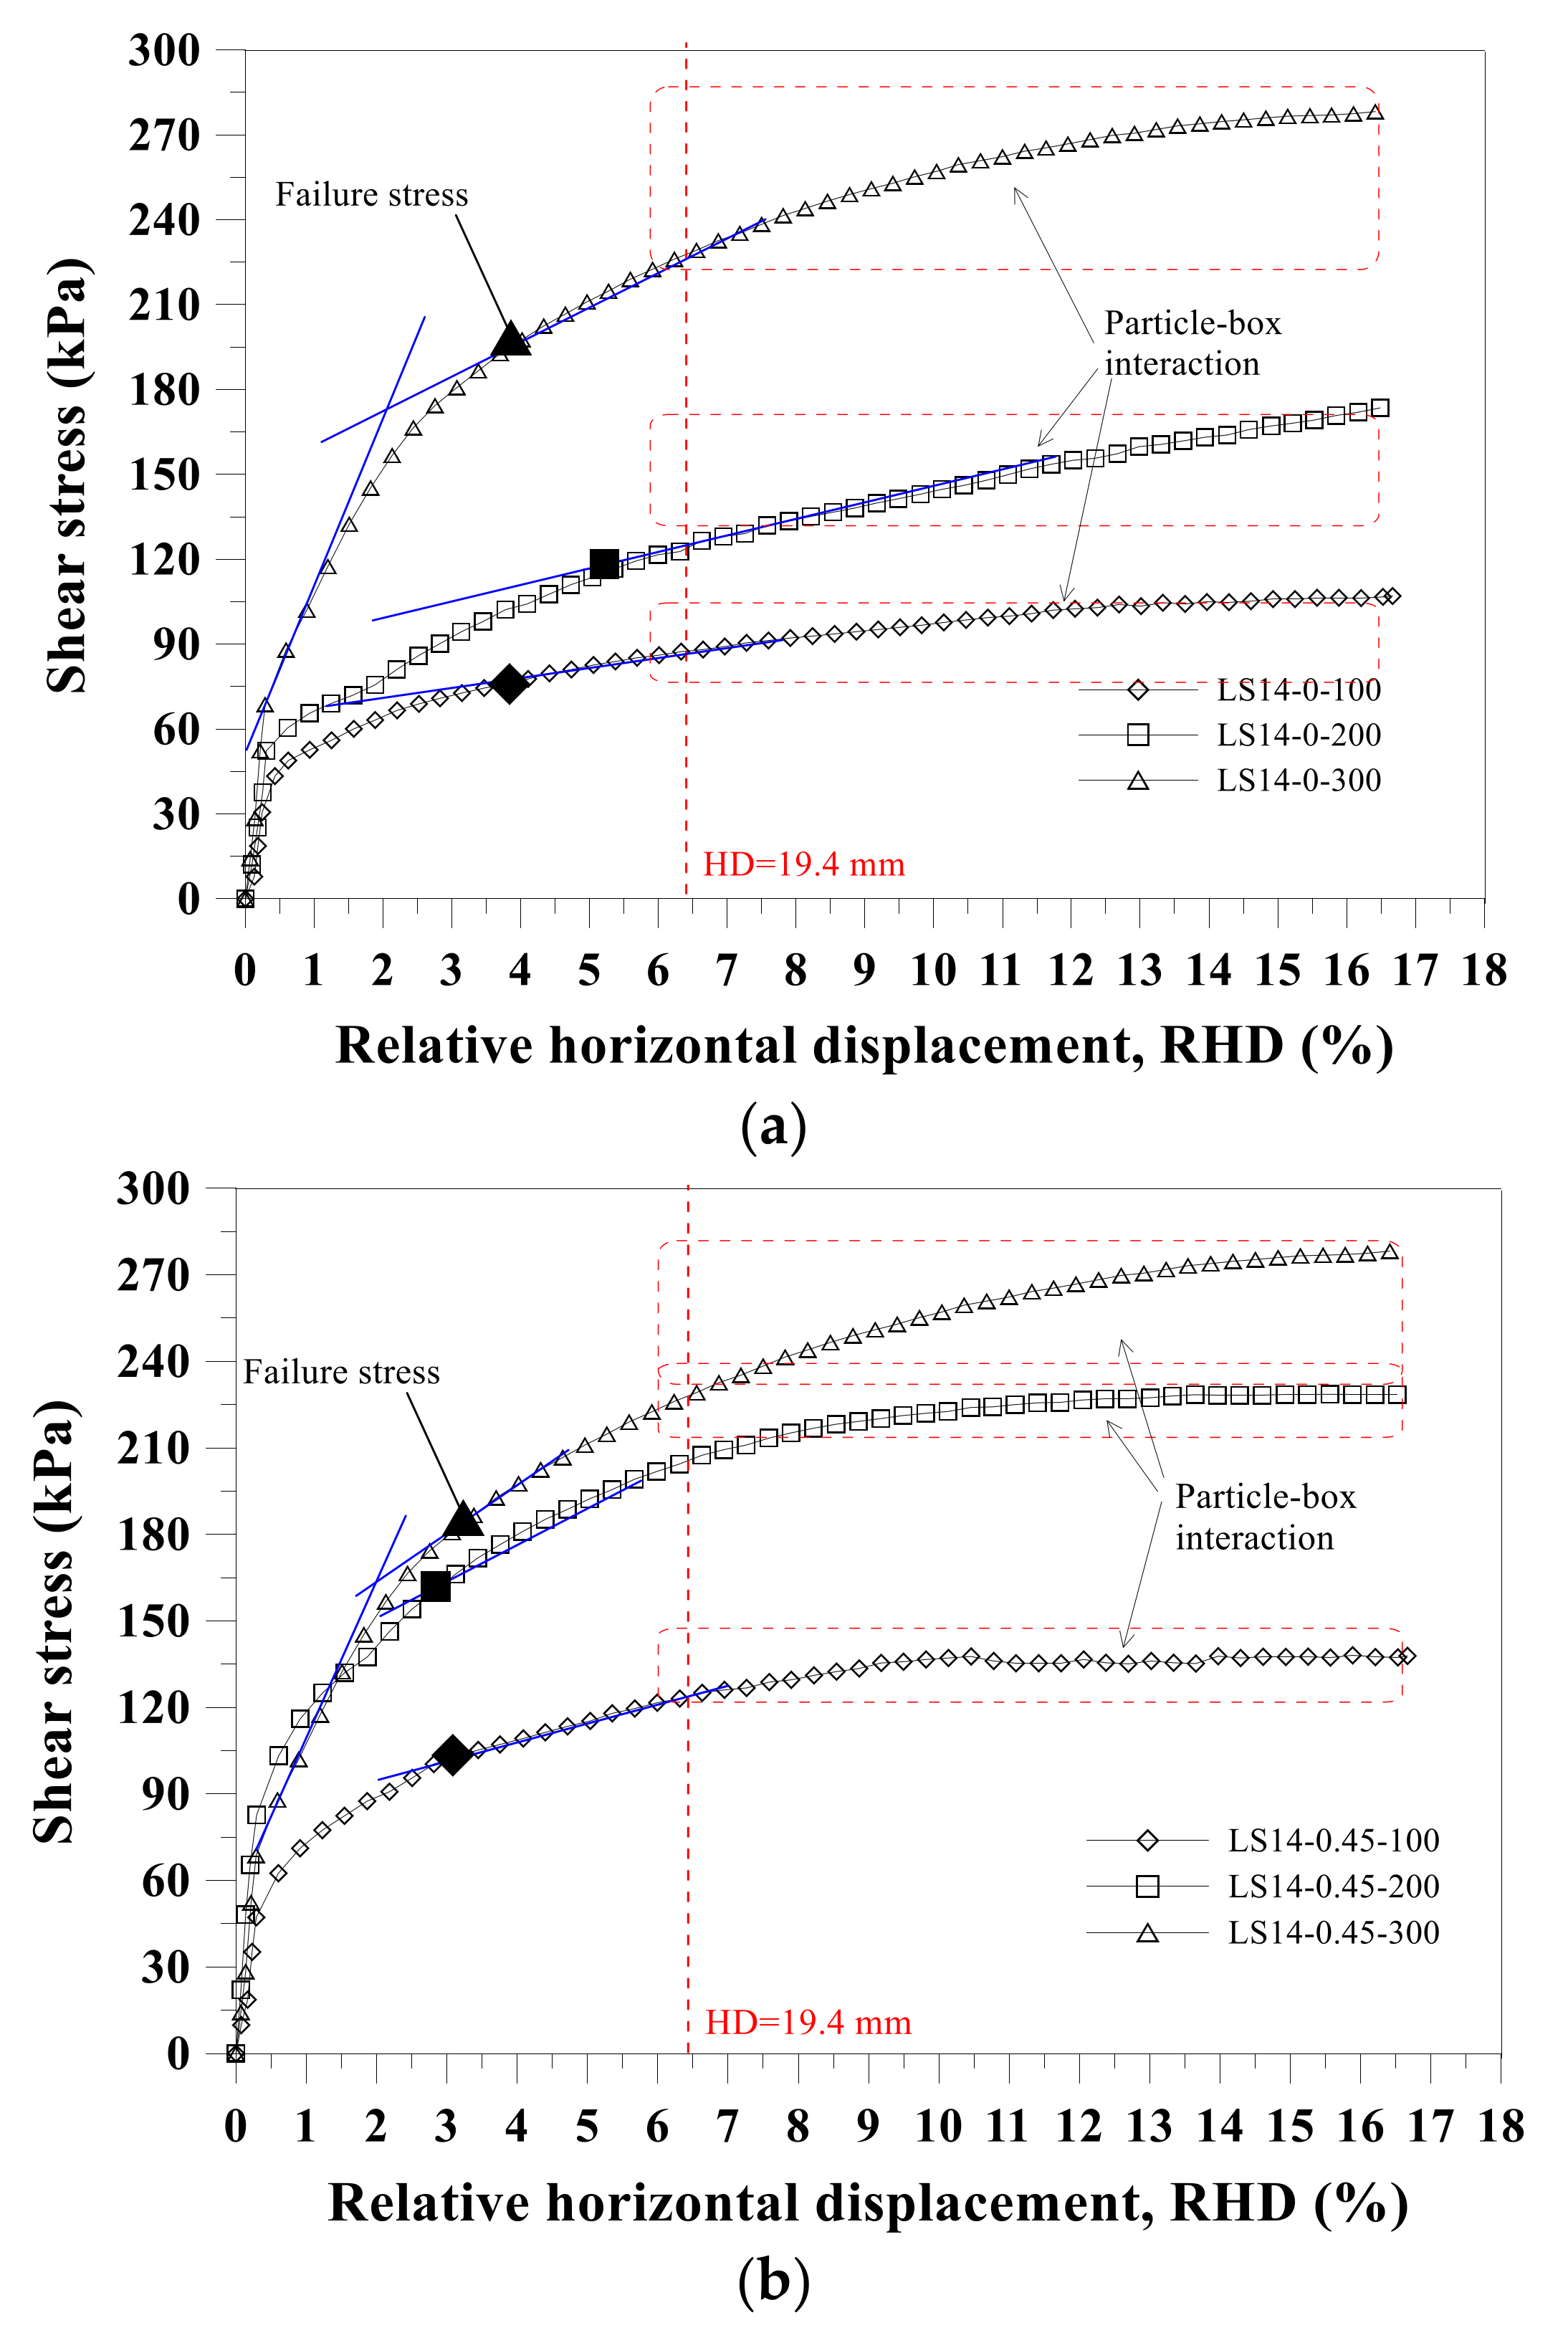
The shear stress versus the RHD curves from the LSDS tests exhibited two out of the four relationships observed from the SSDS tests, which are Type 2 (not shown) and Type 3a. The gradual increase in shear stress observed in Type 3a was believed to be related to the effect of particle-box interaction. Similarly, the failure stress for Type 2 and Type 3a was defined using the horizontal tangent line and the onset of the tangent line, respectively. Additionally, the suggested criterion of 4 mm HD was redefined by regarding the specimen size and applied to the shear stress versus the RHD curves for evaluation of its applicability. It was also found that the redefined criterion of 19.4 mm HD (i.e., 6.5% × 300 mm) differed considerably from the onset of the tangent line, indicating that the 19.4 mm horizontal displacement might not be appropriate for determining the failure stress.
3.2. Comparison of Shear Strength between Small-Scale Direct Shear and Large-Scale Direct Shear
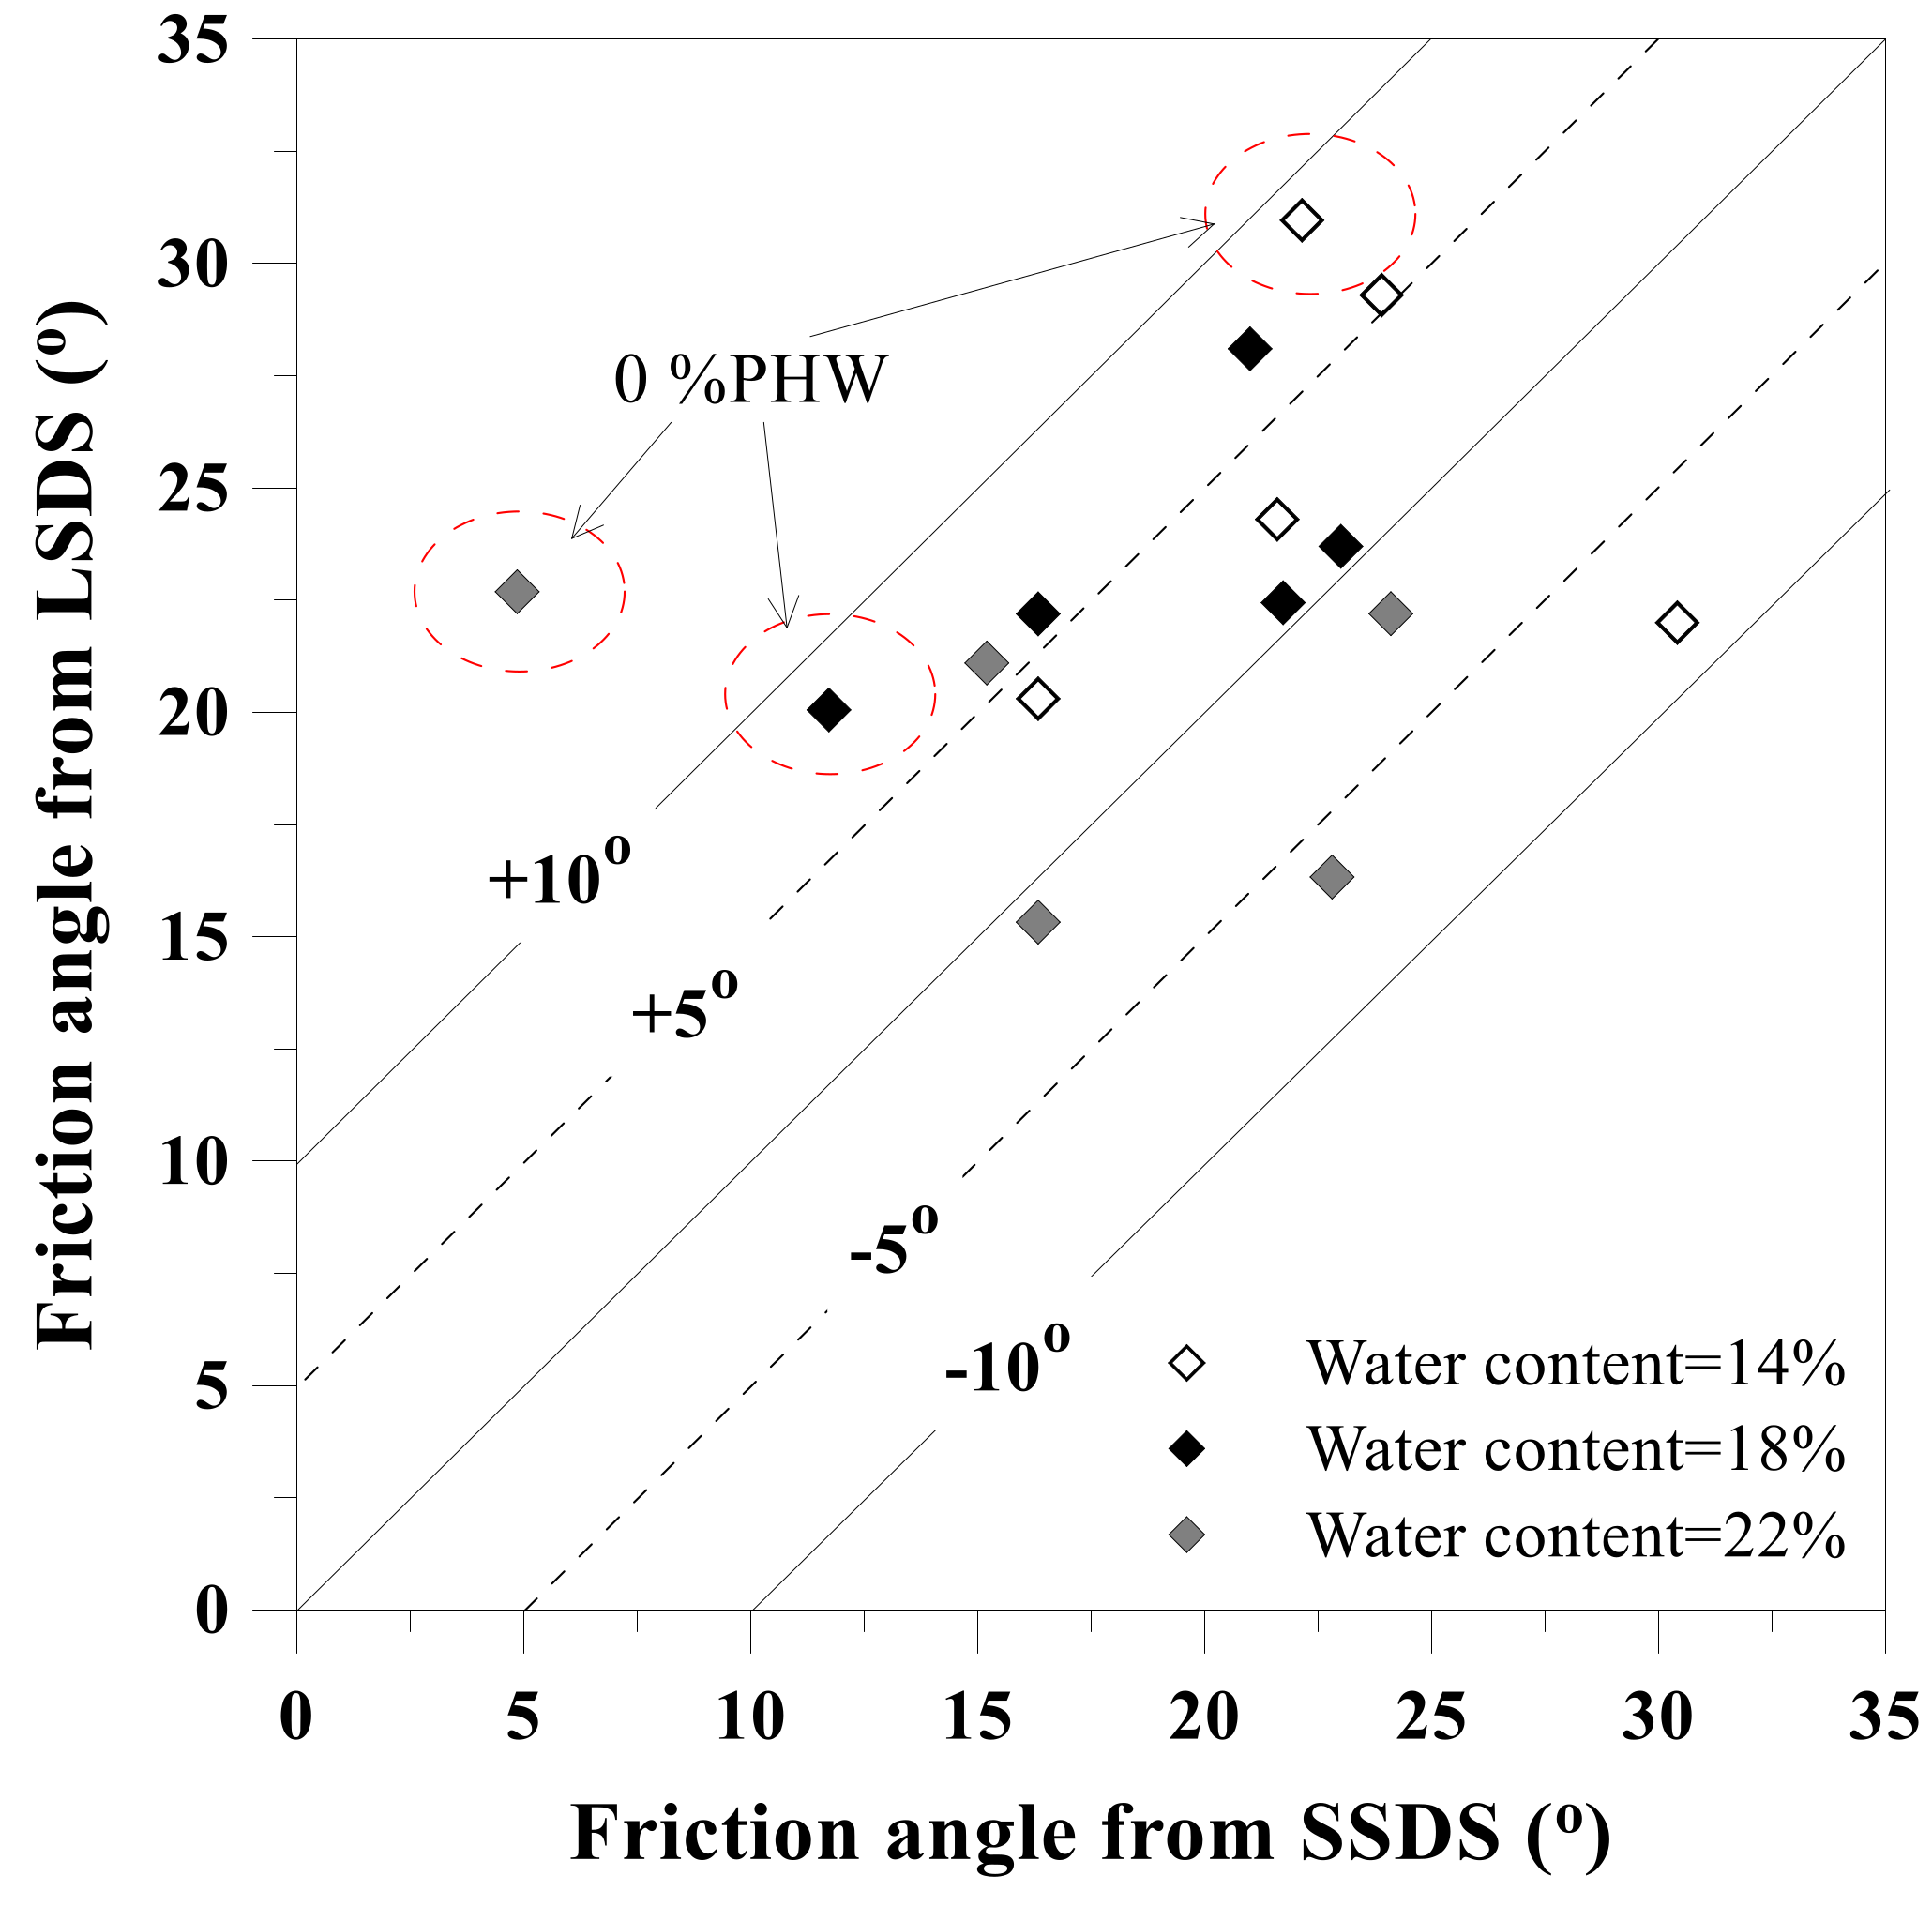
A failure envelope of Mohr–Coulomb failure criterion was established through three DS tests that involved three different normal pressures using the linear least squares regression. The coefficient of determination R2 for the failure envelopes in SSDS varied from 0.914 to 0.999, while in LSDS it varied from 0.906 to 0.999. Shear strength parameters for which the box friction and the possible non-linear nature of the failure envelopes near the origin were omitted are summarised in Table 3. Except the loess specimens with the %PHW equal to 0, the ϕ’ values were typically 16.3–30.4° in SSDS and 15.3–29.3° in LSDS. In most cases the ϕ’ value was the highest as the %PHW was equal to 0.60 and the effect of the PHW on the improvement of the ϕ’ value was more significant in SSDS than in LSDS. A comparison of the ϕ’ values from the SSDS tests and those from the LSDS tests is shown in Figure 9. It was noted that the difference between SSDS and LSDS was typically 0.7–8.8° except the difference of 17.8° for which the specimen prepared at ω = 22% with the %PHW being equal to 0. The PHW was deemed to be effective in achieving the effect of particle inter-locking and thus impeded the development of shear bands near the shear plane as subjected to shear force. The more PHW added, the greater the effect of particle inter-locking and the lesser the significance of the scale effect.
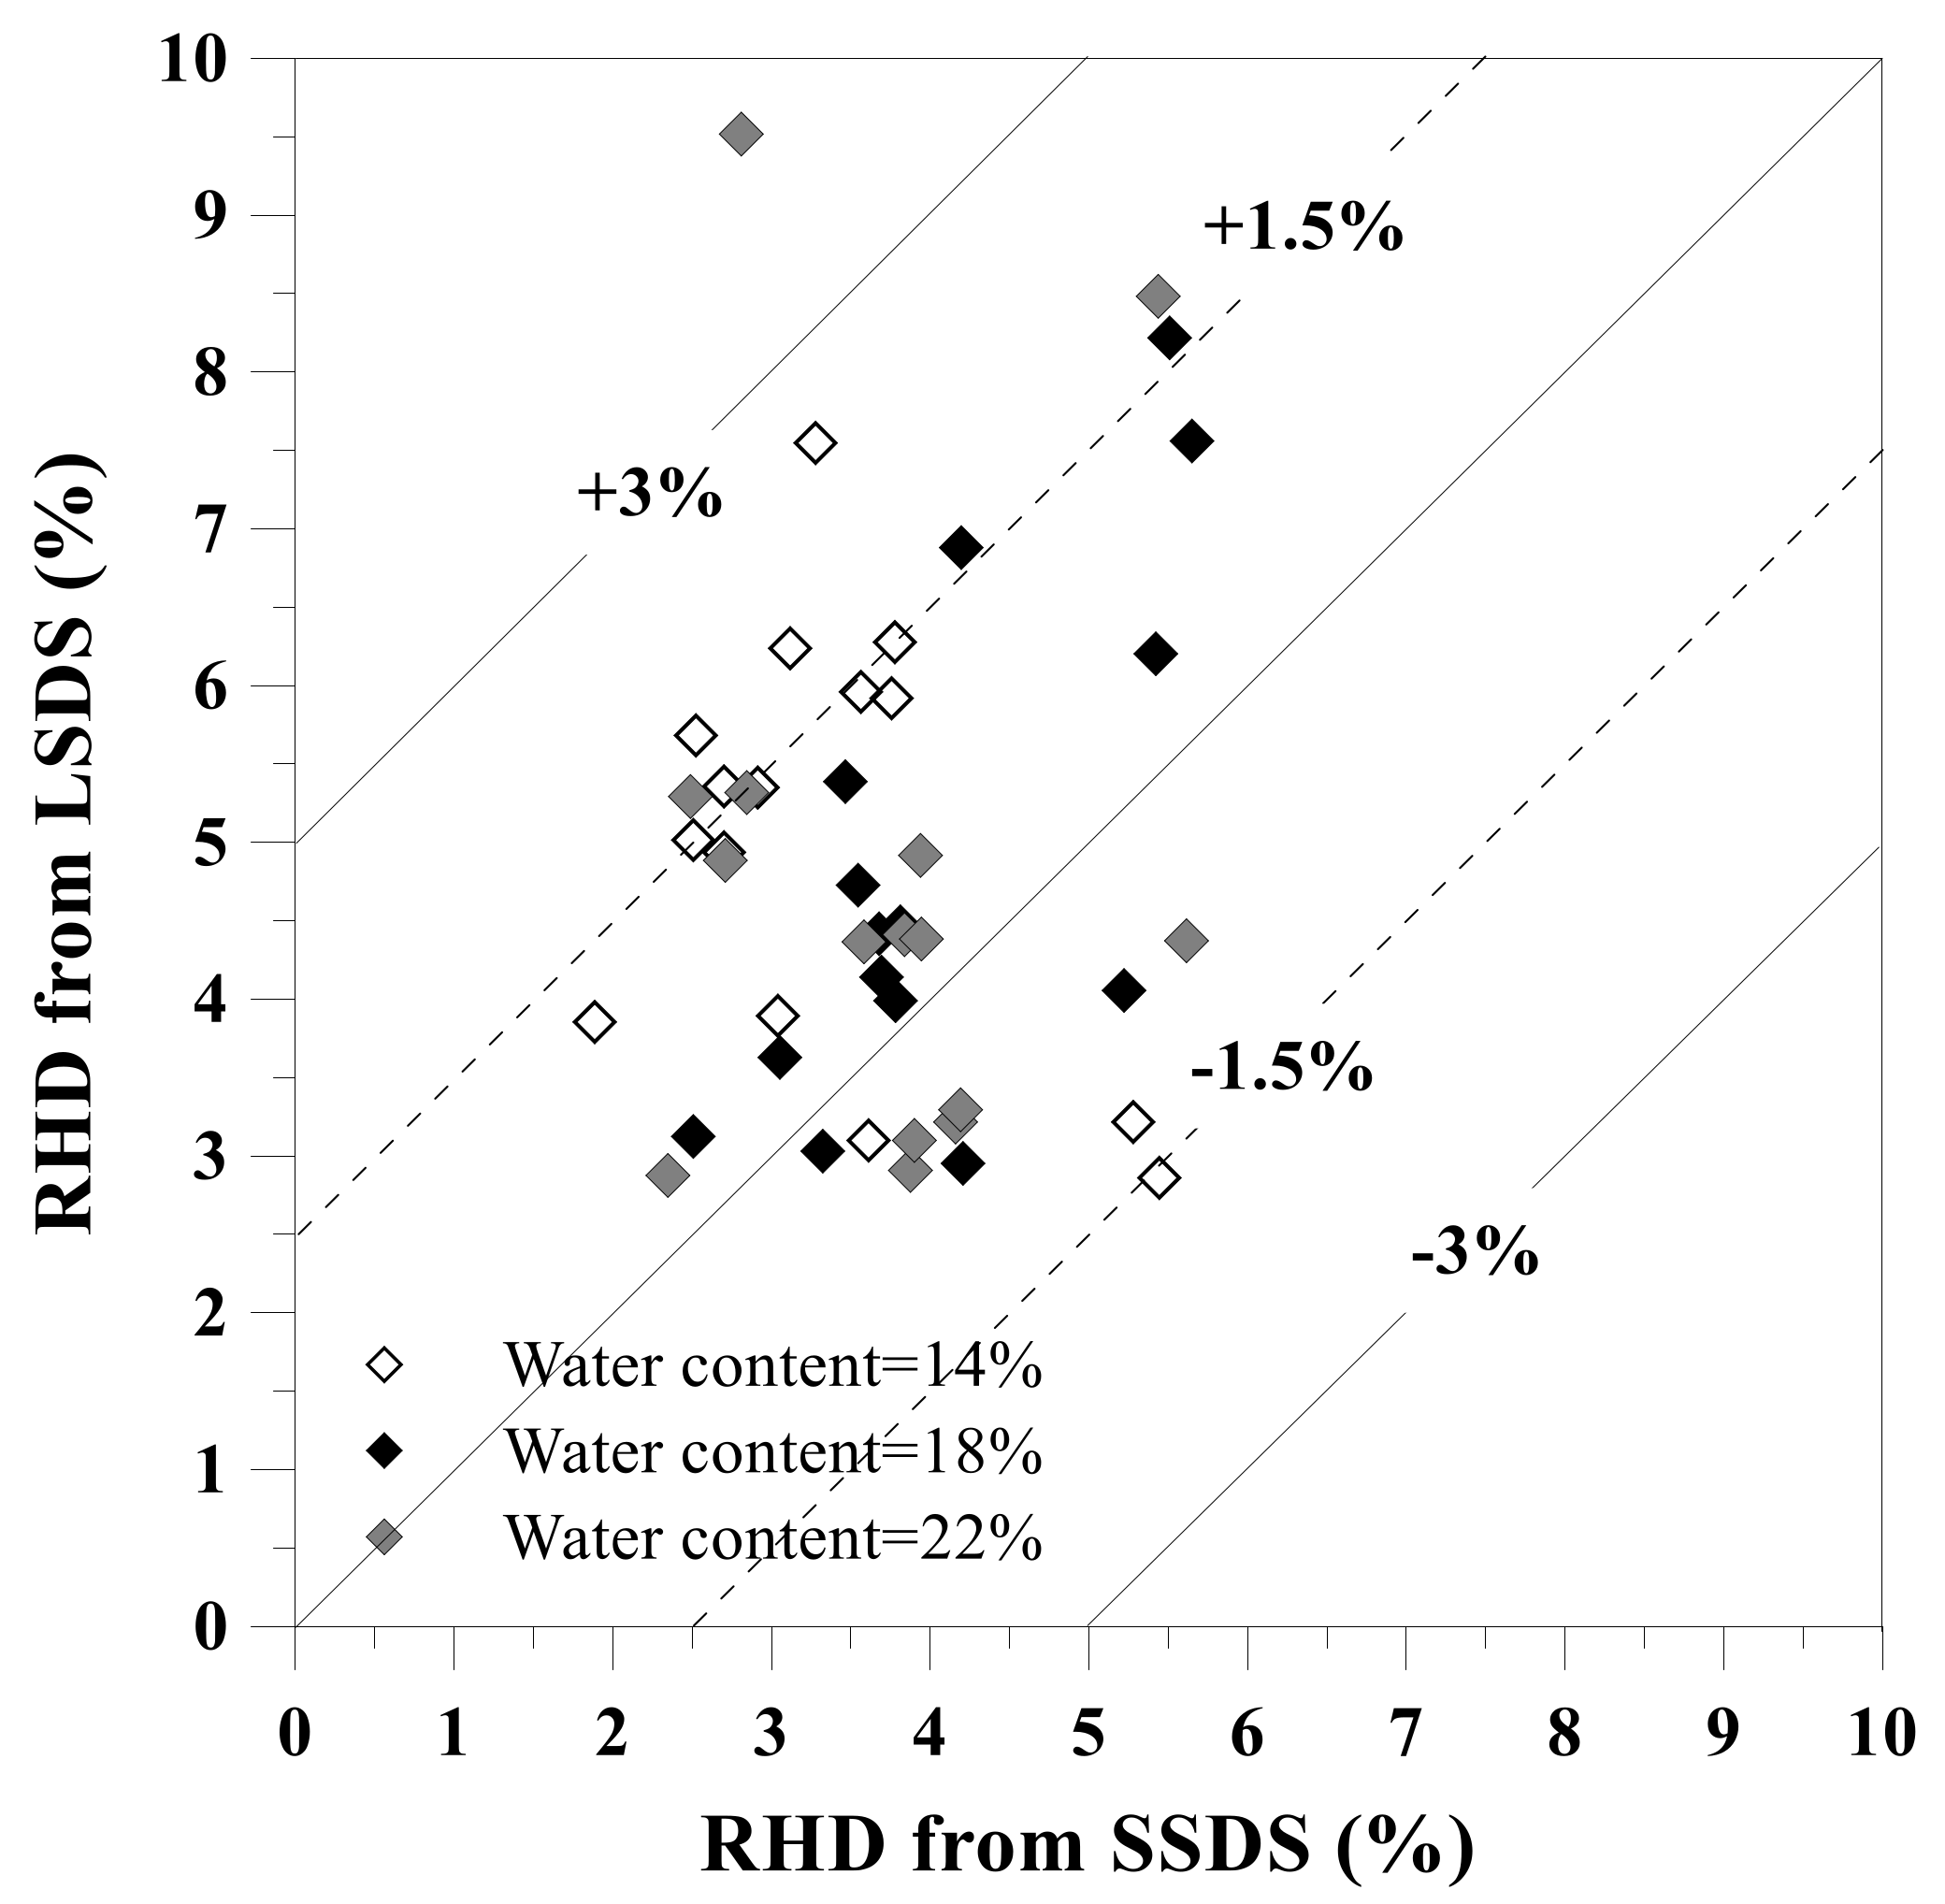
In addition to the ϕ’ value, the RHD at failure was compared between SSDS and LSDS as well. The RHD varied within the range of 1.9–5.4% in SSDS, while it varied within the range of 0.2%–6.7% in LSDS (Figure 10). The difference in the RHD at failure between SSDS and LSDS averaged 1.6%, with a maximum of 4.8%. It is evident that scatter existed in the data although in most cases the difference was generally limited to less than 2.0%. On the other hand, the difference in the RHD in fact was found to be governed by the added water, not by the added amount of PHW. The effect of particle inter-locking restrained the development of shear bands in the vicinity of the shear plane and became distinct when the water content was >14%. The lesser the amount of water added to loess-PHW mixture specimen, the larger the difference in the RHD and the greater the significance of the scale effect.
3.3. Determination of Optimal PHW Dosage
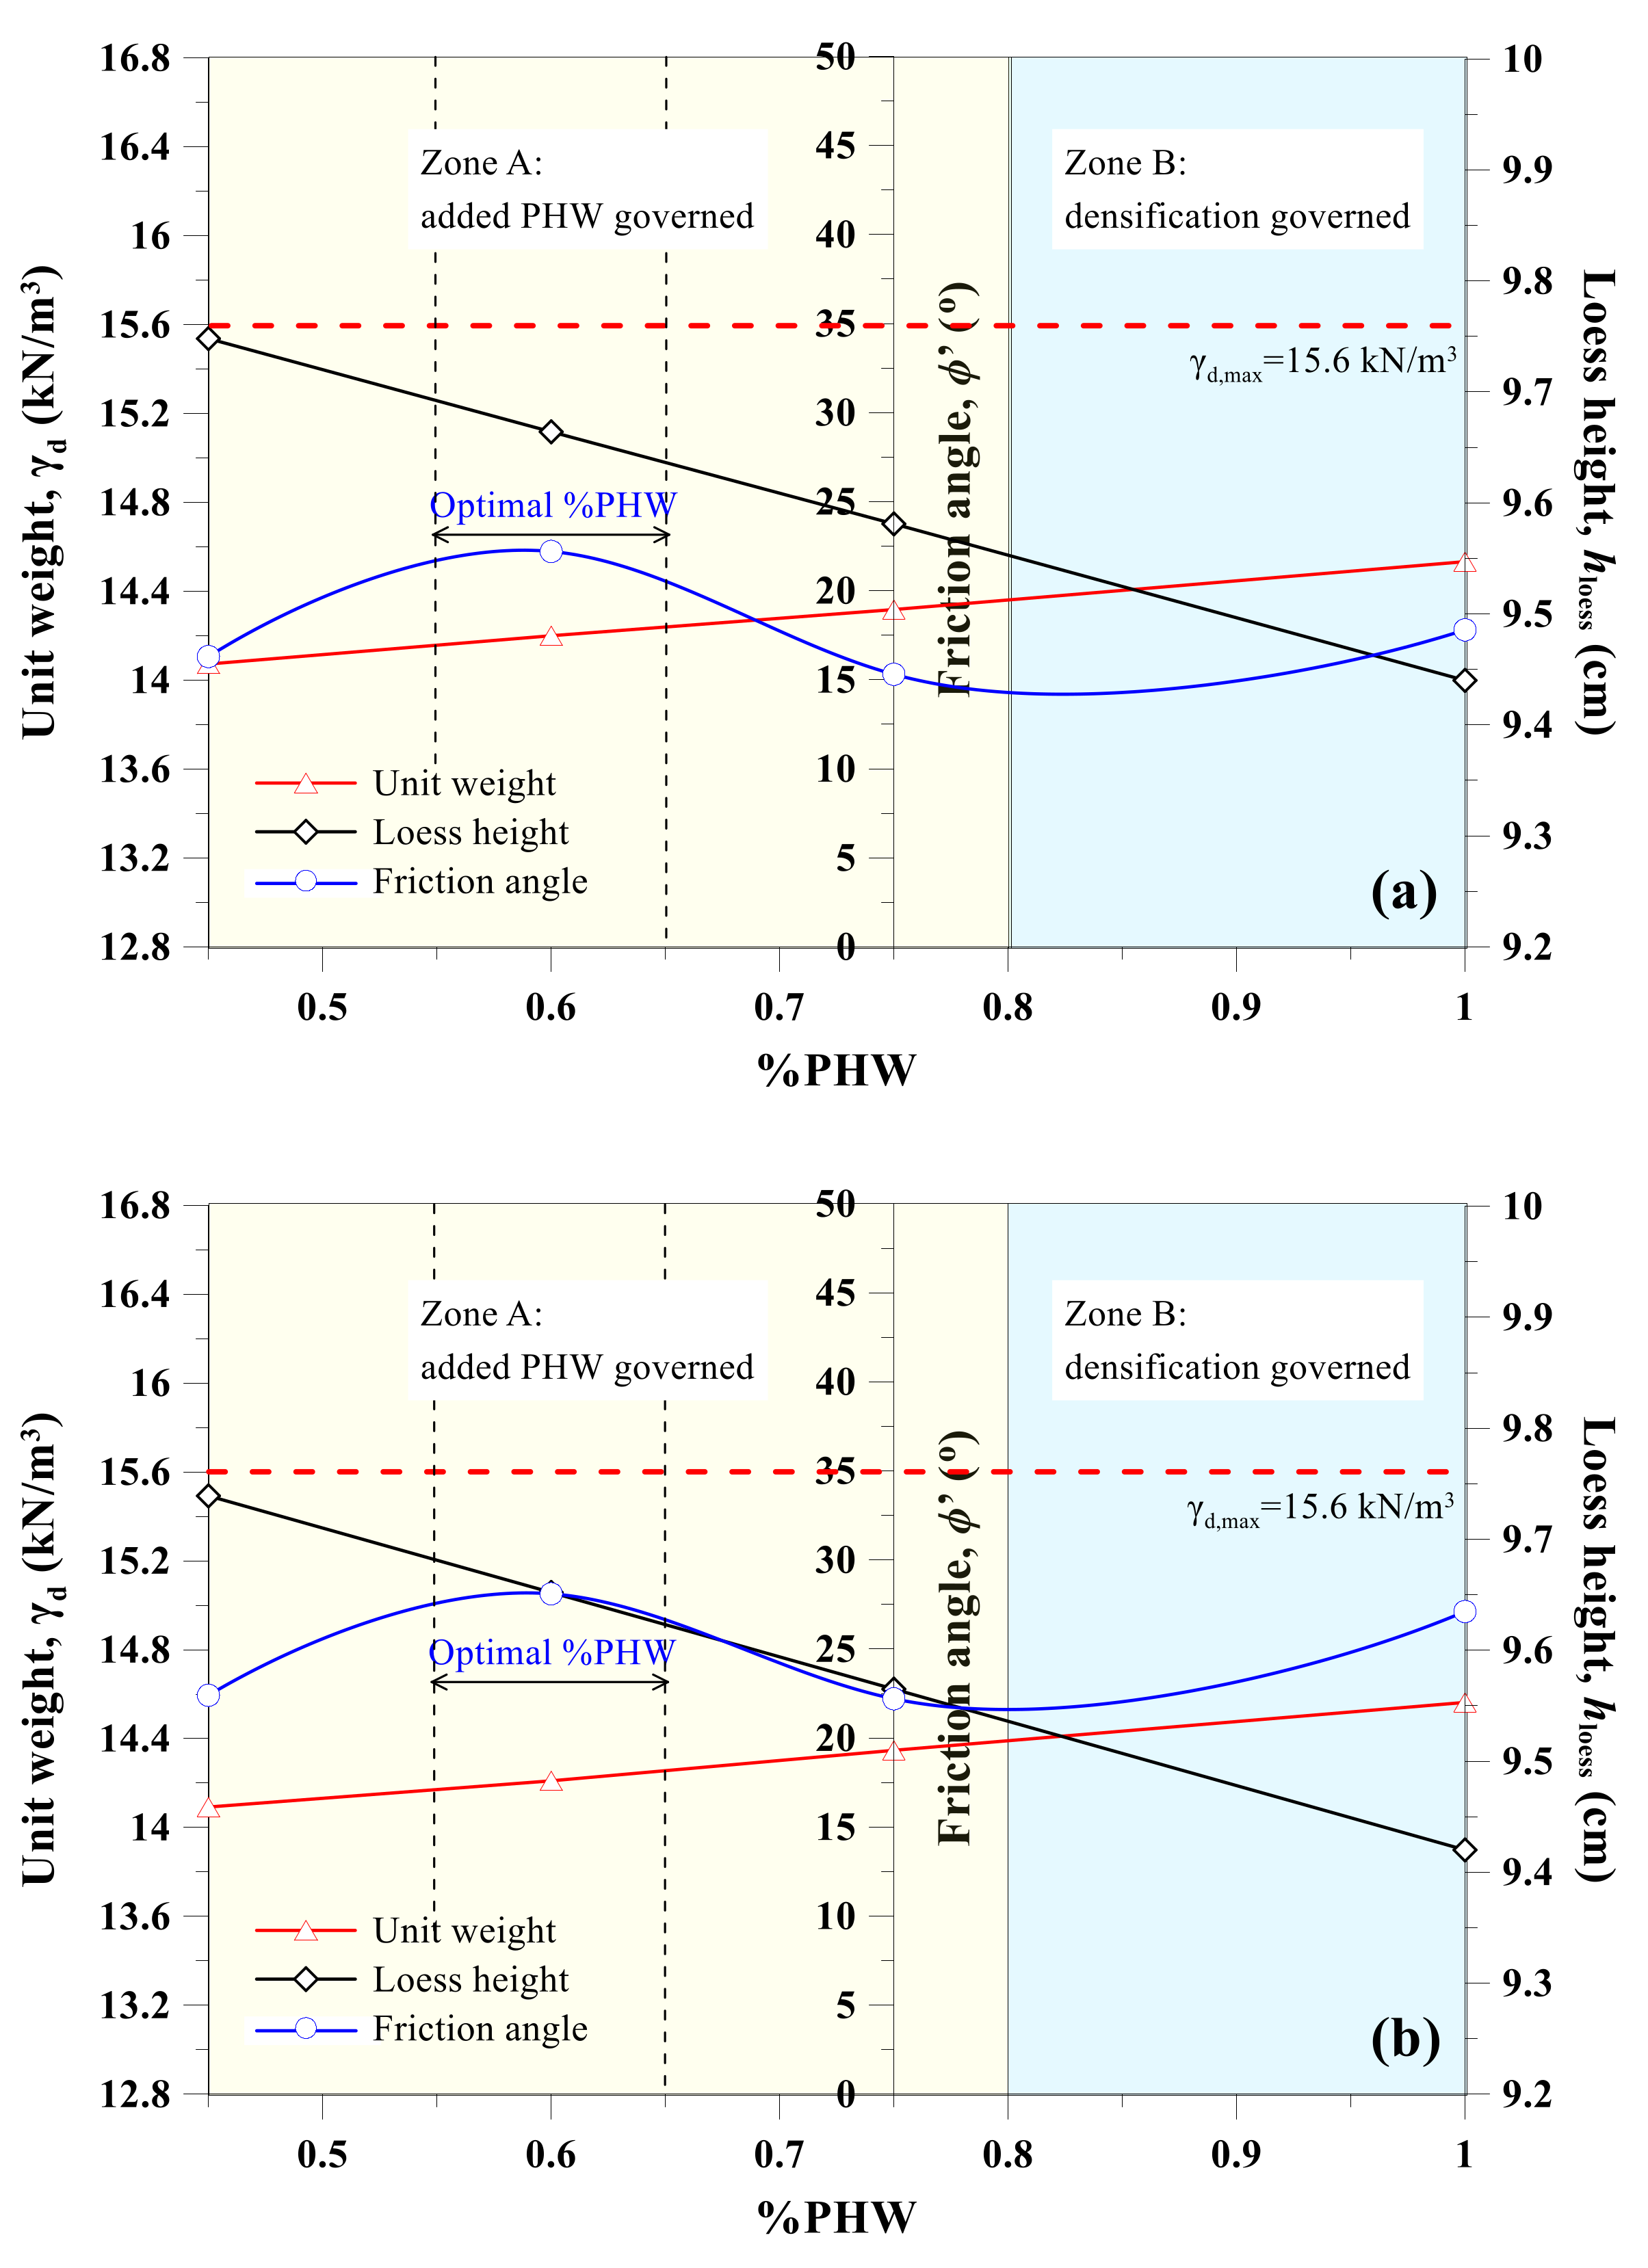
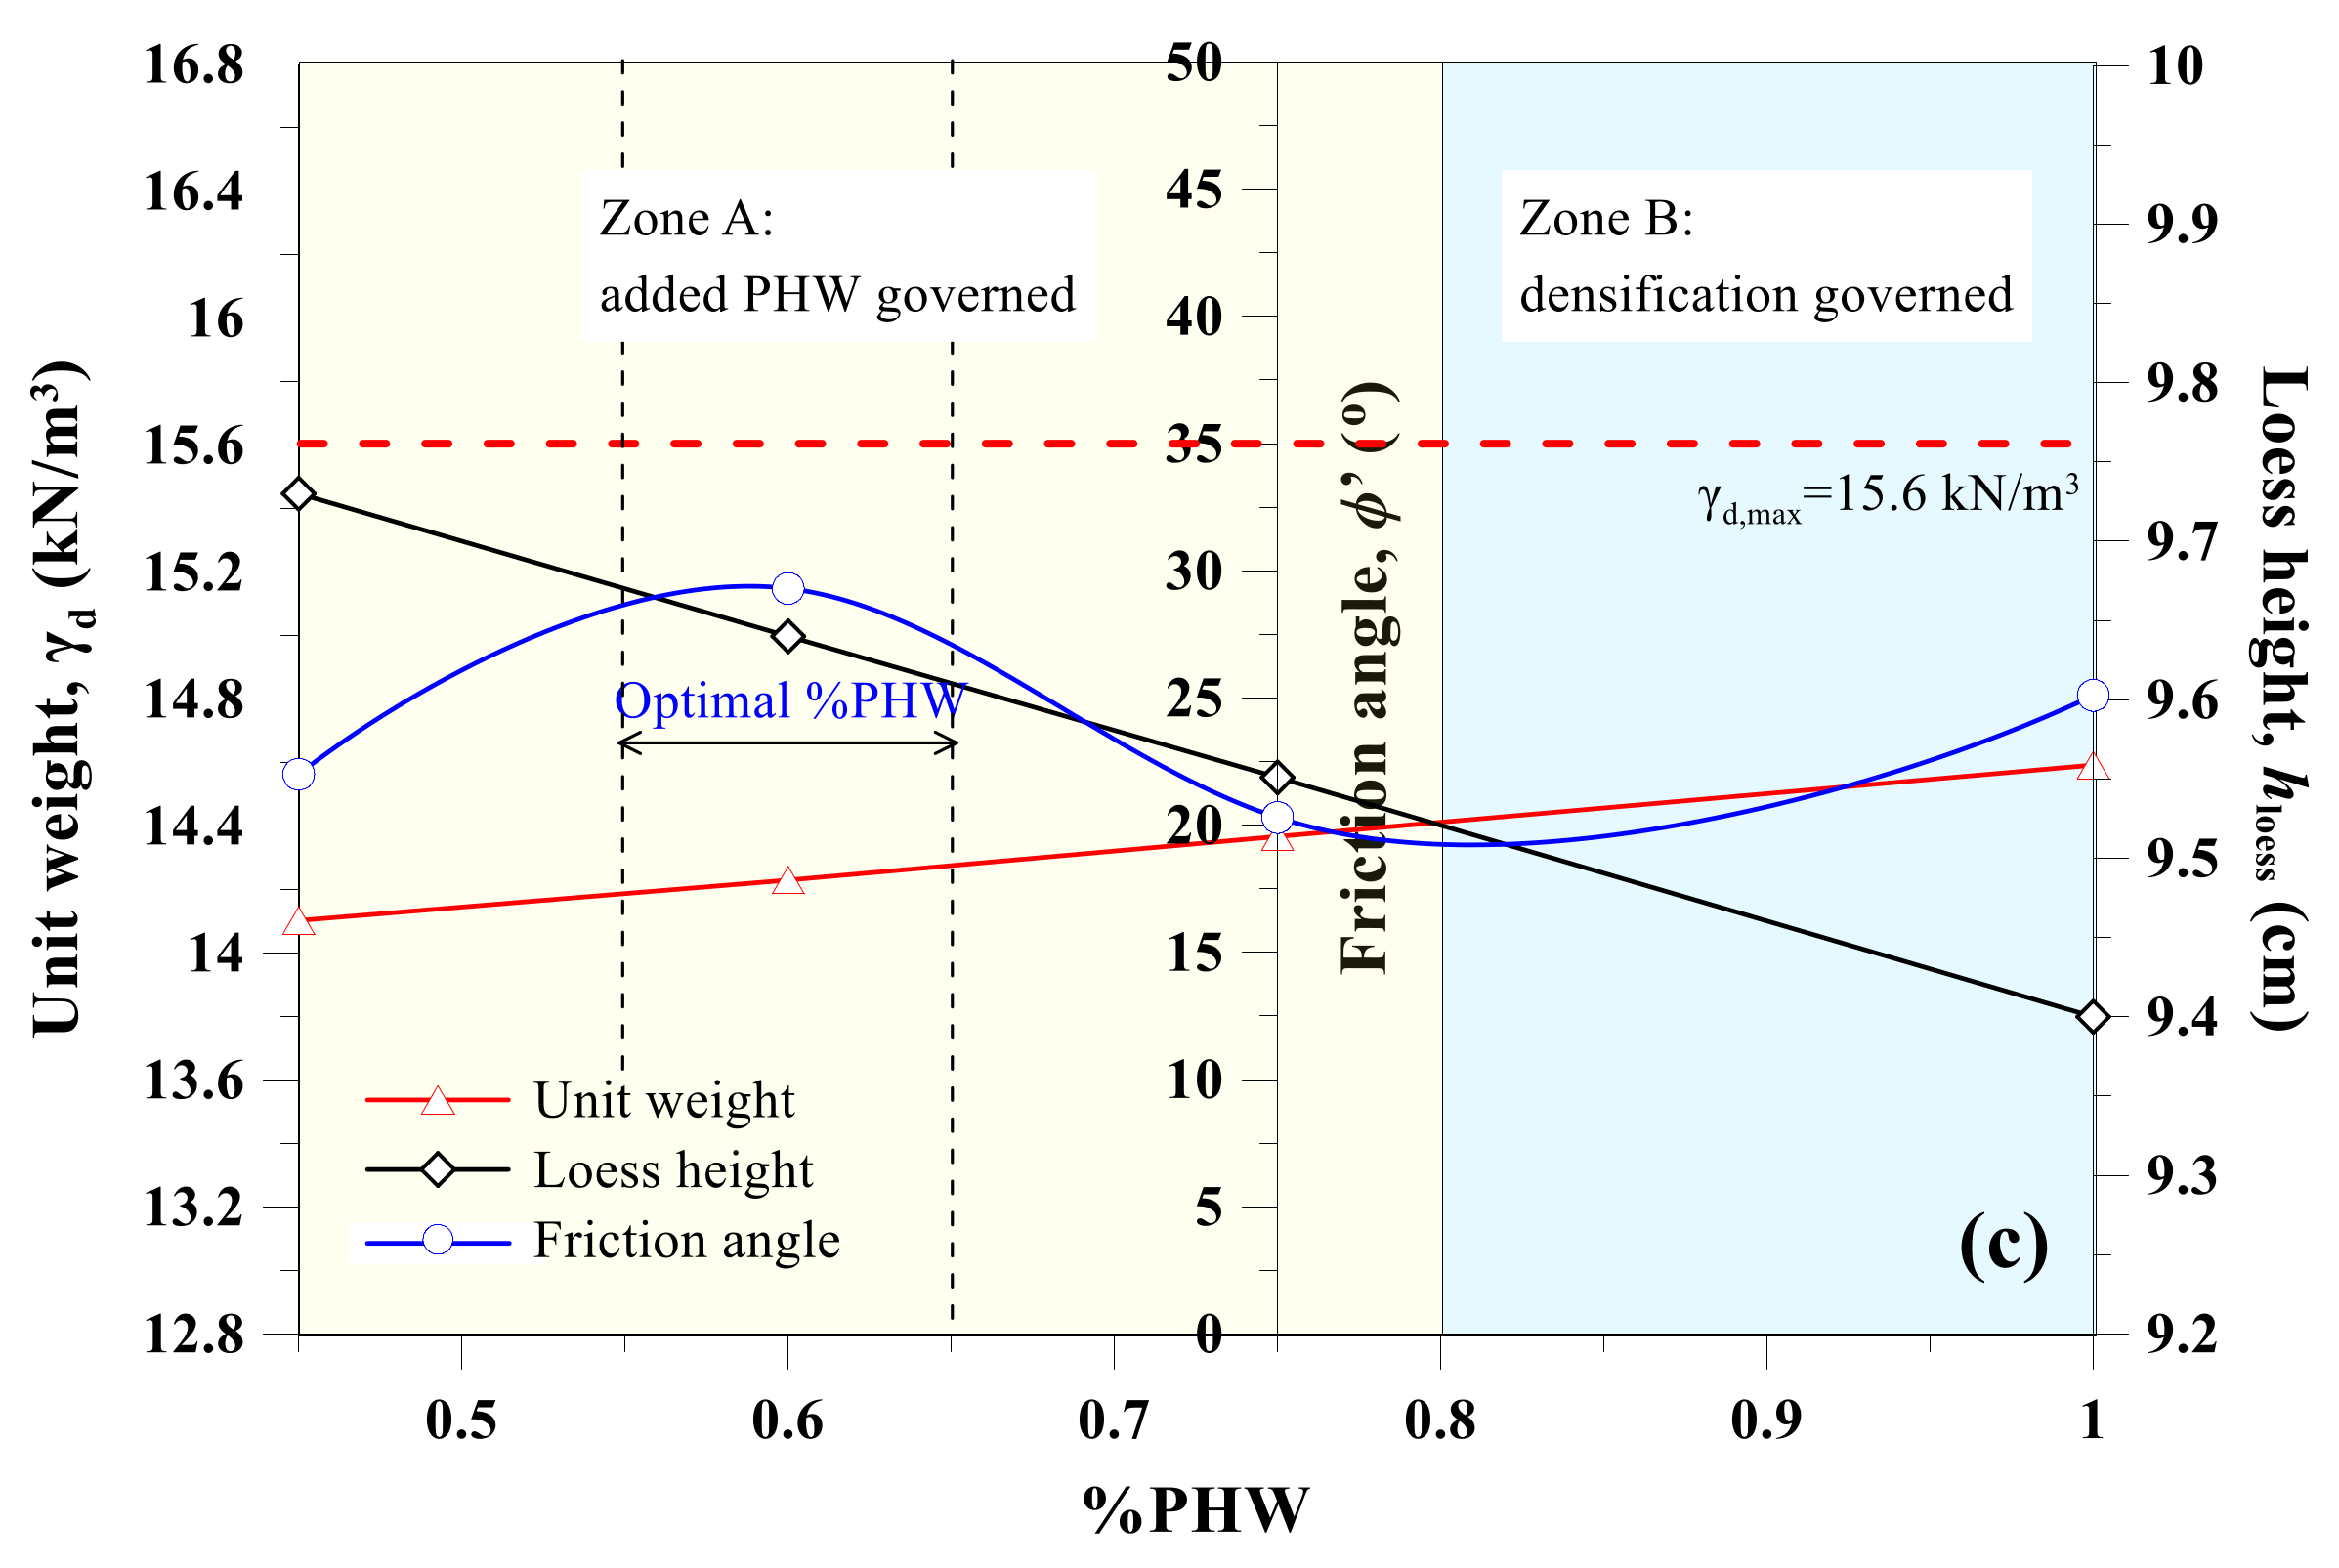
Additional LSDS tests were conducted for the sake of determining the optimal %PHW to be added, in which the %PHW of 1.0 was considered while preparing the loess-PHW mixture specimens at ω equal to 14%, 18% and 22%, respectively. The results of the LSDS tests are summarised in Table 4. The ϕ’ value was the highest as the %PHW was 0.6. Higher ϕ’ value was found as well at the %PHW of 1.0. It is noted that the ϕ’ value for the specimens at ω = 14% increased from 22° to 29.3° as the %PHW increased from 0.45 to 0.6. Then the ϕ’ value decreased to 20.3° as the %PHW further increased to 0.75. The ϕ’ value, however, increased to 25.1° as the %PHW was ultimately increased to 1.0. Similar tendency could also be observed for the specimens at ω = 18% and 22%, respectively. It is evident that the optimal PHW dosage derived from this study was within a range of 0.55–0.65 considering specimen homogenisation and testing reliability. The main cause to as well lead to the increase in the ϕ’ value at the %PHW > 0.8 was investigated by means of a simple test where the height of PHW (hPHW) in the shear box was measured under different normal pressures, hence allowing a back-analysis of the height of loess (hloess) in the shear box. Figure 11 shows the variation of hloess, γd and ϕ’ as the function of %PHWs added (i.e., 0.45, 0.6, 0.75 and 1.0) for the loess-PHW mixture specimens prepared at ω = 14%, 18% and 22%, respectively. The γd values of loess were very close to their maximum of 15.6 kN/m3 from the Proctor curve (not shown) at %PHW of 0.8–1.0. This phenomenon was most likely ascribed to the densified loess resulting from a high %PHW added. It seemed that the shearing behaviour was governed by the amount of added PHW at %PHW <0.8 and that it, in turn, was governed by the densification effect as the %PHW was >0.8. To sum it up, the densification effect led to higher ϕ’ value at %PHW of 0.8–1.0, and this study identified the optimal PHW dosage to be 0.55–0.65 taking into account specimen homogenisation and testing reliability. The impact of the amount of water added would be discussed later in this paper.
3.4. Effect of Particle–Box Interaction
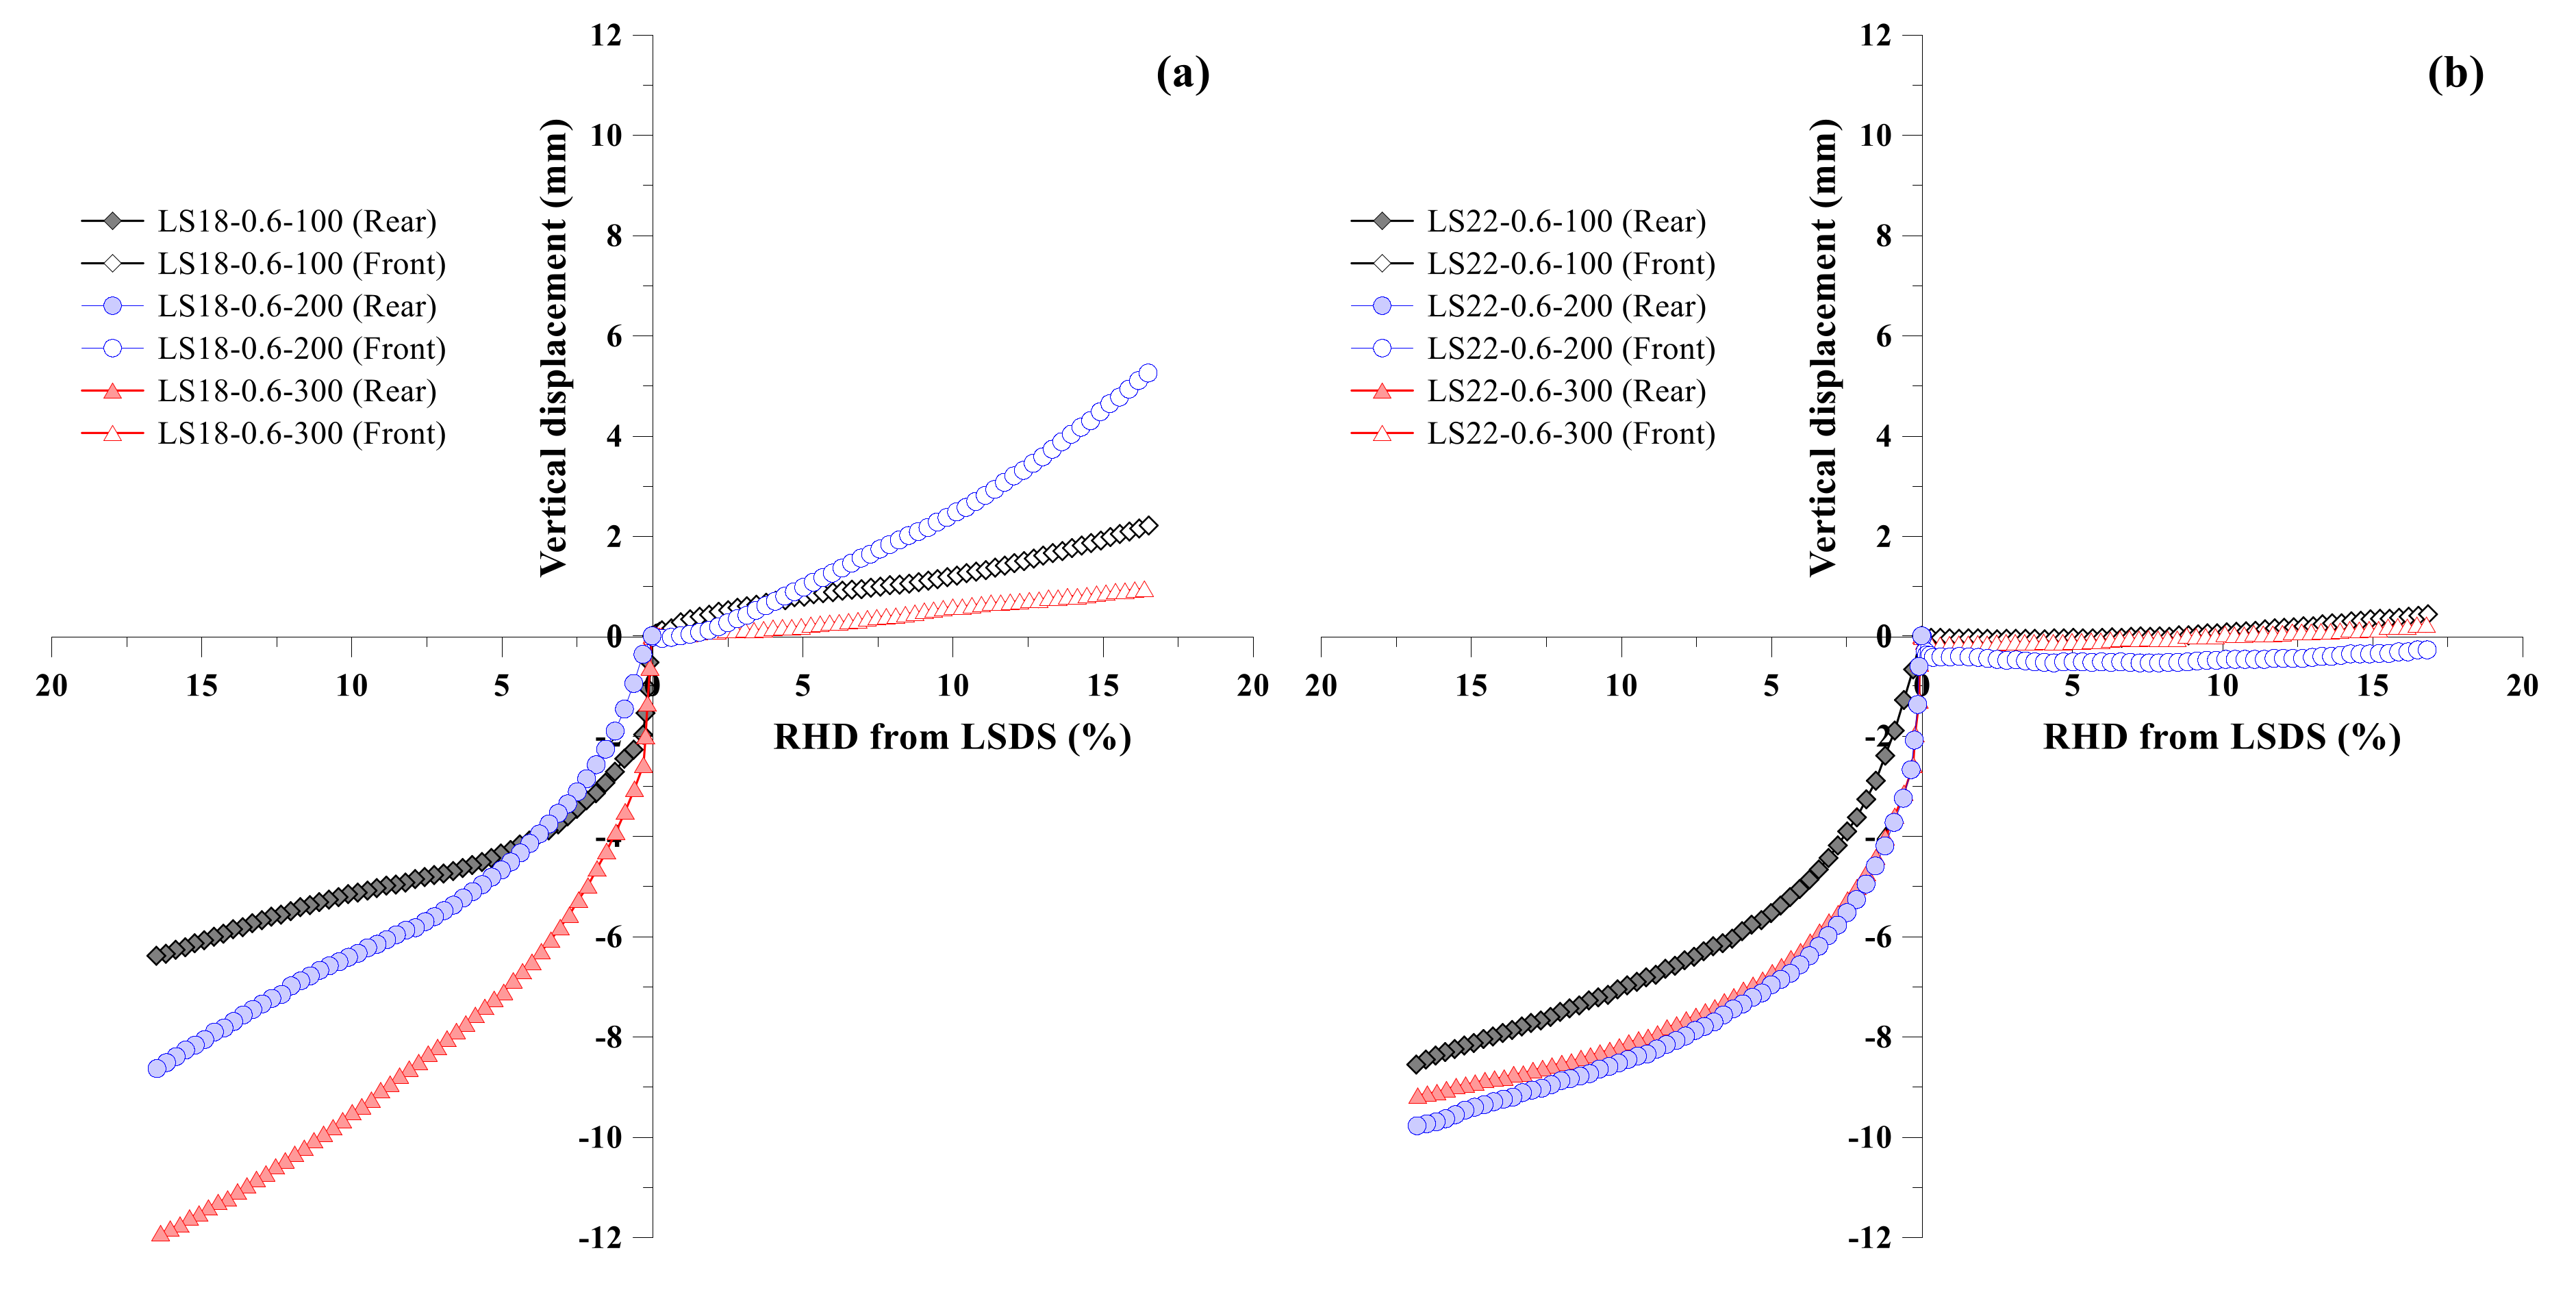
As discussed, the gradual increase in shear stress following the curve inflection point was observed both in Type 3a and Type 3b and its main cause was still not clear. This phenomenon was further studied and elaborated upon. In this regard, two more displacement transducers attached to front and rear of the shear box were introduced for assessing particle movement while shearing in LSDS mode. Figure 12 shows the vertical displacement at front and rear of the shear box versus the RHD for the loess-PHW mixture specimen at ω = 18% and 22%, respectively, as subjected to the normal pressures of 100, 200 and 300 kPa. The vertical upwards displacement at front of the shear box was at most 5.3 mm, while the vertical downwards displacement at rear was typically 6–12 mm. The magnitude of the vertical displacements was more distinct at the rear of the shear box than at the front. Additionally, the greater the normal pressure applied, the larger the vertical displacement. The above results indicate that the particles, during shearing, tended to move to front and rear of the shear box and that the greater normal pressure largely promoted the movement of particles. The observed movement of particles was deemed as the main cause to lead to the further gradual increase in the shear stress observed both in Type 3a and Type 3b.
3.5. Mechanism Leading to Improved Shearing Behaviour
Addition of PHW hampered particle dislocation due to particle inter-locking. This effect thus impeded the development of shear bands in the vicinity of the shearing plane as the HD increased. The difference in the ϕ’ value between SSDS and LSDS was decreased for this reason. It was also found that the RHD rather was a function of the water content than of the amount of PHW added. In spite that addition of PHW hampered particle dislocation, this could not take effect with the small amount of water contained in the specimen. A more accurate way to describe the mechanism leading to the improved shearing behaviour of the loess-PHW mixture is that the improvement was attributed to the effect of particle inter-locking resulting from the added PHW and this effect took effect as the water content reached a threshold, i.e., >14%, that facilitates particle rearrangement. The findings prove not only the reduced environmental impacts while introducing the loess-PHW mixture as compared with other ordinary materials, but also a great potential of its application to sustainable development of urban areas [45,46,47].
4. Conclusions
This study investigated the shearing behaviour of the loess-PHW mixture specimens with various water contents and different PHW dosages in SSDS and LSDS. Some main conclusions can be drawn as follows:
- (1)
- The test results showed that the difference in the ϕ’ value between SSDS and LSDS was typically between 0.7–8.8°, and that the RHD at failure was generally limited to <1.5%, with an average of 1.2%. The improved shearing behaviour of the loess-PHW mixture was attributed to the effect of particle inter-locking and this effect took effect as the water content reached a threshold, i.e., >14%, that facilitates particle rearrangement. The improvement highlighted the great potential of application of loess-PHW mixtures to loess erosion control and slope stabilisation.
- (2)
- The ϕ’ value was the highest as the %PHW was equal to 0.6. The observed higher ϕ’ value, while the %PHW being equal to 0.8–1.0, was most likely because of the densification effect. The optimal PHW dosage derived this study was considered to be 0.55–0.65, taking into account specimen homogenisation and testing reliability.
- (3)
- In the LSDS tests, the vertical displacement, while shearing, was observed at front and rear of the shear box. This movement was more distinct at rear than at front. Additionally, the vertical displacement was increased with the increasing normal pressure. This phenomenon was deemed as the main cause leading to the gradual increase in shear stress following the curve inflection point.
Author Contributions
This paper represents a result of collaborative teamwork. Z.-F.X. and L.W. developed the concept and prepared the manuscript; W.-C.C. and J.X. provided constructive suggestions and revised the manuscript. The four authors contributed equally to this work.
Funding
This research received no external funding.
Acknowledgments
This work would not have been possible without technical supports from Dr. Zhao Duan at Xi’an University of Science and Technology.
Data Availability
The laboratory data used to support the findings of this research work are included within the article.
Conflicts of Interest
The authors declare no conflict of interest.
References
- Cheng, W.C.; Ni, J.C.; Arulrajah, A.; Huang, H.W. A simple approach for characterising tunnel bore conditions based upon pipe-jacking data. Tunn. Undergr. Space Technol. 2018, 71, 494–504. [Google Scholar] [CrossRef]
- Cheng, W.C.; Song, Z.P.; Tian, W.; Wang, Z.F. Shield tunnel uplift and deformation characterisation: A case study from Zhangzhou Metro. Tunn. Undergr. Space Technol. 2018, 79, 83–95. [Google Scholar] [CrossRef]
- Lyu, H.M.; Xu, Y.S.; Cheng, W.C.; Arulrajah, A. Flooding hazards across southern China and perspective sustainability measures. Sustainability 2018, 10, 1682. [Google Scholar] [CrossRef]
- Wang, Y.Q.; Wang, Z.F.; Cheng, W.C. A review on land subsidence caused by groundwater withdrawal in Xi’an, China. Bull. Eng. Geol. Environ. 2018, 78, 2851–2863. [Google Scholar] [CrossRef]
- Wang, Z.F.; Cheng, W.C.; Wang, Y.Q. Investigation into geohazards during urbanization process of Xi’an, China. Nat. Hazards 2018, 92, 1937–1953. [Google Scholar] [CrossRef]
- Elbaz, K.; Shen, S.L.; Tan, Y.; Cheng, W.C. Investigation into performance of deep excavation in sand covered karst: A case report. Soil Found. 2018, 58, 1042–1058. [Google Scholar] [CrossRef]
- Cheng, W.C.; Wang, L.; Xue, Z.F.; Ni, J.C.; Rahman, M.; Arulrajah, A. Lubrication performance of pipejacking in alluvial deposits. Tunn. Undergr. Space Technol. 2019, 91, 102991. [Google Scholar] [CrossRef]
- Babu Sivakumar, G.L.; Vasudevan, A.K. Strength and stiffness response of coir reinforced tropical soils. J. Mater. Civ. Eng. 2008, 20, 571–577. [Google Scholar] [CrossRef]
- Shen, S.L.; Wang, Z.F.; Cheng, W.C. Estimation of lateral displacement induced by jet grouting in clayey soils. Geotechnique 2017, 67, 1–10. [Google Scholar] [CrossRef]
- Cheng, W.C.; Ni, J.C.; Shen, S.L.; Wang, Z.F. Modeling of permeation and fracturing grouting in sand: Laboratory investigations. J. Test. Eval. 2018, 46, 2067–2082. [Google Scholar] [CrossRef]
- Wang, Z.F.; Shen, J.S.; Cheng, W.C. Simple method to predict ground displacements caused by installing horizontal jet-grouting columns. Math. Probl. Eng. 2018, 2018, 1897394. [Google Scholar] [CrossRef]
- Ge, L.; Wang, C.C.; Hung, C.W.; Liao, W.C.; Zhao, H. Assessment of strength development of slag cement stabilized kaolinite. Constr. Build. Mater. 2018, 184, 492–501. [Google Scholar] [CrossRef]
- Kua, T.A.; Arulrajah, A.; Mohammadinia, A.; Horpibulsuk, S.; Mirzababaei, M. Stiffness and deformation properties of spent coffee grounds based geopolymers. Constr. Build. Mater. 2017, 138, 79–87. [Google Scholar] [CrossRef]
- Suksiripattanapong, C.; Kua, T.A.; Arulrajah, A.; Maghool, F.; Horpibulsuk, S. Strength and microstructure properties of spent coffee grounds stabilized with rice husk ash and slag geopolymers. Constr. Build. Mater. 2017, 146, 312–320. [Google Scholar] [CrossRef]
- Arulrajah, A.; Kua, T.A.; Suksiripattanapong, C.; Horpibulsuk, S.; Shen, J.S. Compressive strength and microstructure properties of spent coffee grounds-bagasse ash based geopolymers with slag supplements. J. Clean. Prod. 2017, 162, 1491–1501. [Google Scholar] [CrossRef]
- Belhadj, B.; Bederina, M.; Makhloufi, Z.; Dheilly, R.M.; Montrelay, N.; Quéneudéc, M. Contribution to the development of a sand concrete lightened by the addition of barley straws. Constr. Build. Mater. 2016, 113, 513–522. [Google Scholar] [CrossRef]
- Bederina, M.; Belhadj, B.; Ammari, M.S.; Gouilleux, A.; Makhloufi, Z.; Montrelay, N.; Quéneudéc, M. Improvement of the properties of a sand concrete containing barley straws—Treatment of the barley straws. Constr. Build. Mater. 2016, 115, 464–477. [Google Scholar] [CrossRef]
- Lu, J.; Wang, T.H.; Cheng, W.C.; Yang, T.; Luo, Y. Permeability anisotropy of loess under influence of dry density and freeze-thaw cycles. Int. J. Geomech. 2019, 19, 04019103. [Google Scholar] [CrossRef]
- Tabarsa, A.; Latifi, N.; Meehan, C.L.; Manahiloh, K.N. Laboratory investigation and field evaluation of loess improvement using nanoclay—A sustainable material for construction. Constr. Build. Mater. 2018, 158, 454–463. [Google Scholar] [CrossRef]
- Dijkstra, T.A.; Rogers, C.D.F.; Smalley, I.J.; Derbyshire, E.; Li, Y.J.; Meng, X.M. The loess of north-central China: Geotechnical properties and their relation to slope stability. Eng. Geol. 1994, 36, 153–171. [Google Scholar] [CrossRef]
- Duan, Z.; Cheng, W.C.; Peng, J.B.; Wang, Q.Y.; Chen, W. Investigation into triggering mechanism of loess landslides in south Jingyang platform, Shaanxi province. Bull. Eng. Geol. Environ. 2019. [Google Scholar] [CrossRef]
- Jin, X.; Wang, T.T.; Cheng, W.C.; Luo, Y.; Zhou, A. A simple method for settlement evaluation of loess-pile foundation. Can. Geotech. J. 2019. [Google Scholar] [CrossRef]
- Juang, C.H.; Dijkstra, T.; Wasowski, J.; Meng, X.M. Loess geohazards research in China: Advances and challenges for mega engineering projects. Eng. Geol. 2019, 251, 1–10. [Google Scholar] [CrossRef]
- Yuan, W.N.; Fan, W.; Jiang, C.C.; Peng, X.L. Experimental study on the shear behavior of loess and paleosol based on ring shear tests. Eng. Geol. 2019, 250, 11–20. [Google Scholar] [CrossRef]
- Zhang, S.; Zhang, X.C.; Pei, X.J.; Wang, S.Y.; Huang, R.Q.; Xu, Q.; Wang, Z.L. Model test study on the hydrological mechanisms and early warning thresholds for loess fill slope failure induced by rainfall. Eng. Geol. 2019, 258, 105135. [Google Scholar] [CrossRef]
- Chen, L.; Wei, W.; Fu, B.; Lü, Y. Soil and water conservation on the Loess Plateau in China: Review and perspective. Prog. Phys. Geogr. Earth Environ. 2007, 31, 389–403. [Google Scholar] [CrossRef]
- Qiu, H.; Cui, P.; Regmi, A.D.; Hu, S.; Wang, X.; Zhang, Y.; He, Y. Influence of topography and volume on mobility of loess slides within different slip surfaces. Catena 2017, 157, 180–188. [Google Scholar] [CrossRef]
- Wu, L.; Jiang, J.; Li, G.X.; Ma, X.Y. Characteristics of pulsed runoff-erosion events under typical rainstorms in a small watershed on the Loess Plateau of China. Sci. Rep. 2018, 8, 3672. [Google Scholar] [CrossRef]
- Yates, K.; Fenton, C.H.; Bell, D.H. A review of the geotechnical characteristics of loess and loess-derived soils from Canterbury, South Island, New Zealand. Eng. Geol. 2018, 236, 11–21. [Google Scholar] [CrossRef]
- Larsen, I.J.; Montgomery, D.R.; Korup, O. Landslide erosion controlled by hillslope material. Nat. Geosci. 2010, 3, 247–251. [Google Scholar] [CrossRef]
- Fattet, M.; Fu, Y.; Ghestem, M.; Ma, W.; Foulonneau, M.; Nespoulous, J.; Le Bissonnais, Y.; Stokes, A. Effects of vegetation type on soil resistance to erosion: Relationship between aggregate stability and shear strength. Catena 2011, 87, 60–69. [Google Scholar] [CrossRef]
- Pradhan, B.; Chaudhari, A.; Adinarayana, J.; Buchroithner, M.F. Soil erosion assessment and its correlation with landslide events using remote sensing data and GIS: A case study at Penang Island, Malaysia. Environ. Monit. Assess. 2012, 184, 715–727. [Google Scholar] [CrossRef] [PubMed]
- Schwarz, M.; Phillips, C.; Marden, M.; McIvor, I.R.; Douglas, G.B.; Watson, A. Modelling of root reinforcement and erosion control by ‘Veronese’ poplar on pastoral hill country in New Zealand. N. Z. J. For. Sci. 2016, 46, 4. [Google Scholar] [CrossRef] [Green Version]
- Osman, N.; Barakbah, S.S. Parameters to predict slope stability—Soil water and root profiles. Ecol. Eng. 2006, 28, 90–95. [Google Scholar] [CrossRef]
- Comino, E.; Druetta, A. The effect of Poaceae roots on the shear strength of soils in the Italian alpine environment. Soil Tillage Res. 2010, 106, 194–201. [Google Scholar] [CrossRef]
- Schwarz, M.; Preti, F.; Giadrossich, F.; Lehmann, P.; Or, D. Quantifying the role of vegetation in slope stability: A case study in Tuscany (Italy). Ecol. Eng. 2010, 36, 285–291. [Google Scholar] [CrossRef]
- Peng, H.; Jia, Y.W.; Qiu, Y.Q.; Niu, C.W.; Ding, X.Y. Assessing climate change impacts on the ecohydrology of the Jinghe River basin in the Loess Plateau, China. Hydrol. Sci. J. 2013, 58, 651–670. [Google Scholar] [CrossRef]
- Cerato, A.B.; Lutenegger, A.J. Specimen size and scale effects of direct shear box tests of sands. Geotech. Test. J. 2006, 29, 507–516. [Google Scholar]
- Wu, P.; Matsushima, K.; Tatsuoka, F. Effects of specimen size and some other factors on the strength and deformation of granular soil in direct shear tests. Geotech. Test. J. 2008, 31, 45–64. [Google Scholar]
- Bareither, C.A.; Benson, C.H.; Edil, T.B. Comparison of shear strength of sand backfills measured in small-scale and large-scale direct shear tests. Can. Geotech. J. 2008, 45, 1224–1236. [Google Scholar] [CrossRef]
- Zhang, M.; Cheng, G.; Feng, H.; Sun, B.H.; Zhao, Y.; Chen, H.X.; Chen, J.; Dyek, M.; Wang, X.D.; Zhang, J.G.; et al. Effects of straw and biochar amendments on aggregate stability, soil organic carbon, and enzyme activities in the Loess Plateau, China. Environ. Sci. Pollut. Res. 2017, 24, 10108–10120. [Google Scholar] [CrossRef]
- Zhang, A.F.; Cheng, G.; Hussain, Q.; Zhang, M.; Feng, H.; Dyck, M.; Sun, B.H.; Zhao, Y.; Chen, H.X.; Chen, J.; et al. Contrasting effects of straw and straw-derived biochar application on net global warming potential in the Loess Plateau of China. Field Crops Res. 2017, 205, 45–54. [Google Scholar] [CrossRef]
- American Association of State Highway and Transportation Officials. Standard Method of Test for Direct Shear Test of Soil under Consolidated Drained Conditions. T 236–92; AASHTO: Washington, DC, USA, 2001. [Google Scholar]
- Nanjing Hydraulic Research Institute. Test Code for Soil—Direct Shear Test. SL 237–021; China Water Power Press: Beijing, China, 1999. [Google Scholar]
- Cheng, W.C.; Xue, Z.F.; Wang, L.; Liu, N.; Xu, J.; Horpibulsuk, S. Recent massive incidents for subway construction in soft alluvial deposits of Taiwan: A review. Tunn. Undergr. Space Technol. 2020, 96, 103178. [Google Scholar] [CrossRef]
- Chen, F.; Wang, L.; Zhang, W. Reliability assessment on stability of tunneling perpendicularly beneath an existing tunnel considering spatial variabilities of rock mass properties. Tunn. Undergr. Space Technol. 2019, 88, 276–289. [Google Scholar] [CrossRef]
- Xiang, Y.; Liu, H.; Zhang, W.; Chu, J.; Zhou, D.; Xiao, Y. Application of transparent soil model test and DEM simulation in study of tunnel failure mechanism. Tunn. Undergr. Space Technol. 2018, 74, 178–184. [Google Scholar] [CrossRef]
Figure 1.
Residential house built from loess-PHW mixture: (a) location of Chinese Loess Plateau, (b) house wall and (c) enlargement of house wall.
Figure 1.
Residential house built from loess-PHW mixture: (a) location of Chinese Loess Plateau, (b) house wall and (c) enlargement of house wall.

Figure 2.
Particle-size distribution curves for material used in direct shear tests.

Figure 3.
Loess sampling and hot water treatment: (a) sampling location, (b) water bath apparatus, (c) water bath tank, (d) four sub-tanks and (e) post-harvest waste (PHW) before (right-hand side) and after (left-hand side) treatment.
Figure 3.
Loess sampling and hot water treatment: (a) sampling location, (b) water bath apparatus, (c) water bath tank, (d) four sub-tanks and (e) post-harvest waste (PHW) before (right-hand side) and after (left-hand side) treatment.

Figure 4.
Schematic illustration of direct shear method: (a) large-scale direct shear (LSDS) apparatus and (b) enlargement of shear box.
Figure 4.
Schematic illustration of direct shear method: (a) large-scale direct shear (LSDS) apparatus and (b) enlargement of shear box.

Figure 5.
Results of repeatability tests for the small-scale direct shear (SSDS) test: (a) specimen at the water content of 14% and (b) specimen at the water content of 18%.
Figure 5.
Results of repeatability tests for the small-scale direct shear (SSDS) test: (a) specimen at the water content of 14% and (b) specimen at the water content of 18%.

Figure 6.
Shear stress-relative horizontal displacement relationships from SSDS tests on the loess-PHW specimens at ω = 14%: (a) %PHW = 0 and (b) %PHW = 0.3.
Figure 6.
Shear stress-relative horizontal displacement relationships from SSDS tests on the loess-PHW specimens at ω = 14%: (a) %PHW = 0 and (b) %PHW = 0.3.


Figure 7.
Shear stress-relative horizontal displacement relationships from LSDS tests on the loess-PHW specimens at ω=14%: (a) %PHW = 0 and (b) %PHW = 0.45.
Figure 7.
Shear stress-relative horizontal displacement relationships from LSDS tests on the loess-PHW specimens at ω=14%: (a) %PHW = 0 and (b) %PHW = 0.45.

Figure 8.
Typical shear stress-horizontal displacement curves.

Figure 9.
Comparison of friction angle between SSDS and LSDS.

Figure 10.
Comparison of relative horizontal displacement (RHD) at failure between SSDS and LSDS for three different water contents.
Figure 10.
Comparison of relative horizontal displacement (RHD) at failure between SSDS and LSDS for three different water contents.

Figure 11.
Variation of loess height, unit weight and friction angle from LSDS at %PHW of 0.45, 0.6, 0.75 and 1.0: (a) specimen at ω = 14%, (b) specimen at ω = 18% and (c) specimen at ω = 22%.
Figure 11.
Variation of loess height, unit weight and friction angle from LSDS at %PHW of 0.45, 0.6, 0.75 and 1.0: (a) specimen at ω = 14%, (b) specimen at ω = 18% and (c) specimen at ω = 22%.


Figure 12.
Vertical displacement at front and rear of the shear box versus relative horizontal displacement (RHD) considering three normal pressures of 100, 200 and 300 kPa: (a) specimen at ω = 18% and (b) specimen at ω = 22%.
Figure 12.
Vertical displacement at front and rear of the shear box versus relative horizontal displacement (RHD) considering three normal pressures of 100, 200 and 300 kPa: (a) specimen at ω = 18% and (b) specimen at ω = 22%.


Table 1.
Physical properties of tested loess soils.
| Sample | Uniformity Coefficient Cu | Coefficient of Gradation Cc | % Silt and Clay | % Sand | % Gravel | Unit Weight γd (kN/m3) | USCS Symbol |
|---|---|---|---|---|---|---|---|
| S1a | 9.26 | 1.94 | 74.46 | 6.57 | 0 | 13.72 | ML |
| S1b | 10.48 | 2.13 | 73.79 | 7.88 | 0 | 13.60 | ML |
| S1c | 15.26 | 2.79 | 71.68 | 5.95 | 0 | 13.83 | ML |
Note: USCS represents the abbreviation of the Unified Soil Classification System.
Table 2.
Shear strength parameters for six replicate tests in SSDS.
| Specimenno. | Cohesion c′ (kPa) | Friction Angle ϕ′ (°) | Coefficient of Determination R2 |
|---|---|---|---|
| SS14-1 | 75.64 | 22.0 | 0.996 |
| SS14-2 | 78.54 | 22.3 | 0.997 |
| SS14-3 | 83.80 | 20.5 | 0.987 |
| SS18-1 | 51.61 | 18.5 | 0.999 |
| SS18-2 | 60.59 | 16.3 | 0.996 |
| SS18-3 | 57.45 | 17.5 | 0.999 |
| Average | 67.94 | 19.5 | 0.996 |
| Standard deviation | 11.93 | 2.2 | 0.004 |
Table 3.
Shear strength parameters of loess-PHW mixture specimens measured in direct shear tests.
| Specimen no. | SSDS | Specimen no. | LSDS | ||||
|---|---|---|---|---|---|---|---|
| c (kPa) | ϕ′ (°) | R2 | c (kPa) | ϕ′ (°) | R2 | ||
| SS14-0 | 79.4 | 22.1 | 0.997 | LS14-0 | 48.5 | 18.4 | 0.965 |
| SS14-0.3 | 73.6 | 21.6 | 0.998 | LS14-0.30 | 59.6 | 24.3 | 0.995 |
| SS14-0.45 | 59.6 | 30.4 | 0.972 | LS14-0.45 | 68.5 | 22.0 | 0.942 |
| SS14-0.6 | 73.2 | 23.9 | 0.914 | LS14-0.60 | 44.8 | 29.3 | 0.999 |
| SS14-0.75 | 60.9 | 16.3 | 0.986 | LS14-0.75 | 65.8 | 20.3 | 0.961 |
| SS18-0 | 66.1 | 11.7 | 0.974 | LS18-0 | 40.7 | 20.1 | 0.977 |
| SS18-0.3 | 46.3 | 23.0 | 0.962 | LS18-0.30 | 54.3 | 23.7 | 0.999 |
| SS18-0.45 | 60.7 | 21.7 | 0.936 | LS18-0.45 | 36.9 | 22.4 | 0.906 |
| SS18-0.6 | 63.0 | 21.0 | 0.968 | LS18-0.60 | 40.3 | 28.1 | 0.966 |
| SS18-0.75 | 60.9 | 16.3 | 0.986 | LS18-0.75 | 28.2 | 22.2 | 0.976 |
| SS22-0 | 79.7 | 4.9 | 0.997 | LS22-0 | 16.4 | 21.4 | 0.987 |
| SS22-0.3 | 41.2 | 15.2 | 0.968 | LS22-0.30 | 39.8 | 21.1 | 0.986 |
| SS22-0.45 | 27.4 | 22.8 | 0.999 | LS22-0.45 | 39.2 | 16.3 | 0.930 |
| SS22-0.6 | 43.4 | 24.1 | 0.997 | LS22-0.60 | 30.2 | 22.2 | 0.999 |
| SS22-0.75 | 60.9 | 16.3 | 0.986 | LS22-0.75 | 31.7 | 15.3 | 0.990 |
Table 4.
Effect of PHW dosage on the improvement of friction angle ϕ’ measured in LSDS tests.
| Specimen no. | LSDS | ||
|---|---|---|---|
| ϕ′ (°) | R2 | γd (kN/m3) | |
| LS14-0 | 31.0 | 0.965 | 13.72 |
| LS14-0.45 | 22.0 | 0.942 | 14.07 |
| LS14-0.6 | 29.3 | 0.999 | 14.20 |
| LS14-0.75 | 20.3 | 0.961 | 14.32 |
| LS14-1 | 25.1 | 0.995 | 14.53 |
| LS18-0 | 20.1 | 0.977 | 13.72 |
| LS18-0.45 | 22.4 | 0.906 | 14.09 |
| LS18-0.6 | 28.1 | 0.966 | 14.21 |
| LS18-0.75 | 22.2 | 0.976 | 14.35 |
| LS18-1 | 27.1 | 0.995 | 14.56 |
| LS22-0 | 22.7 | 0.987 | 13.72 |
| LS22-0.45 | 16.3 | 0.930 | 14.10 |
| LS22-0.6 | 22.2 | 0.999 | 14.23 |
| LS22-0.75 | 15.3 | 0.990 | 14.37 |
| LS22-1 | 17.8 | 0.807 | 14.59 |
© 2019 by the authors. Licensee MDPI, Basel, Switzerland. This article is an open access article distributed under the terms and conditions of the Creative Commons Attribution (CC BY) license (http://creativecommons.org/licenses/by/4.0/).
Share and Cite
MDPI and ACS Style
Cheng, W.-C.; Xue, Z.-F.; Wang, L.; Xu, J. Using Post-Harvest Waste to Improve Shearing Behaviour of Loess and Its Validation by Multiscale Direct Shear Tests. Appl. Sci. 2019, 9, 5206. https://doi.org/10.3390/app9235206
AMA Style
Cheng W-C, Xue Z-F, Wang L, Xu J. Using Post-Harvest Waste to Improve Shearing Behaviour of Loess and Its Validation by Multiscale Direct Shear Tests. Applied Sciences. 2019; 9(23):5206. https://doi.org/10.3390/app9235206
Chicago/Turabian StyleCheng, Wen-Chieh, Zhong-Fei Xue, Lin Wang, and Jian Xu. 2019. "Using Post-Harvest Waste to Improve Shearing Behaviour of Loess and Its Validation by Multiscale Direct Shear Tests" Applied Sciences 9, no. 23: 5206. https://doi.org/10.3390/app9235206
Note that from the first issue of 2016, this journal uses article numbers instead of page numbers. See further details here.