Acoustic Emission Monitoring of Fatigue Crack Growth in Mooring Chains
by
 ,
,
Ángela Angulo
1,2,* ,
,
Jialin Tang
1,
Ali Khadimallah
1,
Slim Soua
1,
Cristinel Mares
2 and
Tat-Hean Gan
1,2 1
TWI Ltd., Condition and Structural Health Monitoring, Integrity Management Group. Granta Park, Great Abington, Cambridge CB21 6AL, UK
2
Brunel University London, Department of Mechanical Engineering, Kingston Lane, Uxbridge, Middlesex UB8 3PH, UK
*
Author to whom correspondence should be addressed.
Appl. Sci. 2019, 9(11), 2187; https://doi.org/10.3390/app9112187
Submission received: 11 March 2019
/
Revised: 14 May 2019
/
Accepted: 20 May 2019
/
Published: 28 May 2019
(This article belongs to the Special Issue Modelling, Simulation and Data Analysis in Acoustical Problems)
Abstract
:Featured Application
Structural health monitoring experimental methodology for crack initiation and crack growth analysis for damage detection in mooring chains using acoustic emission.
Abstract
Offshore installations are subject to perpetual fatigue loading and are usually very hard to inspect. Close visual inspection from the turret is usually too hazardous for divers and is not possible with remotely operated vehicles (ROVs) because of the limited access. Conventional nondestructive techniques (NDTs) have been used in the past to carry out inspections of mooring chains, floating production storage and offloading systems (FPSOs), and other platforms. Although these have been successful at detecting and assessing fatigue cracks, the hazardous nature of the operations calls for remote techniques that could be applied continuously to identify damage initiation and progress. The aim of the present work is to study the capabilities of acoustic emission (AE) as a monitoring tool to detect fatigue crack initiation and propagation in mooring chains. A 72-day large-scale experiment was designed for this purpose. A detailed analysis of the different AE signal time domain features was not conclusive, possibly due to the high level of noise. However, the frequency content of the AE signals offers a promising indication of fatigue crack growth.
1. Introduction
Offshore operators are constantly concerned by the safety and integrity of their assets, due to the high stakes involved. Ageing structures notably pose a significant threat to human lives and can incur exorbitant costs when unplanned shutdowns or catastrophic failures occur. Furthermore, in addition to the structural challenges that onshore structures experience, offshore assets withstand harsh marine environments as a result of severe storms, highly corroding sea water, seaquakes, and cyclic wave loading [1,2]. In this context, structural health monitoring (SHM) tools have been developed over the last few decades to mitigate such risks and offer continuous monitoring solutions that can be used in different industries.
One of the major problems in the design of offshore equipment is fatigue damage accumulation. Although this topic has been extensively studied in the literature, theoretically, numerically, and experimentally [3,4,5,6,7,8,9], the available inspection and monitoring technologies developed to date have not been able to fully overcome the severe environmental challenges associated with offshore service activities. Remotely operated vehicles (ROVs) have been widely used since the 1970s but face serious difficulties, despite technological advances, due to the highly unpredictable operating environment characterised by poor visibility and unstable conditions [10,11]. For fatigue damage detection in structural applications in general, several sensing techniques have been developed [12], including guided ultrasonic waves [13,14], fibre Bragg gratings [15,16,17], strain gauges [18], and piezoelectric sensors [19]. Acoustic emission (AE) has also been proposed as a potential solution to detect and monitor cracking in structures, such as vessels and pipelines [20] and bridges [21]. Roberts et al. [22] found a correlation between crack evolution rates and the AE count rates for a narrow range of loading in steel specimens subject to tension. Yu et al. [23] predicted the crack growth behaviour in compact tension steel specimens based on AE data. The AE data were filtered using specific techniques and obtained from AE sensors placed around the crack tip. The authors showed that an accurate life prediction model could be established when the absolute energy of the AE signals was analysed. Despite its limitations, it is now recognised that the AE technique is capable of monitoring fatigue crack initiation [24] and propagation [25] in steels and other metals.
Amongst the offshore assets that are vulnerable to corrosion-enhanced fatigue damage, mooring chains are one of the most crucial mooring components used in permanently anchored structures [26]. Despite their importance, limited experimental work on mooring chains exists in the literature. Studies have been carried out on the chains’ material microstructural properties [27,28], whereas others have been numerical modelling oriented [29]. Few large-scale testing attempts have been made. Rivera et al. [30] conducted a 4-month feasibility study to establish the AE technique’s capabilities in monitoring damage in mooring chain links subjected to stress corrosion cracking in artificial sea water. Although a metallurgical examination was not performed, the authors suggested that the AE technique has promising potential in monitoring fatigue cracking in mooring chains.
The present work is a continuation of a research programme [30,31,32] aimed at identifying the key AE signal features for the prediction of fatigue crack growth in mooring chain links. The primary goal of this study was to investigate the applicability of using ultrasonic guided waves (UGW) and AE approaches for detecting and monitoring crack initiation, location, and propagation on a mooring chain. The study shows preliminary modelling simulations using different finite element analysis (FEA) methods.
In this paper, in Section 2, a description of the full-scale test rig and the monitoring setup is presented. The results and discussion then follow before a brief conclusion. Due to the complexity of the experiment, a substantial amount of data was collected and analysed. For the purpose of simplicity and brevity, only the final outcomes relevant to the scope of this paper are presented.
2. Experimental Procedure
2.1. Test Rig Description
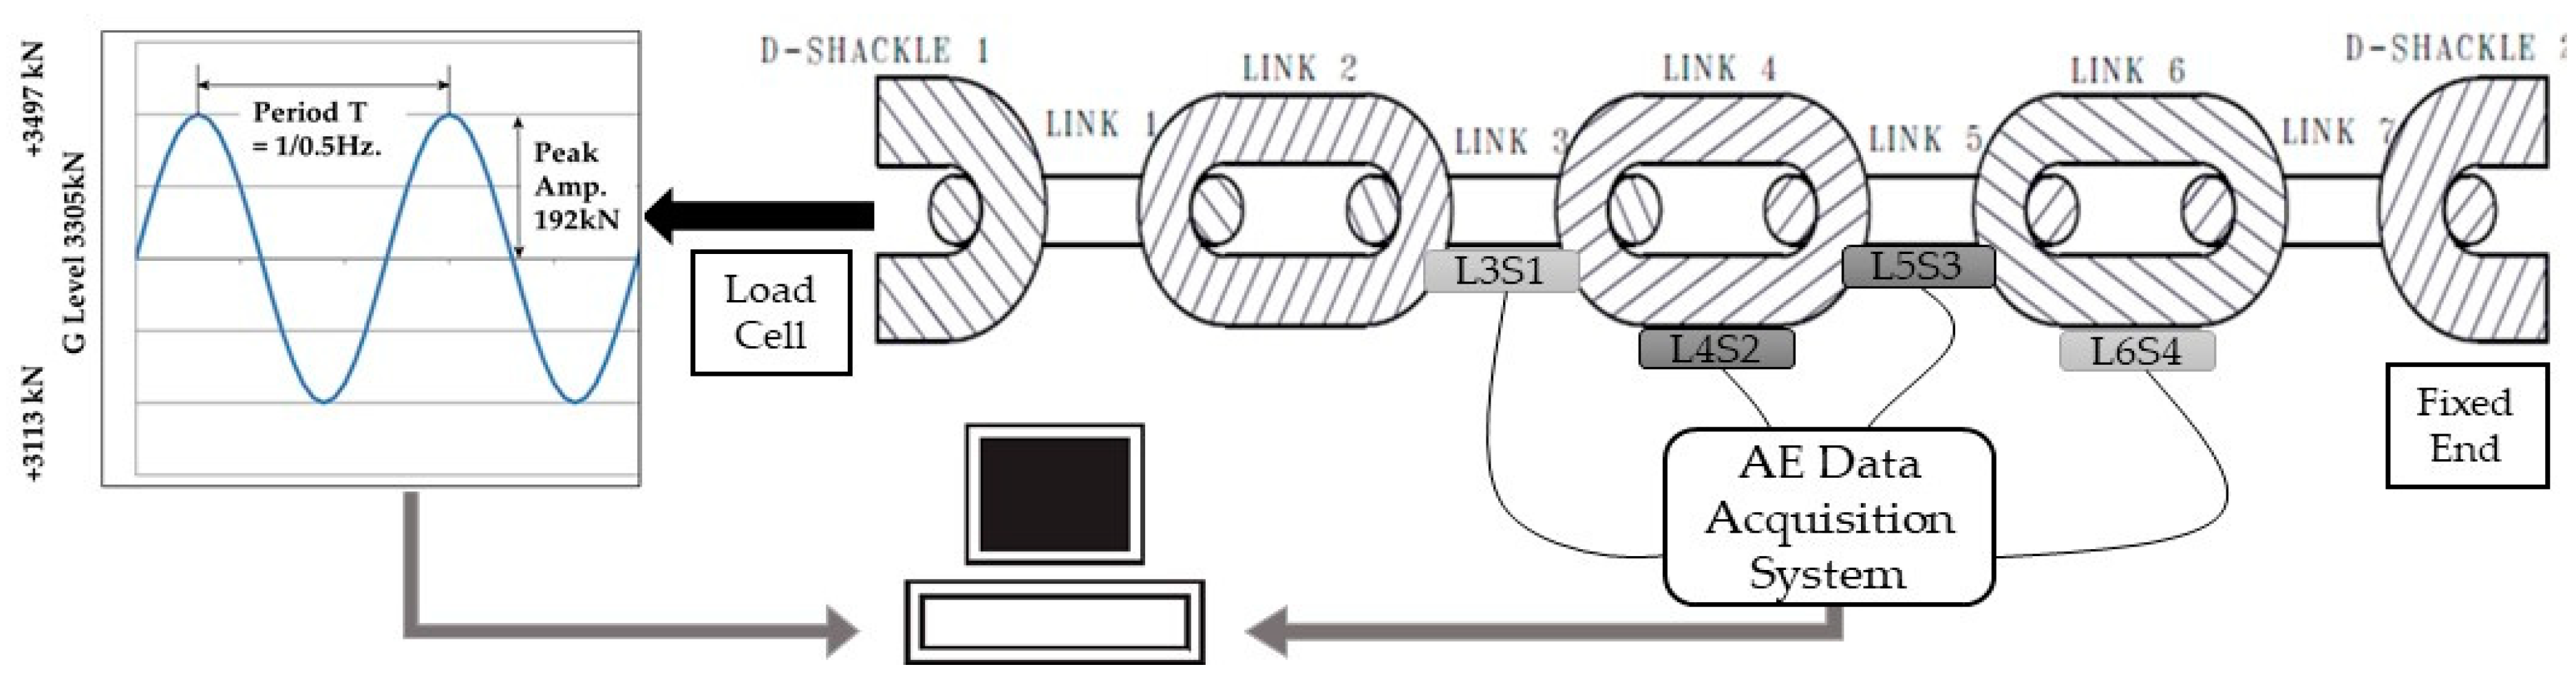
The experiment carried out was part of a large Joint Industry Project (JIP) research programme, which aimed to perform large-scale tests for the analysis of the fatigue performance of mooring chains in seawater. A full-scale fatigue test rig was arranged to perform the AE measurements. The setup was designed to test a short section of a chain made of 7 links in artificial seawater, with a link diameter of 127 mm and a maximum load capacity of 700 tons. The total length and width of the rig was 7.65 m and 2.2 m, respectively.
The chain was initially subjected to a tension of 1000 kN in order to calibrate the load cell. A cycling tensile loading ranging between 3113 kN and 3497 kN at 0.5 Hz frequency was applied during the 72-day experiment (Figure 1).
2.2. Hardware Selection and Sensor Deployment
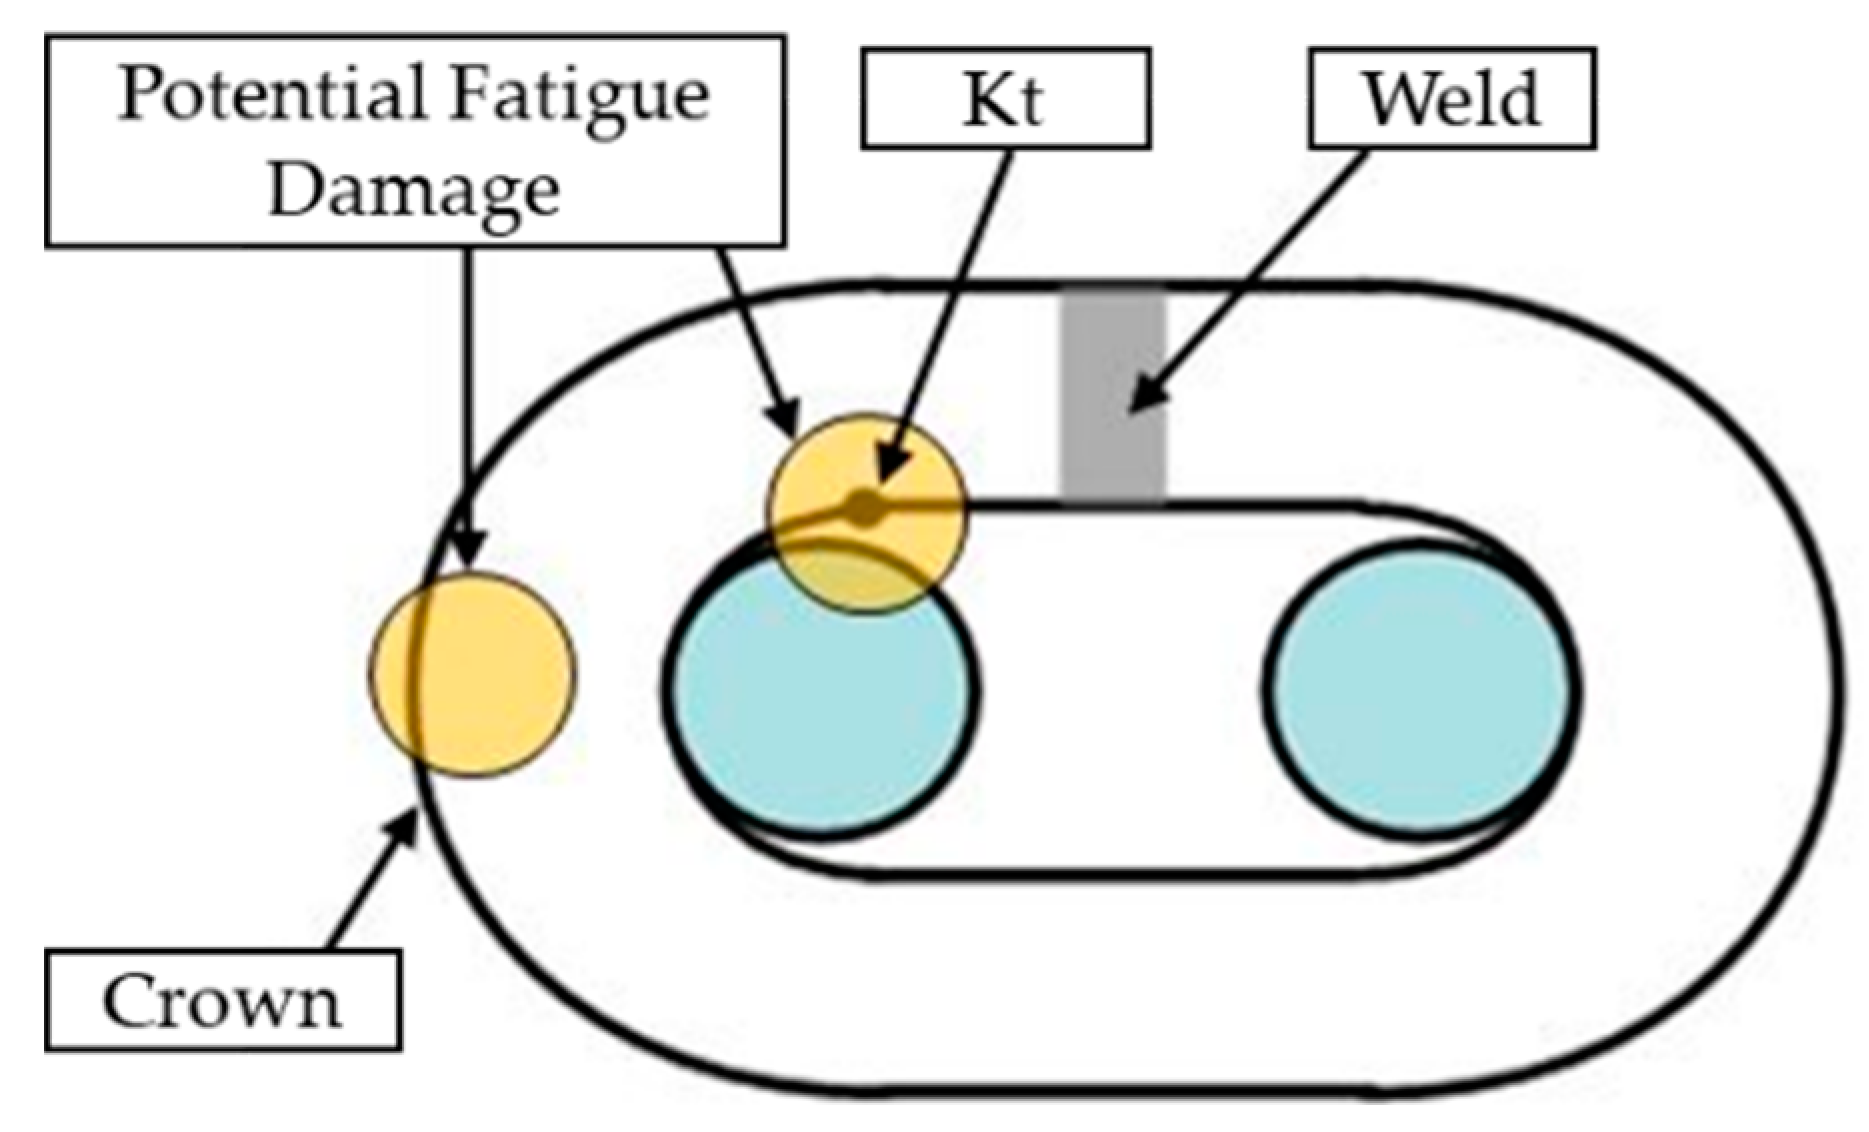
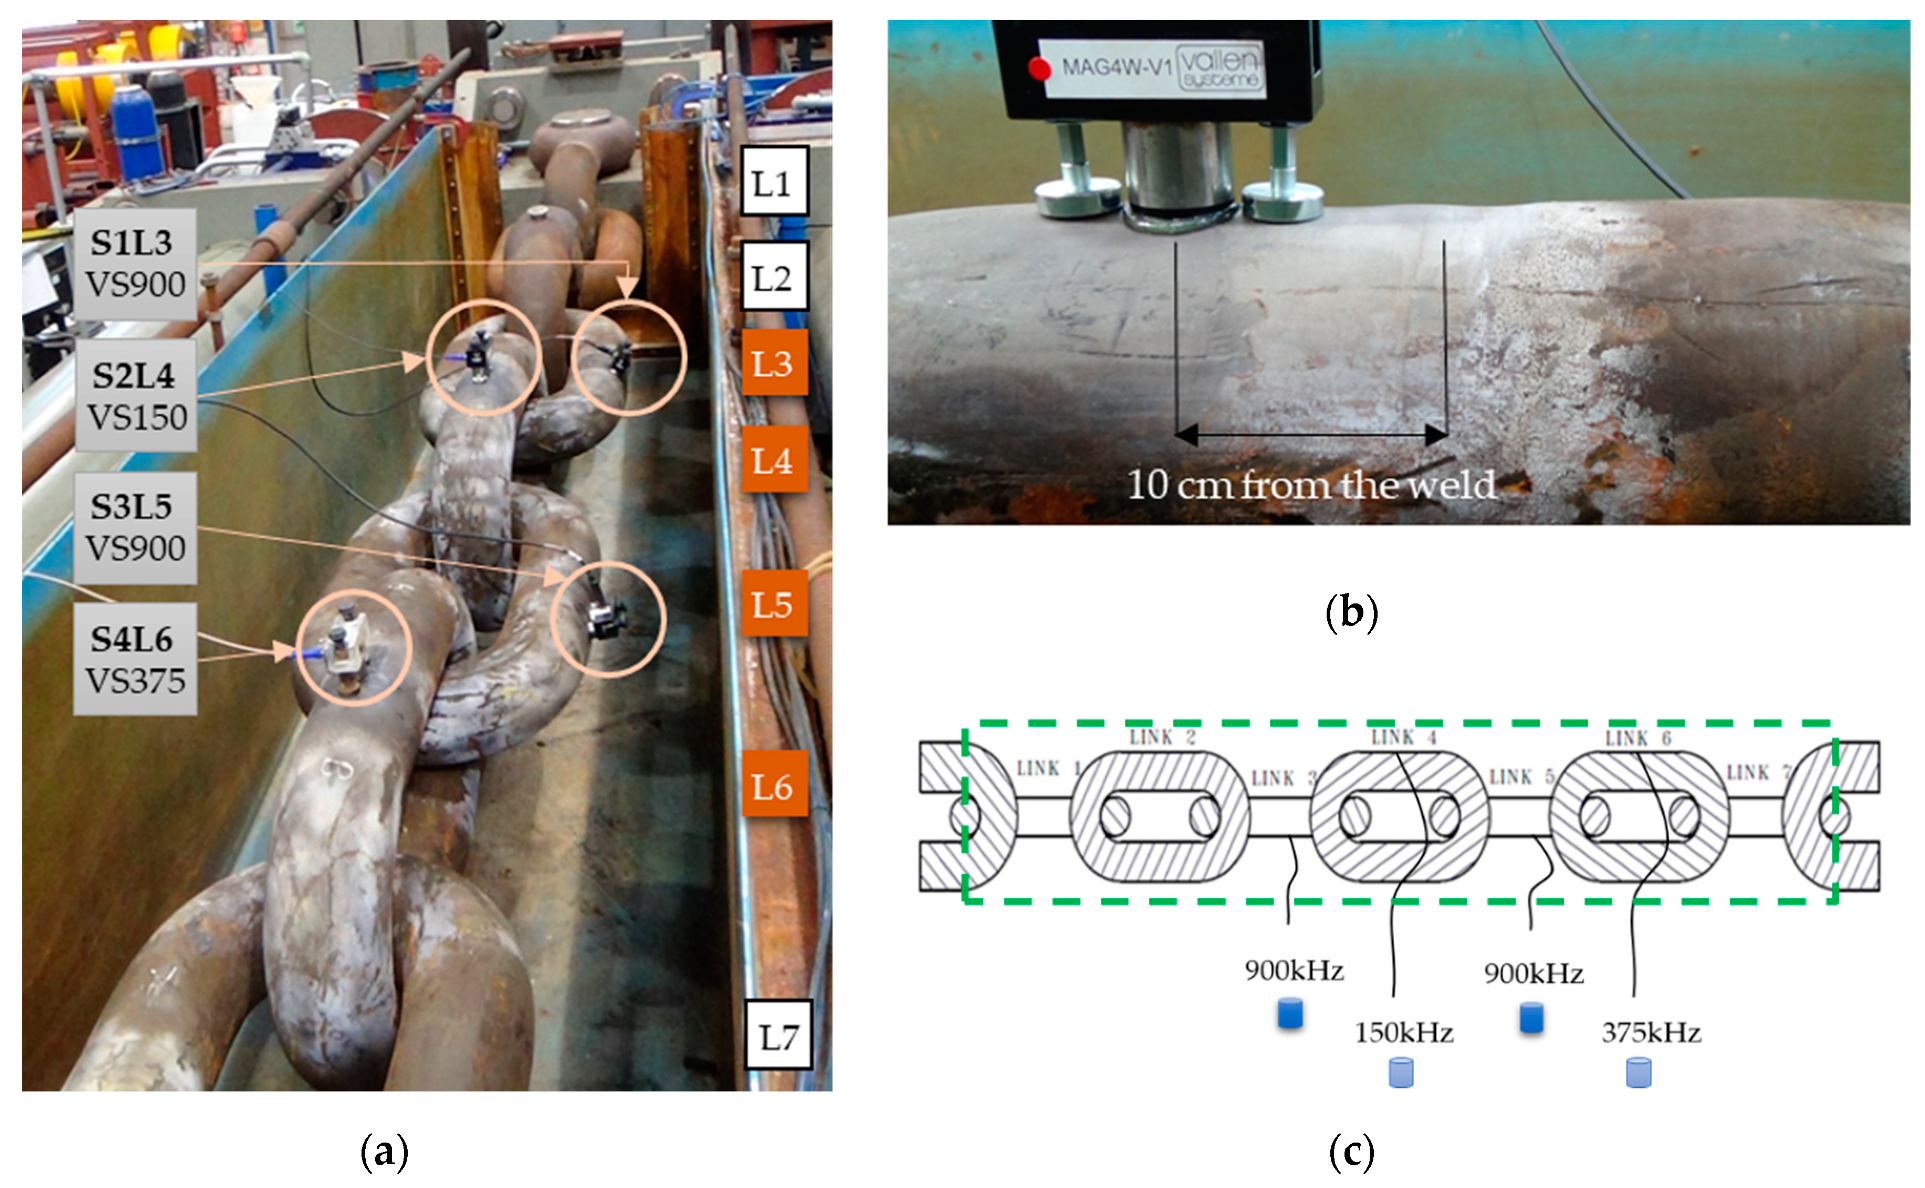
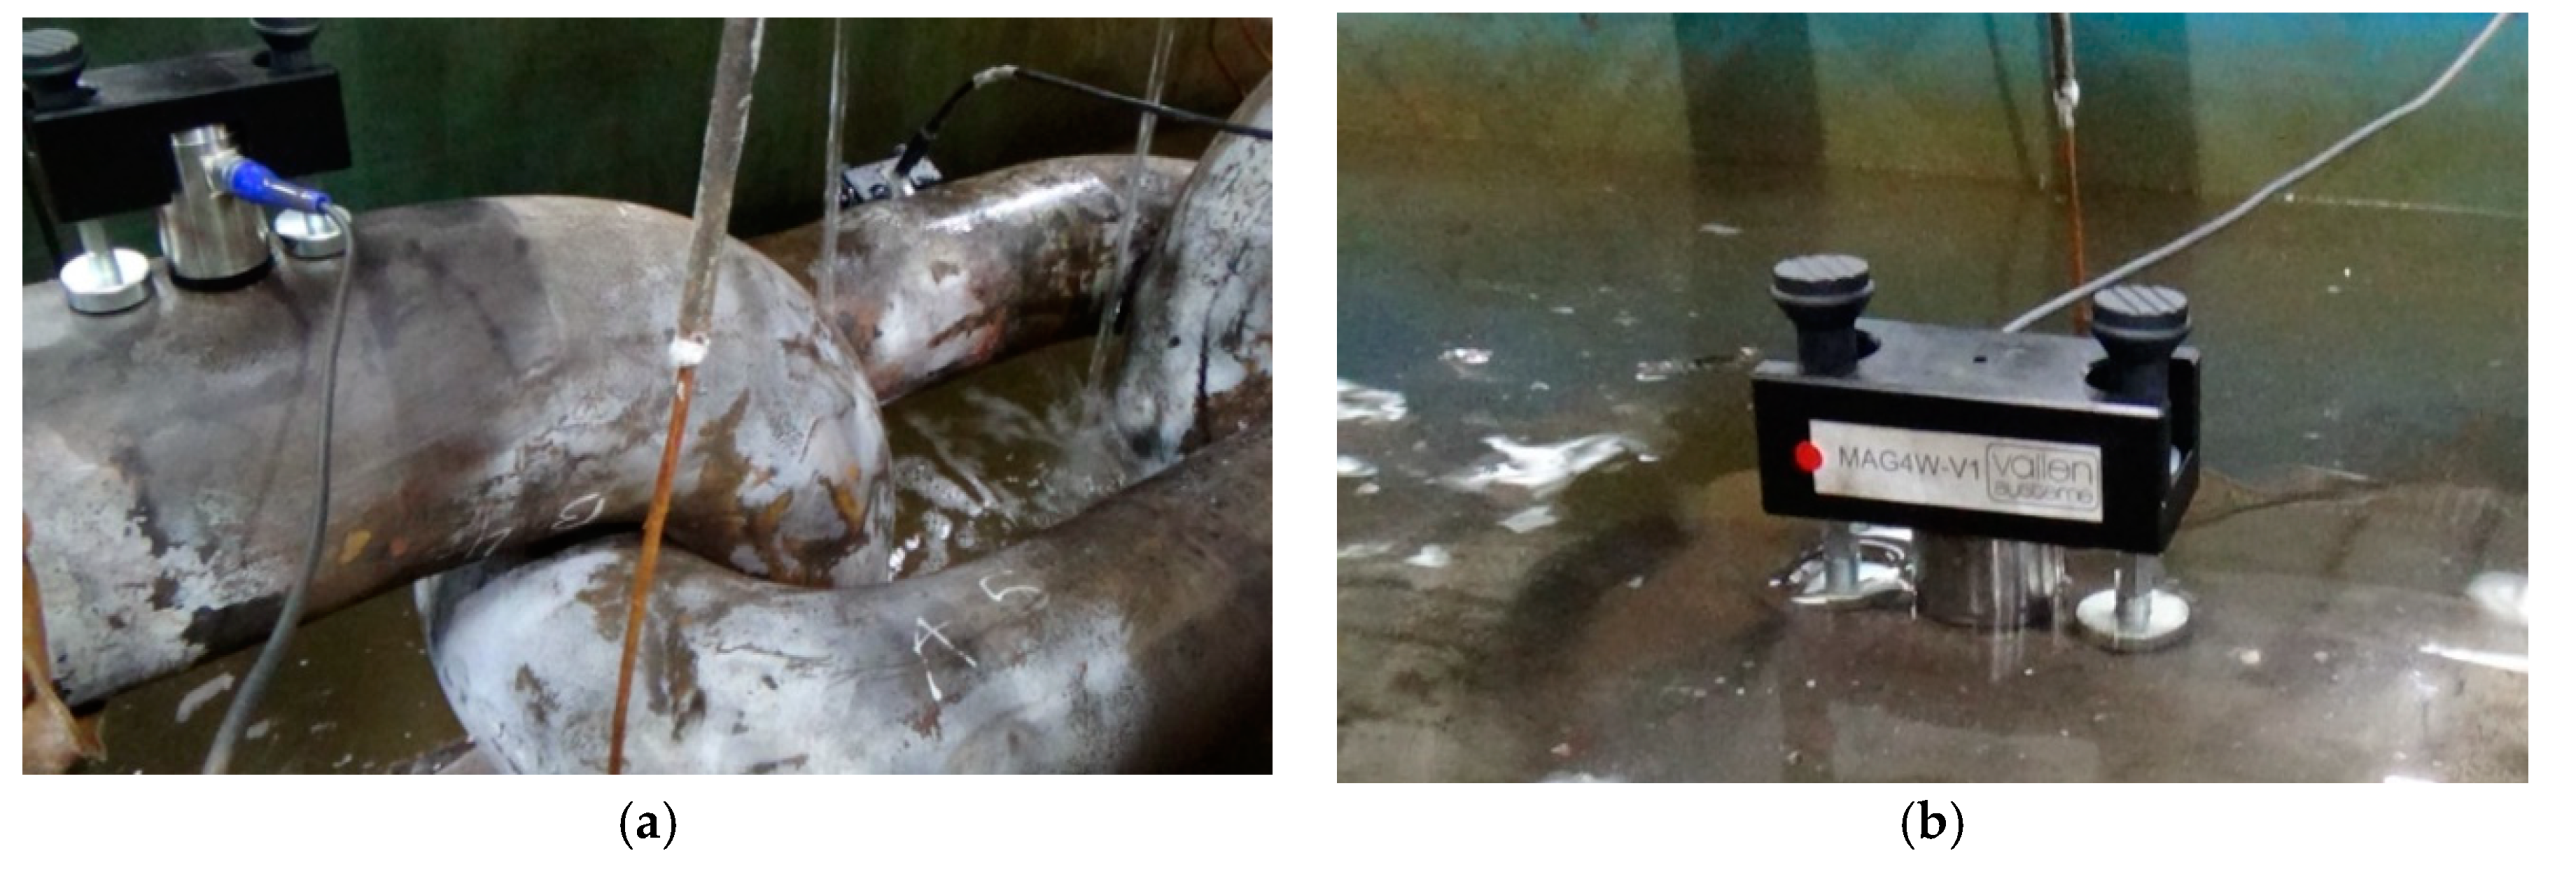
The AE data acquisition was performed using a Vallen AMSY-6 (Vallen Systeme GmbH, Icking, Germany) digital multi-channel AE-measurement system (ASIP-2 dual channel acoustic signal processor). Different AE sensors with different resonance frequencies and frequency bandwidths were tested: Vallen-VS150-WIC-V01 (resonant frequency 150 kHz, bandwidth 100–450 kHz), VS375-WIC-V01 (resonant frequency 375 kHz, bandwidth 250–700 kHz), and VS900-WIC-V01 (resonant frequency 350 kHz, bandwidth 100–900 kHz). It has been found [33,34] that chain failure most likely occurs at the point of the intrados (KT point) and crown positions, due to higher localised stresses in these areas (Figure 2). Therefore, on each link, the sensor was placed 10 cm away from the weld on an accessible side (Figure 3b). Each sensor was equipped with an integrated 34 dB pre-amplification. Four sensors were used on Links 3, 4, 5, and 6 (Figure 3a, and Figure 3c): one VS150, one VS375, and two VS900. A water-based couplant was used to facilitate the transmission of the sound signal between the transducer and the link’s surface. Links 1 and 7 were not monitored in the present setup.
The sensors used in this study had already been calibrated according to the American Society for Testing and Materials standard, ASTM E1106 [35], prior to the experiment to ensure the reliability of the collected signals. Since the experiments were to be performed with the chain submerged in water, the reproducibility of the AE sensors response was verified in air and underwater, according to ASTM E976 [36], by carefully breaking a 0.5 mm pencil lead against the link’s surface (the Pencil Lead Breakage (PLB) test). PLB, also known as the Hsu and Nielsen [37] pencil lead break, is a well-established technique and has long been used as a method to artificially generate reproducible AE signals [36]. Additionally, to verify the sensor coupling, the pulsing function was applied. Each sensor was used as a signal generator that sends signals to be intercepted by the rest of the sensors. These details are briefly summarised in Table 1.
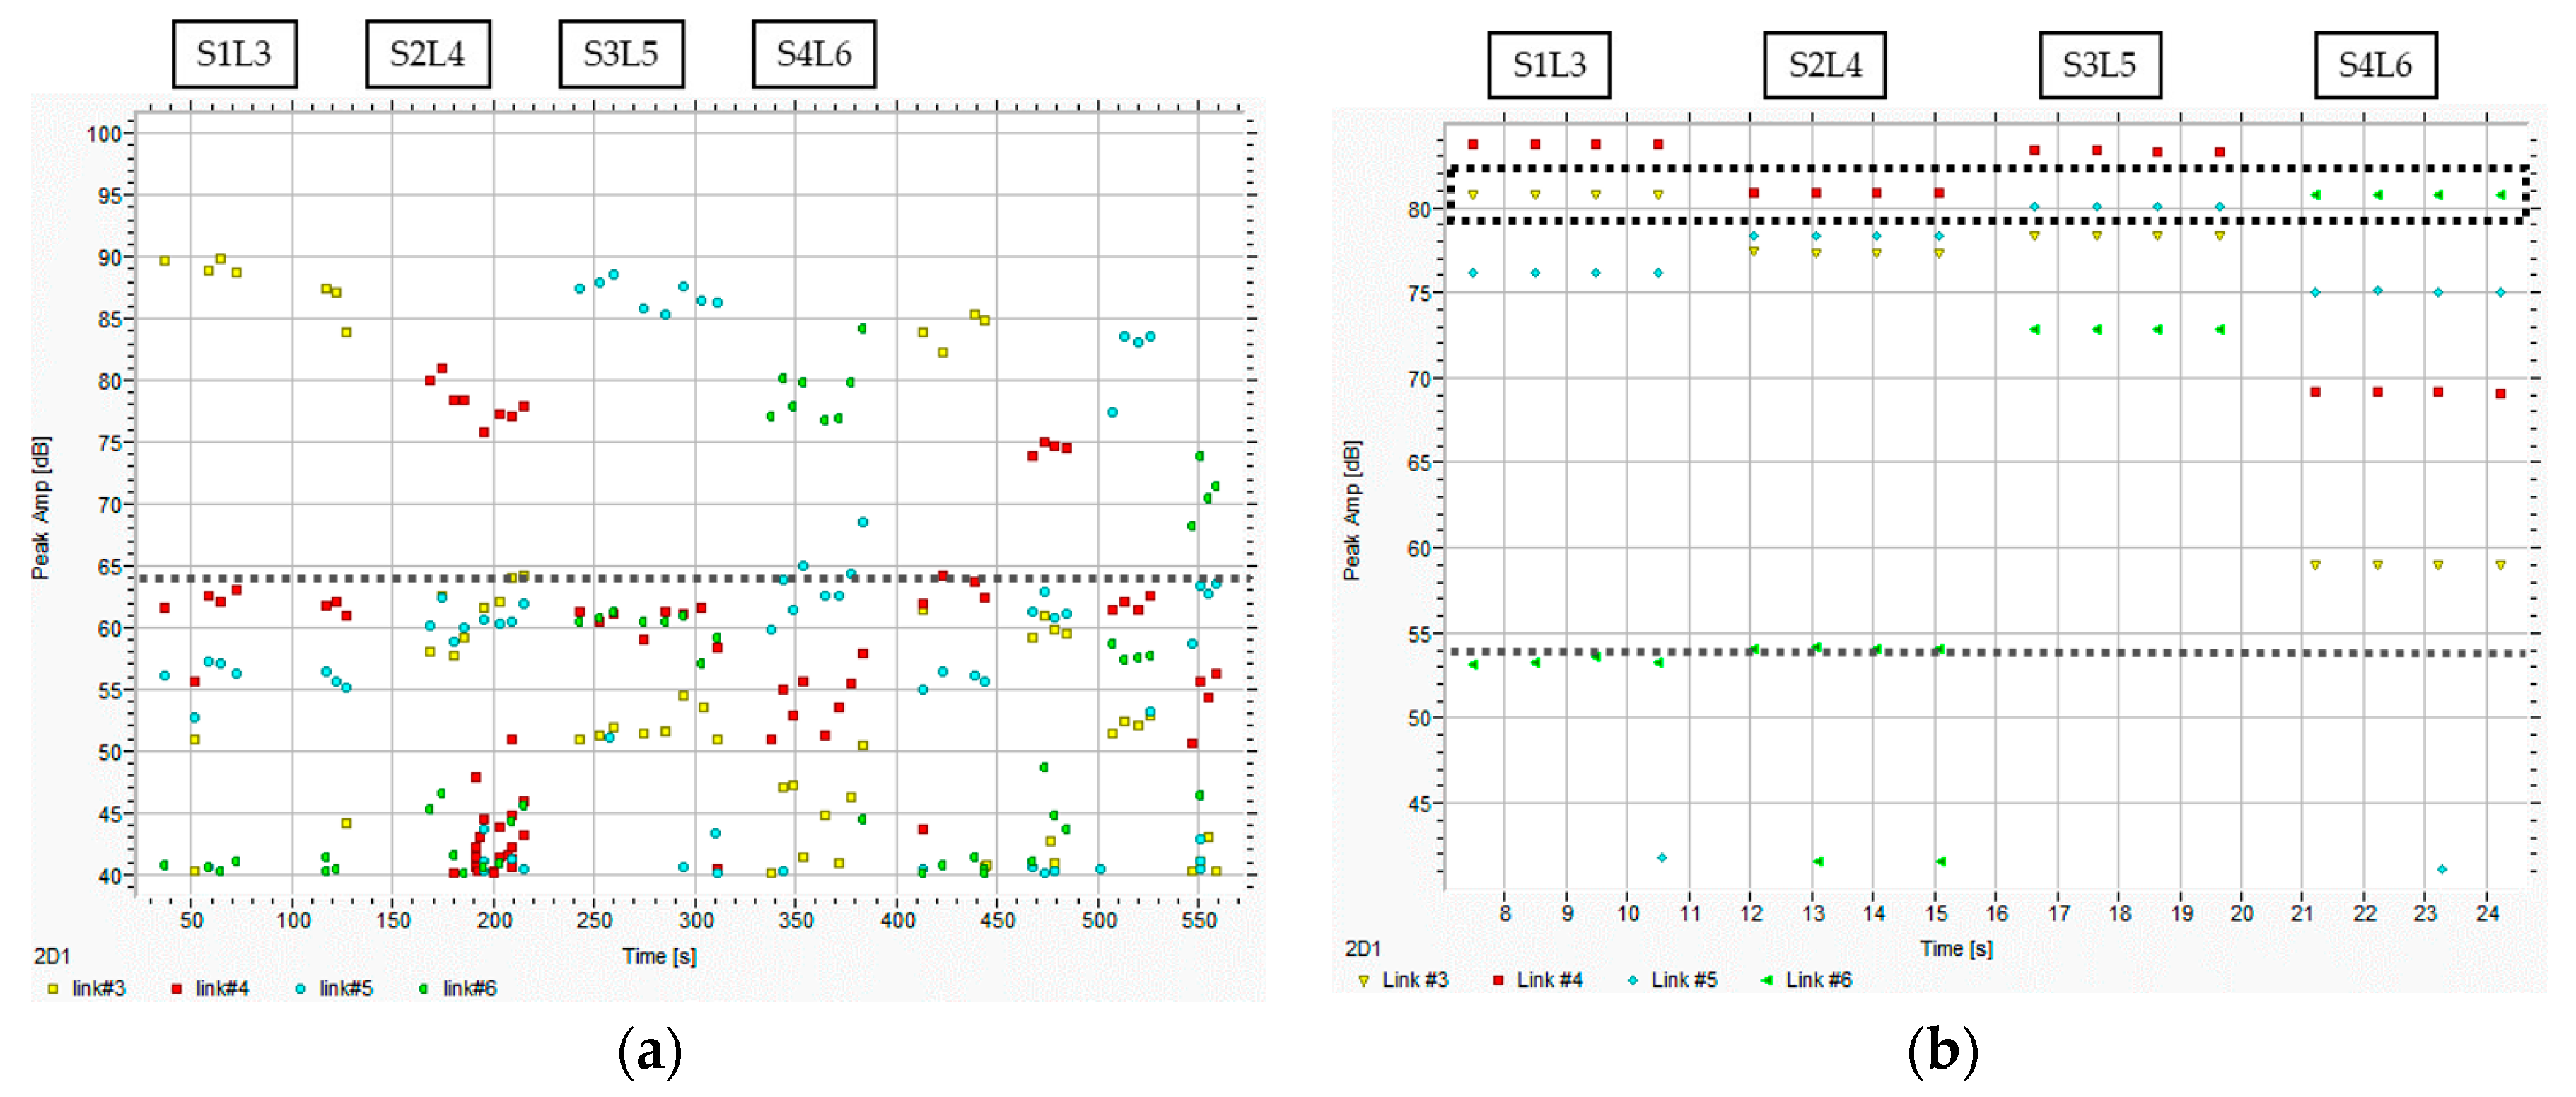
Figure 4 shows the results of the PLB calibration in air. Sensor 1 (S1), located on Link 3 (L3) and referred to as S1L3, and sensor S3L5 both correspond to the VS900 broadband AE sensor and seemed to receive higher dB levels of ~88 dB. For sensor S2L4 and sensor S4L6, corresponding respectively to VS150 and VS375, the dB levels received were approximately 10 dB lower at around 78 dB. From the figure, it is clear that the AE wave propagated through the links—the dB levels dropped to ~64 dB in the first adjacent link, ~54 dB in the second, and ~45 dB in the third (Figure 4a). Signal reproducibility was also demonstrated using the pulsing function. Each sensor generated four consecutive signals of peak amplitude equal to 81 dB (top rectangle in Figure 4b), which were intercepted by the rest of the sensors. As can be seen in Figure 4b, the wave was attenuated to a minimum of ~54 dB in the furthest sensor.
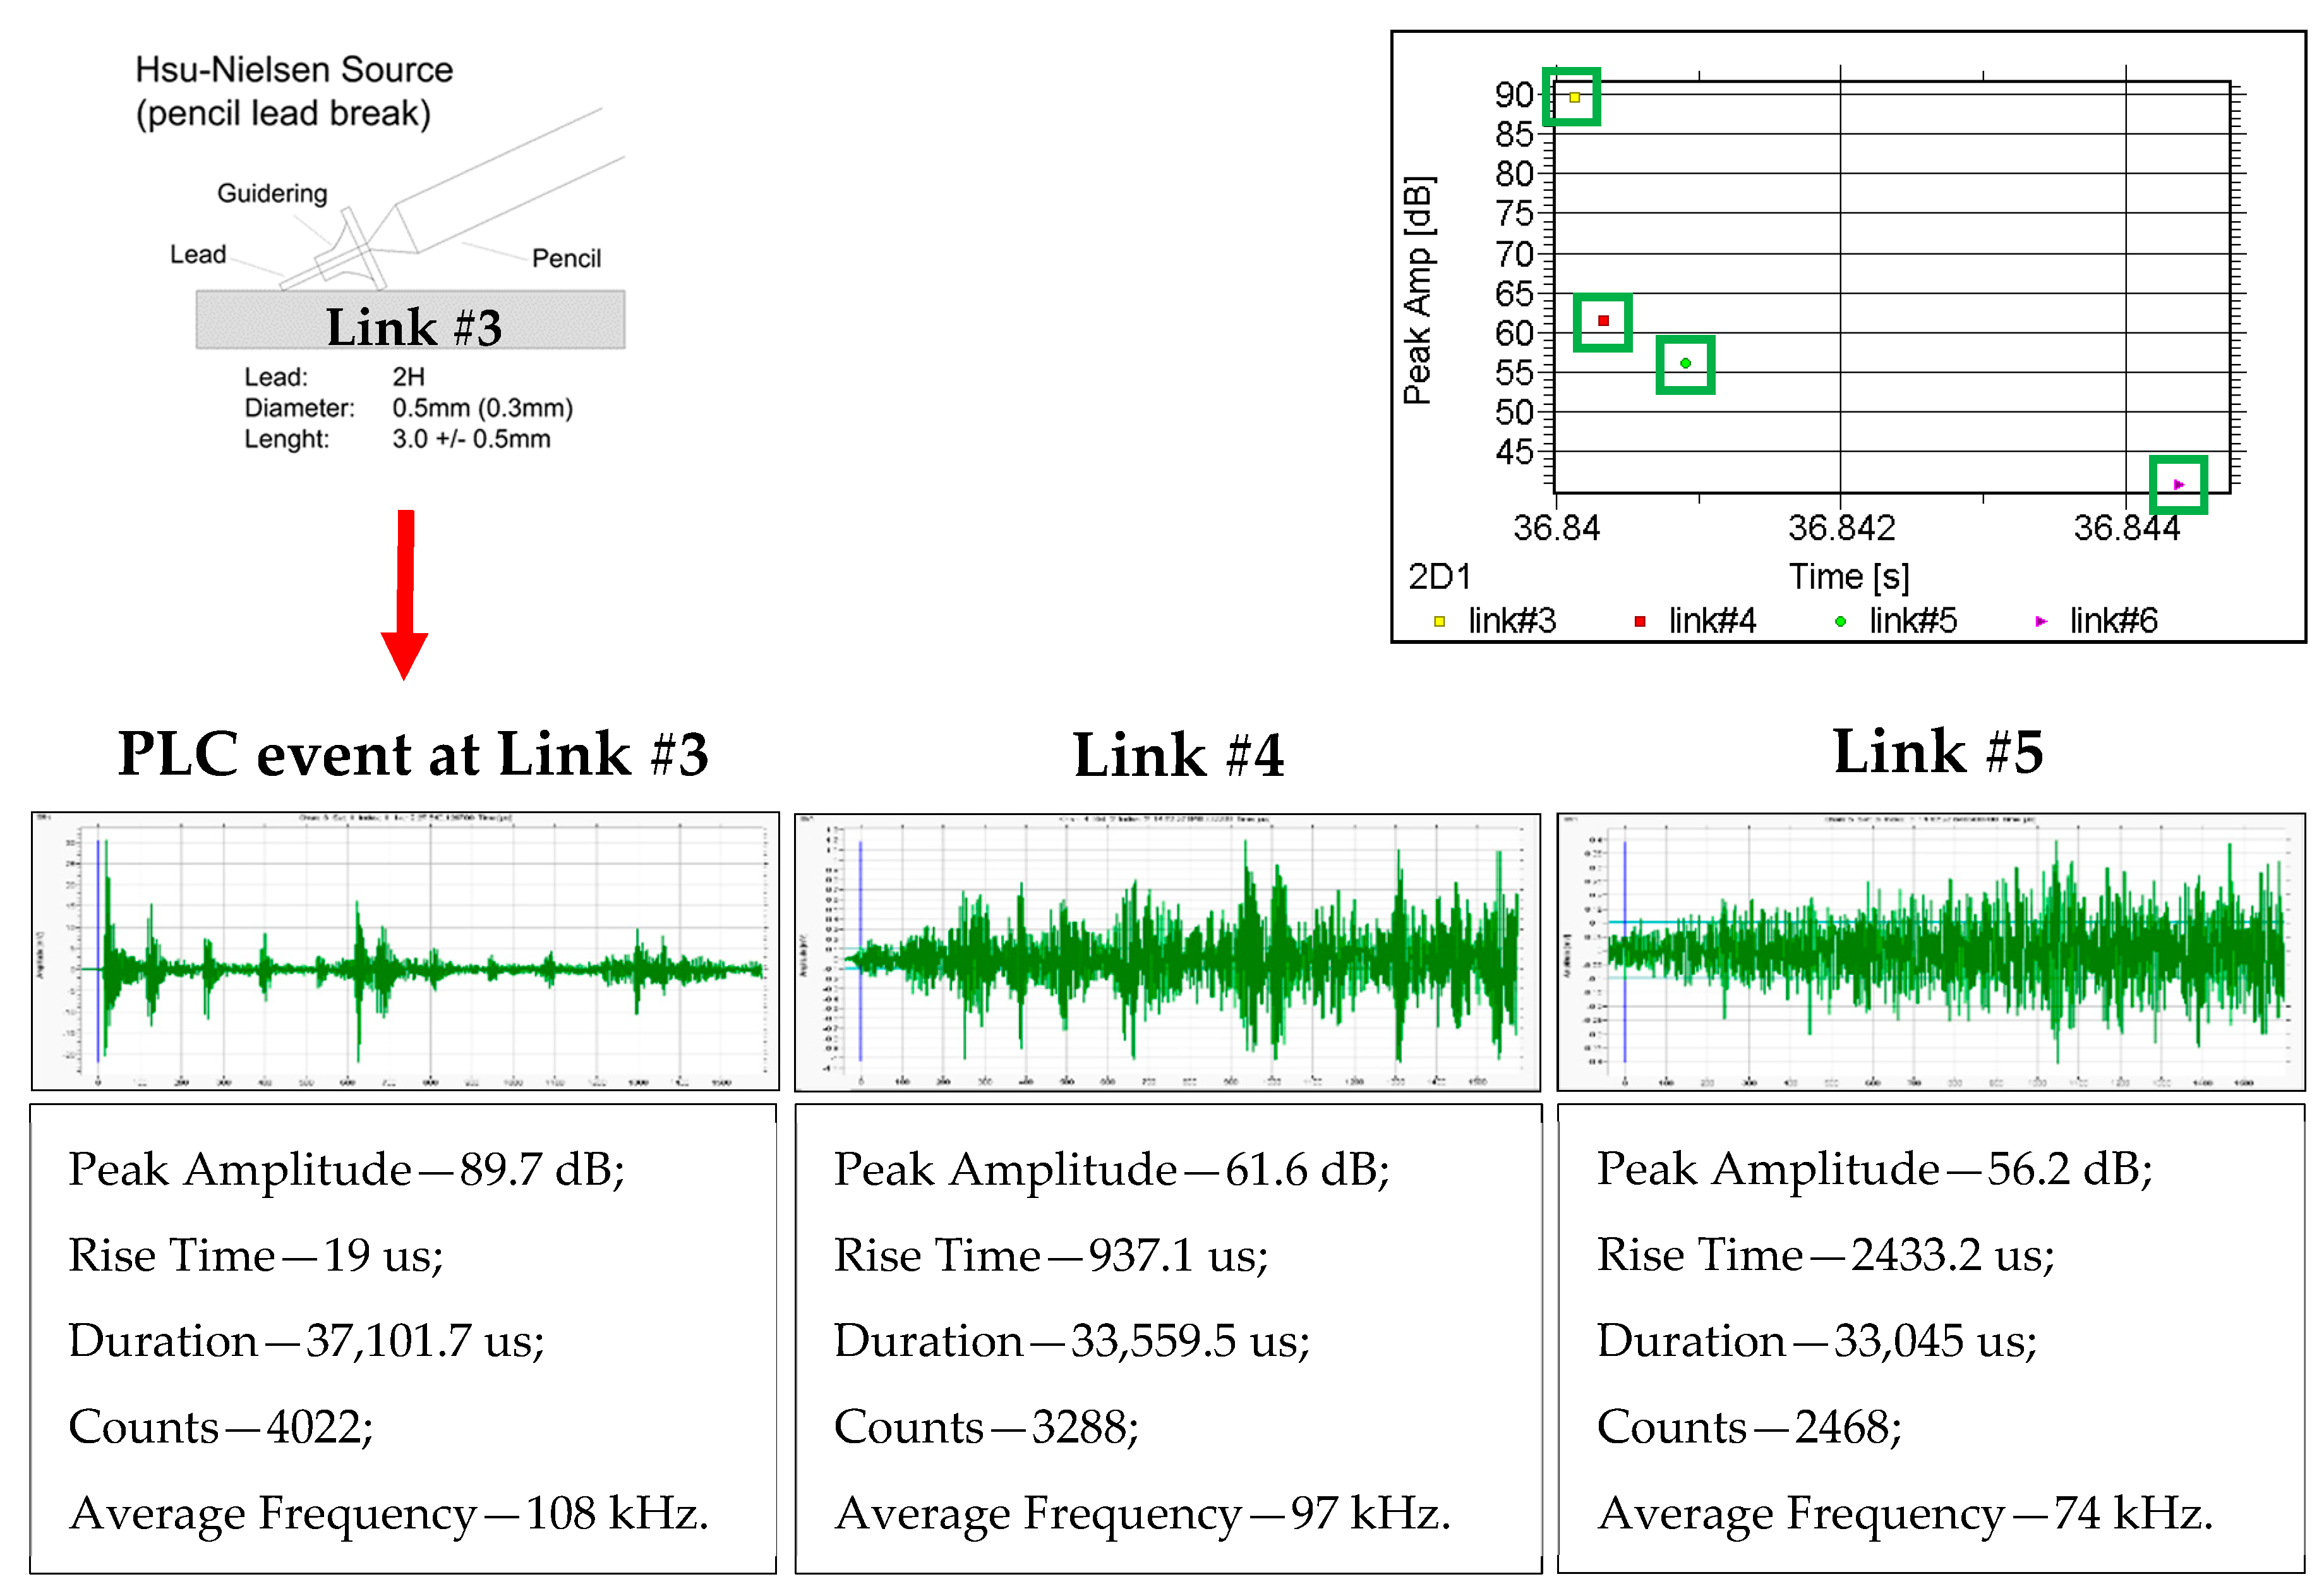
Figure 5 shows the behaviour of a wave generated in Link 3 from a PLB calibration event, where the peak amplitude of the signal ranges from ~90 dB in Link 3 to less than 45 dB in Link 6. The evolution of the other AE signal time domain features as the wave propagates through the chain links is shown in Figure 5. As the wave propagates through the links, the peak amplitude, number of counts, and average frequency decrease, whereas the rise time, duration, and time of arrival increase.
It should be noted that the signal reproducibility was also verified when the tank was being filled with water and the links were partially (almost completely) submerged (Figure 6).
In-air calibration was performed in order to understand in detail the propagation and resulting AE patterns across the links. The results obtained from underwater calibration during and after the tank filling was completed are similar to those obtained from the in-air calibration. However, due to the complexity of the setup, the values and conclusions acquired when full access was granted to the sensors’ positions (in-air) were considered as the final calibration results.
3. Results and Discussion
The total duration of the AE monitoring period was 72 days. Taking into account the findings of the reproducibility tests, the AE acquisition threshold was originally set at 45 dB. However, due to the large unsustainable level of events captured, mostly noise, the threshold was initially increased to 55 dB then finally to 60 dB within the first 24 h of the experiment. The data recorded in this experiment included the number of AE hits (number of emissions detected by the sensors) and AE time domain features, including the number of counts, energy, rise time, time of arrival, and duration, in addition to the load and displacement measured by the load cells. Sensors S1L3 and S4L6 failed during the first days of the experiment for unknown reasons and were not replaced. Only the data from S2L4 and S3L5 were considered in the present analysis.
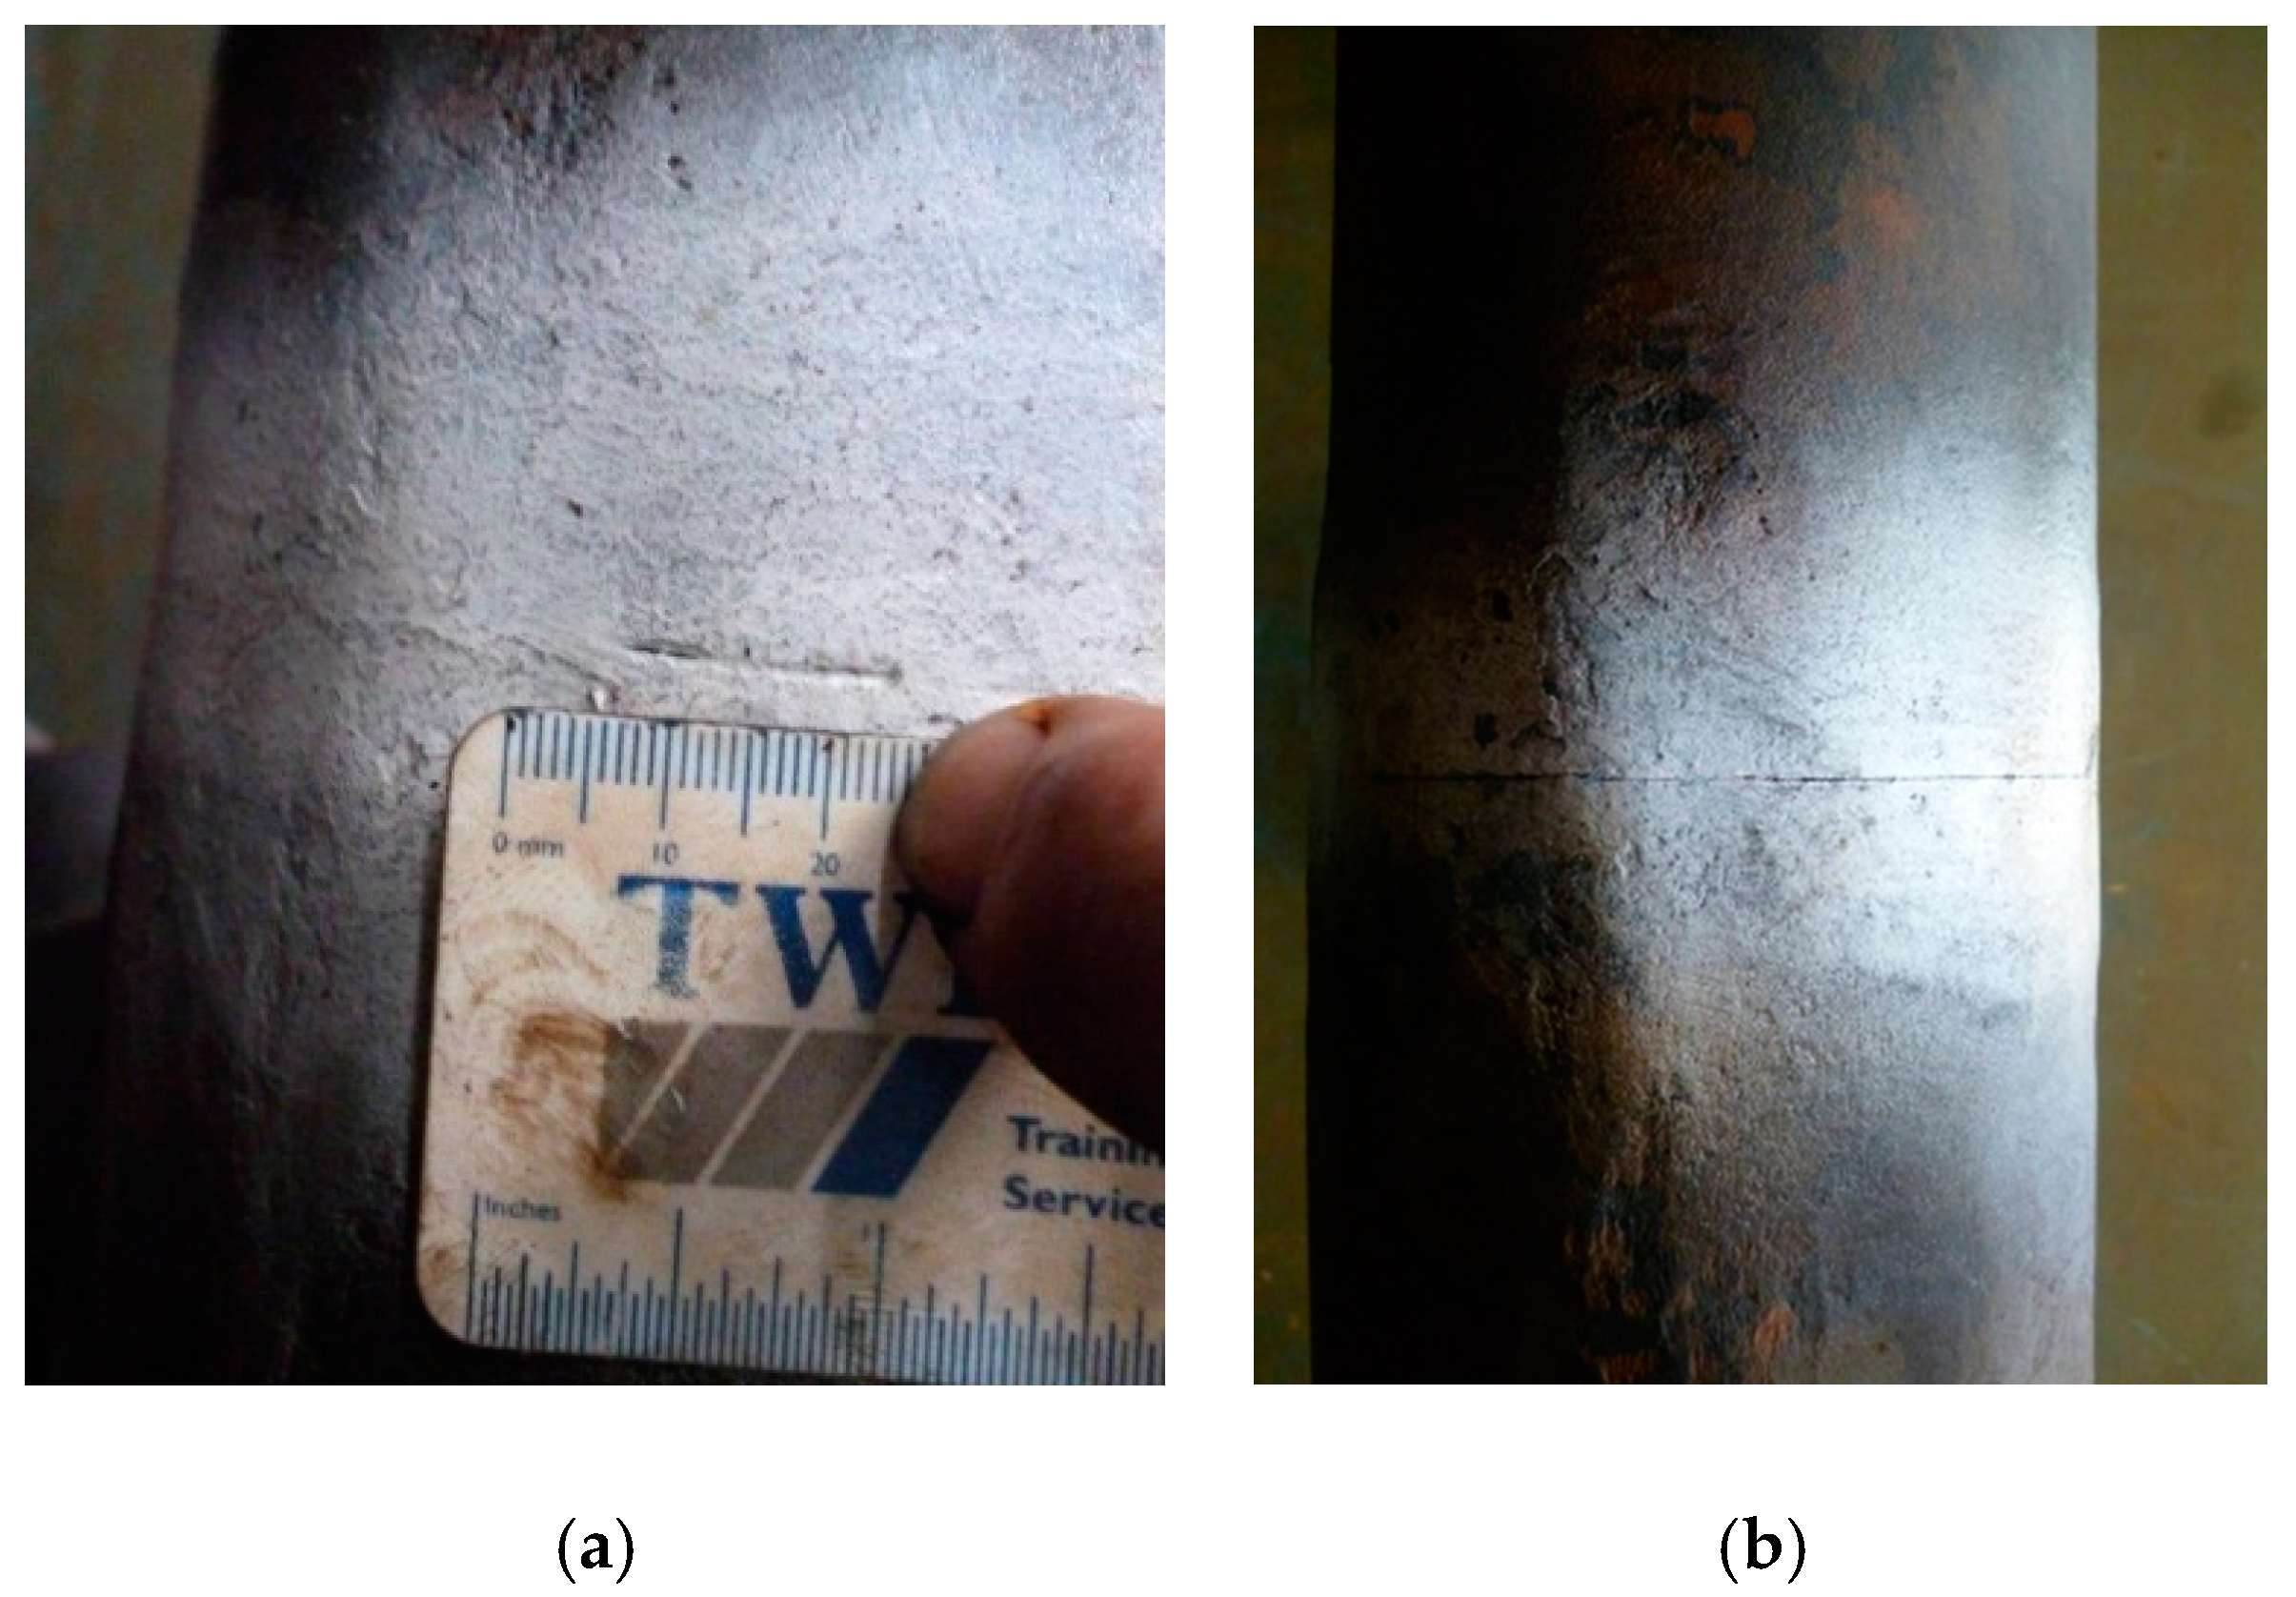
The first time the pre-set limit displacement was exceeded occurred after 4,333,424 cycles. After the water tank was fully drained, a complete inspection of the chain using visual inspection and magnetic particle inspection (MPI) revealed a ~5 mm crack located at the weld area in Link 3 (Figure 7a). No other indication of cracking was found, and the experiment was resumed. At 4,923,552 cycles, close to the fatigue life (5 × 10⁶ cycles when similar loading conditions are applied), the experiment was interrupted. A MPI inspection revealed that the same crack in Link 3 had grown to ~120 mm (Figure 7b). A complete inspection of the chain did not reveal any other cracks.
The crack of interest was revealed 31 days before the end of the experiment. It should be noted that a few interruptions occurred at the beginning of the experiment. Fortunately, these were during the early stages of the test and the information collected after day 41 can be considered accurate. For these reasons, only the AE data that were acquired during the last 31 days were processed. The key AE signal features were examined in an effort to establish correlations that would link the AE activity to the fatigue crack evolution. Some of the relationships considered were:
- Peak amplitude (dB) vs. load (kN): It was desirable to establish a correlation between the AE amplitude of the events detected and the loading state of the chain links;
- Number of hits vs. average frequency (kHz): The frequency analysis was performed in order to measure the characteristic central frequency and characterise the damage evolution;
- Cumulative energy vs. number of hits: The cumulative AE energy is associated with the cumulative energy of the AE hits. An increase in the cumulative energy’s slope may be related to the evolution of the damage [38].
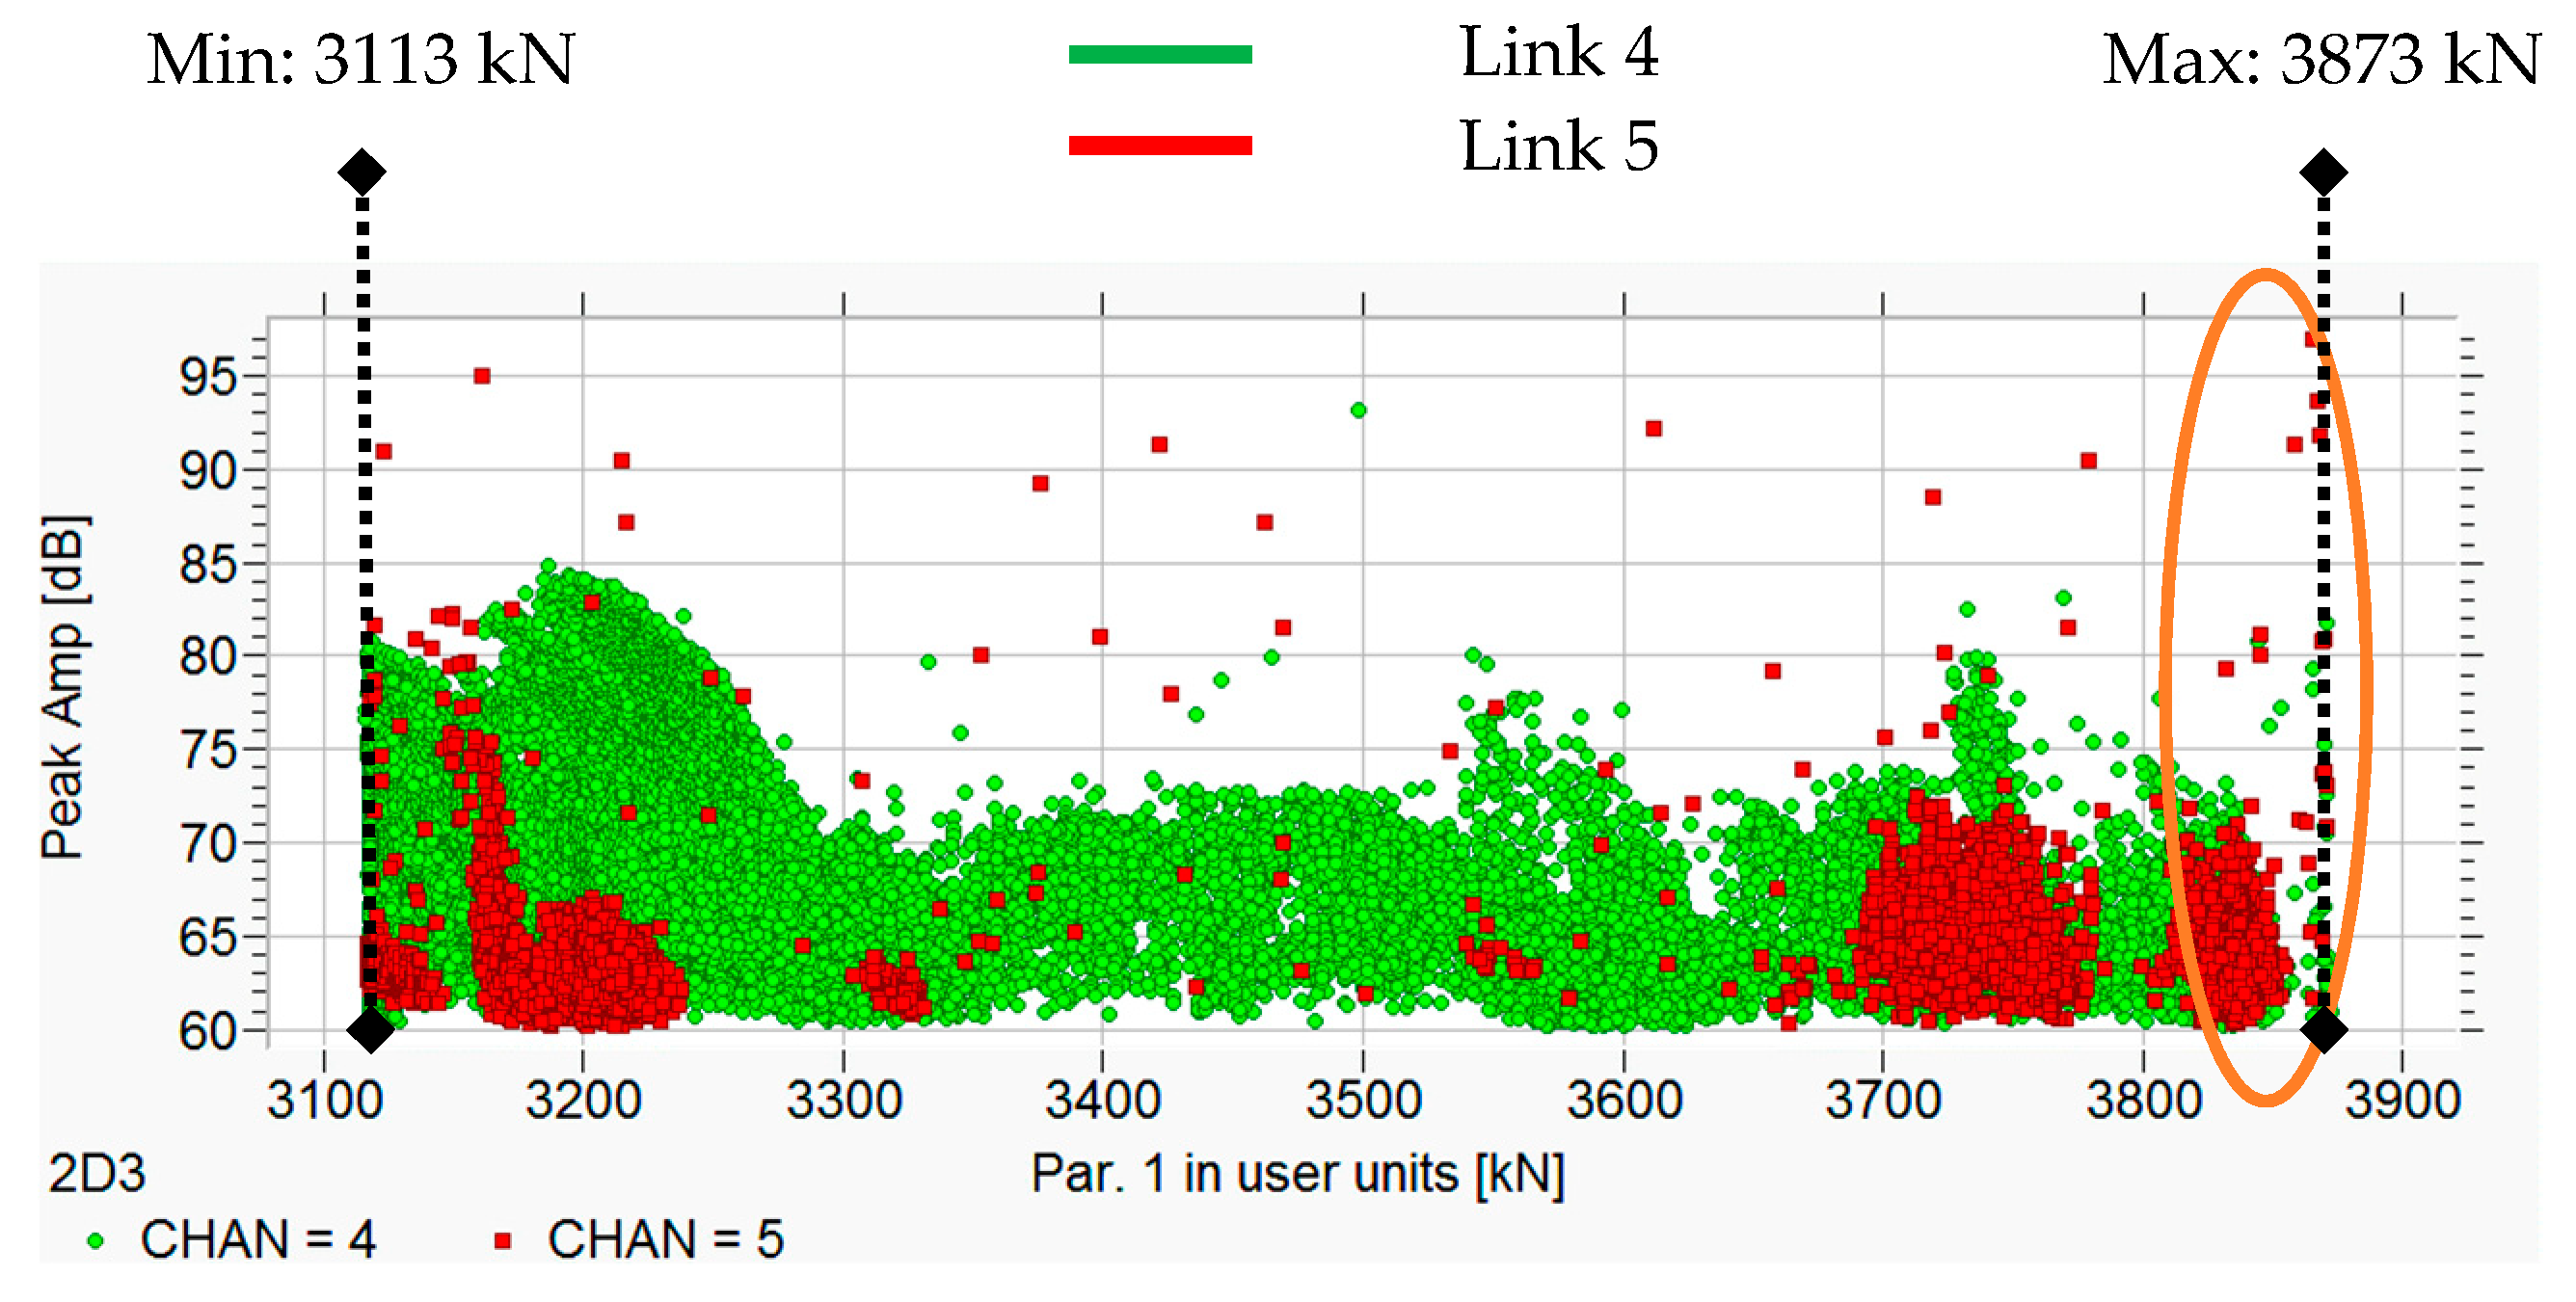
The AE signal features detected during the experiment were studied in detail. An example of the peak amplitude vs. load plot is shown in Figure 8. As can be seen in the figure, the events detected by the sensor attached to Link 5 are exclusively located within certain load ranges: 3150–3250 kN, 3700–3780 kN, and 3800–3850 kN. The corresponding events detected in Link 4 cannot be distinguished due to their uniform distribution. The location pattern of the red events without a clear connection to any cracking suggests they are most likely due to a mechanical noise, possibly caused by the test setup or surface friction where the links meet. It is usually accepted that in fatigue cracking, the AE signals generated close to the high end of the loading range are related to crack growth. Roberts et al. [22] showed that any correlation attempt was unsuccessful when the complete loading range was considered. Attributing the top 10 and 5% of the load range to crack growth improved the correlation to AE significantly. Bhuiyan et al. [39] associated different AE signal groups to the crack behaviour based on a spectral analysis of the AE data. The authors discovered that the AE events generated in the top 75–85% of the load range were statistically different from those below 60% and were related to the fatigue crack growth. In the present study, due to the large amount of noise generated by the full-scale experiment, only data collected above 3820 kN are shown to offer good correlations.
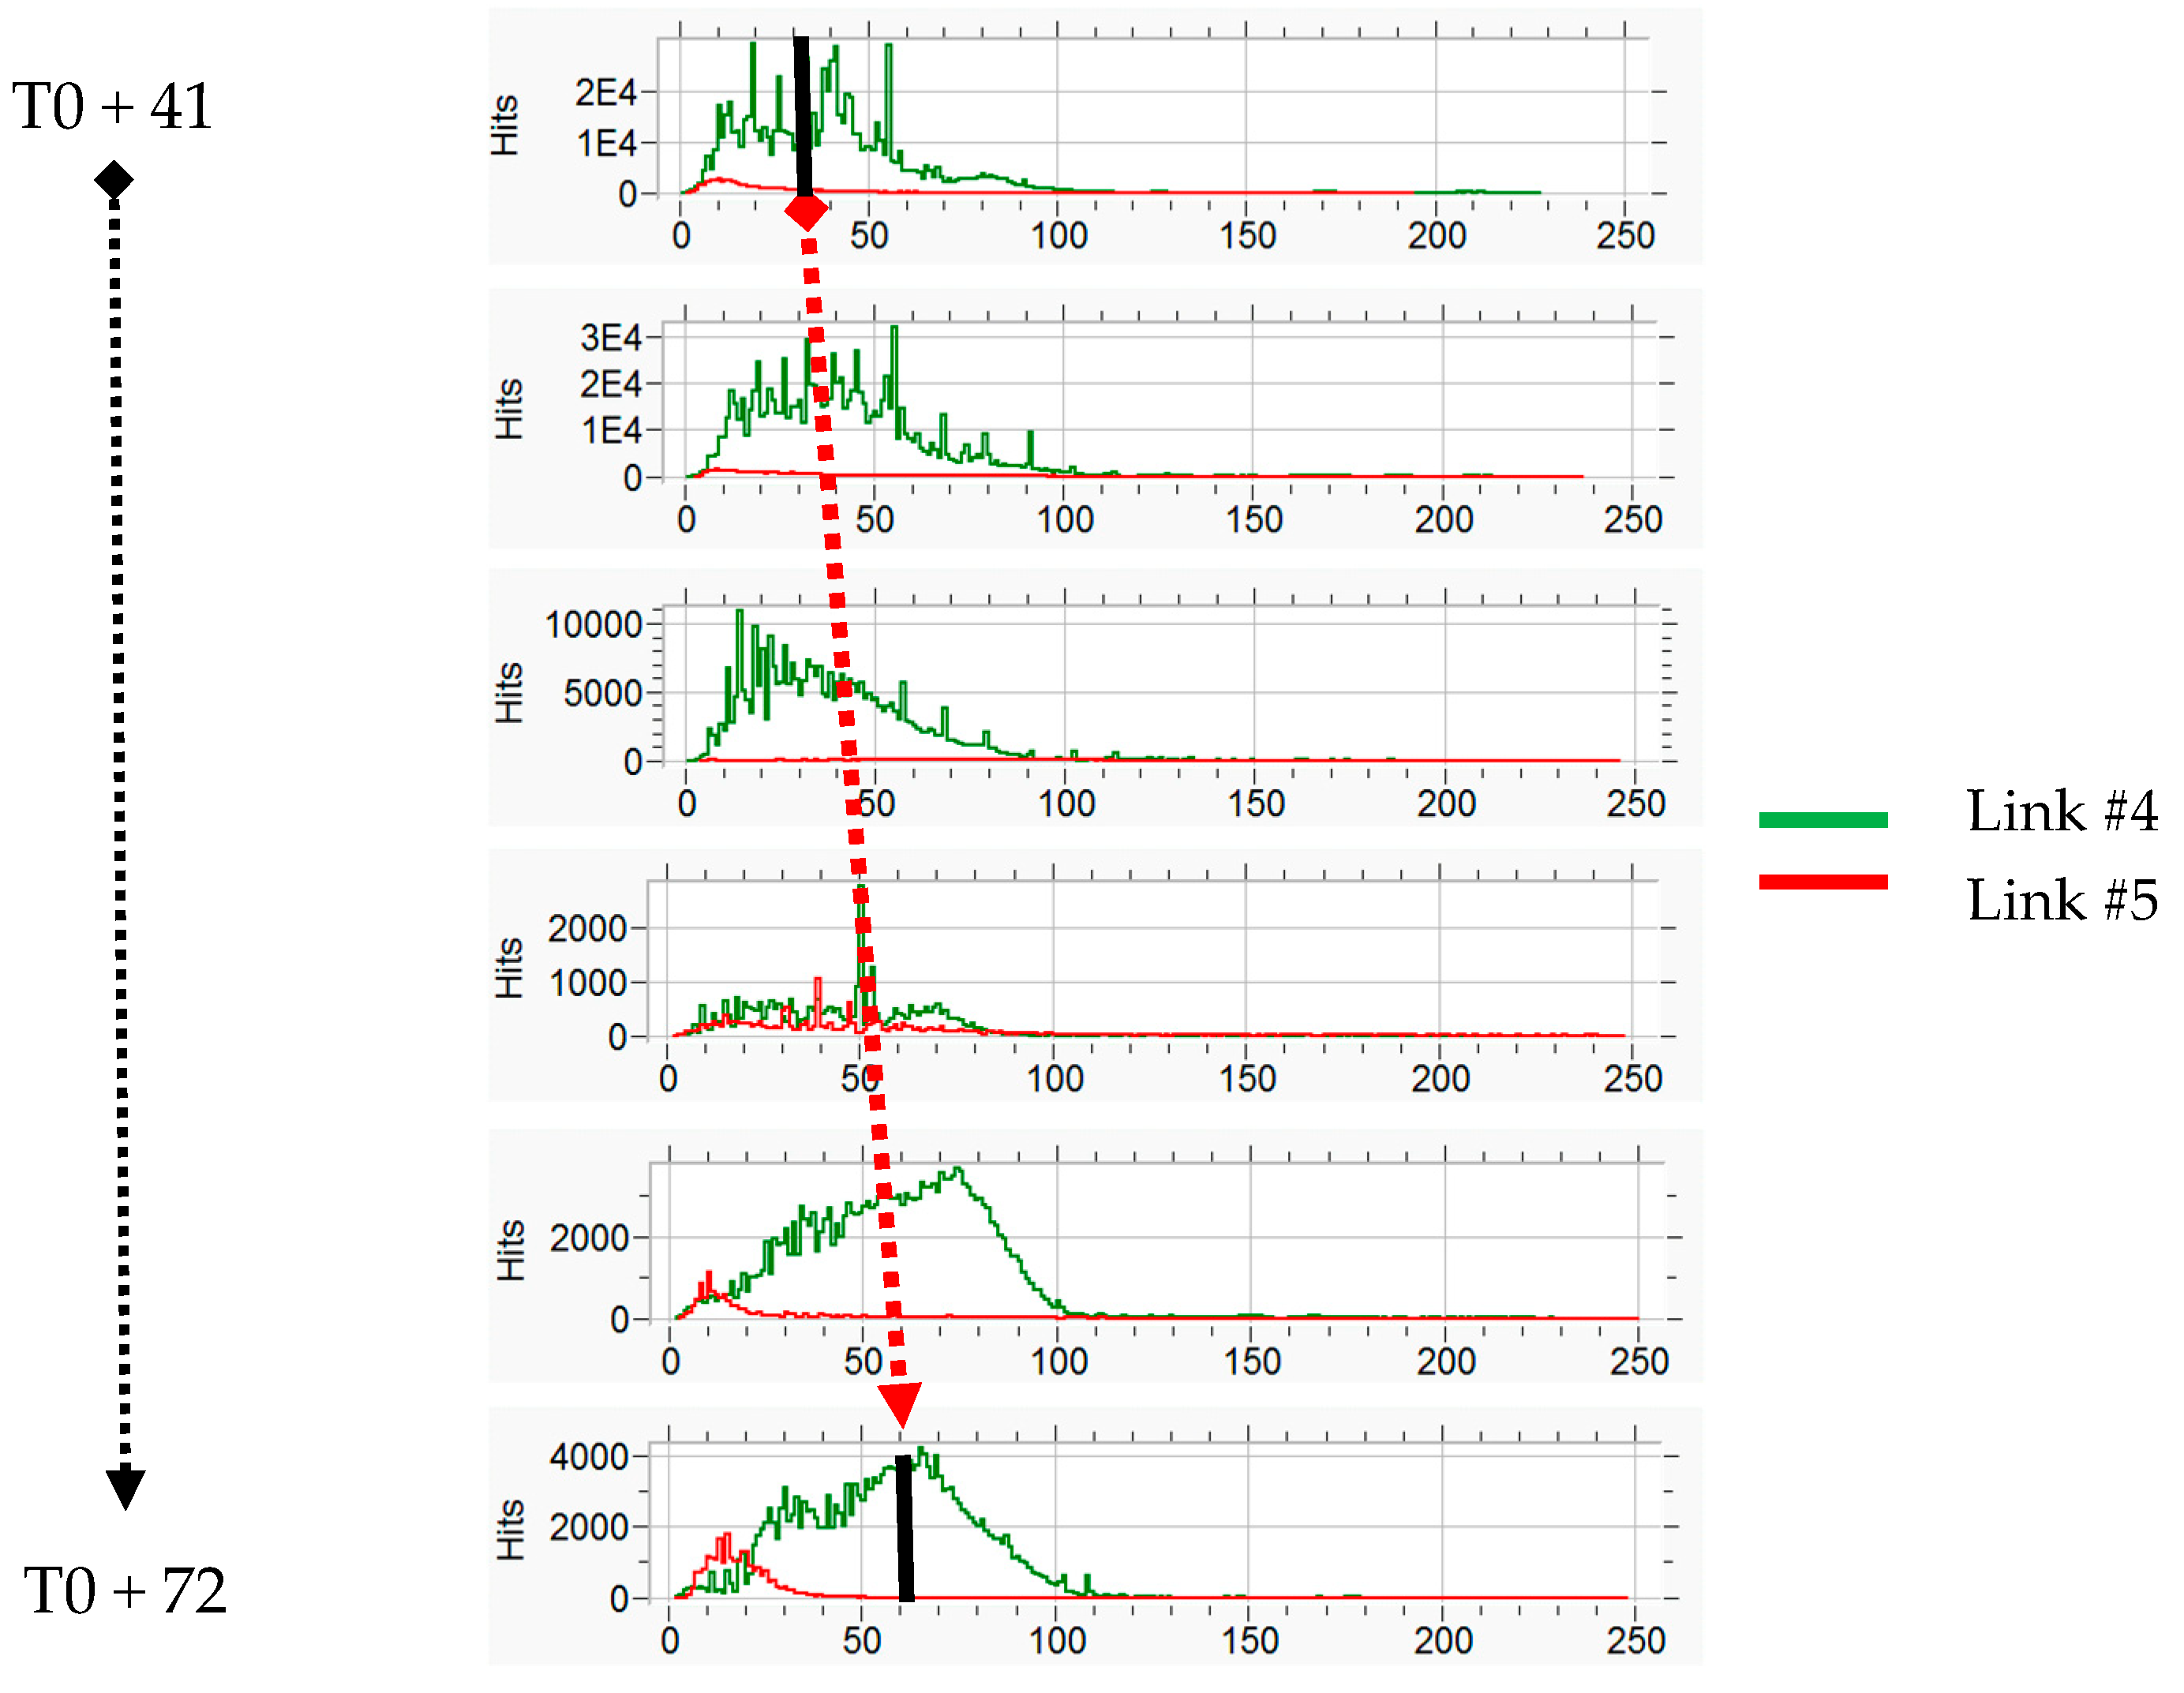
A closer look at the frequency content of the signals detected during the experiment, presented in Figure 9, shows a continuous shift of the average frequency towards higher values throughout the monitoring period.
The shift in the AE signal frequency content may be indicative of a change in the damage mode. For example, in reinforcing steel bars used in reinforced concrete, a decrease of the average AE frequency is attributed to the onset of phase three of the corrosion loss phenomenological model [40]. Additionally, tensile cracking is associated with a higher AE signal frequency range when compared to shear cracking in the same class of materials [41]. In composites, the AE signal frequency can be correlated to the fracture mechanism [42].
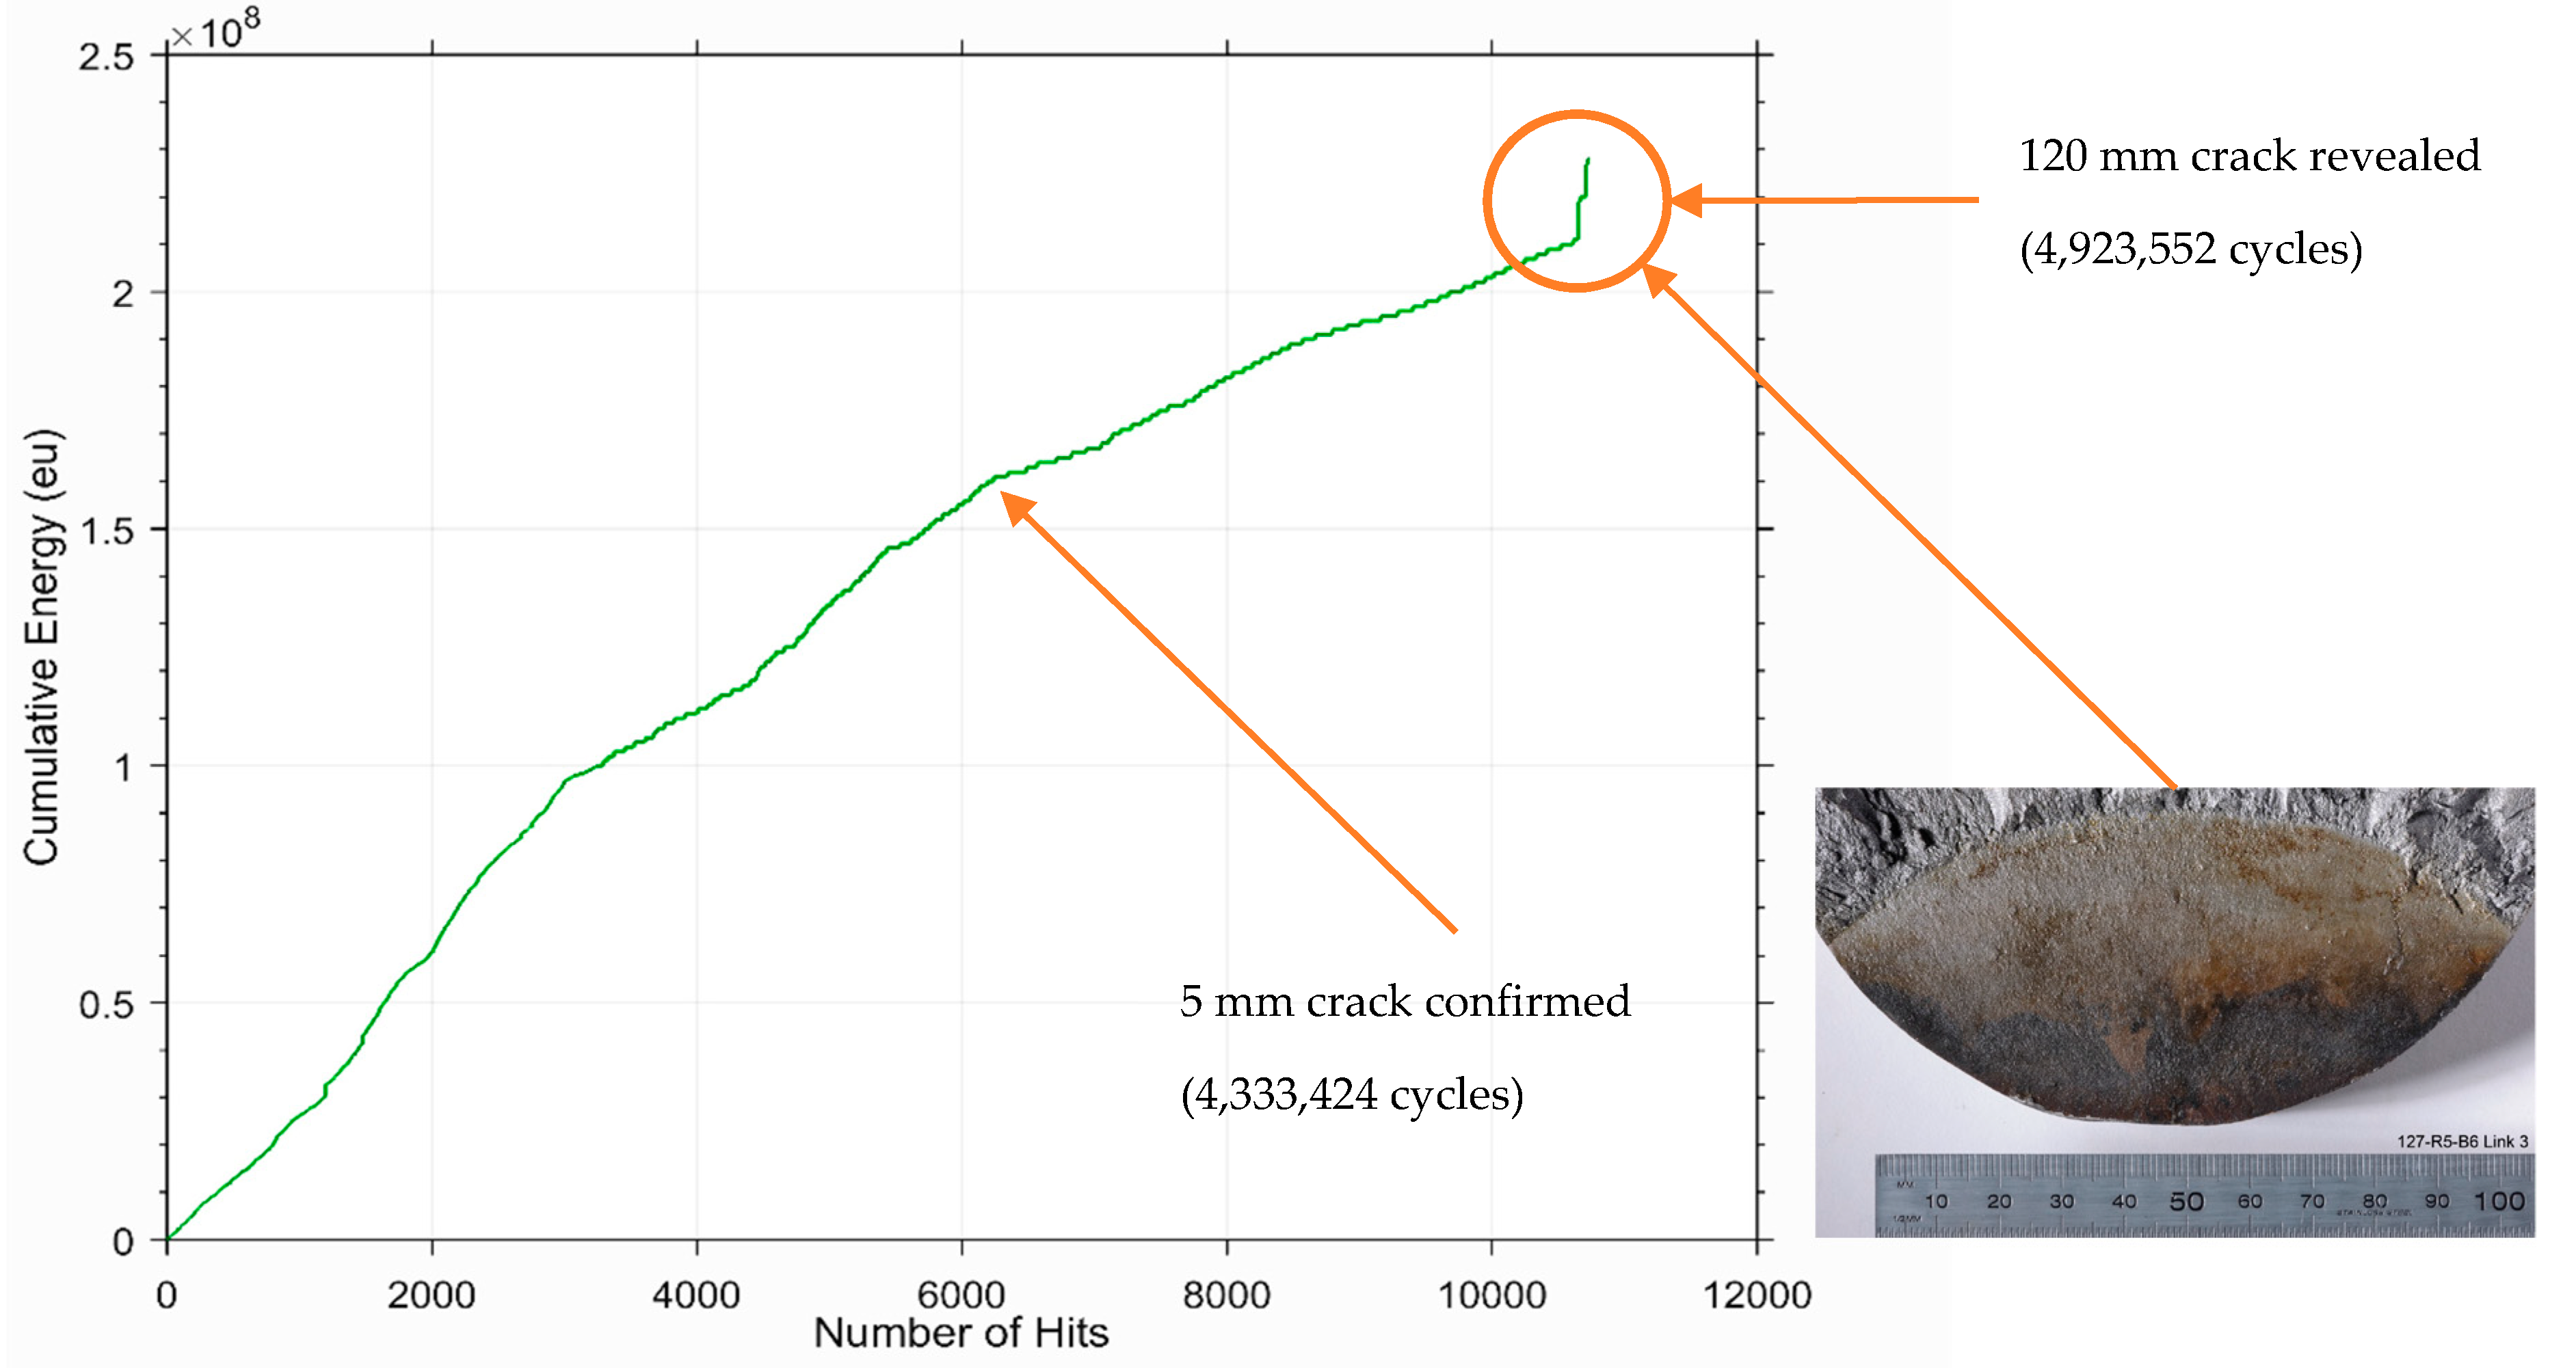
Finally, the observation of the cumulative energy during the last 31 days of the experiment did not show any particular change except during the final cycles (yellow circle in Figure 10). The fast rise indicates a rapid release of energy corresponding to rapid crack propagation. No statistical change was noted in the slope of the cumulative energy after the crack was initially detected. A quick increase in the cumulative energy precedes the exposure of the 120 mm crack. The displacement measured by the gauge did not exceed the pre-set limit until 120 mm was reached. This indicates a sharp crack growth, as seen in Figure 10.
4. Conclusions
The aim of this work was to assess the ability of AE to detect crack initiation and growth in mooring chains under realistic loading and environmental conditions. After careful evaluation of the different AE signal features and all possible correlations, it appears that the frequency content of the AE signals is the most promising parameter. An increase of the average frequency is observed with the growth of the crack in the chain link. However, due to the challenging environment and the high level of noise recorded, a more comprehensive frequency analysis will be needed.
Author Contributions
Conceptualization, Á.A.; Data curation, Á.A., J.T.; Formal analysis, Á.A., S.S.; Investigation, Á.A., A.K.; Methodology, Á.A., J.T.; Project administration, Á.A.; Resources, Á.A.; Software, Á.A., J.T.; Writing—original draft preparation, Á.A.; Supervision, C.M., S.S., T.-H.G.; Validation, C.M., S.S.; Writing – review & editing, Á.A., A.K., T.-H.G.
Funding
This research received no external funding.
Acknowledgments
The authors gratefully acknowledge the opportunity provided by TWI’s JIP project (22116) sponsors to make use of the mooring chain full-scale test rig at TWI’s facilities.
Conflicts of Interest
The JIP sponsors had no role in the design of the study; in the collection, analyses, or interpretation of data; in the writing of the manuscript; or in the decision to publish the results.
References
- Moan, T. Life cycle structural integrity management of offshore structures. Struct. Infrastruct. Eng. 2018, 14, 911–927. [Google Scholar] [CrossRef] [Green Version]
- Thorpe, T.; Scott, P.; Rance, A.; Silverster, D. Corrosion fatigue of BS 4360:50D structural steel in seawater. Int. J. Fatigue 1983, 5, 123–133. [Google Scholar] [CrossRef]
- Agerskov, H.; Pedersen, N. Fatigue life of offshore steel structures under stochastic loading. Struct. Infrastruct. Eng. 1992, 118, 2101–2117. [Google Scholar] [CrossRef]
- Alawi, H.; Ragab, A.; Shaban, M. Corrosion fatigue crack growth of steels in various environments. J. Eng. Mater. Technol. (ASME) 1989, 111, 40–45. [Google Scholar] [CrossRef]
- Komai, K.; Noguchi, M.; Okamoto, H. Growth characteristics of surface fatigue cracks of high-tensile strength steel in synthetic seawater. JSME Int. J. 1988, 31, 613–618. [Google Scholar] [CrossRef]
- Komai, K.; Minoshima, K.; Kinoshita, S.; Kim, G. Corrosion fatigue crack initiation of high-tensile-strength steels in synthetic seawater. JSME Int. J. 1988, 31, 606–612. [Google Scholar] [CrossRef]
- Monsalve-Giraldo, J.S.; Dantas, C.M.S.; Sagrilo, L.V.S. Probabilistic fatigue analysis of marine structures using the univariate dimension-reduction method. Mar. Struct. 2016, 50, 189–204. [Google Scholar] [CrossRef]
- Low, Y. A variance reduction technique for long-term fatigue analysis of offshore structures using Monte Carlo simulation. Eng. Struct. 2016, 128, 283–295. [Google Scholar] [CrossRef]
- Zhang, Y.-H.; Dore, M. Fatigue crack growth assessment using BS 7910:2013—Background andrecommended developments. Int. J. Press. Vessels Pip. 2018, 168, 79–86. [Google Scholar] [CrossRef]
- Shukla, A.; Karki, H. Application of robotics in offshore oil and gas industry—A review Part 2. Robot. Auton. Syst. 2016, 75, 508–524. [Google Scholar] [CrossRef]
- Raine, G.A.; Lugg, M.C. ROV inspection of welds—A reality. Insight Non-Destruct. Test. Cond. Monit. 1996, 38, 346–350. [Google Scholar]
- Papazian, J.M.; Nardiello, J.; Silberstein, R.P.; Welsh, G.; Grundy, C.C.D.; Evans, L.; Godfine, N.; Michaels, J.E.; Michaels, T.E.; Li, Y.; et al. Sensors for monitoring early stage fatigue cracking. Int. J. Fatigue 2007, 29, 1668–1680. [Google Scholar] [CrossRef]
- Chan, H.; Masserey, B.; Fromme, P. High frequency guided ultrasonic waves for hidden fatigue crack growth monitoring in multi-layer model aerospace structures. Smart Mater. Struct. 2015, 24, 1–10. [Google Scholar] [CrossRef]
- Cho, H.; Lissenden, C. Structural health monitoring of fatigue crack growth in plate structures with ultrasonic guided waves. Struct. Health Monit. 2012, 11, 393–404. [Google Scholar] [CrossRef]
- Kuang, K.; Cantwell, W. Use of conventional optical fibers and fiber Bragg gratings for damage detection in advanced composite structures: A review. Appl. Mech. Rev. 2003, 56, 493–513. [Google Scholar] [CrossRef]
- Bernasconi, A.; Carboni, M.; Comolli, L. Monitoring of fatigue crack growth in composite adhesively bonded joints using Fiber Bragg Gratings. Procedia Eng. 2011, 10, 207–212. [Google Scholar] [CrossRef] [Green Version]
- Silva-Munoz, R.; Lopez-Anido, R. Structural health monitoring of marine composite structural joints using embedded fiber Bragg grating strain sensors. Compos. Struct. 2009, 89, 224–234. [Google Scholar] [CrossRef]
- Deans, W.; Richards, C. A simple and sensitive method of monitoring crack and load in compact fracture mechanics specimens using strain gages. J. Test. Eval. 1979, 7, 147–154. [Google Scholar]
- Ihn, J.-B.; Chang, F.-K. Detection and monitoring of hidden fatigue crack growth using a built-in piezoelectric sensor/actuator network: I. Diagnostics. Smart Mater. Struct. 2004, 13, 609. [Google Scholar] [CrossRef]
- Fowler, T. Chemical industry application of acoustic emission. Mater. Eval. 1992, 50, 875–882. [Google Scholar]
- Gong, Z.; Nyborg, E.; Oommen, G. Acoustic emission monitoring of steel railroad bridges. Mater. Eval. 1992, 50, 883–887. [Google Scholar] [CrossRef]
- Roberts, T.; Talebzadeh, M. Acoustic emission monitoring of fatigue crack propagation. J. Constr. Steel Res. 2003, 59, 695–712. [Google Scholar] [CrossRef]
- Yu, J.; Ziehl, P.; Zarate, B.; Caicedo, J. Prediction of fatigue crack growth in steel bridge components using acoustic emission. J. Constr. Steel Res. 2011, 67, 1254–1260. [Google Scholar] [CrossRef]
- Berkovits, A.; Fang, D. Study of fatigue crack characteristics by acoustic emission. Eng. Fract. Mech. 1995, 51, 401–409. [Google Scholar] [CrossRef]
- Lindley, T.; Palmer, I.; Richards, C. Acoustic emission monitoring of fatigue crack growth. Mater. Sci. Eng. 1978, 32, 1–15. [Google Scholar] [CrossRef]
- Mathisen, J.; Larsen, K. Risk-based inspection planning for mooring chain. J. Offshore Mech. Arct. Eng. (Trans. ASME) 2004, 126, 250–257. [Google Scholar] [CrossRef]
- Cheng, X.; Zhang, X.; Zhang, H. The influence of hydrogen on deformation under the elastic stress in mooring chain steel. Mater. Sci. Eng. A 2018, 730, 295–302. [Google Scholar] [CrossRef]
- Cheng, X.; Zhang, H.; Li, H.; Shen, H. Effect of tempering temperature on the microstructure and mechanical properties in mooring chain steel. Mater. Sci. Eng. 2015, 636, 164–171. [Google Scholar] [CrossRef]
- Cheng, Y.; Ji, C.; Zhai, G.; Oleg, G. Nonlinear analysis for ship-generated waves interaction with mooring line/riser systems. Mar. Struct. 2018, 59, 1–24. [Google Scholar] [CrossRef]
- Rivera, F.G.; Edwards, G.; Eren, E.; Soua, S. Acoustic emission technique to monitor crack growth in a mooring chain. Appl. Acoust. 2018, 139, 156–164. [Google Scholar] [CrossRef]
- Angulo, A.; Edwards, G.; Soua, S.; Gan, T.-H. Mooring integrity management: Novel approaches towards in situ monitoring. In Structural Health Monitoring-Measurement Methods and Practical Applications; Intechopen: London, UK, 2017. [Google Scholar]
- Angulo, Á.; Allwright, J.; Mares, C.; Gan, T.H.; Soua, S. Finite element analysis of crack growth for structural health monitoring of mooring chains using ultrasonic guided waves and acoustic emission. Procedia Struct. Integr. 2017, 5, 217–224. [Google Scholar] [CrossRef]
- Bastid, P.; Smith, S. Numerical analysis of contact stresses between mooring chain links and potential consequences for fatigue damage. In Proceedings of the ASME 2013 32nd International Conference on Ocean, Offshore and Arctic Engineering Volume 2B: Structures, Safety and Reliability, Nantes, France, 9–14 June 2013. [Google Scholar]
- Perez, I.; Bastid, P.; Venugopal, V. Prediction of residual stresses in mooring chains and its impact on fatigue life. In Proceedings of the ASME 2017 36th International Conference on Ocean, Offshore and Arctic Engineering Volume 3A: Structures, Safety and Reliability, Trondheim, Norway, 25–30 June 2017. [Google Scholar]
- ASTM E1106-12(2017). Standard Test Method for Primary Calibration of Acoustic Emission Sensors; ASTM Volume 03.03 Nondestructive Testing (I): C1331–E2373; ASTM International: West Conshohocken, PA, USA, 2018. [Google Scholar]
- ASTM E976-15. Standard Guide for Determining the Reproducibility of Acoustic Emission Sensor Response; ASTM Volume 03.03 Nondestructive Testing (I): C1331–E2373; ASTM International: West Conshohocken, PA, USA, 2018. [Google Scholar]
- Hsu, N.; Breckenridge, F. Characterization and calibration of acoustic emission sensors. Mater. Eval. 1981, 39, 60–68. [Google Scholar]
- Bourchak, M.; Farrow, I.; Bond, I.; Rowland, C.; Menan, F. Acoustic emission energy as a fatigue damage parameter for CFRP composite. Int. J. Fatigue 2007, 29, 457–470. [Google Scholar] [CrossRef]
- Bhuiyan, M.; Giurgiutiu, V. The signature of acoustic emission waveforms from fatigu crack advancing in thin metallic plates. Smart Mater. Struct. 2018, 27, 1–15. [Google Scholar] [CrossRef]
- Kawasaki, Y.; Wakuda, T.; Kobarai, T.; Ohtsu, M. Corrosion mechanisms in reinforced concrete by acoustic emission. Constr. Build. Mater. 2013, 48, 1240–1247. [Google Scholar] [CrossRef]
- Tomoda, Y.; Mori, K.; Kawasaki, Y.; Ohtsu, M. Monitoring corrosion-induced cracks in concrete by acoustic emission. In Proceedings of the 7th International Conference on Fracture Mechanics of Concrete and Concrete Structures, Seoul, Korea, 23–28 May 2010; Korea Concrete Institute: Seoul, Korea, 2010; ISBN 978-89-5708-181-5. [Google Scholar]
- Groot, P.D.; Wijnen, P.; Janssen, R. Real-time frequency determination of acoustic emission for different fracture mechanism in carbon/epoxy composites. Compos. Sci. Technol. 1995, 55, 405–412. [Google Scholar] [CrossRef]
Figure 1.
Test rig illustration: the chain is fixed at one end (right) and the loading (strain) is applied at the other end (left).
Figure 1.
Test rig illustration: the chain is fixed at one end (right) and the loading (strain) is applied at the other end (left).

Figure 2.
Chain link potential failure locations.

Figure 3.
Sensor deployment on the chain in (a) the full-size test rig. Sensors fixed using magnetic holders 10 cm away from the link’s weld (b). Illustrative drawing of the chain (c).
Figure 3.
Sensor deployment on the chain in (a) the full-size test rig. Sensors fixed using magnetic holders 10 cm away from the link’s weld (b). Illustrative drawing of the chain (c).

Figure 4.
Calibration results for S1L3 (yellow), S2L4 (red), S3L5 (blue), and S4L6 (green) using (a) PLB and (b) the pulsing technique.
Figure 4.
Calibration results for S1L3 (yellow), S2L4 (red), S3L5 (blue), and S4L6 (green) using (a) PLB and (b) the pulsing technique.

Figure 5.
A pencil lead calibration (PLC) event generated in Link 3.

Figure 6.
AE reproducibility was verified as the tank was being filled with water (a) before the onset of the experiment (b).
Figure 6.
AE reproducibility was verified as the tank was being filled with water (a) before the onset of the experiment (b).

Figure 7.
Crack indications after magnetic particle inspection (MPI) at (a) 4,333,424 cycles (5 mm) and (b) 4,923,552 cycles (120 mm).
Figure 7.
Crack indications after magnetic particle inspection (MPI) at (a) 4,333,424 cycles (5 mm) and (b) 4,923,552 cycles (120 mm).

Figure 8.
Peak amplitude (dB) vs. load (kN). Details of the minimum–maximum loading, and the 3820–3873 kN range is highlighted.
Figure 8.
Peak amplitude (dB) vs. load (kN). Details of the minimum–maximum loading, and the 3820–3873 kN range is highlighted.

Figure 9.
Hits vs. average frequency (kHz). Shift of the average frequency.

Figure 10.
Cumulative energy (load > 3,820 kN) evolution as measured by the sensor fixed on Link 4. Photograph shows the fracture surface corresponding to the final crack.
Figure 10.
Cumulative energy (load > 3,820 kN) evolution as measured by the sensor fixed on Link 4. Photograph shows the fracture surface corresponding to the final crack.


Table 1.
Signals reproducibility verification.
| Pencil Lead Break | Sensor Pulsing |
|---|---|
|
|
© 2019 by the authors. Licensee MDPI, Basel, Switzerland. This article is an open access article distributed under the terms and conditions of the Creative Commons Attribution (CC BY) license (http://creativecommons.org/licenses/by/4.0/).
Share and Cite
MDPI and ACS Style
Angulo, Á.; Tang, J.; Khadimallah, A.; Soua, S.; Mares, C.; Gan, T.-H. Acoustic Emission Monitoring of Fatigue Crack Growth in Mooring Chains. Appl. Sci. 2019, 9, 2187. https://doi.org/10.3390/app9112187
AMA Style
Angulo Á, Tang J, Khadimallah A, Soua S, Mares C, Gan T-H. Acoustic Emission Monitoring of Fatigue Crack Growth in Mooring Chains. Applied Sciences. 2019; 9(11):2187. https://doi.org/10.3390/app9112187
Chicago/Turabian StyleAngulo, Ángela, Jialin Tang, Ali Khadimallah, Slim Soua, Cristinel Mares, and Tat-Hean Gan. 2019. "Acoustic Emission Monitoring of Fatigue Crack Growth in Mooring Chains" Applied Sciences 9, no. 11: 2187. https://doi.org/10.3390/app9112187
Note that from the first issue of 2016, this journal uses article numbers instead of page numbers. See further details here.