Clinical Brain Monitoring with Time Domain NIRS: A Review and Future Perspectives


Biomedical Optics Research Laboratory, Department of Medical Physics and Biomedical Engineering, University College London, London WC1E 6BT, UK
*
Author to whom correspondence should be addressed.
Appl. Sci. 2019, 9(8), 1612; https://doi.org/10.3390/app9081612
Submission received: 28 February 2019
/
Revised: 28 March 2019
/
Accepted: 1 April 2019
/
Published: 18 April 2019
(This article belongs to the Special Issue New Horizons in Time-Domain Diffuse Optical Spectroscopy and Imaging)
Abstract
:Near-infrared spectroscopy (NIRS) is an optical technique that can measure brain tissue oxygenation and haemodynamics in real-time and at the patient bedside allowing medical doctors to access important physiological information. However, despite this, the use of NIRS in a clinical environment is hindered due to limitations, such as poor reproducibility, lack of depth sensitivity and poor brain-specificity. Time domain NIRS (or TD-NIRS) can resolve these issues and offer detailed information of the optical properties of the tissue, allowing better physiological information to be retrieved. This is achieved at the cost of increased instrument complexity, operation complexity and price. In this review, we focus on brain monitoring clinical applications of TD-NIRS. A total of 52 publications were identified, spanning the fields of neonatal imaging, stroke assessment, traumatic brain injury (TBI) assessment, brain death assessment, psychiatry, peroperative care, neuronal disorders assessment and communication with patient with locked-in syndrome. In all the publications, the advantages of the TD-NIRS measurement to (1) extract absolute values of haemoglobin concentration and tissue oxygen saturation, (2) assess the reduced scattering coefficient, and (3) separate between extra-cerebral and cerebral tissues, are highlighted; and emphasize the utility of TD-NIRS in a clinical context. In the last sections of this review, we explore the recent developments of TD-NIRS, in terms of instrumentation and methodologies that might impact and broaden its use in the hospital.
Keywords:
NIRS; diffuse optics; time-domain; time-resolved; brain oxygenation; tissue saturation; scattering; absorption1. Introduction
Over the last two decades, the near-infrared spectroscopy (NIRS) field has gained lots of attention as more and more instruments are used in patients within the hospitals [1]. NIRS relies on the fact that light, in the range of 600 to 1000 nm, can penetrate deep into the biological tissue, because in that wavelength range absorption is low, and scattering is the dominant interaction process. Moreover, each absorber, called chromophore, has a specific absorption or extinction coefficient [2]. It is thus possible to quantify the contribution of each chromophore and to resolve its concentration in the tissue. One of the main chromophores in tissue that is oxygen dependent is haemoglobin; NIRS can quantify the in vivo concentrations of oxygenated (HbO2) and deoxygenated (HHb) haemoglobin and hence monitor tissue oxygenation non-invasively, and in real-time. Since its first introduction by Jobsis in 1977 [3], this technique has been used to probe various types of tissue, such as brain and muscle [4] and breast [5].
From a methodological point of view, a NIRS measurement can be achieved in three different detection modes: continuous wave (CW), frequency domain (FD), and time domain (TD). These modes differ by their level of complexity and the amount of information that they can retrieve. We discuss the details of these techniques in Section 2, and Table 1 lists their main characteristics. Of those three techniques, the CW-NIRS mode is the most widespread and has already been used extensively in the hospitals. Indeed, several reviews can be found in the literature that discuss the use of NIRS in the context of clinical brain monitoring. In particular, a recent review by Obrig discusses the use of NIRS in neuroscience, and the clinical areas of cerebrovascular disease, epileptic disorders, and in the evaluation of the functional activation of the diseased brain [6]. The use of NIRS for monitoring, traumatic brain injury (TBI) [7] and clinical interventions, including the use of the technique in anaesthesiology [8,9], neonatology [10] and psychiatry [11,12,13,14], have also been reviewed.
While these reviews demonstrate the potential and popularity of the NIRS technique; there is still debate on whether NIRS can be used reliably in a clinical context. Most NIRS instruments used in hospitals are CW devices due to their commercial availability and simplicity of operation; however, these instruments have several limitations, mainly their lack of brain-specificity and the large variability in absolute quantification of oxygenation [15]. TD-NIRS can resolve these issues and enable an in-depth measurement of absolutes values (see next section). TD-NIRS technology is often viewed as more complicated when compared to CW-NIRS and is not widely available. Indeed, the society for functional Near Infrared Spectroscopy website lists companies providing NIRS instruments [16] and out of the 14 companies listed, only Hamamatsu Photonics (Hamamatsu Photonics K.K., Hamamatsu, Japan) provides commercial TD-NIRS instruments
The goal of the present work is to review the current use of TD-NIRS for clinical applications, with a particular focus on brain monitoring. We will begin with a brief description of the NIRS basics in terms of methodology and technology. Then, we will review the reported work on clinical brain monitoring with TD-NIRS. Finally, we will highlight some recent TD-NIRS developments that we believe will have a direct impact on the clinical popularity of the technique.
2. Basics of NIRS
In the wavelength range used in NIRS (i.e., 600–1000 nm), two main physical phenomena affect the photon trajectory in tissues: scattering and absorption [17]. The scattering is the dominant effect in biological tissue and is caused by microscopic refractive index changes inside the tissue. The resulting effect is that the initial trajectory of the photon is lost, and the photon is deviated to another direction. In NIRS, this quantity is represented by the reduced scattering coefficient µ′s, which represents the scattering probability per unit length together with the average scattering direction. This parameter can give an insight to the tissue structure [18]. On the other hand, the absorption is the consequence of the loss of a photon which is due to the presence of particular chromophores inside the tissue that convert light intensity into other kinds of energy, either radiative (i.e., fluorescence) or nonradiative (i.e., vibrational). In NIRS, this quantity is represented by the absorption coefficient µa, which represents the absorption probability per unit length. As each chromophore has a specific spectral shape, they will each contribute differently to the overall absorption. Then, using a multiwavelength light source with well-chosen wavelengths s us to separate the contribution of each chromophore in order to quantify its concentration. A more detailed explanation of those processes can be found in [17,19].
The effects of absorption and scattering contribute non-linearly to the global attenuation of the light by the tissue. Hence, it is not straightforward to disentangle them. Indeed, an inverse problem must be solved in order to have access to the absorption and scattering independently [20]. Basically, light transport in tissue can be modelled accurately by the radiative transport equation (RTE) or by the simpler diffusion equation (DE), which is derived from the RTE given certain assumptions [19]. Usually, the RTE is solved numerically using Monte Carlo (MC) approaches and gives the most accurate description of light propagation. This accuracy comes at the cost of long calculation time [21]. The DE can also be solved numerically, by using the finite element method (FEM). Software platforms are available to facilitate this process include TOAST++ and NIRFAST [22,23]. However, the real strength of the DE is that it can be solved analytically in various simple geometries [17]. Thus, the calculation time is fast, and real-time methods can be implemented.
As mentioned in the introduction, data acquisition can be performed in three modes: CW, FD, and TD. The principle of those acquisition modes is summarized in Figure 1. Below we describe the basics of each technique, so the reader can appreciate their advantages and disadvantages. For further, more detailed information we refer the reader to [24]. In all the three modes, the basic idea is to shine light onto the tissue, and to collect the transmitted/reflected light few centimetres away from the source point. The single point CW technique is the simplest one; a continuous light is emitted onto the tissue, and the transmitted attenuated light is collected few centimetres away. CW-NIRS only measures the changes in light attenuation, which is defined as the variation and reduction of the transmitted/reflected light intensity from the emitted light. Indeed, using the change in light attenuation at several wavelengths and assuming that light scattering has not changed between measurement time points, CW-NIRS can calculate, using the modified Beer–Lambert law (MBLL) [25], the changes in [HbO2] and [HHb] concentrations, which are assumed to be the sole chromophores that contributes to the contrast. The MBLL considers the extra path length between the source and the detector due to the scattering with a parameter named the differential path length factor (DPF). As this parameter cannot be measured by CW systems, since they cannot distinguish absorption and scattering, this DPF is generally extracted from tabulated values [26] or using a modelling approach [27]. This limits the quantitative accuracy of the measurement since the overall scattering coefficients of the probed tissues is subject-dependent. This is also the reason why single point CW-NIRS only reports changes in haemoglobin concentration. However, some extensions of the CW technique enable us to access some absolute parameters. Indeed, using the spatially resolved spectroscopy (SRS) technique, based on the measurement of the light attenuation at several source/detector separations, the absolute µa of the tissue can be estimated by fitting the distribution of the spatially resolved light attenuation measured, to the solution of the DE in the CW regime [28]. Then, measuring the spatial distribution of the light attenuation at several wavelengths, and assuming (1) that [HbO2] and [HHb] are the sole chromophores contributing to the absorption and (2) an a-priori distribution of µ′s as a function of wavelength, then one can extract information about the absolute tissue oxygen saturation (referred as tissue oxygenation index (TOI) or tissue saturation (StO2) in the literature) [29]. The tissue saturation reflects the ratio between the concentration of [HbO2] and the concentration of total haemoglobin ([HbT] = [HbO2] + [HHb]). This has been widely exploited by commercial brain oximeters [30]. Moreover, some recent developments in CW system methodology employing a broadband spectrum can be used in order to extract absolute optical properties of the tissue [31]. The use of a broadband spectra can also unlock information on a third chromophore, cytochrome-c-oxidase (CCO), which is a marker of the metabolism. Therefore, the detection of this third chromophore can refine the picture of the tissue status obtained by NIRS, through integration of the metabolic and hemodynamic information [32].
One of the drawbacks of NIRS is its poor spatial resolution due to the inherent properties of light transport in tissue. This drawback can be reduced when using not only one, but several detection channels. Indeed, more complex arrangements have been developed to give access to a topographic (2D) or tomographic (3D) maps of brain haemoglobin concentration (referred as DOT: diffuse optical tomo/topography). This approach has largely been exploited in functional NIRS (fNIRS), where brain activity is being monitored [33]. Recently, the development of high-density DOT proved to have a resolution comparable to MRI [34], marking a new cornerstone in the development of the NIRS technology.
The second NIRS technique is frequency domain NIRS (FD-NIRS). In FD-NIRS the light shined onto the tissue is modulated at frequencies in the MHz range. The tissue will attenuate and shift the phase of the reflected light. Analysis of the phase-shift provides information on the total distance that the light has travelled through tissue. To solve the DE and obtain measurements of absorption and scattering, the intensity and phase at two or more, source-detector distances is required [35]. FD-NIRS enables the estimation of absolute brain tissue oxygen saturation and enhances depth resolution comparable to TD-NIRS [36]. However, Davies and colleagues [37] have recently compared CW-NIRS with FD-NIRS in monitoring clinical hypoxia, reporting that there were no advantageous difference observed in parameters recovered from the FD-NIRS compared with those detected by CW-NIRS.
2.1. TD-NIRS Methodology
In TD-NIRS an ultra-short light impulse (typically in the picosecond range) illuminates the tissue. Tissue has the effect of attenuating and broadening the re-emitted pulse (the resulting pulse-width is typically few nanoseconds wide). The measured signal is typically called a temporal point spread function (TPSF) or distribution of time of flights (DTOFs) of photons. Indeed, the measurand here is the histogram of the arrival time of photons. Thus, the amount of information acquired by time resolved systems outstrips the two previous techniques since they only acquire intensity (CW-NIRS) or intensity and phase (FD-NIRS) dimensions.
The DTOF acquired by the TD-NIRS systems contains information on the optical properties of the tissue and enables various data processing workflows to be used. Each method has its own strengths and drawbacks, in terms of computational cost accuracy, or need for a priori, as depicted in Figure 2. There are three main approaches for the data processing of TD-NIRS: the fitting approach, the moment calculation approach, and the gating approach (also called time gating or time windowing).
The fitting approach. This approach was the first to be used to process TPSF data [38]. It consists of minimising the different between an analytical solution of the DE for a particular geometry, and the measured TPSF. Typically, a non-linear fitting procedure based on the classical Levenberg–Marquardt approach is used in order to determine tissue µa and µ′s [39]. Different geometry can be assumed, the most commonly used being the homogeneous semi-infinite one, notably for its simplicity [38]. However, assuming that the head is completely homogeneous might appear an over simplification. More accurate tissue geometries can be considered, such as the multi-layered geometry, that represents more accurately the brain geometry [40]. For example, one could considerer an extra-cerebral and an intra-cerebral layer. As mentioned earlier, FEM and MC methods can also be used to model-specific anatomies which provides the best accuracy. Once the absorption coefficient is known at several wavelengths, the absolute concentration of each chromophore considered can be calculated using the Beer–Lambert Law. Typically, the considered chromophores are HbO2, HHb and water. The water content is usually set to 80% and the free fitting parameters are [HbO2] and [HHb] [41]. The tissue saturation can then be extracted from those concentrations. It worth mentioning that no assumption of µ′s is needed here as it is calculated.
It worth mentioning that in all TD-NIRS measurements, the contribution of the instrument to the DTOF has to be taken into account by measuring what is called the instrument response function (IRF). The ability to deconvolute the IRF from the tissue response function is crucial in order to retrieve accurate data [42]. This deconvolution step is non-trivial and the standard approach when fitting the data is to minimise the error between the TPSF and the model convoluted by the IRF [43].
The moments calculation. This approach reduces the amount of information contained in the entire DTOF by calculating 3 metrics, the 0th order moment corresponding to the total number of photons (equivalent to CW), the 1st order moment corresponding to the mean arrival time of photon (i.e., used to calculate the DPF (see refs. [26,44])), and the second-order moment corresponding to the variance of the TPSF [45]. Thus, it reduces the computational cost of the calculation. Moreover, the deconvolution of the TPSF is made easier since the deconvolution process only requires subtraction of the moments of the IRF from the moments of the TPSF.
Analytical expressions based on these moments are available in order to determine the absorption and scattering coefficients [45]. Once the optical properties are known, the same process as described for the fitting approach can be applied to the haemoglobin concentrations and tissue saturation. Finally, it has been shown that this approach can enhance the depth sensitivity of the measurements, since these three metrics have different depth-sensitivity [46].
The gating (or time gated approach). This approach is based on the separation of the TPSF in different time gates, representing different arrival time of photons. Usually, one can separate an early and a late gate, the early gate being more sensitive to the superficial layers, and the late gate to the deep tissues [47]. This effect is illustrated in supplementary material 1, which shows a video of the change of absorption sensitivity (x, y) as function as the position of the gate in the TPSF. It shows clearly that the late gates are more sensitive to deep tissues [48]. This technique has been used with systems based on ICCD cameras [49,50] or, more recently, SPADs [51].
2.2. Measure of Brain Perfusion
Finally, it worth mentioning that all the approaches described above rely on the fact that the changes in absorption are due to endogenous oxygen-dependent contrast (i.e., haemoglobin). This principle is at the heart of the NIRS technique as it enables us to follow the blood volume (i.e., via HbT), and StO2, which reflects the balance between the oxygen delivery and the oxygen consumption. This implies that NIRS cannot directly measure the cerebral perfusion. However, this parameter can be assessed by using alternative methodologies and instruments.
Indeed, the use of indocyanine green (ICG), a contrast enhancing agent, makes the assessment of cerebral perfusion with NIRS possible. ICG is a non-toxic light-absorbing dye that has a high absorption and fluorescence emission in the NIR [52]. By following the transit time of an ICG bolus injected intravenously, one can estimate the cerebral blood flow (CBF) [53]. Although, this transit time can be monitored in depth with DOT-CW-NIRS systems [52], it has been showed that when using only one channel, the use of TD-NIRS enhances the depth sensitivity of the ICG bolus tracking and enables us to distinguish between intra- and extra-cerebral layers. Moreover, the use of TD-NIRS gives also access to the measurement of the fluorescence signal of the ICG, which also increase the depth sensitivity [54]. The measured signal of fluorescence is often referred to as the distributions of times of arrival of fluorescence (DTAs). The main advantage of this technique is that it can provide a CBF value in standard physiological units (i.e., mL of blood/100 g/min) [55]. The main drawback of this technique is that it cannot continuously monitor the CBF as the injection of ICG is limited by a maximum recommended daily dose. We will then refer to this technique as DCE-TD-NIRS, where DCE stands for dynamic contrast enhanced.
On the other hand, diffuse correlation spectroscopy (DCS) is a technique that enables continuous monitoring of a CBF index called blood flow index (BFI) without the injection of a contrast agent. Briefly, in DCS, the tissue of interest is illuminated by coherent near-infrared light, which causes a speckle interference pattern to form after the light scatters multiple times through the tissue. Thus, the changes in light scattering due to the moving red blood cells causes the speckle pattern to fluctuate rapidly. Those speckle patterns are then analysed to extract blood flow information. In order to quantify the fluctuation of the speckle pattern, the optical properties of the tissue need to be assumed or measured. Therefore, the use of TD-NIRS is well-suited to provide such information, especially since the two techniques are compatible and can be combined. A more detailed explanation of DCS principles can be found in [56].
3. Clinical Brain Monitoring with TD-NIRS
The focus if the present review was to evaluate the use of TR-NIRS in a clinical context regarding brain monitoring. Therefore, papers were identified using PubMed and Scopus, searching for a combination of keywords including (near-infrared spectroscopy | near infrared | optical | tomography) and (time domain | time resolved) and (brain | cerebral). Moreover, a manual search from articles’ references was performed and authors related to the subject were contacted. Papers were rejected if only CW-NIRS or FD-NIRS were used, if the application was not focused on the brain, and if no clinical application could be identified (i.e., applications on healthy volunteers or animals only). A total of 52 publications covering a variety of applications were identified. We have grouped the applications into seven subgroups that we will discuss below: neonatal applications (19 studies), stroke assessment (8 studies), traumatic brain injury (TBI) assessment (four studies), psychiatry (nine studies), brain death assessment (three studies), perioperative care assessment (seven studies), and other applications (two studies).
Table 2 provides a summary of the main characteristics of the instrument used in the studies reported in this review, and Figure 3 shows pictures of the instrumentation typically used. A more detailed list of TD-NIRS instruments is available in the review by Torricelli and colleagues [57]. Moreover, a summary of the studies included in this review is presented in Table 3 and includes the system used, the number of patients scanned, the methodology used to process the data, and finally states the measurand reported in these studies.
Finally, Figure 4 summarizes the main characteristic of the TD-NIRS systems used in the reviewed publications and shows the number of publications over the last 20 years that report the use of TD-NIRS in a clinical context.
3.1. Neonatology
The use of TD-NIRS in neonatology is the area that has been one of the most explored, starting from the very early days of TD-NIRS. This particular population is well-suited to NIRS, allowing DOT to be performed [61]. Indeed, the first papers reporting the use of an in-house developed TD-NIRS instrument (ID: 6 in Table 2) on neonates dates from the late 1990s, by the group of Dr. David Benaron at Stanford University, USA. In a series of papers [62,63,64,65], they reported the first tomographic images of neonates using TD-NIRS. This team then successfully tomographically-identified intracranial haemorrhage [62,63] and focal regions of low oxygenation after acute stroke [65]. Hintz and colleagues [66] also retrieved a topographic image of the activation of the motor cortex of one infant measured at six days postnatal age.
At University College London (UCL), UK, an in-house 32 channel TD-NIRS system was developed. This system was called MONSTIR (for Multi-channel Opto-electronic Near-infrared System for Time-resolved Image Reconstruction) [67,68]. With this system, tomographic images of healthy infants [69] and infants with intraventricular haemorrhage (IVH) [69,70] were reconstructed. An example of their reconstructed images is provided in Figure 5a. The image reconstruction required a comparison of the in-vivo data with the data acquired on a phantom with well-known optical properties, producing an image of the differences. The natural extension of this work was to be able to reconstruct images without the necessity to image a reference phantom. Hebden and colleagues [71] first demonstrated this possibility on a severely brain-injured 38-week-old newborn. The changes in absorption and scattering coefficient, and in [HbO2] and [HHb], resulting from small alterations in ventilator settings could be detected during an imaging session of three hours at two wavelengths. Following that, Gibson and colleagues [72], reported the first 3D optical images of entire pre-term babies’ heads during motor-evoked response. More recently, the UCL team reported the development of the second generation of the TD-DOT-NIRS MONSTIR, called MONSTIR II [68]. Dempsey and colleagues [73] reported to have successfully scanned a healthy infant with MONSTIR II. This work was largely exploratory to demonstrate the quality of the recording of the data acquired with MONSTIR II in a clinical environment. Moreover, in her PhD thesis [74], Dempsey reported the use of moments to reconstruct images of babies presenting with perinatal arterial ischemic stroke (PAIS). Here, she explored the possibility of using the calculated moments (intensity, time of flight, variance) as a metric to locate the stroke area.
In the literature there is a significant amount of publications using commercial TD-NIRS systems developed by Hamamatsu in neonates. Koyano and colleagues [75] investigated the effect of blood transfusion on cerebral haemodynamic in preterm infants using a TRS-10 system, suggesting that TD-NIRS can be used for determining the need for transfusion in very-low-birth-weight infants. Ishii and colleagues [76] used a TRS-20 system to compare changes in cerebral and systemic perfusion between appropriate- and small-for-gestational-age (AGA and SGA, respectively) infants during the first three days after birth. Also using a TRS-20, Fujioka and colleagues [77] reported the difference in brain oxygenation between term and preterm infants during the first three days of life.
Nakamura and colleagues [78] used a TRS-10 system to measure StO2 and [HbT] in babies with hypoxic-ischemic encephalopathy (HIE), reporting that neonates with adverse outcomes had higher values within 24 h after birth compared with neonates with a favourable outcome. Additionally, using a TRS-10 system, Hoshino and colleagues [79] reported the changes in oxygenation concentration and tissue saturation before and after an endovascular treatment in a 10 months old patient.
Lastly, some work has been done in order to evaluate normal values of optical properties and physiological parameters in neonates. Ijichi and colleagues [80] used a TRS-10 to investigate both the optical properties and relevant physiological parameters of a population of 22 neonates. They reported the absorption and reduced scattering coefficient, DPF, total haemoglobin concentration and tissue saturation, together with the blood volume. They also showed the relationship between those parameters and the gestational age. The use of the TD-NIRS is highlighted here, with the potential to give detailed information about µa and µ′s, and physiological parameters. Spinelli and colleagues [81] used an in-house developed instrument (ID: 9 in Table 2) to evaluate the optical properties and haemoglobin parameters of 33 neonates. They found consistencies in the measures of blood oxygenation but variations in the µa, similar to adult population [82]. They concluded that more work was needed to properly define standard values. Finally, preliminary results from a combined TD-NIRS/DCS system reported the evaluation of µa, µ′s and StO2, together with the BFI of 21 babies, using the BabyLux system [59].
3.2. Stroke Assessment
The utility of using NIRS technology in the context of stroke has been reviewed by Obrig and Steinbrink in 2011 [83]. In that review, they concluded that using TD-NIRS is mandatory for the assessment of pathophysiological state-dependent variables such as perfusion or absolute values of tissue oxygenation. The first works reporting the use of TD-NIRS on stroke patients was by Liebert and colleagues [84,85]. In these studies, the cerebral perfusion was measured by using the method of DCE-TD-NIRS. The bolus transit time through intra- and extra-cerebral tissue was measured in both hemispheres of two stroke patients, using an in-house developed multichannel TD-NIRS system (ID: 11 in Table 2). Steinkellner and colleagues [86] also reported the use of DCE-TD-NIRS to measure the cerebral perfusion in 10 acute stroke patients using an in-house developed multichannel TD-NIRS system (ID: 12 in Table 2). The authors reported to have used the kinetics of the moments to follow the kinetics of the ICG bolus. The kinetic difference between the affect and unaffected hemisphere was compared. The analysis of the variance enabled them to substantially reduce the movement artefacts and to follow the intracerebral compartment, compared to the traditional signals acquired with CW systems, which have been simulated here by time integrating the TPSF (illustrated in Figure 5b). Using the variance, the authors reported a clear difference in perfusion between the affected and non-affected hemisphere.
Other groups reported the use of an in-house developed system to follow the brain oxygenation of stroke patients. Leistner and colleagues [87] compared the neurovascular coupling, induced by a simple motor test, between six patients with subacute ischemic stroke and four healthy volunteers. In this study, the neurovascular coupling was measured using a DC-MEG and a TD-NIRS system (ID: 13 in Table 2) simultaneously. Another in-house developed TD-NIRS system (ID: 14 in Table 2) was used by Giacalone and colleagues [88] to measure haemoglobin concentrations and StO2 of the anterior circulation in stroke patients. In this study, 47 stroke patients were monitored in the stroke unit at the bedside. Multiple areas of the brain were probed (i.e., frontal, parietal, occipital) and CT-scans images were used to categorize brain regions below each TD-NIRS probe. Moreover, the results were compared with a group of 35 controls selected from a previous study reported in [82]. Significant differences of haemoglobin concentrations and StO2 were found between patients and controls, and among patients according to recanalization status.
Finally, commercial Hamamatsu TD-NIRS systems were also used on stroke patients. Yokose and colleges [89,90] reported the detection of vasospasm in patients with aneurismal subarachnoid haemorrhage (SAH). Another study by Sato and colleagues [91] used a TRS-20 system to measure haemoglobin concentrations, StO2, and optical path length of five patients suffering from chronic stroke. They compared the results between the unaffected and affected hemisphere. Significant differences between the unaffected and affected hemisphere were found for StO2 (higher in the affected side), [HHb] (higher in the affected side) and optical path length (longer in the affected side).
3.3. Traumatic Brain Injury (TBI) Assessment
The use of NIRS technology in traumatic brain injury (TBI) has been reviewed by Davies and colleagues in 2015 [92]. Here we explicitly review and discuss the use of TD-NIRS systems in the same patient population. We found three recent studies investigating the brain status of TBI patients. Weigl and colleagues [58], used the DCE-TD-NIRS method to assess cerebral perfusion in 26 TBI patients and nine controls, using an in-house developed multichannel TD-NIRS system (ID: 15 in Table 2). In this study, the moments of the DTOFs and DTAs were calculated, and their time courses were compared, to track the ICG bolus. Statistically significant differences between the time courses of the ICG bolus calculated using the different moment parameters obtained in healthy subjects and patients with brain haematoma and brain oedema were observed. Moreover, it was noted that the best optical parameter to differentiate between patients and controls was the variance of DTOFs and DTAs.
Highton and colleagues [93] focused on the changes in light scattering related to TBI. In this study, a total of 21 TBI patients were monitored with a TRS-20 system. In 10 patients suffering from unilateral infarction, even though no significant difference in cerebral saturation or haemoglobin concentration were found, a significant reduction of µ′s was related to the injury severity.
Finally, He and colleagues [60] used an in-house developed TD-NIRS and DCS system (ID: 16 in Table 2) to continuously monitor the absolute blood flow (i.e., using physiological units, see Section 2) of seven patients with acute brain injury. This absolute assessment was possible by coupling the DCE-TD-NIRS, to extract absolute values, and DCS, to continuously assess the blood flow. Here patients were monitored 8 h a day, four days. This illustrates the use of state-of-the-art TD-NIRS technology and instrumentation to collect information with comprehensive units for a physician.
3.4. Brain Assessement in Death
TD-NIRS could also be used to assess the adequacy of resuscitation. In a pilot study, Lanks and colleagues [94] used a NIRO-TRS1 Hamamatsu system to monitor the cerebral saturation and haemoglobin concentration in 11 patients with septic shock, and compared those measurements with traditional markers of perfusion adequacy. In another study using the same system, Lanks and colleagues [95] reported the case of a young man who suffered a pulseless electrical activity (PEA) arrest (i.e., cardiac arrest) while cortical oxygenation was monitored. The onset of cortical deoxygenation preceded the loss of palpable pulses for 15 min, despite otherwise stable measures of perfusion, reflecting falling cortical microvascular haemoglobin concentration and oxygenation minutes before PEA arrest. This result is presented on Figure 5b. Even though it is a single subject study, this suggest that TD-NIRS might provide the means of detecting PEA arrest, by monitoring cortical oxygenation.
Finally, Liebert and colleagues [96] and Weigl and colleagues [97] investigated the possibility to use DCE-TD-NIRS to confirm brain death. Using an in-house developed multichannel TD-NIRS systems (ID: 17 in Table 2), different stages of cerebral perfusion disturbances were compared in three groups that included controls, patients with post-traumatic cerebral oedema, and patients with brain death. The authors reported that DCE-TD-NIRS was feasible in the demanding ICU environment and had promising initial results. However, at its current stage of development, the accuracy of the method did not reach the high standards required for brain death confirmation.
3.5. Psychiatry and Cognitive Impairement
Another field of clinical application of TD-NIRS is psychiatry, in which NIRS is used to evaluate functional brain activation in different neuropsychiatric disorders, notably in schizophrenic disorders, and normal and pathological aging [12].
In the context of schizophrenia, we found two publications that used Hamamatsu TD-NIRS systems to provide baseline measurement of haemoglobin concentration, tissue saturation and optical path length in this group of patients. In these studies, fNIRS was also performed but using a CW-NIRS system. We will therefore only report the TD-NIRS results. Firstly, Shinba and colleagues [98] used TD-NIRS to investigate the frontal lobe dysfunction in schizophrenia. The authors reported no significant difference in path length between the control group and schizophrenic group. However, in some subjects, the path length was different from the mean value of the group by more than 20%, highlighting the importance of a subject specific path length in order to retrieve accurate quantitative values of the change of the haemoglobin concentrations. Hoshi and colleagues [99] investigated the resting hypofrontality in patients with schizophrenia. They reported that the [HbT] decrease was related to the duration of illness, and it was not observed in patients whose duration of illness was less than 10 years. The authors concluded that despite the fact that resting hypofrontality is a chronically developed feature of schizophrenia, this does not necessarily represent frontal dysfunction, but may reflect anatomical and/or functional changes in frontal microcirculation.
On the other hand, several studies addressed the issue of cognitive impairments and aging using Hamamatsu systems. Harada and colleagues [100] compared the haemoglobin concentration measured by a TRS-10 system, and the cerebral activity, measured by a CW-NIRS system, of the prefrontal cortex between 14 young adults and 14 elderly adults while driving. The main finding regarding the TD-NIRS results for this study was that the concentrations of all forms of haemoglobin in elderly adults were lower compared to young adults.
Two papers [101,102] reported the use of a TRS-20 system to evaluate the effect of cosmetic therapy on prefrontal cortex (PFC) activity in 61 elderly females. The [HbT] and StO2 were evaluated before and after a three-month program of cosmetic therapy. Murayama and colleagues [103] used a TRS-21 system to investigate the relationship between cognitive function and haemoglobin concentration and tissue saturation of the prefrontal cortex (PFC) during rest in 113 elderly adults. The authors quantified cognitive functions using the Mini-Mental State Examination (MMSE) score and the Touch M score, which evaluates working memory function semi-automatically on a touchscreen. A significant positive correlation between the MMSE scores and StO2 was found together with a significant positive correlation between Touch M scores and baseline concentrations of [HbO2], [HbT] and StO2. It is worth noting that the authors reported that the main advantage of TD-NIRS in that study was to measure absolute information at rest; allowing them, therefore, to assess cognitive function without any task (i.e., fNIRS using CW-NIRS). Oyama and colleagues [104] investigated the possibility of using the haemoglobin concentration and StO2 information acquired with a TRS-20 system to predict the MMSE score of a group of 202 elderly people. The MMSE was conducted first and then TD-NIRS measurement was performed. The authors found using a deep neural network (DNN) that the StO2 and the optical path lengths contributed to the prediction of the MMSE score.
Finally, two publications by Sakatani and colleagues [105] and Nakano and colleagues [106] investigated the effects of two drugs on the improvement of cognitive function using a TRS-20 system. In these two studies, the ability of TD-NIRS to measure absolute haemoglobin concentration and StO2 were crucial, since the measurements were taken several weeks apart.
3.6. Peroperative Care
It has been demonstrated that the use of NIRS to monitor the level of anaesthesia could lead to better postoperative cognitive performance of the patient [108].
In a peroperative context, Kacprzak and colleagues [109] evaluated the application of TD-NIRS to monitor cerebral oxygenation during carotid surgery. The authors used an in-house developed multichannel TD-NIRS system (ID: 15 in Table 2) on a group of 16 patients with atherosclerotic disease and monitored them during routine carotid endarterectomy surgery. The authors reported that the changes in the haemoglobin signals, as estimated from intracerebral tissue, are very sensitive to clamping of the internal carotid artery, whereas its sensitivity to clamping of the external carotid artery is limited. This is a good indicator that the TD-NIRS method used in this paper can achieve in-depth selectivity.
Furthermore, seven studies using Hamamatsu systems were reported in a peroperative context. Ohmae and colleagues [110] reported the monitoring of cerebral circulation during cardiopulmonary bypass surgery using a TRS-10 system. In this study, 23 patients who underwent coronary-artery bypass surgery were evaluated reporting that TD-NIRS can be used to follow brain oxygenation during cardiac bypass surgery. Moreover, the authors reported a large fluctuation of the mean optical path length among patients. The authors also reported that the inter-patient variability of saturation was low compared to that of the haemoglobin concentrations. This finding was also recently reported in healthy volunteers [82]. In another study, Kakihana and colleagues [111] also monitored the cerebral tissue saturation of patients undergoing a cardiac surgery requiring a cardiopulmonary bypass using a TRS-10 system. The jugular venous oxygen saturation (SjvO2) was also monitored. Moreover, postoperative cognitive dysfunction (POCD) was evaluated using the MMSE before and seven days after the operation. It was found that there was no significant difference between the SjvO2 and StO2 in patients without POCD, but that those two values were significantly different in patients with POCD. Therefore, the combination of SjvO2 and cerebral StO2 might help predict the occurrence of POCD. Lastly, Satao and colleagues [112] also used a TRS-10 system to investigate the depth-dependence of haemoglobin concentration changes during carotid endarterectomy (CEA) in eight male patients with symptomatic carotid stenosis during CEA surgery reporting brain specificity of the TD-NIRS.
Additionally, two studies using TRS-20 systems investigated the cerebral oxygenation of pregnant women during child delivery. Yamazaki and colleagues [113] reported cerebral oxygenation, on the PFC, of eighteen pregnant women during caesarean section, reporting that in a case of placenta previa, massive bleeding immediately decreased cerebral StO2. Suzuki and colleagues [114] reported the cerebral [HbT] in pregnant women in delivery. They showed difference between normotensive and hypertensive women with or without epidural anaesthesia. Moreover, a decrease in cerebral [HbT] in the hemi-prefrontal lobe in a woman 2 h after the onset of haemorrhagic stroke in labour could also be detected. This reinforces the possibilities of using TD-NIRS in the context of child delivery.
Finally, Fujisaka and colleagues [115] using the latest TD-NIRS device developed by Hamamatsu (a two-channel tNIRS-1) reported in one patient a decrease in brain [HbT] and StO2 during circulatory arrest in cardiac surgery.
3.7. Others
Visani and colleagues [116] reported the haemodynamic and neuronal time course to unilateral hand movement in 10 patients with cortical myoclonus, a pathology that triggers sudden, brief, involuntary muscle jerks, compared with 12 healthy volunteers. This particular study was highly multimodal with simultaneous EEG-fMRI and EEG-TD-NIRS measurements. An in-house developed multimodal TD-NIRS system (ID: 9 in Table 2) was used together with the time-gated approach in order to enhance that brain sensitivity. The authors reported a good agreement between the TD-NIRS and fMRI findings, both for controls and patients, and showed reduced hemodynamic changes in patients compared to controls.
Finally, it is known that NIRS can be used within a brain computer interface framework to allow the use of brain activity to control computers or other external devices [117]. In a clinical context, this can be used to communicate with patients with locked-in syndrome. Abdalmalak and colleagues [107] reported the ability to successfully communicate with a functionally locked-in patient suffering from Guillain–Barré syndrome. At the time of the study, the patient had regained limited eye movement, which could be used to confirm the TD-NIRS findings. The hemodynamic response to a motor imagery (MI) activity was measured using an in-house developed multichannel TD-NIRS systems (ID: 18 in Table 2) and using the methods of moments to quantify the changes in µa to extract the changes in [HHb] and [HbO2]. The subject was asked to answer three questions: (1) confirming his last name, (2) whether he was in pain, and (3) if he felt safe. He was instructed to stay relaxed if he wanted to answer “no” or to perform a tennis imaginary task if the answer was “yes”. The brain activation pattern successfully predicted the correct answers, evaluated by eye movement, to the three questions (see Figure 5d). Moreover, the metrics presented in this paper were in accordance with a previous study, using the same system, on healthy volunteers [118].
4. Discussion
We have summarized the clinical application of TD-NIRS and reported its use (1) in the neonatology unit to follow neonates with various conditions, (2) in the ICU to monitor stroke or TBI patients, or to communicate with patients with locked-in syndrome, (3) in the operating room to follow brain oxygenation during surgery, and (4) in more “standard” neuroscience environments for studies focusing on patients with psychiatric disorders.
Historically, the first clinical application of TD-NIRS was in imaging the brain of premature infants; in particular obtaining 3D tomographical images of their brains in the neonatal intensive care unit. The 17% of TD-NIRS publications exploring TD-DOT are only focused on neonates. However, optical brain tomographs require resolving significant hardware and software challenges, and after a prolific number of publications in early 2000, this field has been less active on the clinical side even though methodological developments are still being made. The reduction in activity might also be explained by the significant improvements made by CW-NIRS-DOT [61].
Most of the TD-NIRS instruments used in clinical applications are multi-channel (81% of the TD-NIRS). Multichannel systems can probe both hemispheres at the same time, which is very important when a comparison is needed between hemispheres. On the other hand, some specific clinical applications, such as in peroperative care where the brain responses are global, do not require monitoring of several brain locations.
The other interesting metric of this review is that the distribution between commercial and in-house developed system was fairly balanced, with 52% of papers reporting commercial system use. However, it is worth mentioning that only Hamamatsu can provide commercial TD-NIRS systems, and that most of the work reported with these systems was originating from Japan. The use of three different versions of their research systems has been reported here (TRS-10/20/21). The use of a NIRO-TRS1 have also been reported, although it is worth noting that it is a research device which is not available for sale. Lastly, we can note that the tNIRS-1 has been approved for use as a medical device in Japan but has not obtained approval outside Japan as of March 2019 (Hamamatsu personal communication). Nevertheless, this approval in Japan is a great step towards the translation of the technique in the clinic. Indeed, the limited availability of these clinically-approved commercial systems is undoubtfully one of the main pitfalls of TD-NIRS, hindering its use in the hospital.
Regarding the data produced by TD-NIRS systems, it has been seen that a variety of information can be retrieved, as illustrated in Figure 5. Information could be extracted about (1) the absolute optical properties of tissue and path length; (2) the absolute value of haemoglobin and tissue saturation, either as a snapshot tomographic image, or as a time-course at specific locations to follow spontaneous changes, or changes due to a brain activation; (3) the in-depth kinetics of an ICG bolus time to assess perfusion; and (4) the perfusion measured by a DCS system and calibrated with a TD-NIRS system. In order to produce this information, different processing methods of the TPSF were used. It seems that the fitting approach is the most widespread in order to extract the optical properties of tissues. This is partly because this method is the one implemented in the Hamamatsu systems. When using in-house instruments, the moment method tends to be used, especially when ICG is used. Indeed, in the case of bolus tracking, the moments can be used directly to follow the kinetics of the contrast agent. Moreover, the different depth-sensitivity of the moments enables the bolus to be tracked in-depth. To date, there is no consensus on what the best method to extract the TPSF information content is, and it might also depend on the application. This open issue still needs to be evaluated but we can report that new methodological developments might help in this (see next section).
All of these different clinical applications require us to take advantages of the possibility of TD-NIRS to measure absolute values of brain tissue saturation and haemoglobin concentration, to compare either patients with controls, injured and less injured hemispheres, or the same patient over time. In all situations, TD-NIRS showed itself relatively easy to use and functionally robust. Even though TD-NIRS has the reputation of requiring bulky instruments, most of the instruments are transportable and useable at the patient bedside, without disrupting patient care.
Indeed, even though a large number of these clinical applications can be done using CW-NIRS systems, the inability of such instruments to interrogate the absorption and scattering properties of the brain tissue will affect their accuracy. This has been for example demonstrated in [93], where a modification of the scattering properties of TBI patients were reported, or in [91] where modification of the optical path length between the affected and unaffected hemispheres of stroke patients were noted. The use of TD-NIRS to acquire insight in anatomical differences of patients is, thus, an interesting path to explore and could justify their use even further. Moreover, the optical properties information extracted from TD-NIRS system could also be used to strengthen the application of the CW-NIRS, by providing more accurate information of path length, as has been seen in the applications in psychiatry. Lastly, it is worth mentioning that even though TD-NIRS can provide absolute information about HHb and HbO2 concentrations, the extraction of the absolute properties and then of the concentration of the chromophore are also subjected to assumptions that also limit the accuracy of TD-NIRS. Indeed, the fitting approach is usually based on the solution of the DE in simple homogeneous geometries which do not reflect the complexity of the head architecture [119]. Moreover, one major assumption that needs to be made to calculate the chromophore concentration from the absorption coefficient, is the number of chromophores considered. Indeed, it is usually assumed than HHb, HbO2 and water are the only significant absorbers, with the water content most often fixed to a certain value (i.e., usually 80% for adults) [41]. However, it is likely that this water content is highly subject-dependent, notably due to the variability of the thickness of skin, skull and CSF and that other chromophores might need to be considered [120]. New methodological and hardware developments are addressing these issues, and these will be detailed in the next section.
We could also see that by using complementary techniques, like DCE-TD-NIRS or TD-NIRS and DCS, it was possible to assess brain perfusion. In particular, the accuracy of the assessment of brain perfusion with the DCE technique, although achievable with a CW-NIRS system, is greatly improved by using TD-NIRS instrumentation, notably because it helps to distinguish between the extra- and intra-cerebral tissues. Having the possibility to continuously assess the CBF together with the brain oxygenation, at the bedside, is a true benefit because it can give information about both oxygen delivery and demand, facilitating the identification of the underlying issue. The novel development in that area (see next section) will probably contribute greatly to the adoption of TD-NIRS in the clinic.
Finally, TD-NIRS proved to be able to be easily integrated with other modalities, and that even simultaneous imaging was possible with MRI, MEG or EEG. As the use of multi-modality imaging in modern medicine is growing, because it helps to get a clearer picture of a patient condition, this capability is also a great strength for TD-NIRS. In the context of brain imaging, this possibility can be used to give a complete picture of the link between anatomical and functional disorders. From a functional point of view, it has the potential to show the links between the neuronal and vascular components of various conditions.
5. Current Developments in TD-NIRS and Clinical Pertinence
We have reviewed the current clinical applications of TD-NIRS for brain monitoring. The present review shows that current generation of TD-NIRS can be used in a clinical environment on patients with different pathologies. However, this technology is still not at its final stage and current progress made in different areas of TD-NIRS might help to push even more its use in the clinic. In the next sections, we will highlight the major novelties in TD-NIRS, which we think will help to promote its growth as a clinical tool.
5.1. Toward TD-NIRS Standardisation
The main reported drawback of NIRS is the lack of standardisation. Indeed, different systems can use different wavelengths, different source or detector types, or even different theoretical models. The use of TD-NIRS makes the standardisation of the NIRS measurement easier by extracting absolute information. Recently, new protocols have emerged in order to compare the results of different TD-NIRS systems. We can cite the MEDPHOT protocol [121], consisting of a set of calibrated phantoms that can be used to test the accuracy of the measured absorption and reduced scattering coefficient; the basic instrumental performance (BIP) protocol [122], consisting of a series of tests that enable us to compare the raw characteristics of different TD-NIRS instruments; and the nEUROPt protocol [123], that addresses the characteristics of optical brain imaging to detect, localize, and quantify absorption changes in the brain. The application of those protocols enables the community to qualitatively and quantitatively compare TD-NIRS instruments, independently of their raw characteristics or independently of the model used. Thus, large-scale clinical studies, even with slightly different TD-NIRS instruments, could be designed.
5.2. Instrumental Progress
In recent years, a great deal of progress has been made in TD-NIRS instrumentation. One of the issues that has to be addressed is to reduce the footprint of the instruments, often considered as bulky. Indeed, even though current systems are useable in a clinical context, the current generation are often mounted on racks which are significantly larger than typical CW-NIRS systems [57]. Reducing the footprint of instruments is therefore crucial in a clinical context where space is limited. Figure 6 illustrates newly developed hardware that illustrates the miniaturisation of TD-NIRS hardware by showing recently developed elements like miniaturized laser sources or detectors [124,125] no larger than few millimetres. Using these newly developed components, a compact two channel, two wavelength system which fits in a box has been reported, as presented in Figure 6e [126]. This illustrates well the future possibilities of TD-NIRS with instrumental footprints comparable to CW-NIRS systems already used in the clinic. Moreover, these new components have the great advantage of being cheap, which will reduce the overall cost of a TD-NIRS system, facilitating even more its implementation.
Another line of developments of TD-NIRS systems in order to make the measurement easier to handle for medical staff is non-contact imaging. Few non-contact TD-NIRS system are reported in the literature [127]. Such systems smooth the user experience since no expertise is required in fibre positioning. However, such imaging systems would be limited to specific applications, probably to the prefrontal cortex, since hairy regions are particularly difficult to image with such systems. Nevertheless, it is an avenue that needs to be explored. Other systems based on non-fibre emission and detection, in contact with the skin of the patient, have also been reported [128]. These systems not only remove the optical fibres, but also increase the SNR by reducing light losses.
5.3. Development of New Methodologies
In parallel with these technical developments, new methodologies have emerged that could be relevant in clinical applications, by improving the data quality, extracting more information or facilitating the operation of TD-NIRS system. For example, one of the particularities of TD measurements is the need to acquire an IRF to calibrate the measurement. This operation is time-consuming and is not always suitable in a clinical environment. A recent work by Milej and colleagues [132] reported a method based on a multi-distance TD-NIRS measurement that eliminates the need for the IRF. The removal of this extra measurement step would definitely benefit its adoption by the clinical community.
Other new methodological developments arise from hardware improvements. For example, the development of the new sources and detectors is not only beneficial in terms of miniaturisation, but also improves the quality of the raw signal. Indeed, one of the drawbacks of the TD-NIRS instrumentations over CW-NIRS systems is that it is more difficult to obtain a TPSF with a good SNR [49]. However, the newly developed sources and detectors can be used to perform a null source-detector distance measurement [133]. This approach is based on the fact that, unlike the CW technique, the source-detector distance does not influence the penetration depth in a TD measurement. Therefore, the sources and detectors can be positioned close together to increase the number of photons acquired, which greatly increases the SNR. Recently, Pifferi and colleagues reviewed the new developments in the concept and hardware of TD-NIRS [134], and showed not only that the SNR of TD-NIRS measurements would not be a problem anymore, but also that the new instrumentation and methodologies can help to improve the resolution, the contrast, or the depth sensitivity of the TD-NIRS measurement. Thus, measurements to assess structures deeper than 5–6 cm are reportedly possible [133]. Although these possibilities are still to be demonstrated practically, this could allow access to subcortical regions which would be a considerable asset in fields like TBI or stroke monitoring.
Another exciting development is the broadband or multi-wavelength TD-NIRS, which enables true spectroscopic analysis. Indeed, the systems presented in this review rarely use more than three wavelengths, which is enough to assess the haemoglobin content. However, being able to quantify other chromophores, like water or lipids, can help to increase the accuracy of the oxygen saturation, by actually quantifying contributions that were either assumed (i.e., water content) or not taken into account (i.e., fat content). Sekar and colleagues [120] have reported the development of a TD-NIRS instrument with a broadband capability, acquiring data from 600–1350 nm. This system has a slow acquisition speed (i.e., minutes per spectra) but could still be used to assess the brain status of patients at the bedside. Lange and colleagues [135] reported the development of a multiwavelength TD-NIRS system, capable of acquiring data at a rate compatible with a typical hemodynamic response, with 16 wavelengths in the range 650 to 870 nm. This system has been designed in order to target haemodynamic as well as CCO. This capability could be of interest in the clinic, as CCO has been shown to be a potential marker of brain injury in HIE [136]. In the context of HIE, some interesting work has been reported recently, using a TD-NIRS instrument to non-invasively monitor the brain temperature [137]. The method has been tested on piglet with promising results. As hypothermic therapy is now the standard treatment for neonates, but optimal protocols are yet to be established (i.e., in terms of duration and depth of treatment, for example) [138], the ability to monitor brain temperature non-invasively at the bedside would certainly be another argument in favour of the clinical use of TD-NIRS.
The last big methodological development, which was discussed in an earlier section, was the ability to measure brain perfusion. It has been shown that the use of TD-NIRS in combination with DCS could improve the data quality of the BFI retrieved by the DCS. However, the current DCS measurement suffers from the same drawback as CW-NIRS, being the contamination of the signal by extracerebral layers. Baker and colleagues in 2015 used a combination of short and long source-detector distance DCS with pressure modulation (head blood pressure cuff) to remove extracerebral contributions in the DCS signal [139]. However, a recent development called TD-diffuse correlation spectroscopy (TD-DCS) has been reported, allowing DCS measurement in the TD regime [137]. Thus, through the use of time gating, an in-depth measurement of the BFI became possible, improving the accuracy of the measurement of the cerebral blood flow [138]. Finally, it is also worth mentioning that while most of the DCS systems reported in the literature only have one channel, Delgado-Mederos and colleagues have recently demonstrated a dual channel DCS allowing bi-hemispheric measurements in stroke patients [140]. This illustrates the potential development of multi-channel DCS.
Finally, as seen in this review, imaging patients differs from imaging healthy subjects because normal tissue configuration cannot always be assumed. A recent study by Ancora and colleagues [141] showed that it might be possible to use TD-NIRS to evaluate the progression of brain atrophy in patients. Indeed, the late photons of the TPSF seems to be sensitive to the thickness of the CSF layer. However, this simulation study showed that this technique would require the acquisition of photons with very long arrival time (>2.5 ns) with a good enough SNR. In that sense, the newly developed detector might help to push this methodology forward.
On the other hand, the structural changes consecutive to some pathologies also suggests that classical models might not work in all cases. However, as it has been seen, NIRS is extremely well-suited for multimodal imaging. Therefore, combining anatomical imaging with NIRS allows for model-patient specific geometry that will increase the NIRS accuracy [142]. Here, the progress being done in terms of Monte-Carlo modelling, especially in terms of calculation speed [143], unlock new possibilities for it to be used in real-time at the bedside.
6. Conclusions
The use of NIRS technology has drawn a great deal of attention in the last four decades, due to its potential to continuously monitor the brain tissue physiology non-invasively, in real-time and at the patient bedside. However, the lack of reference values of brain tissue oxygen saturation coupled with the inherent limitations of the commonly-used CW-NIRS systems, in terms of accuracy and capability to differentiate non-cortical and cortical tissues, have hindered the popularity of NIRS. On the other hand, TD-NIRS systems have not been as popular because of their complexity and the lack of system availability commercially, with only one company selling instruments. However, in recent years, a few publications have reported successful clinical work using TD-NIRS. Indeed, this technique presents the unique advantage of measuring the distribution of the time of flight of photons. The amount of information contained in those DTOFs enables us to retrieve the optical properties ( and ) of the tissue, even with only one channel. Having access to the absolute optical properties allows us to retrieve absolute concentration of haemoglobin and tissue saturation that are more robust than the those acquired via CW-NIRS systems, which only assume a constant, non-patient-specific .
Moreover, it has also been shown that could be used as a biomarker of TBI and that it was possible to follow the development of brain atrophy, for example in patients with neurodegenerative disease, by looking at the distribution of the late photons of the TPSF. These works reinforce the importance of the information acquired with TD-NIRS, which has the potential to not only measure brain oxygenation accurately, but also to give some insights to the brain tissue structure.
It is worth mentioning that TD-NIRS can be coupled with DCE and/or DCS in order to monitor brain perfusion. The use of the moments allows DCE-TD-NIRS to extract an in-depth measure of the brain perfusion, improving the accuracy of its estimation over DCE-CW-NIRS. Additionally, combining DCE-TD-NIRS with DCS allows us to continuously monitor the brain perfusion, reported in physiological units, which facilitates better clinical interpretation.
Finally, both the cost and the size of the TD-NIRS instruments have repeatedly been reported as the main disadvantages of this technique. However, the recent instrumental developments allow the reduction of both the cost and the size of the TD-NIRS systems. Therefore, we have no doubt that these improvements, coupled with the great possibilities offered by TD-NIRS to extract accurate brain oxygenation information, together with insights of the brain tissue structure, will enhance and further facilitate the popularity of TD-NIRS in clinical environments.
Supplementary Materials
The following are available online at https://www.mdpi.com/2076-3417/9/8/1612/s1, Video S1. Depth sensitivity of the gating method.
Author Contributions
F.L. and I.T. conceived and designed the study. F.L. conducted the literature search and drafted the first version of the paper. F.L. and I.T. commented on, revised and approved the manuscript.
Funding
This research was funded by The Wellcome Trust (grant number 104580/Z/14/Z).
Acknowledgments
The authors would like to thank Luke Dunne for providing the video presented in the supplementary material.
Conflicts of Interest
The authors declare no conflict of interest.
References
- Smith, M. Shedding light on the adult brain: A review of the clinical applications of near-infrared spectroscopy. Philos. Trans. A. Math. Phys. Eng. Sci. 2011, 369, 4452–4469. [Google Scholar] [CrossRef] [PubMed]
- Jacques, S.L. Optical Properties of Biological Tissues: A Review. Phys. Med. Biol. 2013, 58, R37–R61. [Google Scholar] [CrossRef]
- Jobsis, F. Noninvasive, infrared monitoring of cerebral and myocardial oxygen sufficiency and circulatory parameters. Science 1977, 198, 1264–1267. [Google Scholar] [CrossRef] [PubMed]
- Wolf, M.; Ferrari, M.; Quaresima, V. Progress of near-infrared spectroscopy and topography for brain and muscle clinical applications. J. Biomed. Opt. 2007, 12, 62104. [Google Scholar]
- Grosenick, D.; Rinneberg, H.; Cubeddu, R.; Taroni, P. Review of optical breast imaging and spectroscopy. J. Biomed. Opt. 2016, 21, 091311. [Google Scholar] [CrossRef] [Green Version]
- Obrig, H. NIRS in clinical neurology—A ‘promising’ tool? Neuroimage 2014, 85, 535–546. [Google Scholar] [CrossRef]
- Weigl, W.; Milej, D.; Janusek, D.; Wojtkiewicz, S.; Sawosz, P.; Kacprzak, M.; Gerega, A.; Maniewski, R.; Liebert, A. Application of optical methods in the monitoring of traumatic brain injury: A review. J. Cereb. Blood Flow Metab. 2016, 36, 1825–1843. [Google Scholar] [CrossRef] [PubMed] [Green Version]
- Murkin, J.M.; Arango, M. Near-infrared spectroscopy as an index of brain and tissue oxygenation. Br. J. Anaesth. 2009, 103, i3–i13. [Google Scholar] [CrossRef]
- Nielsen, H.B. Systematic review of near-infrared spectroscopy determined cerebral oxygenation during non-cardiac surgery. Front. Physiol. 2014, 5, 1–15. [Google Scholar] [CrossRef]
- Greisen, G.; Leung, T.; Wolf, M. Has the time come to use near-infrared spectroscopy as a routine clinical tool in preterm infants undergoing intensive care? Philos. Trans. R. Soc. A Math. Phys. Eng. Sci. 2011, 369, 4440–4451. [Google Scholar] [CrossRef] [Green Version]
- Chou, P.H.; Lan, T.H. The role of near-infrared spectroscopy in Alzheimer’s disease. J. Clin. Gerontol. Geriatr. 2013, 4, 33–36. [Google Scholar] [CrossRef]
- Ehlis, A.-C.; Schneider, S.; Dresler, T.; Fallgatter, A.J. Application of functional near-infrared spectroscopy in psychiatry. Neuroimage 2014, 85 Pt 1, 478–488. [Google Scholar] [CrossRef]
- Hillman, E.M.C. Experimental and Theoretical Investigations of Near Infrared Tomographic Imaging Methods and Clinical Applications. Ph.D. Thesis, University College London, London, UK, 2002. [Google Scholar]
- Ehlis, A.-C.; Barth, B.; Hudak, J.; Storchak, H.; Weber, L.; Kimmig, A.-C.S.; Kreifelts, B.; Dresler, T.; Fallgatter, A.J. Near-Infrared Spectroscopy as a New Tool for Neurofeedback Training: Applications in Psychiatry and Methodological Considerations. Jpn. Psychol. Res. 2018, 60, 225–241. [Google Scholar] [CrossRef]
- Scholkmann, F.; Kleiser, S.; Metz, A.J.; Zimmermann, R.; Mata Pavia, J.; Wolf, U.; Wolf, M. A review on continuous wave functional near-infrared spectroscopy and imaging instrumentation and methodology. Neuroimage 2014, 85, 6–27. [Google Scholar] [CrossRef] [Green Version]
- SfNIRS Instrument List. Available online: https://fnirs.org/resources/instruments/ (accessed on 1 March 2019).
- Jacques, S.L.; Pogue, B.W. Tutorial on diffuse light transport. J. Biomed. Opt. 2008, 13, 041302. [Google Scholar] [CrossRef]
- Pifferi, A.; Farina, A.; Torricelli, A.; Quarto, G.; Cubeddu, R.; Taronia, P. Review: Time-domain broadband near infrared spectroscopy of the female breast: A focused review from basic principles to future perspectives. J. Near Infrared Spectrosc. 2012, 20, 223. [Google Scholar] [CrossRef]
- Durduran, T.; Choe, R.; Baker, W.B.; Yodh, A.G. Diffuse optics for tissue monitoring and tomography. Rep. Prog. Phys. 2010, 73, 076701. [Google Scholar] [CrossRef]
- Arridge, S.R.; Schotland, J.C. Optical tomography: Forward and inverse problems. Inverse Probl. 2009, 25, 123010. [Google Scholar] [CrossRef]
- Fang, Q.; Boas, D. Monte Carlo simulation of photon migration in 3D turbid media accelerated by graphics processing units. Opt. Express 2009, 17, 20178–20190. [Google Scholar] [CrossRef]
- Schweiger, M.; Arridge, S.R. The Toast++ software suite for forward and inverse modeling in optical tomography. J. Biomed. Opt. 2014, 19, 040801. [Google Scholar] [CrossRef] [Green Version]
- Dehghani, H.; Eames, M.E.; Yalavarthy, P.K.; Davis, S.C.; Srinivasan, S.; Carpenter, C.M.; Pogue, B.W.; Paulsen, K.D. Near infrared optical tomography using NIRFAST: Algorithm for numerical model and image reconstruction. Commun. Numer. Methods Eng. 2008, 25, 711–732. [Google Scholar] [CrossRef]
- Contini, D.; Zucchelli, L.; Spinelli, L.; Caffini, M.; Re, R.; Pifferi, A.; Cubeddu, R.; Torricelli, A. Review: Brain and muscle near infrared spectroscopy/imaging techniques. J. Near Infrared Spectrosc. 2012, 20, 15. [Google Scholar] [CrossRef]
- Sassaroli, A.; Fantini, S. Comment on the modified Beer–Lambert law for scattering media. Phys. Med. Biol. 2004, 49, N255–N257. [Google Scholar] [CrossRef]
- Duncan, A.; Meek, J.H.; Clemence, M.; Elwell, C.E.; Tyszczuk, L.; Cope, M.; Delpy, D. Optical pathlength measurements on adult head, calf and forearm and the head of the newborn infant using phase resolved optical spectroscopy. Phys. Med. Biol. 1995, 40, 295–304. [Google Scholar] [CrossRef] [PubMed]
- Scholkmann, F.; Wolf, M. General equation for the differential pathlength factor of the frontal human head depending on wavelength and age. J. Biomed. Opt. 2013, 18, 105004. [Google Scholar] [CrossRef] [PubMed] [Green Version]
- Matcher, S.J.; Kirkpatrick, P.J.; Nahid, K.; Cope, M.; Delpy, D.T. Absolute quantification methods in tissue near-infrared spectroscopy. In Proceedings of the Optical Tomography, Photon Migration, and Spectroscopy of Tissue and Model Media: Theory, Human Studies, and Instrumentation; Chance, B., Alfano, R.R., Eds.; International Society for Optics and Photonics: San Jose, CA, USA, 1995; Volume 2389, pp. 486–495. [Google Scholar]
- Al-Rawi, P.G.; Smielewski, P.; Kirkpatrick, P.J. Evaluation of a near-infrared spectrometer (NIRO 300) for the detection of intracranial oxygenation changes in the adult head. Stroke 2001, 32, 2492–2500. [Google Scholar] [CrossRef] [PubMed]
- Pocivalnik, M.; Pichler, G.; Zotter, H.; Tax, N.; Müller, W.; Urlesberger, B. Regional tissue oxygen saturation: Comparability and reproducibility of different devices. J. Biomed. Opt. 2011, 16, 057004. [Google Scholar] [CrossRef]
- Diop, M.; Tichauer, K.M.; Elliott, J.T.; Migueis, M.; Lee, T.-Y.; St. Lawrence, K. Comparison of time-resolved and continuous-wave near-infrared techniques for measuring cerebral blood flow in piglets. J. Biomed. Opt. 2010, 15, 057004. [Google Scholar] [CrossRef] [Green Version]
- Bale, G.; Elwell, C.E.; Tachtsidis, I. From Jöbsis to the present day: A review of clinical near-infrared spectroscopy measurements of cerebral cytochrome-c-oxidase. J. Biomed. Opt. 2016, 21, 091307. [Google Scholar] [CrossRef]
- Ferrari, M.; Norris, H.; Sowa, M.G. Medical near infrared spectroscopy 35 years after the discovery Guest editorial. J. Near Infrared Spectrosc. 2012, 20, 7–9. [Google Scholar] [CrossRef]
- White, B.R.; Culver, J.P. Quantitative evaluation of high-density diffuse optical tomography: In vivo resolution and mapping performance. J. Biomed. Opt. 2010, 15, 26006. [Google Scholar] [CrossRef] [PubMed]
- Fantini, S. Frequency-domain multichannel optical detector for noninvasive tissue spectroscopy and oximetry. Opt. Eng. 1995, 34, 32. [Google Scholar] [CrossRef] [Green Version]
- Gunadi, S.; Leung, T.S.; Elwell, C.E.; Tachtsidis, I. Spatial sensitivity and penetration depth of three cerebral oxygenation monitors. Biomed. Opt. Express 2014, 5, 2896–2912. [Google Scholar] [CrossRef] [PubMed]
- Davies, D.J.; Clancy, M.; Lighter, D.; Balanos, G.M.; Lucas, S.J.E.; Dehghani, H.; Su, Z.; Forcione, M.; Belli, A. Frequency-domain vs continuous-wave near-infrared spectroscopy devices: A comparison of clinically viable monitors in controlled hypoxia. J. Clin. Monit. Comput. 2017, 31, 967–974. [Google Scholar] [CrossRef] [PubMed]
- Patterson, M.; Chance, B.; Wilson, B.C. Time resolved reflectance and transmittance for the non-invasive measurement of tissue optical properties. Appl. Opt. 1989, 28, 2331–2336. [Google Scholar] [CrossRef]
- Cubeddu, R.; Pifferi, A.; Taroni, P.; Torricelli, A.; Valentini, G. Experimental test of theoretical models for time-resolved reflectance. Med. Phys. 1996, 23, 1625. [Google Scholar] [CrossRef] [PubMed]
- Liemert, A.; Kienle, A. Light diffusion in N-layered turbid media: Frequency and time domains. J. Biomed. Opt. 2010, 15, 025002. [Google Scholar] [CrossRef] [PubMed]
- Oda, M.; Yamashita, Y.; Nakano, T.; Suzuki, A.; Shimizu, K.; Hirano, I.; Shimomura, F.; Ohmae, E.; Suzuki, T.; Tsuchiya, Y. Near-infrared time-resolved spectroscopy system for tissue oxygenation monitor. Proc. SPIE 2000, 4160, 204–210. [Google Scholar]
- Valim, N.; Brock, J.; Leeser, M.; Niedre, M. The effect of temporal impulse response on experimental reduction of photon scatter in time-resolved diffuse optical tomography. Phys. Med. Biol. 2013, 58, 335–349. [Google Scholar] [CrossRef] [PubMed]
- Spinelli, L.; Martelli, F.; Farina, A.; Pifferi, A.; Torricelli, A.; Cubeddu, R.; Zaccanti, G. Accuracy of the nonlinear fitting procedure for time-resolved measurements on diffusive phantoms at NIR wavelengths. In Optical Tomography and Spectroscopy of Tissue VIII; International Society for Optics and Photonics: San Jose, CA, USA, 2009. [Google Scholar]
- Kohl-Bareis, M.; Nolte, C.; Heekeren, H.R.; Horst, S.; Scholz, U.; Obrig, H.; Villringer, A. Determination of the wavelength dependence of the differential pathlength factor from near-infrared pulse signals. Phys. Med. Biol. 1998, 43, 1771–1782. [Google Scholar] [CrossRef]
- Liebert, A.; Wabnitz, H.; Grosenick, D.; Möller, M.; Macdonald, R.; Rinneberg, H. Evaluation of optical properties of highly scattering media by moments of distributions of times of flight of photons. Appl. Opt. 2003, 42, 5785. [Google Scholar] [CrossRef] [PubMed]
- Liebert, A.; Wabnitz, H.; Steinbrink, J.; Obrig, H.; Möller, M.; Macdonald, R.; Villringer, A.; Rinneberg, H. Time-resolved multidistance near-infrared spectroscopy of the adult head: Intracerebral and extracerebral absorption changes from moments of distribution of times of flight of photons. Appl. Opt. 2004, 43, 3037. [Google Scholar] [CrossRef]
- Zucchelli, L.; Contini, D.; Re, R.; Torricelli, A.; Spinelli, L. Method for the discrimination of superficial and deep absorption variations by time domain fNIRS. Biomed. Opt. Express 2013, 4, 2893. [Google Scholar] [CrossRef] [PubMed]
- Dunne, L. Development of a Novel Multiwavelength, Time Resolved, Near Infrared Spectrometer Declaration of Authorship. Ph.D. Thesis, University College London, London, UK, 2016. [Google Scholar]
- Selb, J.; Stott, J.J.; Franceschini, M.A.; Sorensen, A.G.; Boas, D. Improved sensitivity to cerebral hemodynamics during brain activation with a time-gated optical system: Analytical model and experimental validation. J. Biomed. Opt. 2005, 10, 11013. [Google Scholar] [CrossRef] [PubMed]
- Lange, F.; Peyrin, F.; Montcel, B. Broadband time-resolved multi-channel functional near-infrared spectroscopy system to monitor in vivo physiological changes of human brain activity. Appl. Opt. 2018, 57, 6417. [Google Scholar] [CrossRef] [PubMed]
- Alayed, M.; Deen, M. Time-Resolved Diffuse Optical Spectroscopy and Imaging Using Solid-State Detectors: Characteristics, Present Status, and Research Challenges. Sensors 2017, 17, 2115. [Google Scholar] [CrossRef] [PubMed]
- Habermehl, C.; Schmitz, C.H.; Steinbrink, J. Contrast enhanced high-resolution diffuse optical tomography of the human brain using ICG. Opt. Express 2011, 19, 18636–18644. [Google Scholar] [CrossRef] [PubMed] [Green Version]
- Boushel, R.; Langberg, H.; Olesen, J.; Nowak, M.; Simonsen, L.; Bulow, J.; Kjar, M. Regional blood flow during exercise in humans measured by near-infrared spectroscopy and indocyanine green Regional blood flow during exercise in humans measured by near-infrared spectroscopy and indocyanine green. J. Appl. Physiol. 2000, 89, 1868–1878. [Google Scholar] [CrossRef]
- Elliott, J.T.; Milej, D.; Gerega, A.; Weigl, W.; Diop, M.; Morrison, L.B.; Lee, T.-Y.; Liebert, A.; St Lawrence, K. Variance of time-of-flight distribution is sensitive to cerebral blood flow as demonstrated by ICG bolus-tracking measurements in adult pigs. Biomed. Opt. Express 2013, 4, 206–218. [Google Scholar] [CrossRef] [Green Version]
- Diop, M.; Verdecchia, K.; Lee, T.-Y.; St Lawrence, K. Calibration of diffuse correlation spectroscopy with a time-resolved near-infrared technique to yield absolute cerebral blood flow measurements: Errata. Biomed. Opt. Express 2012, 3, 1476. [Google Scholar] [CrossRef]
- Durduran, T.; Zhou, C.; Edlow, B.L.; Yu, G.; Choe, R.; Kim, M.N.; Cucchiara, B.L.; Putt, M.E.; Shah, Q.; Kasner, S.E.; et al. Transcranial optical monitoring of cerebrovascular hemodynamics in acute stroke patients. Opt. Express 2009, 17, 3884. [Google Scholar] [CrossRef] [PubMed]
- Torricelli, A.; Contini, D.; Pifferi, A.; Caffini, M.; Re, R.; Zucchelli, L.; Spinelli, L. Time domain functional NIRS imaging for human brain mapping. Neuroimage 2014, 85, 28–50. [Google Scholar] [CrossRef] [PubMed] [Green Version]
- Weigl, W.; Milej, D.; Gerega, A.; Toczylowska, B.; Kacprzak, M.; Sawosz, P.; Botwicz, M.; Maniewski, R.; Mayzner-Zawadzka, E.; Liebert, A. Assessment of cerebral perfusion in post-traumatic brain injury patients with the use of ICG-bolus tracking method. Neuroimage 2014, 85, 555–565. [Google Scholar] [CrossRef] [PubMed]
- Giovannella, M.; Andresen, B.; De Carli, A.; Pagliazzi, M.; Fumagalli, M.; Greisen, G.; Contini, D.; Pifferi, A.; Spinelli, L.; Durduran, T.; et al. The BabyLux device: Baseline hemodynamic and optical properties of the newborn brain and the reproducibility of the measurements. In Proceedings of the Biophotonics Congress: Biomedical Optics Congress 2018 (Microscopy/Translational/Brain/OTS); Optical Society of America: Washington, DC, USA, 2018; p. OW4C.2. [Google Scholar]
- He, L.; Baker, W.B.; Busch, D.R.; Jiang, J.Y.; Lawrence, K.S.; Kofke, W.A.; Yodh, A.G.; He, L.; Baker, W.B.; Milej, D.; et al. Noninvasive continuous optical monitoring of absolute cerebral blood flow in critically ill adults. Neurophotonics 2018, 5, 1. [Google Scholar]
- Lee, C.W.; Cooper, R.J.; Austin, T. Diffuse optical tomography to investigate the newborn brain. Pediatr. Res. 2017, 82, 376–386. [Google Scholar] [CrossRef] [PubMed] [Green Version]
- Hintz, S.R.; Benaron, D.A.; Van Houten, J.P.; Duckworth, J.L.; Liu, F.W.H.; Spilman, S.D.; Stevenson, D.K.; Cheong, W.F. Stationary Headband for Clinical Time-of-Flight Optical Imaging at the Bedside. Photochem. Photobiol. 1998, 68, 361–369. [Google Scholar] [CrossRef]
- Hintz, S.R.; Cheong, W.-F.; Van Houten, J.P.; Stevenson, D.K.; Benaron, D.A. Bedside Imaging of Intracranial Hemorrhage in the Neonate Using Light: Comparison with Ultrasound, Computed Tomography, and Magnetic Resonance Imaging. Pediatr. Res. 1999, 45, 54. [Google Scholar] [CrossRef]
- Hintz, S.R.; Benaron, D.A.; Siegel, A.M.; Zourabian, A.; Stevenson, D.K.; Boas, D.A. Bedside functional imaging of the premature infant brain during passive motor activation. J. Perinat. Med. 2001, 29, 335–343. [Google Scholar] [CrossRef]
- Benaron, D.A.; Hintz, S.R.; Villringer, A.; Boas, D.; Kleinschmidt, A.; Frahm, J.; Hirth, C.; Obrig, H.; van Houten, J.C.; Kermit, E.L.; et al. Noninvasive functional imaging of human brain using light. J. Cereb. Blood Flow Metab. 2000, 20, 469–477. [Google Scholar] [CrossRef]
- Hintz, S.R.; Benaron, D.A.; Siegel, A.M.; Stevenson, D.K.; Boas, D.A. Real-Time Functional Imaging of the Premature Infant Brain during Passive Motor Activation. Pediatr. Res. 1999, 45, 343A. [Google Scholar] [CrossRef]
- Schmidt, F.E.W.; Fry, M.E.; Hillman, E.M.C.; Hebden, J.C.; Delpy, D.T. A 32-channel time-resolved instrument for medical optical tomography. Rev. Sci. Instrum. 2000, 71, 256. [Google Scholar] [CrossRef]
- Cooper, R.J.; Magee, E.; Everdell, N.; Magazov, S.; Varela, M.; Airantzis, D.; Gibson, A.P.; Hebden, J.C. MONSTIR II: A 32-channel, multispectral, time-resolved optical tomography system for neonatal brain imaging. Rev. Sci. Instrum. 2014, 85, 053105. [Google Scholar] [CrossRef] [PubMed]
- Austin, T.; Gibson, A.P.; Branco, G.; Yusof, R.M.; Arridge, S.R.; Meek, J.H.; Wyatt, J.S.; Delpy, D.T.; Hebden, J.C. Three dimensional optical imaging of blood volume and oxygenation in the neonatal brain. Neuroimage 2006, 31, 1426–1433. [Google Scholar] [CrossRef] [Green Version]
- Hebden, J.C.; Gibson, A.; Yusof, R.M.; Everdell, N.; Hillman, E.M.C.; Delpy, D.T.; Arridge, S.R.; Austin, T.; Meek, J.H.; Wyatt, J.S. Three-dimensional optical tomography of the premature infant brain. Phys. Med. Biol. 2002, 47, 4155–4166. [Google Scholar] [CrossRef]
- Hebden, J.C.; Gibson, A.P.; Austin, T.; Yusof, R.M.; Everdell, N.; Delpy, D.T.; Arridge, S.R.; Meek, J.H.; Wyatt, J.S. Imaging changes in blood volume and oxygenation in the newborn infant brain using three-dimensional optical tomography. Phys. Med. Biol. 2004, 49, 1117–1130. [Google Scholar] [CrossRef] [PubMed]
- Gibson, A.P.; Austin, T.; Everdell, N.; Schweiger, M.; Arridge, S.R.; Meek, J.H.; Wyatt, J.S.; Delpy, D.T.; Hebden, J.C. Three-dimensional whole-head optical tomography of passive motor evoked responses in the neonate. Neuroimage 2006, 30, 521–528. [Google Scholar] [CrossRef] [PubMed]
- Dempsey, L.A.; Cooper, R.J.; Powell, S.; Edwards, A.; Lee, C.-W.; Brigadoi, S.; Everdell, N.; Arridge, S.R.; Gibson, A.P.; Austin, T.; et al. Whole-head functional brain imaging of neonates at cot-side using time-resolved diffuse optical tomography. Prog. Biomed. Opt. Imaging Proc. SPIE 2015, 9538, 1–10. [Google Scholar]
- Dempsey, L.A. Development and Application of Diffuse Optical Tomography Systems for Diagnosis and Assessment of Perinatal Brain Injury. Ph.D. Thesis, University College London, London, UK, 2018. [Google Scholar]
- Koyano, K.; Kusaka, T.; Nakamura, S.; Nakamura, M.; Konishi, Y.; Miki, T.; Ueno, M.; Yasuda, S.; Okada, H.; Nishida, T.; et al. The effect of blood transfusion on cerebral hemodynamics in preterm infants. Transfusion 2013, 53, 1459–1467. [Google Scholar] [CrossRef]
- Ishii, H.; Takami, T.; Fujioka, T.; Mizukaki, N.; Kondo, A.; Sunohara, D.; Hoshika, A.; Akutagawa, O.; Isaka, K. Comparison of changes in cerebral and systemic perfusion between appropriate- and small-for-gestational-age infants during the first three days after birth. Brain Dev. 2014, 36, 380–387. [Google Scholar] [CrossRef]
- Fujioka, T.; Takami, T.; Ishii, H.; Kondo, A.; Sunohara, D. Difference in Cerebral and Peripheral Hemodynamics among Term and Preterm Infants during the First Three Days of Life. Neonatology 2014, 106, 181–187. [Google Scholar] [CrossRef]
- Nakamura, S.; Koyano, K.; Jinnai, W.; Hamano, S.; Yasuda, S.; Konishi, Y.; Kuboi, T.; Kanenishi, K.; Nishida, T.; Kusaka, T. Simultaneous measurement of cerebral hemoglobin oxygen saturation and blood volume in asphyxiated neonates by near-infrared time-resolved spectroscopy. Brain Dev. 2015, 37, 925–932. [Google Scholar] [CrossRef] [PubMed]
- Hoshino, T.; Sakatani, K.; Yokose, N.; Awano, T.; Nakamura, S.; Murata, Y.; Kano, T.; Katayama, Y. Changes in Cerebral Blood Oxygenation and Hemodynamics After Endovascular Treatment of Vascular Malformation Measured by Time-Resolved Spectroscopy BT-Oxygen Transport to Tissue XXXI; Takahashi, E., Bruley, D.F., Eds.; Springer: Boston, MA, USA, 2010; pp. 491–496. [Google Scholar]
- Ijichi, S.; Kusaka, T.; Isobe, K.; Okubo, K.; Kawada, K.; Namba, M.; Okada, H.; Nishida, T.; Imai, T.; Itoh, S. Developmental changes of optical properties in neonates determined by near-infrared time-resolved spectroscopy. Pediatr. Res. 2005, 58, 568–573. [Google Scholar] [CrossRef]
- Spinelli, L.; Zucchelli, L.; Contini, D.; Caffini, M.; Mehler, J.; Fló, A.; Ferry, A.L.; Filippin, L.; Macagno, F.; Cattarossi, L.; et al. In vivo measure of neonate brain optical properties and hemodynamic parameters by time-domain near-infrared spectroscopy. Neurophotonics 2017, 4, 1. [Google Scholar] [CrossRef] [PubMed]
- Giacalone, G.; Zanoletti, M.; Contini, D.; Re, R.; Spinelli, L.; Roveri, L.; Torricelli, A. Cerebral time domain-NIRS: Reproducibility analysis, optical properties, hemoglobin species and tissue oxygen saturation in a cohort of adult subjects. Biomed. Opt. Express 2017, 8, 4987. [Google Scholar] [CrossRef]
- Obrig, H.; Steinbrink, J. Non-invasive optical imaging of stroke. Philos. Trans. R. Soc. A Math. Phys. Eng. Sci. 2011, 369, 4470–4494. [Google Scholar] [CrossRef] [PubMed] [Green Version]
- Liebert, A.; Wabnitz, H.; Steinbrink, J.; Möller, M.; Macdonald, R.; Rinneberg, H.; Villringer, A.; Obrig, H. Bed-side assessment of cerebral perfusion in stroke patients based on optical monitoring of a dye bolus by time-resolved diffuse reflectance. Neuroimage 2005, 24, 426–435. [Google Scholar] [CrossRef] [PubMed]
- Liebert, A.; Milej, D.; Weigl, W.; Gerega, A.; Kacprzak, M.; Mayzner-Zawadzka, E.; Maniewski, R. Assessment of brain perfusion disorders by ICG bolus tracking with time-resolved fluorescence monitoring. In Proceedings of the Biomedical Optics and 3-D Imaging; OSA: Washington, DC, USA, 2012; p. BTu3A.20. [Google Scholar]
- Steinkellner, O.; Wabnitz, H.; Jelzow, A.; MacDonald, R.; Gruber, C.; Steinbrink, J.; Obrig, H. Cerebral perfusion in acute stroke monitored by time-domain near-infrared reflectometry. Biocybern. Biomed. Eng. 2012, 32, 3–16. [Google Scholar] [CrossRef]
- Leistner, S.; Sander-Thoemmes, T.; Wabnitz, H.; Moeller, M.; Wachs, M.; Curio, G.; Macdonald, R.; Trahms, L.; Mackert, B.-M. Non-invasive simultaneous recording of neuronal and vascular signals in subacute ischemic stroke. Biomed. Tech. Eng. 2011, 56, 85–90. [Google Scholar] [CrossRef] [PubMed]
- Giacalone, G.; Germinario, B.; Roveri, L.; Giacalone, G.; Zanoletti, M.; Re, R.; Germinario, B.; Contini, D.; Spinelli, L. Time-domain near-infrared spectroscopy in acute ischemic stroke patients. Neurophotonics 2019, 6, 1. [Google Scholar] [CrossRef]
- Yokose, N.; Sakatani, K.; Murata, Y.; Awano, T.; Igarashi, T.; Nakamura, S.; Hoshino, T.; Kano, T.; Yoshino, A.; Katayama, Y.; et al. Bedside Assessment of Cerebral Vasospasms After Subarachnoid Hemorrhage by Near Infrared Time-Resolved Spectroscopy BT-Oxygen Transport to Tissue XXXI; Takahashi, E., Bruley, D.F., Eds.; Springer: Boston, MA, USA, 2010; pp. 505–511. [Google Scholar]
- Yokose, N.; Sakatani, K.; Murata, Y.; Awano, T.; Igarashi, T.; Nakamura, S.; Hoshino, T.; Katayama, Y. Bedside Monitoring of Cerebral Blood Oxygenation and Hemodynamics after Aneurysmal Subarachnoid Hemorrhage by Quantitative Time-Resolved Near-Infrared Spectroscopy. World Neurosurg. 2010, 73, 508–513. [Google Scholar] [CrossRef]
- Sato, Y.; Komuro, Y.; Lin, L.; Tang, Z.; Hu, L.; Kadowaki, S.; Ugawa, Y.; Yamada, Y.; Sakatani, K. Differences in Tissue Oxygenation, Perfusion and Optical Properties in Brain Areas Affected by Stroke: A Time-Resolved NIRS Study BT—Oxygen Transport to Tissue XL; Thews, O., LaManna, J.C., Harrison, D.K., Eds.; Springer International Publishing: Cham, Switzerland, 2018; pp. 63–67. ISBN 978-3-319-91287-5. [Google Scholar]
- Davies, D.J.; Su, Z.; Clancy, M.T.; Lucas, S.J.E.; Dehghani, H.; Logan, A.; Belli, A. Near-Infrared Spectroscopy in the Monitoring of Adult Traumatic Brain Injury: A Review. J. Neurotrauma 2015, 32, 933–941. [Google Scholar] [CrossRef] [PubMed] [Green Version]
- Highton, D.; Tachtsidis, I.; Tucker, A.; Elwell, C.; Smith, M. Near Infrared Light Scattering Changes Following Acute Brain Injury; Advances in Experimental Medicine and Biology; Elwell, C.E., Leung, T.S., Harrison, D.K., Eds.; Springer: New York, NY, USA, 2016; Volume 876, ISBN 978-1-4939-3022-7. [Google Scholar]
- Lanks, C.W.; Kim, C.B.; Fu, J.; DaCosta, D.; Chang, D.W.; Hsia, D.; Stringer, W.W.; Rossiter, H.B. A Pilot Study of Cortical Oxygenation in Septic Shock by Time-Resolved Near-Infrared Spectroscopy. In A51. Critical Care: Risk Stratification and Prognostication—From Bedside to Big Data; American Thoracic Society International Conference Abstracts; American Thoracic Society: Washington, DC, USA, 2017; p. A1803. [Google Scholar]
- Lanks, C.; Kim, C.B.; Rossiter, H.B. A “NIRS” death experience: A reduction in cortical oxygenation by time-resolved near-infrared spectroscopy preceding cardiac arrest. J. Clin. Monit. Comput. 2018, 32, 683–686. [Google Scholar] [CrossRef] [PubMed]
- Liebert, A.; Milej, D.; Weigl, W.; Toczyłowska, B.; Gerega, A.; Kacprzak, M.; Maniewski, R. Evaluation of ICG washout based on time-resolved monitoring of fluorescence in patients with severe cerebral perfusion abnormalities. In Proceedings of the Biomedical Optics 2014; Optical Society of America: Miami, FL, USA, 2014; p. BW2B.6. [Google Scholar]
- Weigl, W.; Milej, D.; Gerega, A.; Toczyłowska, B.; Sawosz, P.; Kacprzak, M.; Janusek, D.; Wojtkiewicz, S.; Maniewski, R.; Liebert, A. Confirmation of brain death using optical methods based on tracking of an optical contrast agent: Assessment of diagnostic feasibility. Sci. Rep. 2018, 8, 7332. [Google Scholar] [CrossRef] [PubMed]
- Shinba, T.; Nagano, M.; Kariya, N.; Ogawa, K.; Shinozaki, T.; Shimosato, S.; Hoshi, Y. Near-infrared spectroscopy analysis of frontal lobe dysfunction in schizophrenia. Biol. Psychiatry 2004, 55, 154–164. [Google Scholar] [CrossRef]
- Hoshi, Y.; Shinba, T.; Sato, C.; Doi, N. Resting hypofrontality in schizophrenia: A study using near-infrared time-resolved spectroscopy. Schizophr. Res. 2006, 84, 411–420. [Google Scholar] [CrossRef] [PubMed]
- Harada, H.; Nashihara, H.; Morozumi, K.; Ota, H.; Hatakeyama, E. A Comparison of Cerebral Activity in the Prefrontal Region between Young Adults and the Elderly while Driving. J. Physiol. Anthropol. 2007, 26, 409–414. [Google Scholar] [CrossRef] [PubMed] [Green Version]
- Sakatani, K. Effects of Cosmetic Therapy on Cognitive Function in Elderly Women: A Near Infrared Spectroscopy Study. In Proceedings of the 29th Annual Conference of the Japanese Society for Artificial Intelligence, Hakodate, Japan, 5 June 2015; pp. 1–2. [Google Scholar]
- Machida, A.; Shirato, M.; Tanida, M.; Kanemaru, C.; Nagai, S.; Sakatani, K. Effects of Cosmetic Therapy on Cognitive Function in Elderly Women Evaluated by Time-Resolved Spectroscopy Study BT—Oxygen Transport to Tissue XXXVII; Elwell, C.E., Leung, T.S., Harrison, D.K., Eds.; Springer: New York, NY, USA, 2016; pp. 289–295. [Google Scholar]
- Murayama, Y.; Sato, Y.; Hu, L.; Brugnera, A.; Compare, A.; Sakatani, K. Relation Between Cognitive Function and Baseline Concentrations of Hemoglobin in Prefrontal Cortex of Elderly People Measured by Time-Resolved Near-Infrared Spectroscopy BT—Oxygen Transport to Tissue XXXIX; Halpern, H.J., LaManna, J.C., Harrison, D.K., Epel, B., Eds.; Springer International Publishing: Cham, Switzerland, 2017; pp. 269–276. ISBN 978-3-319-55231-6. [Google Scholar]
- Oyama, K.; Hu, L.; Sakatani, K. Prediction of MMSE Score Using Time-Resolved Near-Infrared Spectroscopy BT—Oxygen Transport to Tissue XL; Thews, O., LaManna, J.C., Harrison, D.K., Eds.; Springer International Publishing: Cham, Switzerland, 2018; pp. 145–150. ISBN 978-3-319-91287-5. [Google Scholar]
- Sakatani, K.; Tanida, M.; Hirao, N.; Takemura, N. Ginkobiloba Extract Improves Working Memory Performance in Middle-Aged Women: Role of Asymmetry of Prefrontal Cortex Activity During a Working Memory Task; Advances in Experimental Medicine and Biology; Swartz, H.M., Harrison, D.K., Bruley, D.F., Eds.; Springer: New York, NY, USA, 2014; Volume 812, ISBN 978-1-4939-0583-6. [Google Scholar]
- Nakano, M.; Murayama, Y.; Hu, L.; Ikemoto, K.; Uetake, T.; Sakatani, K. Effects of Antioxidant Supplements (BioPQQTM) on Cerebral Blood Flow and Oxygen Metabolism in the Prefrontal Cortex BT—Oxygen Transport to Tissue XXXVIII; Luo, Q., Li, L.Z., Harrison, D.K., Shi, H., Bruley, D.F., Eds.; Springer International Publishing: Cham, Switzerland, 2016; pp. 215–222. [Google Scholar]
- Abdalmalak, A.; Milej, D.; Norton, L.; Debicki, D.B.; Gofton, T.; Diop, M.; Owen, A.M.; St. Lawrence, K. Single-session communication with a locked-in patient by functional near-infrared spectroscopy. Neurophotonics 2017, 4, 1. [Google Scholar] [CrossRef] [Green Version]
- Trafidło, T.; Gaszyński, T.; Gaszyński, W.; Nowakowska-Domagała, K. Intraoperative monitoring of cerebral NIRS oximetry leads to better postoperative cognitive performance: A pilot study. Int. J. Surg. 2015, 16, 23–30. [Google Scholar] [CrossRef]
- Kacprzak, M.; Liebert, A.; Staszkiewicz, W.; Gabrusiewicz, A.; Sawosz, P.; Madycki, G.; Maniewski, R. Application of a time-resolved optical brain imager for monitoring cerebral oxygenation during carotid surgery. J. Biomed. Opt. 2012, 17, 016002. [Google Scholar] [CrossRef]
- Ohmae, E.; Oda, M.; Suzuki, T.; Yamashita, Y.; Kakihana, Y.; Matsunaga, A.; Kanmura, Y.; Tamura, M. Clinical evaluation of time-resolved spectroscopy by measuring cerebral hemodynamics during cardiopulmonary bypass surgery. J. Biomed. Opt. 2007, 12, 062112. [Google Scholar] [CrossRef]
- Kakihana, Y.; Okayama, N.; Matsunaga, A.; Yasuda, T.; Imabayashi, T.; Nakahara, M.; Kiyonaga, N.; Ikoma, K.; Kikuchi, T.; Kanmura, Y.; et al. Cerebral Monitoring Using Near-Infrared Time-Resolved Spectroscopy and Postoperative Cognitive Dysfunction BT—Oxygen Transport to Tissue XXXIII; Wolf, M., Bucher, H.U., Rudin, M., Van Huffel, S., Wolf, U., Bruley, D.F., Harrison, D.K., Eds.; Springer: New York, NY, USA, 2012; pp. 19–24. [Google Scholar]
- Sato, C.; Yamaguchi, T.; Seida, M.; Ota, Y.; Yu, I.; Iguchi, Y.; Nemoto, M.; Hoshi, Y. Intraoperative monitoring of depth-dependent hemoglobin concentration changes during carotid endarterectomy by time-resolved spectroscopy. Appl. Opt. 2007, 46, 2785–2792. [Google Scholar] [CrossRef] [PubMed]
- Yamazaki, K.; Suzuki, K.; Itoh, H.; Muramatsu, K.; Nagahashi, K.; Tamura, N.; Uchida, T.; Sugihara, K.; Maeda, H.; Kanayama, N. Cerebral oxygen saturation evaluated by near-infrared time-resolved spectroscopy (TRS) in pregnant women during caesarean section—A promising new method of maternal monitoring. Clin. Physiol. Funct. Imaging 2013, 33, 109–116. [Google Scholar] [CrossRef] [PubMed]
- Suzuki, K.; Itoh, H.; Mukai, M.; Yamazaki, K.; Uchida, T.; Maeda, H.; Oda, M.; Yamaki, E.; Suzuki, H. Measurement of maternal cerebral tissue hemoglobin on near-infrared time-resolved spectroscopy in the peripartum period. J. Obstetr. Gynaecol. Res. 2015, 41, 876–883. [Google Scholar] [CrossRef] [PubMed]
- Fujisaka, S.; Ozaki, T.; Suzuki, T.; Kamada, T.; Kitazawa, K.; Nishizawa, M.; Takahashi, A.; Suzuki, S. A Clinical Tissue Oximeter Using NIR Time-Resolved Spectroscopy BT—Oxygen Transport to Tissue XXXVII; Elwell, C.E., Leung, T.S., Harrison, D.K., Eds.; Springer: New York, NY, USA, 2016; pp. 427–433. [Google Scholar]
- Visani, E.; Canafoglia, L.; Gilioli, I.; Sebastiano, D.R.; Contarino, V.E.; Duran, D.; Panzica, F.; Cubeddu, R.; Contini, D.; Zucchelli, L.; et al. Hemodynamic and EEG Time-Courses During Unilateral Hand Movement in Patients with Cortical Myoclonus. An EEG-fMRI and EEG-TD-fNIRS Study. Brain Topogr. 2015, 28, 915–925. [Google Scholar] [CrossRef] [PubMed]
- Naseer, N.; Hong, K.-S. fNIRS-based brain-computer interfaces: A review. Front. Hum. Neurosci. 2015, 9, 1–15. [Google Scholar] [CrossRef] [PubMed]
- Abdalmalak, A.; Milej, D.; Diop, M.; Shokouhi, M.; Naci, L.; Owen, A.M.; St. Lawrence, K. Can time-resolved NIRS provide the sensitivity to detect brain activity during motor imagery consistently? Biomed. Opt. Express 2017, 8, 2162. [Google Scholar] [CrossRef] [PubMed]
- Selb, J.; Ogden, T.M.; Dubb, J.; Fang, Q.; Boas, D. Comparison of a layered slab and an atlas head model for Monte Carlo fitting of time-domain near-infrared spectroscopy data of the adult head. J. Biomed. Opt. 2014, 19, 16010. [Google Scholar] [CrossRef] [PubMed] [Green Version]
- Konugolu Venkata Sekar, S.; Dalla Mora, A.; Bargigia, I.; Martinenghi, E.; Lindner, C.; Farzam, P.; Pagliazzi, M.; Durduran, T.; Taroni, P.; Pifferi, A.; et al. Broadband (600–1350 nm) Time-Resolved Diffuse Optical Spectrometer for Clinical Use. IEEE J. Sel. Top. Quantum Electron. 2016, 22, 406–414. [Google Scholar] [CrossRef] [Green Version]
- Pifferi, A.; Torricelli, A.; Bassi, A.; Taroni, P.; Cubeddu, R.; Wabnitz, H.; Grosenick, D.; Möller, M.; Macdonald, R.; Swartling, J.; et al. Performance assessment of photon migration instruments: The MEDPHOT protocol. Appl. Opt. 2005, 44, 2104–2114. [Google Scholar] [CrossRef]
- Wabnitz, H.; Jelzow, A.; Mazurenka, M.; Steinkellner, O.; Macdonald, R.; Milej, D.; Zolek, N.; Kacprzak, M.; Sawosz, P.; Maniewski, R.; et al. Performance assessment of time-domain optical brain imagers, part 1: Basic instrumental performance protocol. J. Biomed. Opt. 2014, 19, 86010. [Google Scholar] [CrossRef] [PubMed]
- Wabnitz, H.; Jelzow, A.; Mazurenka, M.; Steinkellner, O.; Macdonald, R.; Milej, D.; Zolek, N.; Kacprzak, M.; Sawosz, P.; Maniewski, R.; et al. Performance assessment of time-domain optical brain imagers, part 2: nEUROPt protocol. J. Biomed. Opt. 2014, 19, 086012. [Google Scholar] [CrossRef]
- Di Sieno, L.; Nissinen, J.; Hallman, L.; Martinenghi, E.; Contini, D.; Pifferi, A.; Kostamovaara, J.; Mora, A.D. Miniaturized pulsed laser source for time-domain diffuse optics routes to wearable devices. J. Biomed. Opt. 2017, 22, 1. [Google Scholar] [CrossRef]
- Martinenghi, E.; Di Sieno, L.; Contini, D.; Sanzaro, M.; Pifferi, A.; Dalla Mora, A. Time-resolved single-photon detection module based on silicon photomultiplier: A novel building block for time-correlated measurement systems. Rev. Sci. Instrum. 2016, 87, 073101. [Google Scholar] [CrossRef] [Green Version]
- Renna, M.; Buttafava, M.; Zappa, F.; Tosi, A.; Martinenghi, E.; Zanoletti, M.; Mora, A.D.; Pifferi, A.; Torricelli, A.; Contini, D. Compact dual-wavelength system for time-resolved diffuse optical spectroscopy. In Proceedings of the 2017 13th Conference on Ph.D. Research in Microelectronics and Electronics (PRIME), Giardini Naxos, Italy, 12–15 June 2017; pp. 293–296. [Google Scholar]
- Wabnitz, H.; Mazurenka, M.; Di Sieno, L.; Contini, D.; Dalla Mora, A.; Farina, A.; Hoshi, Y.; Kirilina, E.; Macdonald, R.; Pifferi, A. Non-contact time-domain imaging of functional brain activation and heterogeneity of superficial signals. In European Conference on Biomedical Optics; Dehghani, H., Wabnitz, H., Eds.; Optical Society of America: Munich, Germany, 2017; p. 104120J. [Google Scholar]
- Re, R.; Martinenghi, E.; Mora, A.D.; Contini, D.; Pifferi, A.; Torricelli, A. Probe-hosted silicon photomultipliers for time-domain functional near-infrared spectroscopy: Phantom and in vivo tests. Neurophotonics 2016, 3, 045004. [Google Scholar] [CrossRef]
- Dalla Mora, A.; Martinenghi, E.; Contini, D.; Tosi, A.; Boso, G.; Durduran, T.; Arridge, S.R.; Martelli, F.; Farina, A.; Torricelli, A.; et al. Fast silicon photomultiplier improves signal harvesting and reduces complexity in time-domain diffuse optics. Opt. Express 2015, 23, 13937–13946. [Google Scholar] [CrossRef] [Green Version]
- Mora, A.D.; Contini, D.; Arridge, S.R.; Martelli, F.; Tosi, A.; Boso, G.; Farina, A.; Durduran, T.; Martinenghi, E.; Torricelli, A.; et al. Towards next-generation time-domain diffuse optics for extreme depth penetration and sensitivity. Biomed. Opt. Express 2015, 6, 1749. [Google Scholar] [CrossRef]
- Buttafava, M.; Martinenghi, E.; Tamborini, D.; Contini, D.; Mora, A.D.; Renna, M.; Torricelli, A.; Pifferi, A.; Zappa, F.; Tosi, A. A Compact Two-Wavelength Time-Domain NIRS System Based on SiPM and Pulsed Diode Lasers. IEEE Photonics J. 2017, 9, 1–14. [Google Scholar] [CrossRef] [Green Version]
- Milej, D.; Abdalmalak, A.; Janusek, D.; Diop, M.; Liebert, A.; St. Lawrence, K. Time-resolved subtraction method for measuring optical properties of turbid media. Appl. Opt. 2016, 55, 1507. [Google Scholar] [CrossRef]
- Torricelli, A.; Pifferi, A.; Spinelli, L.; Cubeddu, R.; Martelli, F.; Del Bianco, S.; Zaccanti, G. Time-Resolved Reflectance at Null Source-Detector Separation: Improving Contrast and Resolution in Diffuse Optical Imaging. Phys. Rev. Lett. 2005, 95, 078101. [Google Scholar] [CrossRef]
- Pifferi, A.; Contini, D.; Mora, A.D.; Farina, A.; Spinelli, L.; Torricelli, A. New frontiers in time-domain diffuse optics, a review. J. Biomed. Opt. 2016, 21, 091310. [Google Scholar] [CrossRef] [Green Version]
- Lange, F.; Dunne, L.; Hale, L.; Tachtsidis, I. MAESTROS: A Multiwavelength Time-Domain NIRS System to Monitor Changes in Oxygenation and Oxidation State of Cytochrome-C-Oxidase. IEEE J. Sel. Top. Quantum Electron. 2019, 25, 1–12. [Google Scholar] [CrossRef] [PubMed]
- Bale, G.; Mitra, S.; de Roever, I.; Sokolska, M.; Price, D.; Bainbridge, A.; Gunny, R.; Uria-Avellanal, C.; Kendall, G.S.; Meek, J.; et al. Oxygen dependency of mitochondrial metabolism indicates outcome of newborn brain injury. J. Cereb. Blood Flow Metab. 2018, 0271678X1877792. [Google Scholar] [CrossRef] [PubMed]
- Bakhsheshi, M.F.; Diop, M.; St. Lawrence, K.; Lee, T.-Y. Monitoring brain temperature by time-resolved near-infrared spectroscopy: Pilot study. J. Biomed. Opt. 2014, 19, 057005. [Google Scholar] [CrossRef]
- Davidson, J.O.; Wassink, G.; van den Heuij, L.G.; Bennet, L.; Gunn, A.J. Therapeutic hypothermia for neonatal hypoxic-ischemic encephalopathy—Where to from here? Front. Neurol. 2015, 6, 198. [Google Scholar] [CrossRef] [PubMed]
- Kung, D.K.; Mesquita, R.C.; Ko, T.S.; Abramson, K.; Yodh, A.G.; Greenberg, J.H.; Busch, D.R.; Baker, W.B.; Durduran, T.; Tzeng, S.-Y.; et al. Pressure modulation algorithm to separate cerebral hemodynamic signals from extracerebral artifacts. Neurophotonics 2015, 2, 035004. [Google Scholar] [Green Version]
- Delgado-Mederos, R.; Gregori-Pla, C.; Zirak, P.; Blanco, I.; Dinia, L.; Marín, R.; Durduran, T.; Martí-Fàbregas, J. Transcranial diffuse optical assessment of the microvascular reperfusion after thrombolysis for acute ischemic stroke. Biomed. Opt. Express 2018, 9, 1262–1271. [Google Scholar] [CrossRef] [Green Version]
- Ancora, D.; Zacharakis, G.; Pifferi, A.; Torricelli, A.; Qiu, L.; Spinelli, L. Noninvasive optical estimation of CSF thickness for brain-atrophy monitoring. Biomed. Opt. Express 2018, 9, 4094. [Google Scholar] [CrossRef]
- Chuang, C.-C.; Lee, Y.-T.; Chen, C.-M.; Hsieh, Y.-S.; Liu, T.-C.; Sun, C.-W. Patient-oriented simulation based on Monte Carlo algorithm by using MRI data. Biomed. Eng. Online 2012, 11, 21. [Google Scholar] [CrossRef]
- Yu, L.; Nina-Paravecino, F.; Kaeli, D.; Fang, Q. Scalable and massively parallel Monte Carlo photon transport simulations for heterogeneous computing platforms. J. Biomed. Opt. 2018, 23, 010504. [Google Scholar] [CrossRef] [Green Version]
Figure 1.
Schematic of the three NIRS detection modes. (a) TD-NIRS mode, an ultra-short light impulse is shined onto the tissue and the broadened and attenuated re-emitted pulse is measured after passing through the tissue. (b) FD-NIRS, a modulated (MHz) continuous light source is shined onto the tissues and the attenuated, phase shifted reemitted light is measured. (c) CW-NIRS, a continuous light is shined onto the tissues and the attenuated re-emitted light is measured. (d) Representation of the photon path in tissues for each technique. S: source, D: detector.

Figure 2.
Schematic of the three-data processing approach in TD-NIRS.

Figure 3.
Example of homemade and commercial TD-NIRS instrumentation. (a) Homemade TD-NIRS system used in [58], used with ICG. (b) The tNIRS-1 commercial system, from Hamamatsu (Japan), courtesy of Hamamatsu. (c) Example of probe positioning over both cerebral hemispheres of a patient (the system is the one illustrated in (a)). Extracted from [58].

Figure 4.
Summary of the literature review results. (a) Summary of the principle TD-NIRS component used in the 52 reviewed publications. (b) Graph showing the number of publications using TD-NIRS in brain clinical application since the first study in 1998.
Figure 4.
Summary of the literature review results. (a) Summary of the principle TD-NIRS component used in the 52 reviewed publications. (b) Graph showing the number of publications using TD-NIRS in brain clinical application since the first study in 1998.

Figure 5.
Example of the data produced by TD-NIRS systems. (a) Coronal slices of tomographic images of the blood volume and the StO2 of a baby who had a left ventricular haemorrhage. The haemorrhage can be seen as an increase in blood volume and a decrease in oxygen saturation. Extracted from [69]. (b) StO2 and haemoglobin concentration ([tHb]) in a patient with septic shock during the hour prior to a pulseless electrical activity arrest and cardiopulmonary resuscitation (CPR). The decrease in StO2 can be seen 15 min prior to the arrest. Extracted from [95]. (c) Illustration of a measurement from [86], on a patient with an internal carotid artery (ICA) occlusion on the affected side and a crossflow over the anterior communicating artery (ACoA). The anatomical situation and the influence on the bolus passage are shown schematically on the right diagram, with the affected hemisphere shown in black colour and the unaffected one shown in light grey. The left side of the figure compares the conventional CW-NIRS based approach, which is represented by the time-integrated signal Ntot to the moment TD-NIRS approach based on the analysis of variance. The colours of the bolus curves correspond the diagram (black: affected hemisphere, light grey: unaffected hemisphere). In the CW-NIRS approach, the bolus curves differed only slightly. In contrast, in the TD-NIRS approach, the variance signals showed a significant difference between the hemispheres. (d) Example of brain activity of a patient with locked-in syndrome during mental imagery (MI), from [107]. The “rest” period corresponds to data acquired without MI activation and is presented as a reference for the contrast observed during the question periods. If the answer was “Yes” the patient was asked to perform a MI task (i.e., play tennis). If the answer was “No”, the patient was asked to rest. The grey boxes indicate the response period. One can see that the patient responded “yes” to two questions. At the time of this study, the patient had regained limited eye movement, so those responses could be confirmed.

Figure 6.
Examples of new TD-NIRS instrumentation. (a) Laser diode for compact systems (from [124]). (b) A compact probe holder based on a SiPM detector. No optical fibre is needed, and the detector is placed in direct contact with the skin. Extracted from [128]. (c) Compact SiPM detector. Extracted from [129]. (d) Fibreless TD-NIRS system. Extracted from [130]. (e) Compact all-in-one single channel TD-NIRS system. Extracted from [131].


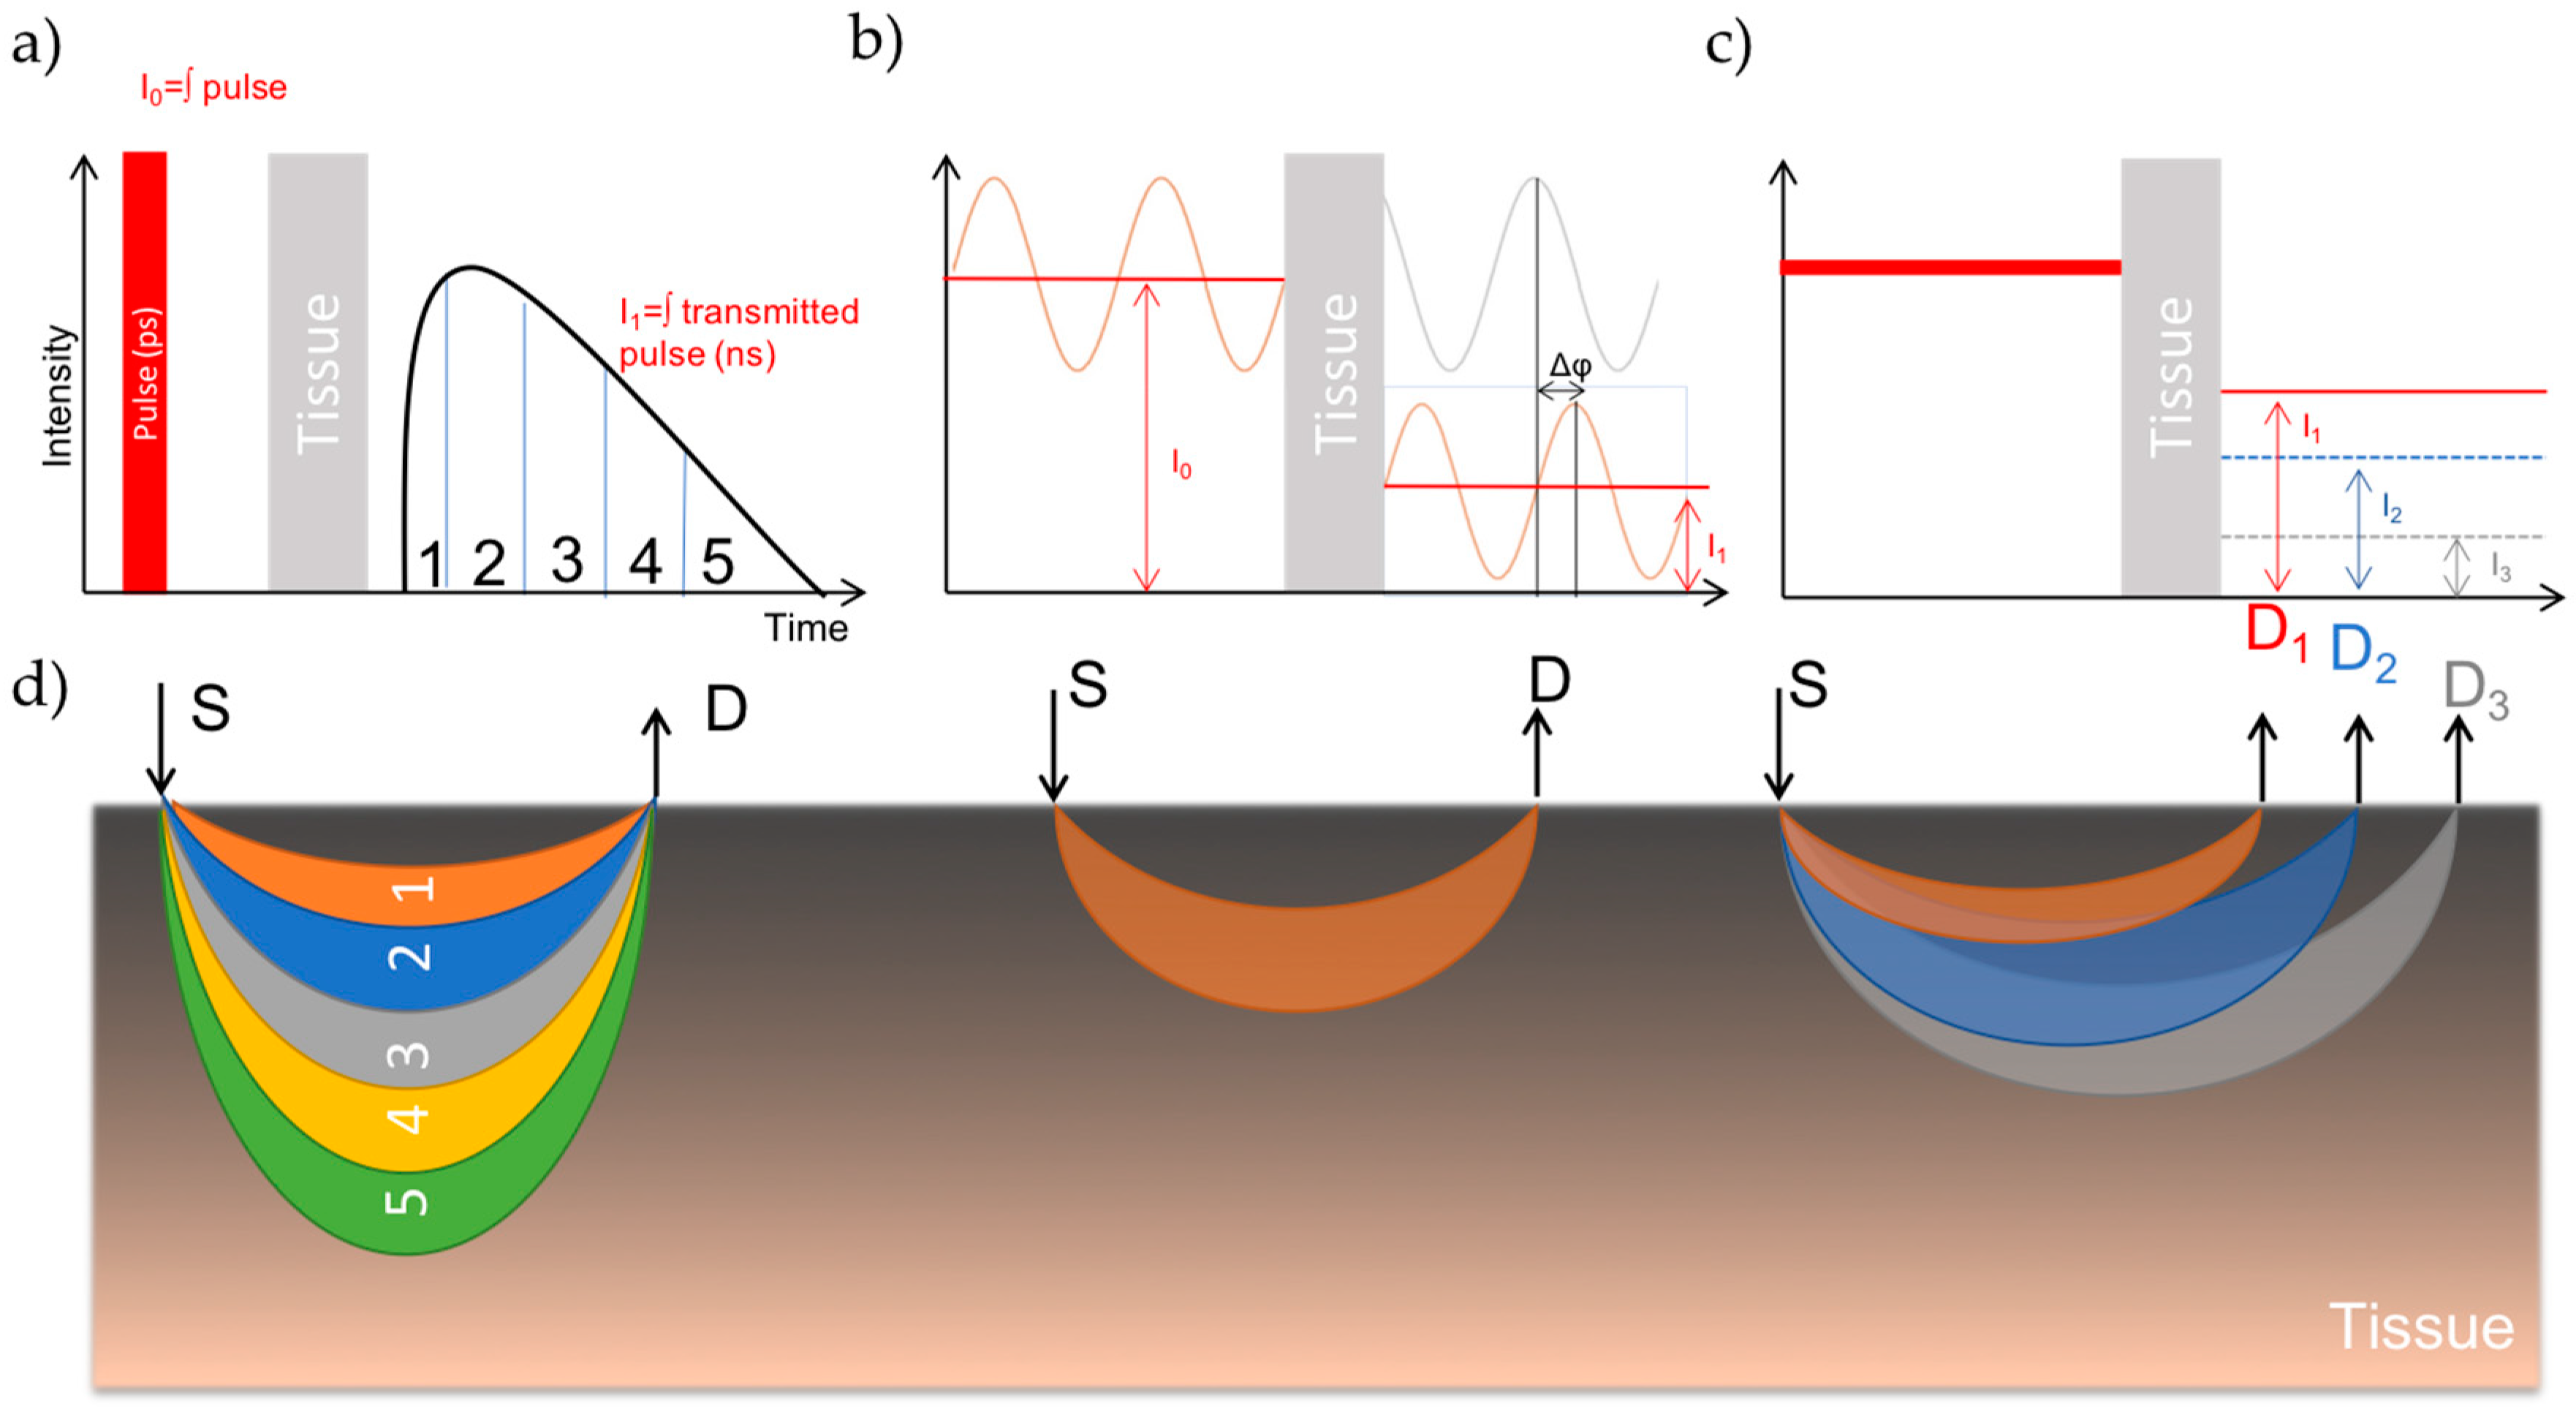
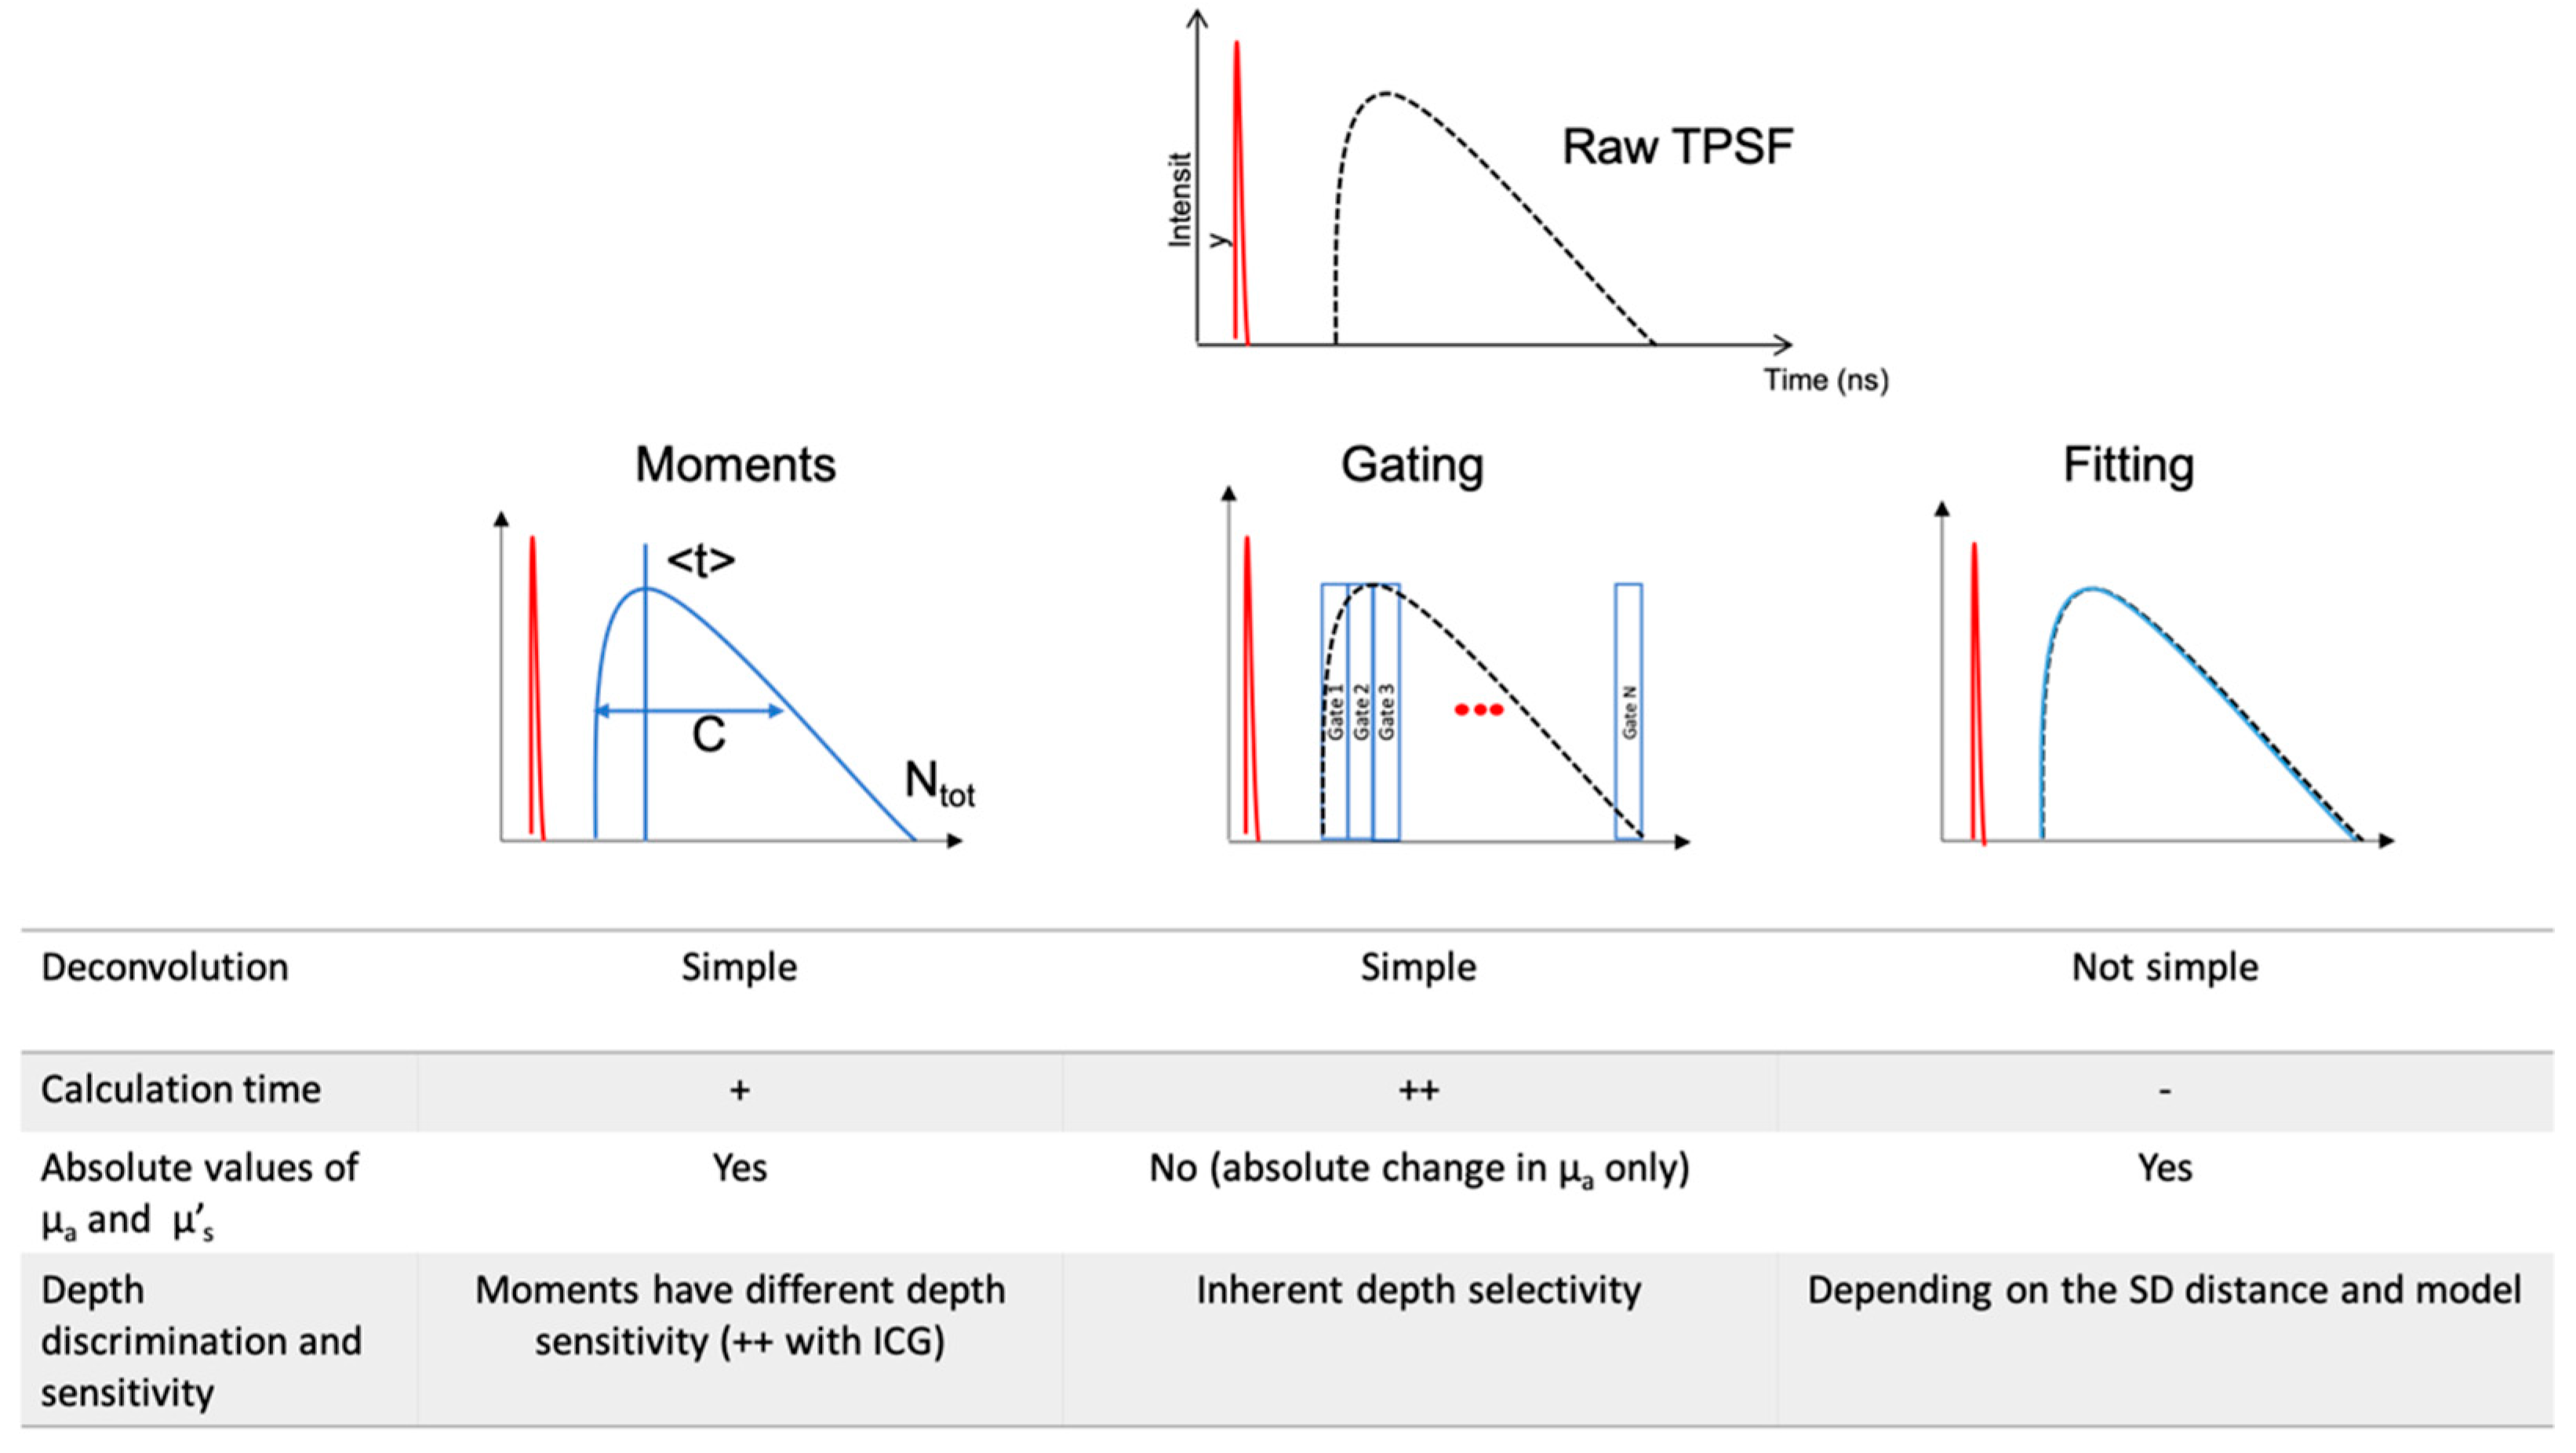
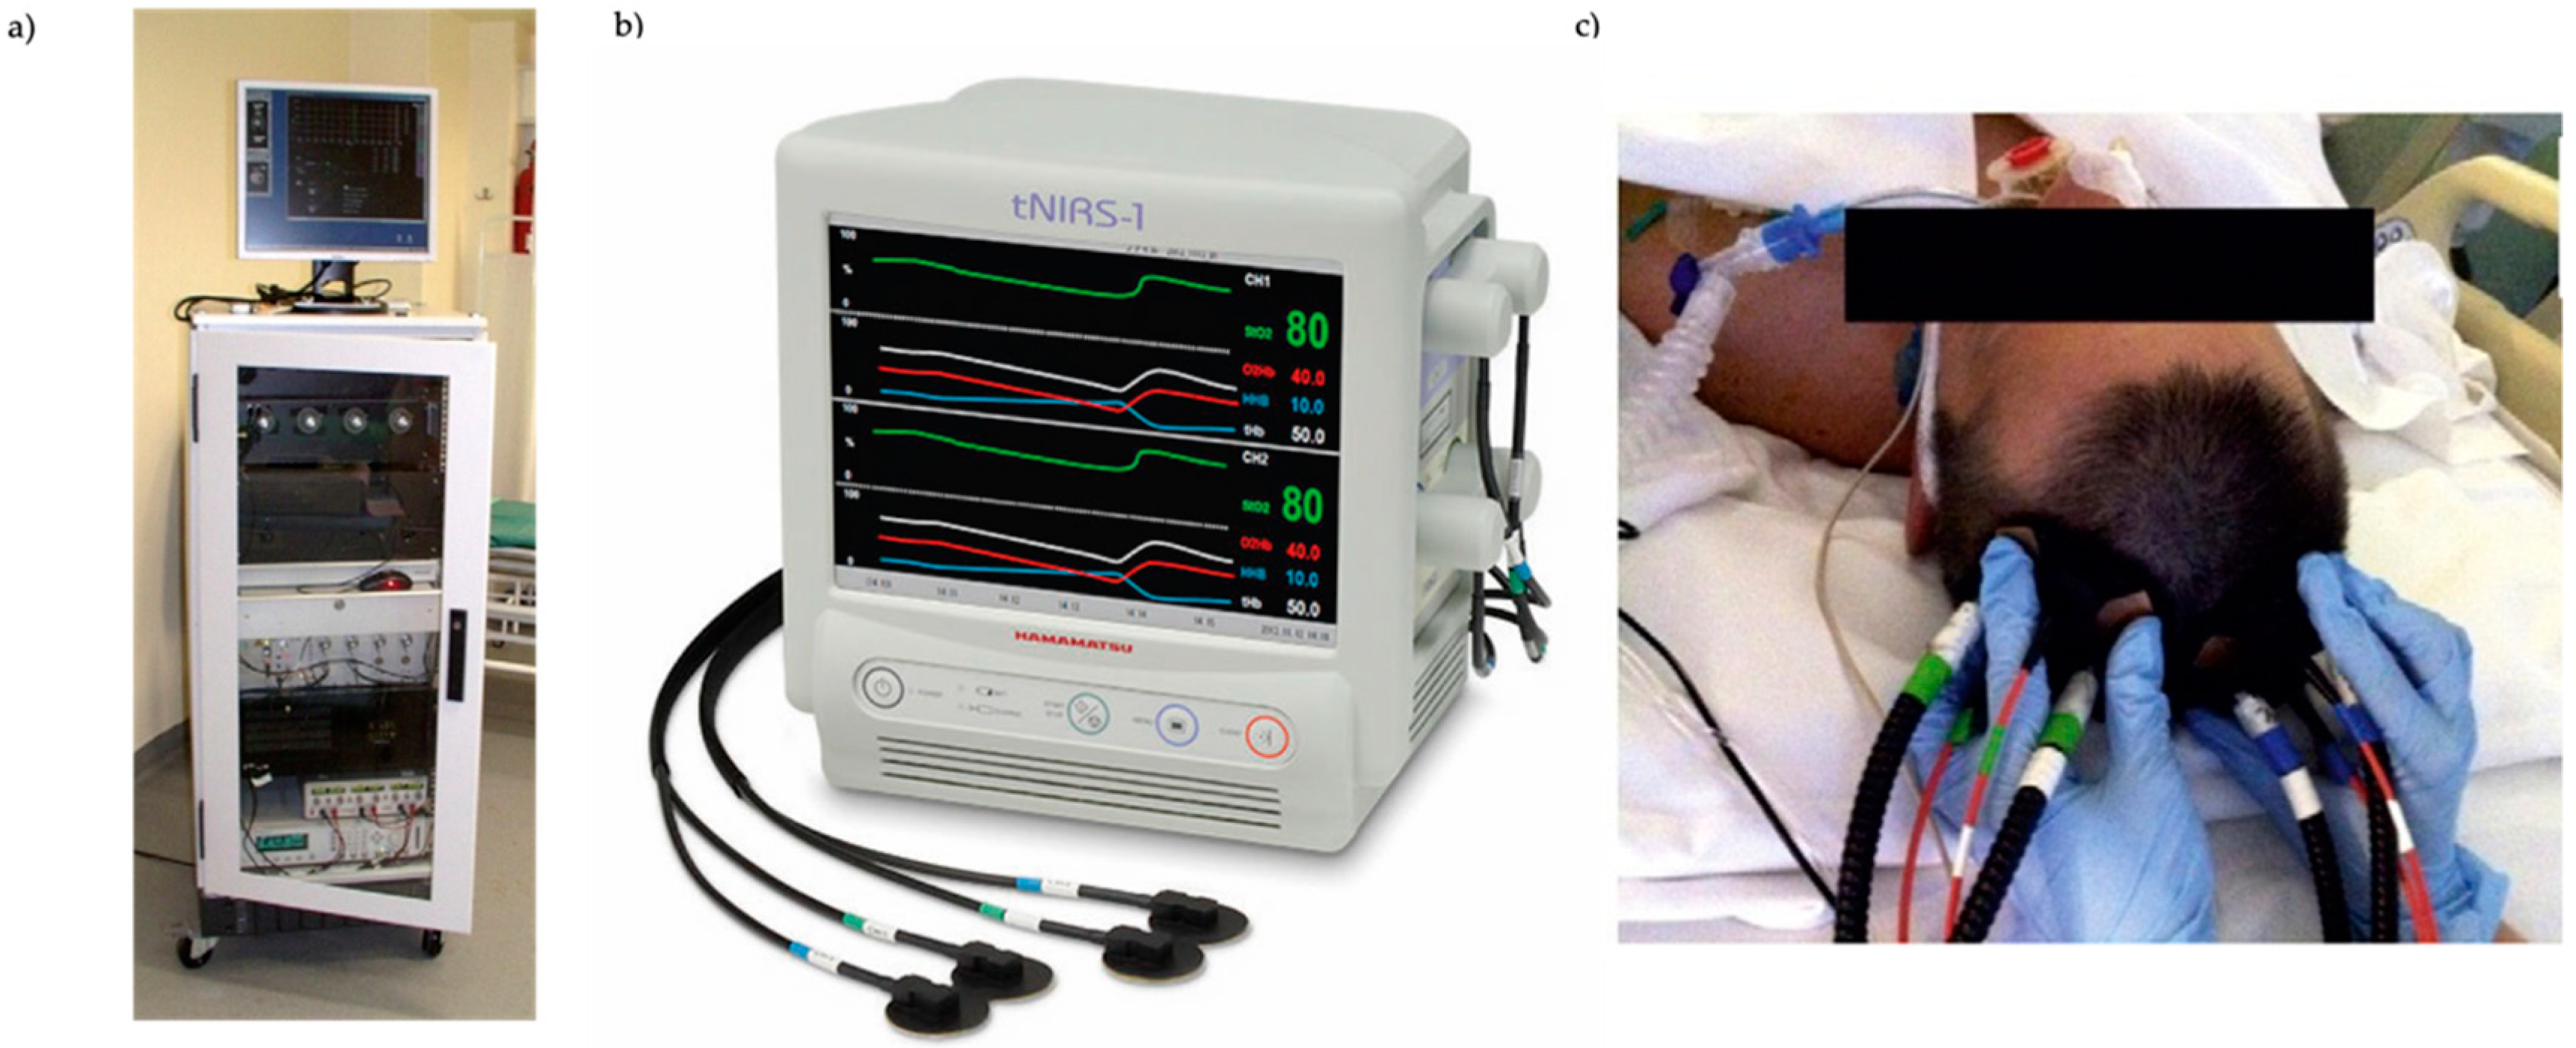
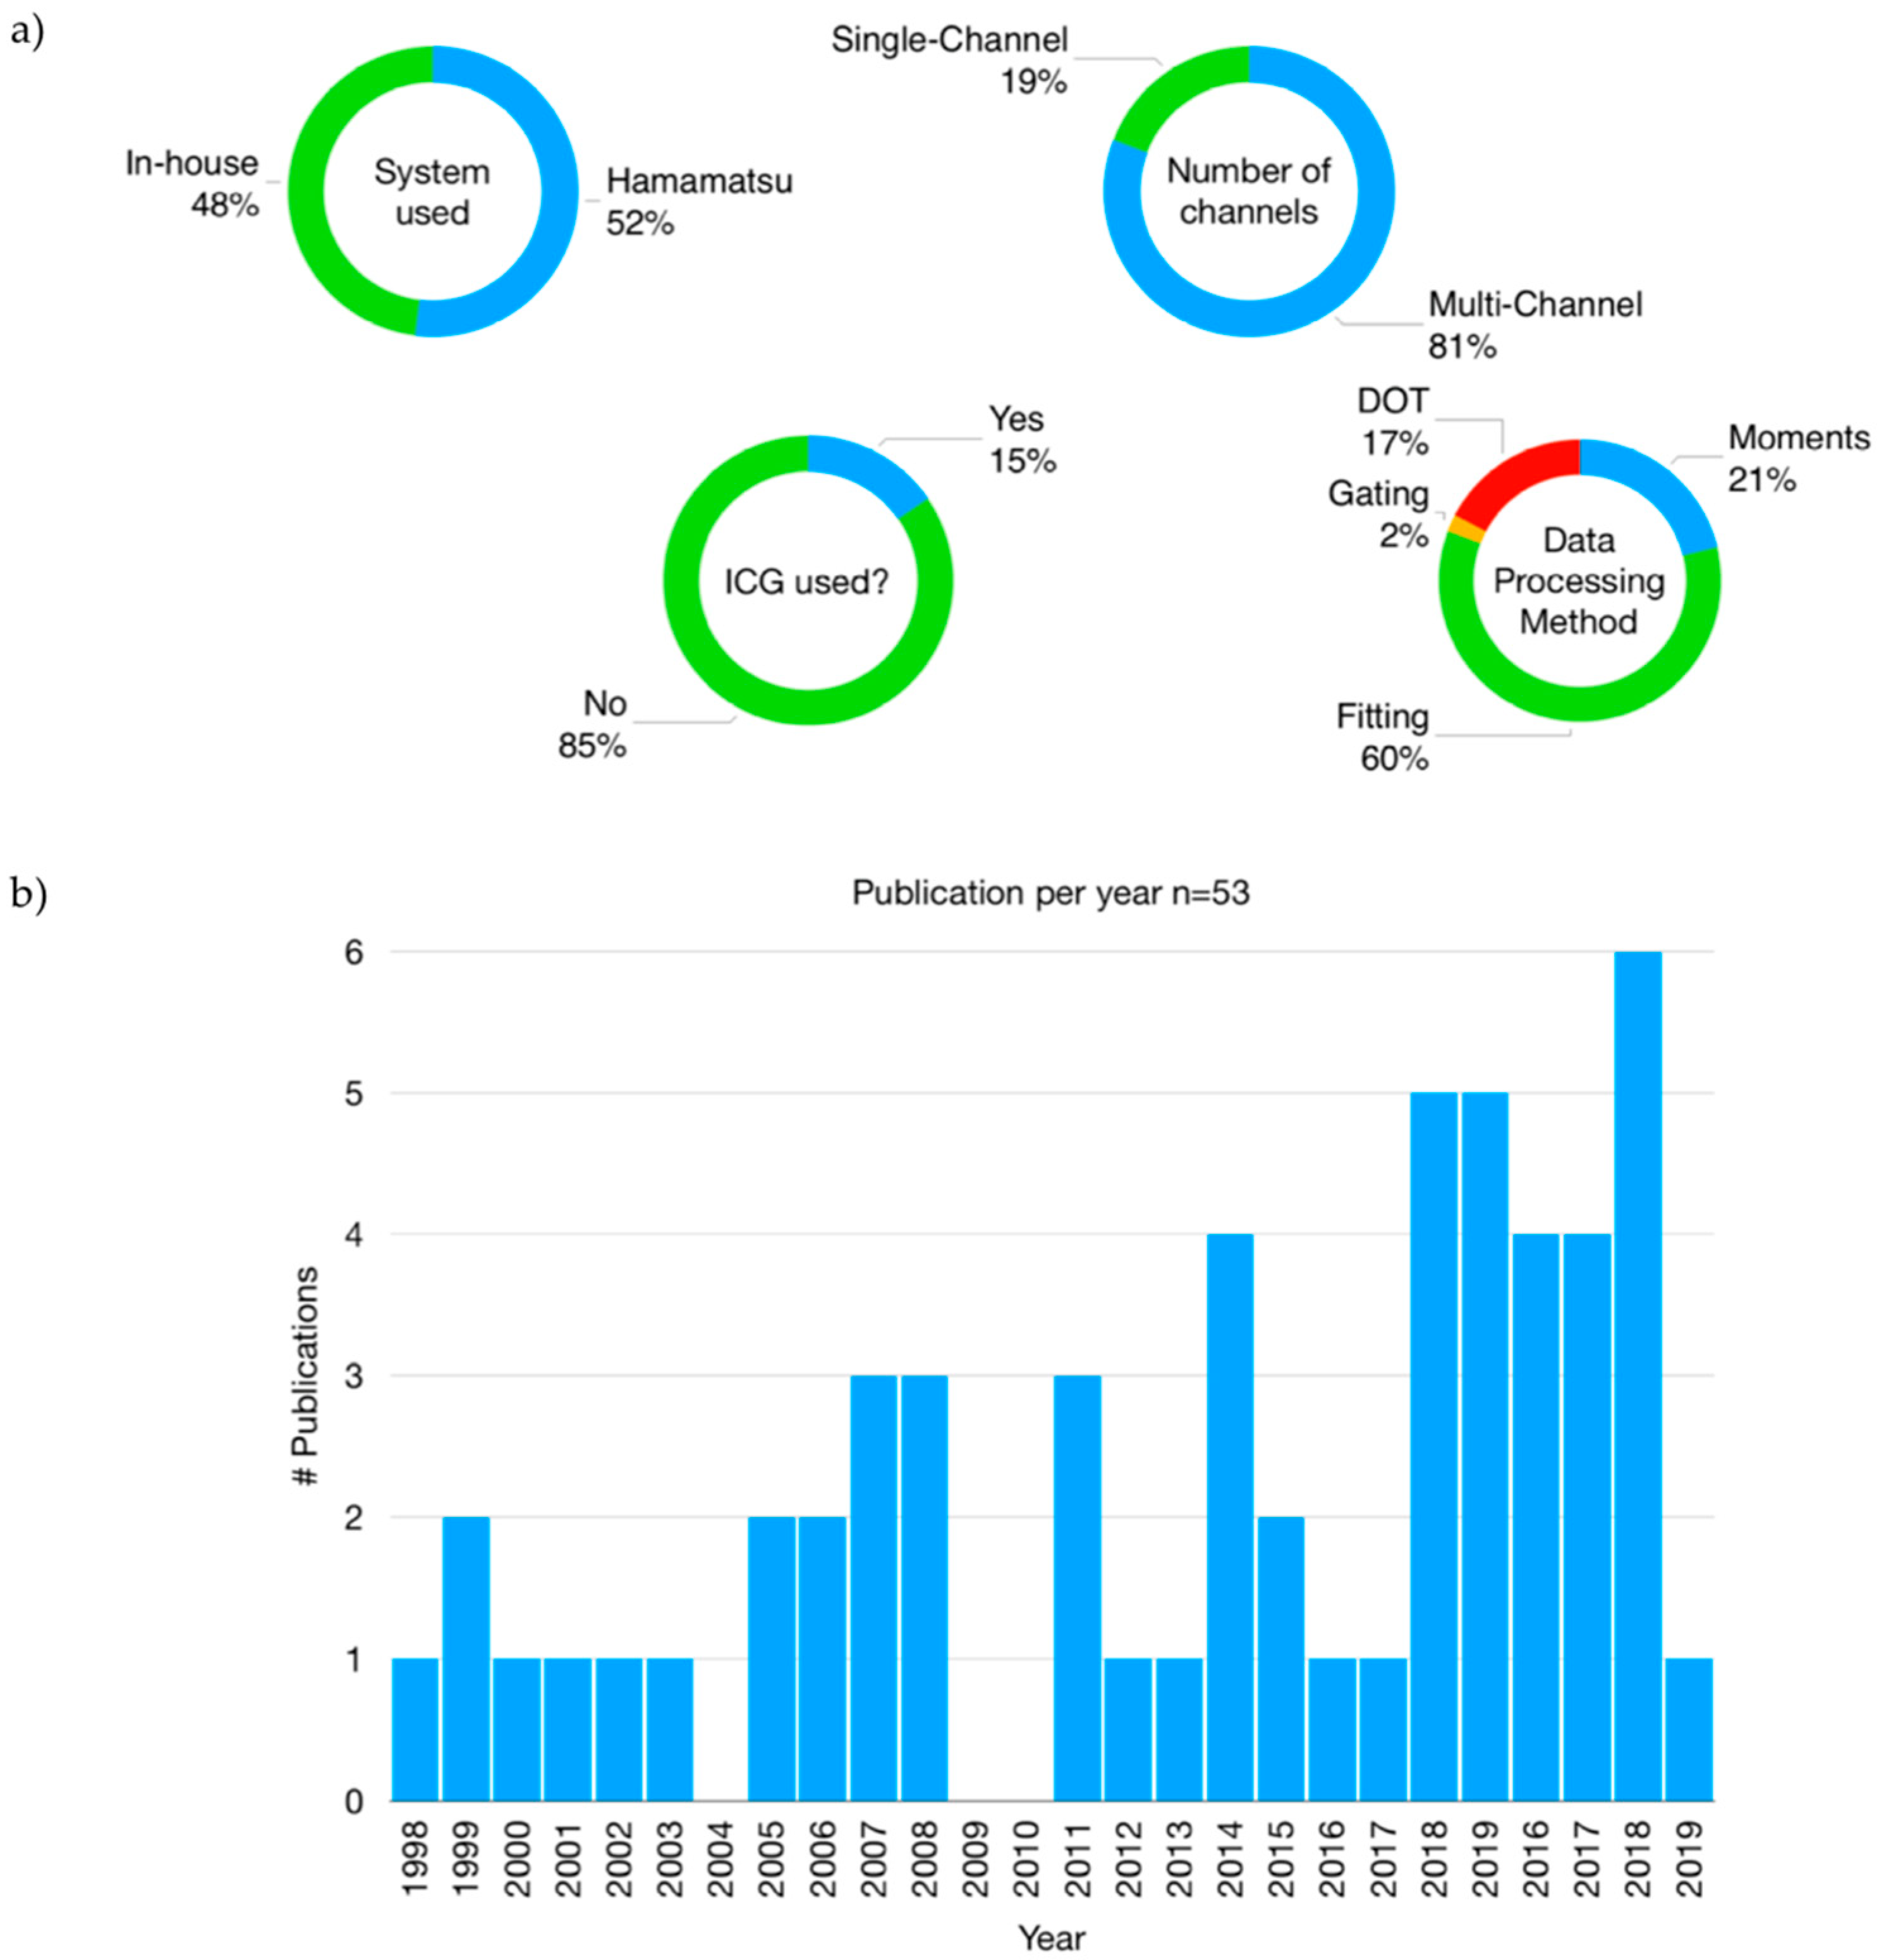
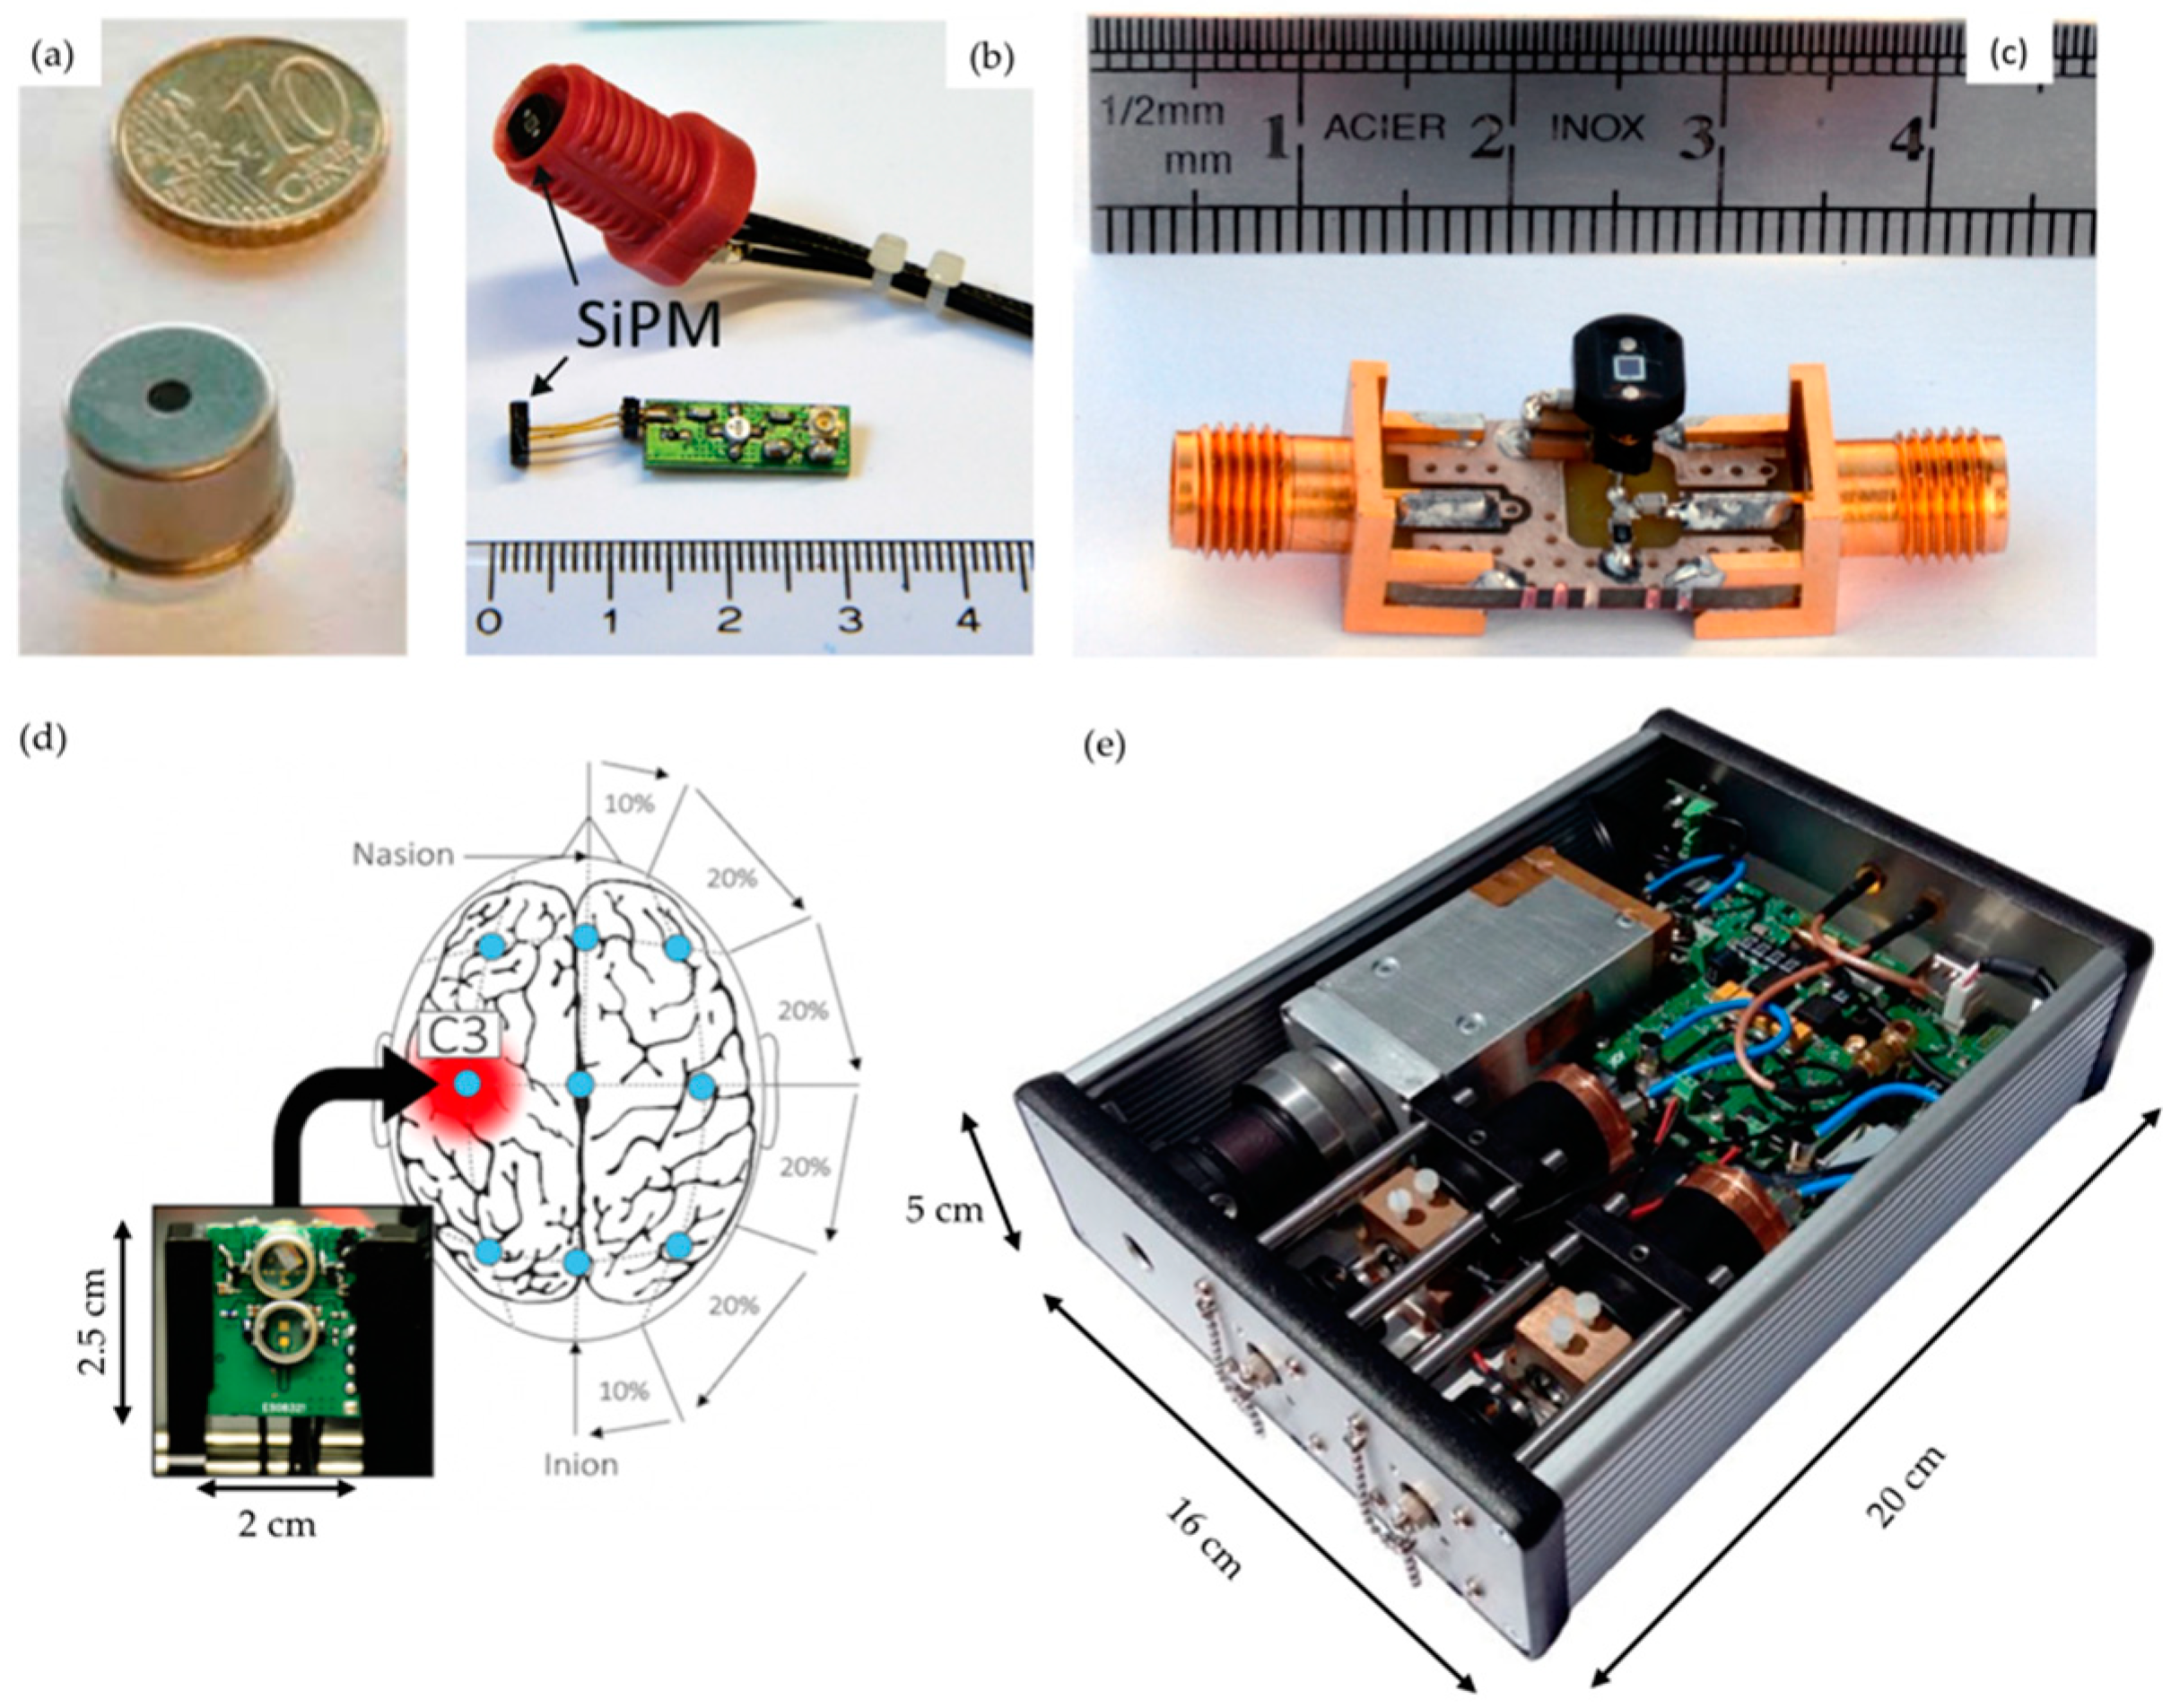
Table 1.
Characteristic of the three NIRS methodologies.
| Main Characteristics | Methodology | ||
|---|---|---|---|
| CW | FD | TD | |
| Practicalities | |||
| Instrument cost | Depends on number of channels, from low to high | High | Very high |
| Instrument size | Depends on number of channels, wearable systems available | Bulky but transportable | Bulky but transportable |
| Availability of commercial systems | Yes, multiple companies | Yes, but only one company | Yes, but only one company |
| Technical considerations | |||
| Number of channels | Can be very high (more than 1000) with the latest HD-NIRS systems. Commercial systems with up to 100 channels | Can be high. Commercial system with up to 500 channels | Lowest. Usually between 1 and 30 channels. Commercial system with up to 2 channels |
| Sampling rate | Highest: 100 Hz | Middle: 50 Hz | Lowest: 1–10 Hz (can be higher, depends on number of channels, wavelengths) |
| Non-contact scanning possibilities | Yes | No | Yes |
| Depth sensitivity | Low, depends on source detector distance | Deep, depends on source detector distance | Deep, do not depends on source detector distance |
| Measurement parameters | |||
| [HbO2], [HHb], [HbT] | Yes, changes | Yes, absolute but requires multi-distance | Yes, absolute, even with a single channel |
| Absolute values of absorption and scattering coefficients, and path length | No | Yes, but requires multi-distance | Yes |
| StO2 | Yes, but requires multi-distance | Yes, but requires multi-distance | Yes |
| DOT possible | Yes | Yes | Yes |
Abbreviations: CW: continuous-wave; FD: frequency-domain; TD: time domain; StO2: tissue saturation in oxygen; DOT: diffuse optical tomography; HD-NIRS: high-density NIRS.
Table 2.
List of the system used in the publication reviewed, with their principle characteristics.
| SYSTEM ID | GROUP | SYSTEM NAME | NB OF WAVELENGTH USED | WAVELENGTH USED | REPETITION RATE (MHZ) | SOURCE TYPE | DETECTOR TYPE | NB OF CHANNELS | ACQ. FREQ. (HZ) ** |
|---|---|---|---|---|---|---|---|---|---|
| 1 | Hamamatsu Photonics K.K. | TRS-10 | 3 | 761, 795, 835 nm | 5 | Laser diode | PMT | 1 | 0.2 |
| 2 | Hamamatsu Photonics K.K. | TRS-20 | 3 | 759,797,833 | 5 | Laser diode | PMT | 2 | 0.2 |
| 3 | Hamamatsu Photonics K.K. | TRS-21 | 6 | 762, 802, 838, 908, 936, 976 nm | 5 | Laser diode | PMT | 2 | 0.2 |
| 4 | Hamamatsu Photonics K.K. | tNIRS-1 | 3 | 755, 826, 850 nm | 9 | Laser diode | MPPC | 2 | 0.2 |
| 5 | Hamamatsu Photonics K.K. | NIRO-TRS 1 | 3 | 755, 826, 850 nm | 9 | Laser diode | MPPC | 2 | 0.2 |
| 6 | Standford University, Standford, USA | NA | 2 | 785, 850 nm | NA | Laser diode | PMT | 34 | >0.05 |
| 7 | UCL, London, UK | MONSTIR | 2 | 780, 815 nm | 40 | Ti:sapphire laser | MCP-PMT | 32 | <0.05 |
| 8 | UCL, London, UK | MONSTIR II | 4 | 690, 750, 800, 850 nm | 40 | Supercontinuum laser | PMT | 32 | ≈0.01 |
| 9 | Politecnico di Milano, Milan, Italy | NA | 2 | 690, 820 nm | 80 | Laser diode | PMT | 24 | 1 |
| 10 * | BabyLux project | BabyLux | 3 | 685, 760, 822 nm | 20 | Laser diode | hybrid PMT | 1 | 1 |
| 11 | Physikalisch-Technische Bundesanstalt, Berlin, Germany | NA | 2 | 803, 807nm | 60 | Laser diode | PMT | 4 | 20 |
| 12 | Physikalisch-Technische Bundesanstalt, Berlin, Germany | NA | 1 | 785 nm | 50 | Laser diode | PMT | 8 | 20 |
| 13 | Physikalisch-Technische Bundesanstalt, Berlin, Germany | NA | 3 | 687, 803, 826 nm | 45 | Laser diode | PMT | 4 | 0.4 |
| 14 | Politecnico di Milano, Milan, Italy | NA | 3 | 690, 785, 830 nm | 80 | Laser diode | hybrid PMT | 1 | 0.03 |
| 15 | Institute of Biocybernetics and Biomedical Engineering, Warsaw, Poland | NA | 2 | 687, 832 nm | 80 | Laser diode | PMT | 32 | 10 |
| 16* | University of Pennsylvania, Philadelphia, Pennsylvania, USA | NA | 7 | 730, 750, 786, 810, 830, 850, 808 nm | 78 | Supercontinuum laser | hybrid PMT | 1 | 0.9 |
| 17 | Institute of Biocybernetics and Biomedical Engineering, Warsaw, Poland | NA | 1 | 760 nm | 80 | Laser diode | PMT | 8 | 10 |
| 18 | Western University, London, Ontario, Canada | NA | 2 | 760, 830 nm | 80 | Laser diode | hybrid PMT | 4 | 3.33 |
* Systems 10 and 16 also have DCS instrumentation. Here only the TD-NIRS part is reported. Refer to [59,60] respectively for complete instrumental details. ** Typical values than can vary depending on the instrument settings. See individual references for more details. Abbreviations: PMT: photomultiplier tube; MCP-PMT: microchannel plate PMT; MPPC: multi-pixel photon counters.
Table 3.
Table of the literature review of the use of TD-NIRS for clinical brain monitoring.
| Publication | Year | Patients N = P (C) P: Patients, C: Controls | Apparatus (ID) | Method | Reported Quantities | |||||||||
|---|---|---|---|---|---|---|---|---|---|---|---|---|---|---|
| Perfusion | [HbO2] | [HHb] | [HbT] | StO2 | µa | µ′s | Path Length | Other | ||||||
| DCS | ICG | |||||||||||||
| Nenonates (number of studies = 19) | ||||||||||||||
| Hintz et al. [62] | 1998 | N = 1 (0) | In-house (6) | DOT | x | |||||||||
| Hintz et al. [63] | 1999 | N = 6 (0) | In-house (6) | DOT | x | |||||||||
| Hintz et al. [64] | 1999 | N = 6 (0) | In-house (6) | DOT | x | |||||||||
| Benaron et al. [65] | 2000 | N = 2 (0) | In-house (6) | DOT | x | x | ||||||||
| Hintz et al. [64] | 2001 | N = 2 (0) | In-house (6) | DOT | x | x | x | |||||||
| Hebden et al. [70] | 2002 | N = 3 (0) | In-house (7) | DOT | x | x | x | x | ||||||
| Hebden et al. [71] | 2004 | N = 1 (0) | In-house (7) | DOT | x | x | x | x | ||||||
| Ijichi et al. [80] | 2005 | N = 22 (0) | TRS-10 (1) | Fitting | x | x | x | x | x | x | x | |||
| Austin et al. [72] | 2006 | N = 24 (0) | In-house (7) | DOT | x | x | x | |||||||
| Gibson et al. [69] | 2006 | N = 6 (0) | In-house (7) | DOT | x | x | x | x | x | |||||
| Hoshino et al. [79] | 2010 | N= 1 (0) | TRS-10 (1) | Fitting | x | x | x | x | ||||||
| Koyano et al. [75] | 2013 | N = 19 (0) | TRS-10 (1) | Fitting | x | x | x | x | x | x | x | |||
| Fujioka et al. [77] | 2014 | N = 72 (0) | TRS-20 (1) | Fitting | x | x | ||||||||
| Ishii et al. [76] | 2014 | N = 87 (0) | TRS-20 (1) | Fitting | x | x | ||||||||
| Nakamura et al. [78] | 2015 | N = 11 (0) | TRS-10 (1) | Fitting | x | x | ||||||||
| Dempsey et al. [73] | 2015 | N = 1 (0) | In-house (8) | Moments | x | |||||||||
| Spinelli et al. [81] | 2017 | N = 33 (0) | In-house (9) | Fitting | x | x | x | x | x | x | ||||
| Giovannella et al. [59] | 2018 | N = 21 (0) | In-house (10) | Fitting | x | x | x | x | ||||||
| Dempsey (PhD thesis) [74] | 2018 | N = 5 (0) | In-house (8) | Moments | x | |||||||||
| Stoke assessment (number of studies = 8) | ||||||||||||||
| Liebert et al. [84] | 2005 | N = 2(2) | In-house (11) | Moments | x | |||||||||
| Yokose et al. (a) [90] | 2010 | N= 14 (11) | TRS-10 (1) | Fitting | x | x | x | x | ||||||
| Yokose et al. (b) [89] | 2010 | N= 10 (0) | TRS-10 (1) | Fitting | x | x | x | x | ||||||
| Leistner et al. [87] | 2011 | N =11 (0) | In-house (13) | Moments | x | |||||||||
| Steinkellner et al. [86] | 2012 | N =10 (0) | In-house (12) | Moments | x | |||||||||
| Liebert et al. [85] | 2012 | N = 2 (2) | In-house (11) | Moments | x | |||||||||
| Sato et al. [91] | 2018 | N = 5 (0) | TRS-20 (2) | Fitting | x | x | x | x | x | |||||
| Giacalone et al. [88] | 2019 | N = 47 (35) | In-house (14) | Fitting | x | x | x | x | ||||||
| Traumatic brain injury (TBI) assessment (number of studies = 3) | ||||||||||||||
| Weigl et al. [58] | 2014 | N = 26 (9) | In-house (15) | Moments | x | |||||||||
| Highton et al. [93] | 2016 | N = 21 (0) | TRS-20 (2) | Fitting | x | x | x | |||||||
| He et al. [60] | 2018 | N = 7 (0) | In-house (16) | Fitting | x | x | ||||||||
| Brain assessment in death (number of studies = 4) | ||||||||||||||
| Liebert et al. [96] | 2014 | N = 35(NA) | In-house (17) | Moments | x | |||||||||
| Lanks et al. [94] | 2017 | N = 11 (0) | NIRO-TRS1 (5) | Fitting | x | x | ||||||||
| Lanks et al. [95] | 2018 | N = 1 (0) | NIRO-TRS1 (5) | Fitting | x | x | x | x | ||||||
| Weigl et al. [97] | 2018 | N = 28 (9) | In-house (17) | Moments | x | |||||||||
| Psychiatry (number of studies = 9) | ||||||||||||||
| Shinba et al. [98] | 2004 | N = 13 (10) | TRS-10 (1) | Fitting | x | x | ||||||||
| Hoshi et al. [99] | 2006 | N = 14 (16) | TRS-10 (1) | Fitting | x | |||||||||
| Harada et al. [100] | 2007 | N = 14 (14) | TRS-10 (1) | Fitting | x | x | x | |||||||
| Sakatani et al. [105] | 2014 | N = 34 (0) | TRS-20 (2) | Fitting | x | x | ||||||||
| Sakatani et al. [101] | 2015 | N = 61 (0) | TRS-20 (2) | Fitting | x | x | x | |||||||
| Machida et al. [102] | 2016 | N = 61 (0) | TRS-20 (2) | Fitting | x | x | x | |||||||
| Nakano et al. [106] | 2016 | N =20 (0) | TRS-20 (2) | Fitting | x | x | x | x | ||||||
| Murayama et al. [103] | 2017 | N = 113 (0) | TRS-21 (3) | Fitting | x | x | x | |||||||
| Oyama et al. [104] | 2018 | N = 202 (0) | TRS-21 (3) | Fitting | x | x | x | x | x | |||||
| Peroperative care (number of studies = 7) | ||||||||||||||
| Ohmae et al. [110] | 2007 | N = 33 (0) | TRS-10 (1) | Fitting | x | x | x | x | x | x | x | |||
| Sato et al. [112] | 2007 | N = 7 (0) | TRS-10 (1) | Fitting | x | x | x | x | ||||||
| Kakihana et al. [111] | 2010 | N = 10 (0) | TRS-10 (1) | Fitting | x | |||||||||
| Kacprzak et al. [109] | 2012 | N = 16 (0) | in-house (15) | Moments | x | x | ||||||||
| Yamazaki et al. [113] | 2013 | N = 18 (0) | TRS-20 (2) | Fitting | x | |||||||||
| Suzuki et al. [114] | 2015 | N = 80 (0) | TRS-20 (2) | Fitting | x | x | x | x | ||||||
| Fujisaka et al. [115] | 2016 | N = 1 (0) | tNIRS-1 (4) | Fitting | x | x | ||||||||
| Others (number of studies = 2) | ||||||||||||||
| Visani et al. [116] | 2015 | N = 12 (10) | In-house (9) | Gating | x | x | ||||||||
| Abdalmalak et al. [107] | 2017 | N = 1 (0) | In-house (18) | Moments | x | x | ||||||||
© 2019 by the authors. Licensee MDPI, Basel, Switzerland. This article is an open access article distributed under the terms and conditions of the Creative Commons Attribution (CC BY) license (http://creativecommons.org/licenses/by/4.0/).
Share and Cite
MDPI and ACS Style
Lange, F.; Tachtsidis, I. Clinical Brain Monitoring with Time Domain NIRS: A Review and Future Perspectives. Appl. Sci. 2019, 9, 1612. https://doi.org/10.3390/app9081612
AMA Style
Lange F, Tachtsidis I. Clinical Brain Monitoring with Time Domain NIRS: A Review and Future Perspectives. Applied Sciences. 2019; 9(8):1612. https://doi.org/10.3390/app9081612
Chicago/Turabian StyleLange, Frédéric, and Ilias Tachtsidis. 2019. "Clinical Brain Monitoring with Time Domain NIRS: A Review and Future Perspectives" Applied Sciences 9, no. 8: 1612. https://doi.org/10.3390/app9081612
Note that from the first issue of 2016, this journal uses article numbers instead of page numbers. See further details here.