
Dynamic Wind Turbine Blade Inspection Using Micro-Polarisation Spatial Phase Shift Digital Shearography


1
School of Engineering, London South Bank University, 103 Borough Road, London SE1 0AA, UK
2
TWI LTD, Granta Park, Great Abington, Cambridge CB21 6AL, UK
*
Authors to whom correspondence should be addressed.
Appl. Sci. 2021, 11(22), 10700; https://doi.org/10.3390/app112210700
Submission received: 6 October 2021
/
Revised: 6 November 2021
/
Accepted: 9 November 2021
/
Published: 12 November 2021
(This article belongs to the Special Issue Advanced Digital Non-Destructive Testing Technology)
Abstract
:Shearography, as a novel non-destructive evaluation technique, has shown notable ability in the detection of composite materials. However, in current shearography practices, the phase shifting and loading methods applied are mainly static. For instance, vacuum hood or force loading facilities are often used in phase-shifting shearography, and these are hard to realise with robotic control, especially for on-board inspection. In this study, a dynamic process for detecting defects in the subsurface of a wind turbine blade (WTB) using spatial phase shift with dynamic thermal loading was proposed. The WTB sample underwent a dynamic thermal loading operation, and its status is captured by a Michelson interferometric-based spatial phase shift digital shearography system using a pixelated micro-polarisation array sensor. The captured images were analysed in a 2D frequency domain and low-pass filtered for phase map acquisition. The initial phase maps underwent a window Fourier filtering process and were integrated to produce a video sequence for realisation of visualising the first derivative of the displacement in the process of thermal loading. The approach was tested in experimental settings and the results obtained were presented and discussed. A comparative assessment of the approach with shearography fringe pattern analysis and temporal phase shift technique is also presented and discussed.
1. Introduction
Researchers have attempted in recent years to develop non-destructive evaluation (NDE) techniques for subsurface defect detection in wind turbine blades (WTBs). Among these, shearography has shown its adaptability to the inspection of various composite materials. This is attributed to its feature of showing the stress concentration and the first derivatives of the displacement while loading on the material’s surface. The novelty of using shearography as an NDE technique for inspecting WTBs is its integration with a robotic platform for on-board defect inspection. A few projects, such as DASHWIN [1] and WInspector [2], have used shearography for the inspection of WTBs using dynamic analysis methods. The reported results are qualitative fringe pattern evaluations, which are subtractions of loaded and unloaded speckle patterns, and no phase maps are produced during the process. The main focus of these projects has been dynamic manipulation and semi-automatic control with no manual work in the inspection, as fringe pattern analysis is more practical in real-time dynamic evaluation compared to the acquisition of a phase map.
The development of shearography systems in recent years has also included the optimisation of phase results using different phase shift techniques for accuracy and quantitative analysis [3]. In the context of inspection, the retrieval phase is more sensitive to the defect than fringe pattern, as when the loading is small, the fringes may not form, while one can easily obtain the information from the phase map. Conventional temporal phase shift digital shearography (TPS-DS) [4,5,6] has been used largely for interferometric analysis. However, changing phase in the time-domain (i.e., at different points in time using phase shifting devices) does not meet the dynamic inspection requirement for WTB inspection. The reason is that in the recording process the shearogram will be easily affected by any fluctuations on the surface. Moreover, a piezoelectric stepper for shifting the phases is hard to control in an integrated robotic system, because the time for shifting the phase needs to be kept short to maintain the optimum fringes for phase map calculation. Furthermore, the relative motion between the sample surface and shearography system needs to be eliminated. If the vibration between the WTB and shearography system is intense to a critical level, the expected results, including phase information, will be lost. The possibility of deriving phase using temporal phase shift interferometry is low owing to the above-mentioned limitations. Thus, researchers have attempted to develop quasi-dynamic inspection processes using advanced algorithms to estimate phase results in a shorter time and with fewer phase-shifting steps. Among these, several algorithms have shown promising results for their fast and precise estimation. Carlsson and Wei [7] and Huang et al. [8] have reported the use of temporal phase shift before loading and estimating the phase map using different algorithms to obtain a fringe pattern after loading. The estimating algorithms could be least-square-based, or clustering-based. The quasi-dynamic approaches with advanced algorithms have resulted in a reduction in the steps of temporal phase shift and calculation time. Kreis and Jueptner [9] also used phase calculation by adopting two successive fringes without knowing their phase step value. However, their approach was limited in the on-board control of the temporal phase stepping. Vargas et al. [10] used principal component analysis on two successive fringes, where phase step was unknown, and achieved relatively more ideal results with less complex computations. They subsequently proposed further developments of their approach with the use of different algorithms, obtaining improved results [11,12]. The application of these methods to real WTBs and their subsurface defects, however, has led to distorted and vague results in some areas that could not show full defect information.
To overcome the limitations of dynamic inspection using TPS-DS, researchers have proposed spatial phase shift digital shearography (SPS-DS). Van Haasteren and Frankena [13] used three cameras to acquire multiple images at the same time for real-time inspection and used conventional phase calculation methods. However, the approach was costly and complex to build, and did not meet the requirements of industry. Xie et al. [14] have carried out modifications to a Michelson interferometer-based system to achieve a larger field of view and used spatial carrier frequency phase shifting to obtain the final phase map. The SPS-DS system thus reported can be used for real-time inspection as an NDE tool on WTB. However, the computational cost of the spatial carrier frequency is high and the confocal point between two lenses is hard to maintain in practice.
Millerd et al. [15] have proposed an SPS-DS technique using micro-polarisers at each small pixel as a carrier on a CCD or CMOS camera. The polarisation has four directions on its array at each pixel of the camera, where with the combination of the circular direction of the oscillation, the phase of interfered beam passing through the micro-polariser is doubled. Serrano-Garcia and Otani [16] further developed the approach using a Michelson interferometer-based setup, but this is yet to be made practical for NDE as the experimental configuration and the sample do not match industrial material. The interferometric technique has been applied on shearography in [17] with relatively low signal-to-noise ratio using a Mach–Zehnder interferometer configuration. A more promising set-up of the SPS-DS has been developed by the combination of spatiotemporal phase-shifting technique and 3D Fourier transform [18,19] with pixelated SPS-DS by fully using simple configuration of the Michelson interferometry-based setup on shearography [20]. The approach achieved a relatively ideal phase map of a hollow artificial cylinder with uniformly exerted air pressure as the loading method. However, in context of NDT and industrial application, these set of trials lacked real-world verifications on industrial material.
WTB is a typical type of facility using composite material for which defect information is nowadays required in real-time and on-board the system. The samples used in most studies of shearography are almost always simple and easy to detect the defects in, whereas in practical NDT inspection processes on-board WTBs, the defects are neither presupposed nor artificial. Moreover, the loading methods applied mainly exert stress evenly on the surface using facilities such as vacuum hood or force loading. These loading methods are suitable for static environments where it is easy to produce a high-quality phase map for the imaging process. However, these approaches are difficult to realise and control in dynamic on-board inspection, and significant efforts need to be made to design adequate loading and control systems for application. By comparison with the loading methods hereinbefore, dynamic loading methods such as heat flow or heating lamp are more feasible to realise as they are easy to control, even remotely, thus complying with on-site NDT conditions in practice.
In this study, a shearography system based on a simple setup of Michelson interferometry using pixelated spatial phase shift was used for the dynamic inspection of delamination defects on a real WTB. Heat flow was used as the loading method. The objective of this work was to validate that the proposed system could be applied on-board a real WTB without using any complicated control for the PZT stepper or complex optical table that could hardly be applied on a platform for in situ WTB inspection. The essence of the proposed method is to optimise the micro-polarised spatial phase shift shearography system by using a carrier modulation algorithm and adding a windowed Fourier filter. Moreover, the proposed method was applied on an actual blade sample to examine its capability for detecting the defects in a practical experimental setting. The rest of the paper is structured as follows: Section 2 presents the proposed methodology for development of the shearography system for on-board inspection of WTBs. Section 3 presents experimental investigations with the corresponding results and discussion. The paper is concluded in Section 4.
2. Methodology
2.1. System Principle and Setup
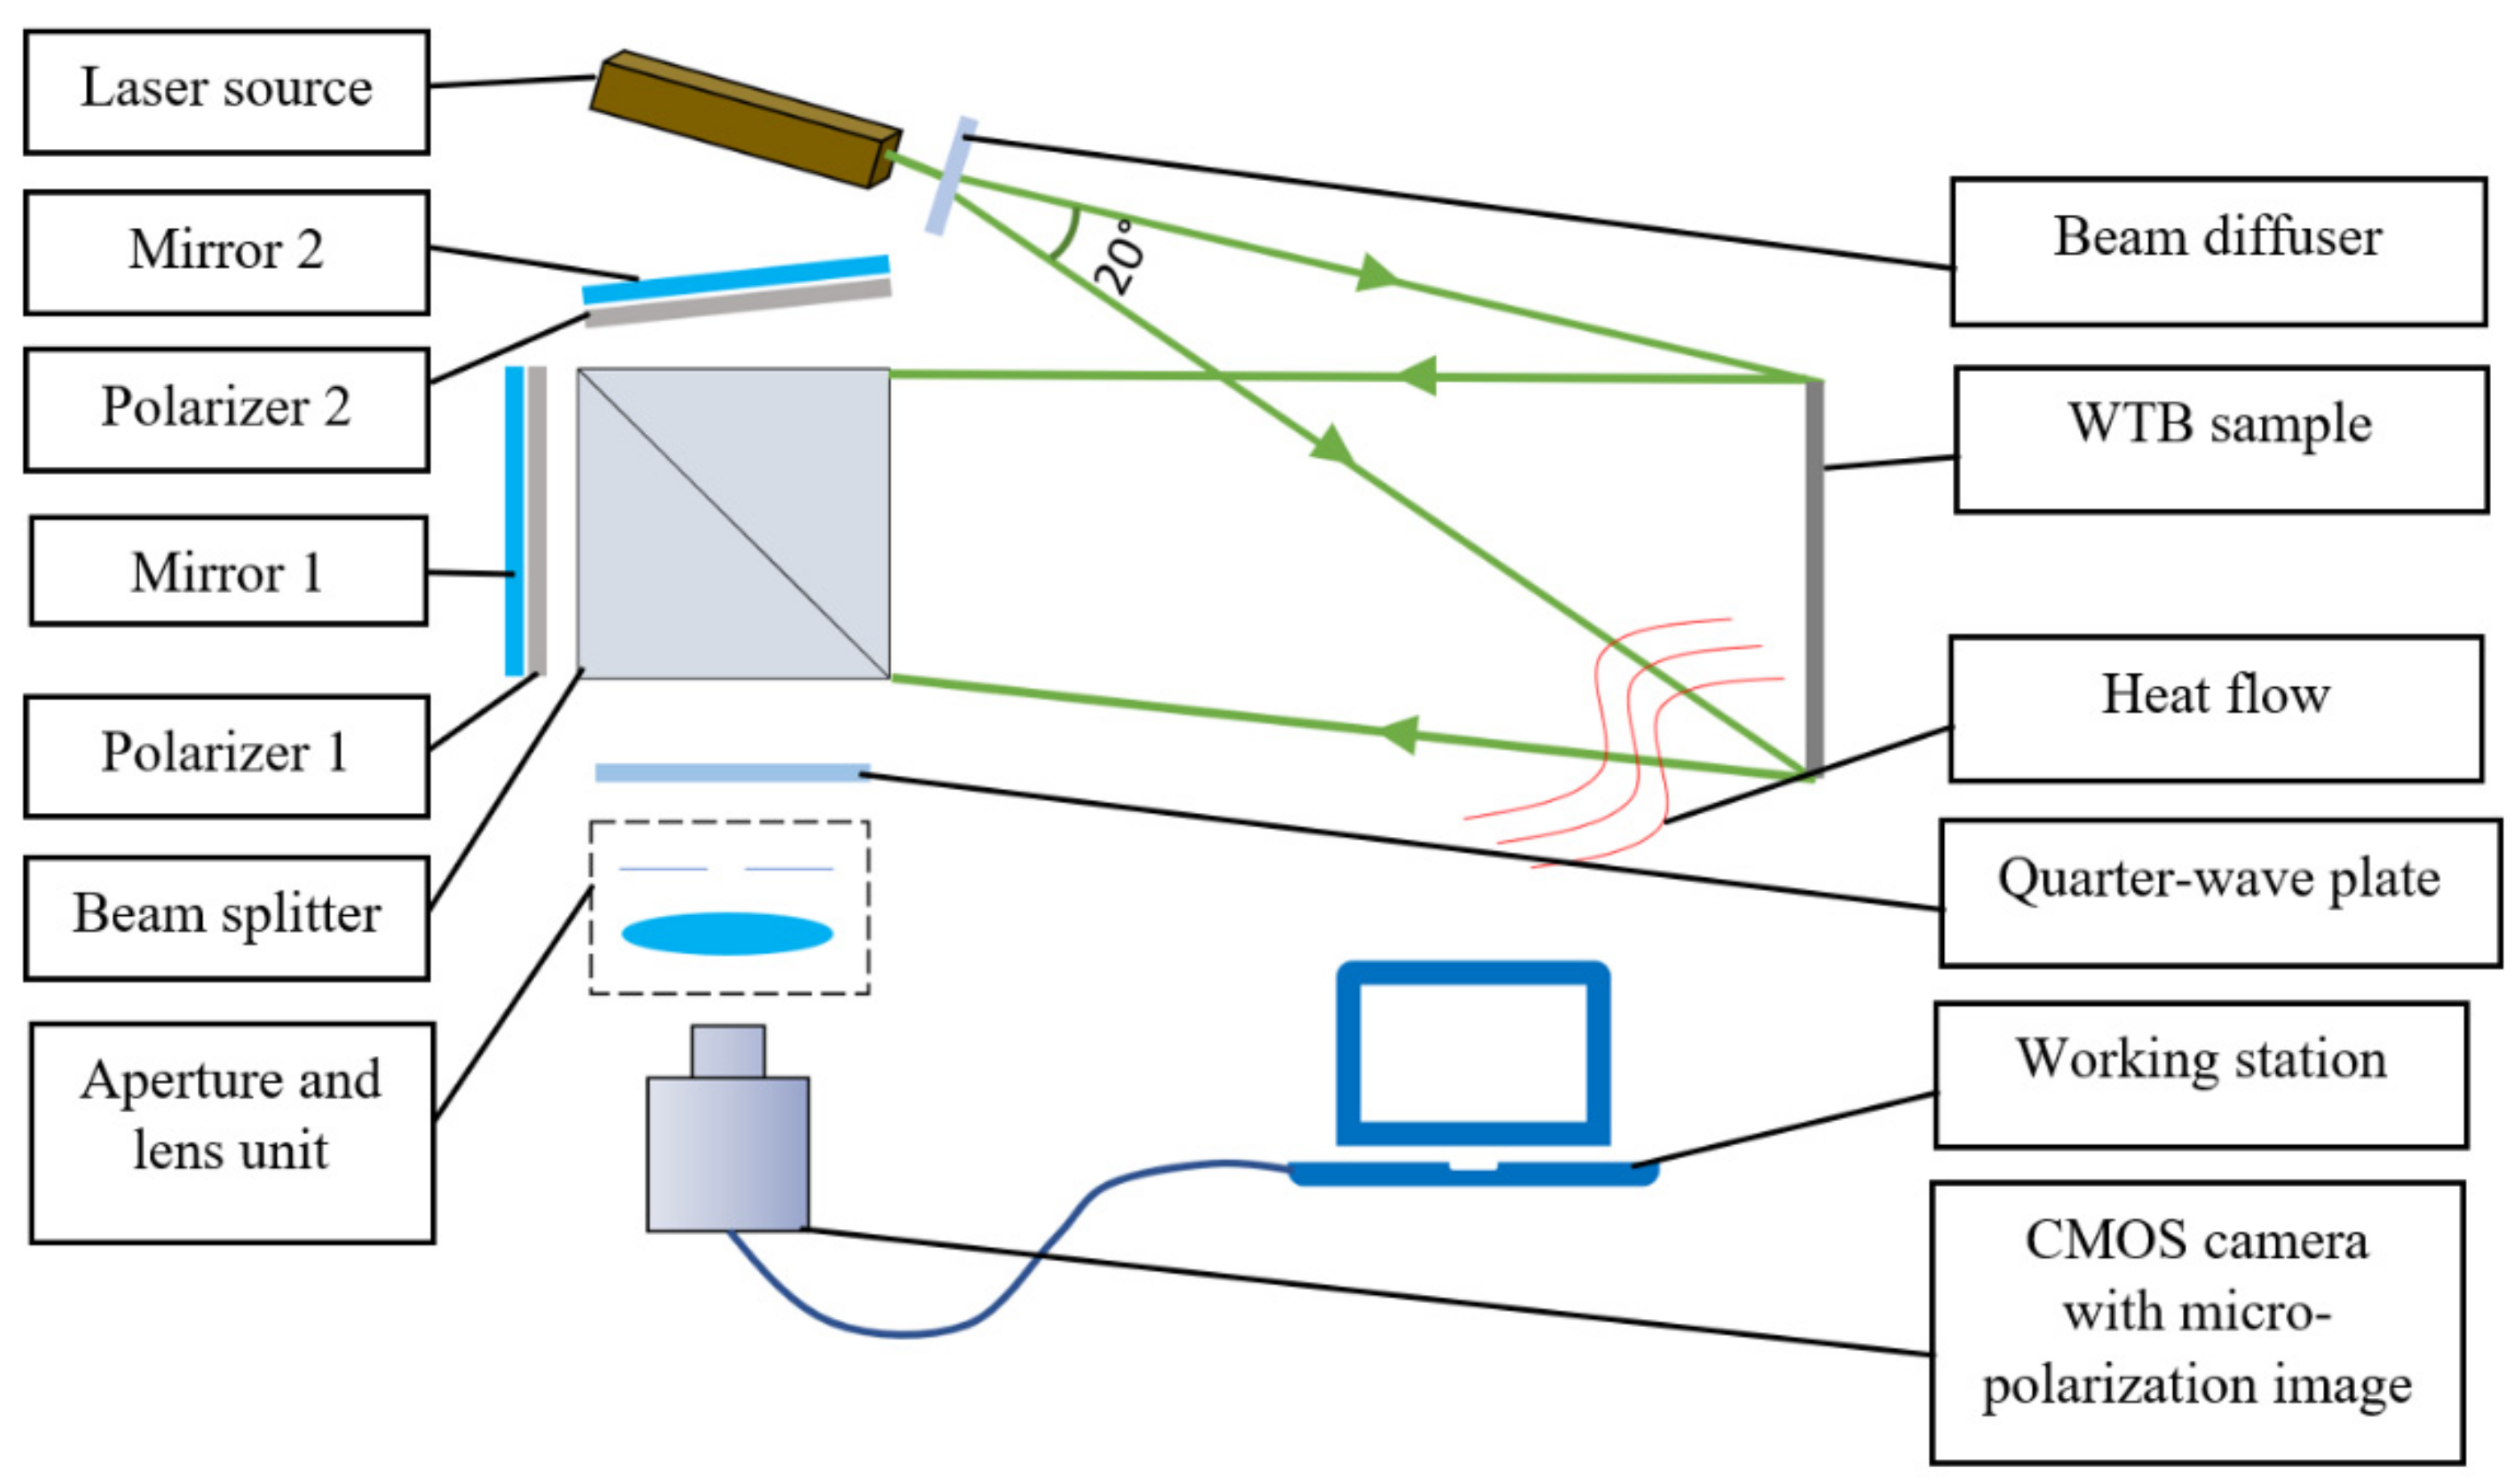
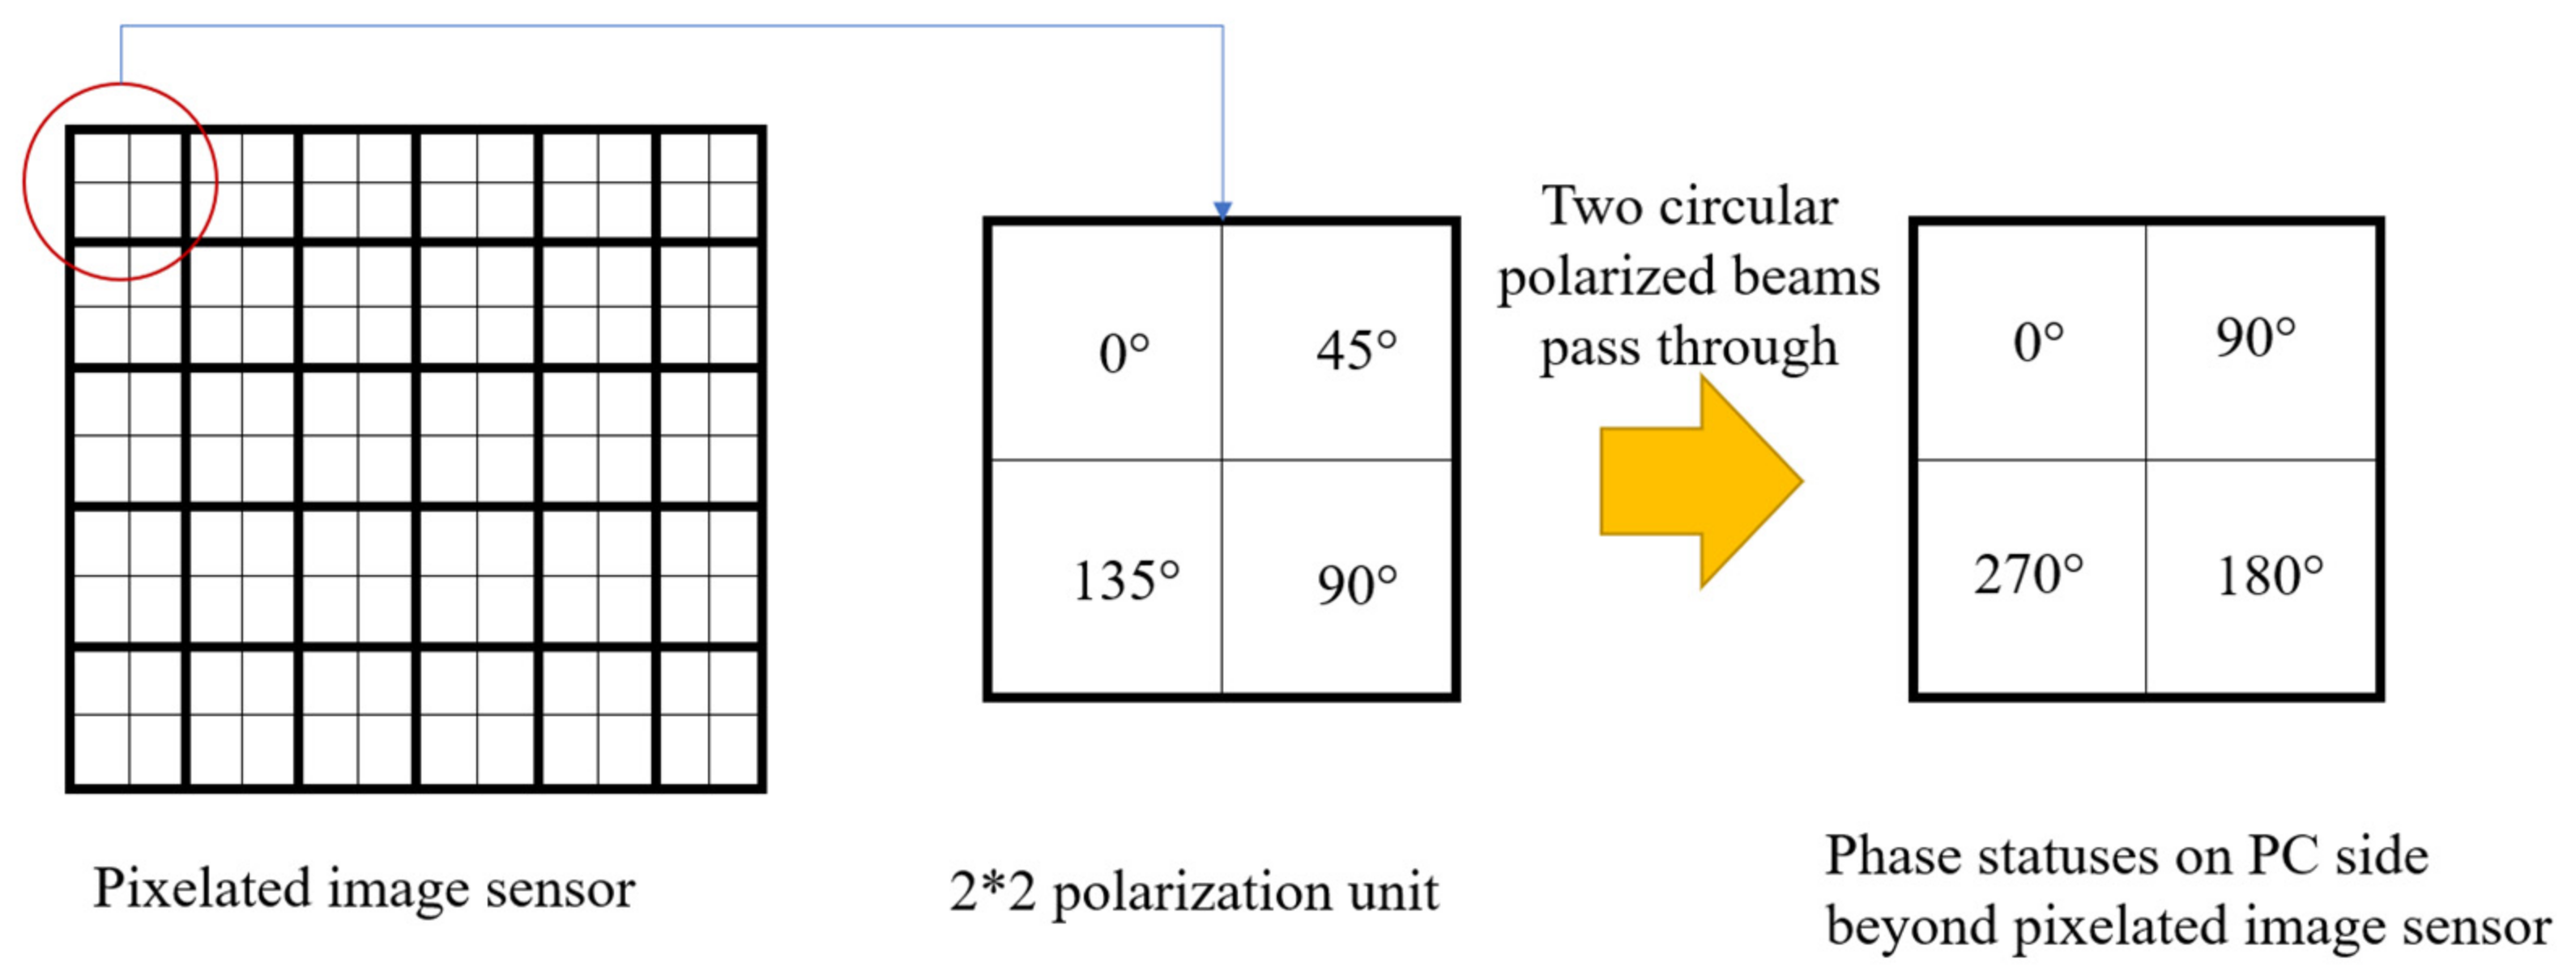
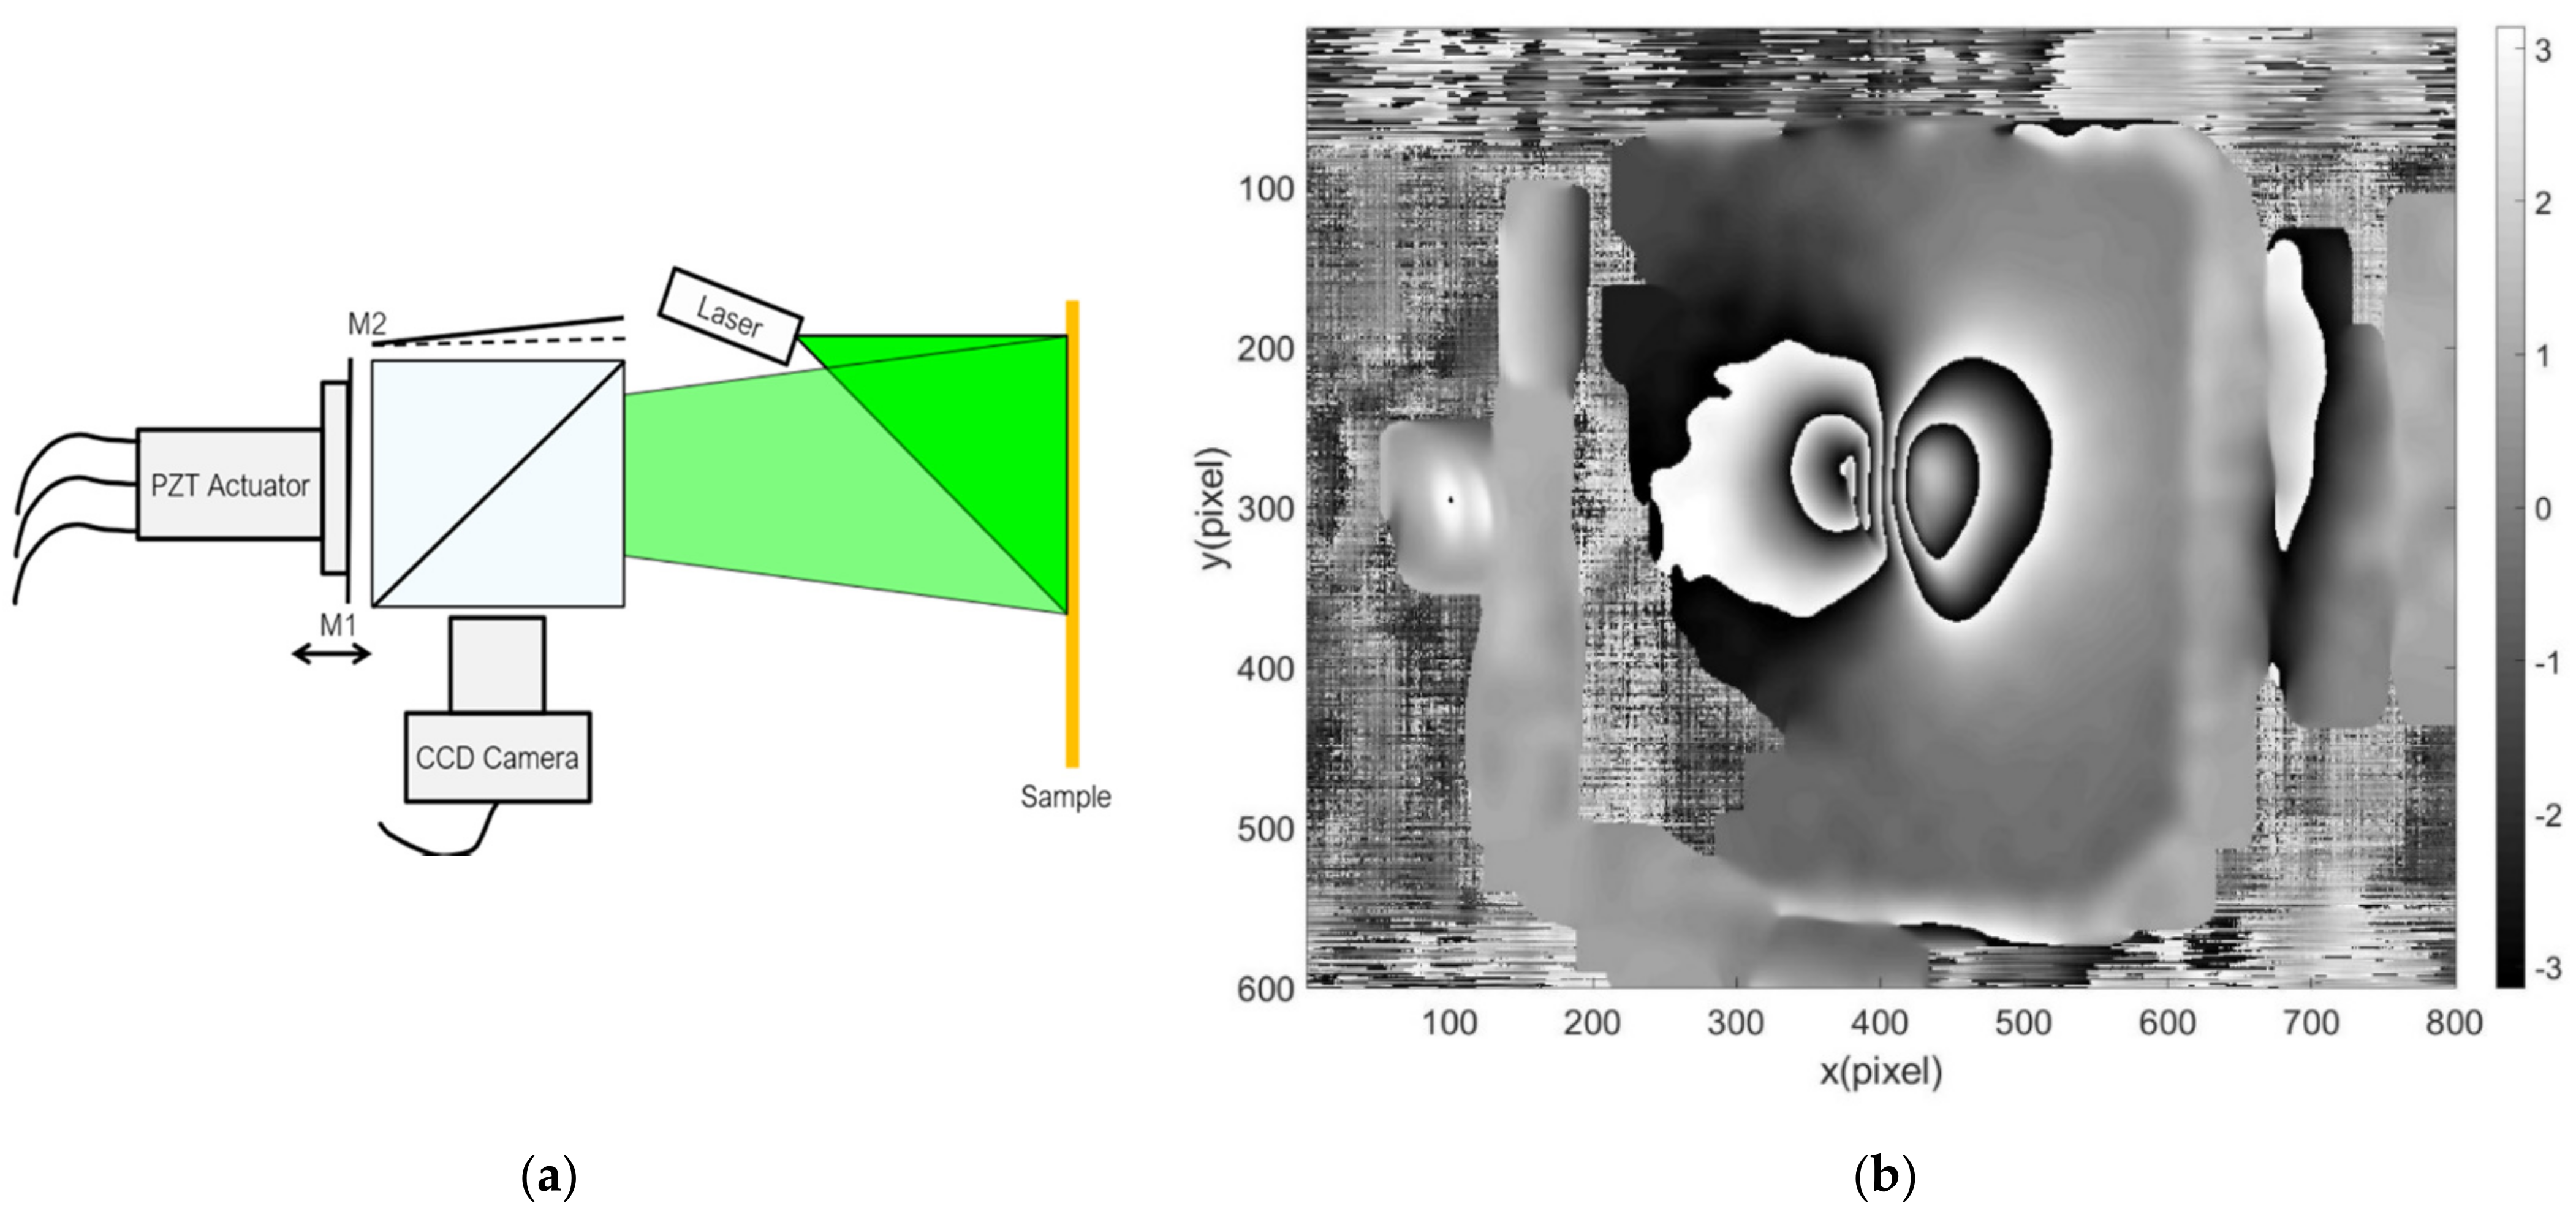
Figure 1 shows a schematic setup of the pixelated spatial phase shift shearography system, including a 532 nm laser source with a power less than 300 mw, expanded by the beam expander, with an angle of 20 degree. The WTB sample is illuminated by the expanded beam, which is received by the Michelson interferometry-based shearography system, where a beam splitter separates the beam into two light paths, each having 50% of the original light intensity at the receiving end of the beam splitter. Two mirrors (mirror 1 and mirror 2) are placed in front of the beam splitter, and mirror 2 is tilted with a small angle to ensure the shearing function of the shearography system. The light beam that goes towards mirror 1 is polarised in the x direction by polariser 1 and is received again by the beam splitter after mirror 1’s reflection. In a similar way, the other light beam is polarised in the y direction by polariser 2 and reflected by mirror 2. Based on optical principles, the linear polarised light will change its oscillating direction to a circular form after passing through a quarter-wave plate; consequently, the two polarised beams are left-hand and right-hand circularly polarised before they are received by the CMOS camera. An image lens placed in front of the CMOS camera adjusts the focusing and aperture size. This enables appropriate sizing of the aperture to make the speckles received by the camera more distinctive at the black and white spots. This has the benefit, in subsequent image processing steps, of simplifying the setting up of window size in the frequency domain to select the lower frequency areas in the middle of the 2D frequency domain as the speckle rings are separated for different frequency ranges [21]. The traditional spatial carrier phase-shifting method [14] also uses the aperture to control the speckle size, but the advantage of the proposed method is that it has no requirement for the CMOS camera’s spatial resolution or advanced spatial filters, except the need for a micro-polarisation image sensor. The two light beams thus generated are received by the CMOS camera on which micro-polarisation image sensing [22] is applied. The pixelated illustration is shown in Figure 2. Each pixel is divided into four subordinate pixels (a, b, c, and d) with four directions of polarisation at increments of 45° polarisation angles, making up 0° to 135° clockwise. With the integration of the derived left-hand and right-hand circularly polarised beams from the quarter-wave plate and the special image sensor, the phase difference between the two beams becomes twice the polarisation direction angles on the micro-polariser sensor. Thus, for one of the pixels of the camera, the four divided small pixels (a, b, c, and d) will be at the phase positions of 0°, 90°, 180°, and 270°, respectively, with respect to the two incoming beams.
2.2. Carrier Mask Modulation and Window Selection Phase Map Retrieval
The initial light intensity for the original data captured at the camera side can be expressed as:
where and are the intensities provided by the two split beams from the beam splitter in the Michelson interferometer, is the optical random phase difference between the two beams, represents the four phase values 0, , , and shifted by the system’s setup and the micro-polarisation image sensor. The above equation cannot be solved for a phase map using a conventional four-step phase-shift calculation, as the calculation will need to be carried out in the complex domain with a carrier mask modulated on all the pixels. The carrier modulation on each subordinating pixel is . The modulated intensity with the carrier mask in a single pixel could be expressed as in the following equation, which shows the phase shift angles in each of the four small pixels:
where and according to the image sensor’s coordinate arrangement. Equation (2) can also be expressed in exponential form, for showing the different frequency areas in the frequency domain, as:
The second term in the above equation is the lower frequency that could be selected by changing the window size in the frequency domain, while other terms are at the higher frequency that could be separated at the same time, thus the selected term (denoted by ) by the window in the frequency domain can be expressed as:
To select the lower frequency, , the necessary step of 2D Fourier transform (2D-FT), and a window of selecting the designated frequency area in the 2D frequency domain need to be generated. The 2D-FT of the modulated intensity distribution can be expressed as:
where and are complex indices in the 2D frequency domain equivalent to x and y in the 2D spatial domain. The window for selecting the appropriate lower frequency area can be expressed as . The window function could be used as a Gaussian centre or an ordinary rectangular window, the length and width of which could be changed according to the practical circumstances. In the case here, the rectangular window is used for simplicity of lower frequency selection. This function allows the lower frequency to pass while blocking the higher frequency below the cutoff rectangular edge, and can be expressed as:
where a and b represent the window size, i.e., length and width of the filtering window, and A and B are the cutoff frequencies along axis and axis to be filtered in this process. The inverse Fourier transform could then be operated after the lower frequency area selection, which is expressed as:
To obtain the phase map, phase change through time needs to be calculated using conjugate multiplication. Assume is the complex form of the phase status at time , is that at time , the phase change between and can be expressed as ;
Then the phase map expressed by can be derived by simply using the following equation:
2.3. Filtering Algorithms and Phase Sequence Retrieval
The phase map derived using the approach presented in the previous section contains a certain amount of noise, which needs to be filtered to achieve accurate results through further quantitative analysis. The WFF (windowed Fourier filtering) algorithm [23] is adopted here as it does not take much computational calculation and achieves a relatively more accurate phase map. The theory and principle of WFF can be found in [23,24,25,26]. The filtered phase map can be expressed as, and its complex domain equivalent can be expressed as .
The vital significance of the inspection of WTB using dynamic interferometric methods is to view changes of the phase states between current and initial times, including stress concentration, displacement, and strain change while load is exerted on the sample surface. The defects can be further analysed through dynamic changes i phase status in a more intuitive way. In previous studies, most of the methods have concentrated on deriving the discrete phase maps at a certain time instant with less analysis of deriving phase changing sequences over a period of time. Thus, it is crucial to form a dynamic phase change sequence over time. The phase change at a certain time, , in comparison to that at the initial time, , can be expressed as. The sequence from the initial time of loading to time is thus:
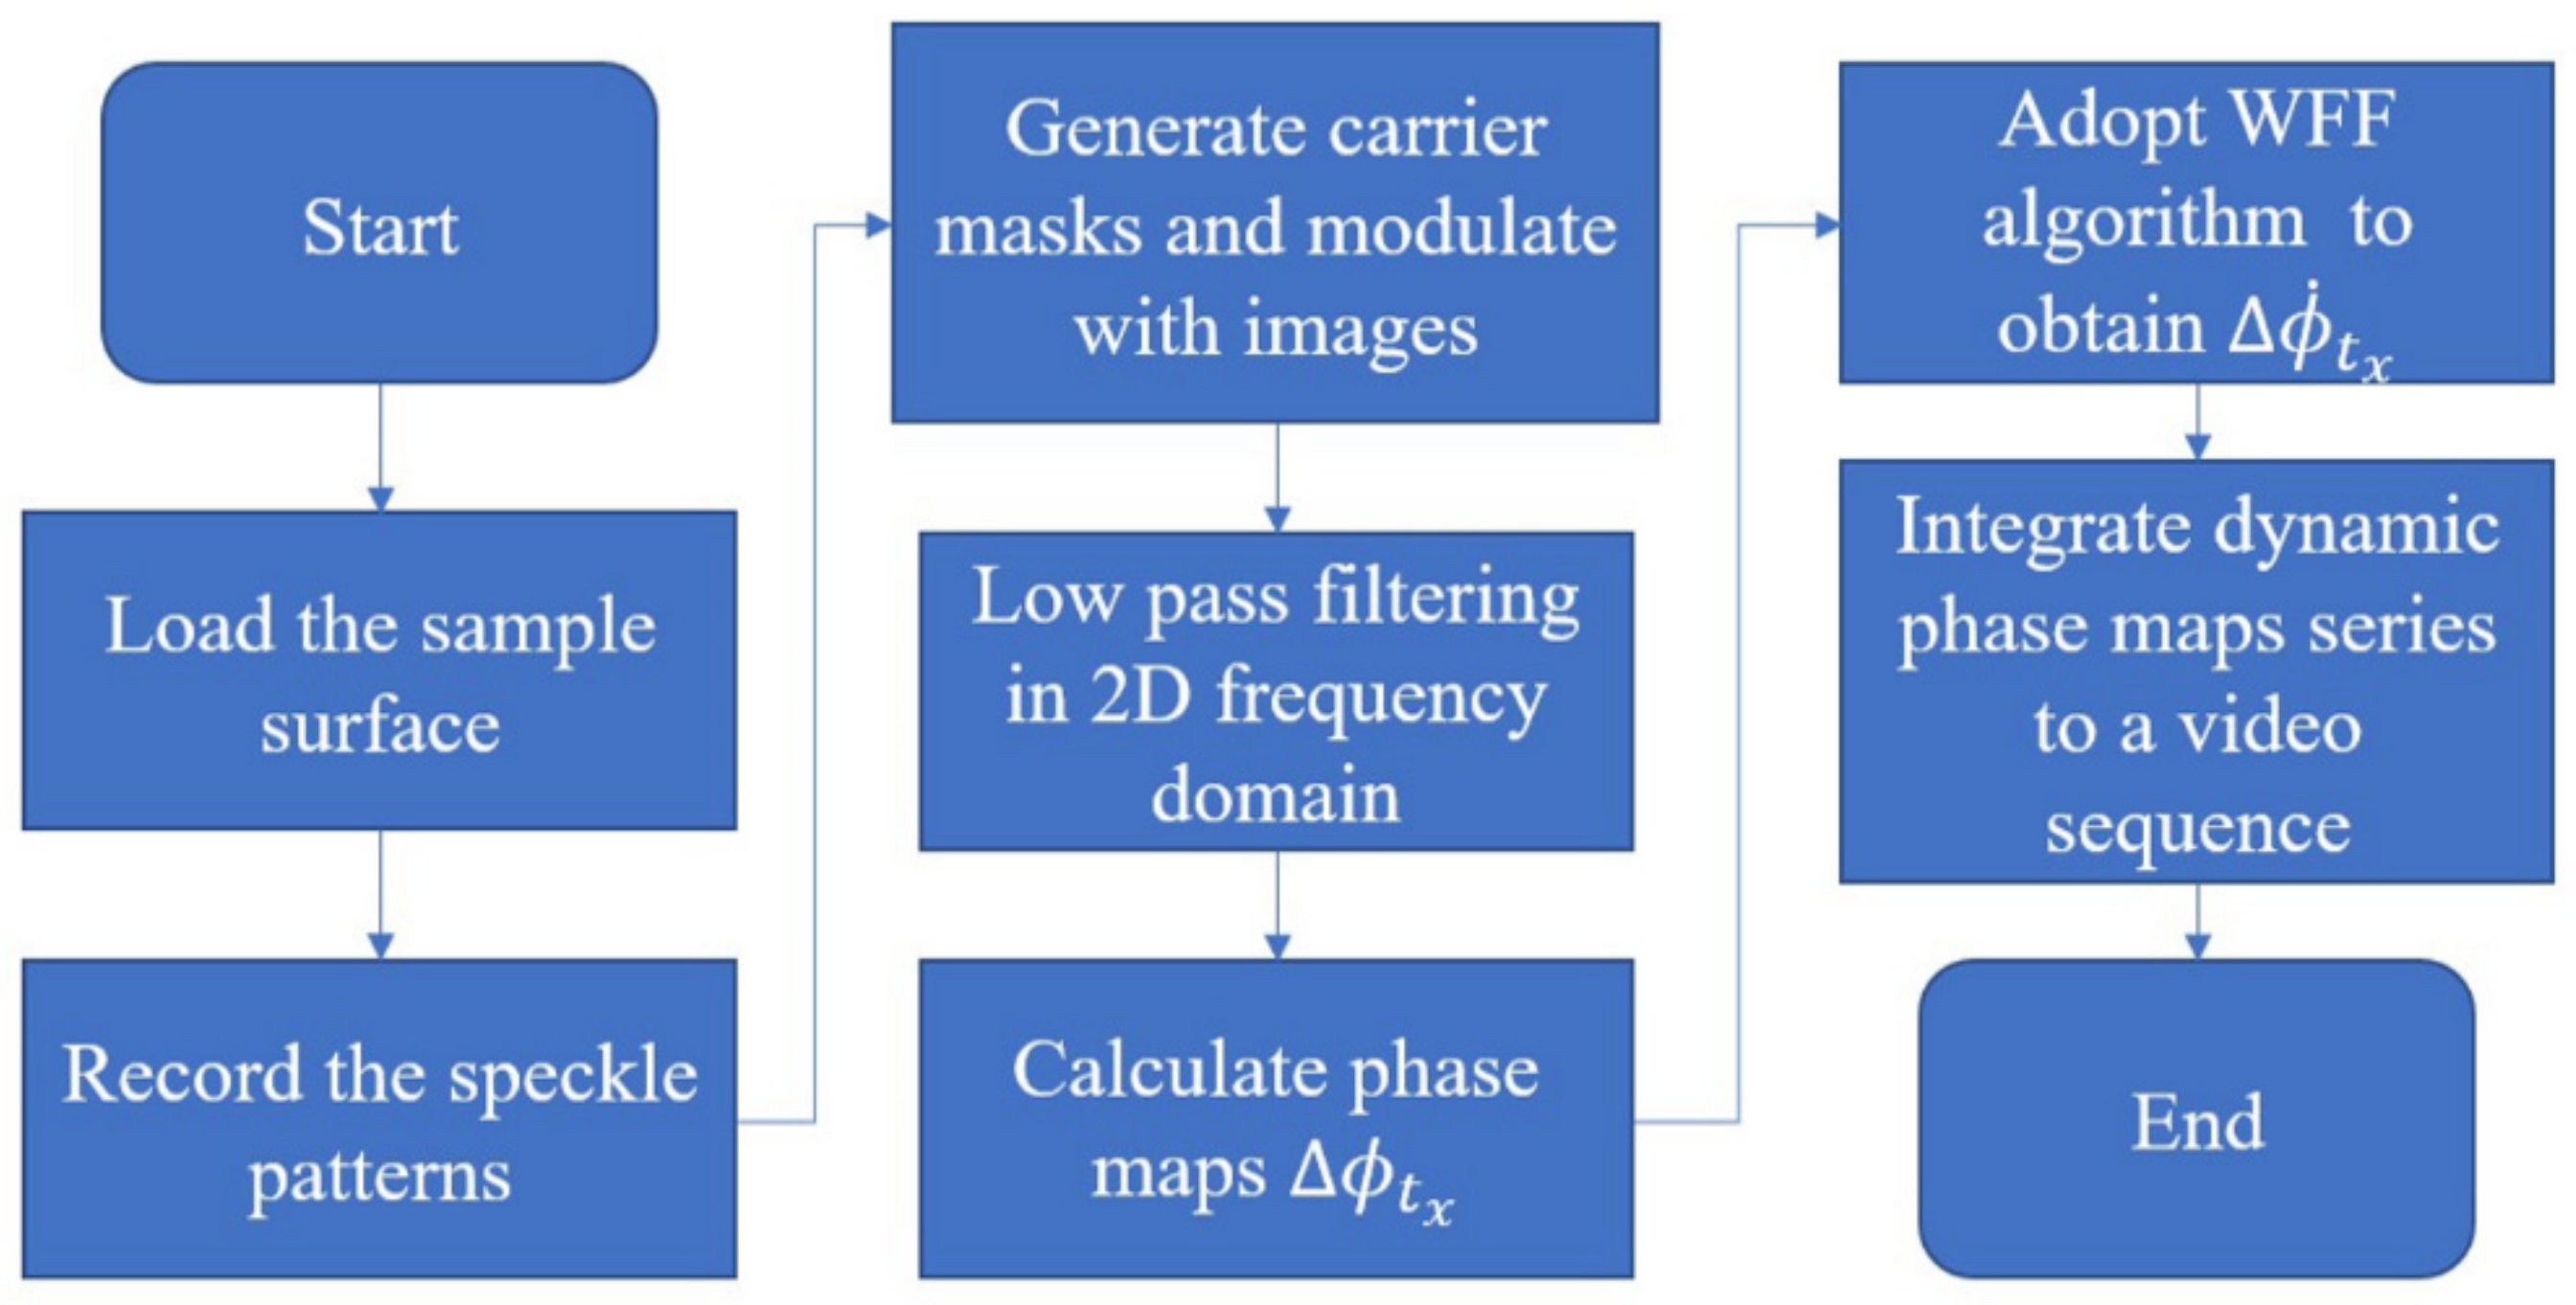
2.4. Steps of the Proposed Method
- S1
- Set up the proposed SPS-DS system described in Section 2.1 and use a heating gun to heat up the area of the WTB surface where there is known defect at the subsurface.
- S2
- Record a sequence of the speckle patterns at the heated area. Decompose the recorded video into frame-by-frame images.
- S3
- From the initial frame at time to time , generate carrier masks at four phase values in different pixels and form a large mask to modulate the whole image, as expressed in Equation (2).
- S4
- Transform the modulated speckle patterns from time to time into 2D in the frequency domain and select the central speckle rings in each speckle pattern as described above with denoting the lower frequency in Equation (4). Transform the derived frequency domain patterns into the original domain using inverse 2D Fourier transform to form the complex terms from to .
- S5
- Multiply the derived at time with conjugates of that at time , as described in Equation (7), and calculate the phase map at time , as in Equation (8).
- S6
- In each of the initial phase maps derived at , adopt the WFF algorithm in their complex domain and obtain a new filtered phase .
- S7
- Form the sequence from time to time , as described in Equation (9), produce the dynamic phase map series, and develop the defect variation along with the temperature change due to the dynamic thermal loading as a video sequence.
A flow chart of the proposed method is shown in Figure 3.
3. Experiments and Discussion
3.1. Pre-Test Using a Composite Sample
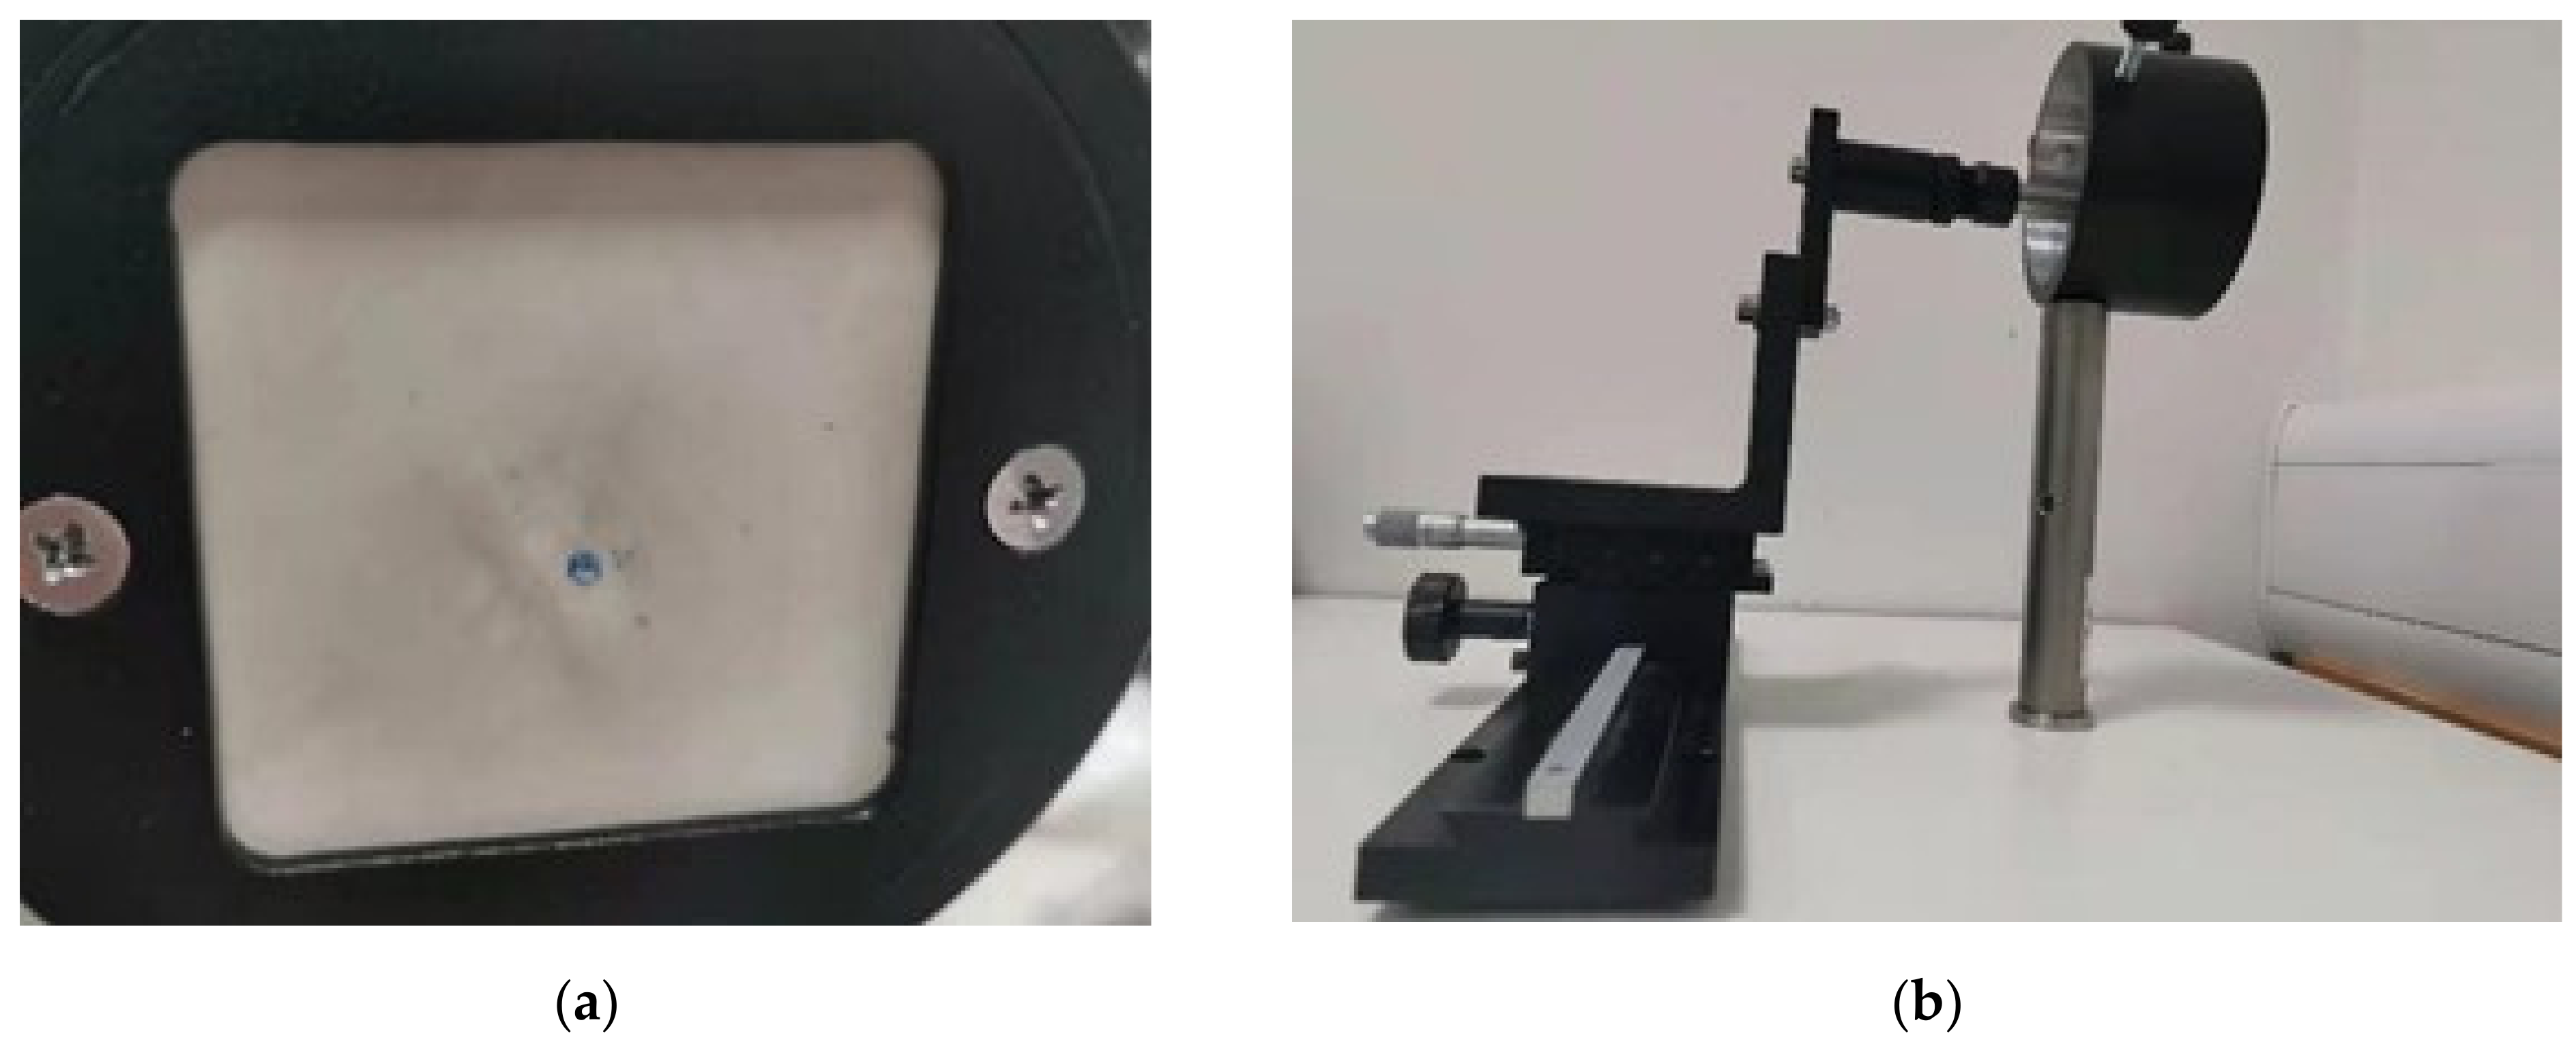
The method was initially tested on a simple artificial composite sample surface to establish its feasibility. The composite sample used is shown in Figure 4a. A continuous force, as shown in Figure 4b, exerted at the centre of the sample, was used as the loading method. A conventional TPS-DS system with three-step phase shift using piezoelectric stepper, as shown in Figure 5a, was applied for comparison of the results with the proposed SPS-DS system and the affiliated algorithm. The resulting wrapped phase map calculated with this TPS-DS system is shown in Figure 5b. The temporal phase shift shearography setup with triple captures of speckle frames enables three intensity speckle patterns to be obtained, and this can be derived, using coarse phase distribution, as:
where , , and are the loaded speckle patterns and , , and are the unloaded speckle patterns. The coarse phase map was filtered by the same filtering methods as the proposed algorithm to control the major influencing aspect for comparison purposes.
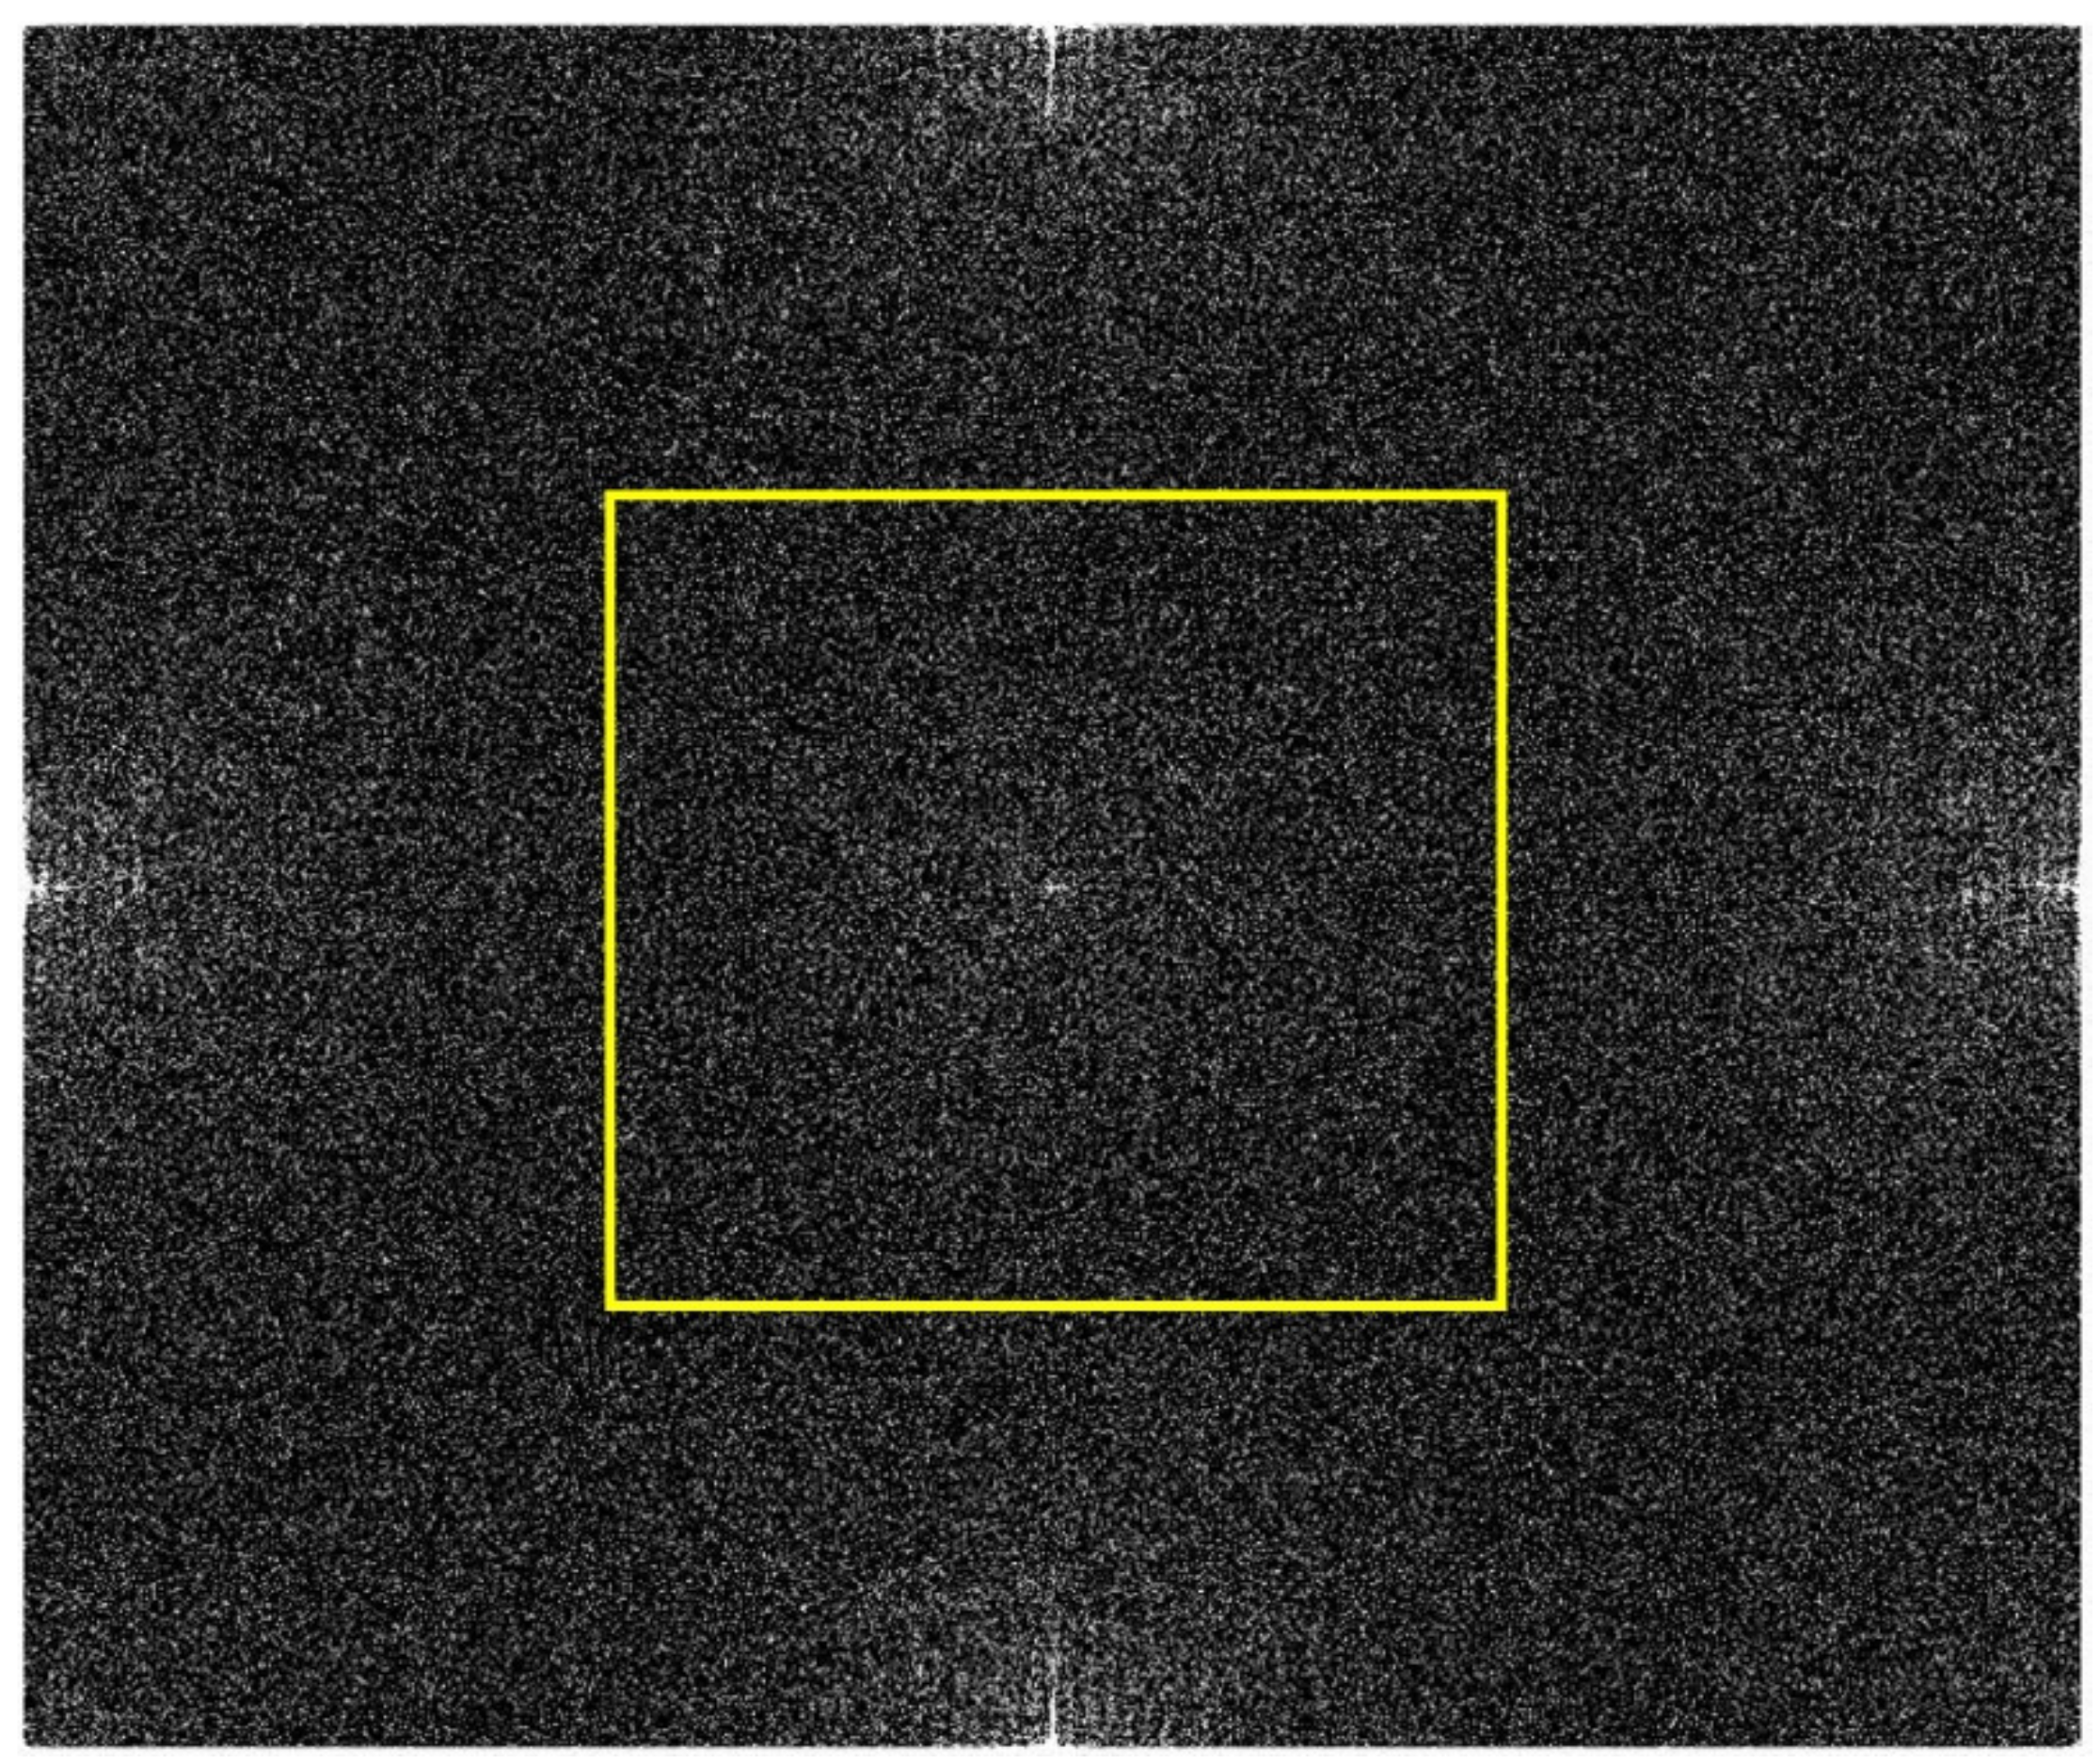
The proposed system’s feasibility verification used the same composite sample, while the force exerted on the surface was instantaneous. The adoption of force loading in this step also aimed to validate that the proposed method could be generalised to other loading methods, apart from heat flow, used in the subsequent defect detection hereinafter. The speckle pattern captured by the shearography system is the recording of the sample’s recovery process from a loaded state to the original state. Therefore, the results derived from this loading process can be deemed as dynamic. An example of the transformation to frequency domain from the carrier mask-modulated shearogram is shown in Figure 6, where the yellow marked rectangular window set for selecting the lower frequencies converged in the central area of the whole spectrum. The window size could be adjusted according to the filtering effect. The fringe patterns at three points of the time span (10th, 40th, and 70th of a total of 70 frames) can be viewed in Figure 7a–c. Accordingly, the wrapped phase maps retrieved using the proposed method at these time points can be viewed in Figure 7d–f. The development of the phase can be viewed in Video S1. As noted, the accuracy of the result was close to that obtained with static measurement method referred to in Figure 4b (TPS-DS inspection in static condition). This implies that it could be fully used as a novel NDE method for detecting true subsurface flaws on WTBs and even for in situ inspection as it is as dynamically stable as the fringe analysis shearography system. Hereinafter, two true subsurface defects on an actual WTB section were detected by the proposed method to confirm its usability and capability as a dynamic NDE method.
3.2. Test on the WTB with Known Defects
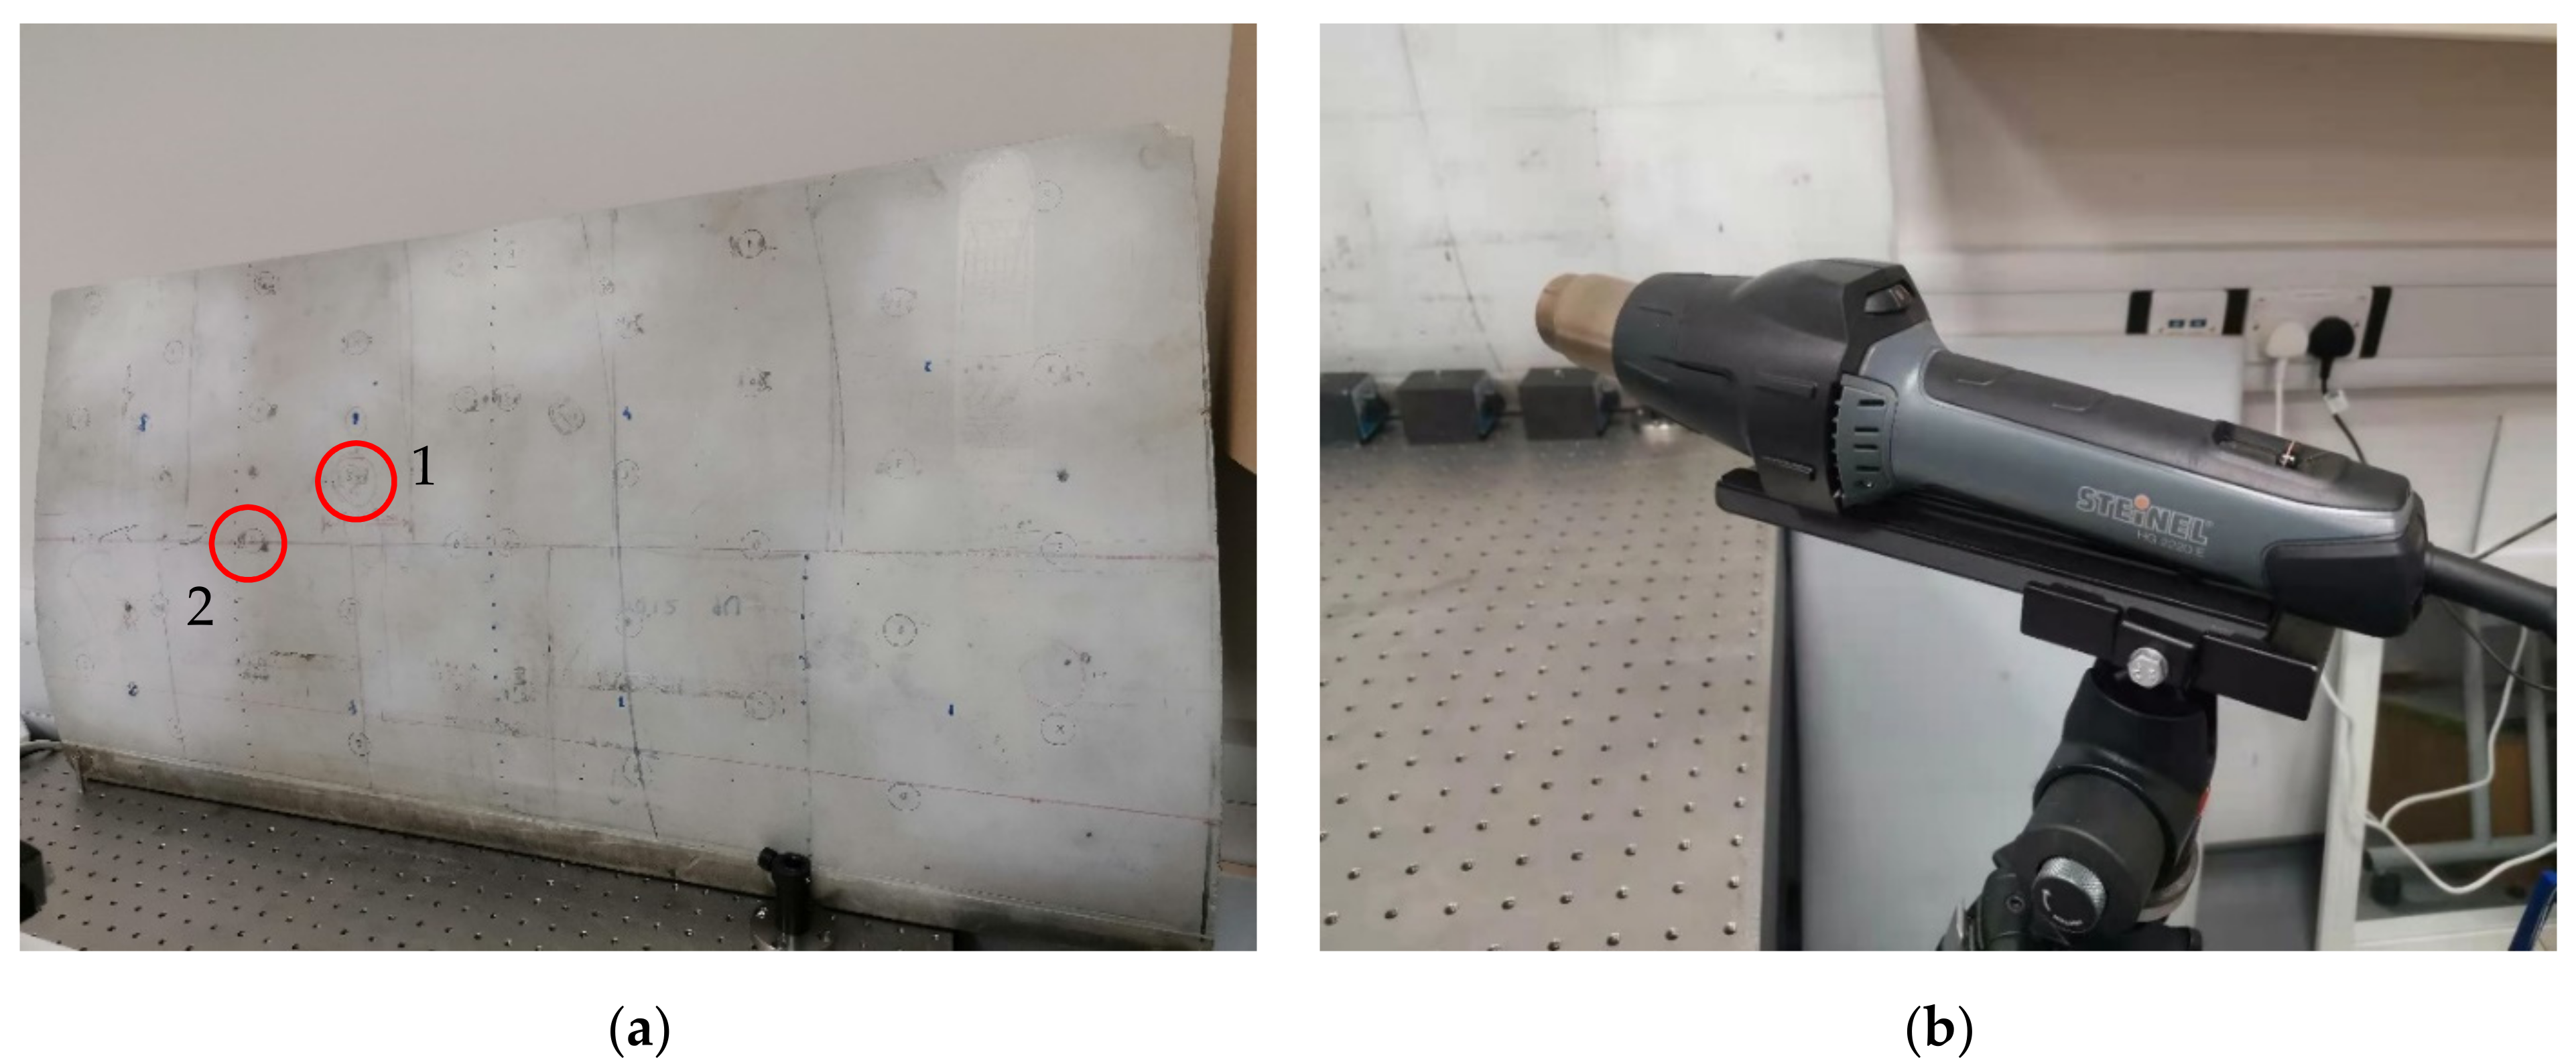
Experimental investigations with application of the proposed method on a WTB sample are described in this section. The blade sample to be inspected and the loading heat flow gun are shown in Figure 8. There were two known delamination defects on the WTB sample. These are circled red and marked as 1 and 2 in Figure 8a. The heat gun used (Figure 8b) had an output power of 2200 W with an air flow of 150–500 L/min. The temperature went from 80 °C to 630 °C with nine stages of temperature settings. In this study, the seventh stage temperature setting was used with the heating time set to 15 s for a certain area. This was to make sure that the area is heated up evenly and the temperature reached effectively. A 532 nm laser with 300 mW power (Class 3R) was illuminated on the inspected area. The FLIR CMOS camera with micro-polarisation image sensor matrix, comprising 5 MPs and 2048*2448 for the image sensor, was used in this system.
The inspection test for the two defects on the WTB sample was used to verify and consolidate the feasibility and function of the proposed method for actual defect inspection. The two known defects to be inspected were at different shapes and conditions. Both defects were delaminations in the subsurface layer, but defect 1 was an oval-like delamination, while defect 2 was made by small defects in the circled area and a had more irregular shape than defect 1. The diameters of each of the two circular areas were ~50 mm.
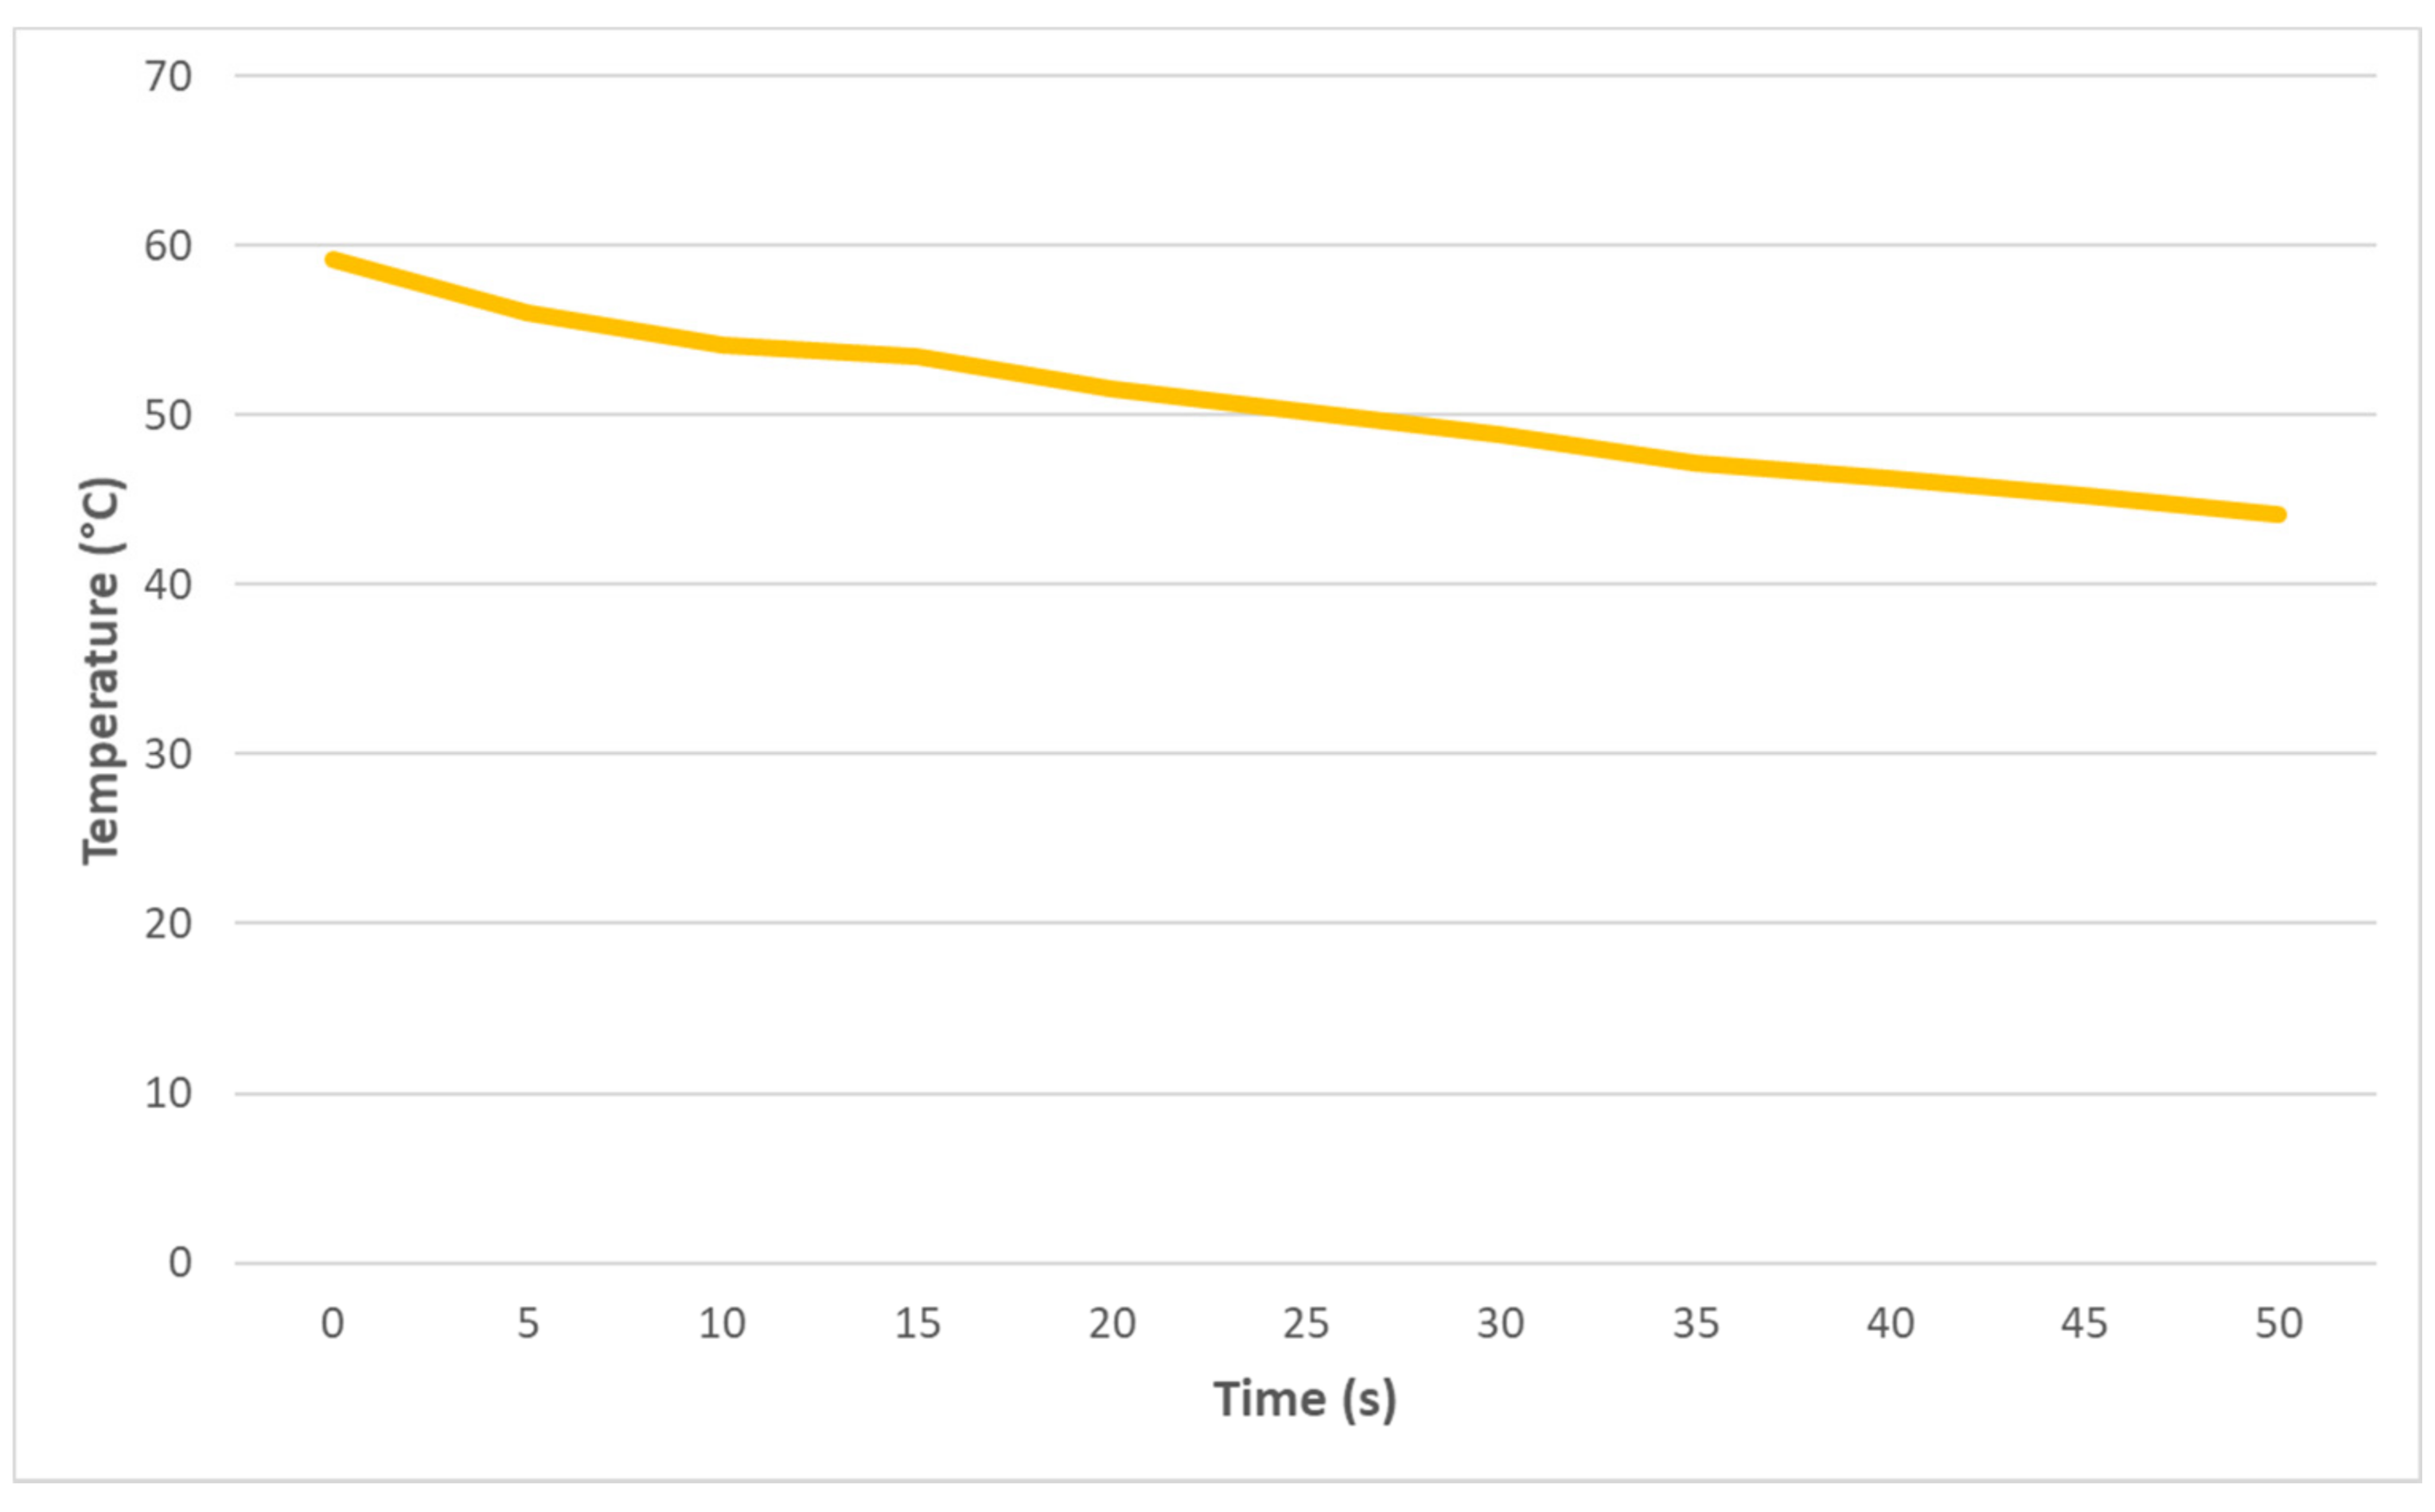
According to the proposed algorithm, the WTB surface was heated up using heat gun and the inspection data was recorded. Figure 9 shows the change of blade surface mean temperature over time for the surrounding area of the defects after heating up. During the increment of the surface temperature, accompanied by rise in surface, stress concentration has subsequently formed at the spot where the subsurface defect exists. Displacement at those spots could be seen microscopically but invisible in macroscope. The task of the shearography system is to reveal the strain by dint of phase change before and after the thermal loading and display the phase change. In the process of cooling down, the surface strain and stress concentration at defect spots are restored to the original status. The reason for using the cooling process is to avoid the temperature turbulence caused by the heat gun and the residual surrounding heat when heating up the surface. Also, the restoration of the displacement at these defects varies smoothly, which is easy to see in step 6 of the algorithm.
3.3. Phase Maps
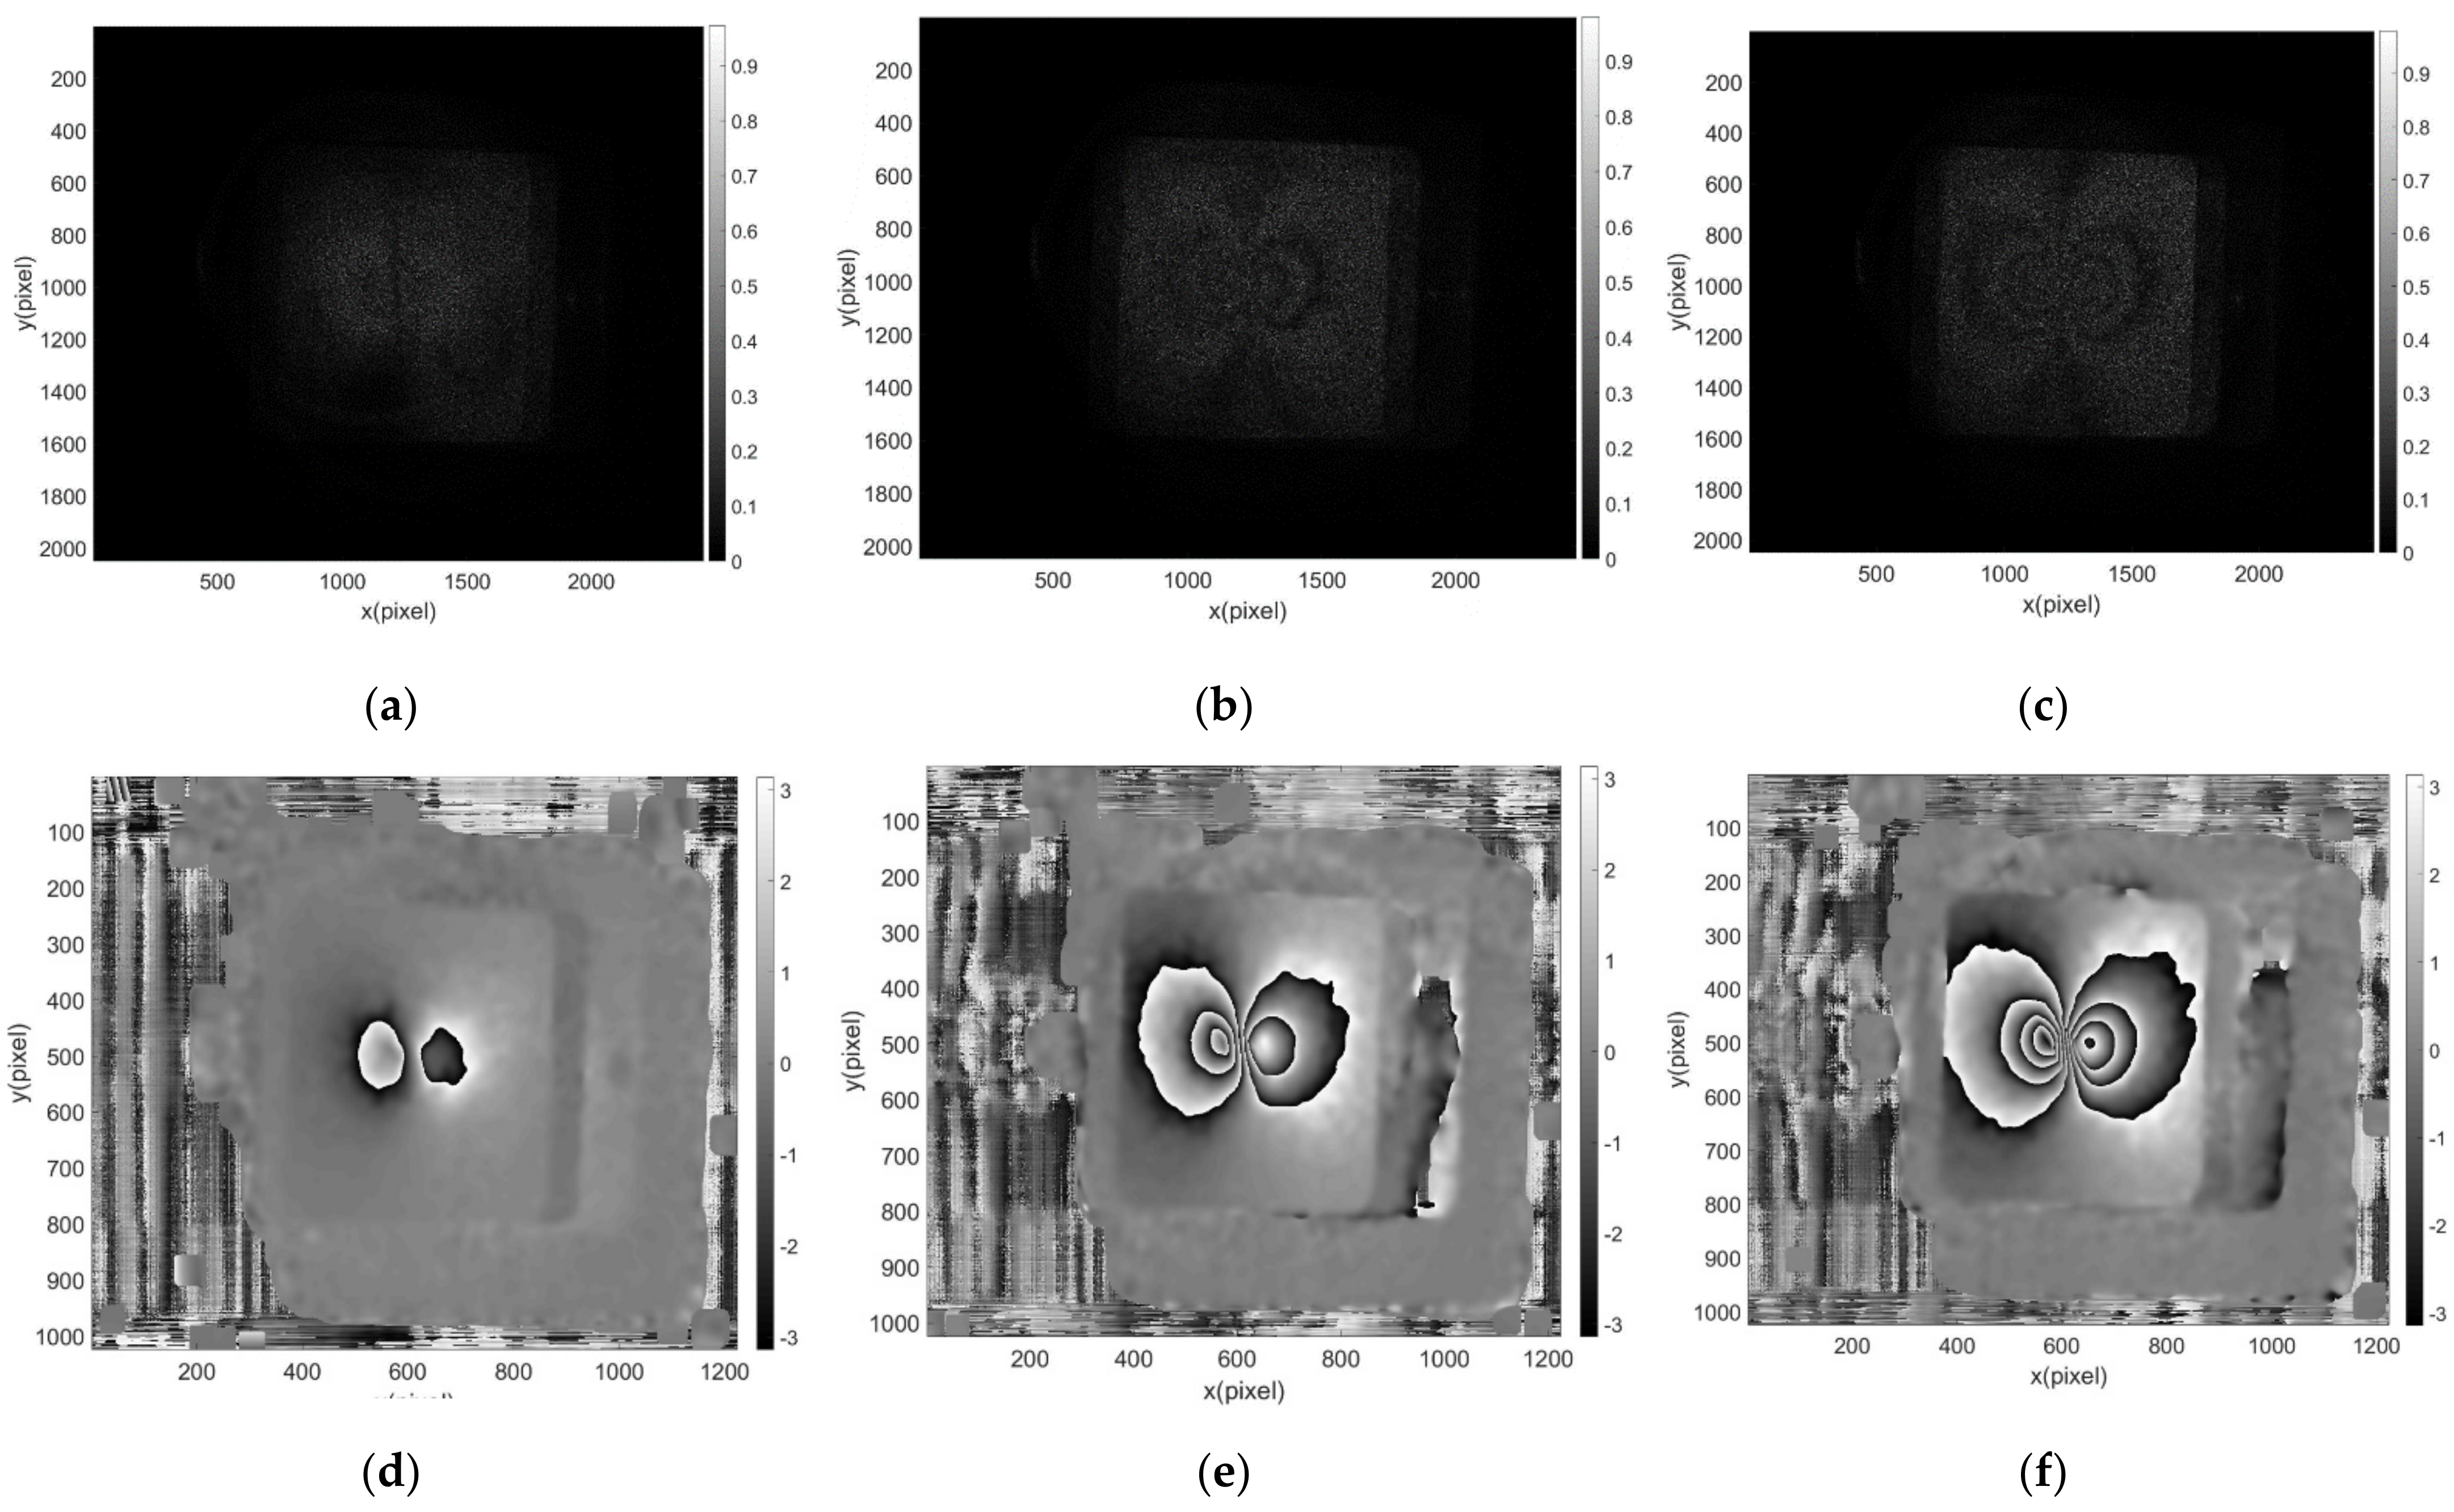
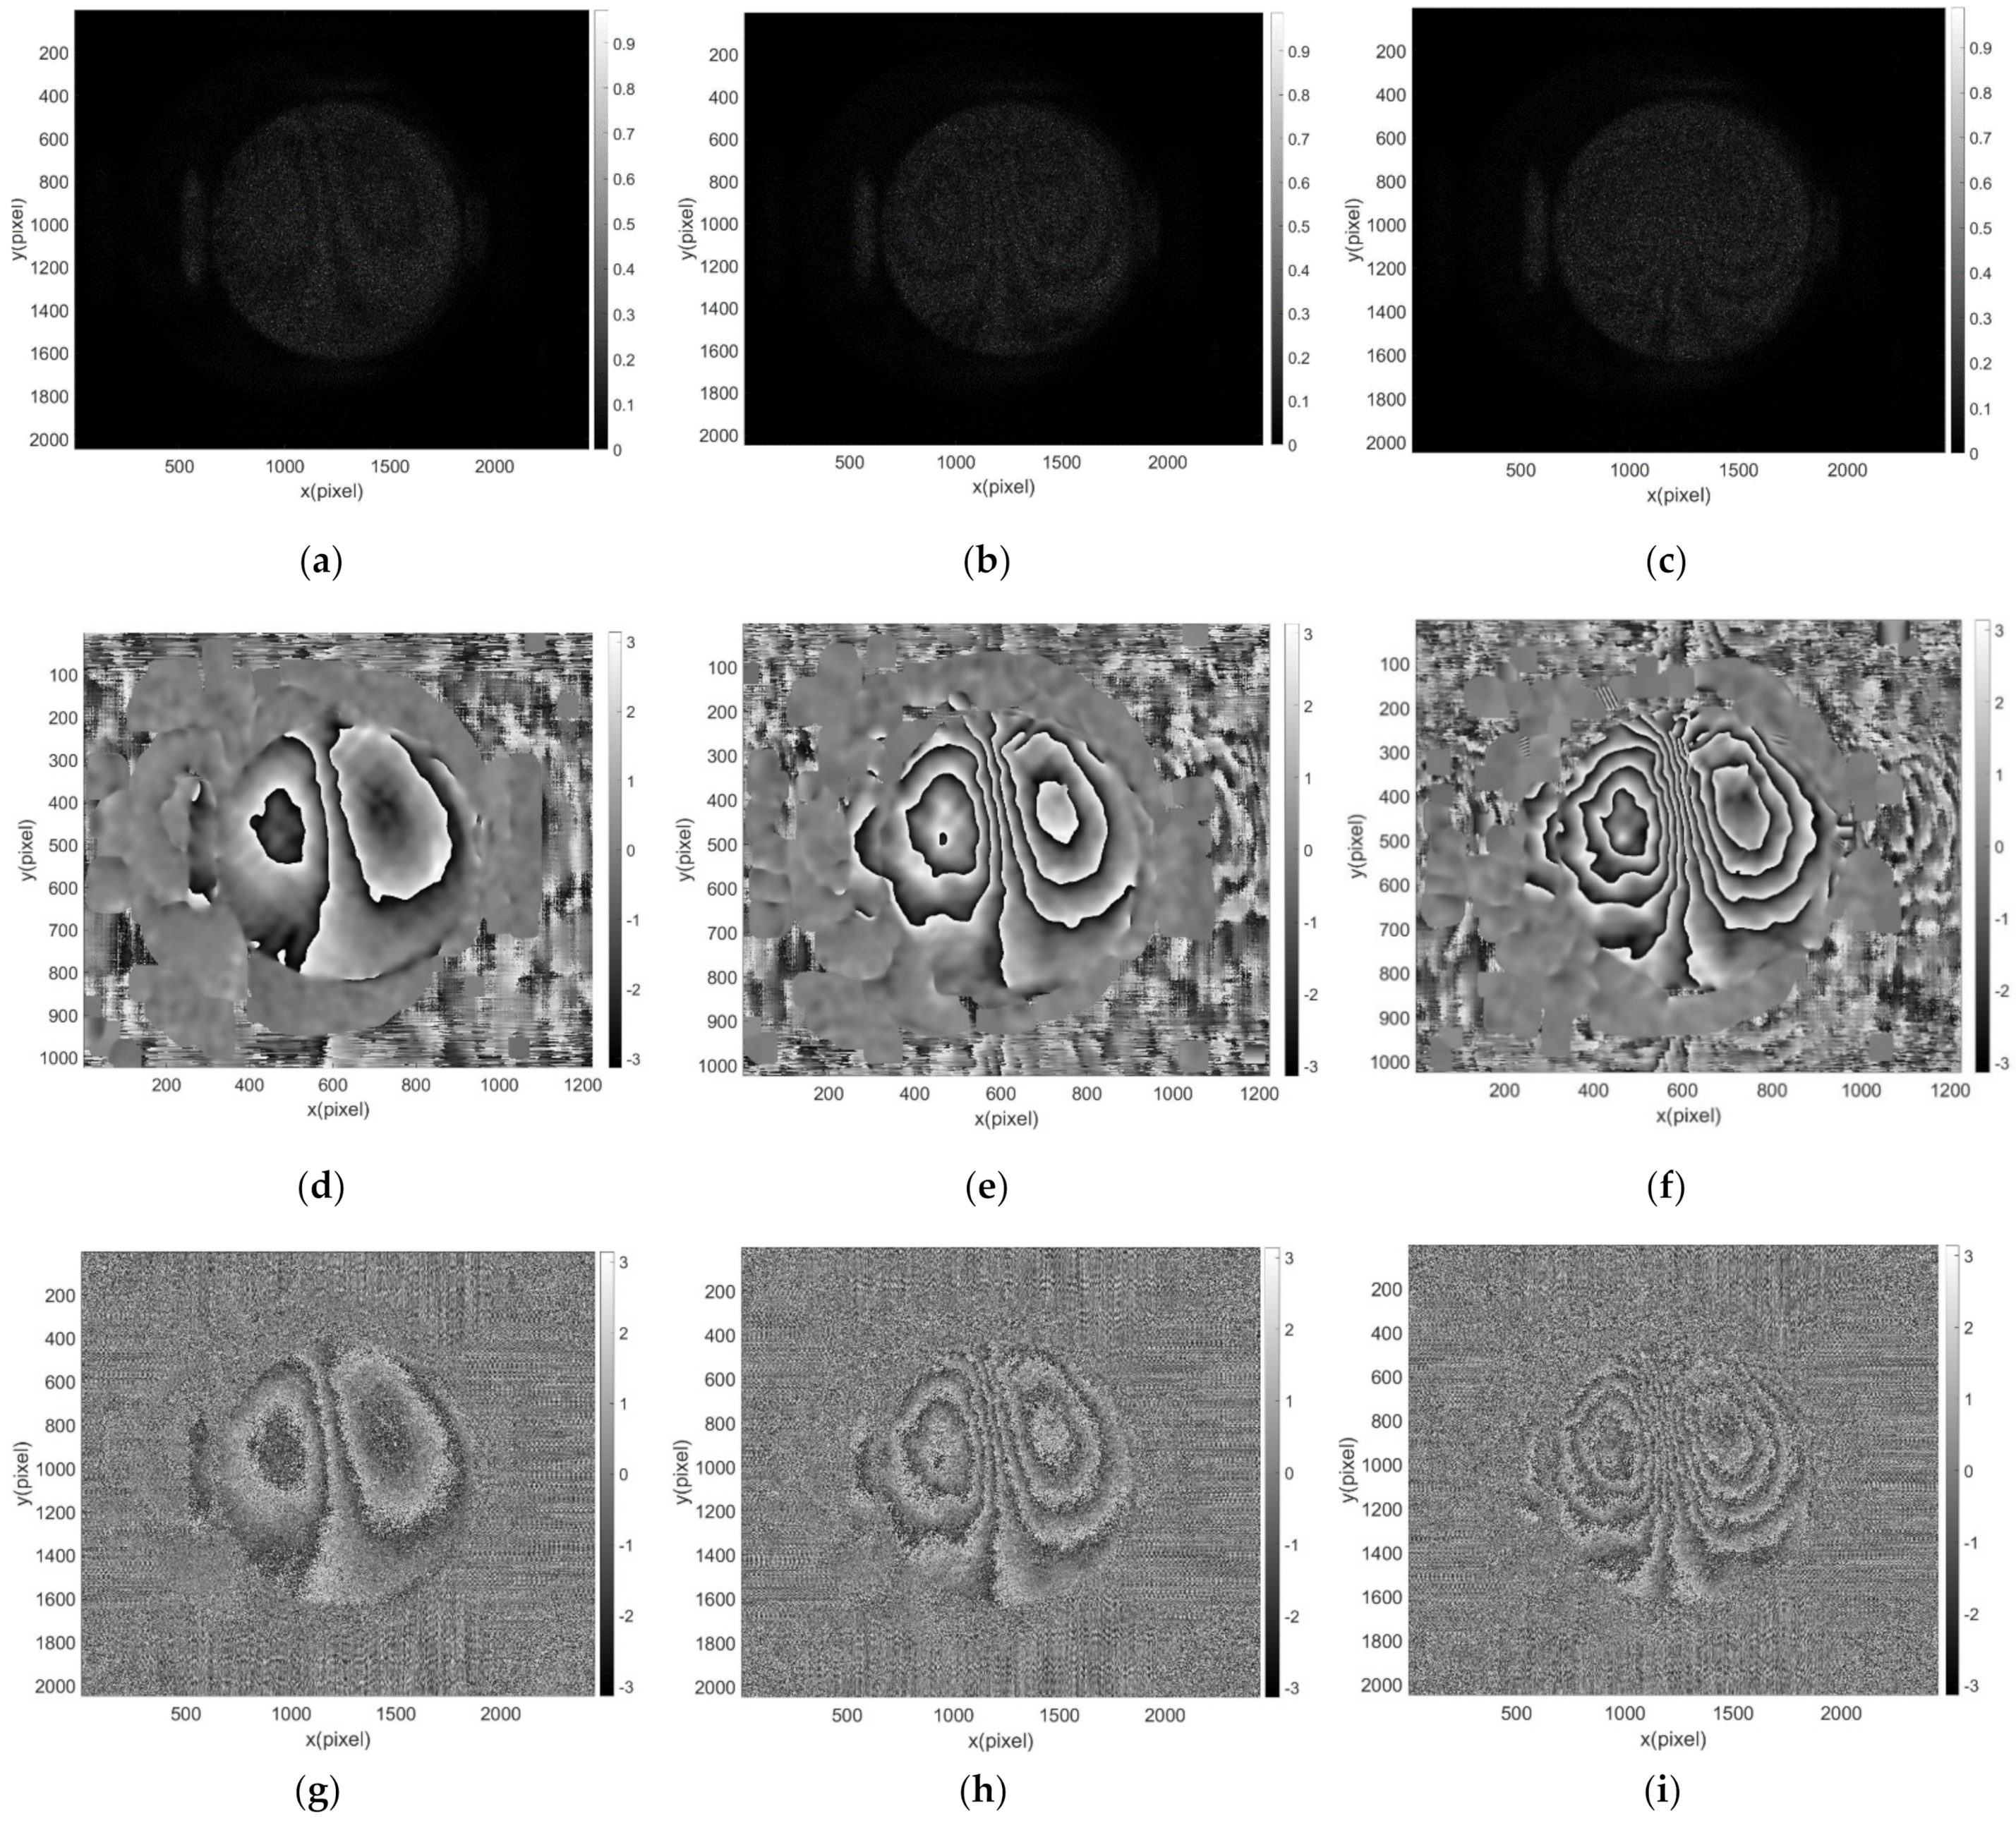
The status of phase change for defect 1 is shown through the images in Figure 10. Figure 10a–c show the interferometric fringe patterns in the cooling process after the heating gun’s heating of the sample. Figure 10d–f show the wrapped phase maps derived using the proposed method at three time instants. Figure 10g–i show the wrapped phase maps at those time instants without going through the WFF filter, which has a relatively high signal to noise ratio (SNR). A video sequence illustrating the phase change corresponding to Figure 10d–f can be viewed in Video S2.
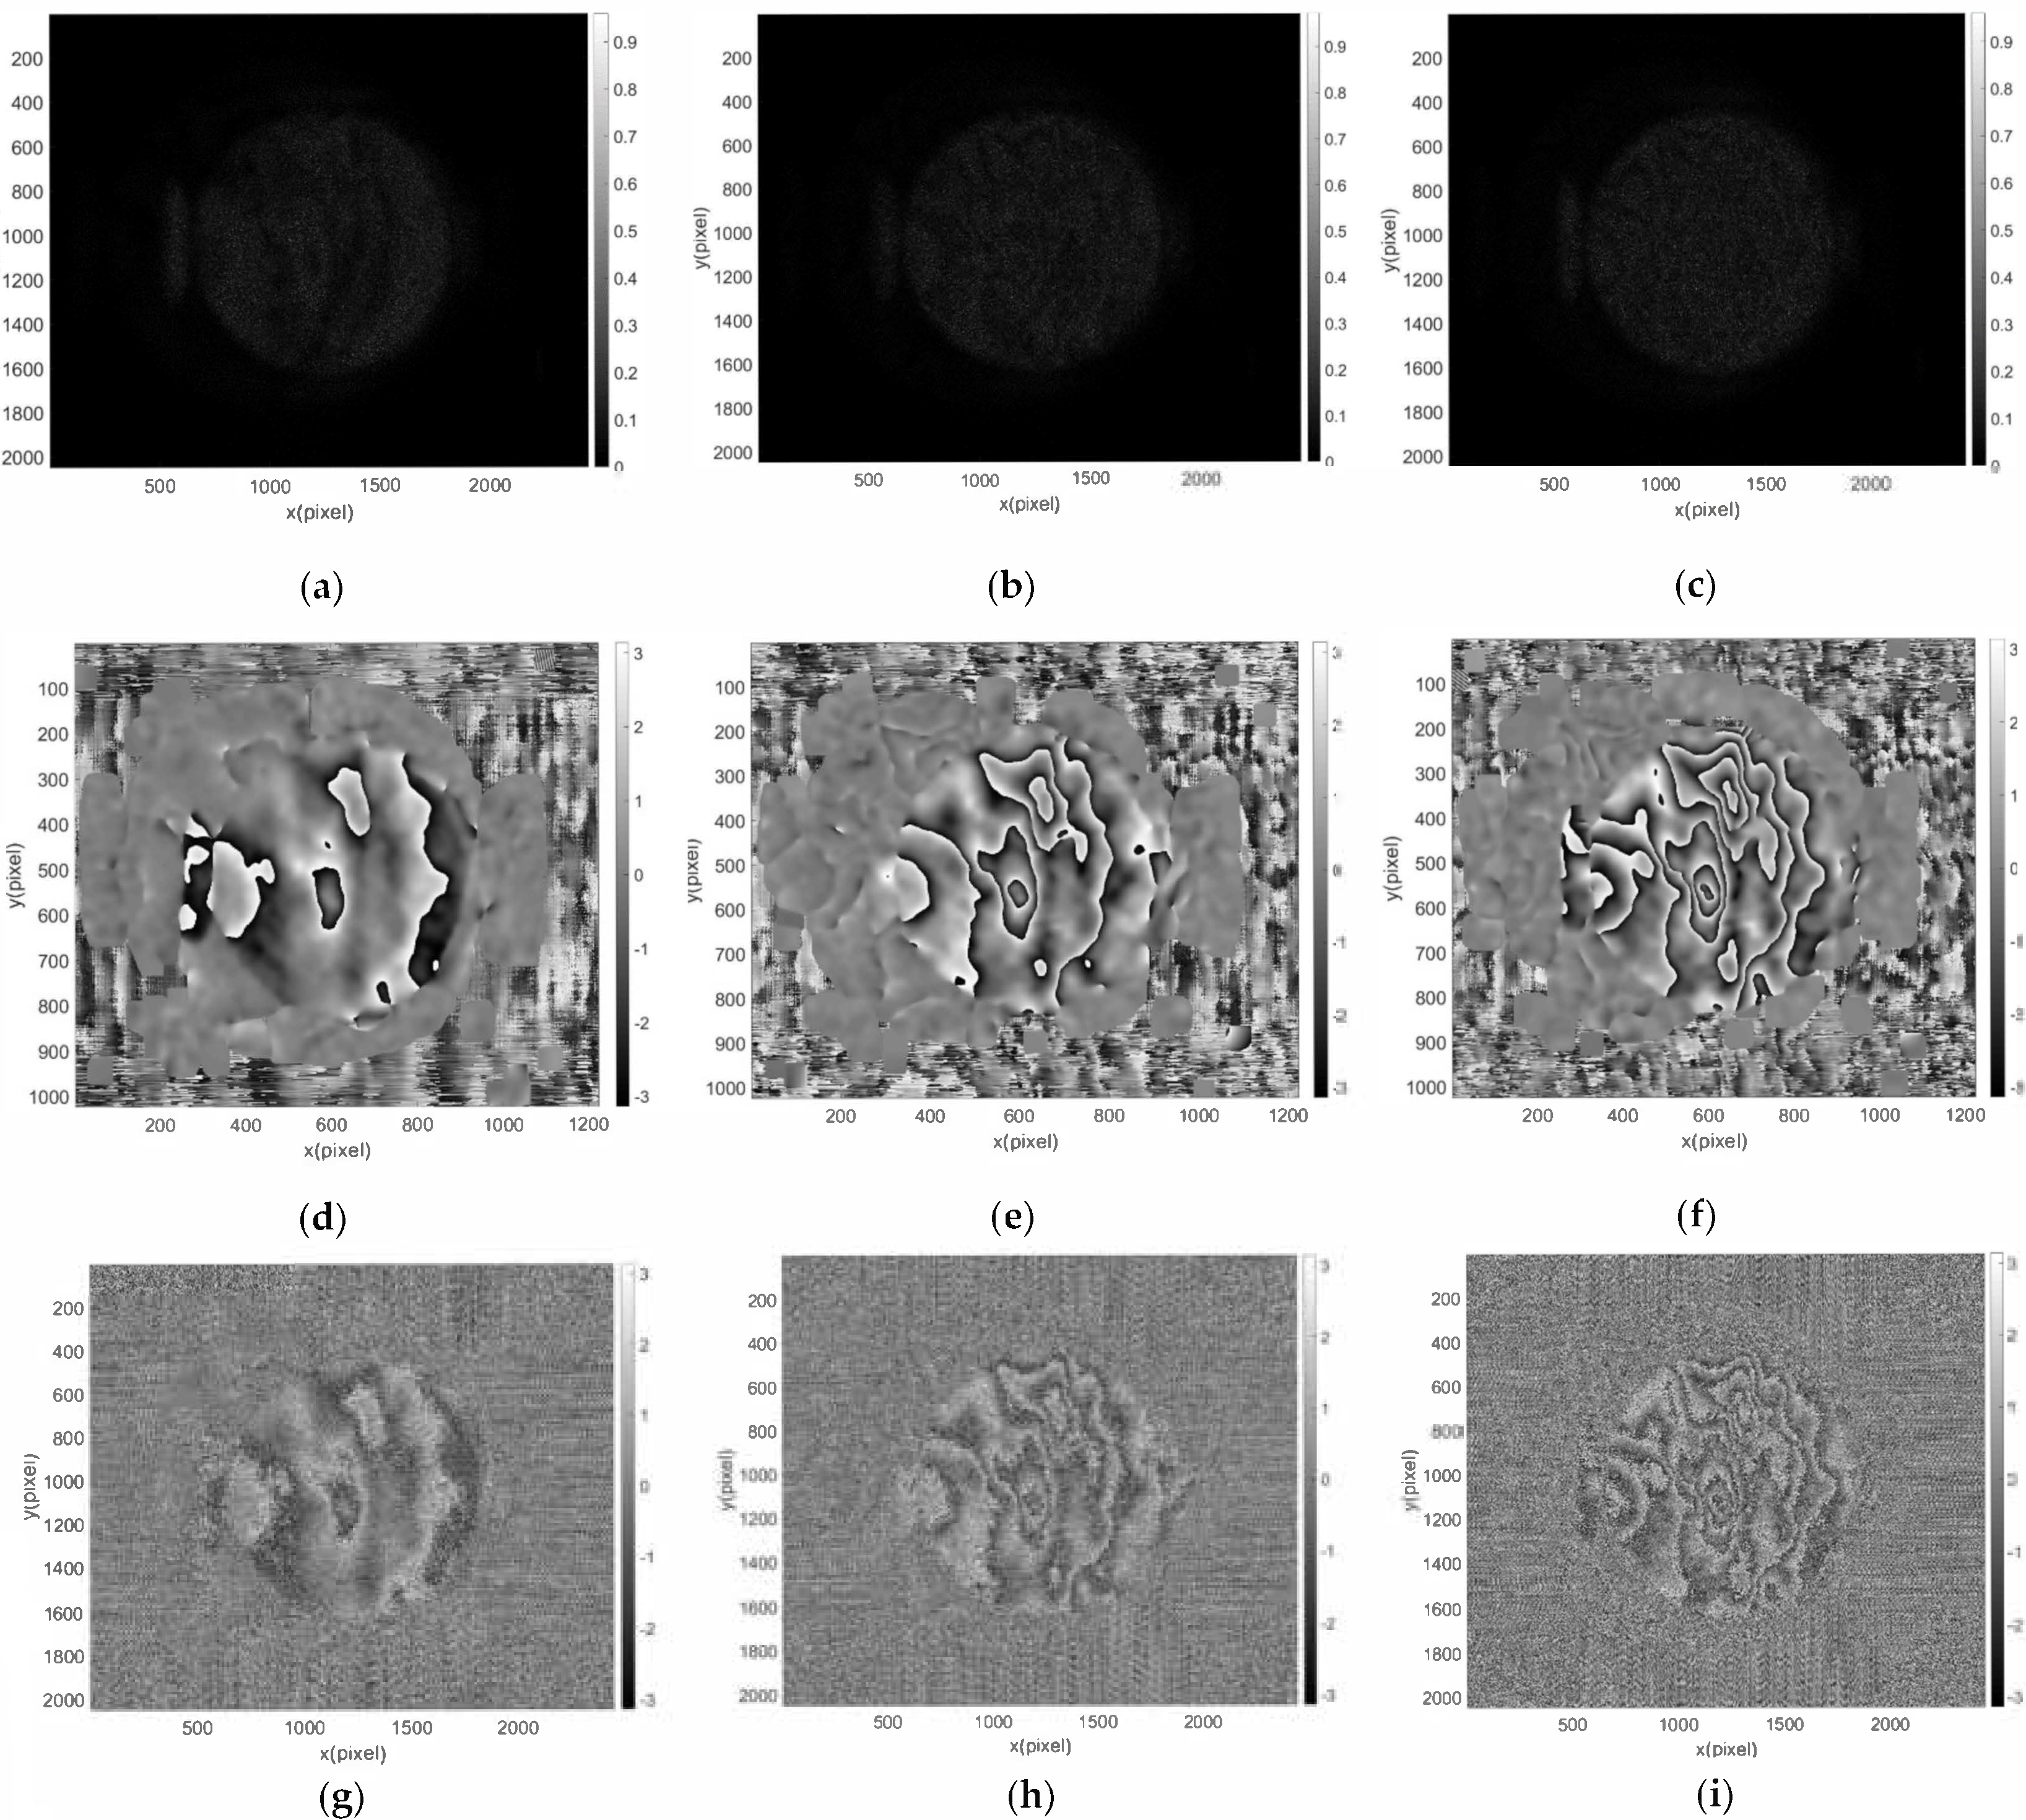
The inspection results for defect 2 are shown in Figure 11 in the same sequence as those for defect 1. Figure 11a–c show the interferometric fringe patterns at three time instants in the cooling process after the heating gun heated of the sample. Figure 11d–f show the wrapped phase maps derived using the proposed method at those time instants. Figure 11g–i show the wrapped phase maps at the same time points without going through the WFF filter. As known for this defect, the derived wrapped phase map is not as regularly shaped as defect 1 and the change of the phase map shape illustrates the defect’s properties. The video sequence for illustrating the phase status change can be viewed in Video S3.
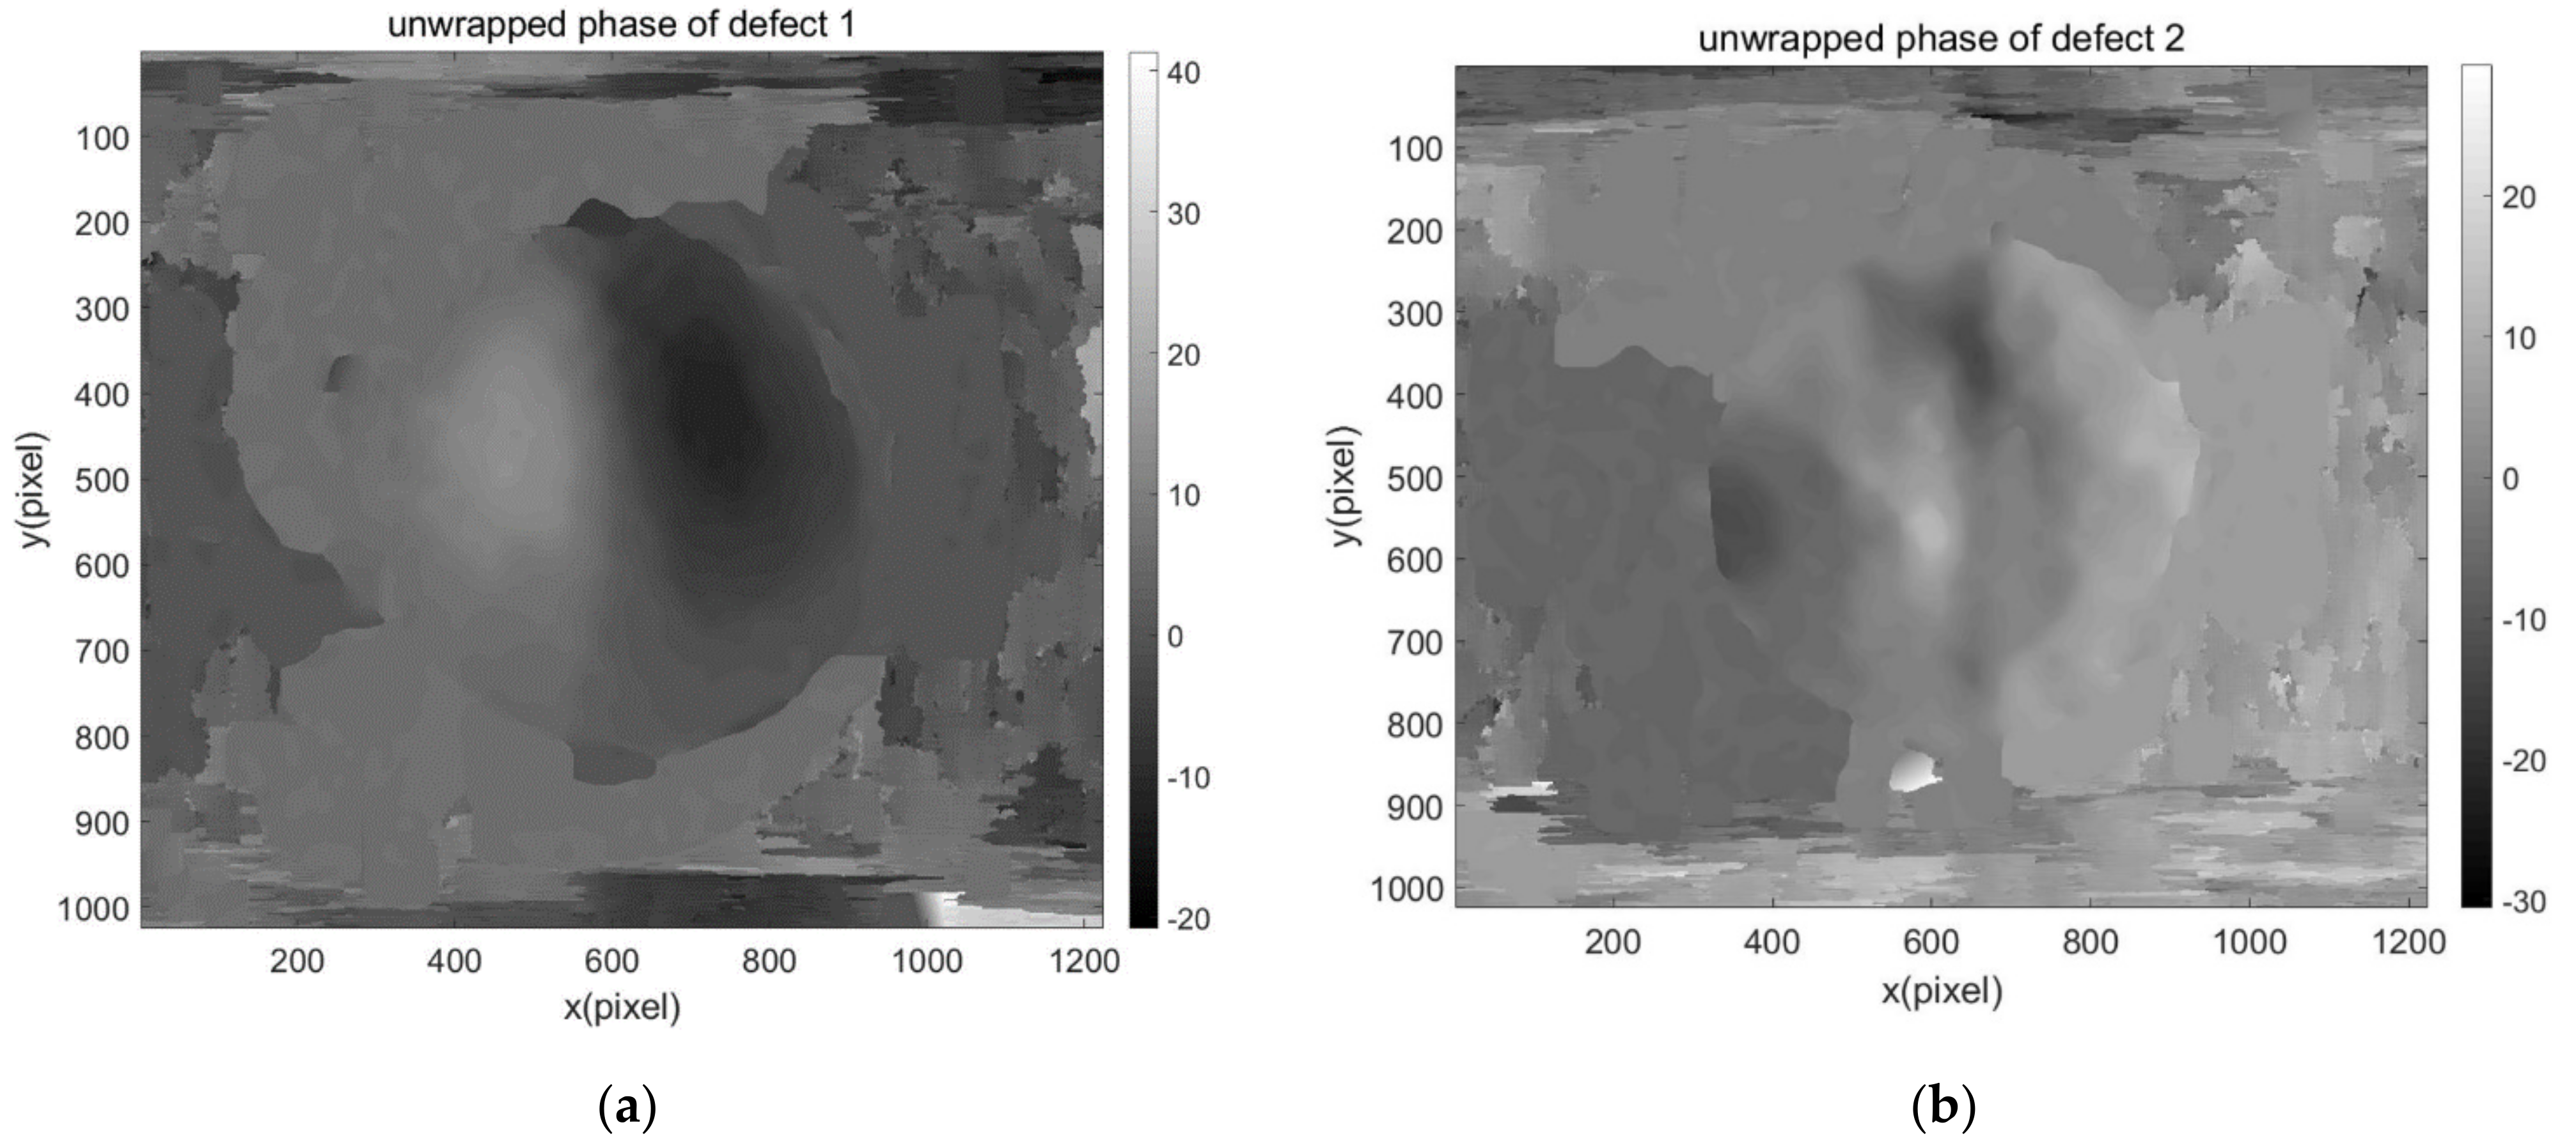
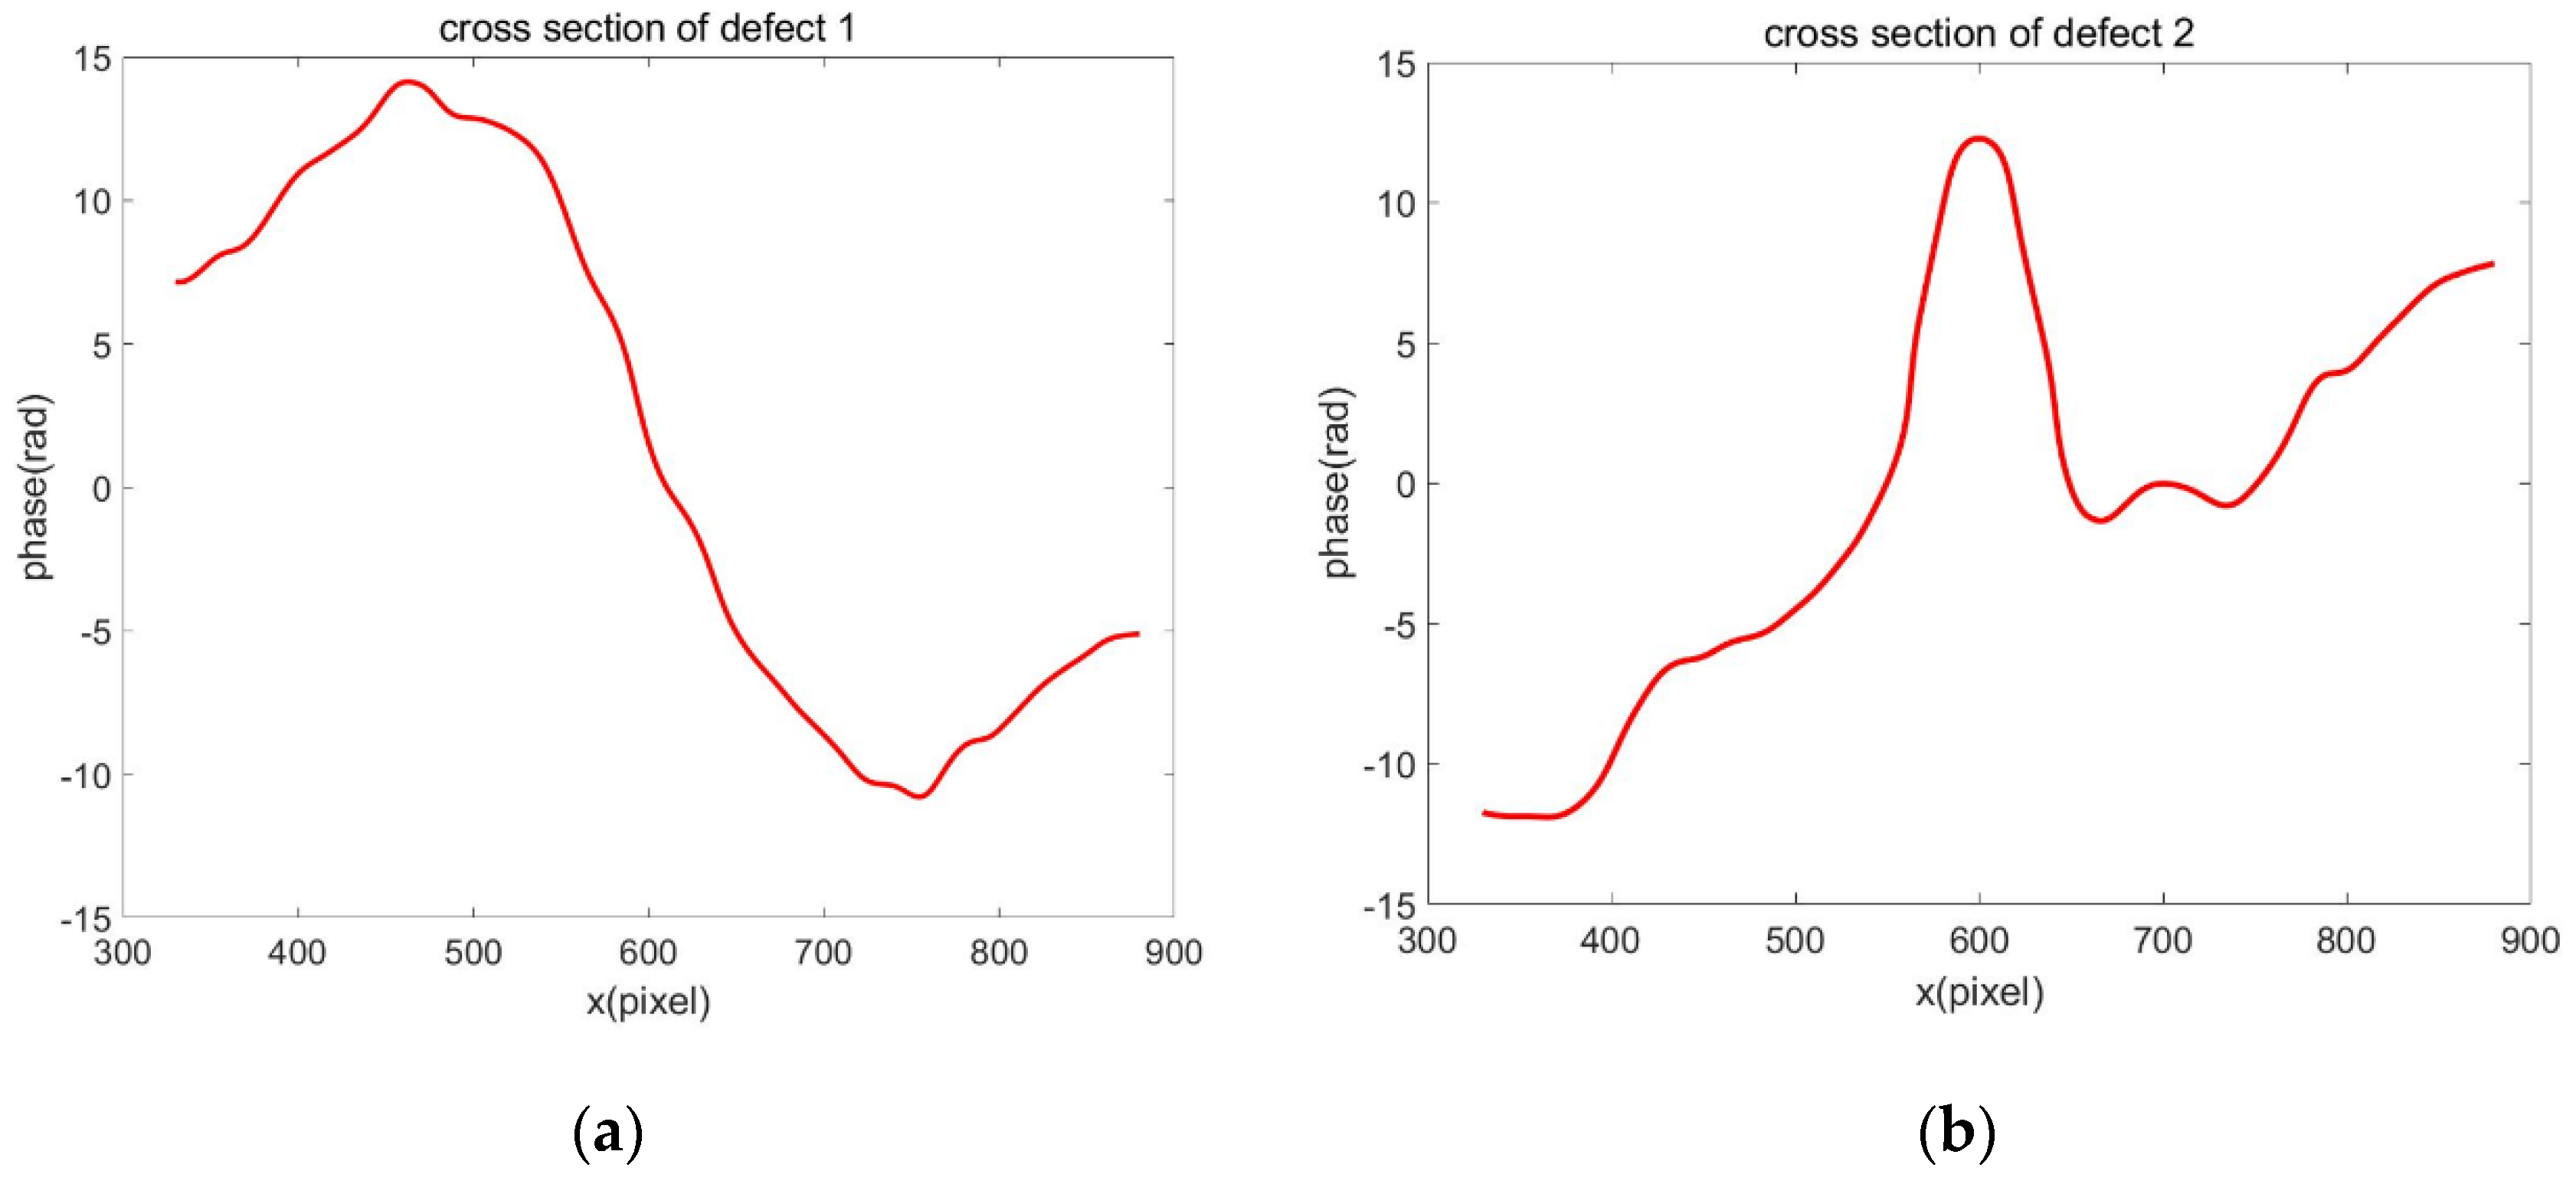
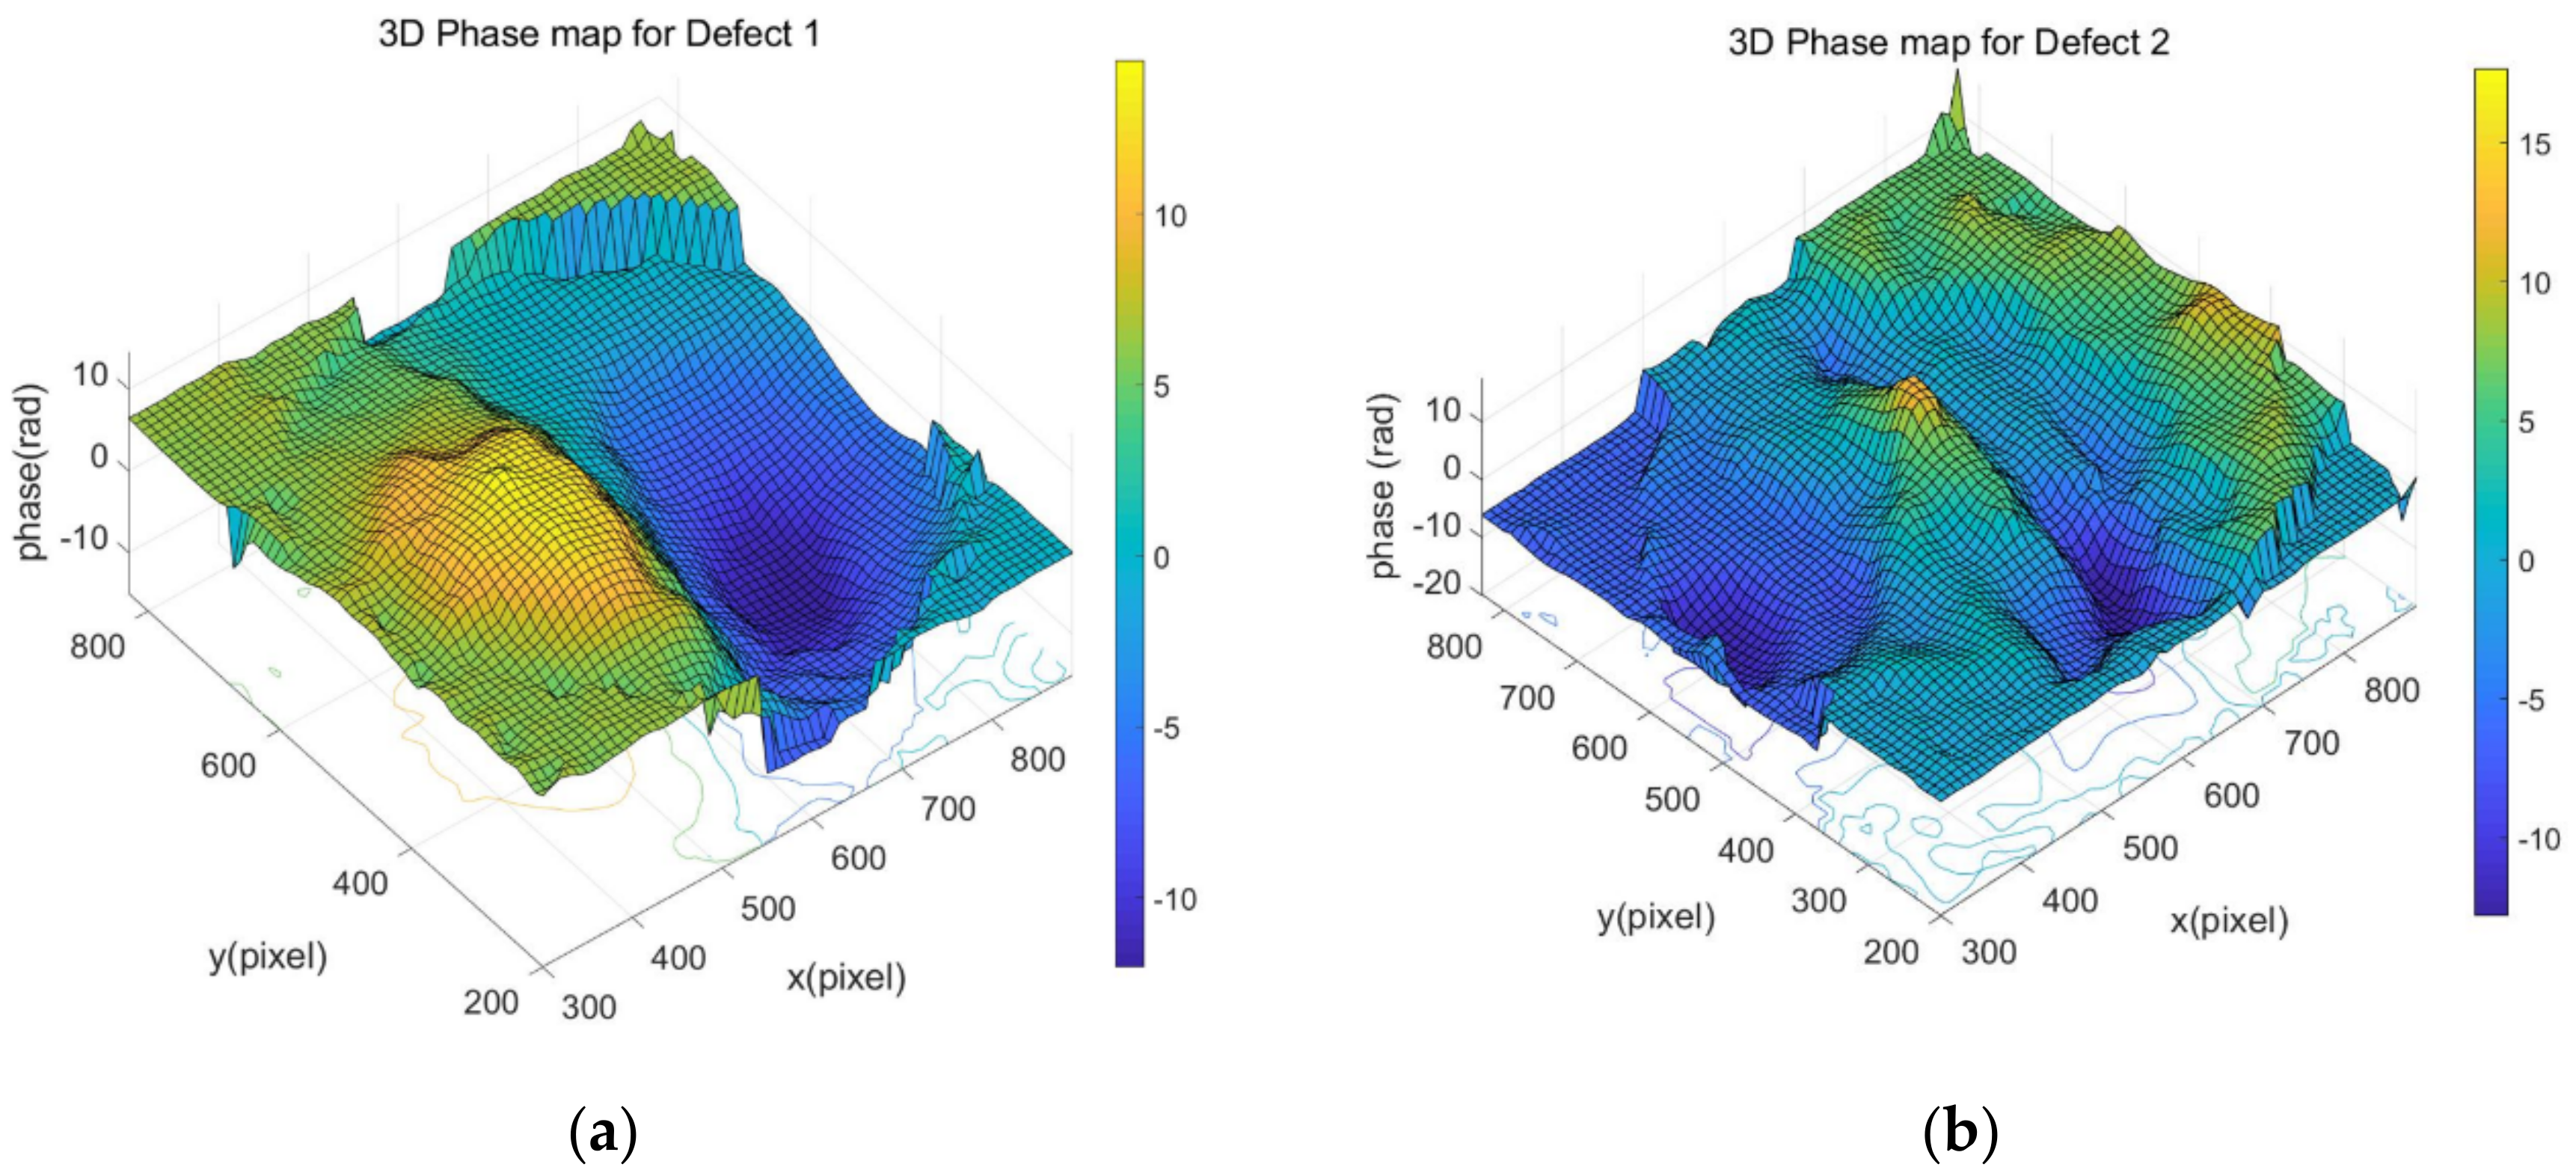
The derived wrapped phase map could also be unwrapped using ordinary phase unwrapping methods. The unwrapped phase maps for defect 1 and defect 2 are shown in Figure 12 the quality of which depends on that of the wrapped phase maps; as the SNR increases using the WFF filter, the unwrapping phase maps are without excessive noise. Figure 13 shows the cross-section profiles of defect 1 and defect 2, and this denotes the first derivative of displacement by shearography’s detection, and the smoothness of the line is attributed to the WFF filtering process. Correspondingly, the 3D phase maps in Figure 14 indicate intuitively the strains for the two defects.
4. Conclusions
The paper has presented a feasibility study of using a spatial phase-shift technique for inspection of an actual defected WTB in an NDE setting. A heating gun for the loading process has been utilised as it is easy and practical to apply with climbing machines in future developments, and that evenly application of force is difficult to automatically control remotely on-board a WTB. An algorithm of carrier mask modulation and window selection in 2D frequency domain has been proposed, along with the WFF algorithm for the purpose of filtering the derived phase map for accuracy and increased signal to noise ratio. The proposed approach has been validated through experimental investigations with a simple composite material and an actual WTB. It has also been compared with a typical TPS-DS three-step phase shifting system to verify that the derived phase map was of similar quality to temporal phase shift shearography. The results obtained have demonstrated the capability of the proposed approach in detecting the defects with good accuracy and deriving phase changing sequence dynamically. As limitations still remain on size of the inspection, future work will be conducted to enhance the field of view and integrate the system with an automatically controlled climbing robot for on-board inspection of WTBs.
Supplementary Materials
The following are available online at https://www.mdpi.com/article/10.3390/app112210700/s1, Video S1: Phase development for composite sample, Video S2: Phase development for WTB defect 1, Video S3: Phase development for WTB defect 2.
Author Contributions
Conceptualization, Z.L. and H.Z.; mythology and experimental validation, Z.L.; software analysis, Z.L. and H.Z.; data curation, Z.L.; writing—original draft preparation, Z.L.; writing—review and editing, M.O.T.; supervision, M.O.T. and Z.Z.; project administration, R.M.; All authors have read and agreed to the published version of the manuscript.
Funding
This work has received funding from the European Union’s Horizon 2020 research programme under grant agreement No. 780662.
Acknowledgments
This work was enabled through, and undertaken at, the National Structural Integrity Research Centre (NSIRC), a postgraduate engineering facility for industry-led research into structural integrity established and managed by TWI through a network of both national and international Universities.
Conflicts of Interest
The authors declare no conflict of interest.
References
- Gao, J. CORDIS|European Commission 31 May 2014. Available online: https://cordis.europa.eu/project/id/283533/reporting (accessed on 28 January 2021).
- London South Bank University. LSBU Researchers Are Developing Robots to Inspect wind Turbines. 21 May 2019. Available online: http://lsbu.staging.squizedge.net/stories/robots-inspect-wind-turbines (accessed on 28 January 2021).
- Zhao, Q.; Dan, X.; Sun, F.; Wang, Y.; Wu, S.; Yang, L. Digital Shearography for NDT: Phase Measurement Technique and Recent Developments. Appl. Sci. 2018, 8, 2662. [Google Scholar] [CrossRef] [Green Version]
- Carré, P. Installation et utilisation du comparateur photoélectrique et interférentiel du Bureau International des Poids et Mesures. Metrologia 1966, 2, 13–23. [Google Scholar] [CrossRef]
- Bruning, J.H.; Herriott, D.R.; Gallagher, J.E.; Rosenfeld, D.P.; White, A.D.; Brangaccio, D.J. Digital Wavefront Measuring Interferometer for Testing Optical Surfaces and Lenses. Appl. Opt. 1974, 13, 2693–2703. [Google Scholar] [CrossRef]
- Creath, K. Phase-shifting speckle interferometry. Appl. Opt. 1985, 24, 3053–3058. [Google Scholar] [CrossRef] [PubMed]
- Carlsson, T.E.; Wei, A. Phase evaluation of speckle patterns during continuous deformation by use of phase-shifting speckle interferometry. Appl. Opt. 2000, 39, 2628–2637. [Google Scholar] [CrossRef] [PubMed]
- Huang, Y.H.; Ng, S.P.; Liu, L.; Chen, Y.S.; Hung, M.Y.Y. Shearographic phase retrieval using one single specklegram: A clustering approach. Opt. Eng. 2008, 47, 054301. [Google Scholar] [CrossRef]
- Kreis, T.M.; Jueptner, W.P.O. Fourier transform evaluation of interference patterns: Demodulation and sign ambiguity. In Laser Interferometry IV: Computer-Aided Interferometry; SPIE: Paris, France, 1992. [Google Scholar] [CrossRef]
- Vargas, J.; Quiroga, J.A.; Belenguer, T. Phase-shifting interferometry based on principal component analysis. Opt. Lett. 2011, 36, 1326–1328. [Google Scholar] [CrossRef] [Green Version]
- Vargas, J.; Quiroga, J.A.; Sorzano, C.O.S.; Estrada, J.C.; Carazo, J.M. Two-step demodulation based on the Gram-Schmidt orthonormalization method. Opt. Lett. 2012, 37, 443–445. [Google Scholar] [CrossRef]
- Vargas, J.; Sorzano, C.O.S. Quadrature Component Analysis for interferometry. Opt. Lasers Eng. 2013, 51, 637–641. [Google Scholar] [CrossRef]
- Van Haasteren, A.J.P.; Frankena, H.J. Real-time displacement measurement using a multicamera phase-stepping speckle interferometer. Appl. Opt. 1994, 33, 4137–4142. [Google Scholar] [CrossRef]
- Xie, X.; Yang, L.; Xu, N.; Chen, X. Michelson interferometer based spatial phase shift shearography. Appl. Opt. 2013, 52, 4063–4071. [Google Scholar] [CrossRef]
- Millerd, J.E.; Brock, N.J.; Hayes, J.B.; North-Morris, M.B.; Novak, M.; Wyant, J.C. Pixelated phase-mask dynamic interferometer. In Interferometry XII: Techniques and Analysis; Springer: Berlin/Heidelberg, Germany, 2004. [Google Scholar] [CrossRef]
- Serrano-Garcia, D.I.; Otani, Y. Dynamic phase measurements based on a polarization Michelson interferometer employing a pixelated polarization camera. Adv. Opt. Technol. 2017, 6, 47–51. [Google Scholar] [CrossRef]
- Aranchuk, V.; Lal, A.; Hess, C.F.; Trolinger, J.D. Pulsed spatial phase-shifting digital shearography based on a micropolarizer camera. Opt. Eng. 2018, 57, 024109. [Google Scholar] [CrossRef]
- Trillo, C.; Doval, Á.F.; Mendoza-Santoyo, F.; Pérez-López, C.; Ibarra, M.H.D.L.T.; Deán, J.L. Multimode vibration analysis with high-speed TV holography and a spatiotemporal 3D Fourier transform method. Opt. Express 2009, 17, 18014–18025. [Google Scholar] [CrossRef] [PubMed] [Green Version]
- Ri, S.; Wang, Q.; Xia, P.; Tsuda, H. Spatiotemporal phase-shifting method for accurate phase analysis of fringe pattern. J. Opt. 2019, 21, 095702. [Google Scholar] [CrossRef]
- Yan, P.; Liu, X.; Wu, S.; Sun, F.; Zhao, Q.; Wang, Y. Pixelated Carrier Phase-Shifting Shearography Using Spatiotemporal Low-Pass Filtering Algorithm. Sensors 2019, 19, 5185. [Google Scholar] [CrossRef] [Green Version]
- Servin, M.; Estrada, J.C. Error-free demodulation of pixelated carrier frequency interferograms. Opt. Express 2010, 18, 18492–18497. [Google Scholar] [CrossRef]
- Sony Semiconductor Solutions Group. Products|Image Sensor: Polarization Image Sensor|Products|Sony Semiconductor Solutions Group. 2019. Available online: https://www.sony-semicon.co.jp/e/products/IS/industry/product/polarization.html (accessed on 15 March 2021).
- Kemao, Q. Windowed Fourier transform for fringe pattern analysis. Appl. Opt. 2004, 43, 2695–2702. [Google Scholar] [CrossRef]
- Kai, L.; Kemao, Q. Dynamic phase retrieval in temporal speckle pattern interferometry using least squares method and windowed Fourier filtering. Opt. Express 2011, 19, 18058–18066. [Google Scholar] [CrossRef]
- Kemao, Q. Two-dimensional windowed Fourier transform for fringe pattern analysis: Principles, applications and implementations. Opt. Lasers Eng. 2007, 45, 304–317. [Google Scholar] [CrossRef]
- Kemao, Q.; Wang, H.; Gao, W. Windowed Fourier transform for fringe pattern analysis: Theoretical analyses. Appl. Opt. 2008, 47, 5408–5419. [Google Scholar] [CrossRef] [PubMed]
Figure 1.
Pixelated spatial phase shift shearography system setup for dynamic WTB inspection.

Figure 2.
Illustration of the polarisation directions for the micro-polarisation image sensor applied and the corresponding phase shift.
Figure 2.
Illustration of the polarisation directions for the micro-polarisation image sensor applied and the corresponding phase shift.

Figure 3.
Flow chart of the proposed method.

Figure 4.
(a) Sample composite surface; (b) A continuous force used as the loading method exerted on the composite sample.
Figure 4.
(a) Sample composite surface; (b) A continuous force used as the loading method exerted on the composite sample.

Figure 5.
(a) Setup of conventional TPS-DS system with three-step phase shift; (b) Wrapped phase map retrieved by TPS-DS system.
Figure 5.
(a) Setup of conventional TPS-DS system with three-step phase shift; (b) Wrapped phase map retrieved by TPS-DS system.

Figure 6.
Frequency domain of a modulated shearogram and the window for selecting the lower frequency.
Figure 6.
Frequency domain of a modulated shearogram and the window for selecting the lower frequency.

Figure 7.
(a–c) Development of fringe patterns at time points 10th, 40th, and 70th frame in SPS-DS system; (d–f) Retrieved wrapped phase map at time points 10th (), 40th (), and 70th () frame in SPS-DS system.
Figure 7.
(a–c) Development of fringe patterns at time points 10th, 40th, and 70th frame in SPS-DS system; (d–f) Retrieved wrapped phase map at time points 10th (), 40th (), and 70th () frame in SPS-DS system.

Figure 8.
(a) WTB sample for inspection and the delamination defects at subsurface circled in red; (b) Heat gun for loading the blade surface.
Figure 8.
(a) WTB sample for inspection and the delamination defects at subsurface circled in red; (b) Heat gun for loading the blade surface.

Figure 9.
Temperature measurement for the inspected surface during the cooling process.

Figure 10.
Results derived at three time instants for defect 1 on the WTB; (a–c) Fringe patterns at time instants of 65th frame, 130th frame, and 200th frame; (d–f) Phase maps derived with the proposed method at time instants of 65th frame (), 130th frame (), and 200th frame (); (g–i) Phase maps without passing through WFF filter at time instants of 65th frame (), 130th frame (), and 200th frame ().

Figure 11.
Results derived at three time instants for defect 2 on WTB; (a–c) Fringe patterns corresponding to the time instants of 65th frame, 130th frame, and 200th frame; (d–f) Phase maps derived with the proposed method at the instants of 65th frame (), 130th frame (), and 200th frame (); (g–i) Phase maps derived without going through WFF filter at time instants of 65th frame (), 130th frame (), and 200th frame ().

Figure 12.
Unwrapped phase maps at (a) defect 1 and (b) defect 2.

Figure 13.
Cross-section profiles; (a) defect 1 (b) defect 2.

Figure 14.
3D phase maps for (a) defect 1 and (b) defect 2.

Publisher’s Note: MDPI stays neutral with regard to jurisdictional claims in published maps and institutional affiliations. |
© 2021 by the authors. Licensee MDPI, Basel, Switzerland. This article is an open access article distributed under the terms and conditions of the Creative Commons Attribution (CC BY) license (https://creativecommons.org/licenses/by/4.0/).
Share and Cite
MDPI and ACS Style
Li, Z.; Tokhi, M.O.; Marks, R.; Zheng, H.; Zhao, Z. Dynamic Wind Turbine Blade Inspection Using Micro-Polarisation Spatial Phase Shift Digital Shearography. Appl. Sci. 2021, 11, 10700. https://doi.org/10.3390/app112210700
AMA Style
Li Z, Tokhi MO, Marks R, Zheng H, Zhao Z. Dynamic Wind Turbine Blade Inspection Using Micro-Polarisation Spatial Phase Shift Digital Shearography. Applied Sciences. 2021; 11(22):10700. https://doi.org/10.3390/app112210700
Chicago/Turabian StyleLi, Zhiyao, Mohammad Osman Tokhi, Ryan Marks, Haitao Zheng, and Zhanfang Zhao. 2021. "Dynamic Wind Turbine Blade Inspection Using Micro-Polarisation Spatial Phase Shift Digital Shearography" Applied Sciences 11, no. 22: 10700. https://doi.org/10.3390/app112210700
Note that from the first issue of 2016, this journal uses article numbers instead of page numbers. See further details here.