Article

Starch Rich Chlorella vulgaris: High-Throughput Screening and Up-Scale for Tailored Biomass Production

1
Division of Biotechnology and Plant Health, Norwegian Institute of Bioeconomy Research (NIBIO), P.O. Box 115, NO-1431 Ås, Norway
2
Faculty of Chemistry, Biotechnology and Food Science, Norwegian University of Life Sciences (NMBU), P.O. Box 5003, 1432 Ås, Norway
3
Faculty of Science and Technology, Norwegian University of Life Sciences (NMBU), P.O. Box 5003, 1432 Ås, Norway
4
Bioprocess Engineering, AlgaePARC, Wageningen University, P.O. Box 16, 6700 AA Wageningen, The Netherlands
*
Author to whom correspondence should be addressed.
Appl. Sci. 2021, 11(19), 9025; https://doi.org/10.3390/app11199025
Submission received: 31 August 2021 / Revised: 23 September 2021 / Accepted: 24 September 2021 / Published: 28 September 2021
(This article belongs to the Special Issue Algae as a Nutritional and Bioactive Biomass)

Abstract

:
The use of microalgal starch has been studied in biorefinery frameworks to produce bioethanol or bioplastics, however, these products are currently not economically viable. Using starch-rich biomass as an ingredient in food applications is a novel way to create more value while expanding the product portfolio of the microalgal industry. Optimization of starch production in the food-approved species Chlorella vulgaris was the main objective of this study. High-throughput screening of biomass composition in response to multiple stressors was performed with FTIR spectroscopy. Nitrogen starvation was identified as an important factor for starch accumulation. Moreover, further studies were performed to assess the role of light distribution, investigating the role of photon supply rates in flat panel photobioreactors. Starch-rich biomass with up to 30% starch was achieved in cultures with low inoculation density (0.1 g L−1) and high irradiation (1800 µmol m−2 s−1). A final large-scale experiment was performed in 25 L tubular reactors, achieving a maximum of 44% starch in the biomass after 12 h in nitrogen starved conditions.

1. Introduction

Several microalgal species accumulate starch as a storage compound under sub-optimal environmental conditions and this property has made them extensively studied within the fields of biofuels, bioplastics and biorefining in general [1,2,3,4,5]. Microalgal biomass has the potential of being a sustainable substitute to fossil resources and research is consistently improving the feasibility and scalability of algal biorefining processes [6,7], from cultivation technologies to downstream processing. However, for a microalgal industry to thrive it is necessary to also target high-value compounds [8], and microalgal biotechnologists are starting just recently to valorise starch-rich biomass as a potential ingredient in the agri-food-tech sector, an important economical field that could make algal production economically viable [9] and thus implement a sustainable technology into novel industrial sectors.
Within the high-starch producers, Chlorella vulgaris is among the species enlisted in the novel foods catalogue by the European Food Safety Authority [10], it is approved for human consumption and is the most used species for food-related industrial production. The starch from C. vulgaris has an amylose-amylopectin ratio of 30–40%, which is similar to the ratio of potatoes and cereals and has similar crystallinity and thermal properties. However, the size of the starch granules in the algae is significantly smaller [11]. Algal starch performs well in digestibility tests if compared to commercial potato starch [12], and may represent an easily accessible source of glucose. Extracted starch could also be evaluated as a functional food for processes needing gelatinisation [9] or fermentation steps since algal starch extraction only requires boiling. Despite the fact that the exact costs for starch production from microalgae are not known we can assume that these are higher than potato starch based on the existing techno-economic studies performed for biomass [13] and lipids (TAG) [14]. However, the use of microalgal starch in foods has huge potential in terms of sustainability since algae production has higher ground areal productivities, high CO2 fixation rates and does not compete with crops for arable land and fresh water. There are also additional benefits related to the health-promoting properties of algal biomass as algae are rich in antioxidants and unsaturated lipids, even during starch accumulation [15].
Chlorella vulgaris is a well-studied microalgal species, reported to be an efficient starch producer. A variety of methods have been tested to induce starch accumulation and very diverse results, ranging from 20 to 60% starch in the dry weight, have been achieved. Nitrogen starvation has been extensively studied and reported to induce up to 55% starch in the biomass content [16,17] but is also renowned as a strong inhibitor factor for cell proliferation and biomass productivity [18,19]. Under sulphur starvation conditions Chlorella vulgaris was shown to accumulate up to 60% starch [18] with low short-term mortality, and thus better productivities [18,20,21]. The nutrient limitation has also been tested by diluting the whole medium, showing yet again high starch accumulation and low mortality rates [22].
While the modulation of nutrients is the most acknowledged trigger for metabolic switches, light availability also plays an essential role in the shift to starch accumulation within the cell. The biomass specific photon supply rate (BSPSR) is a parameter that allows the quantifying and standardisation of the light received from cultures in different setups, based on the surface irradiance, the depth and the density of the culture. Though it is not frequently reported in the literature, BSPSR has shown a strong effect on the accumulation of storage compounds for several species [23,24]. Thus, it can be inferred from the literature that high starch accumulation was frequently achieved in Chlorella species at low irradiance and low inoculum concentration [18,25,26], whereas the lowest reported starch contents have been reported either at a lower light irradiance or at high inoculum density or in the presence of wider light paths.
Considering the variety of parameters that may influence the accumulation of starch in Chlorella vulgaris, our investigations began with a high-throughput screening performed in a traditional shake flask system combined with a high-throughput Fourier Transform Infrared (FTIR) spectroscopy, to test different nutrient and light conditions. FTIR spectroscopy is a biophysical technique that allows the profiling of the main cellular components—lipids, proteins, polysaccharides, polyphosphates, pigments—in a rapid and high-throughput manner. The analysis of cell chemistry by FTIR is done on the intact cells and does not require tedious extraction of cell components, therefore, it has been positioned as a next-generation phenotyping technique suitable for extensive screenings in biotechnology [27,28,29] Recently, the technique was utilised for screening oleaginous yeast [30,31,32,33,34,35,36,37,38], filamentous fungi [39,40,41] and microalgae [42,43,44,45].
In this study, FTIR spectroscopy was used to map the chemical changes in the biomass of Chlorella vulgaris under multiple nutrient and light stress conditions using a factorial design on 12 different treatment combinations. Based on this, optimal parameters for starch production were selected and scaled to 1.5 L flat panel photobioreactors, to assess the effect of light distribution and BSPSR. Finally, the best conditions were translated to a 25 L tubular reactor, to evaluate the scalability and productivity of starch.

2. Materials and Methods

2.1. Algal Cultures

Chlorella vulgaris strain SAG 211-11b obtained from SAG Culture Collection of Algae (Göttingen, Germany) was maintained on agar plates on TAP medium [46] at a 20 µmol m−2 s−1 irradiance and 22 °C temperature. Prior to inoculation, the algae were scaled up in Erlenmeyer flasks or screw cap bottles, both supplied with 1% CO2: air mixture (v/v) on a shaking table, at 50–100 µmol m−2 s−1, 22 °C, at 110 rpm. The growth medium was M8a mineral medium, a version of the M8 medium developed by Mandalam and colleagues [47] based on Chlorella vulgaris elemental balancing, further modified by Kliphuis et al. [48].
For starvation experiments, the M8a medium was modified by removing either the nitrate, phosphorous or sulphur sources. To compensate the molarities of the other compounds in the salts, KNO3 was substituted by KCl, and MgSO4·7H2O, CuSO4·5H2O and ZnSO4·7H2O were respectively substituted with MgCl2·6H2O, ZnCl2 and CuCl·2H2O. In the experiments involving the removal of multiple macronutrients, the absence of a buffer in the P-deprived cultures was compensated by adding 3 g L−1 NaHCO3 to all the cultures of the experiment. In all mediums, the initial pH was set to 7.5 with NaOH and HCl.

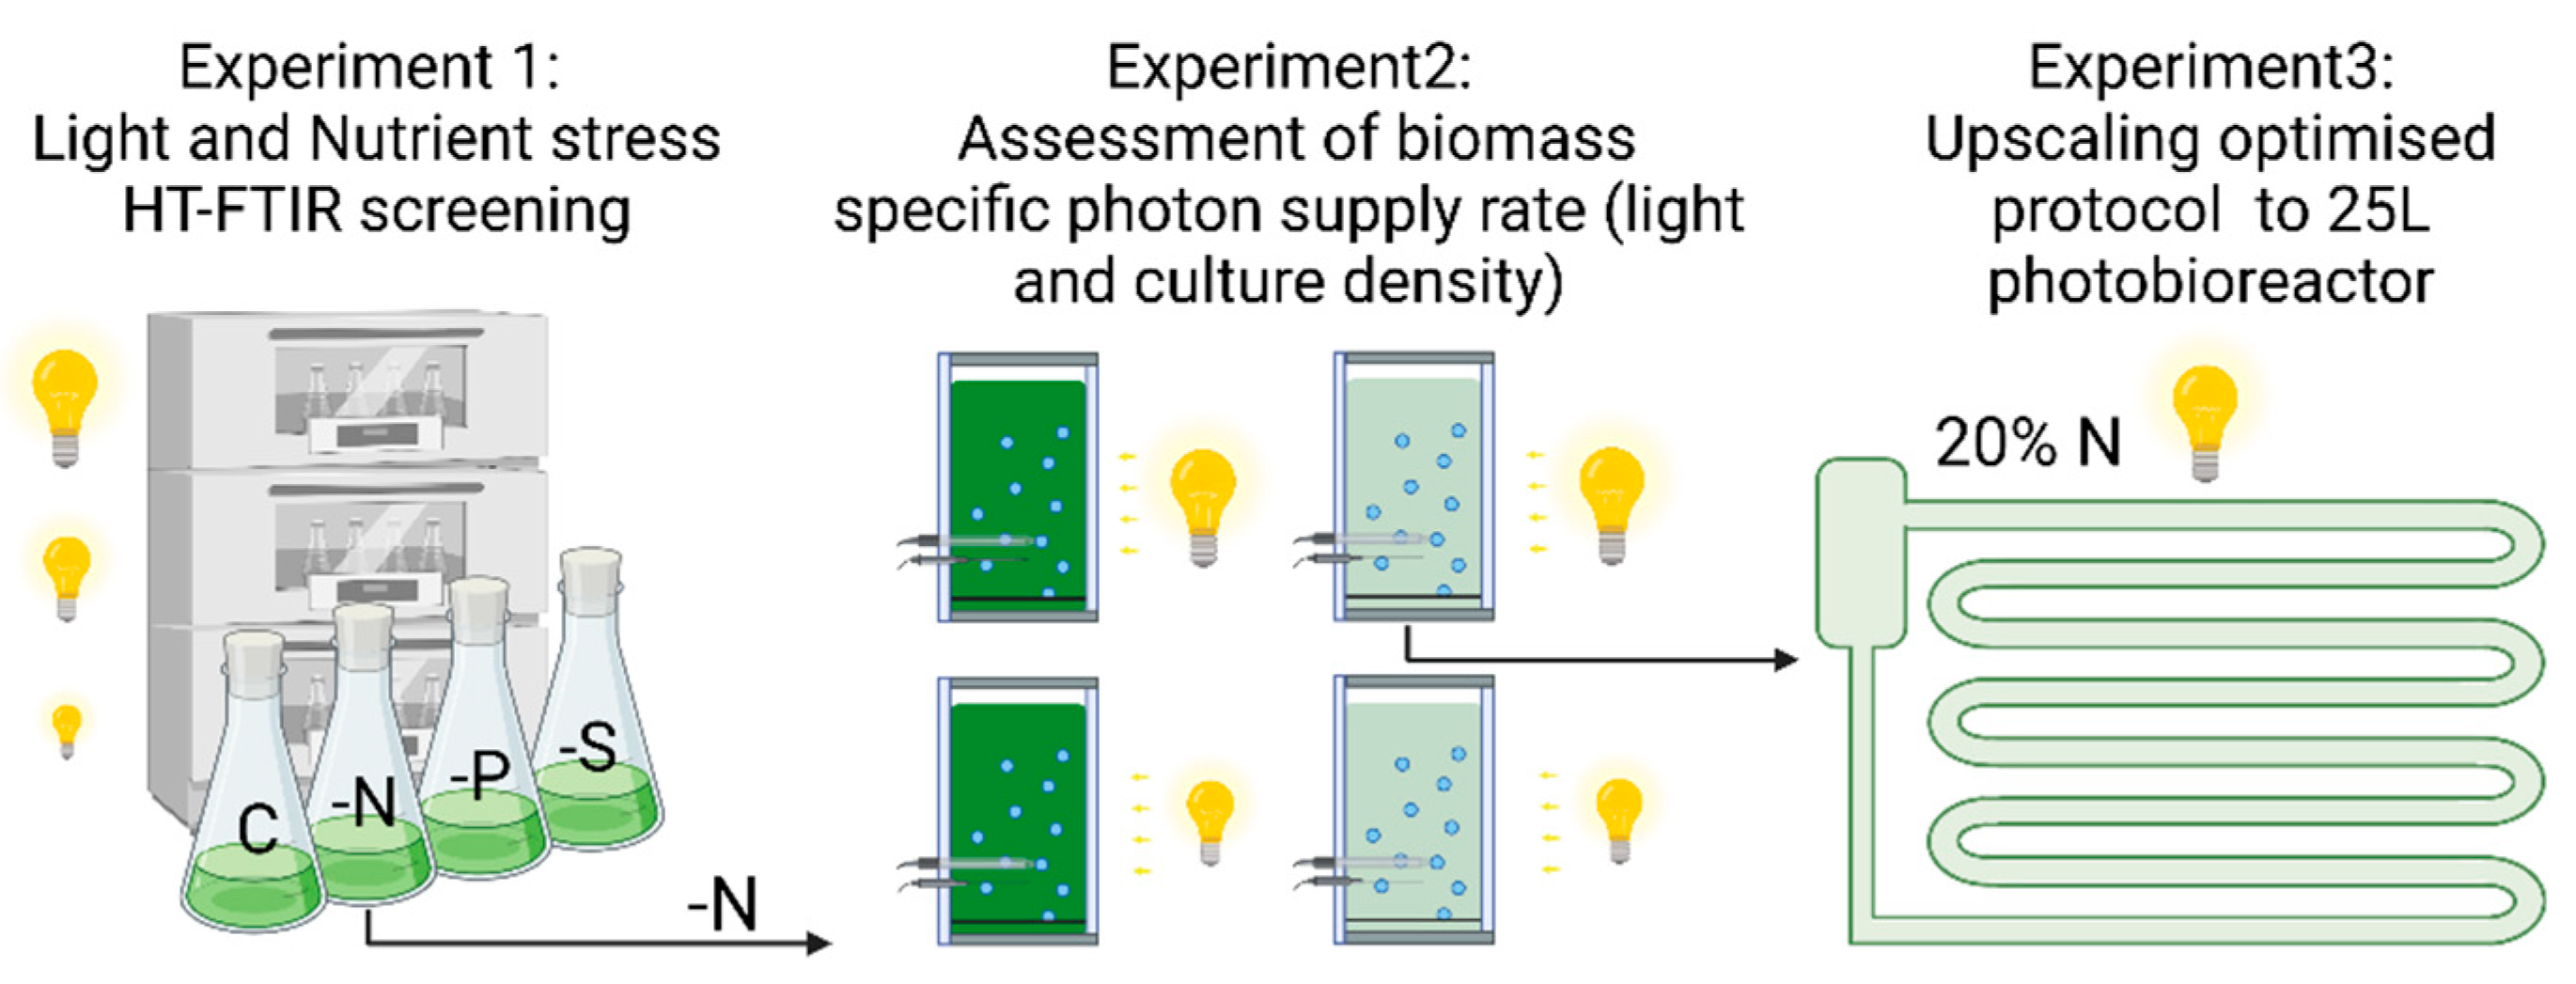
2.2. Experimental Designs

Three experiments were performed in our study to assess optimal conditions for starch production. The three experimental set-ups are illustrated in Figure 1.
In experiment 1, FTIR spectroscopy screening, a Multitron Incubator with three chambers (InforsHT, Mainz, Germany) was used to test different cultivation conditions in 36 cultures. The experiment was performed in 1 L Erlenmeyer flasks containing 500 mL culture, mixed by filter-sterilised air with 1% CO2 and orbital shaking at 110 rpm, and the light was provided from two sides. Twelve cultures with a starting Absorbance750 nm = 1.2 were cultured for acclimation in full M8a medium, increasing light intensity from 100 to 400 µmol m−2 s−1. The starting pH was 7.5. After incubating for six days cultures were centrifuged and resuspended in 36 Erlenmeyer flasks at an Abs750 nm = 0.5 in four medium treatments (control (C), nitrogen starved (-N), phosphorous starved (-P) and sulphur starved(-S) in triplicates. The temperature was set to 25 °C and the three incubator chambers were set respectively at 800, 1300 and 1800 µmol m−2 s−1.
In experiment 2 the cultures were grown in autoclavable flat panel photobioreactors [49] to study the effect of light intensity and culture density on the production of starch. The reactors’ volume capacity was 1.5 L and the light path 3 cm. The light was supplied by modulable LED panels, 5% CO2: air mixture (v/v) was supplied on demand to maintain pH stable at 7.5 ± 0.1 and the temperature was set at 25 °C. Cultures were acclimated for four days, increasing light intensity daily from 100 to 500 µmol m−2 s−1. The cultures were harvested and centrifuged, and the algae were resuspended in a nitrogen starvation medium at the desired density and aliquoted into six reactors. Two inoculation densities, 0.25 and 0.65 g L−1 were tested at two light intensities, 1300 and 1800 µmol m−2 s−1. Each treatment combination was run three times.
For the scale-up trials, experiment 3, low inoculum (0.1 g L−1) cultures were grown in LGemTube RD1-25, 25 L tubular photobioreactors (LGem BV, Rotterdam, The Netherlands) in M8a medium containing 20% of the nitrogen source. The temperature was maintained at 25 ± 2 °C, pH maintained at 7.5 ± 0.2 controlled by CO2 addition, and the light was increased daily (50 to 100 to 200 µmol m−2 s−1) until the moment of starvation when it was finally set to 1300 µmol m−2 s−1.

2.3. Growth Analysis

Algal growth was followed by spectrophotometry, measuring Optical Density as Absorbance at 750 nm using a SparkTM microplate reader, (Tecan®, Männerdorf, Switzerland).
Dry weight was measured filtrating a known volume, diluted in 20 mL distilled water, in pre-washed and weighed Whatman GF/F glass fibre filters 25 mm diameter with 0.7 µm pore size (Cytiva, Marlborough, MA, USA). Filters were subsequently dried in a drying oven at 105 °C for 24–48 h before weighing.

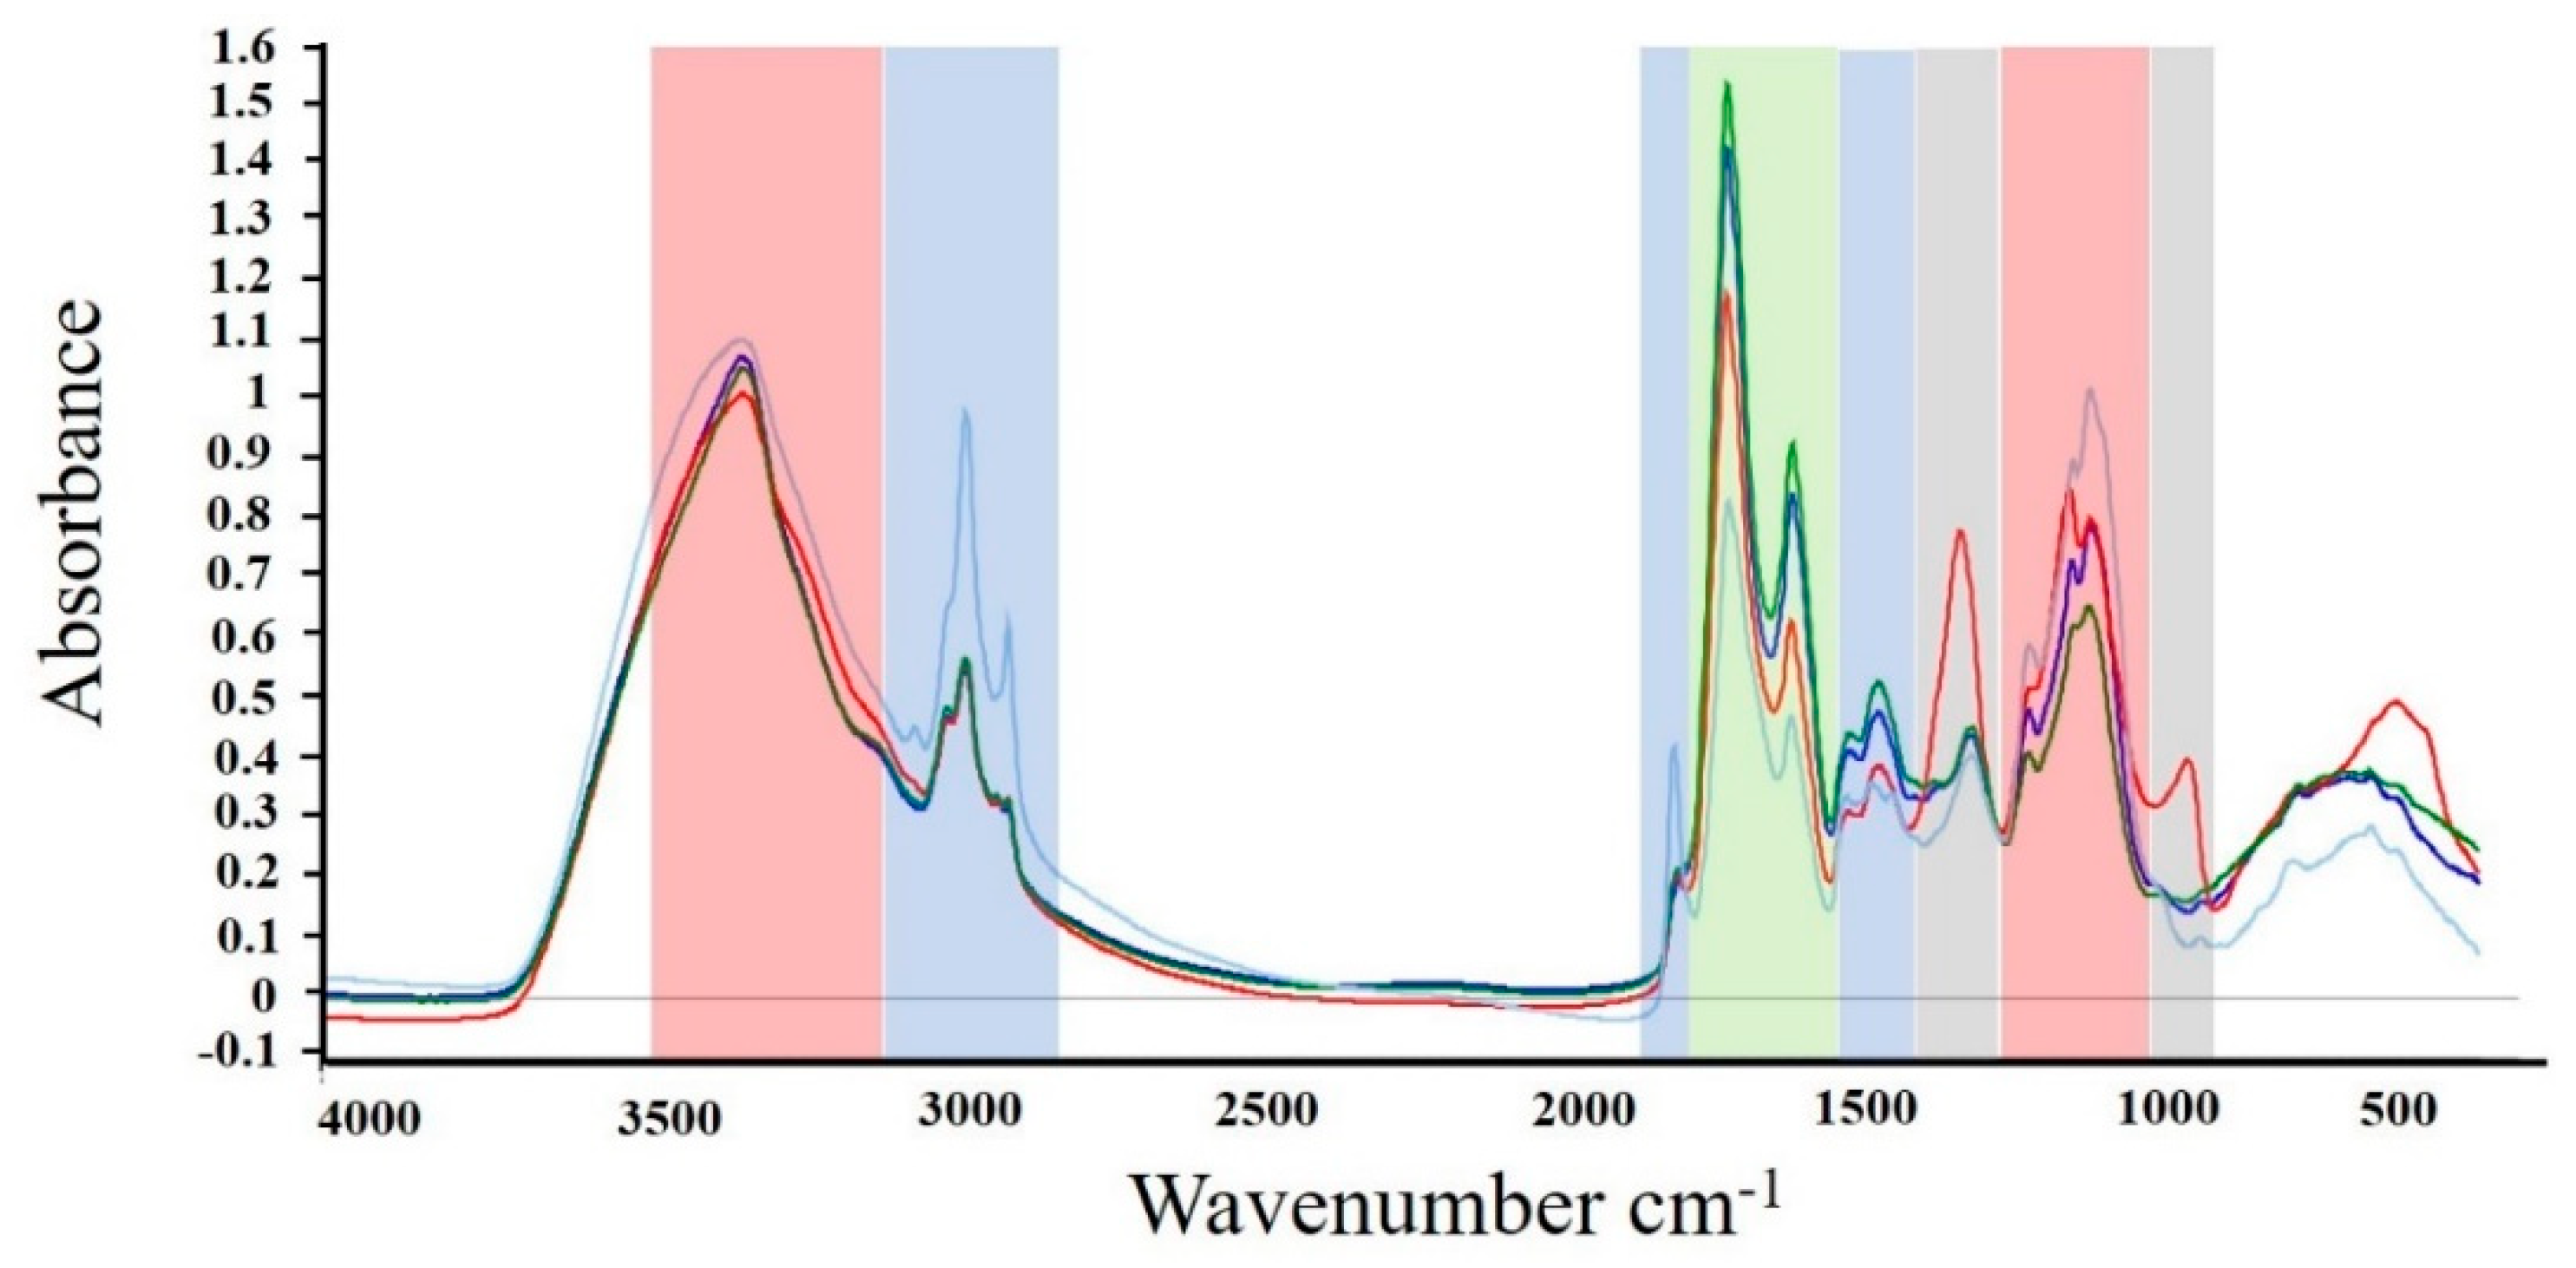
2.4. FTIR Spectroscopy of Algal Biomass

FTIR spectroscopy analysis of algal biomass for all screening samples was performed in the following way: (1) approximately 800 µL of cell culture, depending on the optical density, was centrifuged for 5 min at 4700 rpm (4816× g) and the supernatant was removed; (2) the obtained cell pellet was washed three times with distilled water; (3) the washed pellet was resuspended in 50 µL distilled water, to achieve a final density of Abs750 = 7–8, (4) 10 µL of cell suspension was transferred in triplicate on the 384 wells silicon FTIR plate and dried at room temperature.
FTIR Spectra were recorded in a transmission mode using a High Throughput Screening eXTension (HTS-XT) unit coupled to the Vertex 70 FTIR spectrometer (both Bruker Optik, Ettlingen, Germany). Spectra were recorded as the ratio of the sample spectrum to the spectrum of the empty IR transparent microplate in the region between 4000 cm−1 and 500 cm−1 with a spectral resolution of 6 cm−1, a digital spacing of 1.928 cm−1, and an aperture of 5 mm. For each spectrum, 64 scans were averaged. In total, 360 biomass spectra were obtained. The OPUS software (Bruker Optik GmbH, Ettlingen, Germany) was used for data acquisition and instrument control.

2.5. Light and Biomass-Specific Photon Supply Rate

The light was measured with a light meter (SpectroSense2, Skye instruments, Llandrindod Wells, UK), photon flux density was calculated averaging four different measurements taken in the same positions for all reactors. The biomass specific photon supply rate values at the beginning of starvation were calculated as described by Zijiffers et al. [50] using Equation (1).
rE,x = PFDin/Cx × l
With PFDin being the incoming photon flux density, expressed as µmol m2 s−1, Cx being the dry weight biomass concentration in g m−3 at the onset of starvation and l being the light path in meters.

2.6. Nutrient Consumption

The nitrogen consumption in experiments 2 and 3 was assessed on the spot with the colorimetric Nitrate Test strips, 10–500 mg L−1 (NO3), MQuant® (Supelco, Bellefonte, PA, USA). Values were later confirmed with ion chromatography performed on 940 Professional IC Vario, (Metrohm AG, Herisau, Switzerland).
After centrifuging 15 mL, the supernatant was filtered through 0.22 µm cellulose acetate membrane filters (VWR International, Radnor, PA, USA). IC was calibrated for detecting three anions, NO3, PO4 and SO4.

2.7. Starch Analysis

Centrifuged pellets were freeze-dried, and 7 ± 1 mg biomass were weighed in triplicates. The samples were bead-beaten in ethanol to break the cells and remove interfering compounds and the starch was subsequently quantified with the Total Starch (AA/AMG) Assay Kit (Megazyme, Wicklow, Ireland). Briefly, the pre-treated biomass was incubated with α-amylase and amyloglucosidase enzymes to degrade starch to monosaccharides. The total sugar content was then assessed with a colorimetric reaction against a glucose standard curve and the glucose content was transformed to starch multiplying by glucose/starch molecular weight conversion factor (0.9).

2.8. Data Analysis

The Following software packages were used for the analysis of FTIR spectra: Unscrambler X version 10.5.1 (CAMO Analytics, Oslo, Norway), and Orange (The Mathworks Inc., Natick, MA, USA) [51]. The pre-processing of FTIR spectra was performed in two ways: FTIR spectra of the algal biomass were first transformed to second-derivative spectra by the Savitzky-Golay algorithm using a polynomial of degree 2 and a window size of 11 in total. The second-derivative spectra were pre-processed by extended multiplicative scatter correction (EMSC), an MSC model extended by linear and quadratic components [52,53,54]. Technical replicates were averaged to remove the technical variability of the measurements. Then the spectra were cut and used for the principal component analysis (PCA) of lipid (3050–2800 cm−1, 1800–1700 cm−1), protein (1700–1500 cm−1) and polysaccharide (1200–700 cm−1) spectral regions.
Experiment 2 was analysed using R Studio version 3.6.1 (R. RStudio, Inc., Boston, MA, USA), one-way ANOVA was performed on the data after a Cochran test of homogeneity of variances. Where outliers were detected an sqrt transformation was applied, and where the transformation did not remove the effect of the outlier, the significance level to reject the null hypothesis was set at α < 0.001.

3. Results and Discussion

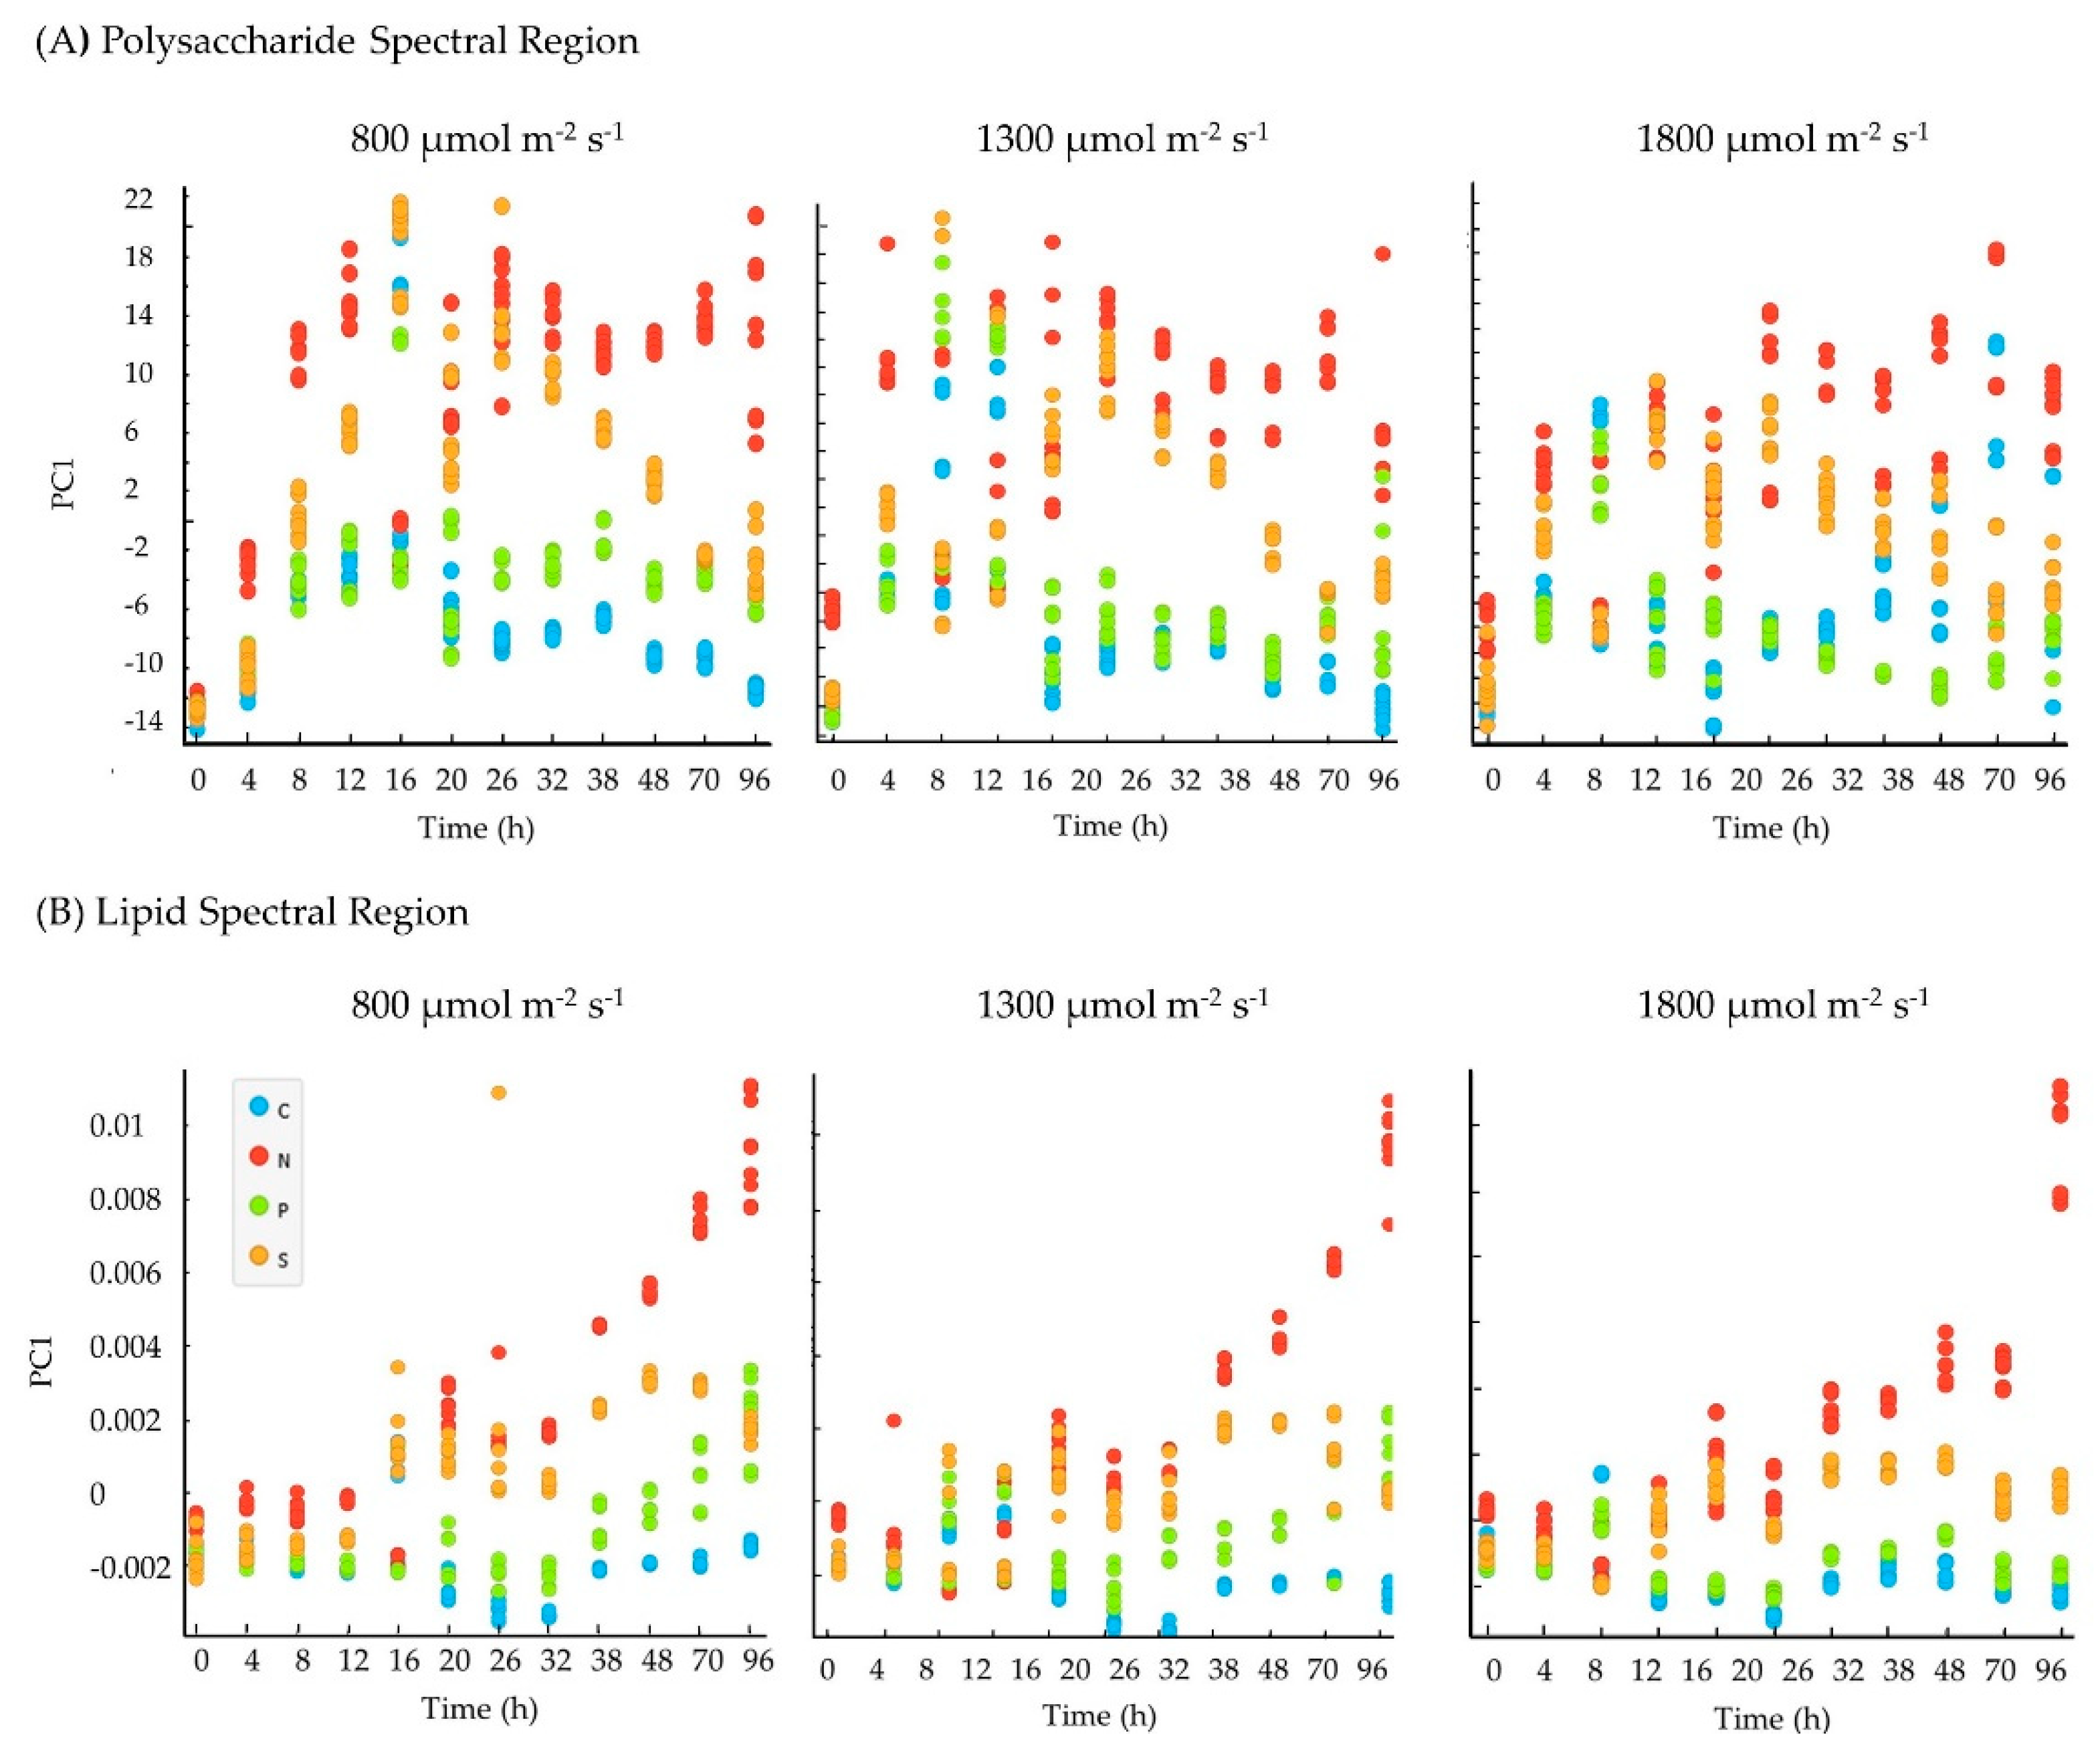
3.1. Experiment 1: Effect of Light Stress and Nutrient Starvation

High-throughput cultivations are based on utilising microtiter plates or microbioreactor based systems, where it is possible to grow simultaneously many microbial species and strains under different conditions [36,37,55,56,57,58]. Such systems, as, for example, Bioscreen C, MTPS-Duetz or microbioreactors have not been evaluated for screening phototrophic microalgae because they often have limited light transparency which does not allow optimal lighting during cultivation. For this reason, we used a traditional shake flask system combined with the high-throughput FTIR spectroscopy to assess qualitatively how nutrient and light treatments affect the metabolism and composition of C. vulgaris biomass over time. FTIR detects the IR radiation, which is absorbed by specific molecular bonds, generating a spectrum that can be considered a chemical fingerprint of the biomass. The characteristic absorbance peaks of the different bonds, and the corresponding molecular components and spectral regions are detailed in Table 1 and Figure 2.
Figure 2 shows the spectral emission of cultures grown under different nutrient conditions using data from the last time point at a high light intensity and is an example of how the treatments generate different chemical fingerprints. The spectrum shows a marked difference in the starch peaks at the wavelengths of 1080 and 1155 cm−1, with nitrogen starvation giving the highest signal, whereas the other polysaccharide region is homogeneous between treatments, thus we consider starch accumulation as a storage compound to be the main driver for differences in polysaccharide region, being starch the most abundant carbohydrate in C. vulgaris [12]. In the lipid region, there is again a strong signal for the nitrogen deprived culture which has a specific pattern and a higher peak at 1745 cm−1 related to ester bond stretching in acyl glycerides. Proteins have a higher signal at control and P- conditions though the peaks are similar for all treatments. Finally, the signals at 885 and 1265 cm−1 have been attributed to polyphosphates which are known to be accumulated in microalgae, including C. vulgaris, as inorganic IP3 granules [61,62].
As confirmed by further principal component analysis (PCA), the areas with higher variability are the lipid and polysaccharide regions. Their changes over time are detailed in Figure 3. The PCA results have shown significant chemical changes in the algal cells grown under different nutrient conditions, although no changes were detected for the different light intensities. Generally, among all tested conditions, nitrogen and sulphur starvation showed the most pronounced effect on the algal cellular chemical profile, while control and phosphorus did not show any significant effect. Moreover, lipids and carbohydrates were the most affected by the nitrogen and sulphur treatments, while changes in protein content and profile were not detected if not at the last time points, where cultures were also visibly stressed (data not shown).
Thus, in Figure 3A, we can observe how nitrogen and sulphur starvation influenced polysaccharide accumulation in algal cells. In these conditions the polysaccharides increased rapidly from 4 h to 16 h, then it stabilized until 32 h and, finally, it dropped slightly for cells grown under nitrogen starvation, while in sulphur starvation, we can observe a considerable decrease. Additionally, a significant increase over time in the lipids (Figure 3B) can be seen under nitrogen starvation, with the highest value indicated after 94 h. Sulphur starvation also slightly affected total lipid with the highest content at 16 h–94 h while control and phosphorous conditions were shown not to be affecting the total lipid content.
Starch and lipid storage patterns in our study are in agreement with several examples existing in the literature that show how starch accumulation is a fast response to environmental changes, with an anabolic phase lasting 12–48 h followed by starch degradation and concomitant lipid synthesis [63,64,65]. This sequential accumulation is a mechanism that is activated when sub-optimal conditions are long-term, and the cells turn from starch to lipid synthesis, which is preferred as storage having higher energy density and stability [21,66].
Among the treatments, phosphorous starvation did not have an effect on the biomass composition, although Branyikova et al. in 2011 [18] reported it has a role in inducing starch accumulation. We theorise that this may be explained by the presence of polyphosphates, detected with FTIR spectroscopy, which may have been induced by high phosphorous content in the medium prior to starvation, through luxury uptake [61], whereas in the aforementioned study phosphorous in the growth medium was lower, possibly hindering IP3 uptake and resulting in stress.
Nitrogen and sulphur starvation proved to both be promising triggers for polysaccharide accumulation and, despite sulphur being reported to induce up to 60% starch in the literature [18], nitrogen led to a faster and steadier accumulation pattern. It is also worthy to note that, according to the literature, sulphur limitation is associated with lower cell mortality and better growth performance over a long period of time [18,20]. However, since our work has focused on producing starch, which increased and should be harvested in a short time span, it was considered that the expected long term cell mortality and productivity loss in nitrogen starvation would not be deemed an issue for this specific purpose, and a faster and steadier accumulation would be preferable.
The tested light intensities did not result in any significant differences in the biomass composition within each treatment, which is in contrast to previously reported data [18,25] that show light as a major influence on starch concentration. Light is in fact necessary to fixate the carbon used for the starch synthesis [67]. These results led to the hypothesis that light penetration in this experimental setup may have been a limiting factor for polysaccharide production. Considering the difficulties encountered assessing light distribution in Erlenmeyer shake-flasks, further studies about the relationship between irradiation, culture density and starch concentration were performed in Flat Panel Photobioreactors under nitrogen starvation.

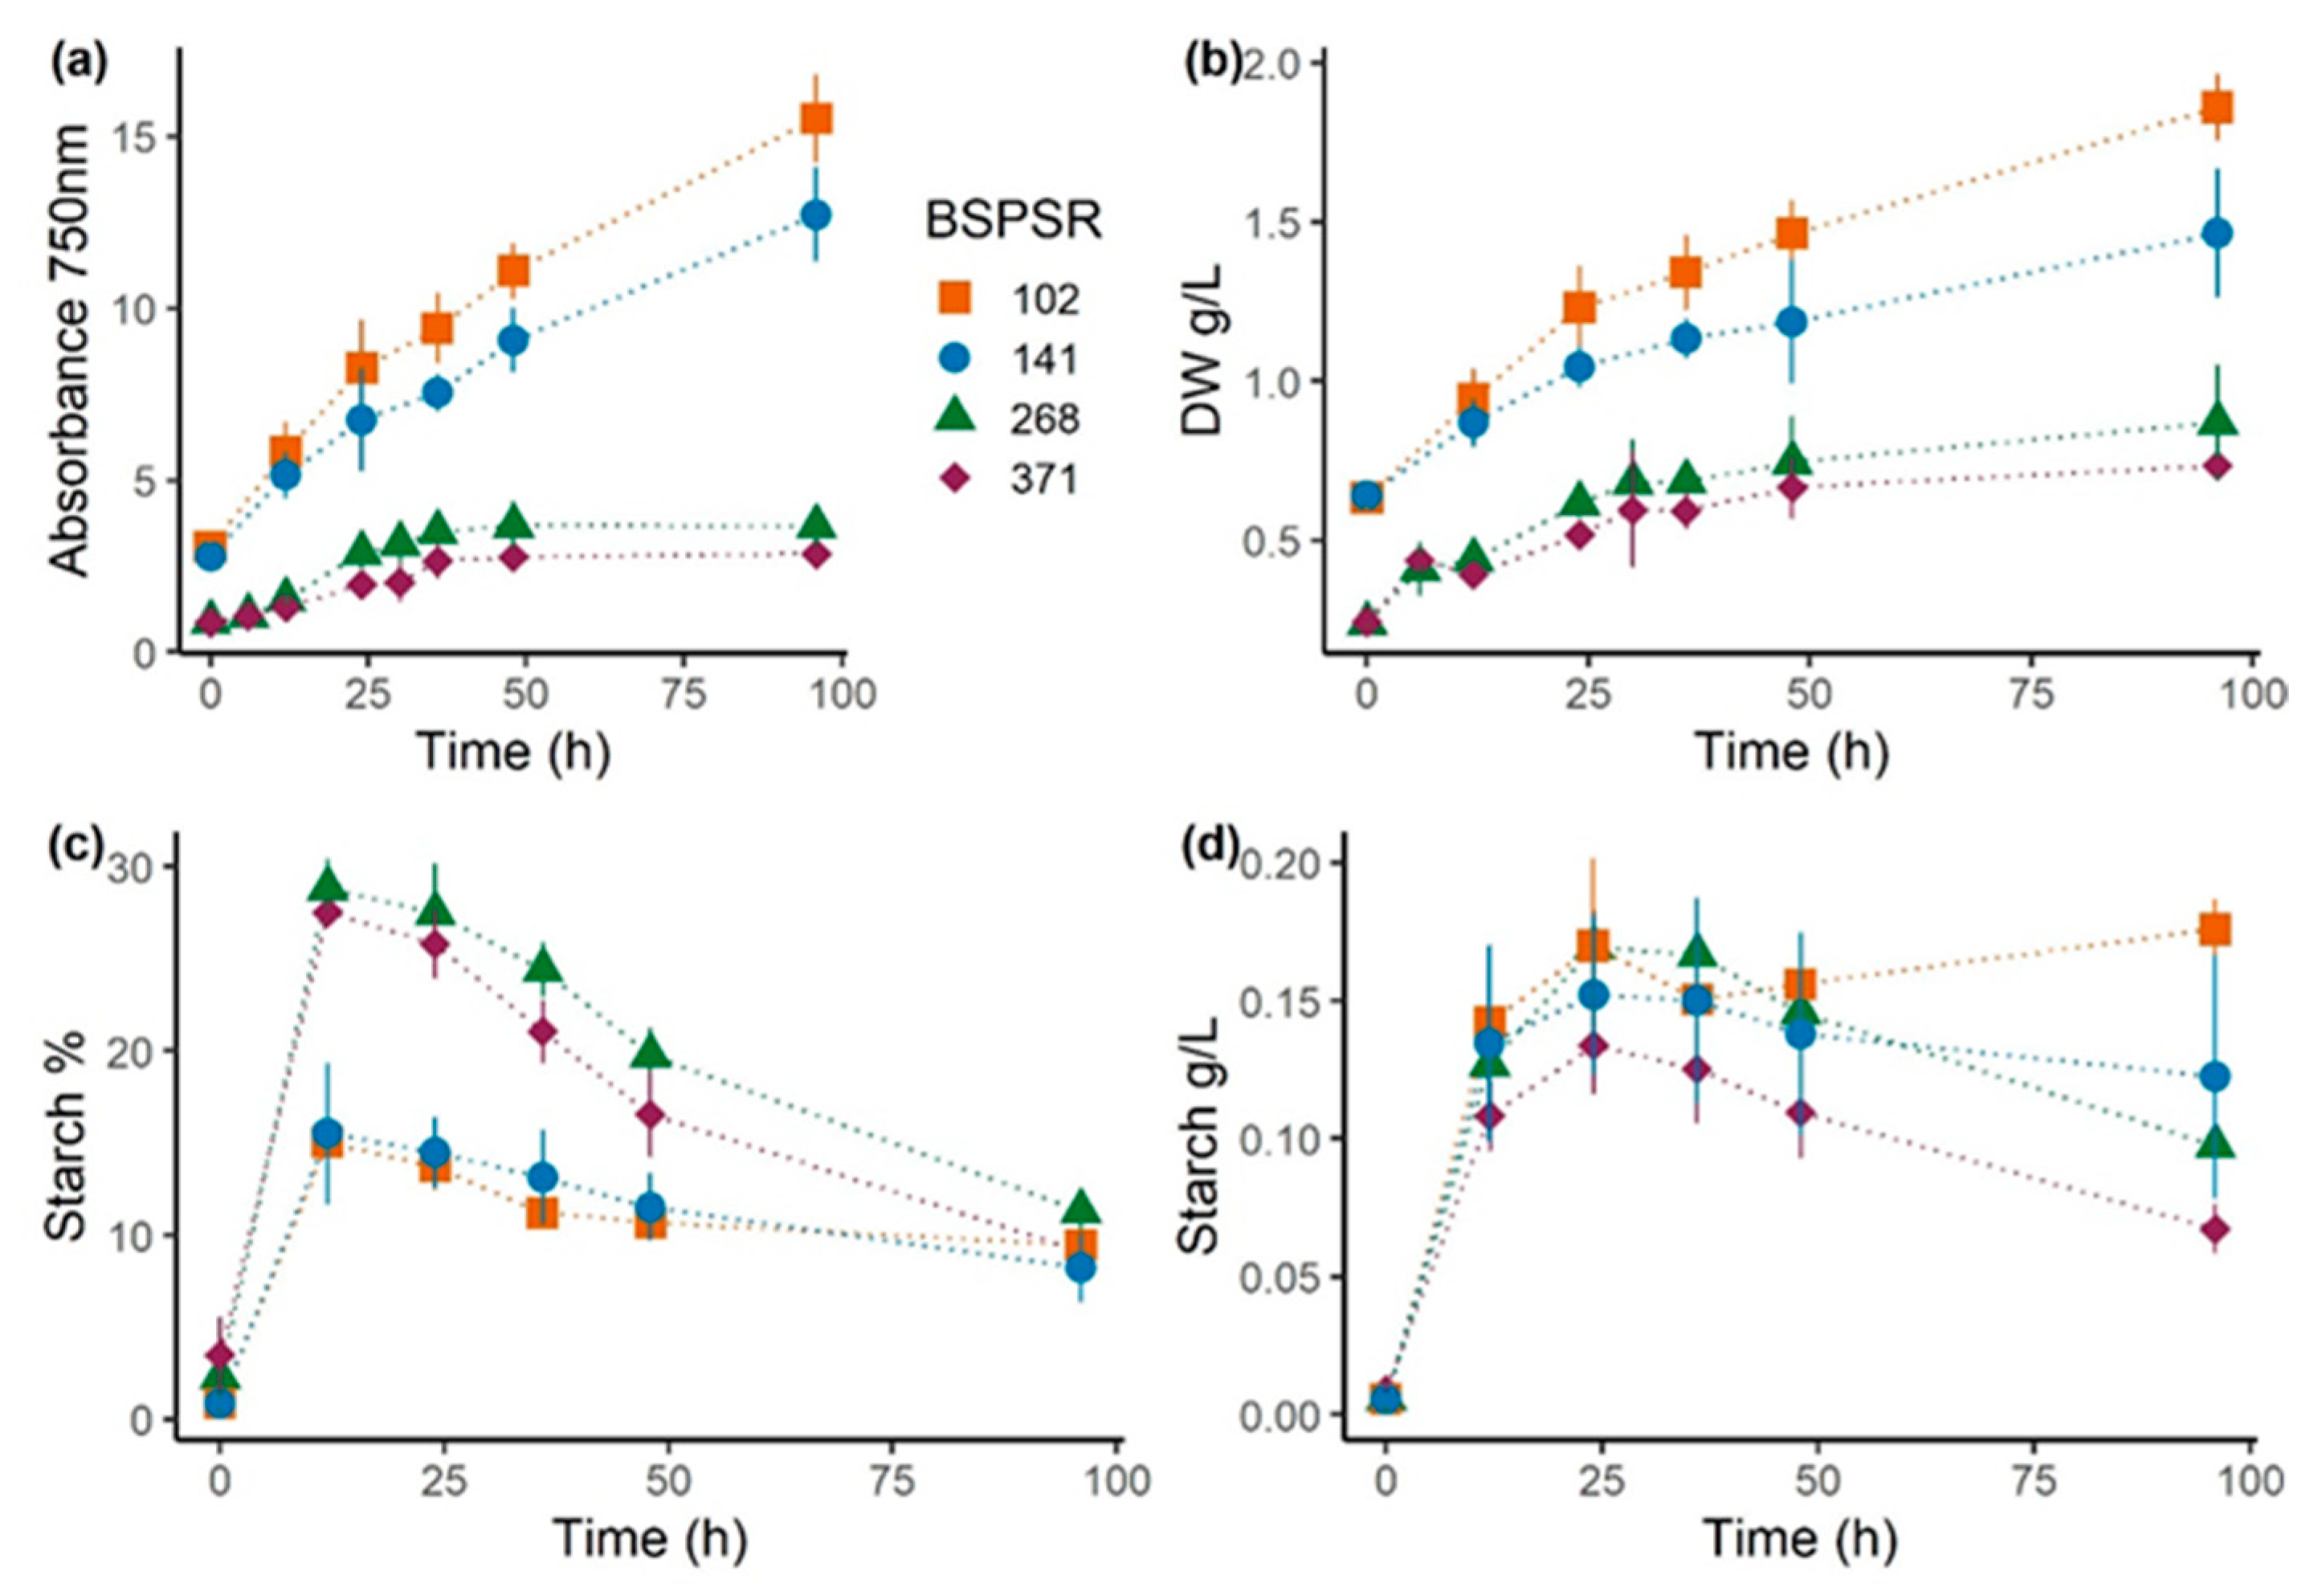
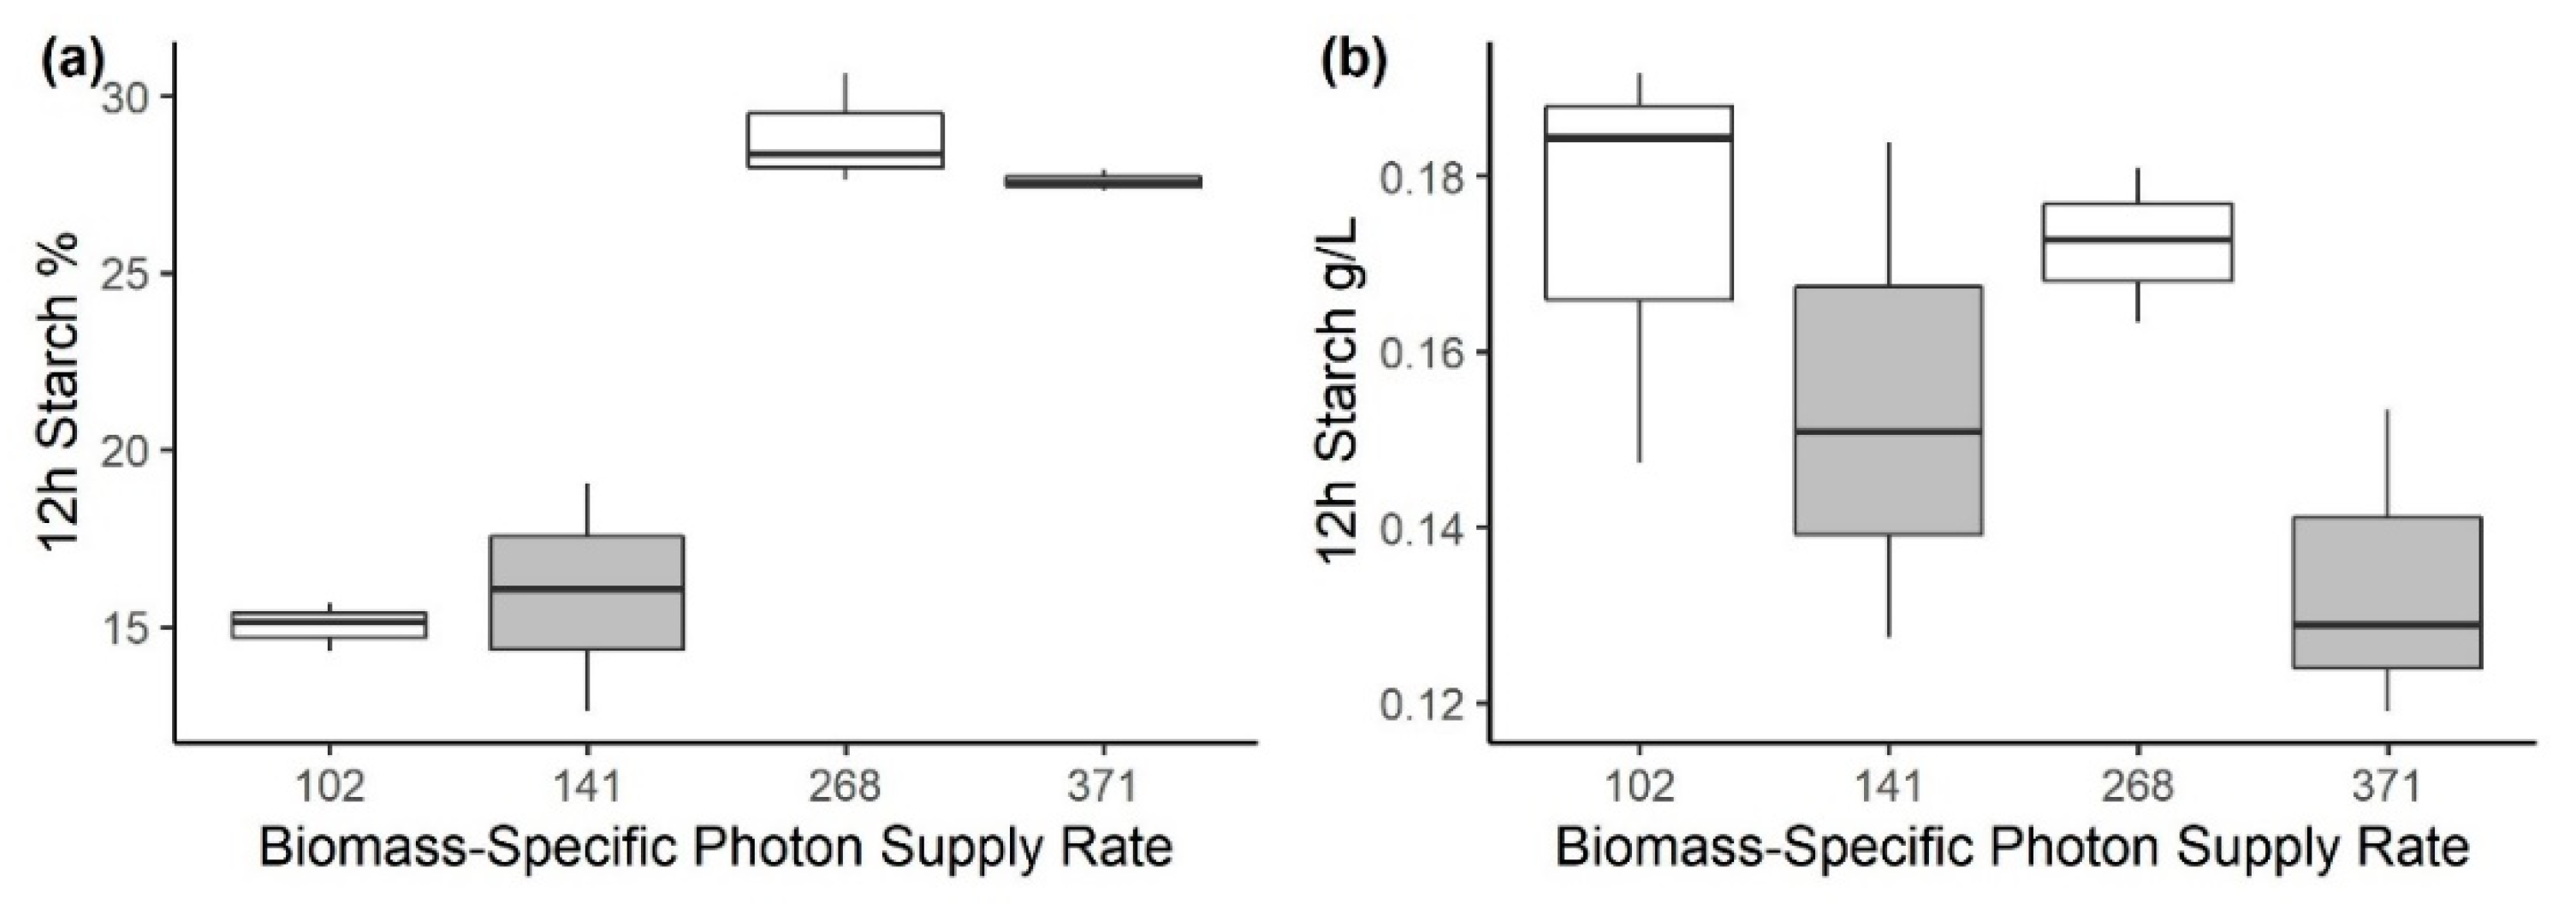
3.2. Experiment 2: Effect of Biomass-Specific Photon Supply Rate under Nitrogen Starvation

The light distribution per biomass unit was studied in flat panel reactors subjecting cultures inoculated at two different densities, 0.25 and 0.65 g L−1, to two light intensities, 1300 and 1800 µmol m−2 s−1. These conditions resulted, as shown in Table 2, in four biomass-specific photon supply rates (BSPSR) which have a clear effect on growth and starch accumulation under nitrogen deprivation.
Figure 4a,b, show the absorbance and dry weight over 96 h from starvation. The overall increase in dry weight and absorbance may be explained by the accumulation of metabolites such as starch and consequent increase in weight and granulometry [68] despite nitrogen starvation inhibiting growth.
The cultures which received fewer photons per biomass unit and are also those that had a higher density at starvation, had higher final biomass productivity, 0.2 and 0.3 g L−1 d−1, compared to the lower irradiance treatments that were ranging between 0.12 and 0.15 g L−1 d−1.
As reported in the FTIR screening, also in flat panels the starch content in the cells had increased significantly in all cultures within the first 12 h (Figure 4c) followed by degradation. Maximum starch concentration reached up to 30% in cultures with high BSPSR, whereas the cultures that received a lower light supply rate did not accumulate more than 15%. The relationship between BSPSR and starch content at 12 h was confirmed by a strong positive correlation of correlation coefficient 0.88 (Figure 5a).
The peak of starch concentration in the biomass did not coincide with the peak of maximum starch accumulation in the culture, expressed as g L−1, which happened at 24 h rather than 12 h (Figure 4d), and was very similar for all four treatments. This discrepancy happened because in starch-rich cultures, at 24 h from starvation, the starch was still contained at a high percentage in the cells (>25%), while we see a small increase in biomass dry weight. At the same time, the cultures with lower starch content, which had a higher initial biomass, higher productivity and less cell mortality reached similar starch production values as the cultures with a high starch content, which on the other hand had lower productivity and suffered the impact of light stress on cell growth. The photon supply rate, in this case, showed the opposite effect with a weak negative correlation of −0.65 (Figure 5b). These two tendencies may both be interesting for industrial production depending on the desired final product. In a biorefinery context, where starch is to be extracted, a lower BSPSR may be chosen as a strategy to produce starch alongside other interesting metabolites. However, if the goal is to produce a starch-rich biomass with high percentage starch content, a higher BSPSR is to be preferred.
It is interesting to know that starch contents higher than what was achieved in our study have been previously reported in Chlorella, and have been often achieved combining high light and low inoculum density, reaching up to 55% in C. vulgaris [18] and even 77% in a CO2 adapted strain grown in a 2-stage process with high dilution [25]. In continuous chemostat growth, it has also been reported a very high effect of light and inoculum density, with the best result of 25% starch-rich biomass [19]. However, Dragone et al. reported in 2011 a high starch content of 44% in C. vulgaris at a relatively low light intensity of 70 µmol m−2 s−1 [22]. Differences in mediums used and growth vessels may be the cause of those discrepancies, nonetheless, our study contributes to a solid body of literature that identifies C. vulgaris as a high starch producer, especially at higher photon supply rates.

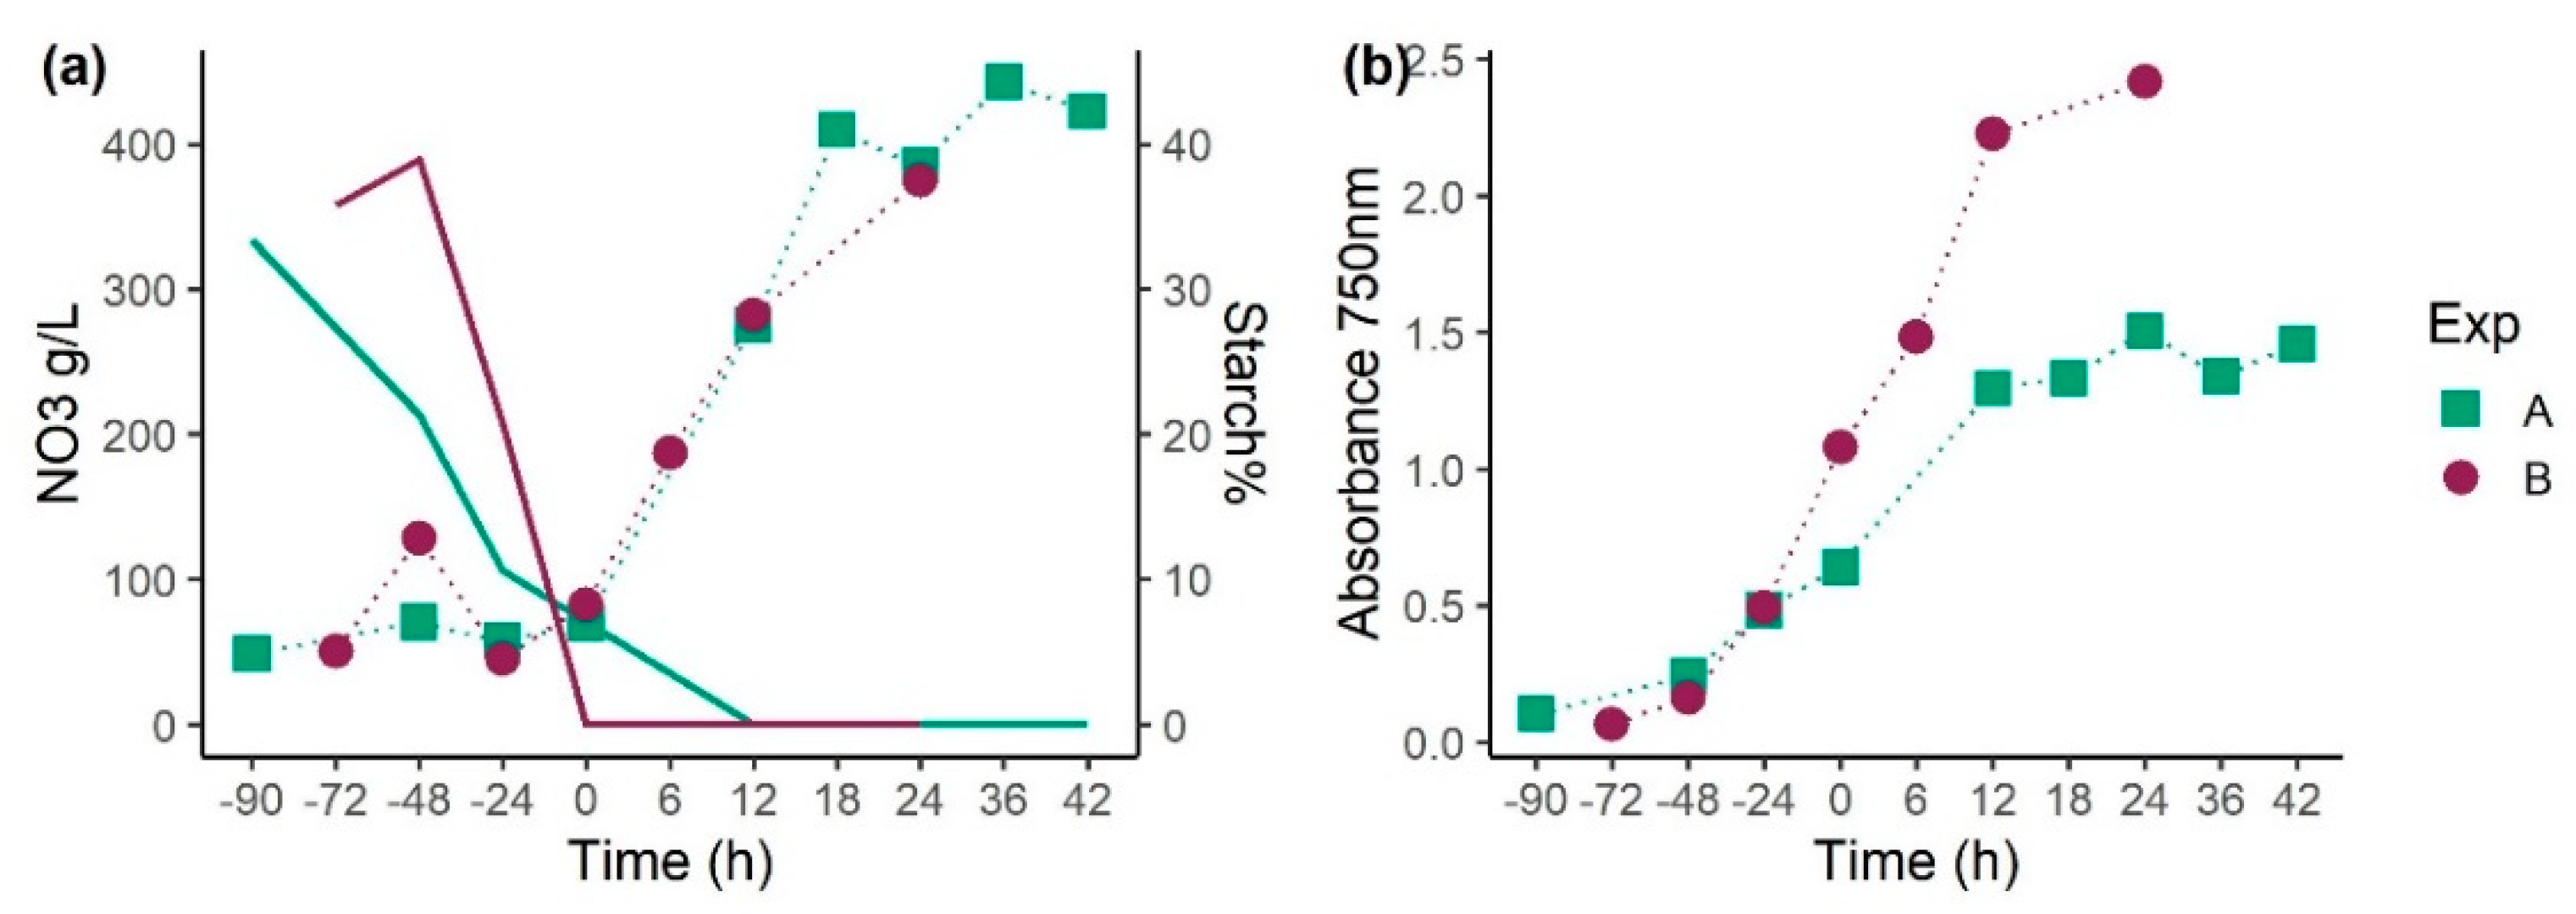
3.3. Experiment 3: Upscaling Starch-Rich Biomass Production

Very few studies have tested starch production from C. vulgaris at a larger scale, and most experiments done so far, including our studies in flat panel reactors, have adopted a protocol where the cultures were centrifuged and resuspended in a starvation medium. Such protocols cannot be applied on large scales.
Thus, two further separate experiments were performed with C. vulgaris in 25 L tubular photobioreactors inoculated at a low density (<0.1 g L−1) in a modified M8a medium containing 20% of the original nitrogen content. Giving a limited amount of nitrogen has allowed the algae to proliferate during the first cultivation days before exhausting the nitrogen and beginning the transition to starvation metabolism.
The difficulty when limiting the amount of nutrients supplied, rather than completely removing it at a known time point by centrifugation lays in identifying the exact moment of nutrient exhaustion. With a species like C. vulgaris, which in the present experiments has again been shown to accumulate maximum starch between 12–24 h from starvation, monitoring nitrogen consumption is essential to both (i) increase the light supply at the correct moment and (ii) harvest the algae before starch degradation begins.
To monitor consumption nitrogen was consequently checked daily with rapid test strips, and the results were subsequently confirmed with ion chromatography. In Figure 6a we see that the 20% of N source in these conditions was exhausted within three to four days from inoculation, allowing for the culture to acclimate and grow while the light was daily increased until it was finally set to 1300 µmol m−2 s−1 on t0 of starvation to support starch production. Starch follow up showed an increase over the 12 h after starvation up to 44% in both experiments performed.
Experiment A was followed up further to 48 h after starvation, and notably the starch content remained above 40% even after the 12 h peak. In experiment B, where starch-rich biomass was harvested between 12 and 24 h after starvation, the growth was altogether faster than in the former trial (Figure 6b) achieving higher biomass productivity and a final starch production upon the harvesting of 1 g L−1. Harvesting 12–24 h after the onset of stress implies that nitrogen starvation mainly impacted starch accumulation, not other components of the biomass since other known effects of starvation usually require longer incubation times. Additionally, through a short-term stress phase, the supply of high light intensity, which is a factor that may greatly influence the cost of production, is limited to a brief time.

4. Conclusions

Starch accumulation above 40% was achieved at a large scale in C. vulgaris, through a protocol that could be suitable for industrial setups. FTIR spectroscopy proved to be an efficient tool for screening multiple stress conditions and characterising changes in biomass composition, identifying the stress conditions to be used for inducing starch production. Both nitrogen and sulphur starvation proved to be good methods for inducing starch and lipid accumulation, yet nitrogen as a stress factor led to faster starch accumulation (12 h), making it preferable for industrial production. To achieve efficient production, nutrient stress needs to be implemented in a protocol that uses a high light intensity to cell density ratio. Thus, a biomass specific photon supply rate above 200 is recommended to produce biomass containing high starch concentrations.
Future investigations involving novel approaches such as “omics” technologies may extend our understanding of metabolic responses to stress, allowing us to further improve the final composition of the biomass. To speed the transfer of knowledge to the industry, research should go forward in assessing the scalability of the process on one side, testing in pilot-scale reactors and in outdoors conditions to improve starch productivity and evaluating the properties of starch-rich algal biomass and testing the possible applications in the food sector.

Author Contributions

Conceptualization, K.S., G.C., M.J.B. and F.R.; methodology, G.C., F.R., V.S., K.S.; software, G.C., V.S., A.K.; formal analysis, G.C., V.S.; investigation, G.C., F.R., V.S.; resources, K.S., V.S.; data curation, G.C., F.R.; writing—original draft preparation, G.C., F.R., V.S.; writing—review and editing, G.C., F.R., V.S., M.J.B., K.S., T.W., S.J.H.; visualization, G.C., V.S., S.D.; supervision, K.S., T.W., M.J.B., S.J.H.; project administration, K.S.; funding acquisition, K.S. All authors have read and agreed to the published version of the manuscript.

Funding

This work received financial support from Research Council Norway (BIONÆR programme, “ALGAE TO FUTURE” project #267872) and NordForsk (NCoE Programme “NordAqua” (project #82845)).

Institutional Review Board Statement

Not applicable.

Data Availability Statement

Data available from authors.

Acknowledgments

We thank Ksenia Gulayeva for her support with ion chromatography, Hanne Skomedal for supporting and managing the team and Stig A. Borgvang for funding acquisition and coordinating the ALGAE TO FUTURE project.

Conflicts of Interest

The authors declare no conflict of interest. The funders had no role in the design of the study; in the collection, analyses, or interpretation of data; in the writing of the manuscript, or in the decision to publish the results.

References

  1. Markou, G.; Nerantzis, E. Microalgae for high-value compounds and biofuels production: A review with focus on cultivation under stress conditions. Biotechnol. Adv. 2013, 31, 1532–1542. [Google Scholar] [CrossRef] [PubMed]
  2. Mata, T.M.; Martins, A.A.; Caetano, N.S. Microalgae for biodiesel production and other applications: A review. Renew. Sustain. Energy Rev. 2010, 14, 217–232. [Google Scholar] [CrossRef] [Green Version]
  3. Milano, J.; Ong, H.C.; Masjuki, H.H.; Chong, W.T.; Lam, M.K.; Loh, P.K.; Vellayan, V. Microalgae biofuels as an alternative to fossil fuel for power generation. Renew. Sustain. Energy Rev. 2016, 58, 180–197. [Google Scholar] [CrossRef]
  4. Chowdhury, H.; Loganathan, B. Third-generation biofuels from microalgae: A review. Curr. Opin. Green Sustain. Chem. 2019, 20, 39–44. [Google Scholar] [CrossRef]
  5. Onen Cinar, S.; Chong, Z.K.; Kucuker, M.A.; Wieczorek, N.; Cengiz, U.; Kuchta, K. Bioplastic Production from Microalgae: A Review. Int. J. Environ. Res. Public Health 2020, 17, 3842. [Google Scholar] [CrossRef]
  6. Lam, M.K.; Lee, K.T. Microalgae biofuels: A critical review of issues, problems and the way forward. Biotechnol. Adv. 2012, 30, 673–690. [Google Scholar] [CrossRef]
  7. Norsker, N.; Barbosa, M.J.; Vermuë, M.H.; Wijffels, R.H. Microalgal production—A close look at the economics. Biotechnol. Adv. 2011, 29, 24–27. [Google Scholar] [CrossRef]
  8. Chew, K.W.; Yap, J.Y.; Show, P.L.; Suan, N.H.; Juan, J.C.; Ling, T.C.; Lee, D.J.; Chang, J.S. Microalgae biorefinery: High value products perspectives. Bioresour. Technol. 2017, 229, 53–62. [Google Scholar] [CrossRef]
  9. Gifuni, I.; Olivieri, G.; Pollio, A.; Marzocchella, A. Identification of an industrial microalgal strain for starch production in biorefinery context: The effect of nitrogen and carbon concentration on starch accumulation. New Biotechnol. 2018, 41, 46–54. [Google Scholar] [CrossRef]
  10. EFSA Novel Food Catalogue. Available online: https://ec.europa.eu/food/safety/novel-food/novel-food-catalogue_en (accessed on 29 August 2021).
  11. Gifuni, I.; Olivieri, G.; Krauss, I.R.; D’Errico, G.; Pollio, A.; Marzocchella, A. Microalgae as new sources of starch: Isolation and characterization of microalgal starch granules. Chem. Eng. Trans. 2017, 57, 1423–1428. [Google Scholar] [CrossRef]
  12. Ferreira, A.S.; Ferreira, S.S.; Correia, A.; Vilanova, M.; Silva, T.H.; Coimbra, M.A.; Nunes, C. Reserve, structural and extracellular polysaccharides of Chlorella vulgaris: A holistic approach. Algal Res. 2020, 45, 101757. [Google Scholar] [CrossRef]
  13. Ruiz, J.S.; Olivieri, G.; De Vree, J.; Bosma, R.; Willems, P.; Reith, J.H.; Eppink, M.H.M.; Kleinegris, D.M.M.; Wijffels, R.H.; Barbosa, M.J. Towards industrial products from microalgae. Energy Environ. Sci. 2016, 9, 3036–3043. [Google Scholar] [CrossRef] [Green Version]
  14. Benvenuti, G.; Ruiz, J.; Lamers, P.P.; Bosma, R.; Wijffels, R.H.; Barbosa, M.J. Towards microalgal triglycerides in the commodity markets. Biotechnol. Biofuels 2017, 10, 188. [Google Scholar] [CrossRef] [PubMed]
  15. Petruk, G.; Gifuni, I.; Illiano, A.; Roxo, M.; Pinto, G.; Amoresano, A.; Marzocchella, A.; Piccoli, R.; Wink, M.; Olivieri, G.; et al. Simultaneous production of antioxidants and starch from the microalga Chlorella sorokiniana. Algal Res. 2018, 34, 164–174. [Google Scholar] [CrossRef]
  16. Behrens, P.W.; Bingham, S.E.; Hoeksema, S.D.; Cohoon, D.L.; Cox, J.C. Studies on the incorporation of CO2 into starch by Chlorella vulgaris. J. Appl. Phycol. 1989, 1, 123–130. [Google Scholar] [CrossRef]
  17. Ho, S.H.; Huang, S.W.; Chen, C.Y.; Hasunuma, T.; Kondo, A.; Chang, J.S. Characterization and optimization of carbohydrate production from an indigenous microalga Chlorella vulgaris FSP-E. Bioresour. Technol. 2013, 135, 157–165. [Google Scholar] [CrossRef] [PubMed]
  18. Brányiková, I.; Maršálková, B.; Doucha, J.; Brányik, T.; Bišová, K.; Zachleder, V.; Vítová, M. Microalgae-novel highly efficient starch producers. Biotechnol. Bioeng. 2011, 108, 766–776. [Google Scholar] [CrossRef]
  19. García-Cubero, R.; Moreno-Fernández, J.; Acién-Fernández, F.G.; García-González, M. How to combine CO2 abatement and starch production in Chlorella vulgaris. Algal Res. 2018, 32, 270–279. [Google Scholar] [CrossRef]
  20. Mizuno, Y.; Sato, A.; Watanabe, K.; Hirata, A.; Takeshita, T.; Ota, S.; Sato, N.; Zachleder, V.; Tsuzuki, M.; Kawano, S. Sequential accumulation of starch and lipid induced by sulfur deficiency in Chlorella and Parachlorella species. Bioresour. Technol. 2013, 129, 150–155. [Google Scholar] [CrossRef] [Green Version]
  21. Takeshita, T.; Ota, S.; Yamazaki, T.; Hirata, A.; Zachleder, V.; Kawano, S. Starch and lipid accumulation in eight strains of six Chlorella species under comparatively high light intensity and aeration culture conditions. Bioresour. Technol. 2014, 158, 127–134. [Google Scholar] [CrossRef] [Green Version]
  22. Dragone, G.; Fernandes, B.D.; Abreu, A.P.; Vicente, A.A.; Teixeira, J.A. Nutrient limitation as a strategy for increasing starch accumulation in microalgae. Appl. Energy 2011, 88, 3331–3335. [Google Scholar] [CrossRef] [Green Version]
  23. Janssen, J.H.; Wijffels, R.H.; Barbosa, M.J. Lipid Production in Nannochloropsis gaditana during Nitrogen Starvation. Biology 2019, 8, 5. [Google Scholar] [CrossRef] [Green Version]
  24. Mulders, K.J.M.; Janssen, J.H.; Martens, D.E.; Wijffels, R.H.; Lamers, P.P. Effect of biomass concentration on secondary carotenoids and triacylglycerol (TAG) accumulation in nitrogen-depleted Chlorella zofingiensis. Algal Res. 2014, 6, 8–16. [Google Scholar] [CrossRef]
  25. Cheng, D.; Li, D.; Yuan, Y.; Zhou, L.; Li, X.; Wu, T.; Wang, L.; Zhao, Q.; Wei, W.; Sun, Y. Improving carbohydrate and starch accumulation in Chlorella sp. AE10 by a novel two-stage process with cell dilution. Biotechnol. Biofuels 2017, 10, 75. [Google Scholar] [CrossRef] [PubMed] [Green Version]
  26. Jerez, C.G.; Malapascua, J.R.; Sergejevová, M.; Figueroa, F.L.; Masojídek, J. Effect of Nutrient Starvation under High Irradiance on Lipid and Starch Accumulation in Chlorella fusca (Chlorophyta). Mar. Biotechnol. 2016, 18, 24–36. [Google Scholar] [CrossRef] [PubMed]
  27. Xiong, Y.; Shapaval, V.; Kohler, A.; Li, J.; From, P.J. A Fully Automated Robot for the Preparation of Fungal Samples for FTIR Spectroscopy Using Deep Learning. IEEE Access 2019, 7, 132763–132774. [Google Scholar] [CrossRef]
  28. Xiong, Y.; Shapaval, V.; Kohler, A.; From, P.J. A Laboratory-Built Fully Automated Ultrasonication Robot for Filamentous Fungi Homogenization. SLAS Technol. Transl. Life Sci. Innov. 2019, 24, 583–595. [Google Scholar] [CrossRef] [PubMed]
  29. Li, J.; Shapaval, V.; Kohler, A.; Talintyre, R.; Schmitt, J.; Stone, R.; Gallant, A.J.; Zeze, D.A. A Modular Liquid Sample Handling Robot for High-Throughput Fourier Transform Infrared Spectroscopy. In Advances in Reconfigurable Mechanisms and Robots II; Ding, X., Kong, X., Dai, J.S., Eds.; Springer International Publishing: Cham, Switzerland, 2016; pp. 769–778. [Google Scholar]
  30. Shapaval, V.; Schmitt, J.; Møretrø, T.; Suso, H.P.; Skaar, I.; Åsli, A.W.; Lillehaug, D.; Kohler, A. Characterization of food spoilage fungi by FTIR spectroscopy. J. Appl. Microbiol. 2013, 114, 788–796. [Google Scholar] [CrossRef]
  31. Shapaval, V.; Møretrø, T.; Suso, H.-P.; Åsli, A.W.; Schmitt, J.; Lillehaug, D.; Martens, H.; Böcker, U.; Kohler, A. A high-throughput microcultivation protocol for FTIR spectroscopic characterization and identification of fungi. J. Biophotonics 2010, 3, 512–521. [Google Scholar] [CrossRef] [PubMed]
  32. Shapaval, V.; Brandenburg, J.; Blomqvist, J.; Tafintseva, V.; Passoth, V.; Sandgren, M.; Kohler, A. Biochemical profiling, prediction of total lipid content and fatty acid profile in oleaginous yeasts by FTIR spectroscopy. Biotechnol. Biofuels 2019, 12, 140. [Google Scholar] [CrossRef] [Green Version]
  33. Kohler, A.; Böcker, U.; Shapaval, V.; Forsmark, A.; Andersson, M.; Warringer, J.; Martens, H.; Omholt, S.W.; Blomberg, A. High-Throughput Biochemical Fingerprinting of Saccharomyces cerevisiae by Fourier Transform Infrared Spectroscopy. PLoS ONE 2015, 10, e0118052. [Google Scholar] [CrossRef] [Green Version]
  34. Colabella, C.; Corte, L.; Roscini, L.; Shapaval, V.; Kohler, A.; Tafintseva, V.; Tascini, C.; Cardinali, G. Merging FT-IR and NGS for simultaneous phenotypic and genotypic identification of pathogenic Candida species. PLoS ONE 2017, 12, e0188104. [Google Scholar] [CrossRef] [Green Version]
  35. Shapaval, V.; Walczak, B.; Gognies, S.; Møretrø, T.; Suso, H.P.; Wold Åsli, A.; Belarbi, A.; Kohler, A. FTIR spectroscopic characterization of differently cultivated food related yeasts. Analyst 2013, 138, 4129–4138. [Google Scholar] [CrossRef] [PubMed]
  36. Szotkowski, M.; Byrtusova, D.; Haronikova, A.; Vysoka, M.; Rapta, M.; Shapaval, V.; Marova, I. Study of Metabolic Adaptation of Red Yeasts to Waste Animal Fat Substrate. Microorganisms 2019, 7, 578. [Google Scholar] [CrossRef] [PubMed] [Green Version]
  37. Byrtusová, D.; Shapaval, V.; Holub, J.; Šimanský, S.; Rapta, M.; Szotkowski, M.; Kohler, A.; Márová, I. Revealing the Potential of Lipid and β-Glucans Coproduction in Basidiomycetes Yeast. Microorganisms 2020, 8, 1034. [Google Scholar] [CrossRef] [PubMed]
  38. Marova, I.; Szotkowski, M.; Vanek, M.; Rapta, M.; Byrtusova, D.; Mikheichyk, N.; Haronikova, A.; Certik, M.; Shapaval, V. Utilization of animal fat waste as carbon source by carotenogenic yeasts—A screening study. EuroBiotech J. 2017, 1, 310–318. [Google Scholar] [CrossRef] [Green Version]
  39. Forfang, K.; Zimmermann, B.; Kosa, G.; Kohler, A.; Shapaval, V. FTIR Spectroscopy for Evaluation and Monitoring of Lipid Extraction Efficiency for Oleaginous Fungi. PLoS ONE 2017, 12, e0170611. [Google Scholar] [CrossRef] [Green Version]
  40. Kosa, G.; Kohler, A.; Tafintseva, V.; Zimmermann, B.; Forfang, K.; Afseth, N.K.; Tzimorotas, D.; Vuoristo, K.S.; Horn, S.J.; Mounier, J.; et al. Microtiter plate cultivation of oleaginous fungi and monitoring of lipogenesis by high-throughput FTIR spectroscopy. Microb. Cell Fact. 2017, 16, 1–12. [Google Scholar] [CrossRef] [Green Version]
  41. Shapaval, V.; Afseth, N.; Vogt, G.; Kohler, A. Fourier transform infrared spectroscopy for the prediction of fatty acid profiles in Mucor fungi grown in media with different carbon sources. Microb. Cell Fact. 2014, 13, 86. [Google Scholar] [CrossRef] [Green Version]
  42. Wagner, H.; Liu, Z.; Langner, U.; Stehfest, K.; Wilhelm, C. The use of FTIR spectroscopy to assess quantitative changes in the biochemical composition of microalgae. J. Biophotonics 2010, 3, 557–566. [Google Scholar] [CrossRef]
  43. Mayers, J.J.; Flynn, K.J.; Shields, R.J. Rapid determination of bulk microalgal biochemical composition by Fourier-Transform Infrared spectroscopy. Bioresour. Technol. 2013, 148, 215–220. [Google Scholar] [CrossRef] [Green Version]
  44. Dean, A.P.; Sigee, D.C.; Estrada, B.; Pittman, J.K. Using FTIR spectroscopy for rapid determination of lipid accumulation in response to nitrogen limitation in freshwater microalgae. Bioresour. Technol. 2010, 101, 4499–4507. [Google Scholar] [CrossRef] [PubMed]
  45. Grace, C.E.E.; Lakshmi, P.K.; Meenakshi, S.; Vaidyanathan, S.; Srisudha, S.; Mary, M.B. Biomolecular transitions and lipid accumulation in green microalgae monitored by FTIR and Raman analysis. Spectrochim. Acta Part A Mol. Biomol. Spectrosc. 2020, 224, 117382. [Google Scholar] [CrossRef] [PubMed]
  46. Harris, E.H. Chlamydomonas in the Laboratory. In The Chlamydomonas Sourcebook; Academic Press Inc.: San Diego, CA, USA, 2009; pp. 241–302. [Google Scholar]
  47. Mandalam, R.K.; Palsson, B.Ø. Elemental Balancing of Biomass and Medium Composition Enhances Growth Capacity in High-Density Chlorella vulgaris Cultures. Biotechnol. Bioeng. 1998, 59, 605–611. [Google Scholar] [CrossRef] [Green Version]
  48. Kliphuis, A.M.J.; de Winter, L.; Vejrazka, C.; Martens, D.E.; Janssen, M.; Wijffels, R.H. Photosynthetic efficiency of Chlorella sorokiniana in a turbulently mixed short light-path photobioreactor. Biotechnol. Prog. 2010, 26, 687–696. [Google Scholar] [CrossRef]
  49. Skjånes, K.; Andersen, U.; Heidorn, T.; Borgvang, S.A. Design and construction of a photobioreactor for hydrogen production, including status in the field. J. Appl. Phycol. 2016, 28, 2205–2223. [Google Scholar] [CrossRef] [PubMed] [Green Version]
  50. Zijffers, J.-W.F.; Schippers, K.J.; Zheng, K.; Janssen, M.; Tramper, J.; Wijffels, R.H. Maximum Photosynthetic Yield of Green Microalgae in Photobioreactors. Mar. Biotechnol. 2010, 12, 708–718. [Google Scholar] [CrossRef] [Green Version]
  51. Demṡar, J.; Curk, T.; Erjavec, A.; Gorup, Ċ.; Hoċevar, T.; Milutinoviċ, M.; Możina, M.; Polajnar, M.; Toplak, M.; Stariċ, A. Orange: Data mining toolbox in Python. J. Mach. Learn. Res. 2013, 14, 2349–2353. [Google Scholar]
  52. Zimmermann, B.; Kohler, A. Optimizing Savitzky–Golay Parameters for Improving Spectral Resolution and Quantification in Infrared Spectroscopy. Appl. Spectrosc. 2013, 67, 892–902. [Google Scholar] [CrossRef] [Green Version]
  53. Afseth, N.K.; Kohler, A. Extended multiplicative signal correction in vibrational spectroscopy, a tutorial. Chemom. Intell. Lab. Syst. 2012, 117, 92–99. [Google Scholar] [CrossRef]
  54. Kohler, A.; Kirschner, C.; Oust, A.; Martens, H. Extended Multiplicative Signal Correction as a Tool for Separation and Characterization of Physical and Chemical Information in Fourier Transform Infrared Microscopy Images of Cryo-Sections of Beef Loin. Appl. Spectrosc. 2005, 59, 707–716. [Google Scholar] [CrossRef]
  55. Kosa, G.; Vuoristo, K.S.; Horn, S.J.; Zimmermann, B.; Afseth, N.K.; Kohler, A.; Shapaval, V. Assessment of the scalability of a microtiter plate system for screening of oleaginous microorganisms. Appl. Microbiol. Biotechnol. 2018, 102, 4915–4925. [Google Scholar] [CrossRef] [PubMed] [Green Version]
  56. Shapaval, V.; Møretrø, T.; Wold Åsli, A.; Suso, H.P.; Schmitt, J.; Lillehaug, D.; Kohler, A. A novel library-independent approach based on high-throughput cultivation in Bioscreen and fingerprinting by FTIR spectroscopy for microbial source tracking in food industry. Lett. Appl. Microbiol. 2017, 64, 335–342. [Google Scholar] [CrossRef] [PubMed]
  57. Dzurendova, S.; Zimmermann, B.; Tafintseva, V.; Kohler, A.; Ekeberg, D.; Shapaval, V. The influence of phosphorus source and the nature of nitrogen substrate on the biomass production and lipid accumulation in oleaginous Mucoromycota fungi. Appl. Microbiol. Biotechnol. 2020, 104, 8065–8076. [Google Scholar] [CrossRef]
  58. Dzurendova, S.; Zimmermann, B.; Tafintseva, V.; Kohler, A.; Horn, S.J.; Shapaval, V. Metal and Phosphate Ions Show Remarkable Influence on the Biomass Production and Lipid Accumulation in Oleaginous Mucor circinelloides. J. Fungi 2020, 6, 260. [Google Scholar] [CrossRef] [PubMed]
  59. Dzurendova Id, S.; Zimmermann, B.; Kohler, A.; Tafintseva, V.; Slany, O.; Certik, M.; Shapaval, V. Microcultivation and FTIR spectroscopy-based screening revealed a nutrient-induced co-production of high-value metabolites in oleaginous Mucoromycota fungi. PLoS ONE 2020, 15, e0234870. [Google Scholar] [CrossRef]
  60. Lal Karwasra, B.; Singh Gill, B.; Kaur, M. International Journal of Food Properties Rheological and structural properties of starches from different Indian wheat cultivars and their relationships Rheological and structural properties of starches from different Indian wheat cultivars and their relationships. Int. J. Food Prop. 2017, 20, S1093–S1106. [Google Scholar] [CrossRef]
  61. Powell, N.; Shilton, A.; Chisti, Y.; Pratt, S. Towards a luxury uptake process via microalgae—Defining the polyphosphate dynamics. Water Res. 2009, 43, 4207–4213. [Google Scholar] [CrossRef]
  62. Wu, Q.; Guo, L.; Wang, Y.; Zhao, Y.; Jin, C.; Gao, M.; She, Z. Phosphorus uptake, distribution and transformation with Chlorella vulgaris under different trophic modes. Chemosphere 2021, 285, 131366. [Google Scholar] [CrossRef] [PubMed]
  63. Figueroa-Torres, G.M.; Pittman, J.K.; Theodoropoulos, C. Kinetic modelling of starch and lipid formation during mixotrophic, nutrient-limited microalgal growth. Bioresour. Technol. 2017, 241, 868–878. [Google Scholar] [CrossRef] [Green Version]
  64. Li, T.; Gargouri, M.; Feng, J.; Park, J.J.; Gao, D.; Miao, C.; Dong, T.; Gang, D.R.; Chen, S. Regulation of starch and lipid accumulation in a microalga Chlorella sorokiniana. Bioresour. Technol. 2015, 180, 250–257. [Google Scholar] [CrossRef] [PubMed] [Green Version]
  65. Zhu, S.; Huang, W.; Xu, J.; Wang, Z.; Xu, J.; Yuan, Z. Metabolic changes of starch and lipid triggered by nitrogen starvation in the microalga Chlorella zofingiensis. Bioresour. Technol. 2014, 152, 292–298. [Google Scholar] [CrossRef] [PubMed]
  66. Nordin, N.; Yusof, N.; Maeda, T.; Mustapha, N.A.; Mohd Yusoff, M.Z.; Raja Khairuddin, R.F. Mechanism of carbon partitioning towards starch and triacylglycerol in Chlorella vulgaris under nitrogen stress through whole-transcriptome analysis. Biomass Bioenergy 2020, 138, 105600. [Google Scholar] [CrossRef]
  67. Zachleder, V.; Brányiková, I. Starch Overproduction by Means of Algae. In Algal Biorefineries; Springer: Dordrecht, The Netherlands, 2014; pp. 217–240. ISBN 9789400774940. [Google Scholar]
  68. de Souza, M.F.; Rodrigues, M.A.; Bon, E.P.; da, S.; Freitas, S.P. Interference of starch accumulation in microalgal cell growth measurement. J. Appl. Phycol. 2019, 31, 249–254. [Google Scholar] [CrossRef]
Figure 1. Experimental setup of the three experiments performed in the study.
Applsci 11 09025 g001
Figure 2. Preprocessed FTIR-HTS spectra of Chlorella vulgaris grown for 94 h on control medium (dark blue), nitrogen starvation (light blue), phosphorus starvation (green) and sulphur starvation (red) under light intensity 1800 µmol m−2 s−1 in experiment 1.
Applsci 11 09025 g002
Figure 3. FTIR-HTS spectra PCA score plots of (A) polysaccharide (1200–900 cm−1) and (B) lipid (3000–2800 cm−1 and 1800–1700 cm−1) regions of C. vulgaris biomass grown on different nutrient conditions (blue for control, red for nitrogen starvation, green for phosphorus starvation and orange for sulphur starvation) and under three light intensities in experiment 1.
Applsci 11 09025 g003
Figure 4. Time course over 96 h after N starvation expressed as average of triplicate cultures in experiment 2: (a) culture density expressed as absorbance at 750 nm; (b) culture density expressed as biomass dry weight; (c) starch concentration expressed as % of biomass dry weight; (d) starch concentration expressed as grams per litre.
Applsci 11 09025 g004
Figure 5. Starch maximum accumulation in C. vulgaris at different biomass specific photon supply rates in experiment 2. (a) peak of maximum concentration in the biomass, observed 12 h within starvation; (b) peak of maximum starch production in the culture, expressed as g L−1, and observed 24 h within starvation.
Applsci 11 09025 g005
Figure 6. Time sequence of two experiments growing C. vulgaris in limiting medium containing 20% nitrogen in experiment 3. Experiment A was harvested after 24 h from starvation (x = 24), experiment B was harvested 36–48 h after starvation. (a) Nitrate content in the medium measured with ion chromatography (solid line) and starch accumulation in the cells (dotted line) (b) Absorbance at 750 nm.
Applsci 11 09025 g006
Table 1. Peak assignments of the FTIR-HTS spectra in the algal cells in experiment 1 (main chemical components are marked on Figure 2).
Chemical ComponentsWavenumber (cm−1)Peak AssignmentReference
Polysaccharides
(Red area on Figure 2)
3500–3200O-H stretching[59]
1200–1000C-O and C-O-C stretching
1080C-O-H bending in starch[12,60]
1155C-O stretching in starch
Lipids
(Blue area on Figure 2)
3010=C-H stretching
2955-C-H (CH3) stretching
2925>CH2 of acyl chain[59]
2855-C-H (CH2) stretching
1745-C = O stretching in esters
1465-C-H (CH2, CH3) bending
Proteins
(Green area on Figure 2)
1680–1630-C = O stretching, Amide I[59]
1530–1560C-N-H deformation, Amide II
Polyphosphate
(Grey area on Figure 2)
1265P = O stretching[59]
885P-O-P stretching
Table 2. Experimental parameters and results from experiment 2. The experimental parameters were biomass-specific photon supply rate (BSPSR), light intensity and inoculum density, vs the resulting starch concentration in the biomass 12 h after N starvation, starch concentration in the culture 24 h after N starvation, and biomass productivities after 48 h. Average values ± SD.
BSPSR
(µmol g−1 s−1)
Irradiance
(µmol m−2 s−1)
Inoculum
(g L−1)
Starch%12 h
(g g−1 dw)
Starch24 h
(g L−1)
Productivity48 h
(g L−1 day−1)
10213000.65 ± 0.0115.0 ± 0.60.17 ± 0.030.42 ± 0.06
14118000.65 ± 0.0115.5 ± 3.00.15 ± 0.030.27 ± 0.10
26813000.25 ± 0.0428.9 ± 1.60.17 ± 0.010.25 ± 0.09
37118000.25 ± 0.0427.5 ± 0.20.13 ± 0.020.21 ± 0.05
Publisher’s Note: MDPI stays neutral with regard to jurisdictional claims in published maps and institutional affiliations.

