
Virtual Reality Visualization of CFD Simulated Blood Flow in Cerebral Aneurysms Treated with Flow Diverter Stents


1
Department of Mechanical Engineering, University of Saskatchewan, Saskatoon, SK S7N 5A9, Canada
2
Division of Biomedical Engineering, University of Saskatchewan, Saskatoon, SK S7N 5A9, Canada
3
Medical Imaging Department, Royal University Hospital, University of Saskatchewan, Saskatoon, SK S7N 0W8, Canada
4
Luxsonic Technologies Inc., 400-15 Innovation Blvd, Saskatoon, SK S7N 3H5, Canada
*
Author to whom correspondence should be addressed.
Appl. Sci. 2021, 11(17), 8082; https://doi.org/10.3390/app11178082
Submission received: 15 July 2021
/
Revised: 13 August 2021
/
Accepted: 20 August 2021
/
Published: 31 August 2021
(This article belongs to the Section Applied Biosciences and Bioengineering)
Abstract
:Simple Summary
Cerebral aneurysm is one of the brain diseases with high mortality and morbidity rates when an abnormal dilation of a vessel occurs and, in severe conditions, ruptured, and blood flows into the space around the brain. A flow diverting stent is one of the devices that has been developed to treat brain aneurysms by diverting the blood flow away from the aneurysm sac. Several important considerations need to be taken into account in stent positioning inside the artery. Computational fluid dynamics is a useful tool in predicting the devices’ efficacy and post-treatment complications but the obtained data need to be visualized in an interactive environment for non-fluid-dynamics experts. We found that virtual reality provides a fully immersive interactive environment for the analysis of blood flow variations in the presence of flow diverters. Therefore, we developed a method to convert the numerical data to three-dimensional objects in virtual reality environments usable for both neurosurgeons and patients. Cerebral neurosurgeons could make easier decisions about selecting the treatment devices, and patients could walk inside their virtual treated aneurysm, reducing their anxiety and making their pre-treatment consulting process more efficient.
Abstract
Virtual reality (VR) has the potential to be a powerful tool for the visualization of simulated blood flow in cerebral aneurysms. This paper presents our study aimed at developing the VR visualization of computational fluid dynamics (CFD) simulations of cerebral aneurysms treated with flow-diverting (FD) stents. First, a spherical sidewall aneurysm located at a simplified internal carotid artery was considered for investigating the impact of stent deployment and positioning on the corresponding spatially time-varying blood flow behavior. The three-dimensional unsteady blood flow over a cardiac cycle was simulated numerically using the finite volume method, and the distributions of hemodynamic parameters inside the aneurysm sac, and on its wall, were presented with and without stent cases. Two stent positions, with and without a gap between the artery wall and stent, were considered to show the influence of correct stent position on aneurysm treatment. Second, a straightforward workflow was developed to import, process, and visualize the CFD analysis data in a VR environment by using open-source software with a high resolution. The Unity3D engine was used for displaying the processed animations in a VR environment operated on a head-mounted display (HMD). The refining process of each frame of time-varying CFD data was automated. The animated flow elements rendered in the VR environment were velocity vectors, velocity contours, streamlines, particle traces, and point clouds. CFD results showed that proper stenting facilitates thrombosis and occlusion of the aneurysm by modification of the flow patterns, which leads to lower inflow jet velocities into the aneurysm, longer turnover time, lower aneurysm-averaged kinetic energy, and lower wall shear stress. Additionally, the results indicated that a gap between the stent and the parent artery may lead to undesirable hemodynamic alterations. The VR visualization illustrated that the recognition of the potential in danger regions of aneurysms and the evaluation of the performance of FD stents in aneurysm treatment can be conducted without the need for several slices through the parent artery and aneurysm, as is required for traditional postprocessing methods. Through VR visualization, the details of the simulation results become readily available by navigating in the 3D animated flow elements using a high-degree-of-freedom headset.
1. Introduction
A cerebral or intracranial aneurysm occurs due to the weakness in the walls of the cerebral artery, which causes abnormal focal dilation of the vessel. As the artery wall becomes thinner over time, the aneurysm is likely to rupture, causing blood to flow into the space in the brain. The rupture of an intracranial aneurysm produces a subarachnoid hemorrhage (SAH) and leads to high mortality and morbidity rates [1]. In order to diagnose the aneurysms, noninvasive angiographic imaging techniques such as computed tomography angiography (CTA), magnetic resonance angiography (MRA), and digital subtraction angiography (DSA) have been commonly used [2]. After detection of an aneurysm, various methods may be used to avoid its rupture, including (open surgery) clipping and endovascular therapy (coils or stents, flow diversion devices). These treatments are based on the exclusion of aneurysms from the blood circulation [3].
A number of devices have been developed over the last decade to treat cerebral aneurysms. Among them, the flow-diverting (FD) stent—a self-expandable, strut-braided, mesh device—shows considerable promise by promoting thrombosis within the aneurysm cavity by diverting the blood flow away from the aneurysm [4]. Despite encouraging results with FD stents, post-treatment complications such as failure of occlusion and subarachnoid hemorrhaging have been reported, so clinicians need to consider some vital issues, for example, discriminating between ruptured and unruptured aneurysms to make a decision on the treatment process, and assessing the performance of selected devices [5,6]. Computational fluid dynamics (CFD) is a promising, yet economic, means to tackle these problems [6,7]. High-resolution images of the brain can be acquired to create detailed 3D models of aneurysm geometry. Governing equations on blood flow have been solved using CFD methods to calculate vascular flow patterns in the aneurysm [6,7,8]. The computational simulations can be performed before and after treatment to analyze the hemodynamic alterations due to the implantation of the devices [3]. The post-treatment hemodynamic parameters, including time-averaged inflow rate, aneurysm-averaged velocity, wall shear stress, total absolute circulation, and turnover time (the aneurysm sac volume divided by the inflow rate at the neck plane), are provided using computational fluid dynamics analysis [9]. The flow-related parameters are used to anticipate the flow diverter performance in aneurysm occlusion, and this information helps clinicians to select the optimal devices before treatment [10].
CFD studies have been conducted on aneurysm treatment using flow diverting stents. Most studies aim to identify the effects of flow-diverter placements by comparing the distribution of hemodynamic parameters in patient-specific or idealized models of cerebral aneurysms before and after treatment. The distribution of velocity, pressure, and wall shear stress has been presented to assess the potential risk of aneurysm rupture [11], evaluate the accuracy of computational fluid dynamics methods by comparing with clinical imaging results [12], or consider the effect of mechanical properties of the stent, as well as its hemodynamic performance [4]. Previous studies have illustrated that detailed knowledge of hemodynamics can be affected by stent placement, thus being critical to the prediction of treatment outcome. Some studies have focused on the simulation of the mechanical deployment of flow-diverter stents using finite element analysis to capture the clinically realistic FD deployment processes [3,13]. Some researchers have conducted stent deployment and CFD simulations simultaneously to investigate the influence of different stent deployment approaches and the location of stents on the hemodynamics of aneurysms by comparing untreated and stented vessels [9,14,15]. It is noted that the specifications of FD stents such as stent type, mesh porosity, and mesh pore density are other determining factors in the greater device efficacy, which have been considered by researchers using CFD simulations [6,8,16]. In addition to the appropriate selection of pore size and density, the device positioning against the parent artery wall remains vital. The dependency of aneurysm occlusion on the space or gap between the flow diverter and the parent artery has been considered using CFD investigations, and the results demonstrate that even a small gap causes the aneurysm to be blocked incomplete and remain permeable longer because of the jet-like blood flow through the gap into the aneurysm sac [10,16,17].
All aforementioned studies have indicated that CFD simulations can help to design better devices, and also offer clinicians insight about decision-making, personalize the treatment methods, and provide valuable information to plan stent deployment for the treatment of cerebral aneurysms. CFD is able to produce spatiotemporal results for the millions of elements of the model during an entire cardiac cycle, which are usually viewed at a single time point or time-averaged on standard 2D displays. In addition, people who did not perform the CFD analysis, for example, clinicians who would like to use the CFD data, may not intend to utilize the CFD data while there are other available visualization tools [18]. The simulation data need to be visualized in an appropriate environment to provide direct and intuitive knowledge and insight into the FD-stent treatment and its outcome. Visualization in virtual reality (VR) may be an ideal solution. Using a head-mounted display (headset), in combination with a computer system, a user is able to experience and naturally interact with a digital simulated three-dimensional (3D) digital environment, complete with images, sounds, and other sensations. The user (wearing the headset) is able to see and manipulate (move, rotate, and/or scale) objects of interest in the virtual environment. Stereoscopic 3D visualization in VR has been illustrated as a powerful, low-cost, noninvasive method for visualizing complex biological systems [19]. The CFD analysis data can be displayed in the VR environment to allow physicians to understand the complex flow patterns of blood within cerebral arteries while “taking a walk” inside the aneurysm and observing the velocity, pressure, and stress fields [7]. This is not only a useful means for neurosurgeons to assess the risk of stent treatment but is also a stimulating way for the active training of medical students and preparation of patients before their stent treatment (through education to reduce their anxiety). There are a few studies that have presented a workflow to postprocess the CFD results in a VR environment with biomedical applications. For example, an improved replacement heart valve was designed using CFD simulation to overcome time and financial constraints. The output of the simulations displayed in a virtual reality environment also included innovative 3D interfaces for interacting with the data [20]. Additionally, some workflows were developed to display biomedical CFD analysis results in the virtual environment and were tested for blood flow in arteries [21,22], congenital cardiovascular disease, the Circle of Willis with respect to cerebral aneurysms, the airway for surgical treatment planning [18], and percutaneous coronary intervention [23]. The results from all these studies suggest that VR immersion significantly improves the accuracy of the placement of the simulated medical devices in complex arterial geometries, relative to traditional display methods with no immersion.
Considering the extensive applications of CFD for biomedical purposes, the number of CFD-VR studies, especially related to stented aneurysms, is limited. Additionally, most previous CFD-VR studies have presented complicated workflows and relied on the use of the CAVE (Cave Automatic Virtual Environment), a multi-walled immersive environment that can be financially burdensome to construct. Finally, commercial software has been developed that allows the visualization of simulated data in a VR environment such as Simcenter STAR-CCM+ Virtual Reality [24]; however, this type of software may require an enterprise license for its use. Therefore, a straightforward method to visualize CFD data in a VR environment with high resolution and low cost could prove to be a valuable tool for biomedical research.
In this regard, the current research aimed to first present a complete CFD-VR workflow that is able to obtain the output files of both licensed and open-source CFD software and use the open-source visualization software to render the objects and create animations in a VR environment. Only a low-cost VR headset and a desktop computer with a VR-capable graphics card are required. Second, the flow behavior in a sidewall-type saccular aneurysm was simulated numerically for pre/past stenting and the results were displayed in a VR environment using the presented workflow as screenshots and animations.
2. Materials and Methods
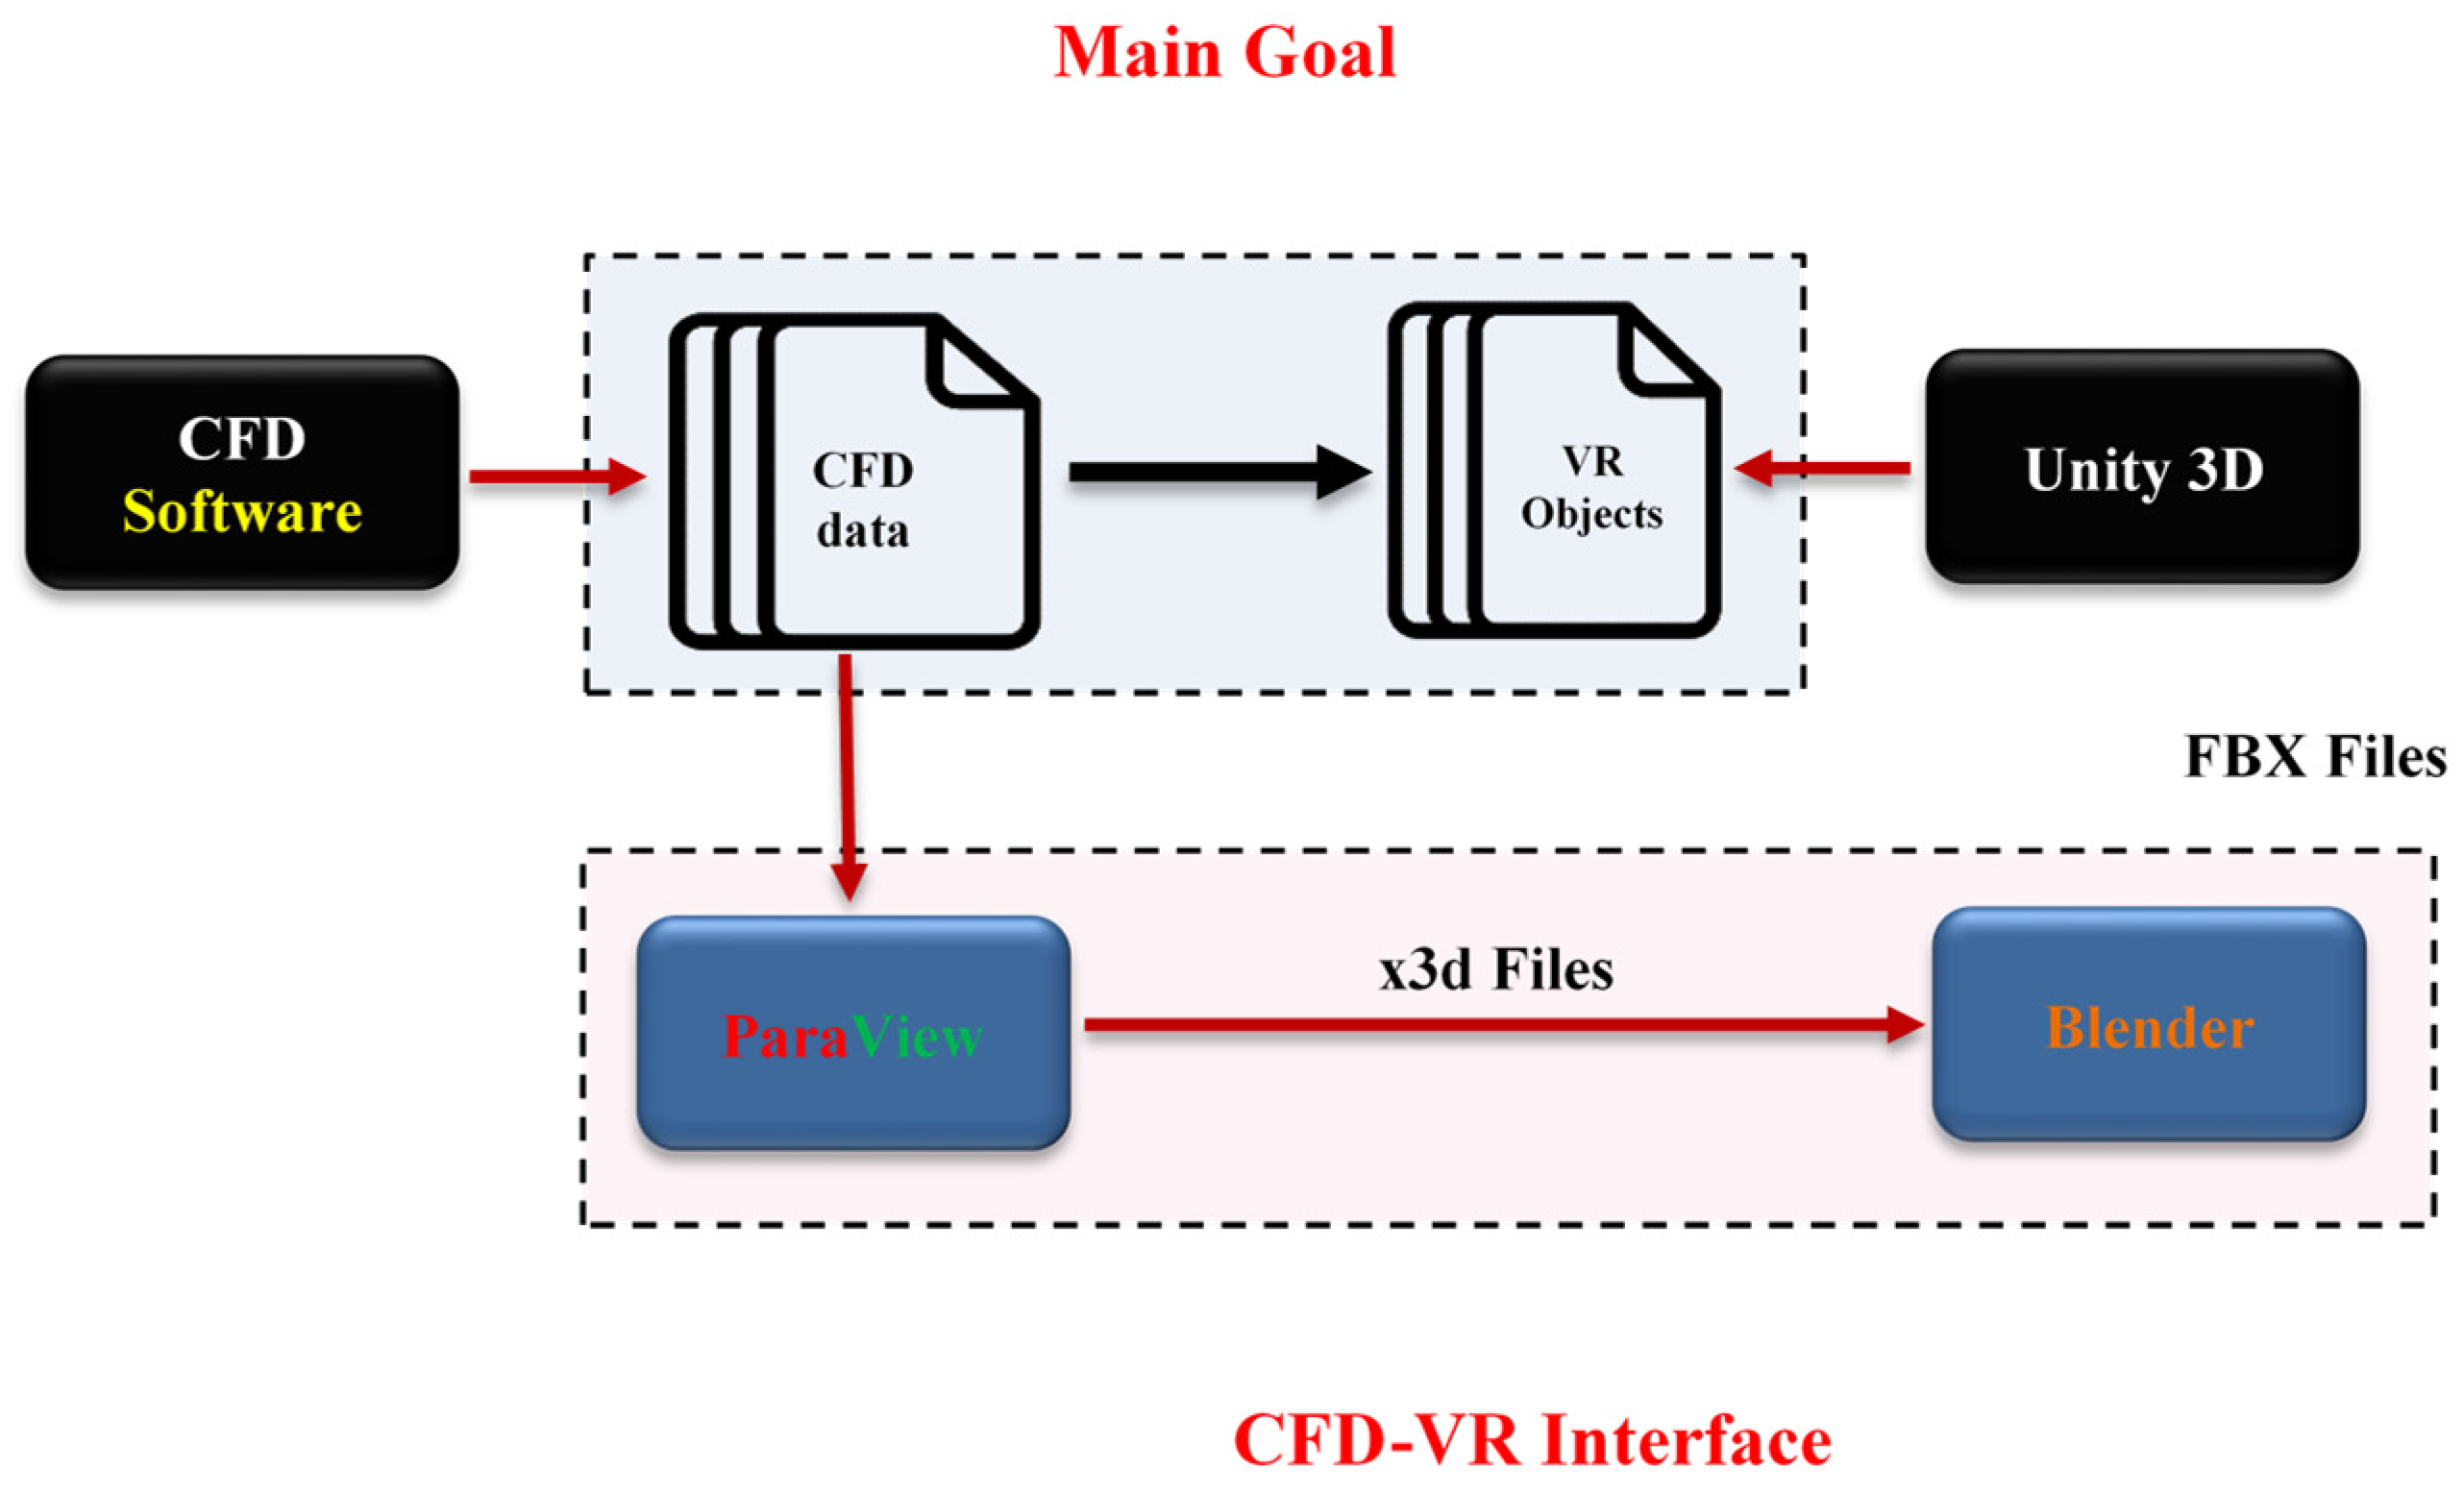
The general workflow for the VR environment visualization is illustrated in Figure 1. It is obvious that the main goal (the blue box) was to convert the CFD-produced data into a visual representation that is compatible with the VR environment. In order to achieve this, the CFD-VR interface (the pink box), including intermediate steps, was developed. The required steps, including “obtaining CFD analysis data,” “developing CFD-VR interface,” and “Displaying the CFD data in VR environment,” are explained in more detail as follows.
2.1. CFD Modeling and Simulation
2.1.1. Generating the 3D Model of Geometry and the Volume Grid
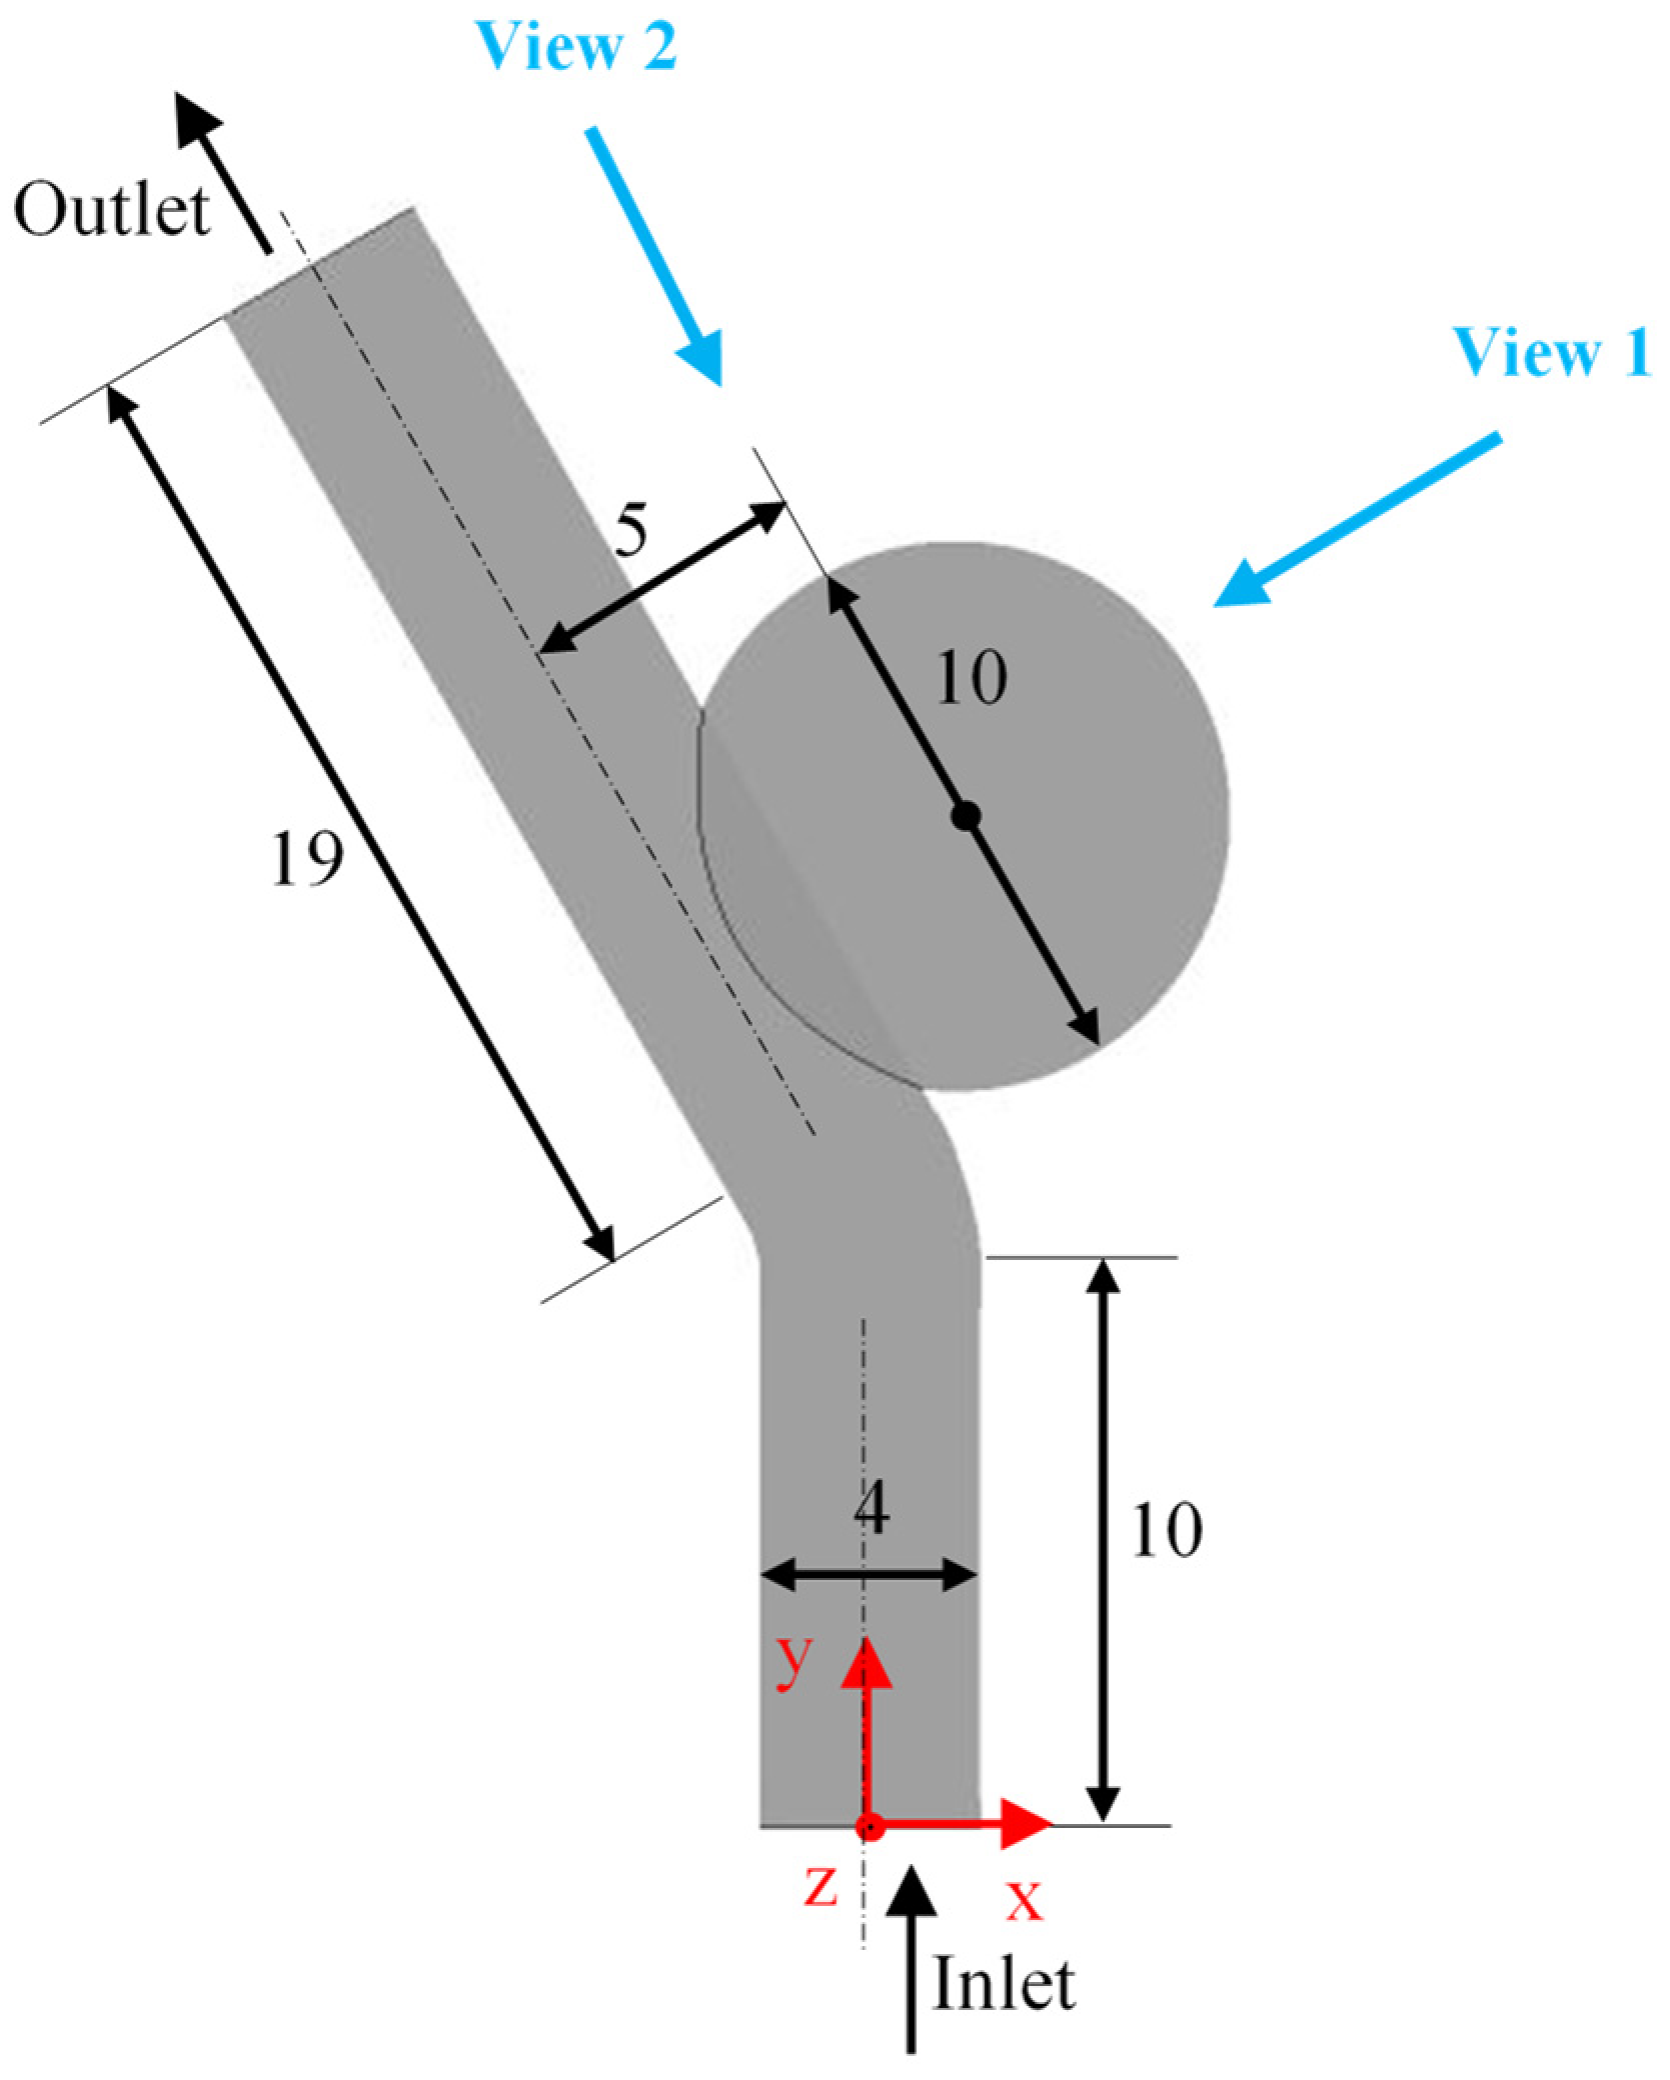
In the current study, a simplified geometry of an aneurysm located at the internal carotid artery was selected, because the flow diverters are more suitable for the treatment of these kinds of aneurysms. The simplified geometries with a straight parent artery give unrealistic results; therefore, adding an inclined section to the parent artery causes the velocity vector to have other components while turning in the bend, and enough flow enters the aneurysm as happens in real cases [4]. The schematic geometry is illustrated in Figure 2. The origin of the Cartesian coordinate system is located at the center of the inlet cross-section, so the mid-plane of the parent artery is located at z = 0. The diameters of the parent artery and aneurysm sac, and the spacing between the centerline of the inclined part and center of the aneurysm sphere are 4 mm, 10 mm, and 5 mm, respectively. More details about the dimensions can be found in reference [4]. Views 1 and 2, illustrated in Figure 2, are used for exploring the flow during navigation in the VR environment.
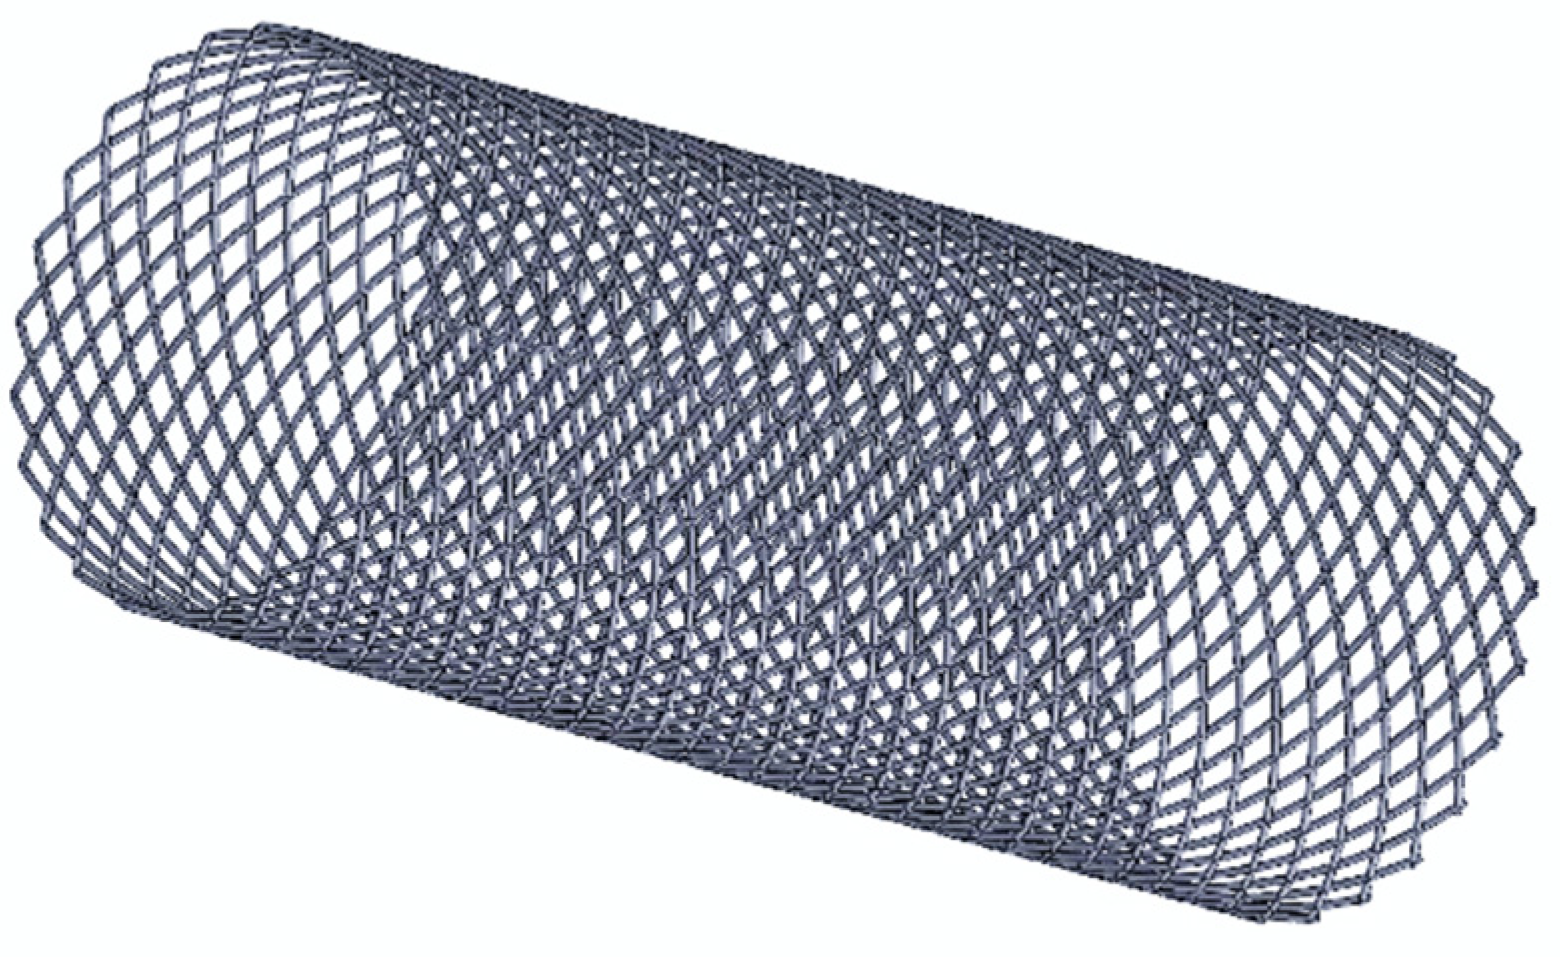
Figure 3 shows the generated 3D solid model of the braided stent with a length of 10 mm, where an intracranial aneurysm flow diverter by Covidien (Irvine) was selected [25]. The stent has a single wire thickness and is braided as per the study [13]. The strand thickness, external diameter, weave angle, and porosity of stent are 0.05 mm, 4 mm, 31.98°, and 66.44%, respectively. In the current study, the number of stent wires was halved to 12 to display the phenomena in the VR environment much clearer.
According to the study [26], instead of the whole stent, only the portion that was located at the aneurysm neck was used in numerical simulations for reduced computational time while having no considerable deviation from the flow behavior obtained with the full stent models. By doing so, the stent geometry was simplified, as shown in Figure 4. It is known that the positioning of the stent plays a major role in the effective treatment of the aneurysm. One of these positioning issues is related to the gap between the flow diverter and the parent artery wall that may create unfavorable conditions and increase the flow into the aneurysm. In order to investigate this effect, two cases were studied, the case with a 0.03 mm wall–stent gap, named “With-Stent1,” and the case named “With-Stent2” for which the gap has been clogged by a wall.
Seven slices were created as some important locations to report the contours of scalar variables, and they are illustrated in Figure 4. Slice 1 is located on the mid-plane of the geometry at z = 0, whiles Slices 2–6 are perpendicular to the artery wall. The equal-spaced slices of 3, 4, and 5 intersect the aneurysm, while slice 4 passes through the center of the aneurysm sphere. Slice 7 is parallel to the axis of the inclined artery and close enough to the artery–aneurysm interface to cover the near-neck phenomena.
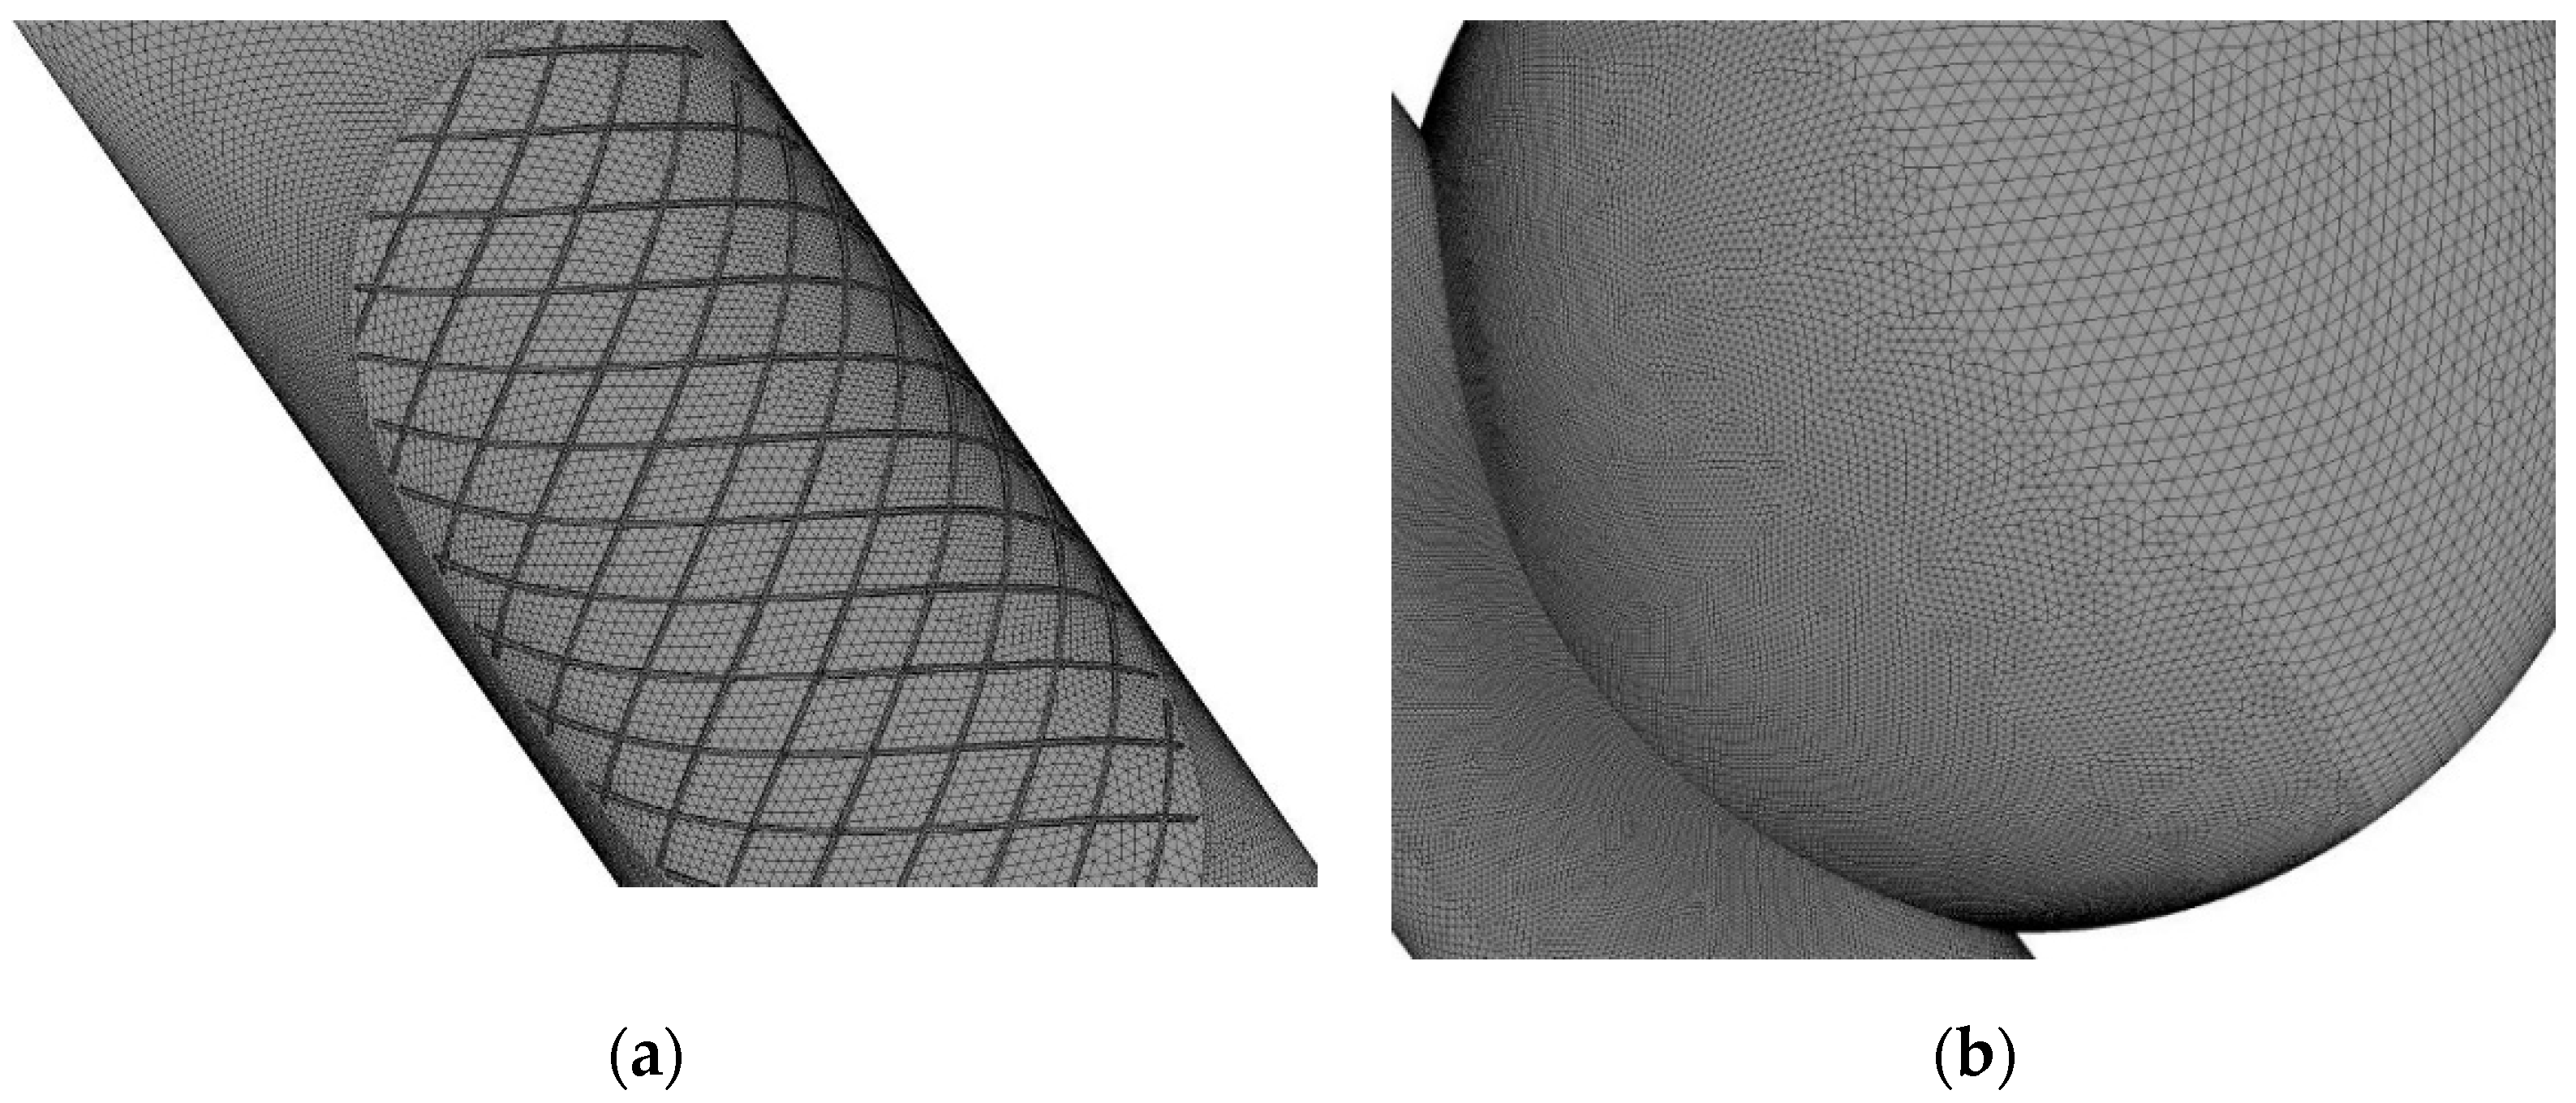
All geometries were generated in SOLIDWORKS, CAD software. The grids were generated using the ANSYS ICEM CFD software package. A nonuniform tetrahedral mesh was generated with a much finer grid close to the aneurysm neck and the wires of the stent. The number of grid elements ranged from 500,000 to 2,500,000 and were generated based on the grid independency test, and a compromise between the accuracy and computation time. The time step was 0.01 s. An example of the generated grid can be seen in Figure 5.
2.1.2. Determination of Governing Equations, and Initial and Boundary Conditions
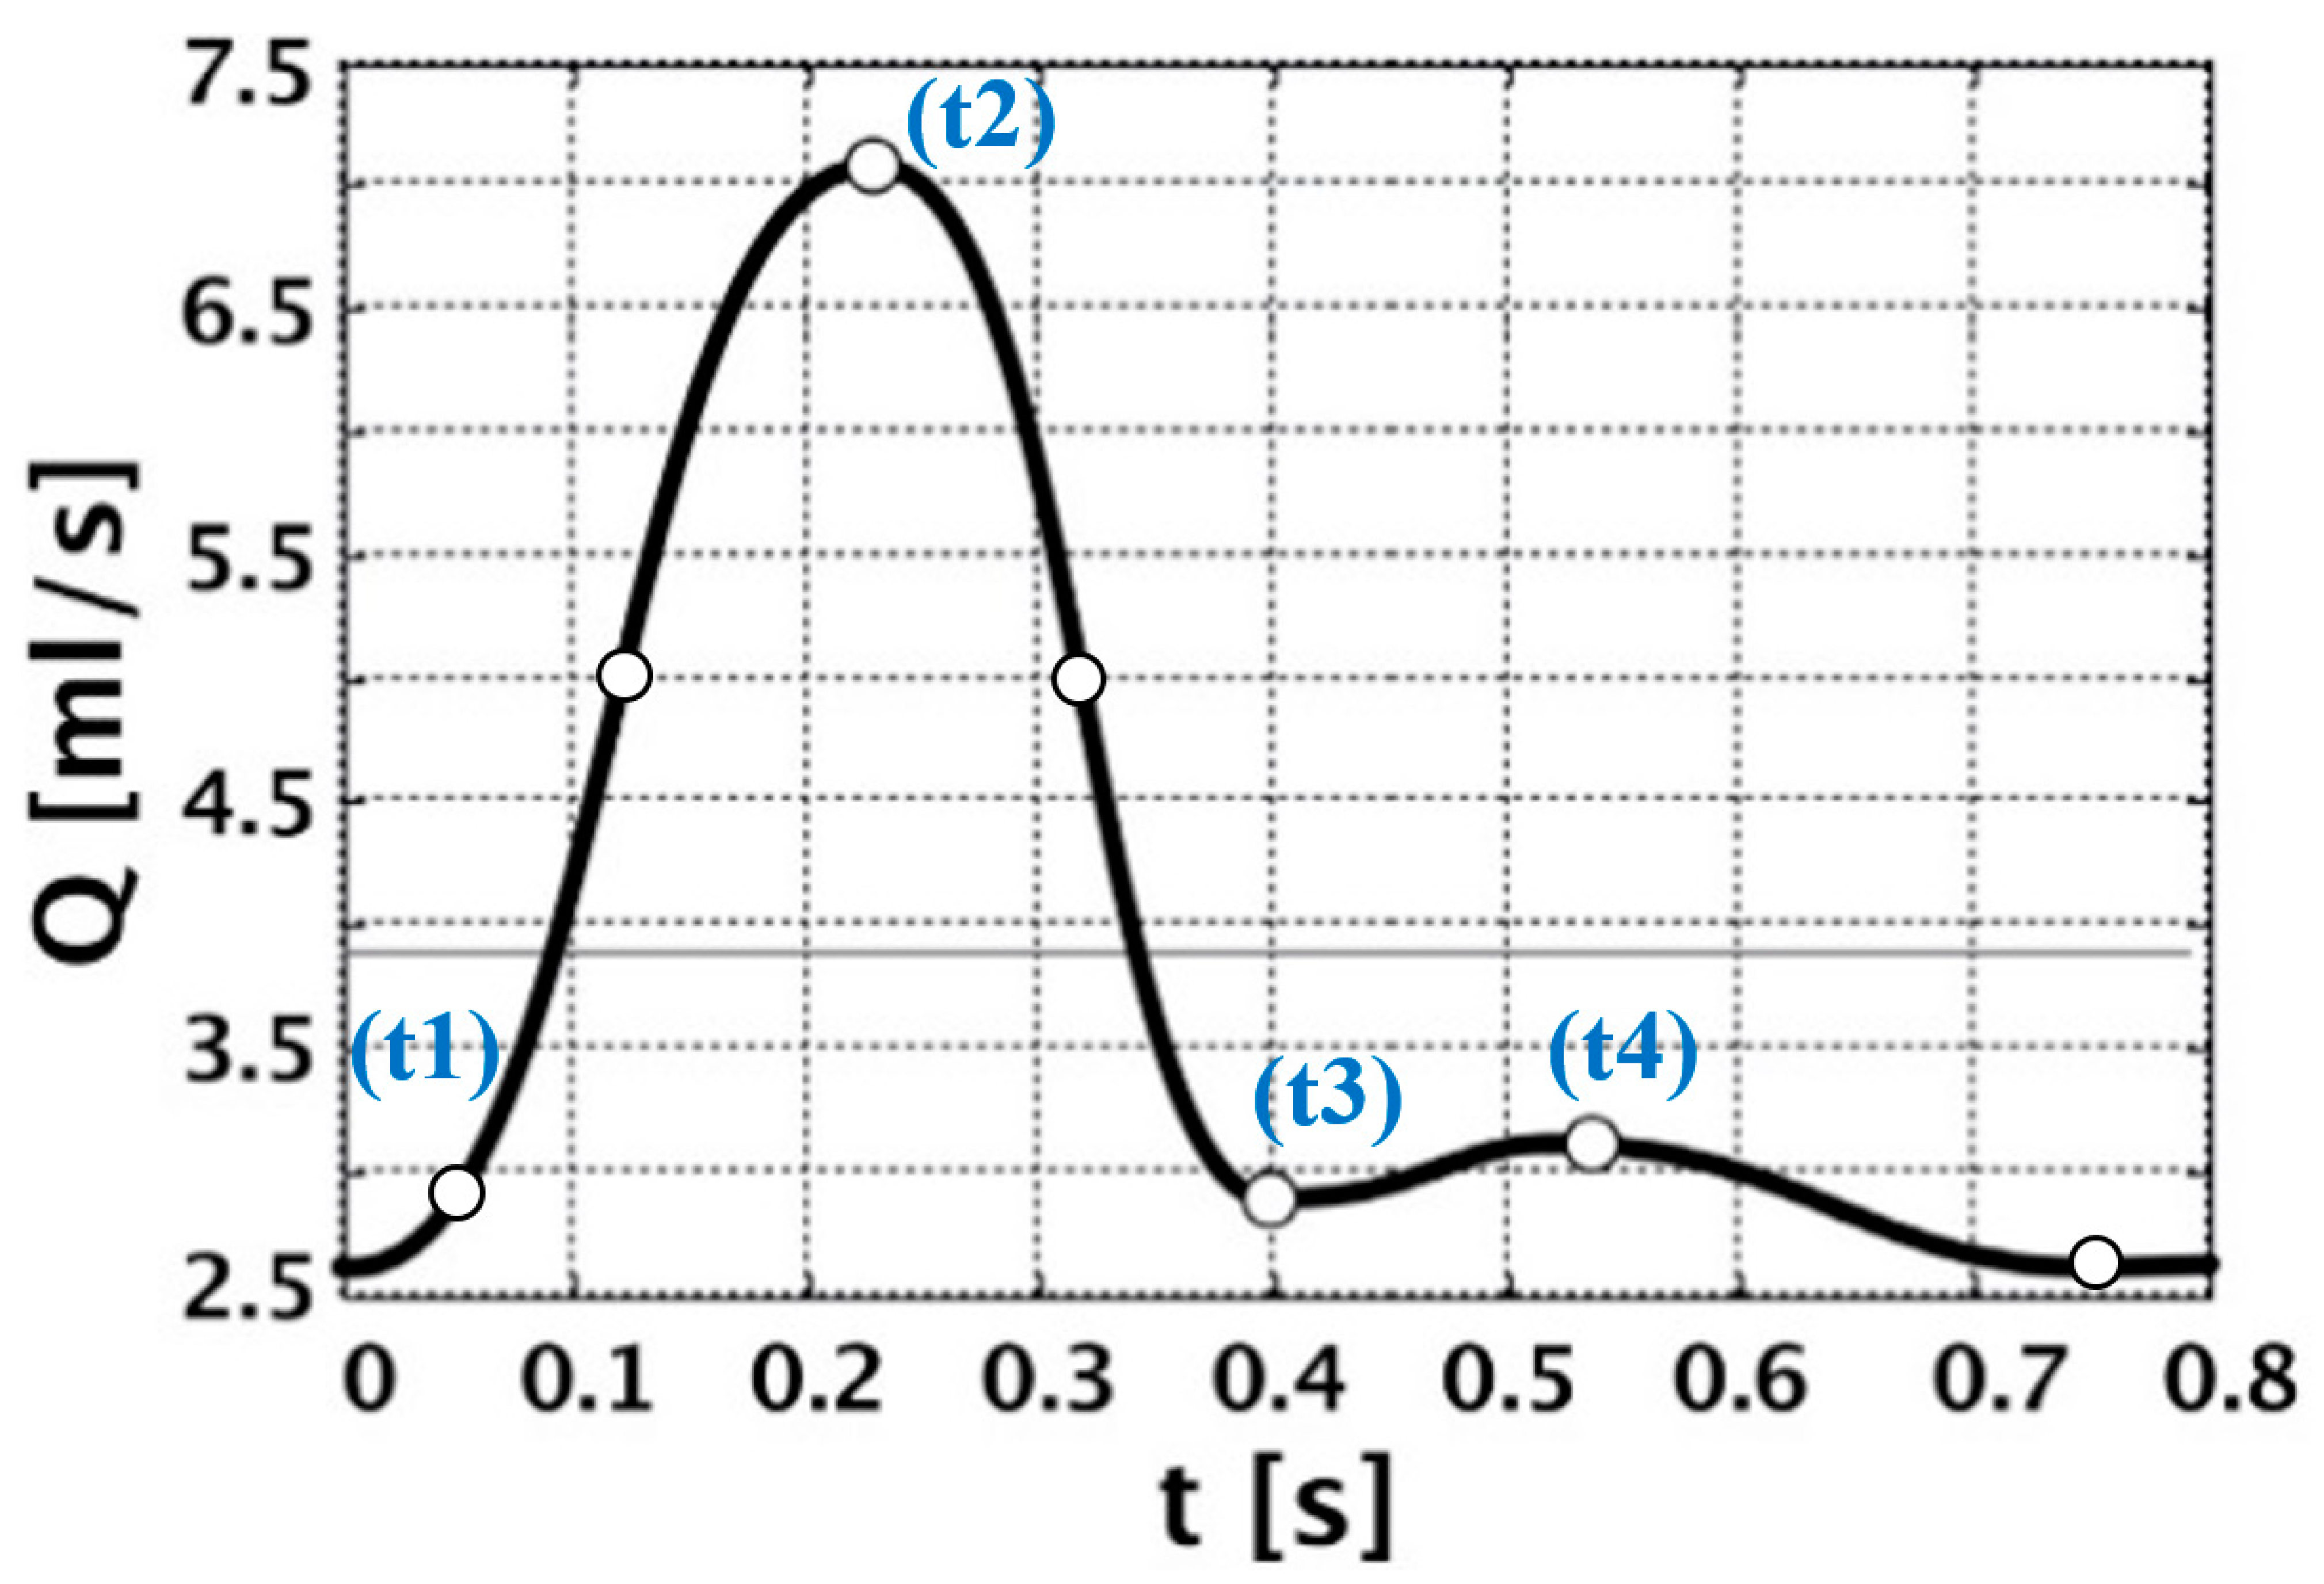
The unsteady pulsatile flow rate at the inlet of the artery was imposed based on the idealized cardiac cycle with a period of 0.8 s ([27,28]) and is shown in Figure 6, with four time points numbered t1–t4 to report the CFD and VR post-processed results. A constant pressure outlet boundary condition was applied on the outlet surface and all walls were considered rigid with no-slip boundary conditions. Unsteady simulations were initialized with the end-diastolic flow rate, and two cardiac cycles were simulated. All results are presented for the second cycle to diminish the effect of initial conditions.
2.1.3. Performing CFD Simulation
The equations governing the laminar three-dimensional unsteady incompressible Newtonian flow of blood in the artery without body force terms are the continuity one, Equation (1), and the Navier–Stokes one, Equation (2):
where is the velocity vector, is pressure, and and are fluid density and dynamic viscosity, respectively. The blood was modeled as a Newtonian fluid with a density of 1100 kg/m3 and viscosity of 0.0036 Pa.s [4].
To quantify the hemodynamic alterations due to stenting, time-averaged wall shear stress magnitude, time-averaged kinetic energy, i.e., (u2 + v2 + w2), in the aneurysm sac, and turnover time defined as the aneurysm sac volume divided by the inflow rate at the neck plane were selected to draw a comparison between treated and untreated aneurysms. The dimensionless pressure was defined as the ratio of pressure to the time-averaged pressure on the inlet section, and it was used in the VR postprocessing of point clouds.
These equations were solved using ANSYS CFX, a finite-volume-based solver. Advection fluxes were evaluated using a second-order accurate and bounded high-resolution scheme. For time derivatives, an implicit second-order accurate time differencing scheme was used. Computational fluid dynamics simulation and VR visualizations were conducted using a desktop PC with an i9-9900 CPU @ 3.1 GHz, 32 GB of RAM, NVIDIA Quadro RTX 4000 GPU, and OS Windows 10 Pro 64-bit.
2.2. Development of CFD-VR Interface
2.2.1. Exporting CFD Analysis Data to ParaView
ParaView is an open-source multiple-platform application for interactive, scientific visualization [29]. ParaView 5.8.0 was used in the current research to postprocess the CFD data. “Ensight gold” is the best format to export CFD results from ANSYS CFX-Solver to ParaView.
2.2.2. Adding Filters to Make Flow Elements
The CFD-produced data are stored on millions of nodes and manipulating this volume of data is impossible. The major role of ParaView is converting the node-based data to 3D graphics information by adding different filters. Five sets of flow elements including velocity vectors, contours, streamlines, particle traces, and point clouds, all located inside vessel walls, were extracted from CFD analysis data to be visualized in the virtual reality environment. As an indication of risk of aneurysm rupture, wall shear stress distribution was selected to color the parent artery, aneurysm, and stent walls.
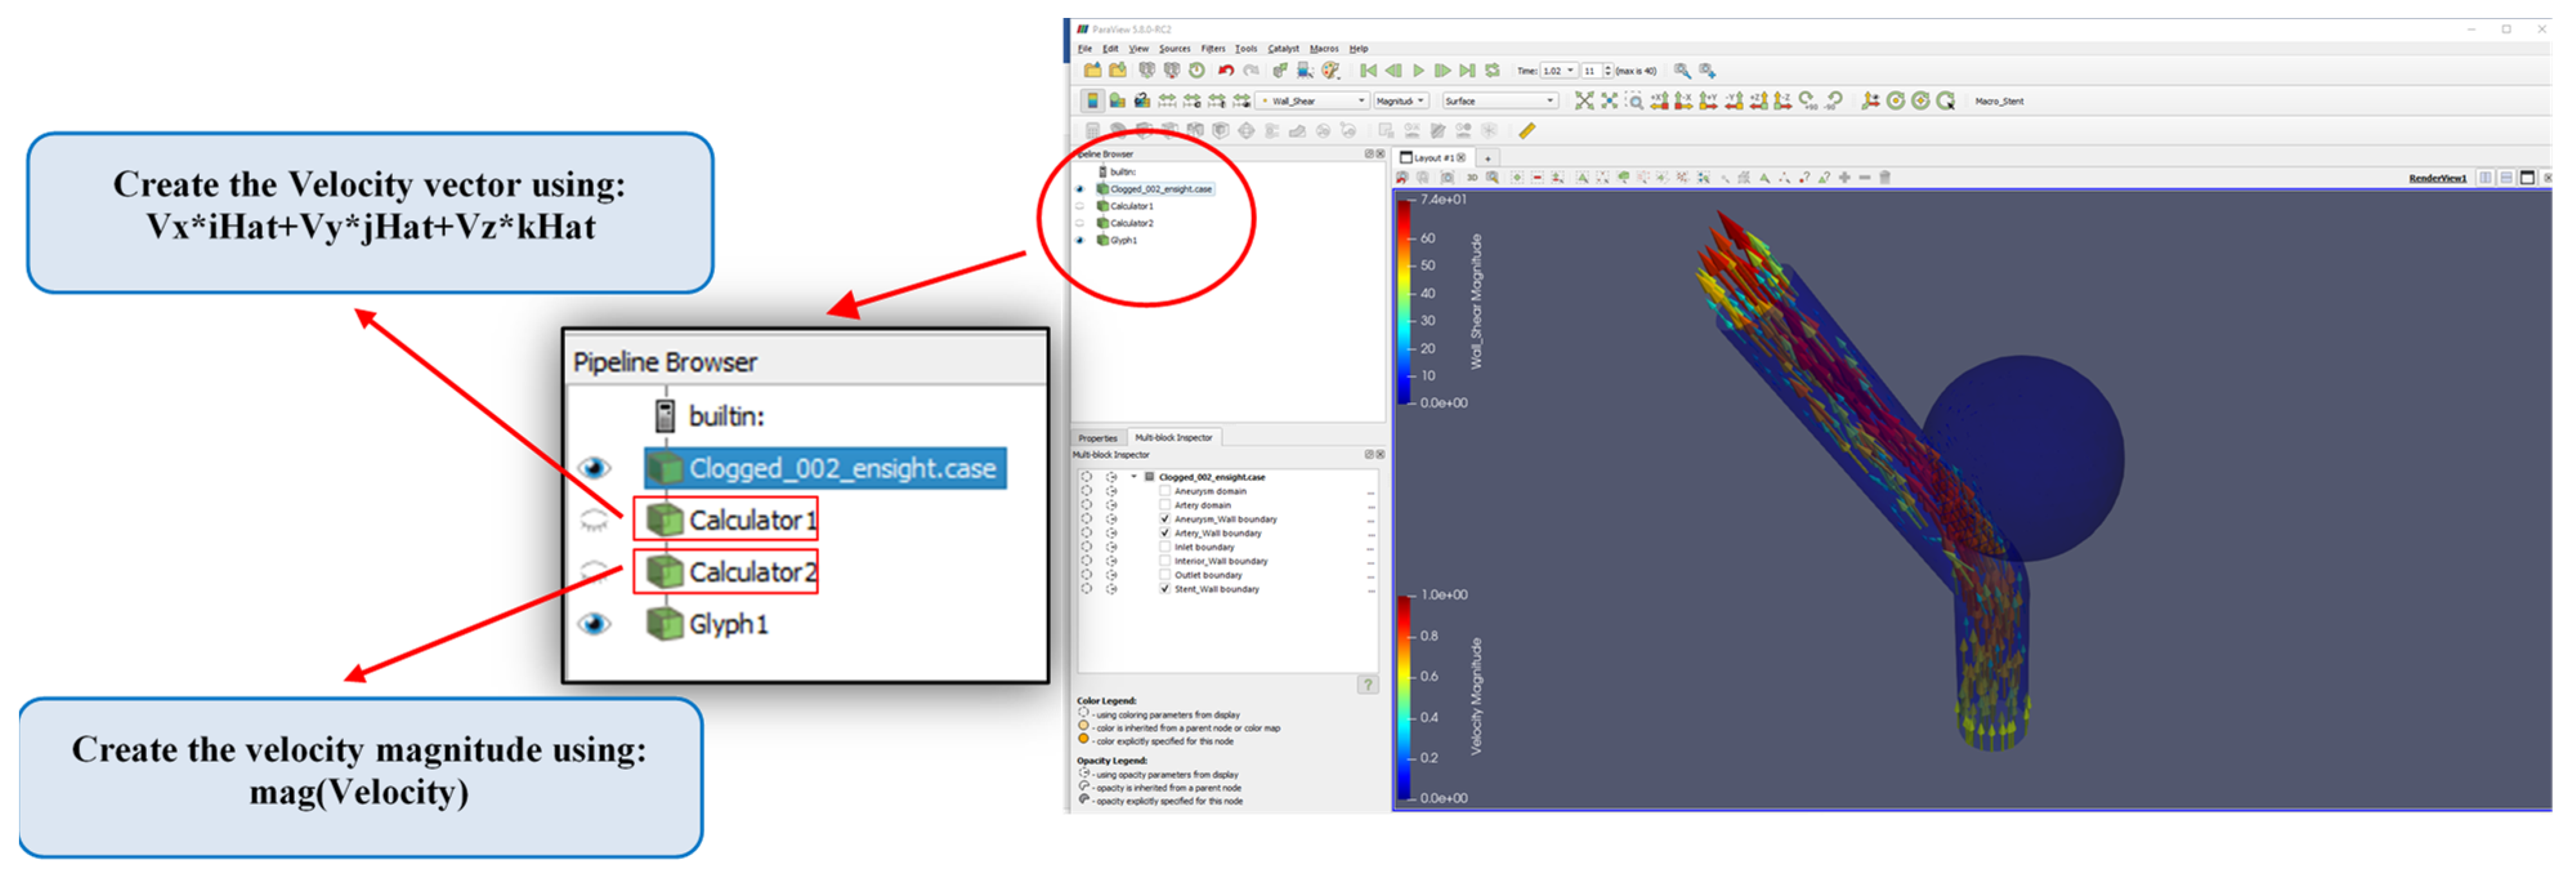
Figure 7 shows the velocity vectors inside the artery walls—colored by wall shear stress—in the ParaView viewport. The order of filters can be found in the Pipeline Browser. The calculator filters were used to color the velocity vectors by velocity magnitude.
Similar filters were added to create the other fluid elements. To display the streamlines in the ParaView viewport, the points on the inlet surface were extracted and used as the source of the StreamTracer filter.
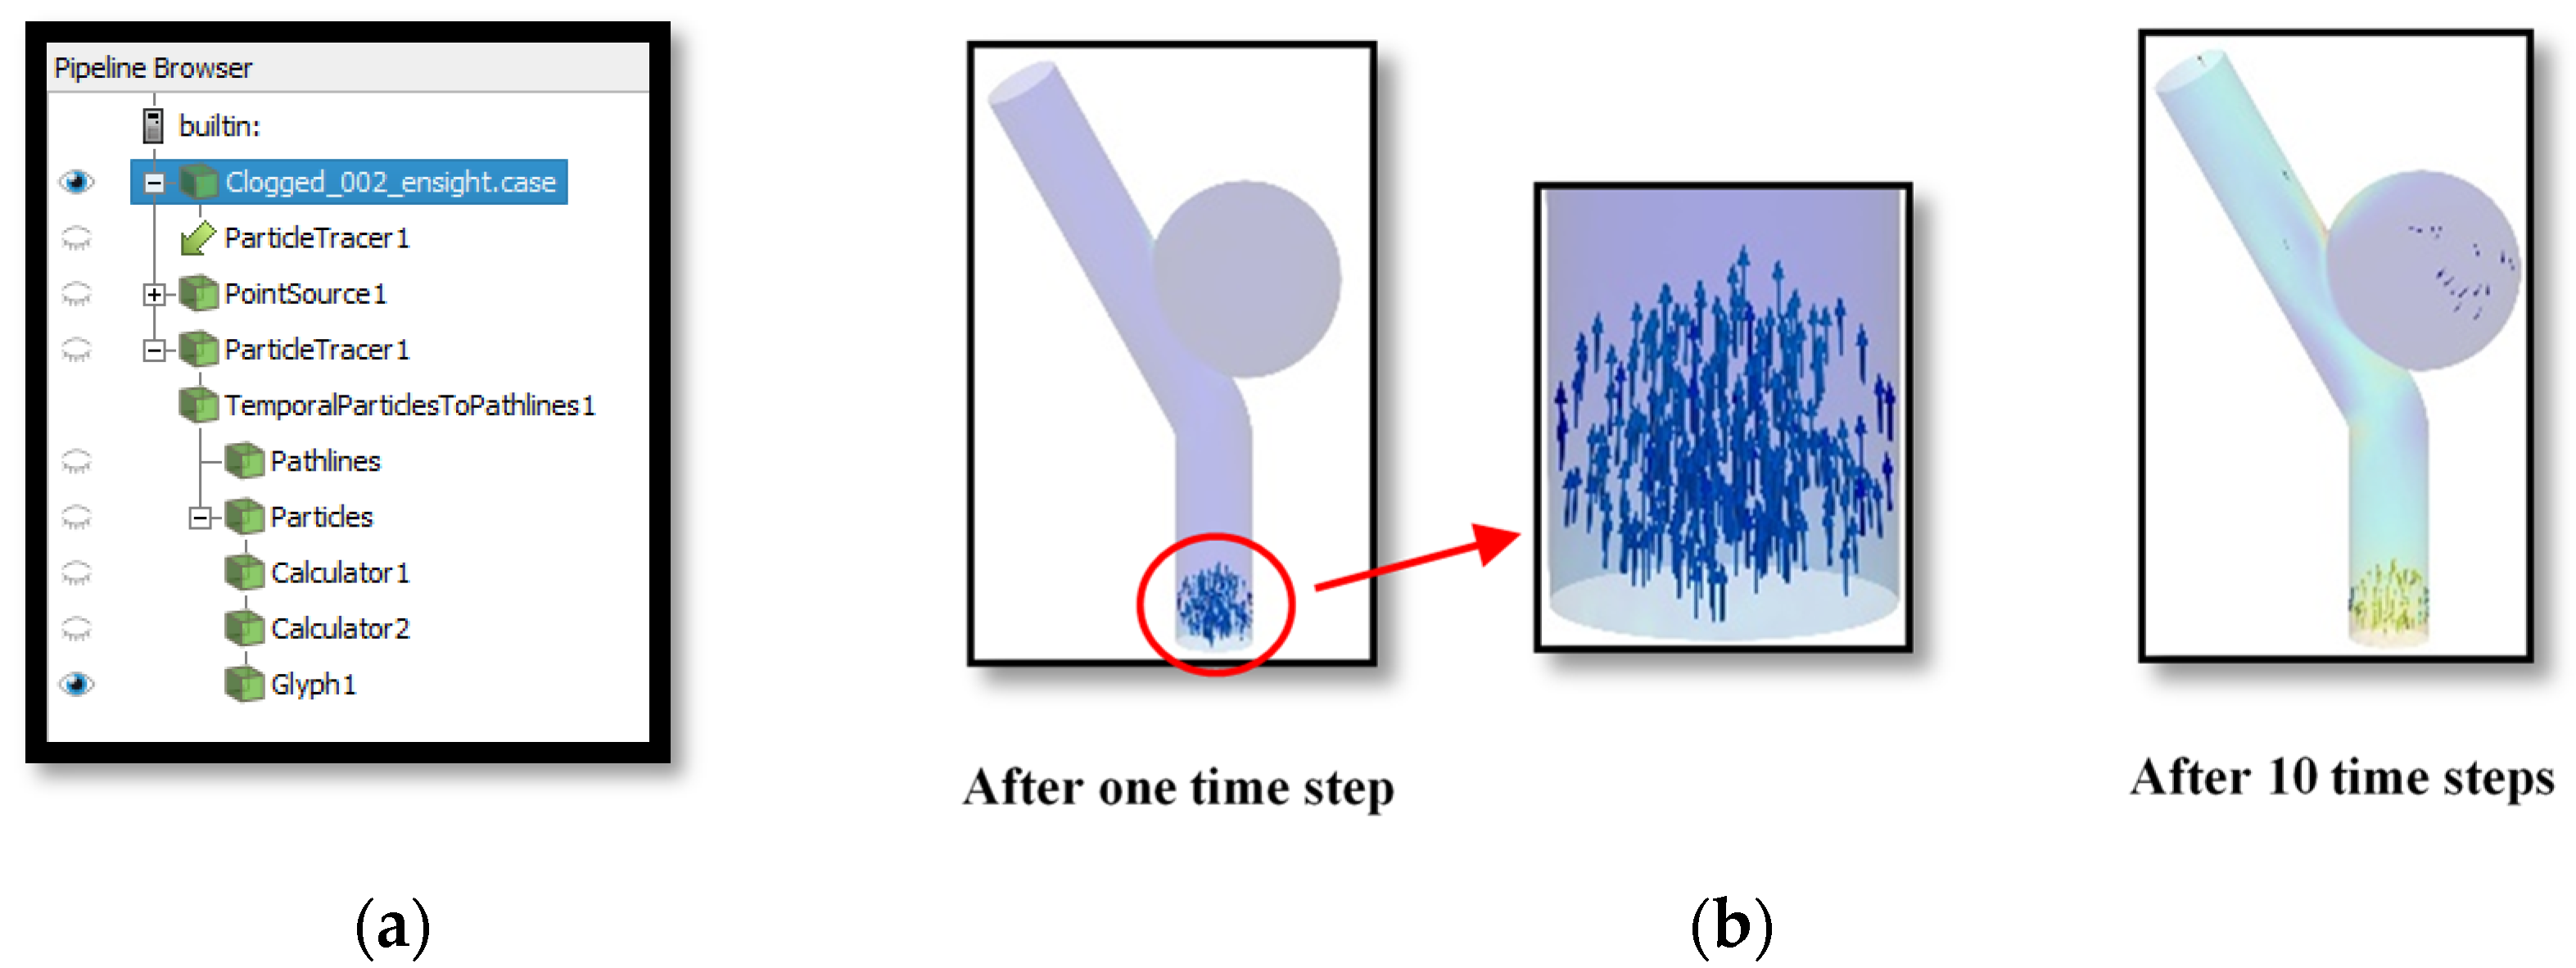
The animation of fluid particle trace is a beneficial tool to explore the fluid path during the cardiac cycle. As the point source of the ParticleTtracer filter, 300 points were distributed randomly, 1.5 mm above the inlet surface, and entered every 5 time steps, repetitively. The glyph arrow type was added to the particles to show the change in flow direction more clearly inside the aneurysm with and without stenting. The ParticleTracer filter and created particles can be seen in Figure 8.
2.2.3. Exporting the 3D Fluid Elements to Blender
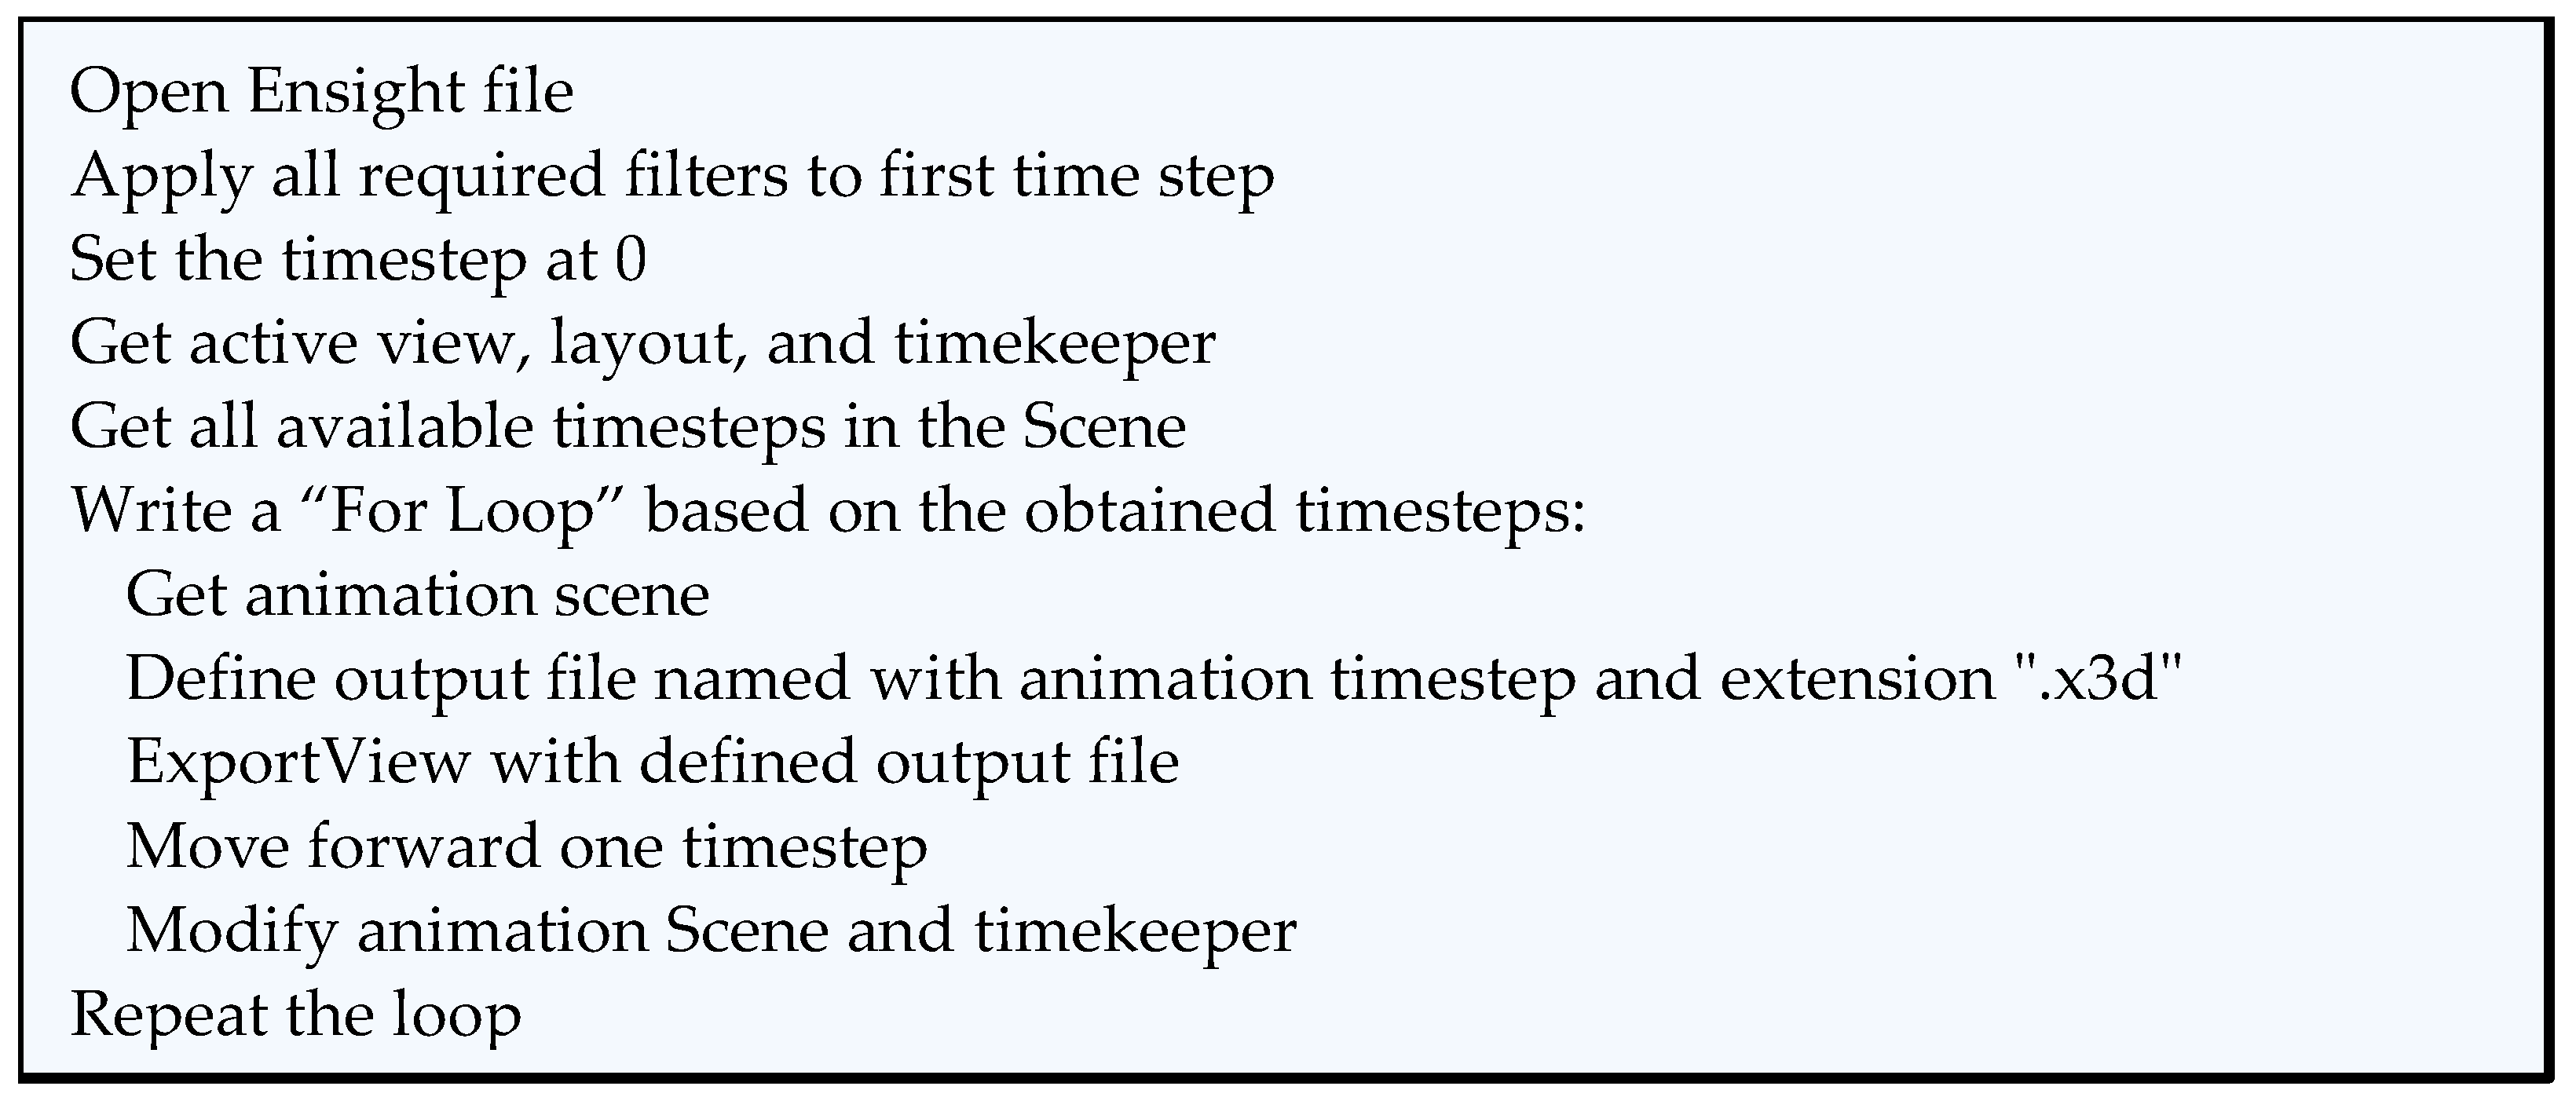
The created scenes for fluid elements in Paraview were exported to Blender [30] for coloring adjustments as a x3d file format. The blood flow in the aneurysm is unsteady; therefore, a macro was written in Python to be added and run in ParaView, and to convert the results of each time step to x3d files, automatically. The algorithm is shown in Figure 9.
2.2.4. Adjustment of Object’s Properties in Blender and Exporting Them to Unity
2.3. Displaying the CFD Data in the VR Environment
2.3.1. Adjustment of Coloring and Making Animation in Unity
To visualize the CFD data in the VR environment, the Unity software engine 2019.3.10f1 release was used. As mentioned in Section 2.2.4, for every flow element, a collection of FBX files is generated using Blender due to the unsteady behavior of blood flow. These files are used to make the animation of flow elements in Unity. The FBX files are saved in a separate folder and located in the Assets folder, while other auxiliary images such as coloring legend tables need saving in the Resources folder and are loaded as sprites.
It needs to be mentioned that the CFD numeric data are saved in the vertices and colors are stored in the vertex colors of the mesh so the shaded colors adjusted in Blender are missing when the objects are imported to Unity. To display CFD data coloring in the Unity platform, these data were associated with RGB values by writing a custom vertex color shader (in C#) to recognize the vertex color. By adding this script as a component to the materials of objects, the complete CFD results can be displayed in the Unity scene environment.
A series of C# scripts were programmed and, depending on the user’s selection, FBX files were loaded sequentially and make an animation. A new frame was imported each time step and the previous frame was destroyed. The algorithm of color adjusting and animation making is shown in Figure 12.
2.3.2. Visualization of 3D Objects in VR Environment
After adding the script components to the objects, creating the required user interface (UI) menu, adjusting the OVRPlayer Controller, and lights, the headset is worn and the results can be seen in the VR environment by running the Unity application. The VR headset used in the current study was an Oculus Quest standalone VR headset with six degrees of freedom. Animations and screenshots were captured using OculusMirror and open broadcaster software OBS Studio 26.1.1. The visualization was customized by designing a menu for users to select the desired flow element with or without stenting. The designed UI menu is displayed in Figure 13. By clicking the desired button, the animation plays and can also be paused, resumed, and restarted. Afterward, the user can navigate through the VR environment for detailed explorations.
3. Results and Discussion
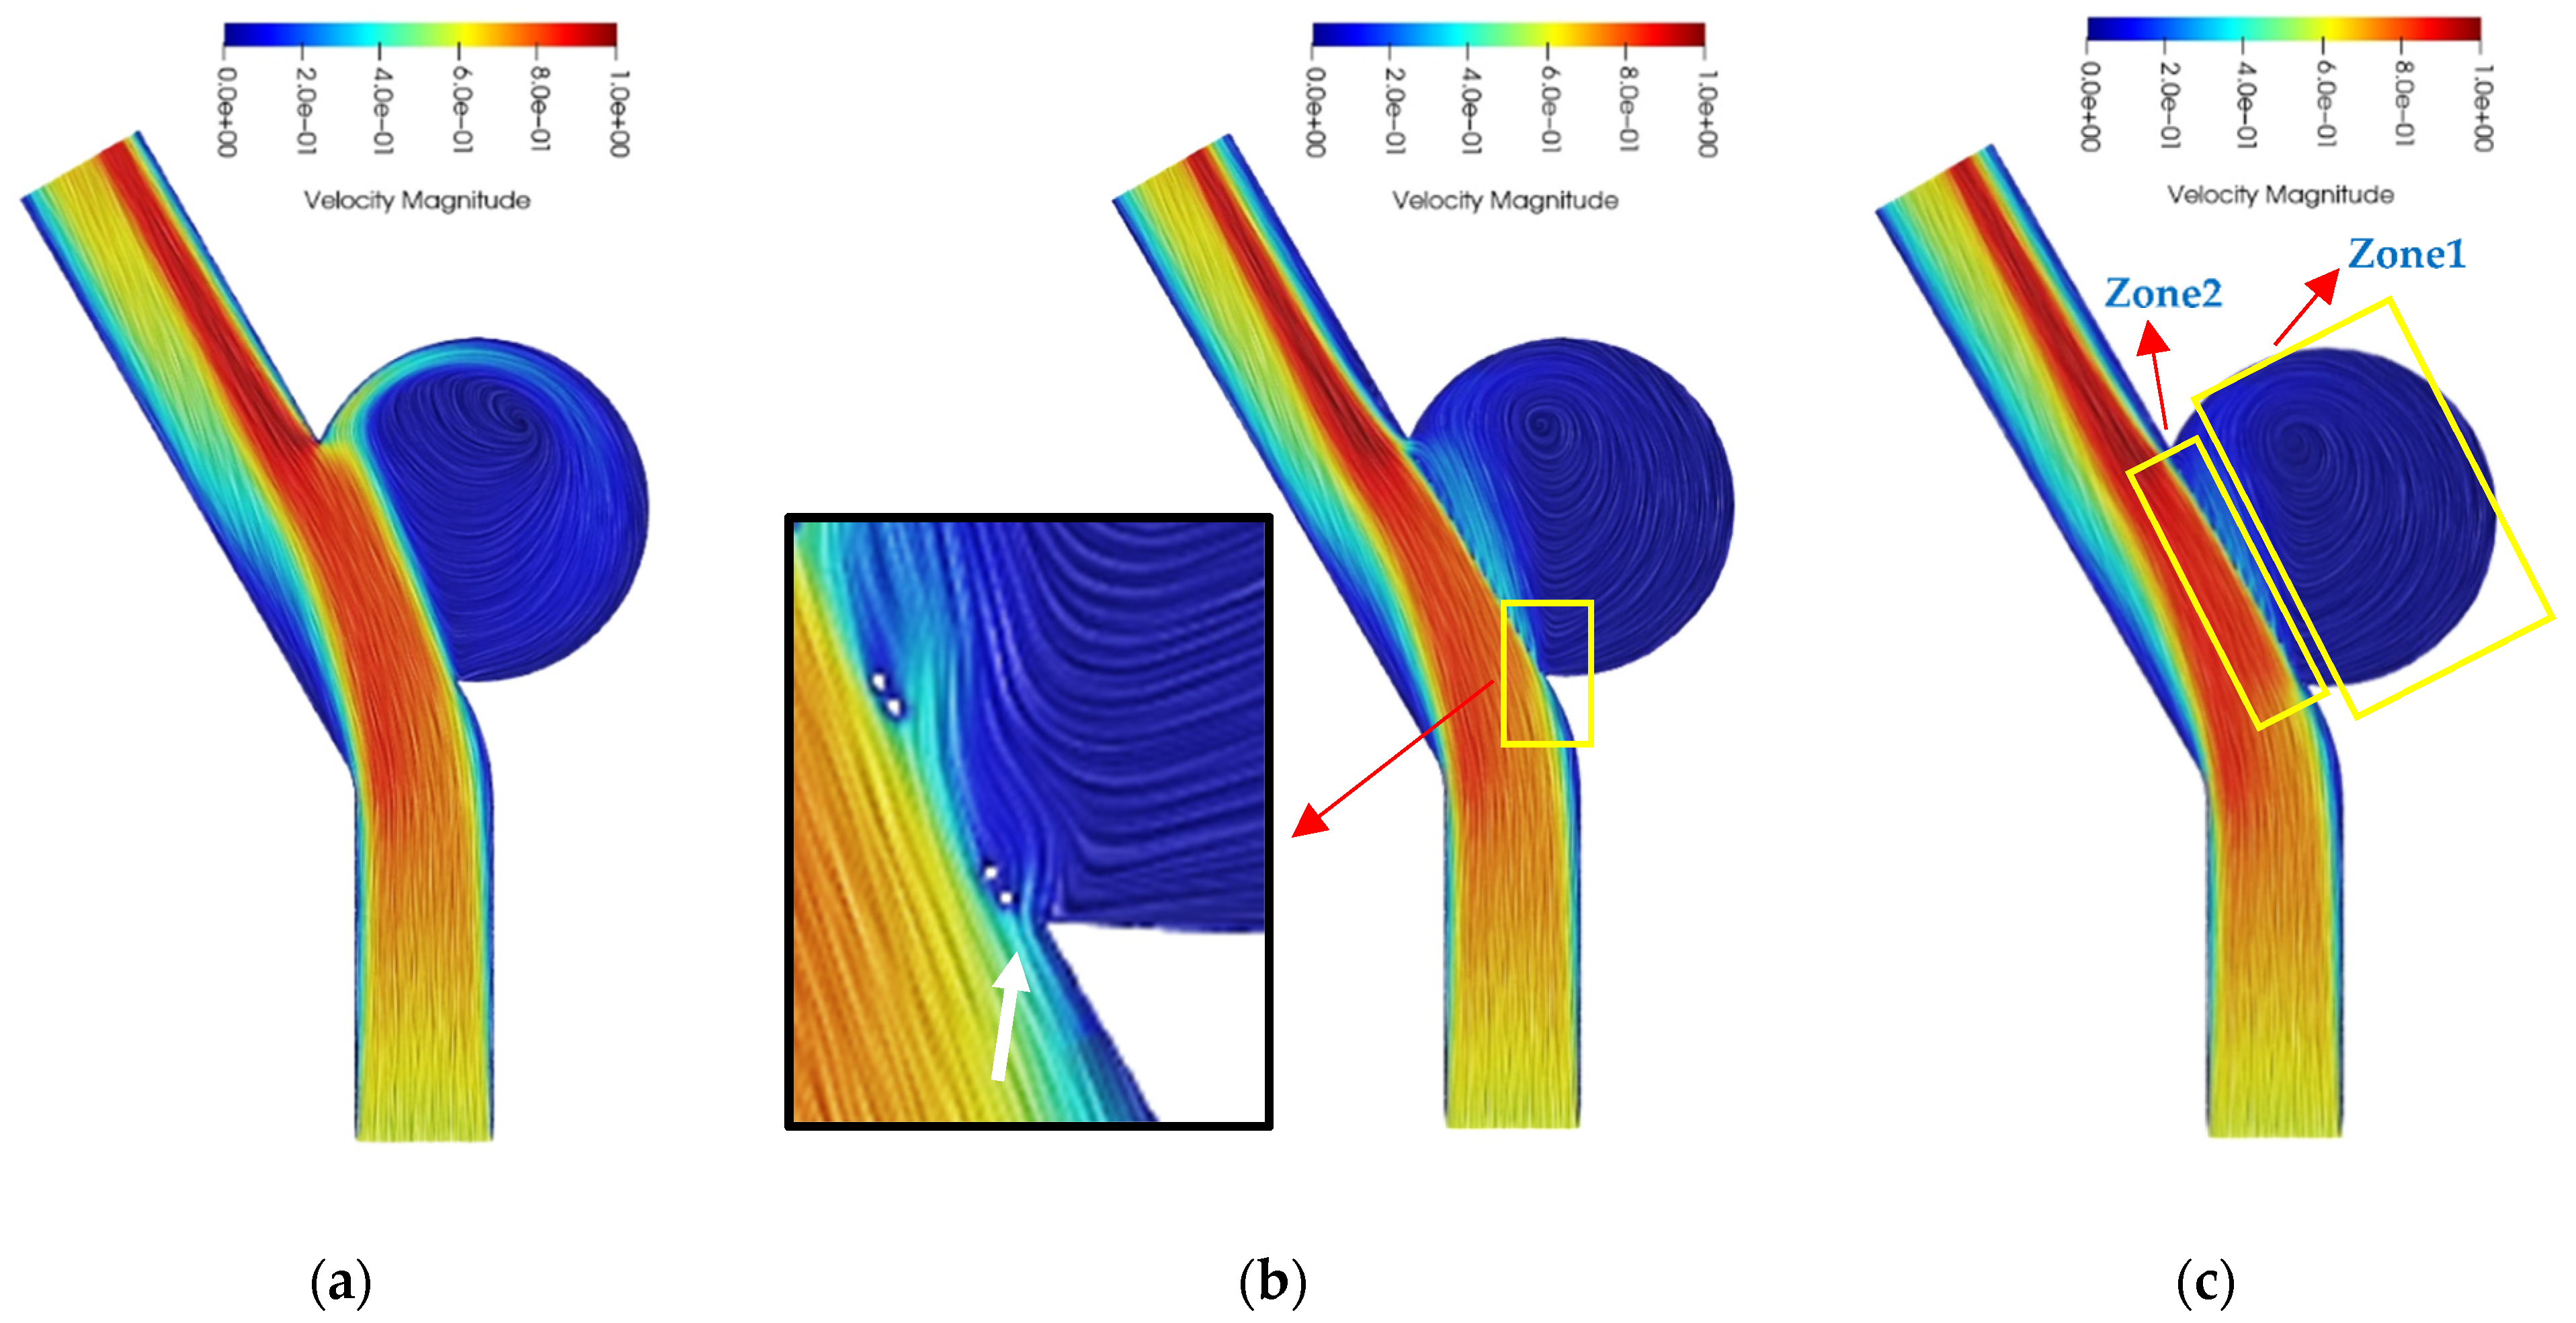
Results are presented in both the traditional post-processing and virtual reality environment to show the interactive accessibility of VR visualization in this section. The velocity magnitude contours with streaking patterns (that follow vector field tangents) are illustrated in Figure 14 on Slice 1 at t = t2, the peak of systolic flow, for the cases of Without-stent, With-stent1, and With-sent2.
The flow pattern for the untreated aneurysm shows that the flow starts to enter the sac after the proximal edge of the neck and continues toward the distal edge. The inflow impinges to the sac wall close to the distal neck, rotates inside the sac, and exits the aneurysm at the proximal neck; therefore, a single large vortex is created within the sac (Figure 14a). Due to the placement of the stent across the aneurysm neck, the whole inlet flow enters from the proximal neck for stented cases and then the flow breaks up to the flow swirling around the sac (Figure 14c, Zone1), and the flow is restricted to the neck region and leaves the sac from the distal neck region directly (Figure 14c, Zone2). The size of Zone2 is smaller for the With-stent2 case because of the lower inflow rate into the aneurysm. Figure 14b shows the effect of a small gap between the stent and the artery wall. An inflow jet in the proximal neck edge is created due to the presence of the gap, so this aneurysm feeding increases the flow into the sac and slows down the thrombosis process.
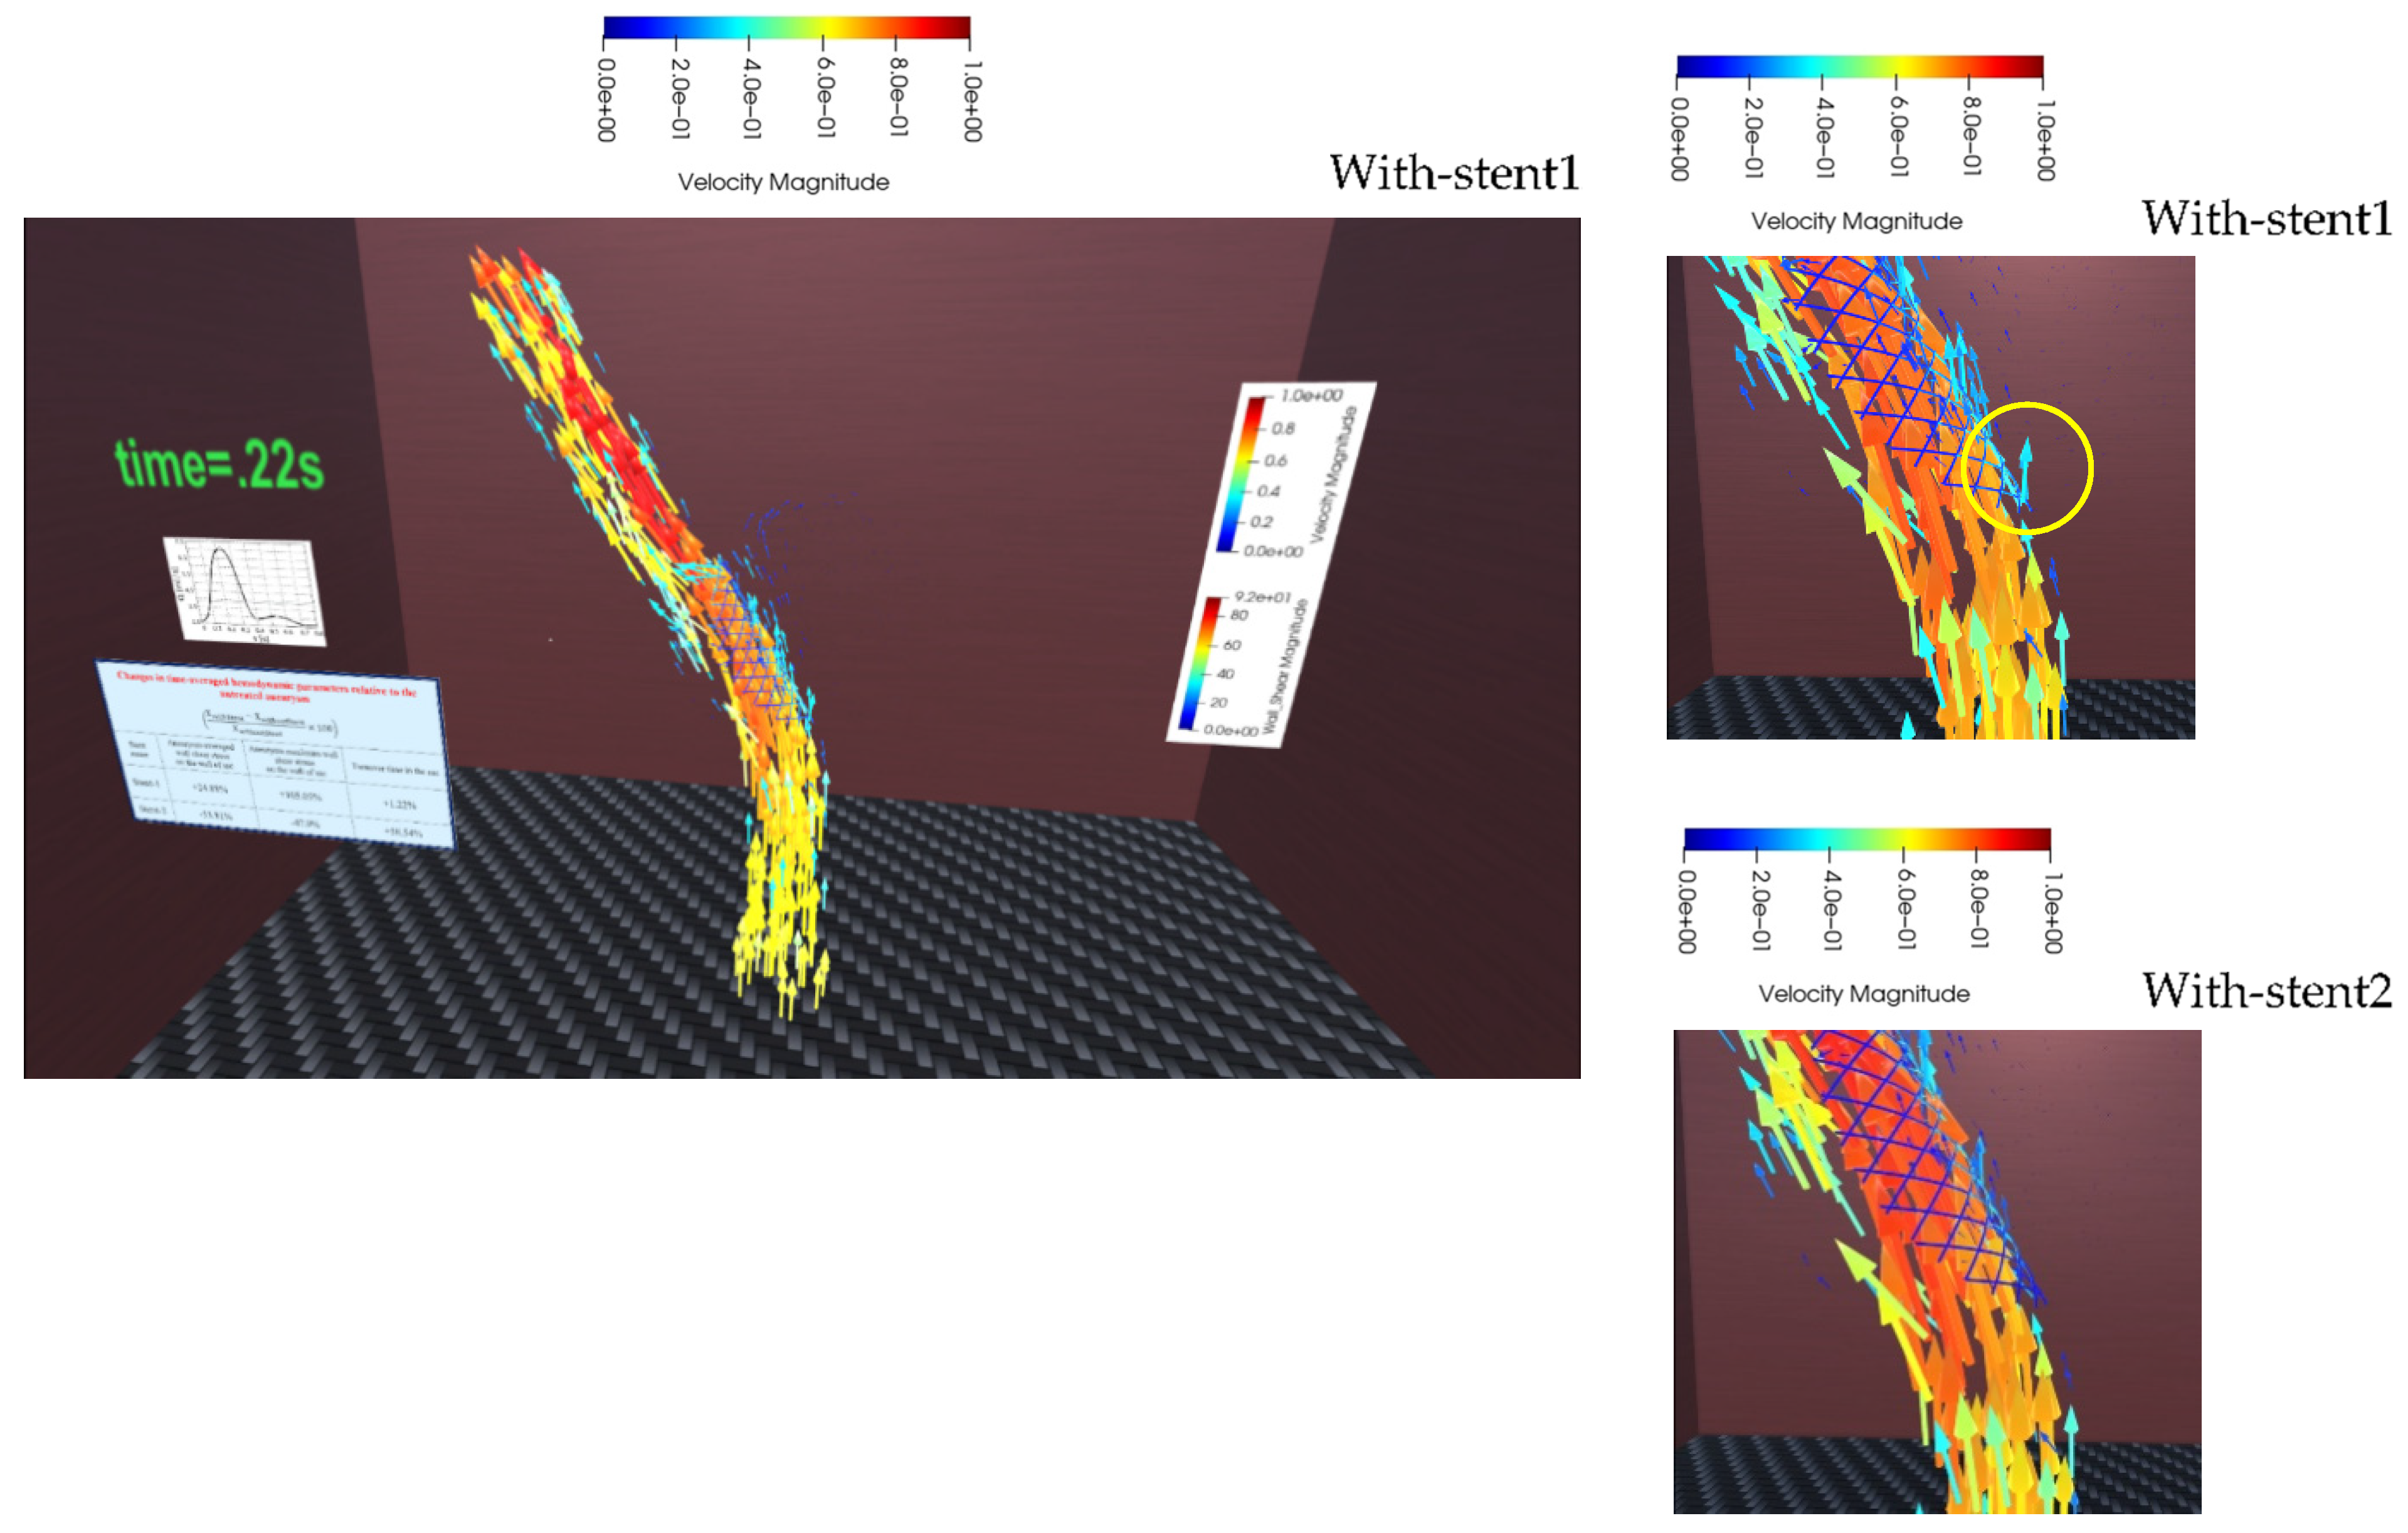
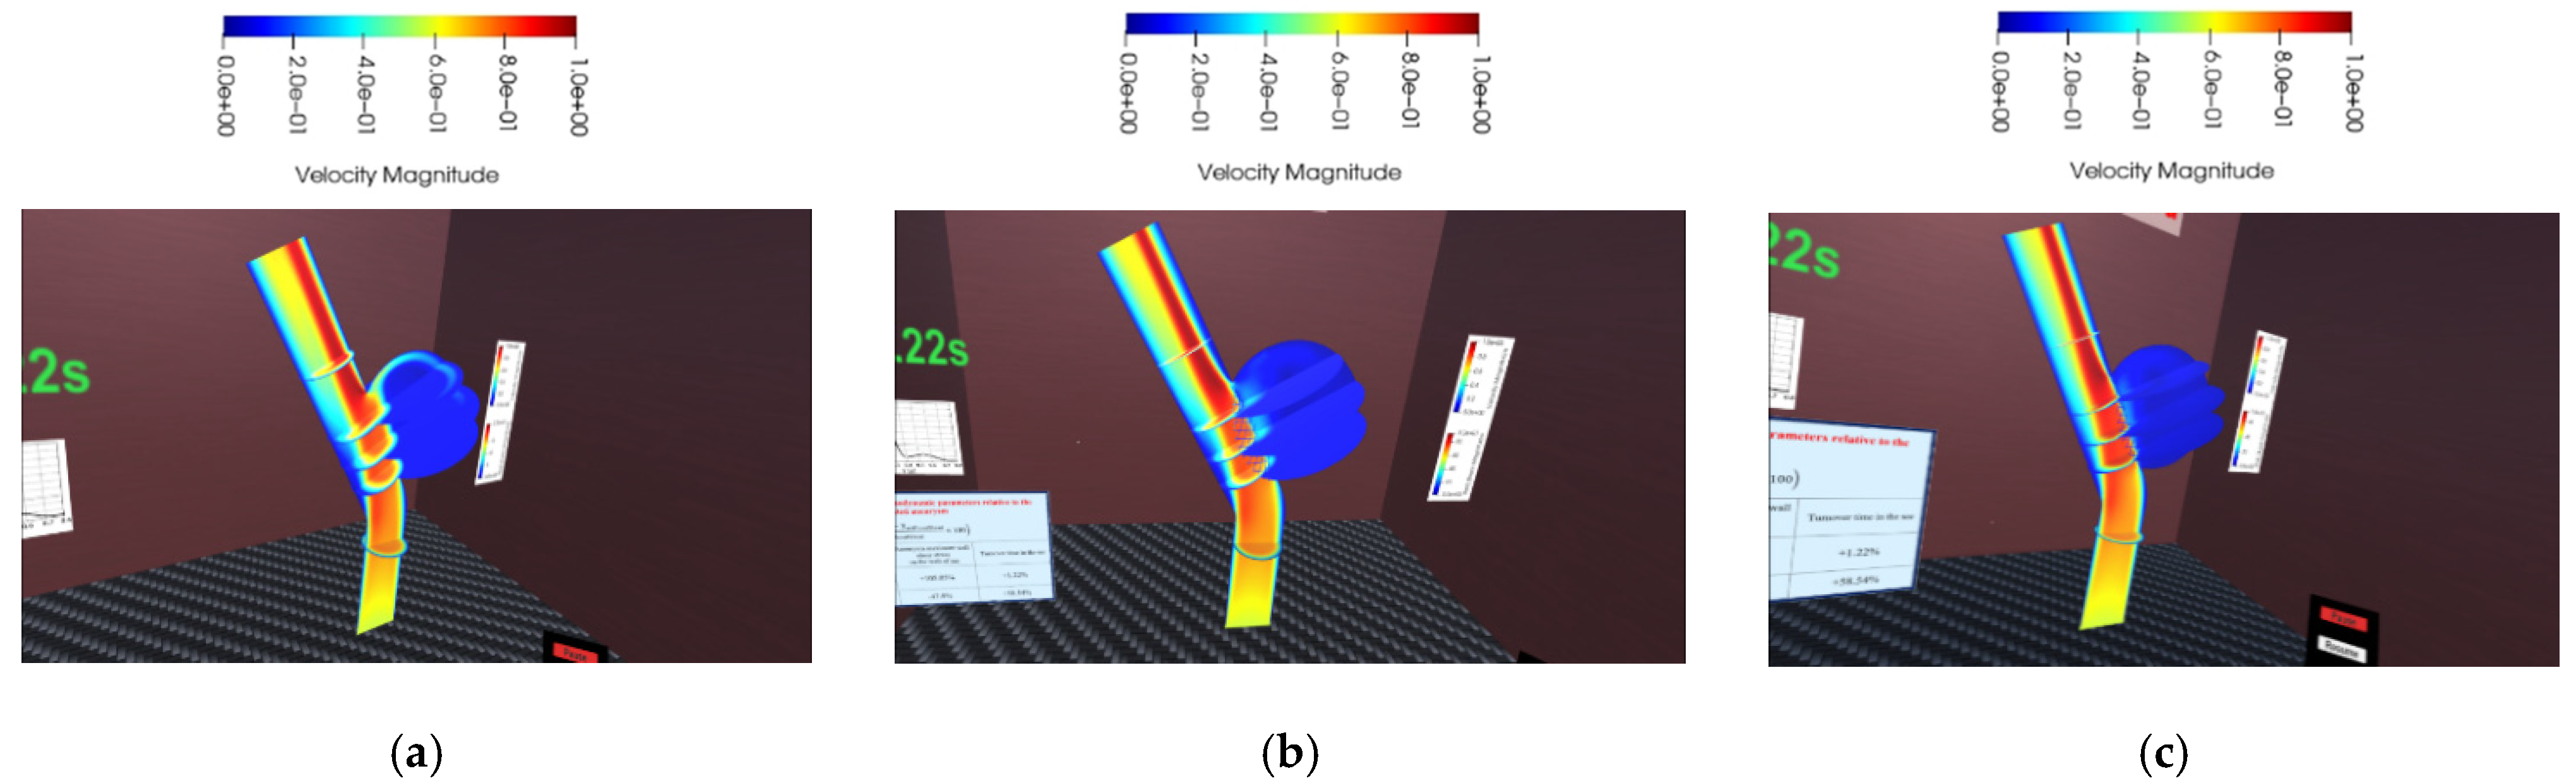
The effects of inflow/outflow locations into/out of the aneurysm, and the wall–stent gap can be observed in more detail in the 3D space of the VR environment. If the user selects one of the flow elements using the menu, illustrated in Figure 13, the animation of the associated element starts playing. Figure 15 shows a screenshot of the velocity vector animation at t = t2. The vessel wall has been deactivated here to show the vectors more clearly. In addition to the vectors, the legend, hemodynamic parameters table, and the associated time of the cardiac cycle are displayed. The user is free to walk inside the fluid domain, zoom, grab, or move the domain to explore the flow behavior while the animation is playing or paused. A distinguishing feature of VR visualization can be explored if the user zooms in to the wall–stent gap for the With-stent1 case and find out the high-speed jet flow into the sac through the gap, as displayed in Figure 15-right. In addition, the time variation in the jet flow velocity is traceable via the velocity vectors animation in the VR environment.
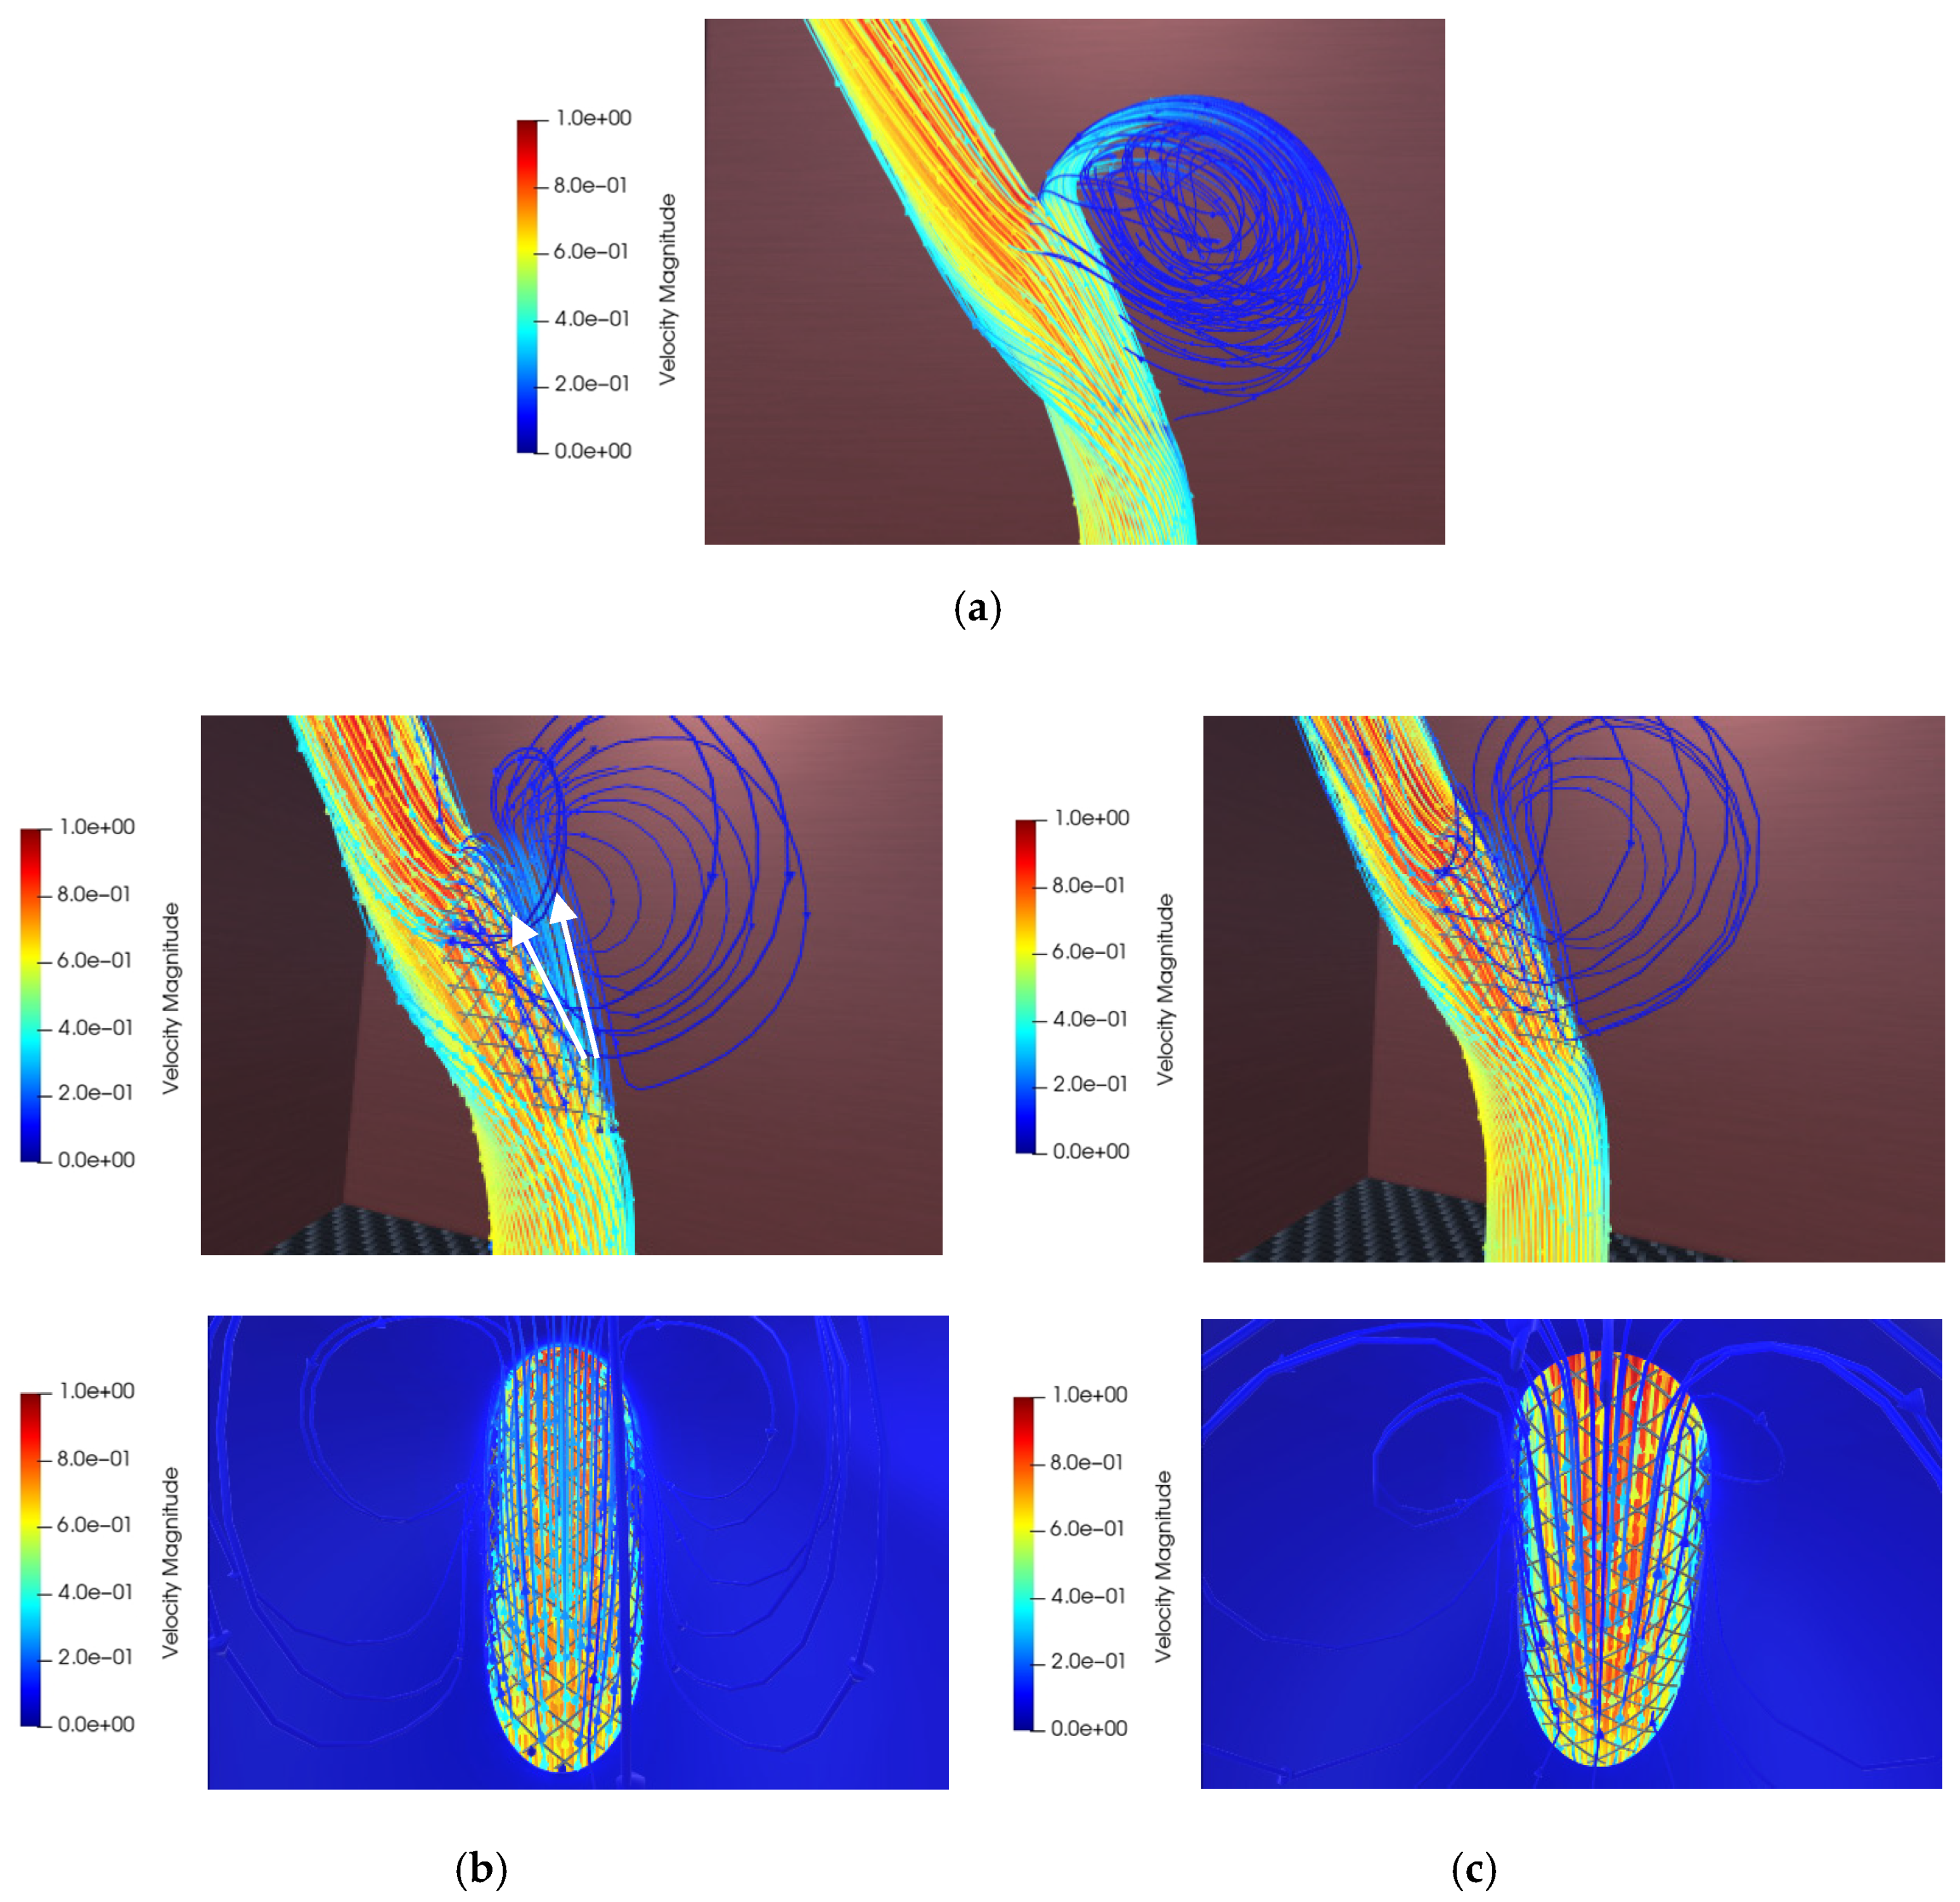
Three-dimensional streamlines provide the viewer with the advantages of simultaneously displaying all recirculating zones that are considerably different for treated and untreated aneurysms. The interactive accessibility of blood flow behavior in the vessel would be experienced by exploring the streamlines, as shown in the screenshots of Figure 16. Zone1 and Zone 2 can be seen in Figure 16b-top,16c-top, respectively. Two white arrows demonstrate the different paths of flow after entering the sac through the proximal neck edge. In addition, vortex flows from View 1 (shown in Figure 2) are accessible to be explored, as shown in Figure 16b-bottom and 16c-bottom.
The particle tracer is another proper method to follow the fluid path through the vessel. The Videos S1 and S2 in Supplementary Materials show the animation of streamlines (Without-stent) and particle tracers (With-stent2), respectively. In these animations, the viewer is mostly located on View 1 and View 2 viewpoints.
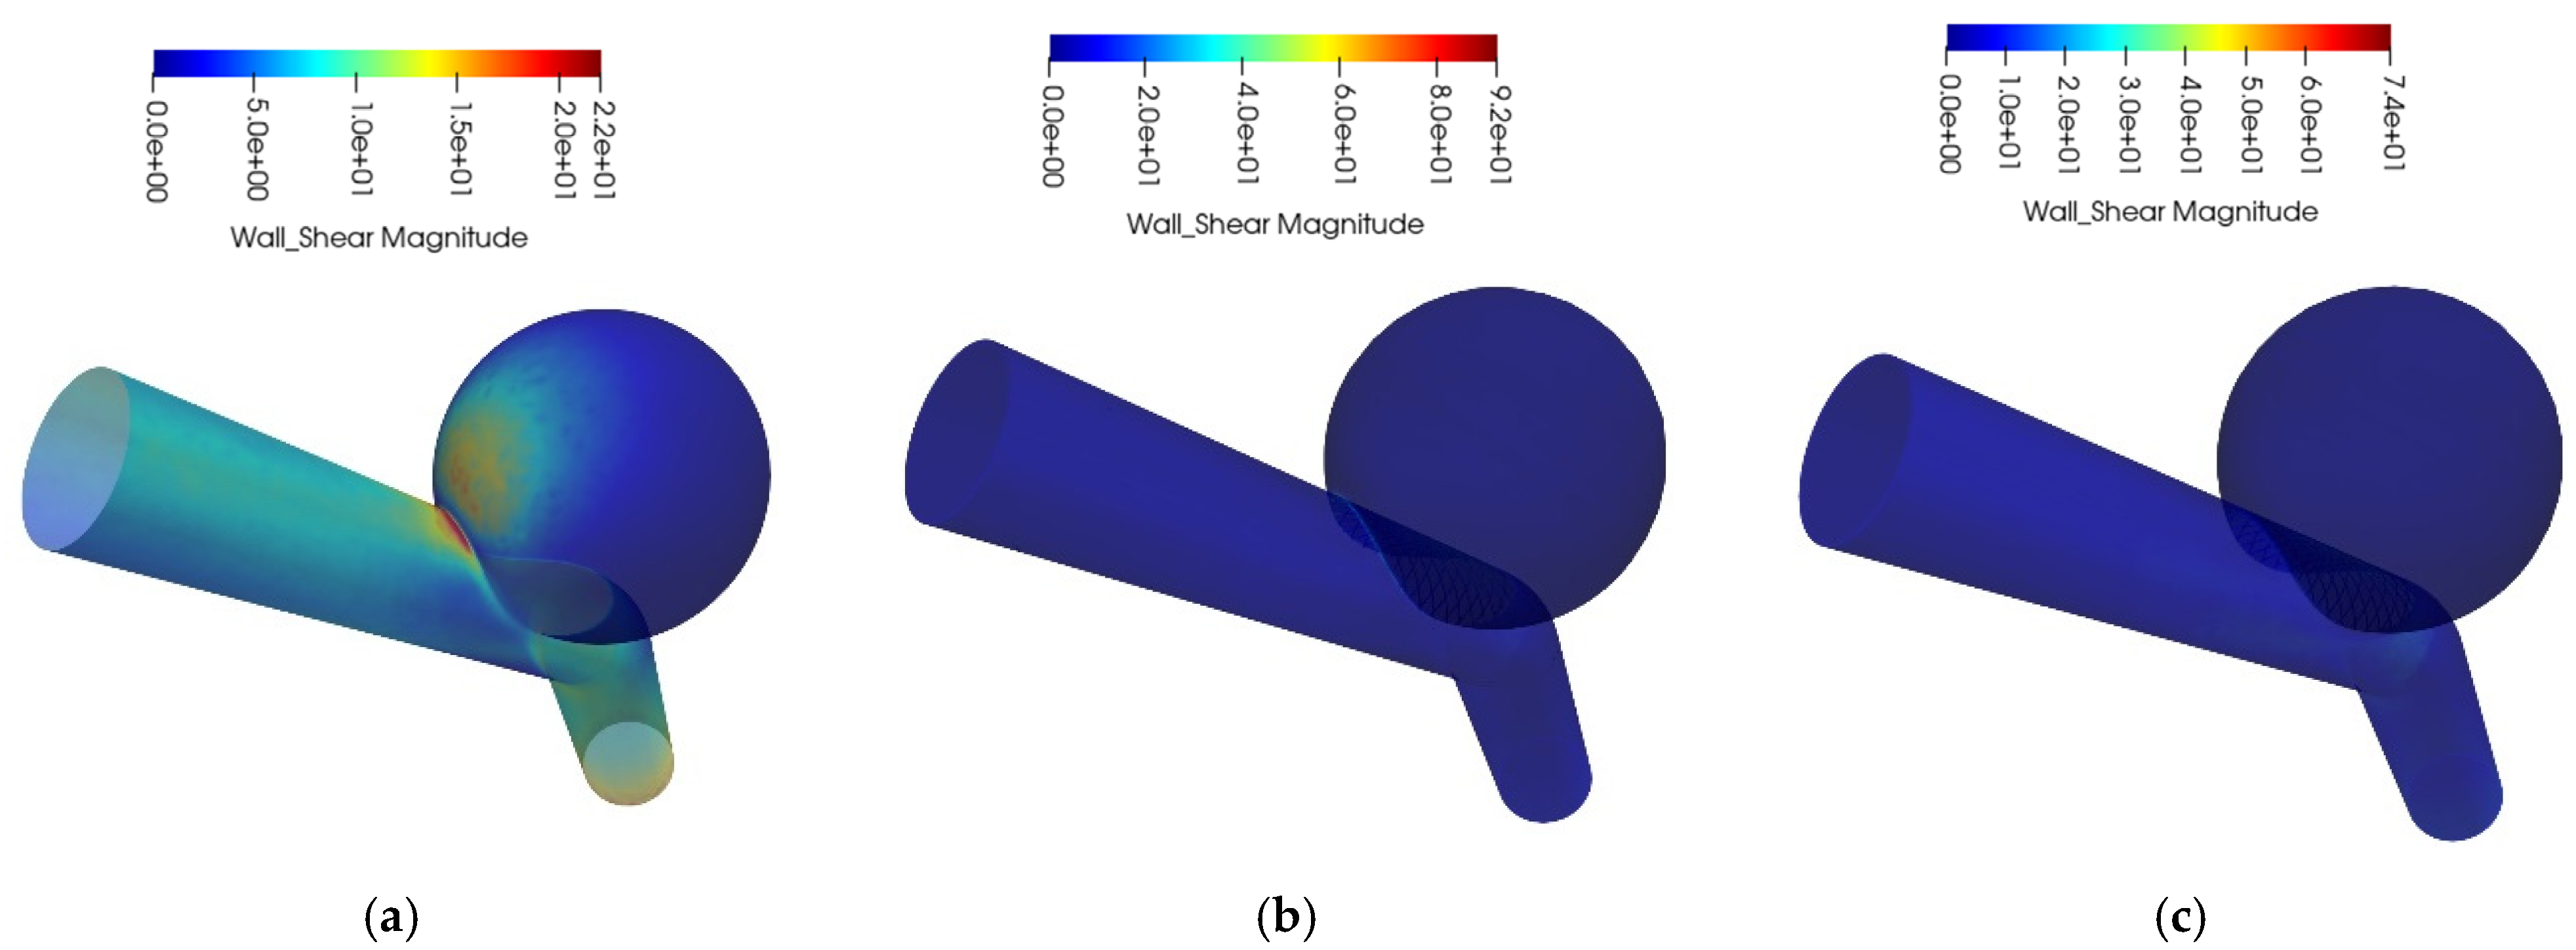
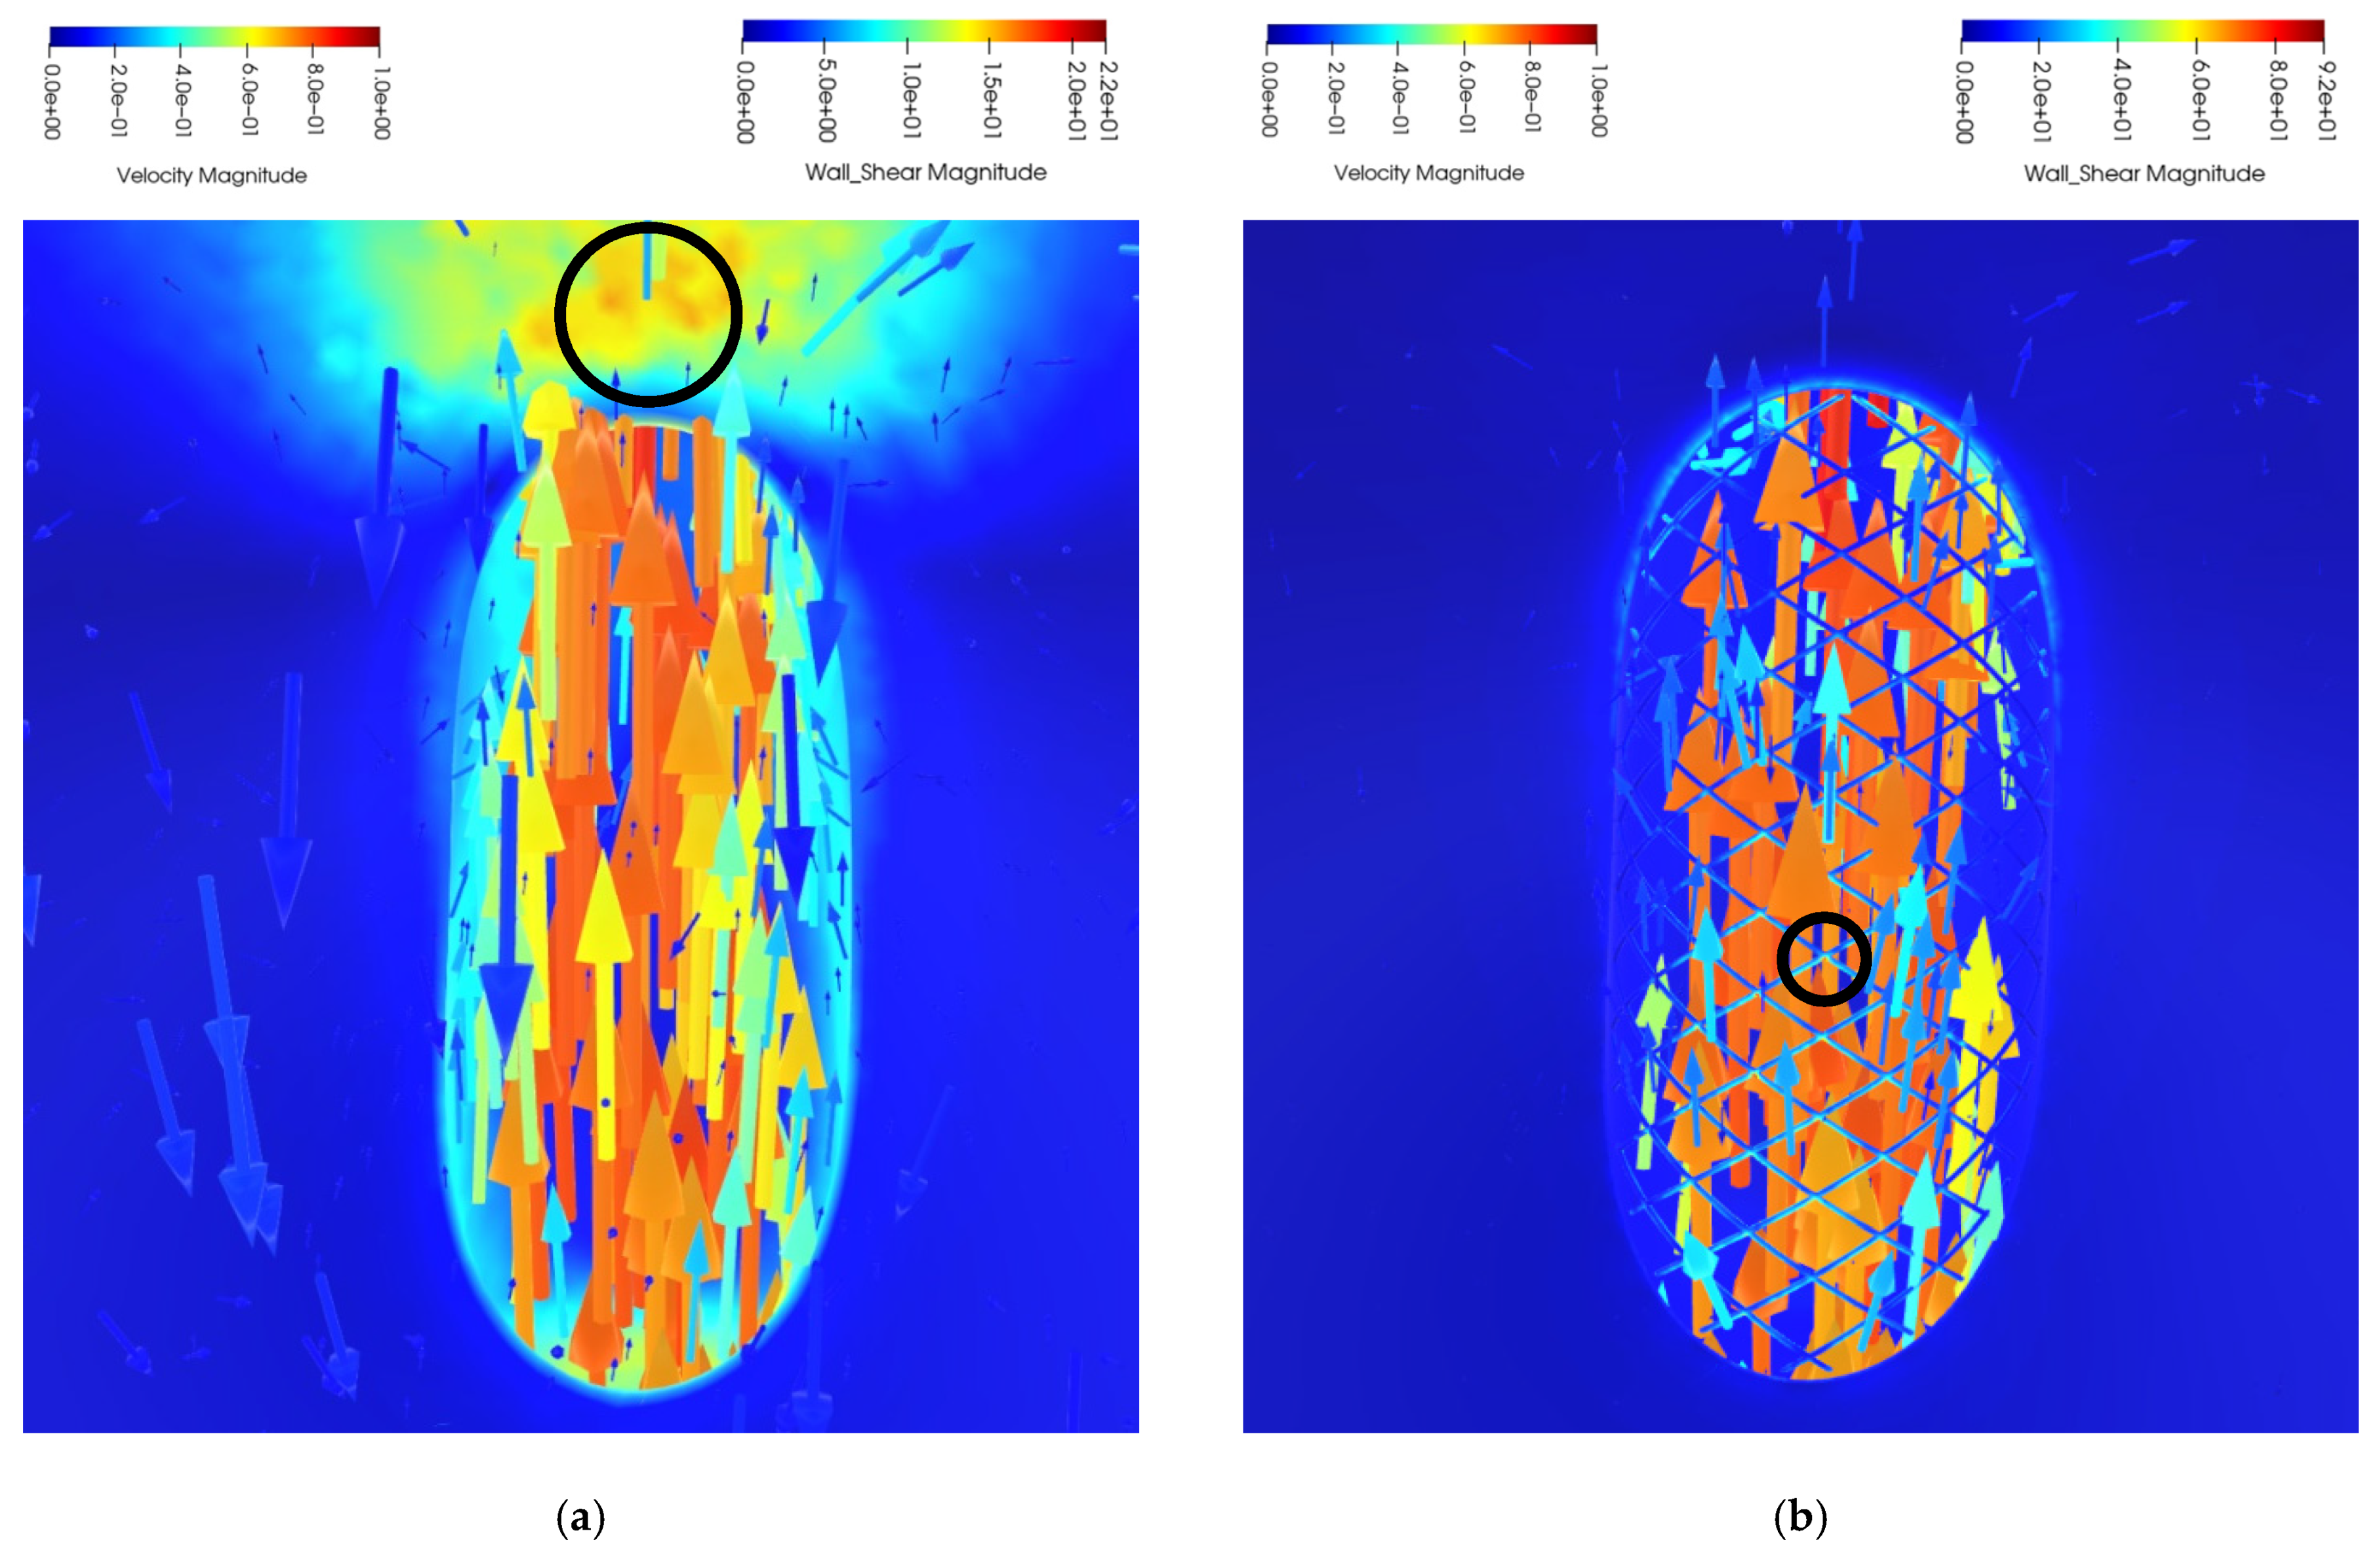
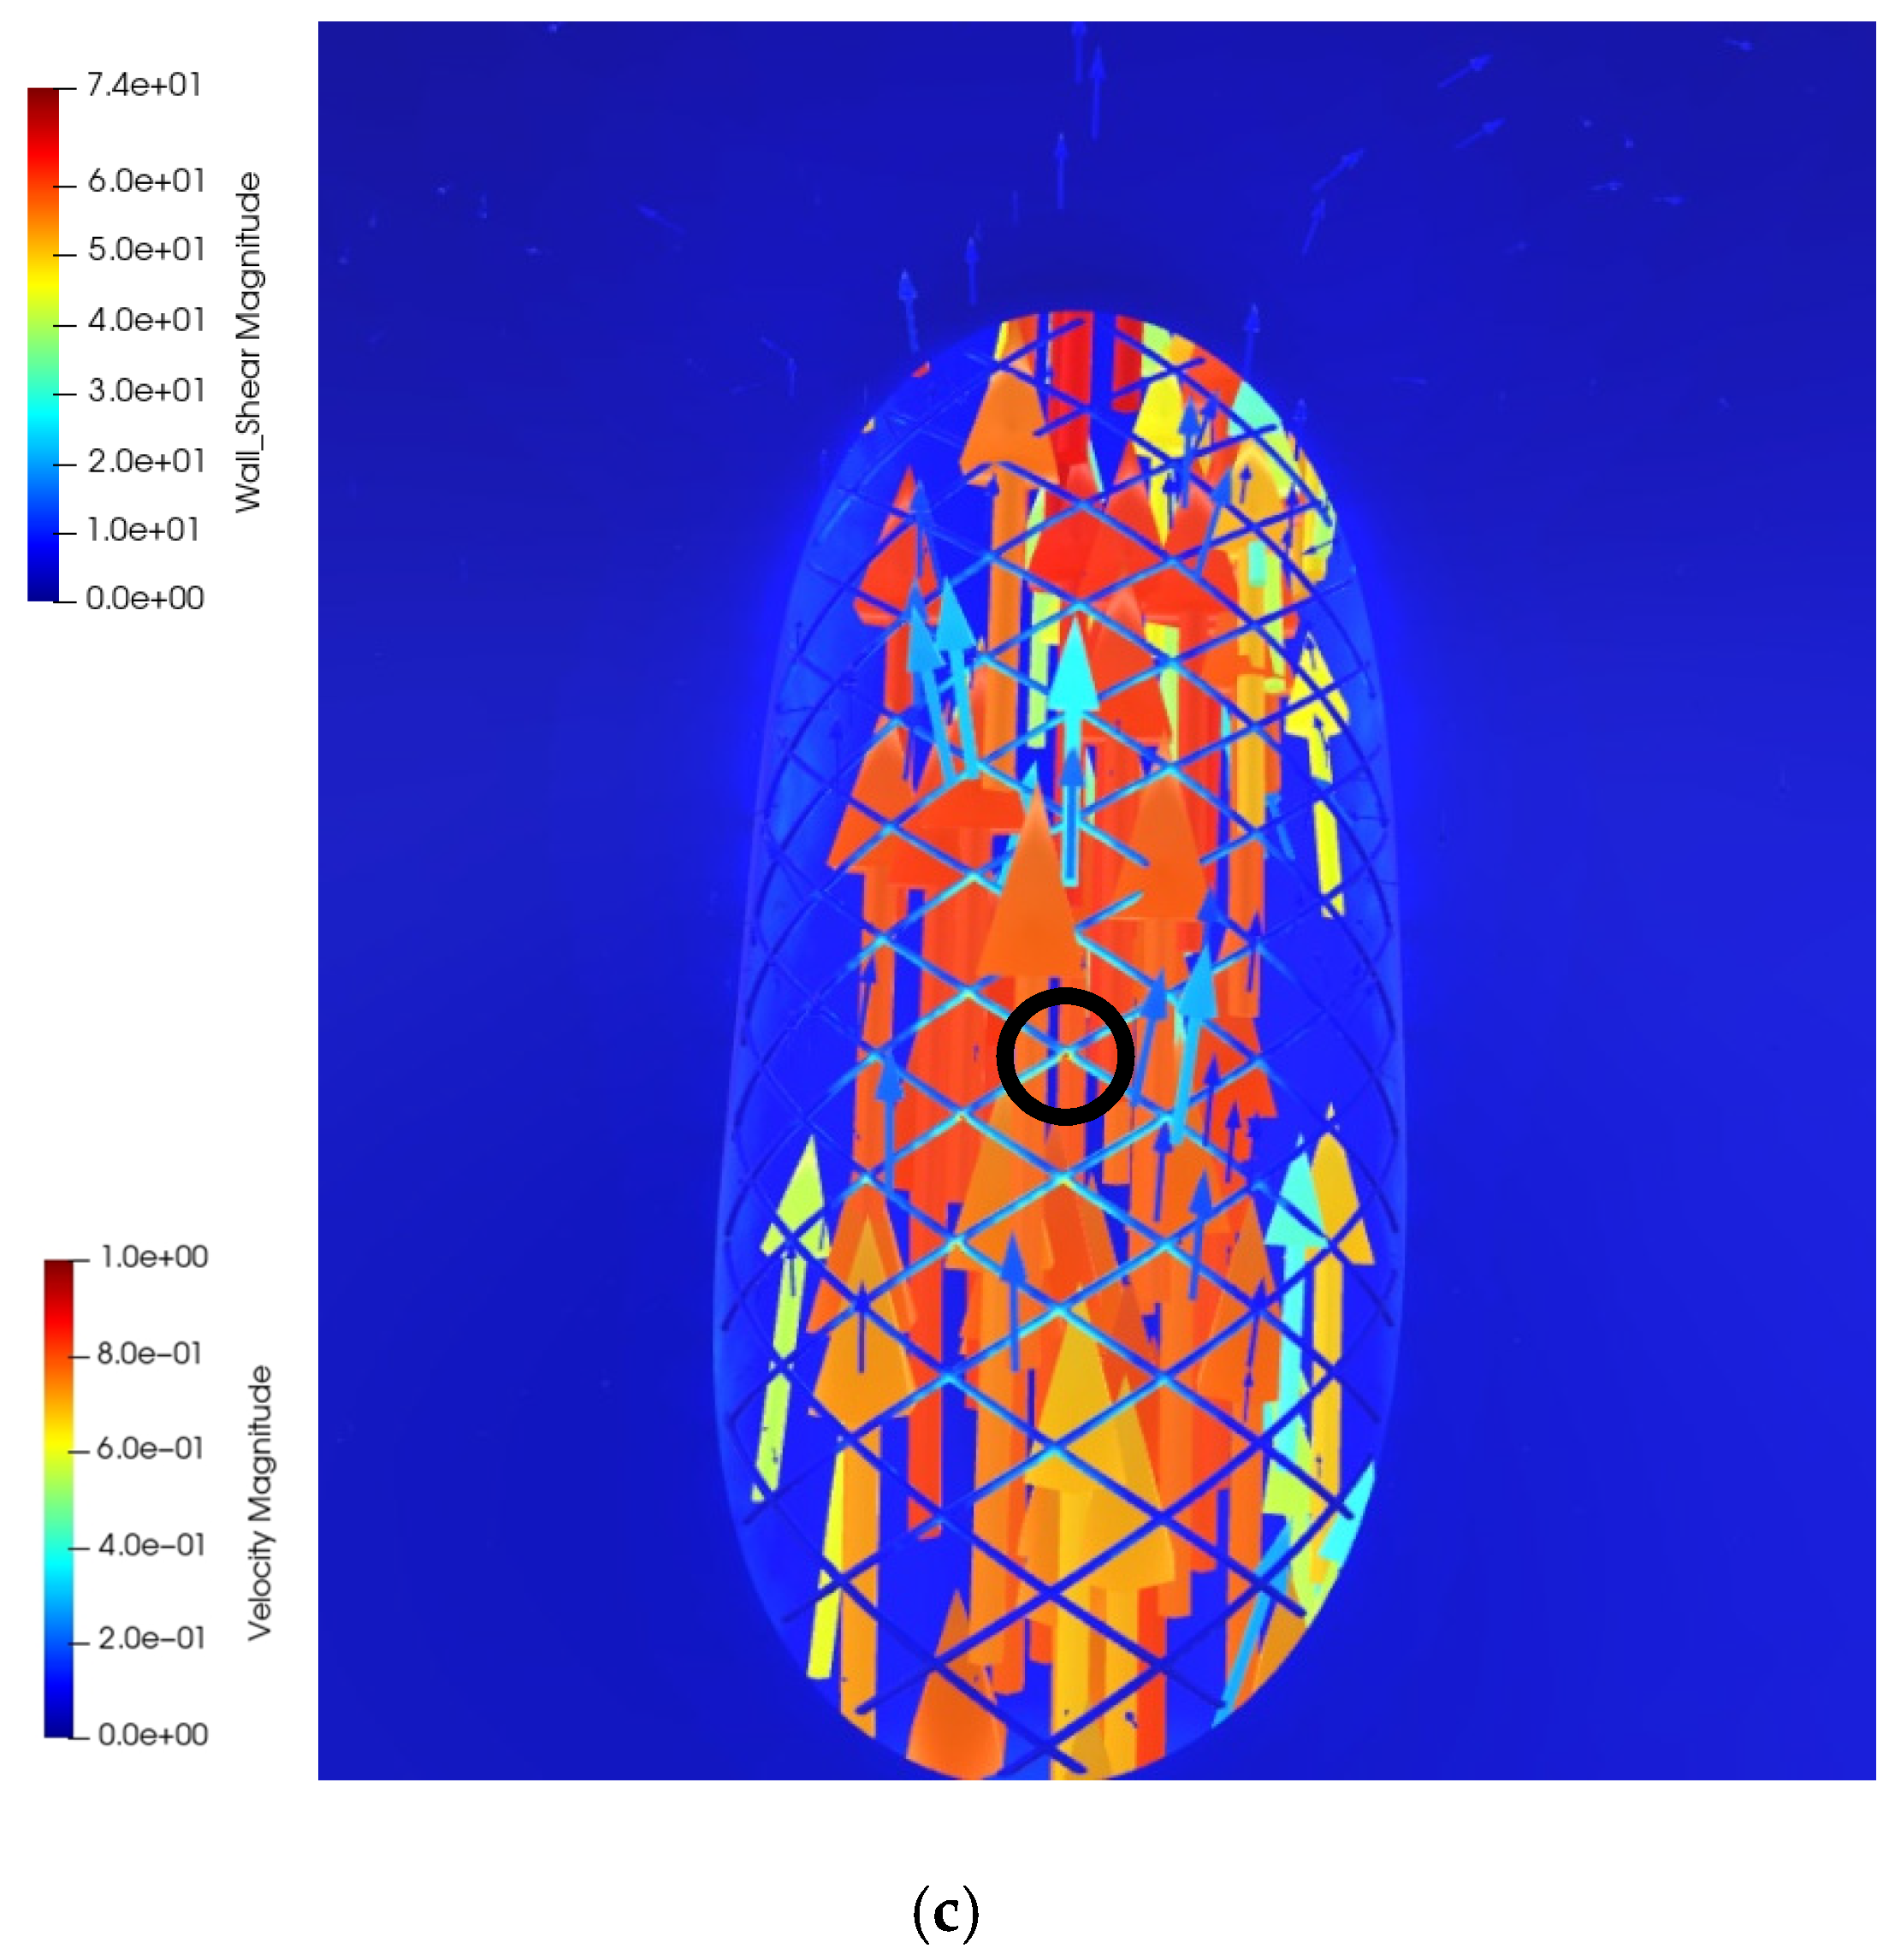
The contours of wall shear stress magnitude at time t2 are shown in Figure 17 and it can be found out that the locations of high wall shear stress have changed due to stenting. In addition, for the Without-stent case, the distal neck edges on the parent artery wall and aneurysm distal wall have high wall shear stress values, while for the stented cases, the peak WSS occurs on the stent wall, which is safer in terms of aneurysm rupture reduction risk [32].The exact regions of high wall shear stress are evident by navigation in the 3D virtual space and by observing the inside space of the sac from viewpoint 1. It is obvious from screenshots of Figure 18 that the regions of high WSS are located on the stent wires (Figure 18b,c) contrary to the untreated case for which this location is on the distal sac wall (Figure 18a). Some locations of high WSS are shown with black circles in Figure 18. The navigation through viewpoints 1 and 2 can provide extremely informative insight about the flow behavior and WSS distribution inside the aneurysm. The Videos S3 and S4 in Supplementary Materials show the animation of velocity vectors for Without-stent and With-stent1 with the focus on the wall–stent gap.
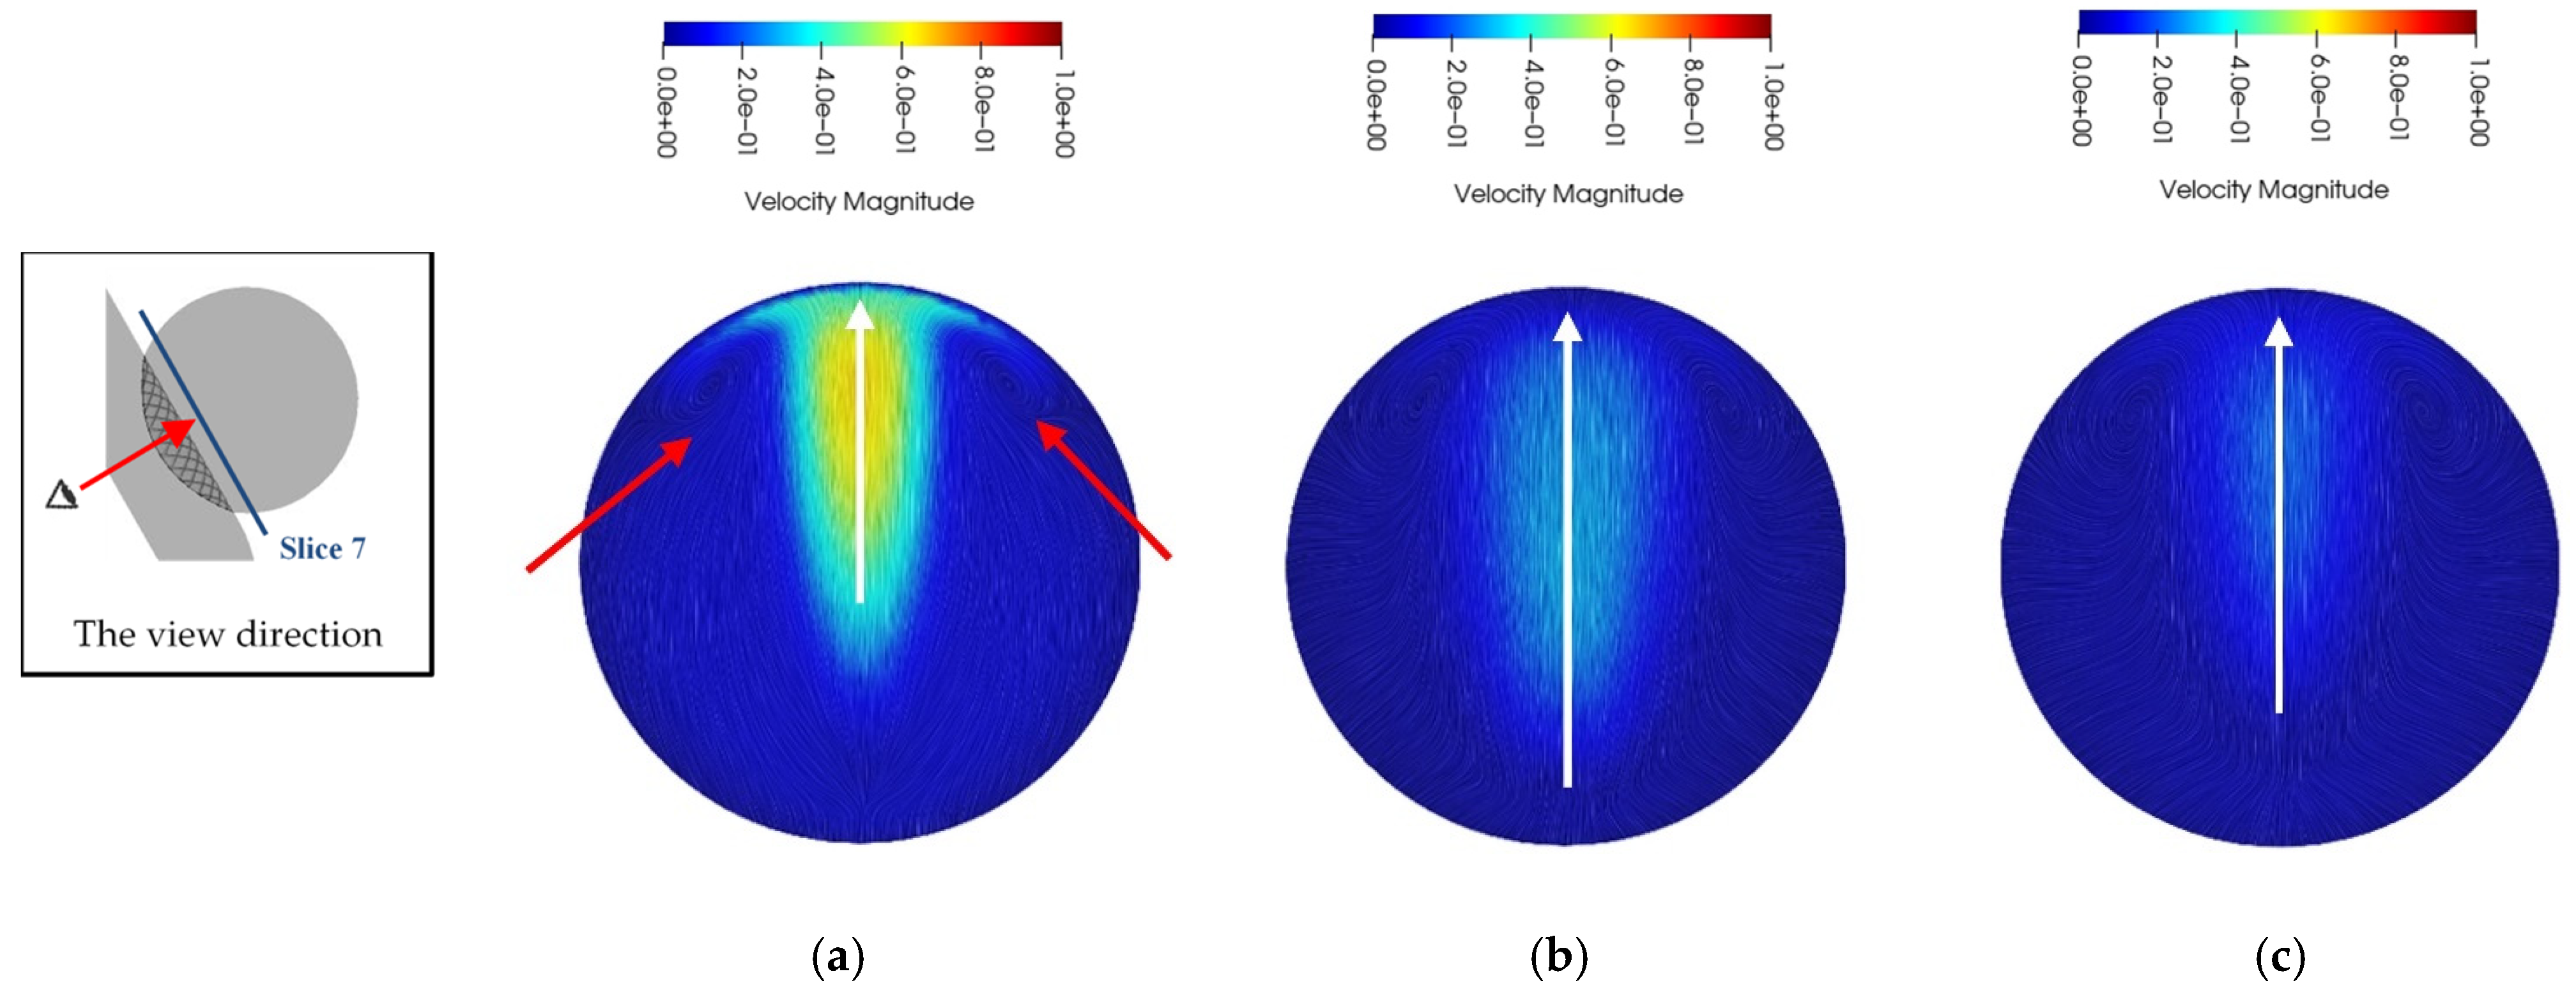
The changes in flow behavior and high WSS regions due to stenting can be explained by displaying velocity contours on Slice 7. Figure 19 shows the velocity magnitude contours and streaking patterns on Slice 7. The streak pattern shows that the flow enters the untreated aneurysm and then impinges on the distal sac wall with high speed (white arrow in Figure 19) that is the reason behind the higher wall shear stress and pressure values in this region. The inflow flows in both upward and lateral directions and leads to the creation of two small recirculating zones around the impingement point (red arrows Figure 19). In addition, this figure shows the higher flow rate into the sac for the untreated aneurysm, in comparison to the stented cases, and the With-stent2 case has the lowest inflow. It is obvious that the presence of the wall–stent gap influences the inflow rate into the aneurysm.
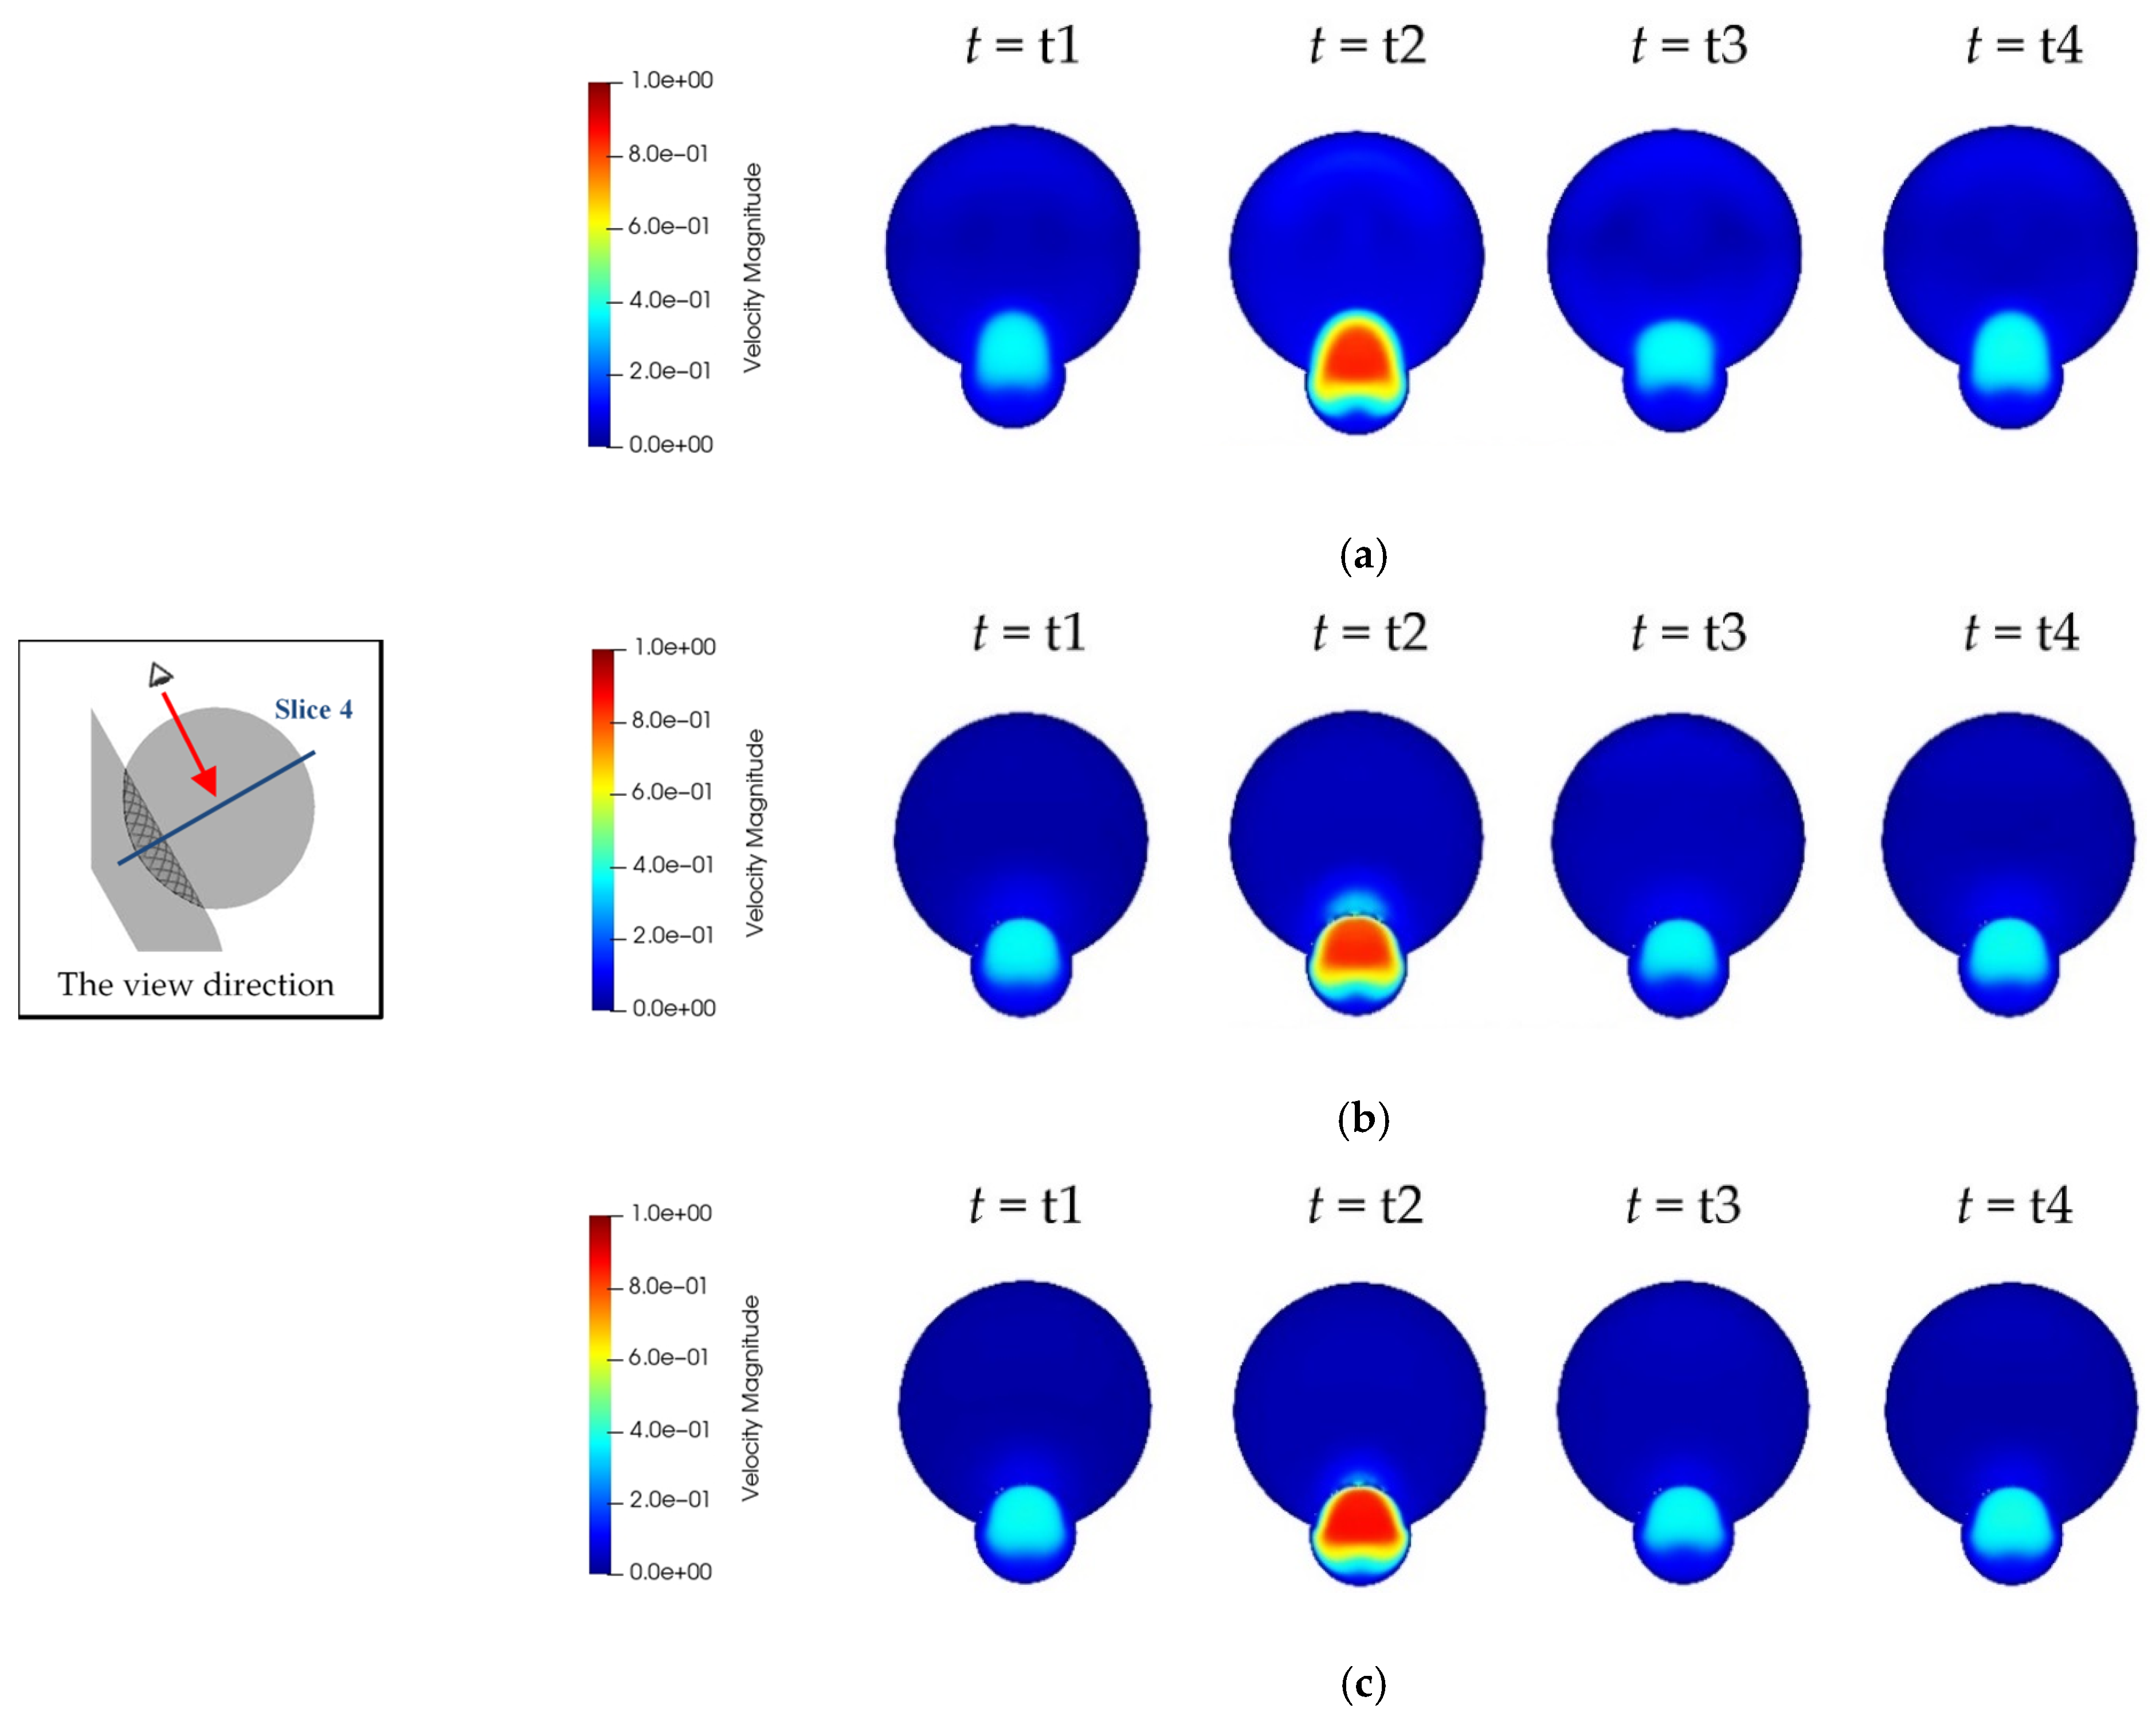
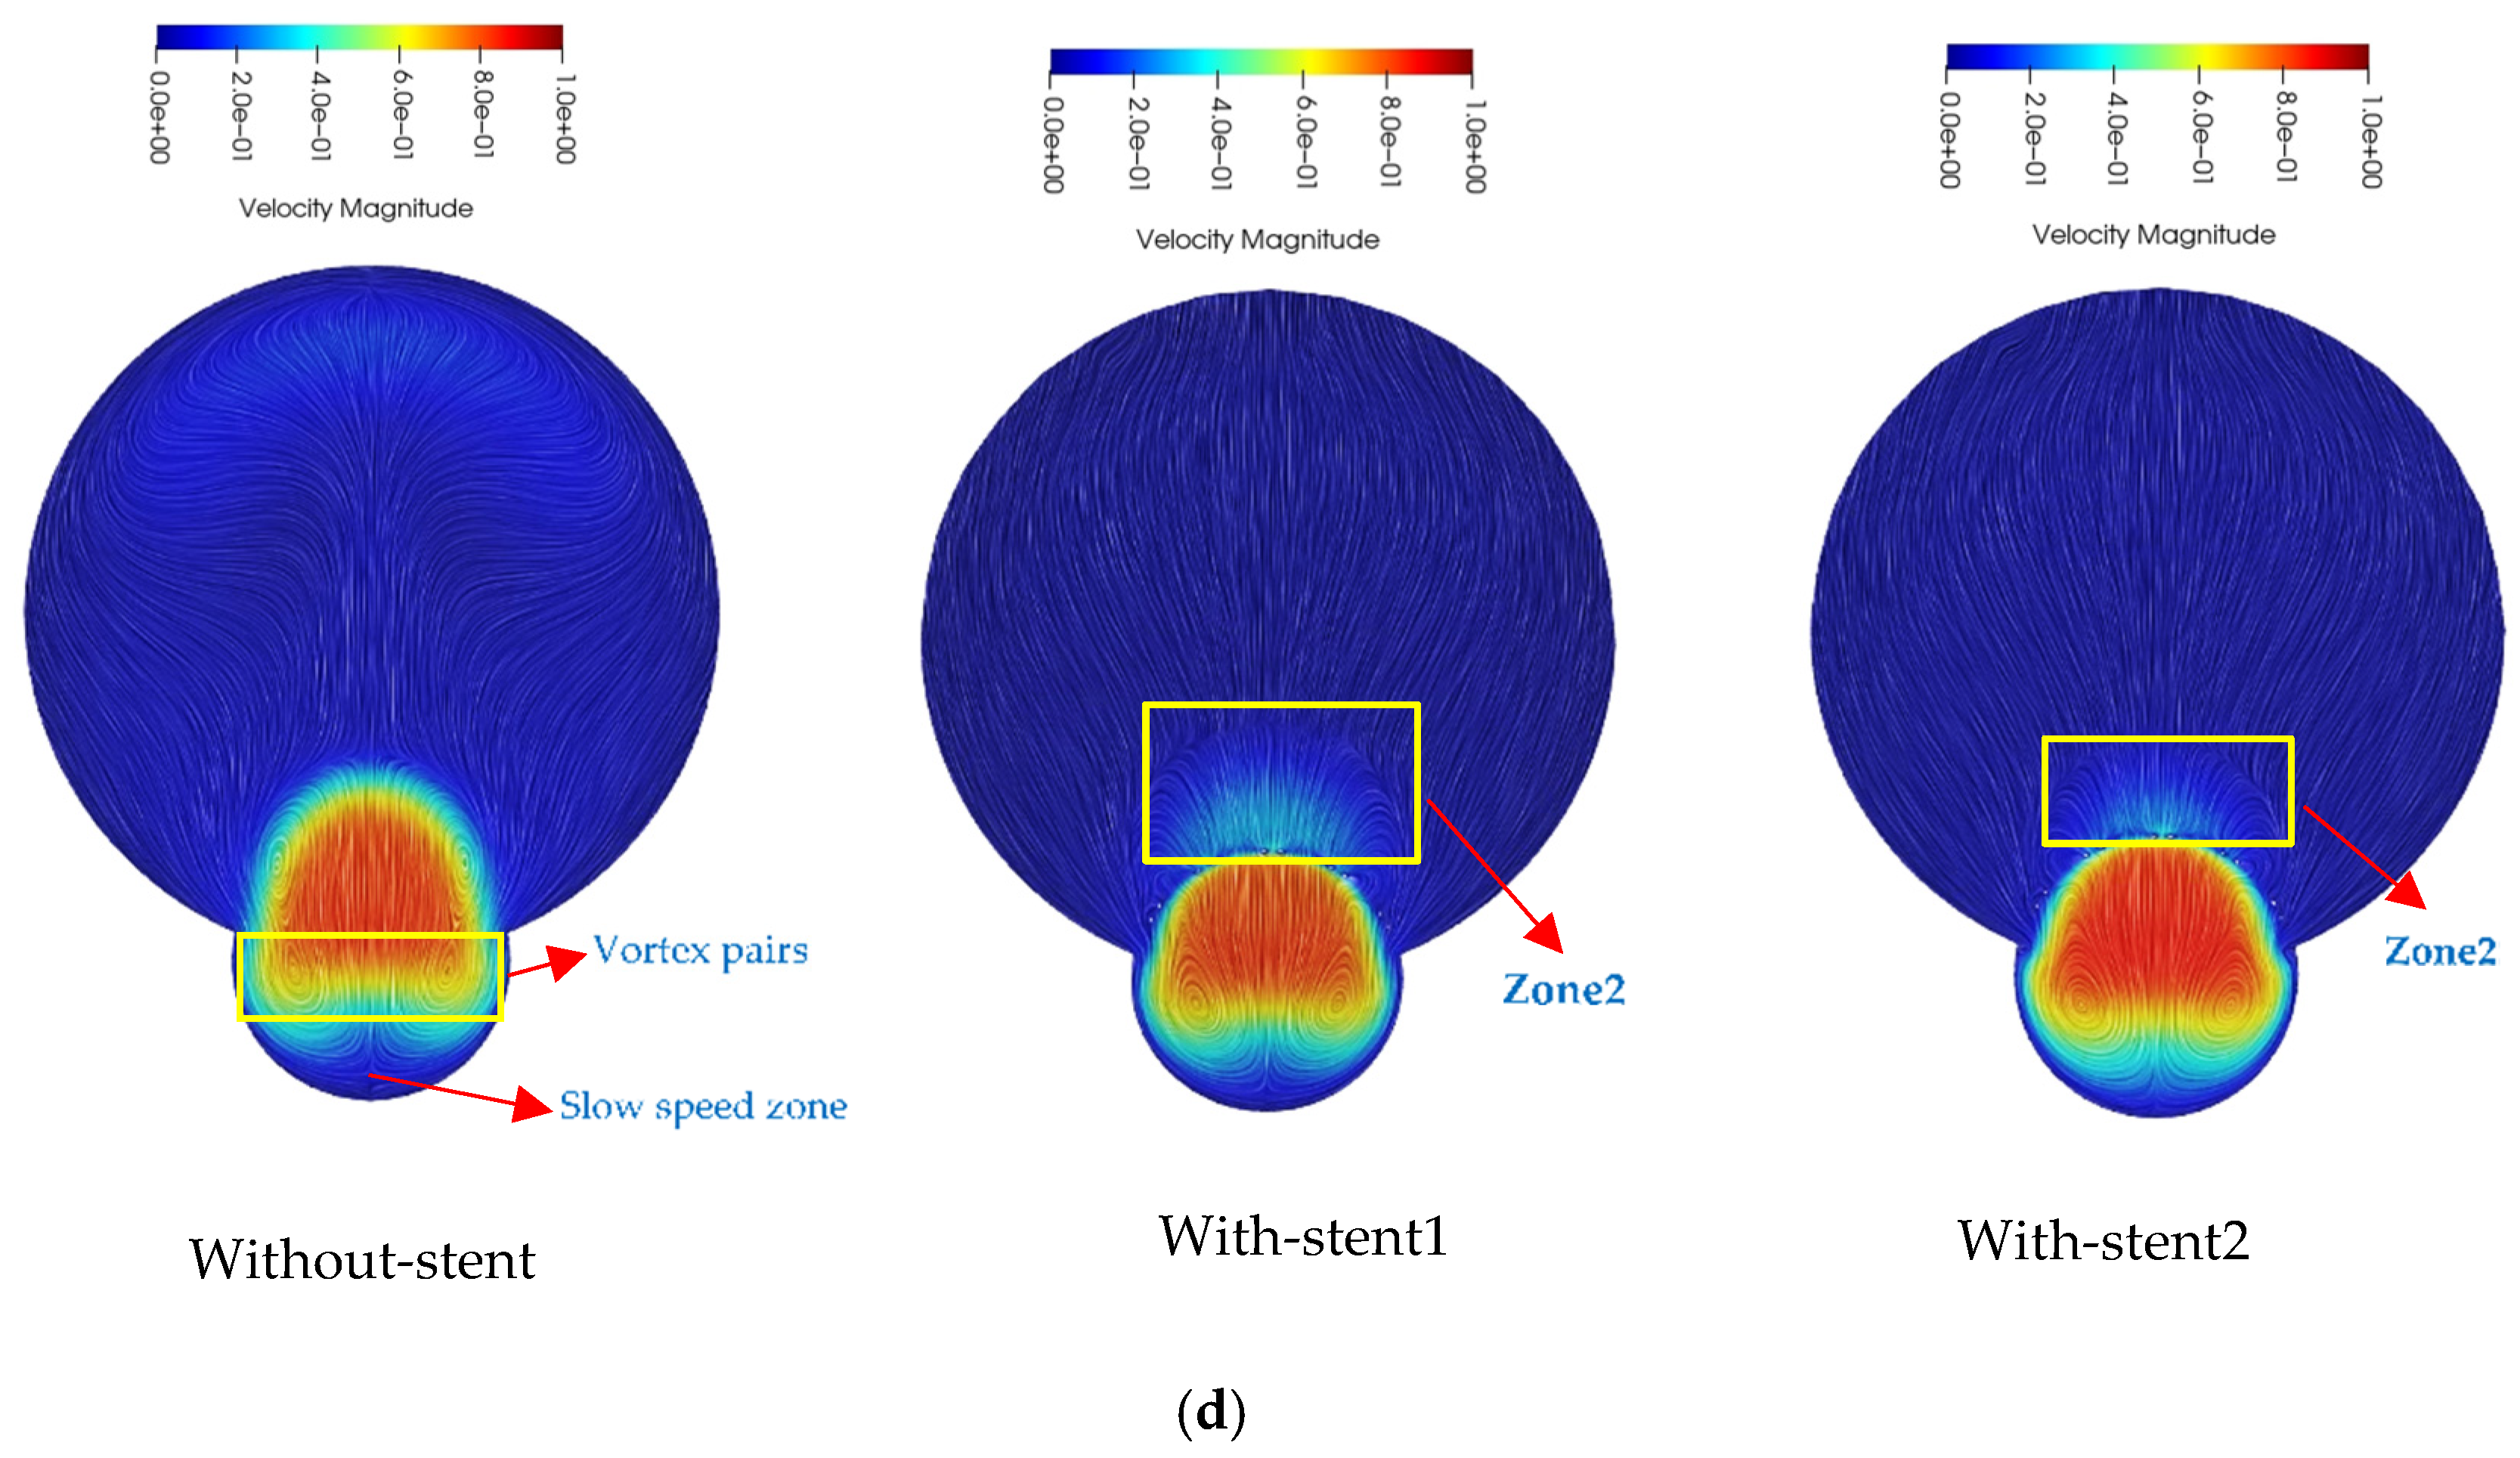
To show the time variation of parameters, it is required to use several slices in routine postprocessing methods. An example is presented in Figure 20 that shows the velocity magnitude contours and streak patterns on Slice 4 at four points in time. It is evident that the highest inflow rate into the aneurysm is associated with the Without-stent case at all times. For stented cases, the high velocity is limited to the near neck regions, especially for Stent2. As the flow enters the aneurysm sac, a slow speed zone adjacent to the parent artery opposite to the neck is generated and results in the creation of a vortex pair at the entrance. Similar behaviors can be seen in the inflow region of stented cases. The lower the flow rate into the aneurysm, the smaller the slow-speed zone, and the larger the vortex pair size. The streak patterns in Figure 20d illustrate this flow behavior. Furthermore, Zone 2, introduced in Figure 14, can be seen in Figure 20d for both stented cases, while that of With-stent2 is smaller due to the lower inflow rate. More detailed spatial CFD results and their changes versus time are represented by VR visualization, as shown in Figure 21. This figure shows some screenshots of velocity magnitude contours on Slices 1 to 6.The disadvantages of traditional postprocessing methods are obvious from previous section figures. In a 2D environment, flow behavior is explained using several slices. Even traditional animations made of unsteady CFD simulation data are observed with a limited fixed viewing angle. The more interactive VR environment and six degrees of freedom overcome these issues using 3D vectors and streamlines or a point cloud field. For example, to develop insight into 3D variations in scalar variables, the visualization of point clouds colored by scalar variables may be an ideal method. The variation in point color represents the high-risk regions that need identifying and consideration in the treatment with FD devices. The blood pressure at the inlet boundary was extracted from the CFD simulation results, and the time-averaged pressure during the second cardiac cycle was calculated to produce the dimensionless pressure.
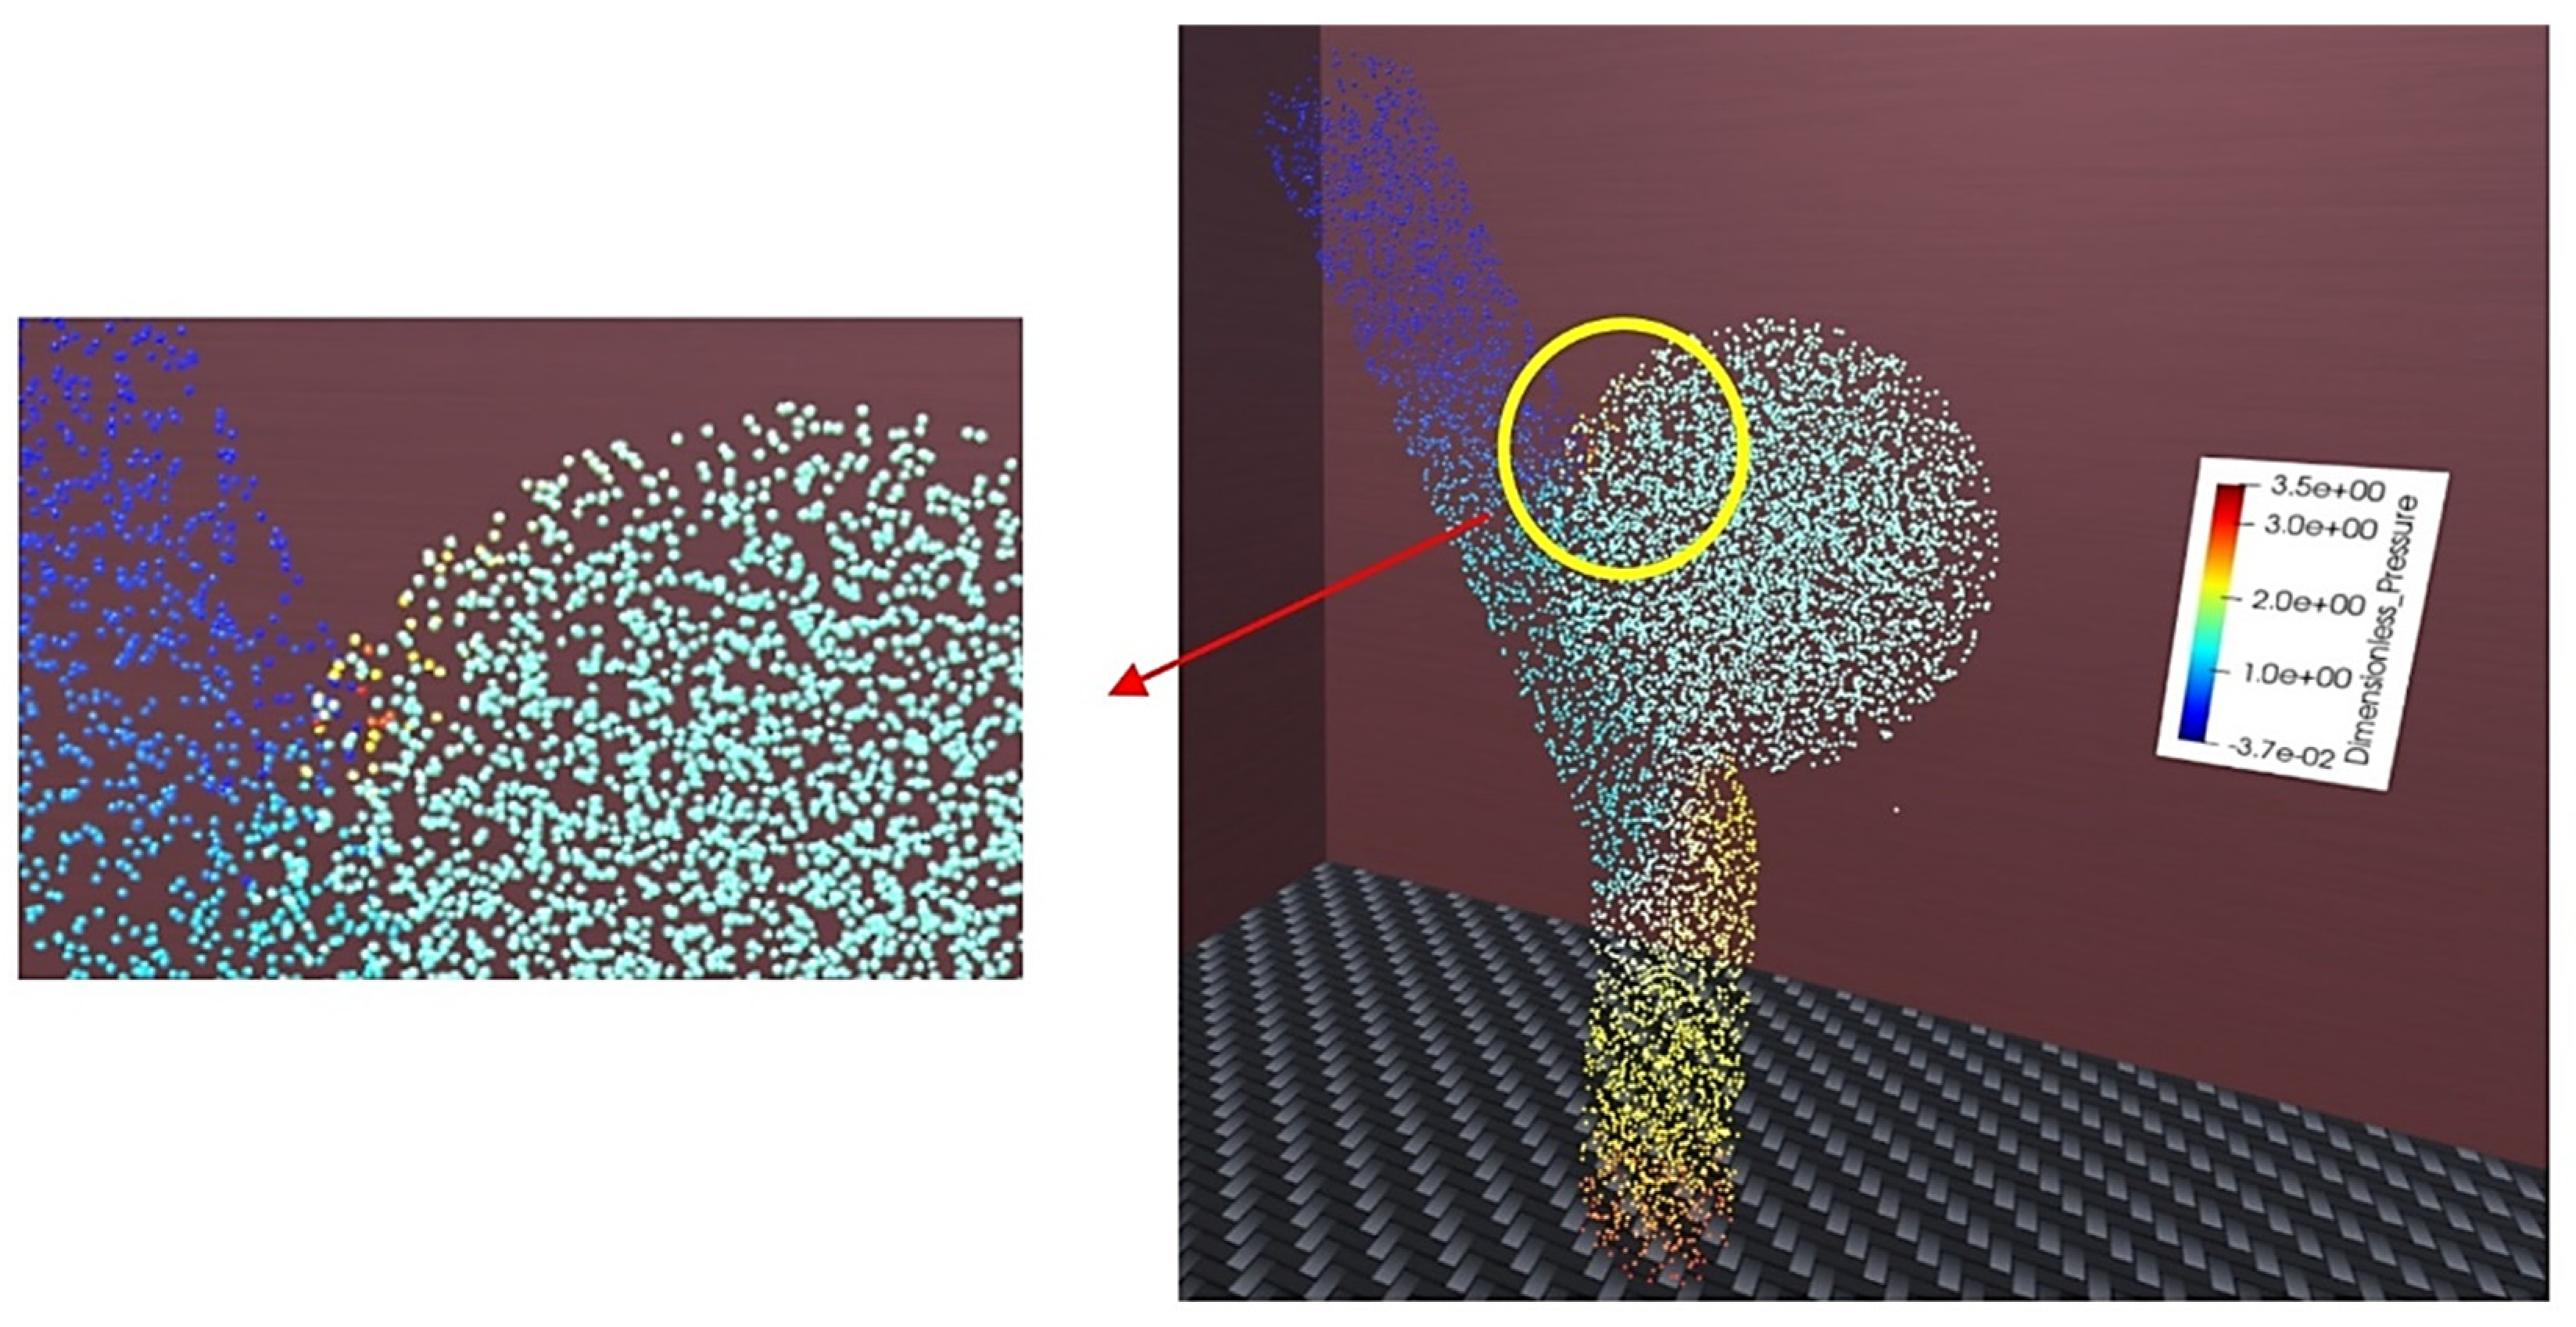
An example of a point cloud colored by dimensionless pressure for the Without-stent case in the VR environment is given in Figure 22. The points with red, orange, and yellow colors adjacent to the distal sac area are the locations of high pressure due to the direct impingement of the inflow on the sac wall, which can be easily found by navigation in the pressure field.
The main purpose of using FD stents is the creation of aneurysmal flow stagnation and the facilitation of thrombosis. Long turnover times, lower time-averaged kinetic energy, and lower wall shear stress magnitudes actively promote the occurrence of thrombosis. These hemodynamic parameters are compared for treated and untreated cases in Table 1. The jet flow through the wall–stent gap increased the inflow rate into the aneurysm, and as a result, the average wall shear stress and the kinetic energy for the With-stent1 case increased. Turnover time is the time the flow takes to enter the sac, circulate there, and return to the parent artery [33]. The longer the turnover time, the more expedited the thrombosis process. By using the stent2, the turnover time increased 58%, while there was a 41% reduction in the aneurysm-averaged kinetic energy, relative to the untreated case. It is clear that With-stent2 has the desired performance as a treatment device.
4. Applications and Limitations
VR has been used in neurosurgery to simulate the operating room experience so that surgical residents can rehearse cases before operating on live patients to promote their surgical skills and reduce patient risk [34]. Furthermore, VR has been used to provide preoperative plans for invasive treatment strategies and improve surgical outcomes [35]. The current CFD-VR method is a more suitable use for the latter purpose. The main difference between VR simulators and CFD-VR visualization in cerebral endovascular neurosurgery is that the first one is more focused on the implementation of the intervention, while the second one illustrates the consequences of the proposed method and conditions after treatment. Notably, the other important aspect of the current CFD-VR method is its applicability to design a unique patient-specific treatment method for every patient. The neurosurgeon could use computed tomography (CT) and/or magnetic resonance imaging (MRI) to build each patient’s 3D aneurysm model (8). Then, the model could be transferred to computer-aided design (CAD) software and, using the generated model, the computational fluid dynamics simulation can be carried out for the cases where flow diverter devices with various geometries are used and deployed with varying positioning. The VR-visualized results would indicate the effect of various FD devices on blood flow and important hemodynamic parameters and produce significant insight for the neurosurgeon when selecting and positioning these kinds of tools. This could lead to a reduction in technical errors and greater treatment efficiency.
Although the benefits are evident, the application of VR in neurosurgery faces several limitations. The first practical challenge is the usability of VR systems that need to be adopted into the surgical environment and require a minimum technical proficiency [35]. The development of robust VR software can be challenging and can require high-end computer systems with advanced graphics cards, high-resolution displays, and accurate tracking systems [36,37]. In addition, professionals from various fields need to cooperate when designing VR software for application in clinical settings. These factors may increase the costs and influence the economic feasibility of the widespread use of virtual reality technology in neurosurgery [36]. Furthermore, neurosurgeons may be hesitant to adopt the proposed VR methodology because VR applications lack comprehensive technical standards [34,35]. Furthermore, this type of technology may cause the gradual shift in decision making in surgery from human surgeons to computers, which could create ethical issues related to the use of this technology [34].
The above issues concerning VR surgery simulators are not as critical in relation to the current CFD-VR visualization method. On the one hand, due to the accelerating technology advances, low-cost and low-weight head-mounted displays and more powerful computer and graphics processors are available for rendering CFD three-dimensional images and animations. On the other hand, only CFD experts can work on CFD-VR visualization, so the costs of the current technology are reasonable. Additionally, the reliability of CFD-VR visualized data is completely dependent on the accuracy of CFD simulations, and there are several standard methods to prove the validity of the numerical simulations to neurosurgeons. Furthermore, while the real-time CFD simulation capability during the changing of geometry and flow conditions made by the surgeon has not been developed extensively, the final decision about the selection of devices and methods is made by the operating surgeon, not the computer. While the rendering of CFD data in a VR environment is not very time-consuming, the computation time of CFD simulations for some complicated cases is significant, but it can be reduced considerably (from several days to even some minutes) by high-performance computing.
5. Conclusions
CFD has been used as a powerful tool to study the effects of flow-diverters on aneurysm treatment and blood flow behavior in aneurysms before and after treatment. Because of the complicated nature of the intra-aneurysmal flow, the visualization of CFD data in the VR environment would be an efficient method to explore the performance of treatment devices and their positioning strategies. Therefore, we developed a straightforward method to visualize the CFD results in the VR environment. The blood flow in cerebral aneurysms without and with flow diverter stents was simulated numerically and visualized in the virtual reality environment using the proposed method. Several flow elements, including velocity vectors, contours, streamlines, particle tracers, and point clouds, were rendered and animated in the VR environment colored by node values. It was found from the CFD results that the flow diverters are thoroughly efficient devices to redirect the flow from aneurysms, but their efficiency completely depends on the placement of the stent. Additionally, the inflow and outflow locations and flow patterns changed due to stenting. The high-speed inflow jet impinging on the sac wall causes the untreated aneurysm to have high wall shear stresses on the distal neck and wall. The results also indicated that a small gap between the artery wall and stent can reduce the stent efficiency and even lead to higher kinetic energy inside the stented aneurysm in comparison to the untreated one.
All CFD results need to be visualized on several slices through the parent artery and aneurysm from different viewpoints; however, the animated CFD data in the VR environment reduce the high volume of data as needed to be displayed in traditional postprocessing methods because of the high degree of freedom of VR headsets. The VR-visualized results showed that, fully immersed in the 3D flow elements field, a viewer without any specific CFD knowledge is able to recognize the high-risk regions inside the vessel and evaluate the performance of FD stents in flow stagnation, as a consequence, facilitating thrombosis.
The findings of this research would provide surgeons with new insights into the applicability of treatment methods and also the proper placement of flow-diverter stents to obtain maximum efficacy.
In conclusion, the visualization in the VR environment offers nonexperts in CFD a fully immersive environment to interact with three-dimensional computer-generated objects productively without the issues of traditional postprocessing methods. Additionally considering the VR benefits and limitations, the advantages of using the proposed visualization method outweigh the disadvantages.
Supplementary Materials
The following are available online at https://www.mdpi.com/article/10.3390/app11178082/s1, Video S1: The animation of streamlines for Without-stent, Video S2: The animation of particle tracers for With-stent2, Video S3: The animation of velocity vectors for Without-stent, Video S4: The animation of velocity vectors for With-stent1.
Author Contributions
Conceptualization, S.B.I. and X.C.; data curation, S.B.I.; formal analysis, S.B.I.; funding acquisition, M.W. and X.C.; methodology, S.B.I.; project administration, X.C.; resources, M.W., W.R. and X.C.; software, S.B.I. and W.R.; supervision, X.C.; validation, S.B.I.; visualization, S.B.I., M.W. and W.R.; writing—original draft, S.B.I.; writing—review and editing, X.C. All authors have read and agreed to the published version of the manuscript.
Funding
(NSERC): grant number 538407-2019, via an engage grant to the University of Saskatchewan and LUXSONIC Technologies Inc.
Acknowledgments
We would like to thank Arjun Puri from Luxsonic Technologies for the provision of the headset to carry out visualization in the virtual reality environment.
Conflicts of Interest
The authors declare no conflict of interest.
References
- Valencia, A.; Solis, F. Blood flow dynamics and arterial wall interaction in a saccular aneurysm model of the basilar artery. Comput. Struct. 2006, 84, 1326–1337. [Google Scholar] [CrossRef]
- Howard, B.M.; Hu, R.; Barrow, J.W.; Barrow, D. Comprehensive review of imaging of intracranial aneurysms and angiographically negative subarachnoid hemorrhage. Neurosurg. Focus 2019, 47, E20. [Google Scholar] [CrossRef] [PubMed] [Green Version]
- Bernardini, A.; Larrabide, I.; Morales, H.G.; Pennati, G.; Petrini, L.; Cito, S.; Frangi, A.F. Influence of different computational approaches for stent deployment on cerebral aneurysm haemodynamics. Interface Focus 2011, 1, 338–348. [Google Scholar] [CrossRef] [PubMed]
- Suzuki, T.; Takao, H.; Fujimura, S.; Dahmani, C.; Ishibashi, T.; Mamori, H.; Fukushima, N.; Yamamoto, M.; Murayama, Y. Selection of helical braided flow diverter stents based on hemodynamic performance and mechanical properties. J. NeuroInterventional Surg. 2016, 9, 999–1005. [Google Scholar] [CrossRef]
- Liang, L.; Steinman, D.A.; Brina, O.; Chnafa, C.; Cancelliere, N.M.; Pereira, V.M. Towards the Clinical utility of CFD for assessment of intracranial aneurysm rupture—A systematic review and novel parameter-ranking tool. J. NeuroInterventional Surg. 2018, 11, 153–158. [Google Scholar] [CrossRef] [PubMed]
- Catalán-Echeverría, B.; Kelly, M.E.; Peeling, L.; Bergstrom, D.; Chen, X.; Malvè, M. CFD-Based Comparison Study of a New Flow Diverting Stent and Commercially-Available Ones for the Treatment of Cerebral Aneurysms. Appl. Sci. 2019, 9, 1341. [Google Scholar] [CrossRef] [Green Version]
- Valentino, D.J.; Harreld, M.R.; Lee, D.A.; Duckwiler, G.R. Simulation of brain hemodynamics: The virtual aneurysm. In Modeling and Simulation: Theory and Practice: A Memorial Volume for Professor Walter J. Karplus (1927–2001); Bekey, G.A., Kogan, B.Y., Eds.; Springer: Boston, MA, USA, 2003; pp. 195–215. [Google Scholar]
- Cillo-Velasco, P.R.; Luciano, R.D.; Kelly, M.E.; Peeling, L.; Bergstrom, D.; Chen, X.; Malvè, M. The Hemodynamics of Aneurysms Treated with Flow-Diverting Stents Considering both Stent and Aneurysm/Artery Geometries. Appl. Sci. 2020, 10, 5239. [Google Scholar] [CrossRef]
- Damiano, R.J.; Tutino, V.M.; Paliwal, N.; Ma, D.; Davies, J.M.; Siddiqui, A.H.; Meng, H. Compacting a Single Flow Diverter versus Overlapping Flow Diverters for Intracranial Aneurysms: A Computational Study. Am. J. Neuroradiol. 2017, 38, 603–610. [Google Scholar] [CrossRef] [Green Version]
- Dholakia, R.; Sadasivan, C.; Fiorella, D.J.; Woo, H.H.; Lieber, B.B. Hemodynamics of Flow Diverters. J. Biomech. Eng. 2017, 139, 021002. [Google Scholar] [CrossRef] [Green Version]
- Cebral, J.; Mut, F.; Raschi, M.; Scrivano, E.; Ceratto, R.; Lylyk, P.; Putman, C. Aneurysm Rupture Following Treatment with Flow-Diverting Stents: Computational Hemodynamics Analysis of Treatment. Am. J. Neuroradiol. 2011, 32, 27–33. [Google Scholar] [CrossRef] [Green Version]
- Sindeev, S.; Arnold, P.G.; Frolov, S.; Prothmann, S.; Liepsch, D.; Balasso, A.; Berg, P.; Kaczmarz, S.; Kirschke, J.S. Phase-contrast MRI versus numerical simulation to quantify hemodynamical changes in cerebral aneurysms after flow diverter treatment. PLoS ONE 2018, 13, e0190696. [Google Scholar] [CrossRef] [PubMed] [Green Version]
- Ma, D.; Dargush, G.F.; Natarajan, S.K.; Levy, E.I.; Siddiqui, A.H.; Meng, H. Computer modeling of deployment and mechanical expansion of neurovascular flow diverter in patient-specific intracranial aneurysms. J. Biomech. 2012, 45, 2256–2263. [Google Scholar] [CrossRef]
- Janiga, G.; Daróczy, L.; Berg, P.; Thévenin, D.; Skalej, M.; Beuing, O. An automatic CFD-based flow diverter optimization principle for patient-specific intracranial aneurysms. J. Biomech. 2015, 48, 3846–3852. [Google Scholar] [CrossRef] [PubMed]
- Yu, H.; Huang, G.P.; Yang, Z.; Ludwig, B.R. Numerical studies of hemodynamic alterations in pre- and post-stenting cerebral aneurysms using a multiscale modeling. Int. J. Numer. Methods Biomed. Eng. 2019, 35, e3256. [Google Scholar] [CrossRef] [PubMed]
- Rayepalli, S.; Gupta, R.; Lum, C.; Majid, A.; Koochesfahani, M. The Impact of Stent Strut Porosity on Reducing Flow in Cerebral Aneurysms. J. Neuroimaging 2013, 23, 495–501. [Google Scholar] [CrossRef] [PubMed]
- Mut, F.; Raschi, M.; Scrivano, E.; Bleise, C.; Chudyk, J.; Ceratto, R.; Lylyk, P.; Cebral, J.R. Association between hemodynamic conditions and occlusion times after flow diversion in cerebral aneurysms. J. NeuroInterventional Surg. 2015, 7, 286–290. [Google Scholar] [CrossRef] [PubMed]
- Venn, J.T. Immersive Visualization in Biomedical Computational Fluid Dynamics and Didactic Teaching and Learning. Ph.D. Thesis, Marquette University, Milwaukee, WI, USA, 2018; p. 139. Available online: https://manchester.idm.oclc.org/login?url=https://search.proquest.com/docview/2035548374?accountid=12253%0Ahttp://man-fe.hosted.exlibrisgroup.com/openurl/44MAN/44MAN_services_page?genre=dissertations+%26+theses&atitle=&author=Venn%2C+John+T.&volume=&issue (accessed on 19 May 2020).
- Jackson, D. 3-D visualization. Mil. Eng. 2008, 100, 53–54. [Google Scholar]
- Keefe, D.F.; Sotiropoulos, F.; Interrante, V.; Runesha, H.B.; Coffey, D.; Staker, M.; Lin, C.-L.; Sun, Y.; Borazjani, I.; Le, T.; et al. A Process for Design, Verification, Validation, and Manufacture of Medical Devices Using Immersive VR Environments. J. Med. Devices 2010, 4, 045002. [Google Scholar] [CrossRef]
- Djukic, T.; Mandic, V.; Filipovic, N. Virtual reality aided visualization of fluid flow simulations with application in medical education and diagnostics. Comput. Biol. Med. 2013, 43, 2046–2052. [Google Scholar] [CrossRef]
- Quam, D.J.; Gundert, T.J.; Ellwein, L.; Larkee, C.E.; Hayden, P.; Migrino, R.Q.; Otake, H.; John, F.; Ladisa, J.F., Jr. Immersive Visualization for Enhanced Computational Fluid Dynamics Analysis. J. Biomech. Eng. 2015, 137, 0310041–03100412. [Google Scholar] [CrossRef] [Green Version]
- Vardhan, M.; Shi, H.; Gounley, J.; Chen, S.J.; Kahn, A.; Leopold, J.; Randles, A.; Radles, A. Investigating the role of VR in a simulation-based medical planning system for coronary interventions. In Medical Image Computing and Computer Assisted Intervention—MICCAI 2019; Springer: Cham, Switzerland, 2019; pp. 366–374. [Google Scholar]
- Simcenter STAR-CCM+. Available online: https://www.plm.automation.siemens.com/global/en/products/simcenter/STAR-CCM.html (accessed on 27 May 2021).
- Shapiro, M.; Raz, E.; Becske, T.; Nelson, P.K. Variable Porosity of the Pipeline Embolization Device in Straight and Curved Vessels: A Guide for Optimal Deployment Strategy. Am. J. Neuroradiol. 2014, 35, 727–733. [Google Scholar] [CrossRef] [Green Version]
- Appanaboyina, S.; Mut, F.; Löhner, R.; Putman, C.; Cebral, J. Simulation of intracranial aneurysm stenting: Techniques and challenges. Comput. Methods Appl. Mech. Eng. 2009, 198, 3567–3582. [Google Scholar] [CrossRef]
- Ugron, Á.; Paál, G. On the boundary conditions of cerebral aneurysm simulations. Period. Polytech. Mech. Eng. 2014, 58, 37–45. [Google Scholar] [CrossRef]
- Ford, M.D.; Alperin, N.; Lee, S.H.; Holdsworth, D.W.; Steinman, D.A. Characterization of volumetric flow rate waveforms in the normal internal carotid and vertebral arteries. Physiol. Meas. 2005, 26, 477–488. [Google Scholar] [CrossRef] [PubMed]
- Paraview. Available online: https://www.paraview.org/ (accessed on 28 January 2020).
- Blender. Available online: https://www.blender.org (accessed on 15 February 2020).
- Unity. Available online: https://unity.com/ (accessed on 20 February 2020).
- Doddasomayajula, R.; Chung, B.J.; Mut, F.; Jimenez, C.M.; Hamzei-Sichani, F.; Putman, C.M.; Cebral, J.R. Hemodynamic Characteristics of Ruptured and Unruptured Multiple Aneurysms at Mirror and Ipsilateral Locations. Am. J. Neuroradiol. 2017, 38, 2301–2307. [Google Scholar] [CrossRef] [PubMed] [Green Version]
- AlKhalili, K.; Hannallah, J.; Cobb, M.; Chalouhi, N.; Philips, J.L.; Echeverria, A.B.; Jabbour, P.; Babiker, M.H.; Frakes, D.H.; Gonzalez, L.F. The Effect of Stents in Cerebral Aneurysms: A Review. Asian J. Neurosurg. 2018, 13, 201–211. [Google Scholar] [CrossRef]
- Fiani, B.; De Stefano, F.; Kondilis, A.; Covarrubias, C.; Reier, L.; Sarhadi, K. Virtual Reality in Neurosurgery: Can You See It? A Review of the Current Applications and Future Potential. World Neurosurg. 2020, 141, 291–298. [Google Scholar] [CrossRef]
- Pelargos, P.E.; Nagasawa, D.T.; Lagman, C.; Tenn, S.; Demos, J.V.; Lee, S.J.; Bui, T.T.; Barnette, N.E.; Bhatt, N.S.; Ung, N.; et al. Utilizing virtual and augmented reality for educational and clinical enhancements in neurosurgery. J. Clin. Neurosci. 2017, 35, 1–4. [Google Scholar] [CrossRef] [PubMed]
- Baniasadi, T.; Ayyoubzadeh, S.M.; Mohammadzadeh, N. Challenges and Practical Considerations in Applying Virtual Reality in Medical Education and Treatment. Oman Med. J. 2020, 35, e125. [Google Scholar] [CrossRef]
- Garrett, B.; Taverner, T.; Gromala, D.; Tao, G.; Cordingley, E.; Sun, C. Virtual Reality Clinical Research: Promises and Challenges. JMIR Serious Games 2018, 6, e10839. [Google Scholar] [CrossRef]
Figure 1.
Proposed workflow for visualization of CFD analysis data in VR environment.

Figure 2.
Generated 3D model of cerebral aneurysm—all dimensions are in millimeters.

Figure 3.
Generated 3D model of stent.

Figure 4.
Generated 3D model of the cerebral aneurysm with a stent.

Figure 5.
Examples of the generated numerical grids with stents: (a) parent artery; (b) aneurysm.

Figure 6.
Volumetric flow rate waveform of idealized cardiac cycle [27].
Figure 6.
Volumetric flow rate waveform of idealized cardiac cycle [27].

Figure 7.
Filters to display the vessel walls colored by shear stress magnitude and velocity vectors colored by velocity magnitude in the ParaView viewport, t = t2.
Figure 7.
Filters to display the vessel walls colored by shear stress magnitude and velocity vectors colored by velocity magnitude in the ParaView viewport, t = t2.

Figure 8.
Particle tracer created in ParaView viewport, wthout-Stent: (a) the created filter; (b) particles colored by velocity magnitude at the first and tenth time steps.
Figure 8.
Particle tracer created in ParaView viewport, wthout-Stent: (a) the created filter; (b) particles colored by velocity magnitude at the first and tenth time steps.

Figure 9.
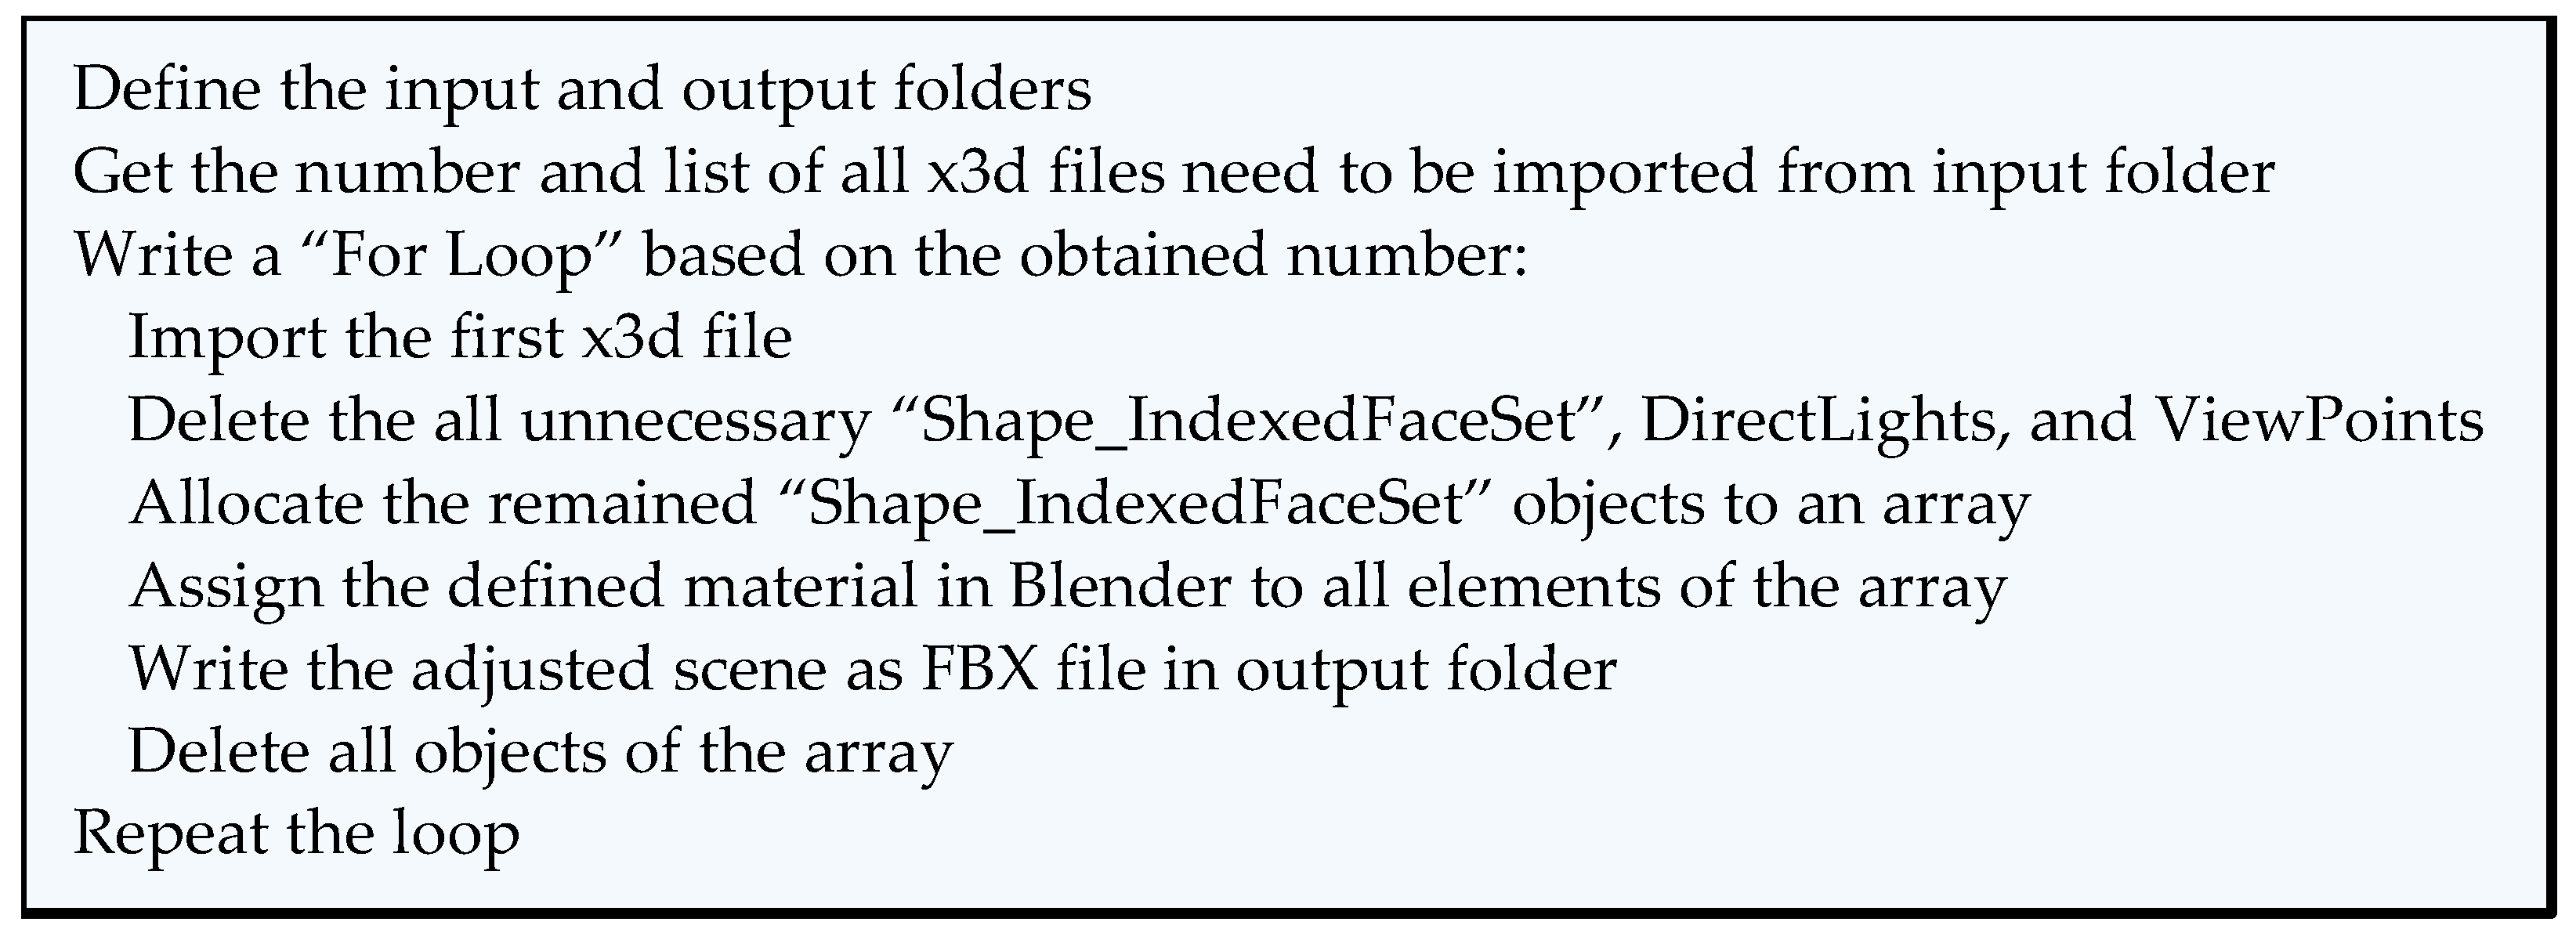
Algorithm of Macro written to automate the converting of ParaView post-processed unsteady CFD data to x3d files.
Figure 9.
Algorithm of Macro written to automate the converting of ParaView post-processed unsteady CFD data to x3d files.

Figure 10.
Algorithm of written Macro to automatically convert the results of each time step to an x3d file.
Figure 10.
Algorithm of written Macro to automatically convert the results of each time step to an x3d file.

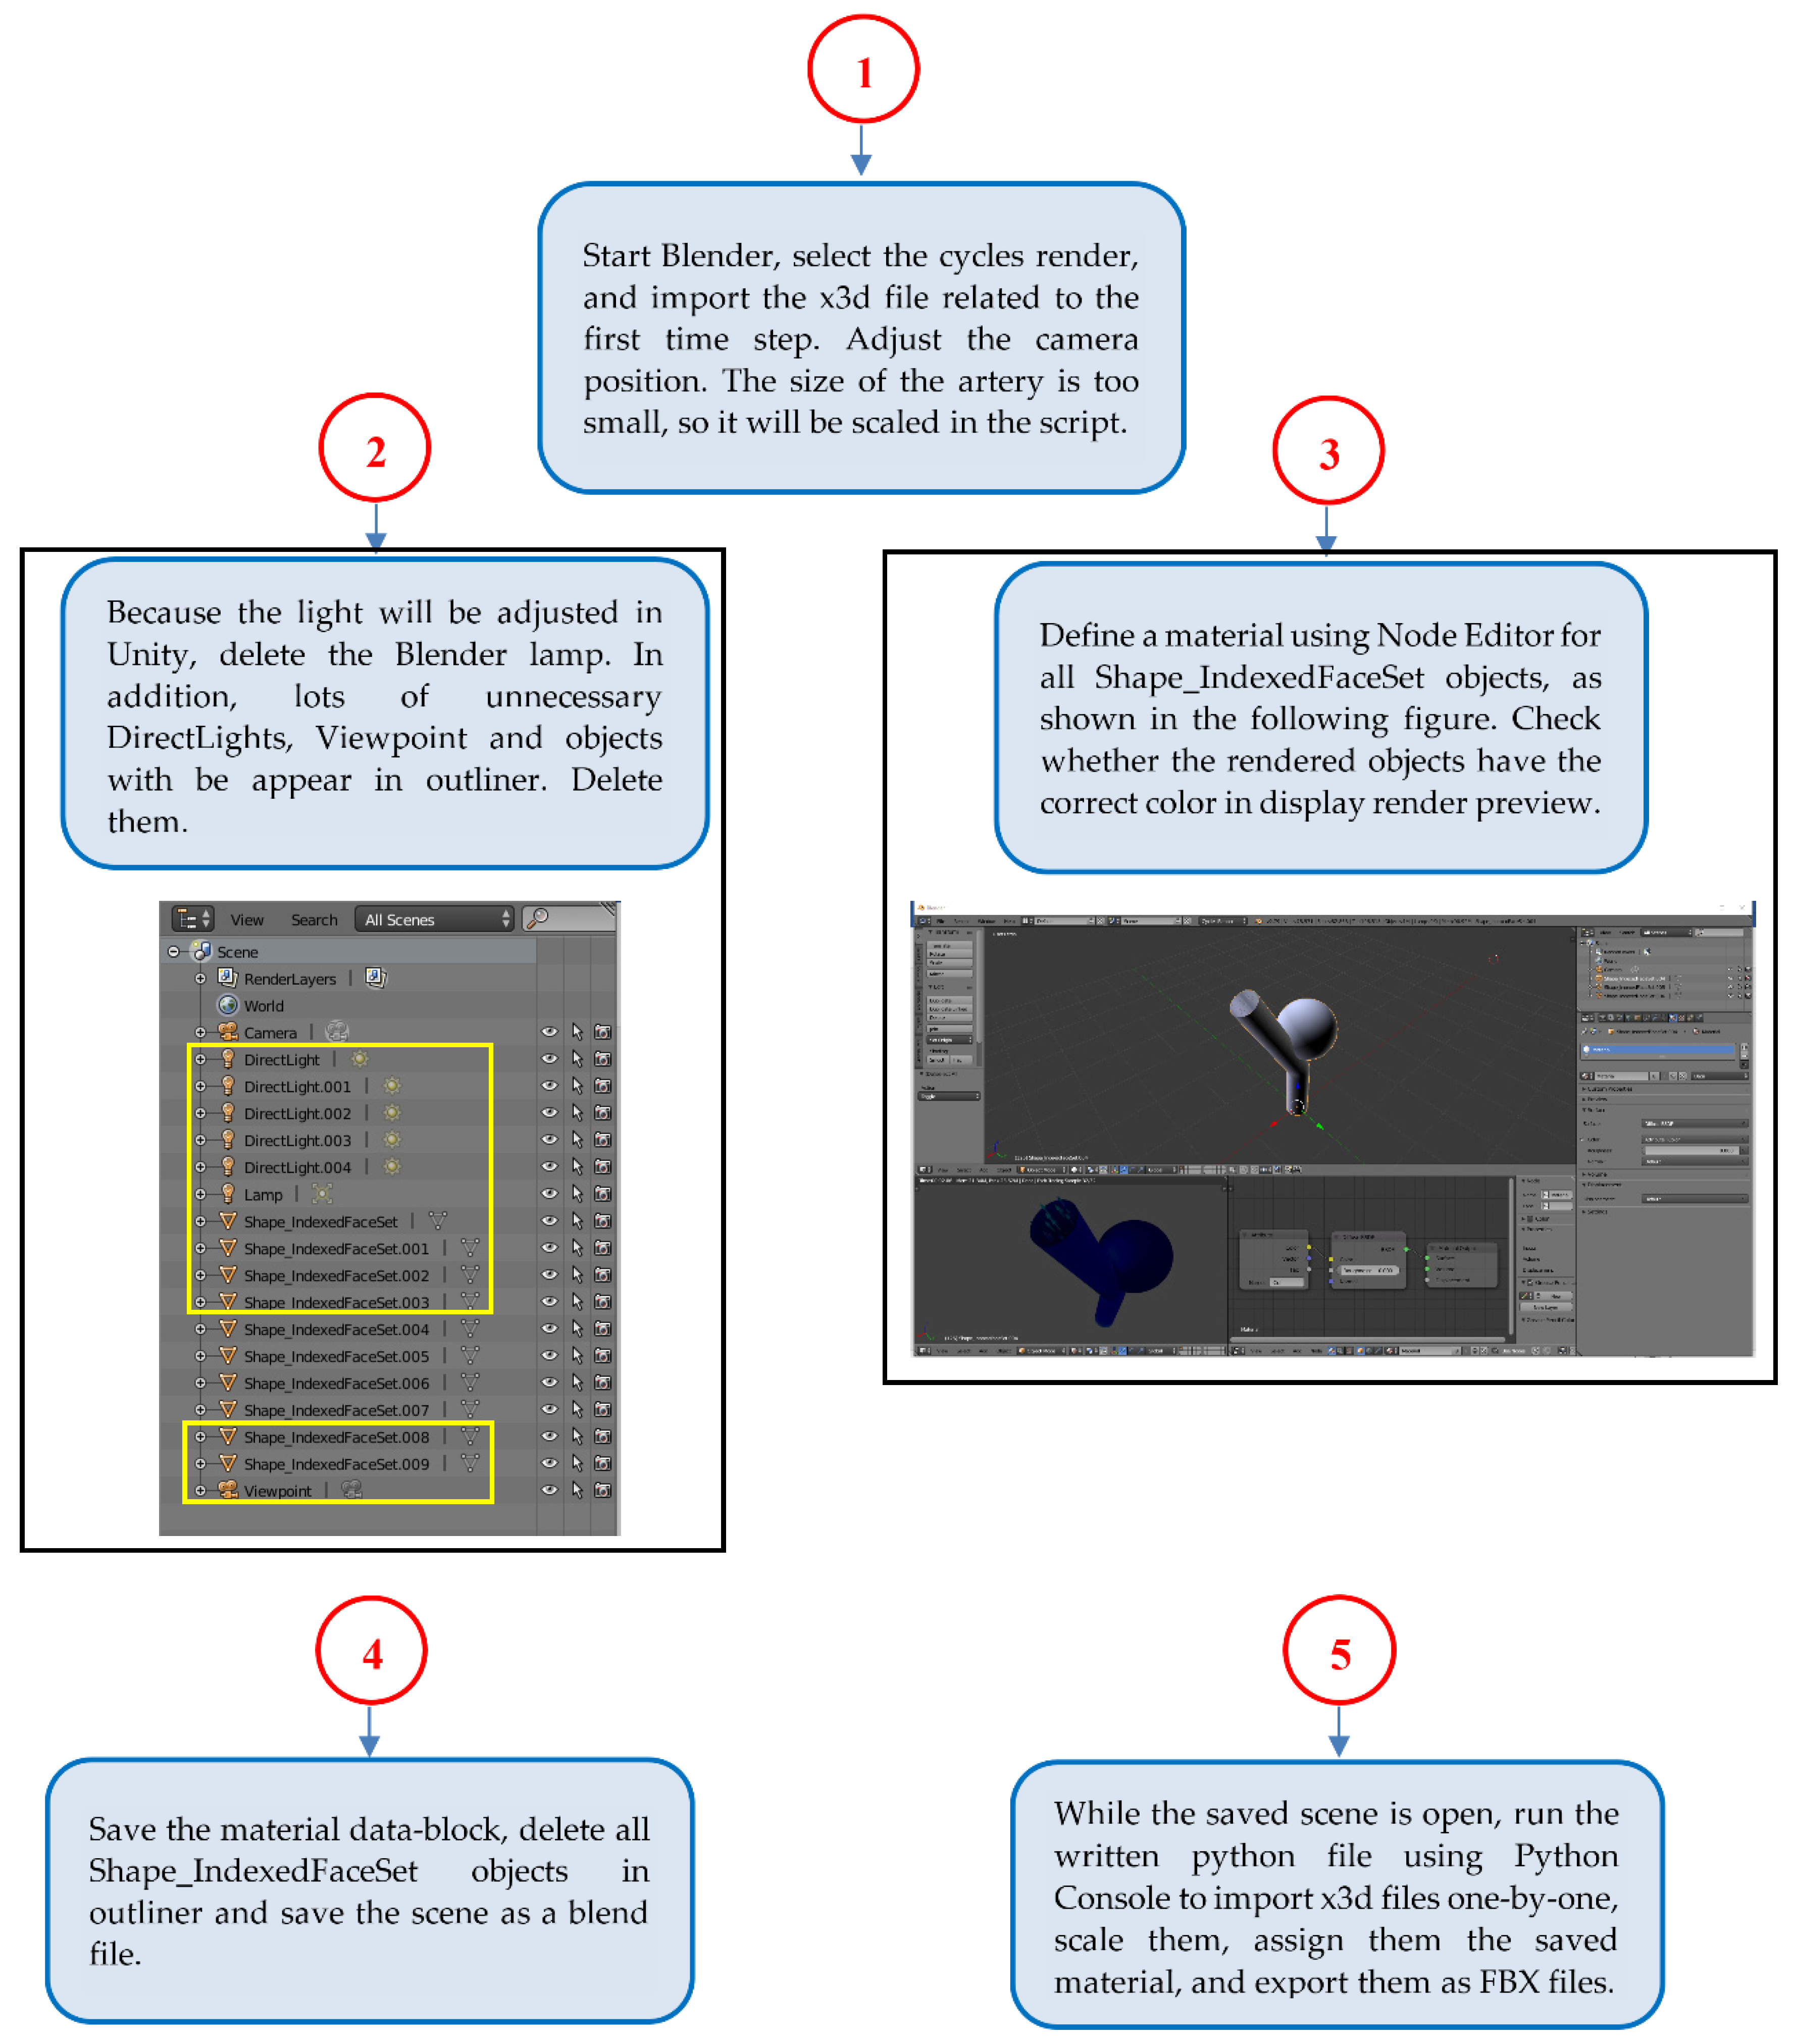
Figure 11.
Steps of converting x3d files to FBX files in Blender.

Figure 12.
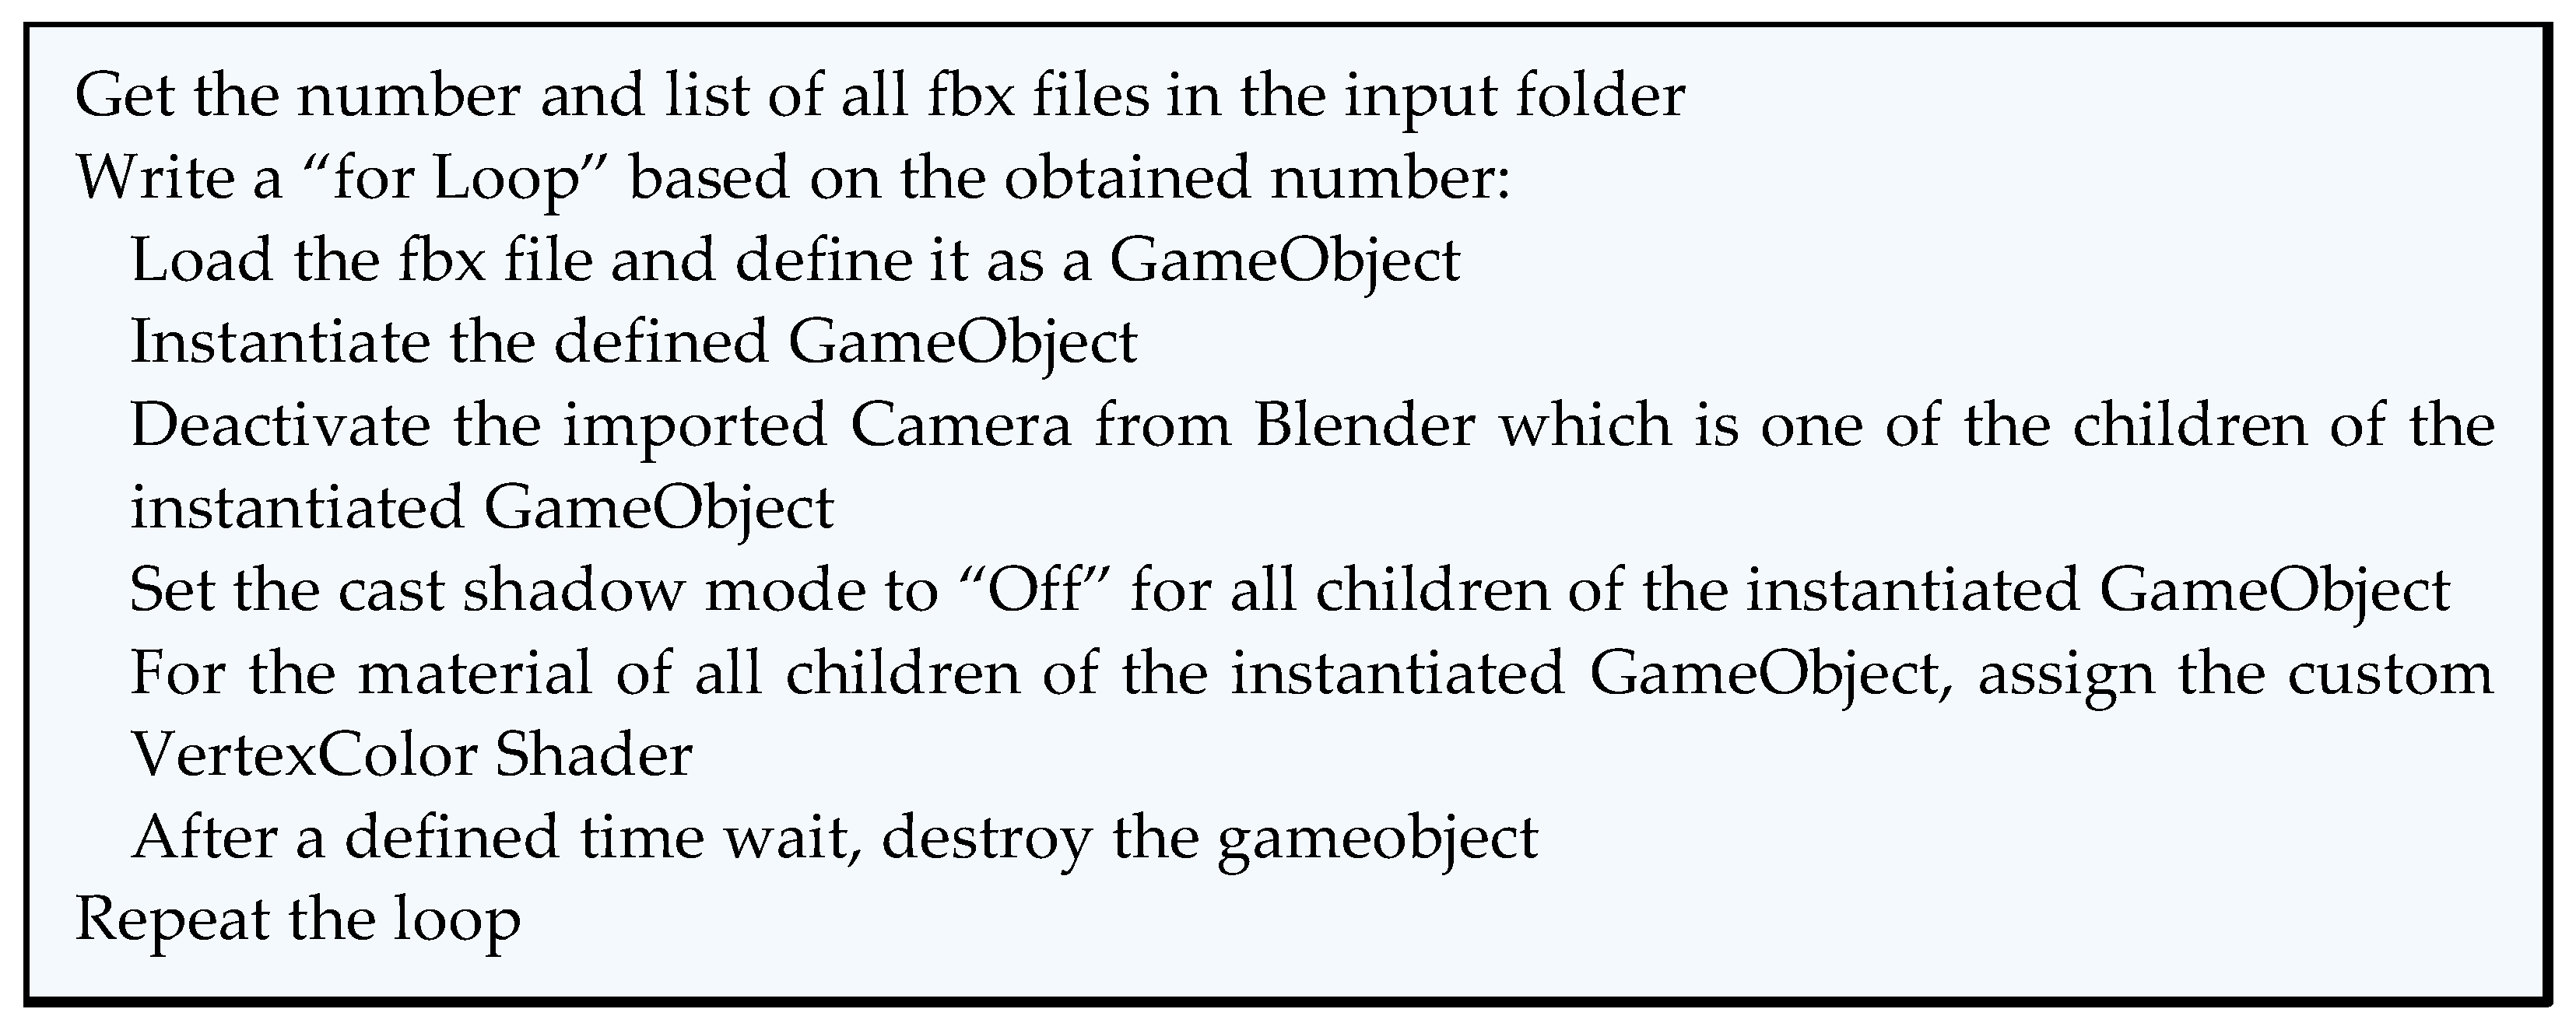
The algorithm of color adjusting and animation making using Unity C# script.

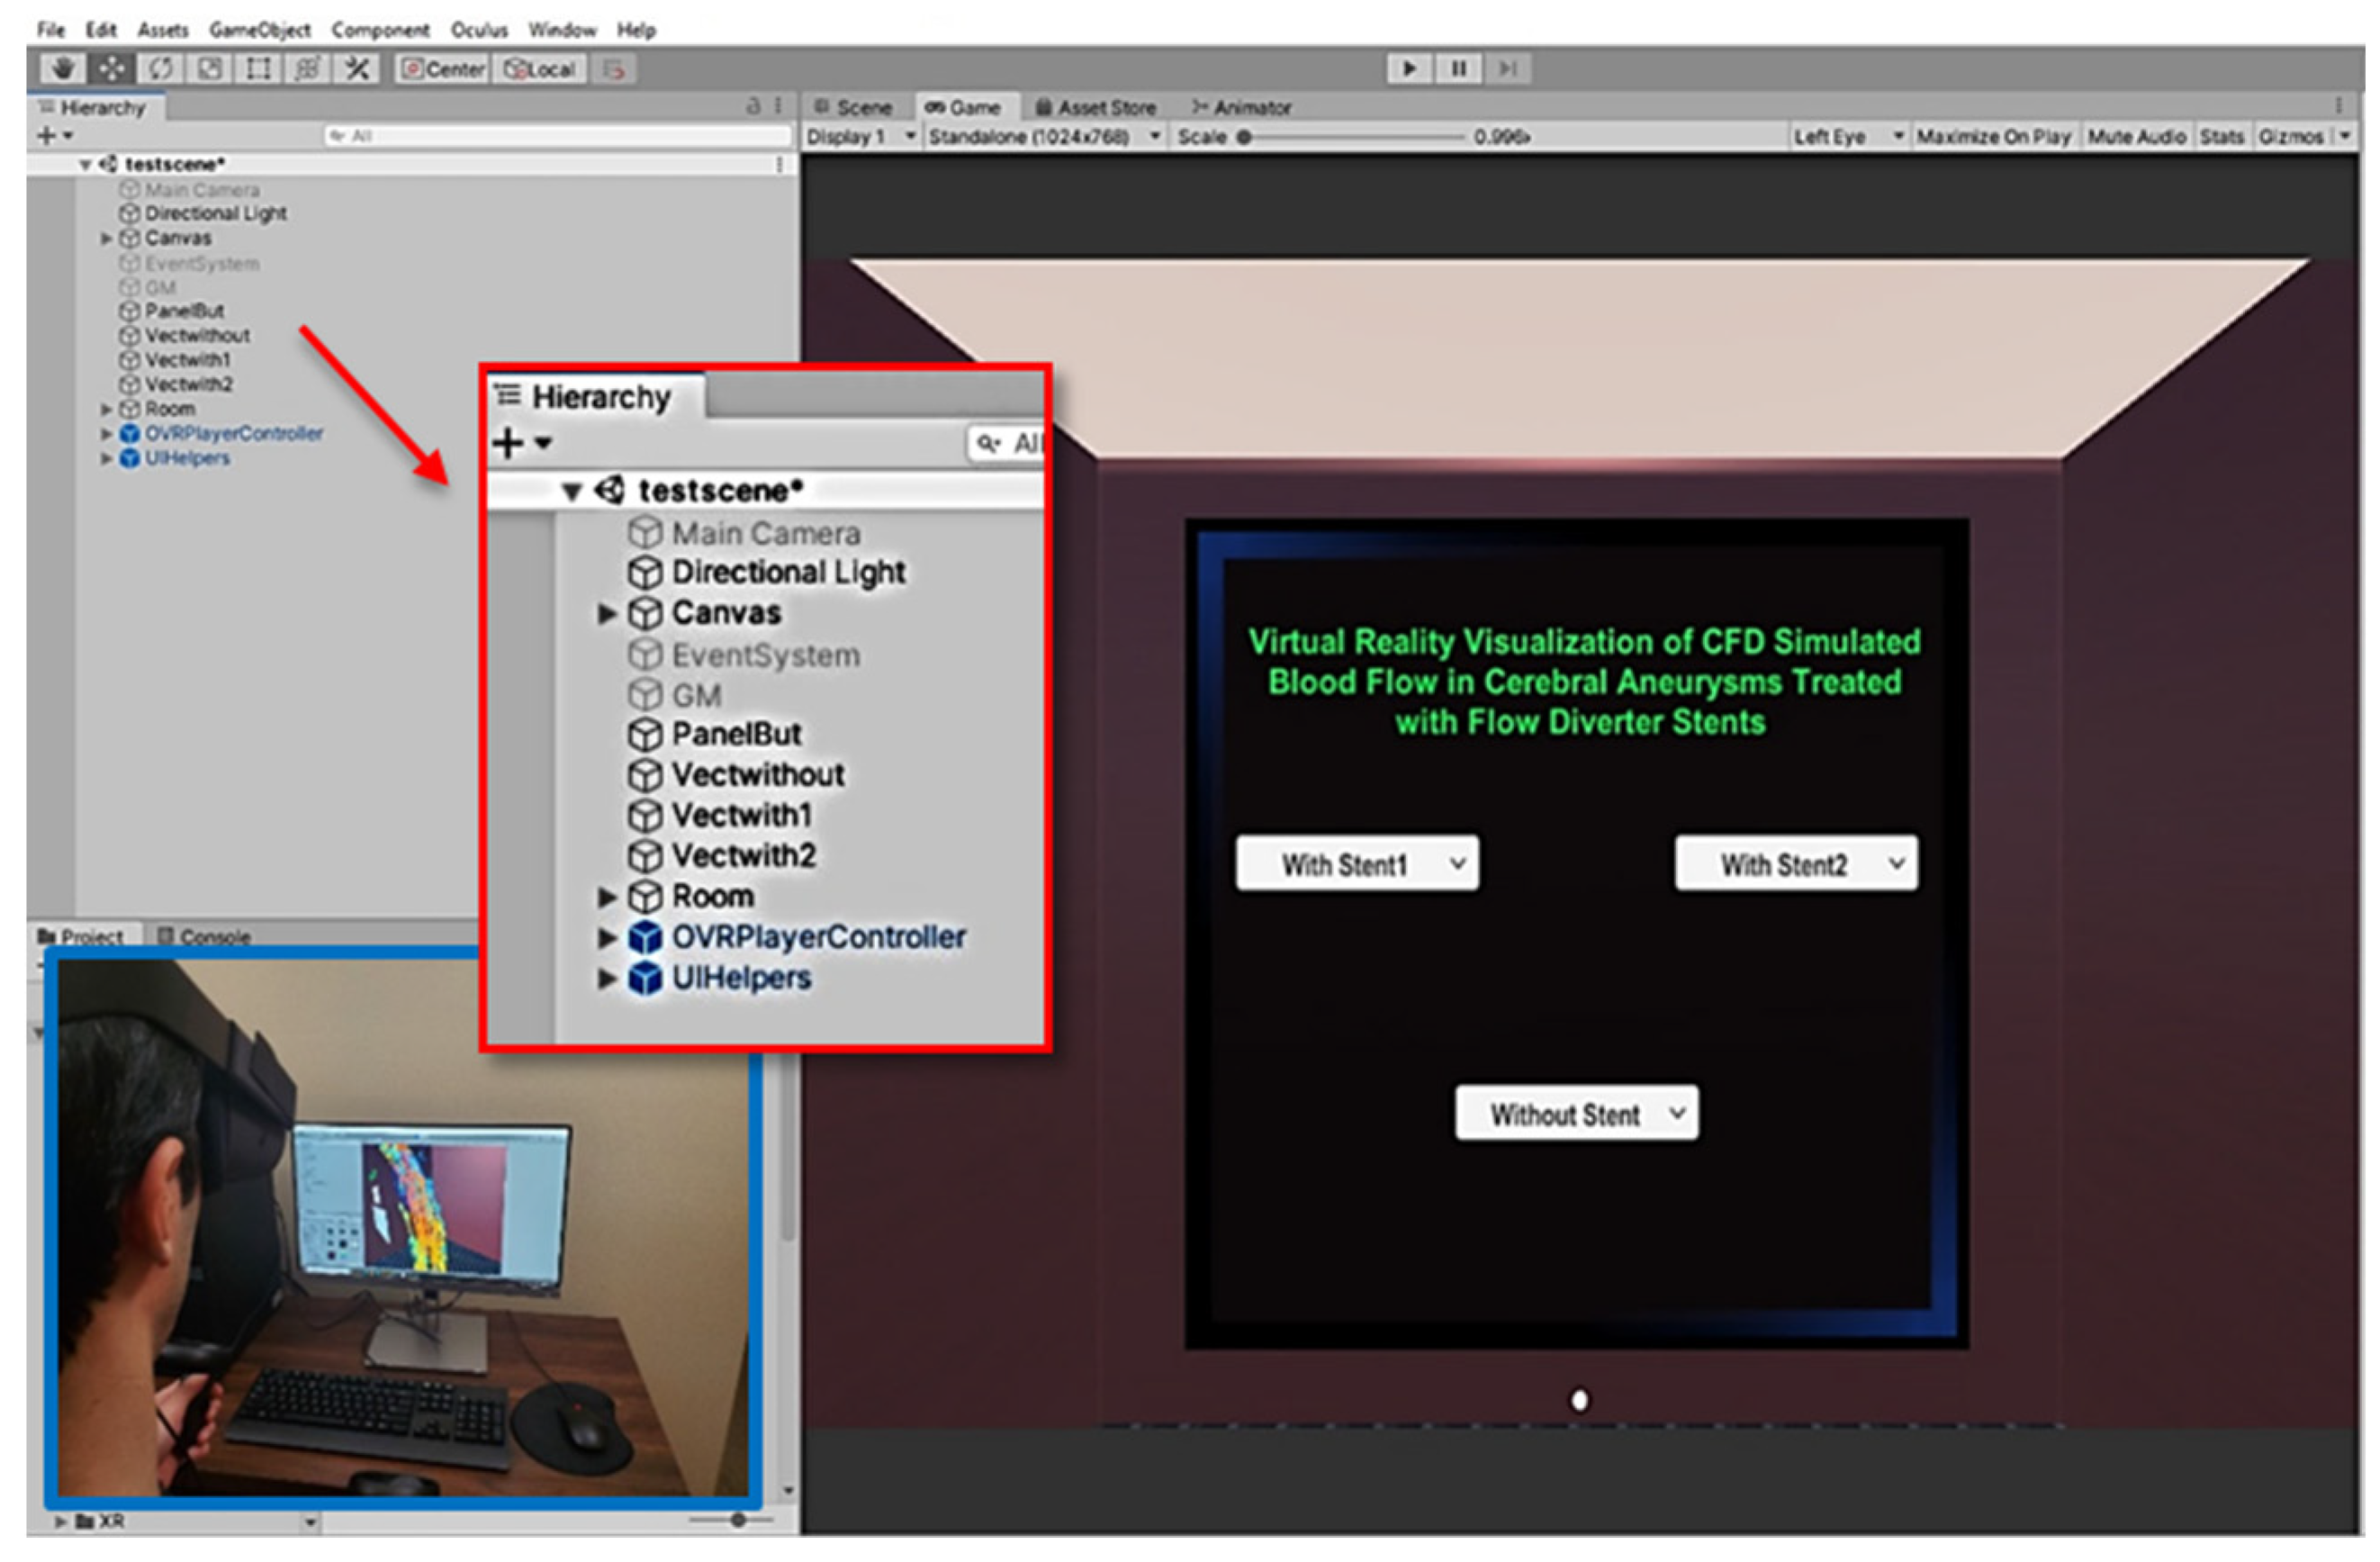
Figure 13.
UI menu for VR visualization of CFD results in Unity game mode.

Figure 14.
Velocity magnitude (m/s) contours on Slice1, t = t2: (a) Without-stent; (b) With-stent1; (c) With-stent2.
Figure 14.
Velocity magnitude (m/s) contours on Slice1, t = t2: (a) Without-stent; (b) With-stent1; (c) With-stent2.

Figure 15.
Velocity vectors, colored by velocity magnitude (m/s), displayed in VR environment, t = t2.
Figure 15.
Velocity vectors, colored by velocity magnitude (m/s), displayed in VR environment, t = t2.

Figure 16.
Streamlines, colored by velocity magnitude (m/s), displayed in VR environment, t = t2: (a) Without-stent; (b) With-stent1 (bottom: from Viewpoint 1); (c) With-stent2 (bottom: Viewpoint 1).
Figure 16.
Streamlines, colored by velocity magnitude (m/s), displayed in VR environment, t = t2: (a) Without-stent; (b) With-stent1 (bottom: from Viewpoint 1); (c) With-stent2 (bottom: Viewpoint 1).

Figure 17.
Wall shear stress magnitude (Pa) contours, t = t2: (a) Without-stent; (b) With-stent1; (c) With-stent2.
Figure 17.
Wall shear stress magnitude (Pa) contours, t = t2: (a) Without-stent; (b) With-stent1; (c) With-stent2.

Figure 18.
Velocity vectors, colored by velocity magnitude inside the vessel wall colored by WSS, displayed in VR environment, t = t2: (a) Without-stent; (b) With-stent1; (c) With-stent2.
Figure 18.
Velocity vectors, colored by velocity magnitude inside the vessel wall colored by WSS, displayed in VR environment, t = t2: (a) Without-stent; (b) With-stent1; (c) With-stent2.


Figure 19.
Velocity magnitude (m/s) on Slice 7, t = t2: (a) Without-stent; (b) With-stent1; (c) With-stent2.
Figure 19.
Velocity magnitude (m/s) on Slice 7, t = t2: (a) Without-stent; (b) With-stent1; (c) With-stent2.

Figure 20.
Velocity magnitude (m/s) on Slice 4: (a) Without-stent; (b) With-stent1; (c) With-stent2; (d) t = t2.
Figure 20.
Velocity magnitude (m/s) on Slice 4: (a) Without-stent; (b) With-stent1; (c) With-stent2; (d) t = t2.


Figure 21.
Velocity magnitude (m/s) contours on Slices 1 to 6, displayed in VR environment, t = t2: (a) Without-stent; (b) With-stent1; (c) With-stent2.
Figure 21.
Velocity magnitude (m/s) contours on Slices 1 to 6, displayed in VR environment, t = t2: (a) Without-stent; (b) With-stent1; (c) With-stent2.

Figure 22.
Point clouds colored by dimensionless pressure, Without-stent, t = t2.


Table 1.
Time-averaged hemodynamic parameters.
| Aneurysm-Averaged Wall Shear Stress on the Wall of the Sac (Pa) | Aneurysm-Averaged Kinetic Energy Inside the Sac (m2/s2) | Turnover Time (s) | |
|---|---|---|---|
| Without-stent | 0.771 | 0.00247 | 0.82 |
| With-stent1 | 0.963 | 0.00340 | 0.83 |
| With-stent2 | 0.356 | 0.00146 | 1.3 |
Publisher’s Note: MDPI stays neutral with regard to jurisdictional claims in published maps and institutional affiliations. |
© 2021 by the authors. Licensee MDPI, Basel, Switzerland. This article is an open access article distributed under the terms and conditions of the Creative Commons Attribution (CC BY) license (https://creativecommons.org/licenses/by/4.0/).
Share and Cite
MDPI and ACS Style
Baheri Islami, S.; Wesolowski, M.; Revell, W.; Chen, X. Virtual Reality Visualization of CFD Simulated Blood Flow in Cerebral Aneurysms Treated with Flow Diverter Stents. Appl. Sci. 2021, 11, 8082. https://doi.org/10.3390/app11178082
AMA Style
Baheri Islami S, Wesolowski M, Revell W, Chen X. Virtual Reality Visualization of CFD Simulated Blood Flow in Cerebral Aneurysms Treated with Flow Diverter Stents. Applied Sciences. 2021; 11(17):8082. https://doi.org/10.3390/app11178082
Chicago/Turabian StyleBaheri Islami, Sima, Mike Wesolowski, William Revell, and Xiongbiao Chen. 2021. "Virtual Reality Visualization of CFD Simulated Blood Flow in Cerebral Aneurysms Treated with Flow Diverter Stents" Applied Sciences 11, no. 17: 8082. https://doi.org/10.3390/app11178082
Note that from the first issue of 2016, this journal uses article numbers instead of page numbers. See further details here.