
Pile Base and Shaft Capacity under Various Types of Loading


Faculty of Civil Engineering, Wroclaw University of Science and Technology, Wybrzeże Wyspiańskiego 27, 50-370 Wrocław, Poland
*
Author to whom correspondence should be addressed.
Appl. Sci. 2021, 11(8), 3396; https://doi.org/10.3390/app11083396
Submission received: 24 February 2021
/
Revised: 28 March 2021
/
Accepted: 1 April 2021
/
Published: 10 April 2021
(This article belongs to the Special Issue Advances in Geotechnologies in Infrastructure Engineering)
Abstract
:Pile bearing capacity is usually understood as the sum of the bearing capacities of the pile’s base and shaft. Nevertheless, the behaviour of the pile base and shaft can be different, depending on what testing method is used for the evaluation of the bearing capacity. In this paper, three different methods of pipe pile testing are introduced, which make it possible to evaluate the pile base and shaft bearing capacities. On the basis of the tests conducted on a laboratory scale and numerical simulations performed with the finite element method, different approaches to bearing capacity evaluation have been compared. As a result, some similarities and differences between the applied methods are presented.
1. Introduction
Most of the traditional methods used to estimate the bearing capacity of a single pile are based on the concept that the total pile capacity is the sum of the base and the shaft capacities [1]. The unit resistance values on the shaft surface and the pile base can be determined using various empirical correlations developed from different soil testing methods [2,3]. However, it is assumed that there is no mutual relationship between the base and shaft capacities. There is also a general agreement that, on the basis of the estimated unit resistances, in some cases, it is impossible to determine the pile bearing capacity with an accuracy greater than 30% [4].
Static load testing is considered the most reliable method for assessing the pile behaviour under an applied load. Nevertheless, the test only makes it possible to determine the bearing capacity of the whole pile. Determining the behaviour of the pile’s base and shaft requires conducting tests on specially instrumented piles [5]. In some cases, an alternative method to the static load test may be a bidirectional static load test, originally proposed by Osterberg [6]. In this test, the capacity of the pile base and shaft can be measured separately without the necessity of building a retaining structure. Nevertheless, the results obtained from the Osterberg test differ from the pile bearing capacity estimated in the traditional test due to different working conditions of the shaft and the base in these two tests. Appropriate determination of these differences can make it possible to verify the method and better apply the bidirectional tests in the analysis of the pile bearing capacity.
In this paper, three methods of pile bearing capacity examination were introduced, including traditional static load tests with the load applied to both the whole pile and the pile base and the method of bidirectional static load test [7] developed by the authors. For the proposed method, tests on laboratory-scale models of pipe piles were carried out, and numerical simulations of the tests were performed. The results of the base and shaft load capacities obtained from the tests were compared, and future recommendations were proposed. This paper is part of a bigger research program concerning tests for a new bidirectional load testing method on real-scale piles [7,8,9,10], model piles [11], and numerical simulations.
2. Pile Bearing Capacity
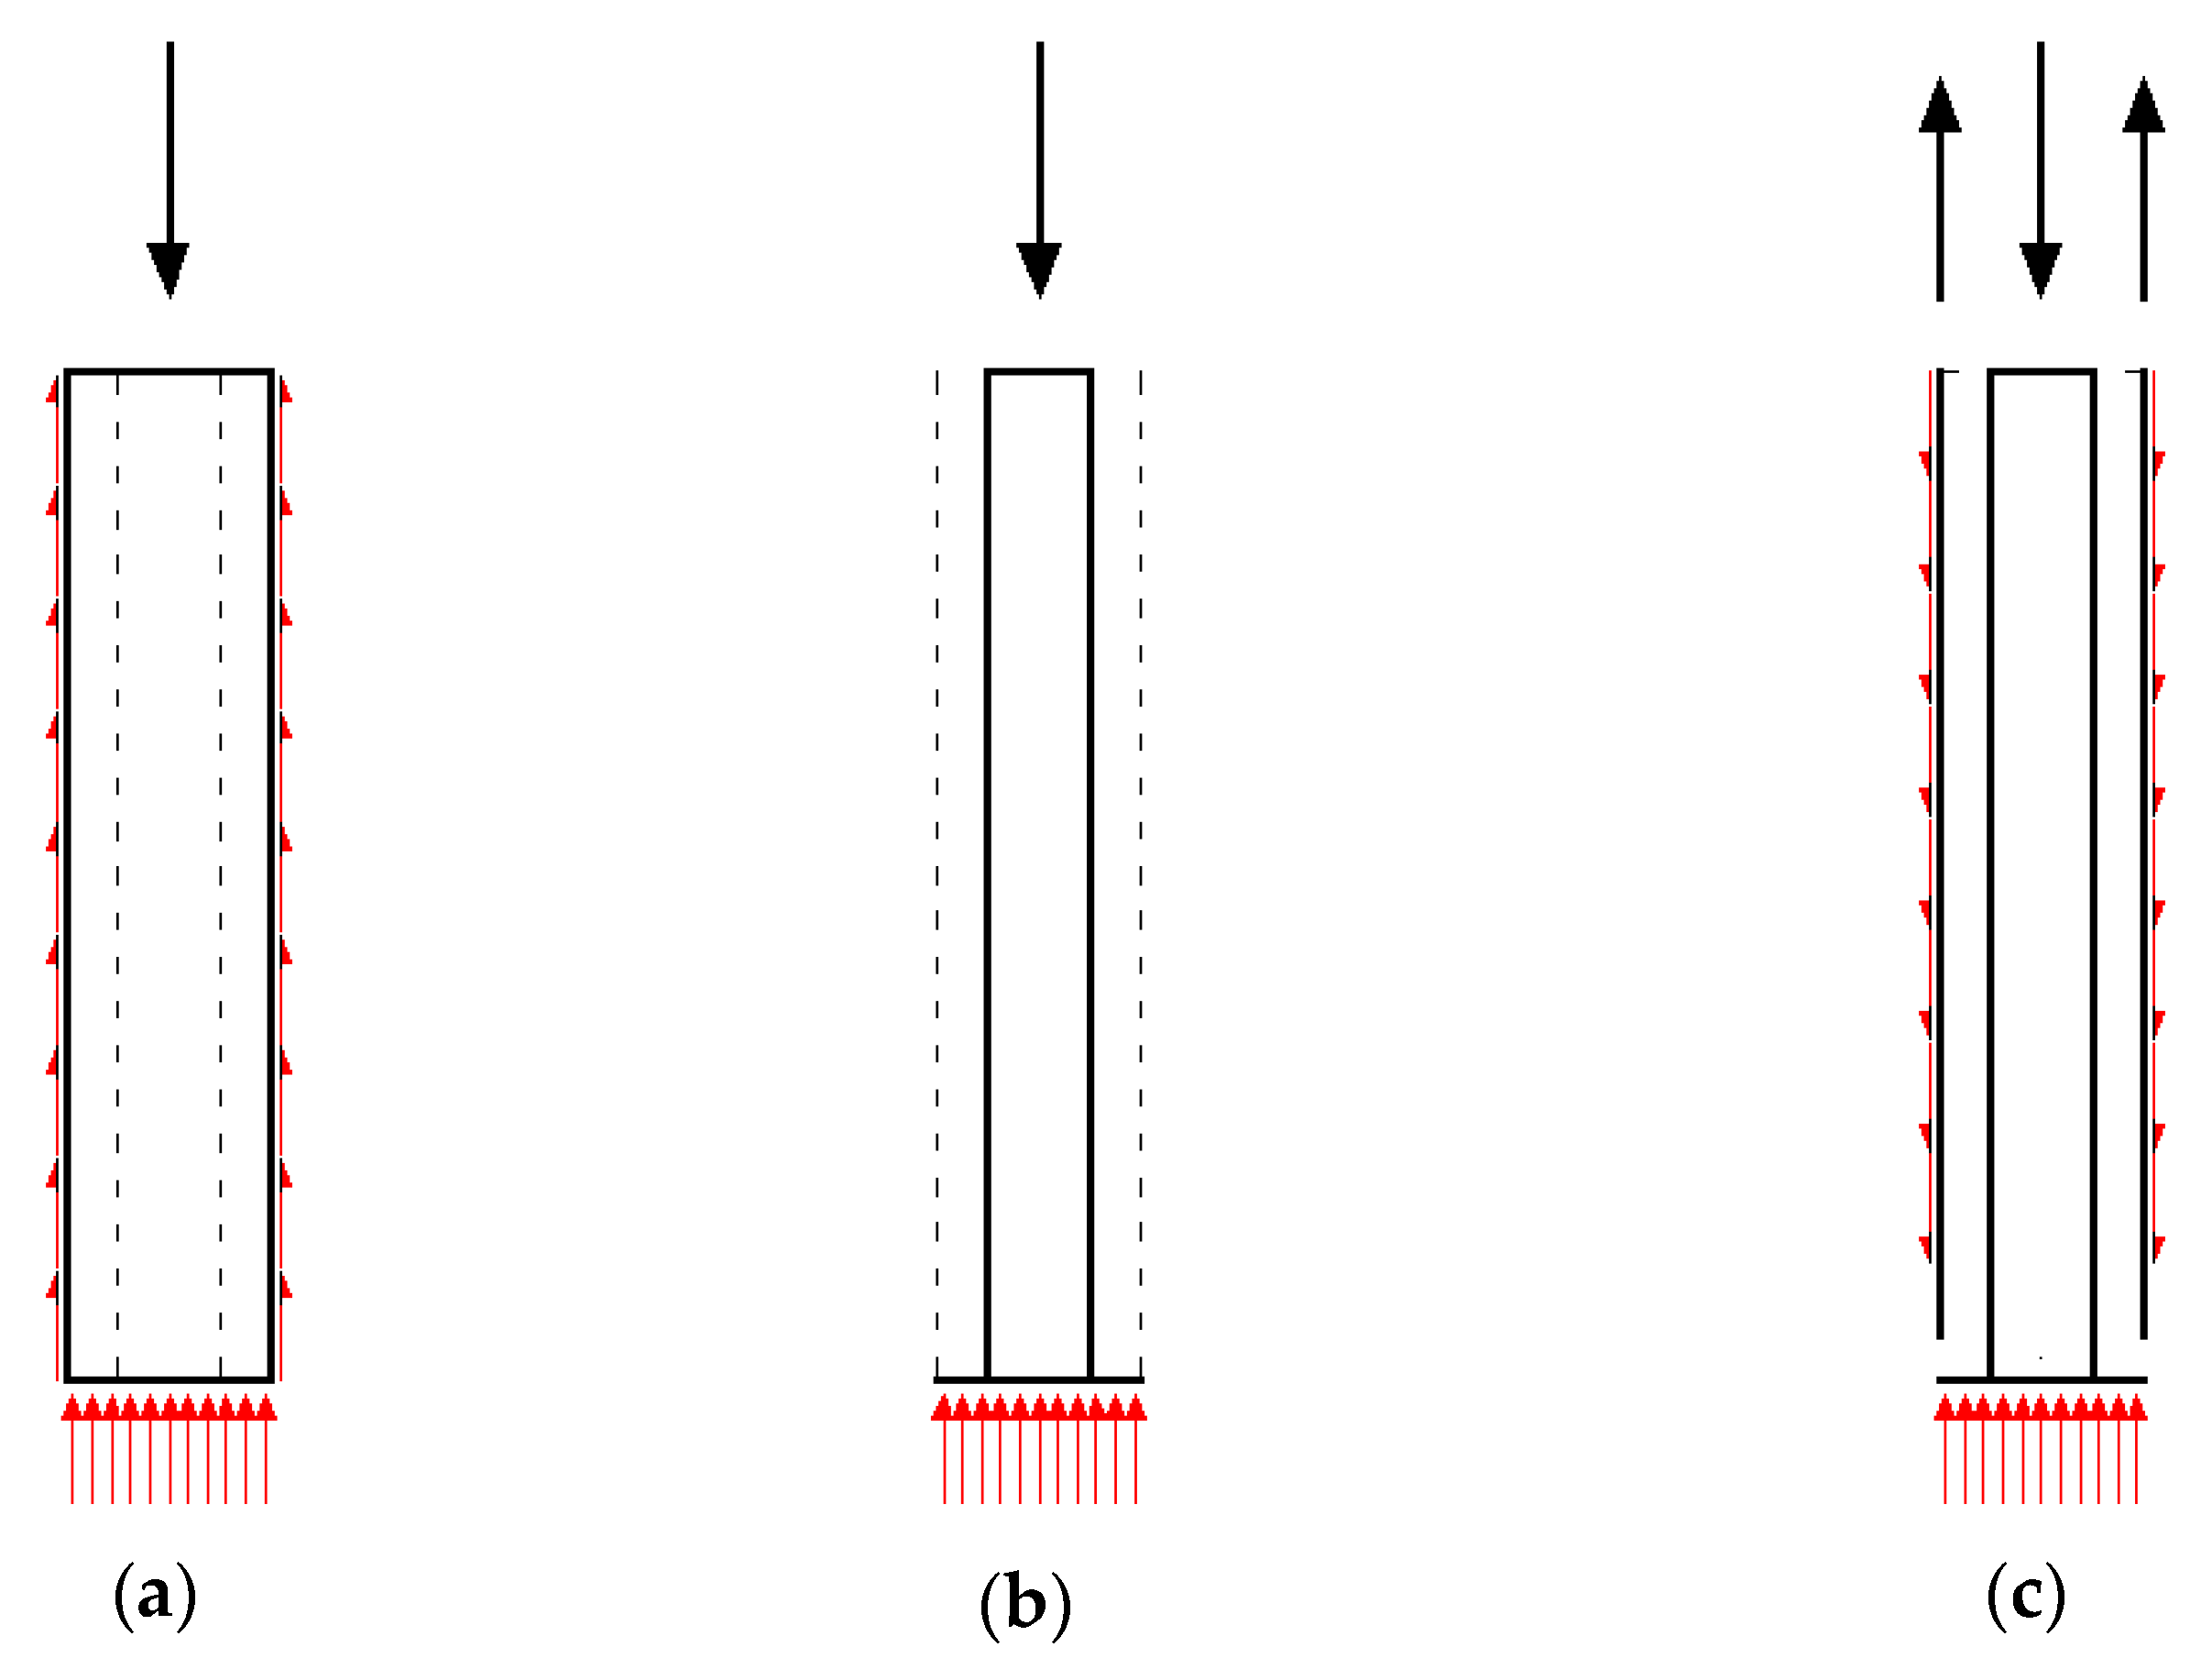
For piles in compression, the load applied to the pile is transferred separately by the pressure resistance on the pile base and by the friction resistance on the shaft (Figure 1a). For uplift piles, it is assumed that the load is transferred only by uplift shaft friction (Figure 1b). For the piles under a bidirectional load, the compression of the base is accompanied by the uplift of the shaft (Figure 1c). The state of stress around the pile for each of these three cases is different and may generate different load capacities.
2.1. Base Bearing Capacity
The load on the pile base is transferred to the soil by pressure. The value of unit resistance generated under the base depends on the type and condition of the soil underneath the pile base, the level of stresses at the base level, installation effects, and many other factors [4,12,13]. During the installation of a pile, additional residual stresses may appear as a result of soil displacement [14] (deformations created during the installation of displacement piles). Soil setup (increasing capacity) may also be observed due to pore pressure dissipation during soil reconsolidation. According to [14], residual stresses can cause the overestimation of the shaft bearing capacity and the underestimation of the base bearing capacity.
Determining the pile base bearing capacity in a traditional static load test requires the use of specially instrumented piles [15]. Separate behaviour of the pile base under a load can be tested during the bidirectional test [9], although different conditions of the test can influence the bearing capacity of the pile base.
2.2. Shaft Bearing Capacity
The physical behaviour of the pile shaft is different from its base. The unit resistances on the shaft surface result from the shear friction at pile–soil contact. Its values depend mainly on the stress around the pile and after the pile installation [16]. The shaft friction value is also influenced by the friction between the pile and the soil, usually determined by the angle δ. The values of the angle δ can be determined from shear tests for various materials. Kishida and Uesugi examined δ for various surface roughness and they determined tan δ in the range of 0.75–1.00 [17]. The determination of the δ parameter was also discussed in several other works, e.g., [18] and [19].
The shaft bearing capacity for an uplift pile is slightly lower than for a compression pile, and it is estimated by most design guidelines to be around 70%–90% [4]. De Nicola and Randolph in their work [20] conducted a parametric study for piles in an elastic and perfectly plastic Mohr–Coulomb model. On the basis of the research, they proposed the following relationship
where η–compressibility parameter, Qc–compressive shaft capacity of a pile, Qt–tensile shaft capacity of a pile, Gave, Ep, νp–average shear modulus of soil, Young’s modulus of the pile, and Poisson’s ratio of the pile, respectively. De Nicola and Randolph observed that even for a large variety of Gave/Ep—despite not taking into account other effects (e.g., local changes in stresses caused by dilatation)—the ratio Qt/Qc remains within the range of 0.7–0.85.
2.3. Concept of the New Method of Bidirectional Static Load Testing
The bidirectional test allows for conducting the static load test without retaining structure as the loading force is balanced within the testing appliance (Figure 2c). This kind of test was originally introduced by Osterberg [6]. Similar tests were also carried out in Austria [21], Slovakia [22], Poland [7], Serbia [23], and the USA [24].
The proposed research method requires two steel pipes with different diameters and similar lengths for the tests. The outer pipe with a larger diameter is installed in the ground with a loose steel shoe beneath. Inside the installed pipe, a second pipe is placed. On the prepared stand, three stages of the test can be performed (Figure 2).
In the first stage, the load is applied to the outer pipe by means of a hydraulic cylinder (Figure 2a). The second stage is similar to the first one, although this time the load is applied only to the inner tube, which allows only for measurement of the pile base bearing capacity (Figure 2b). In the third stage, the load is also applied to the inner tube, but this time the support structure is bolted to the outer tube (Figure 2c).
During the measurements, the steel shoe (inner pipe + shoe) is pressed into the ground, and at the same time the outer pipe, working solely by friction on its shaft, is uplifted vertically with the same force. The result of the tests, in the first stage, is the Q-s curve for the whole pile and, in the second stage, for its base. During the tests in the third stage, two Q-s curves are obtained, one for the uplift shaft and the other for the pressed base.
Additionally, with the conducted tests, it is possible to plot a Q-s diagram for the pile shaft under compression loading. For this purpose, the Osterberg method [6], originally developed to determine an equivalent Q-s plot from the results of the bidirectional test, can be applied. The method for constructing the shaft curve is presented in Figure 3.
The main assumption in the construction of the curve is that every point in the curve of a pile is a sum of load points on the base and shaft curves for the same displacement. The process of curve construction is divided into a few steps. At first, both curves for the whole pile and pile base are divided into a series of points. Then, two points from both curves are selected for the same displacement values and a new point is created. It has the same value of displacement, but the value of load results from subtracting the loads for these two points selected. This procedure is repeated for successive points until the whole curve Q-s of the pile shaft can be drawn.
3. Model Pile Tests on a Laboratory Scale
Model tests can provide valuable information on the behaviour of real objects when there are problems with conducting a full-scale test. The main limitation of laboratory tests is the difficulty of transferring the obtained results to real objects due to the scale effect. The tests on pile models were repeated by various authors [25,26,27,28,29,30].
For actual tests on a laboratory scale, a test setup was constructed in which six models of piles scaled 1:10 were prepared. In [11], a comparison of the traditional static load test with the bidirectional static load test was described. This paper focuses on a more detailed analysis of the pile base and shaft behaviour during different types of pile testing methods.
3.1. Test Stand
The rigid box prepared for measuring the load capacity of model piles is shown in Figure 4. It was 1.5 m high and the internal dimensions in the plan were 1.25 × 1.15 m.
The box was filled with sand to a total height of 120 cm. Six steel pipes, each 1.0 m long, with a 4.2-cm outer diameter and a 0.25-cm wall thickness, were used for the test as pile models. The pile base included a rigid steel cap with a diameter equal to the pipe diameter, which was loosely placed under the pipe during its driving. Moreover, all caps included a thread, which enabled the rods to be screwed to them. The pile models were driven using a light dynamic penetrometer. The degree of soil compaction in the box was determined to be about ID = 0.5. A detailed description of the test stand is included in [11].
3.2. Loading and Monitoring Mechanism
Three types of tests, introduced in Section 2.3, were performed on the pile models (Figure 5). The first stage of the study was to perform the static load test on piles after applying the load to the head of the pile model, which allowed for the determination of the Q-s curve for the whole pile (Figure 5b). The load in the test was gradually applied by means of the jack, and the displacements were measured for the subsequent load steps. The test was carried out until the bearing capacity was achieved.
In order to determine the Q-s curve of the pile base, a rod from the dynamic probe was placed inside the steel pipe and screwed to the steel bottom. The applied load was transmitted by the rod only to the base of the pile (Figure 5b) until the bearing capacity was achieved. The last stage of the research involved conducting bidirectional tests by applying a load to the pile base, but with the jack spreading with an additional retaining structure integrated with the outer pipe. Therefore, increasing the load simultaneously caused compression of the base and uplift of the shaft. The tests were finished when one of the two tested elements (base or shaft) achieved load capacity.
3.3. Results
The results of the measurements as Q-s curves obtained from the tests for the six pile models are presented in Figure 6. Additionally, for every pile model, Q-s curve for the pile shaft in compression was evaluated, with the method proposed in Section 2.3 and also presented in Figure 6. The shape of the curves and the bearing capacity were evaluated with the Brinch–Hansen 80% method. Every chart includes results of the whole pile test, the pile base test, the bidirectional static load test, and a constructed curve describing the behaviour of the shaft under compression load. The load capacities obtained from every curve for each pile are presented in Table 1. The comparison between pile base and shaft capacities as Rb,s/Rb and Rs,s/Rs ratios are also shown in Table 1.
4. Numerical Simulations
The precise numerical simulations of pile behaviour in soil can still be a problematic issue [31]. This is mainly due to the complexity of the processes appearing in the soil during and after pile installation. Its influence on stresses and soil properties in the pile vicinity, and consequently on pile bearing capacity, can be significant and even experimentally, it still has not been examined accurately enough [24,32].
An example of a simple model estimating the impact of a pile installation has been introduced by Broere and van Tol [31] and by Krasinski [33]. The more advanced models can better reflect some of the issues related to the installation of a pile in the ground; however, their implementation is more difficult than simple FEM (Finite Element Method) models [32].
4.1. Model Assumptions
For a more thorough examination of different aspects of pile base and shaft behaviour, a simple numerical model was proposed to simulate the different methods of pile testing. The model was prepared for a steel pipe pile 8.0 m in length and 0.4 m in diameter, placed in a homogeneous soil. The calculations were conducted using the finite element method in the PLAXIS® v.7.2 software (Bentley Systems, Incorporated, 685 Stockton Drive, Exton, PA, USA) [34] under the conditions of axial symmetry, with the use of six-node elements. After preliminary simulations, the calculation area was established as a cylinder with a radius of 10.0 m and a height of 15.0 m, while the pile has a radius of 0.2 m and a length of 8.0 m. The FEM mesh in the model was additionally densified in the 1.0-m zone around the pile. The calculation area with the generated finite element mesh and boundary conditions is presented in Figure 7.
The steel elements of the pile were modelled as the elastic beam elements, while the soil layer was modelled as the volumetric elements with the parameters of the Hardening Soil model [35]. Between the pile and soil elements, an interface layer was modelled. The simulations were performed in three stages similar to the research performed in the experimental test. For the given parameters of the model, three test stages were simulated (Figure 2), i.e., the simulation of the traditional static load test, the static load test of a single base, and the bidirectional test.
4.2. Model Parameters
Numerical simulations performed by Wehnert and Vermeer [36] proved that the Hardening Soil model allows for better modelling of the pile performance due to the hyperbolic load–strain relationship and the linear relationship between unloading and reloading. Each simulation stage was performed in a homogeneous subsoil for three different subsoil models, representing coarse, medium, and fine sands. Based on the soil parameters determined from the actual soil tests, the parameters for the Hardening Soil model were derived. They were determined using the assumptions and correlations collected in [34,37]. The soil parameters for each soil model are presented in Table 2.
The pipe pile and steel shoe were modelled as beam elastic elements with E = 210.0 GPa and ν = 0.3. The width of the elements was assumed to be 0.05 m for the pipes and 0.1 m for the shoe. On this basis, the parameters of the beam elements were determined (Table 3).
The test simulations were carried out for different values of the interface parameter R between the pile and soil (R = 0.900, R = 0.750, R = 0.666)
4.3. Load Application
In simulations, the same three types of pile tests that were carried out in the experimental tests were performed. The methods of applying the load in numerical models are presented in Figure 8. The bold lines in Figure 8 show the beam elements, which simulate the pipe and the steel shoe of the pile. Traditional static load tests were modelled by applying a concentrated force to the pile head, and the load was transferred to the soil through coupled beam elements: vertical (pipe) and horizontal (shoe) (Figure 8a). The static load tests of the pile base carried out through the inner tube were modelled by applying a concentrated force to the steel shoe (Figure 8b). A small crack was modelled between the vertical and horizontal beam, allowing for the displacement of the horizontal beam. The bidirectional tests were conducted on a similar model to the previous one; however, apart from the force applied to the pile base, there was an additional vertical concentrated force applied to the vertical beam element, which allowed for the simulation of the uplift of the outer pipe during the test (Figure 8c).
4.4. Results of Simulation
The results of the simulations are presented in the Q-s curves in Figure 9, Figure 10 and Figure 11. The results of the calculations were grouped depending on the soil models used for the simulations. For each type of soil, the results are presented on three diagrams with a different parameter (R) applied. Every diagram contains results of the simulation of the traditional static load test, the static load test with a load applied to the pile base, and the bidirectional static load test. Additionally, the Q-s curve, imitating the behaviour of the pile shaft due to compression load, was constructed. The load capacities obtained from every curve for each pile and Rb,s/Rb and Rs,s/Rs ratios are presented in Table 4.
5. Discussion
The main purpose of the measurements was to compare the results of the bearing capacity of the pile base and pile shaft in different load conditions. For the pile base, slight differences were observed between the results from the static load test and the bidirectional static load test. For laboratory tests, the ratio Rb,s/Rb is in the range of 0.91–1.03, and 0.88–1.11 for numerical tests. Therefore, the maximum difference between different types of tests reaches 12%. This shows that the load-applying method has little effect on the value of the pile base bearing capacity.
However, comparing the shaft bearing capacity reveals larger differences between loading methods. For laboratory tests, the ratio Rs,s/Rs is in the range of 0.51–0.89, and for numerical tests in the range of 0.66–0.99. Therefore, the differences reach 49% in the laboratory tests and 34% in the case of numerical simulations. The differences are slightly larger than those reported in the literature [19]. From the numerical simulations, it was observed that larger differences occur for higher values of the R coefficient of the interface layer. This shows that the rougher the pile surface is, the greater the Rs,s/Rs ratio can be expected.
However, it should be mentioned that the measured values of shaft bearing capacity are different from the normal compression and uplift conditions. The uplift capacity is based on bidirectional tests, while the compression capacity is constructed from the full static test results of the whole pile and pile base. This may cause slightly different results to what the literature indicates. The analysis did not also include the residual values, which, when taken into account, could result in smaller differences.
6. Conclusions
In this paper, a comparison of the load-bearing capacity of the pile base and shaft with different methods of applying the load was introduced. For this purpose, tests were carried out on laboratory-scale pile models, and numerical simulations were performed. The tests were carried out for the load applied to the whole pile, the pile base, and for bidirectional static load tests. The results of the conducted tests showed small differences between the base bearing capacities and more substantial differences between shaft bearing capacities.
For a more thorough investigation of this issue, the research should be repeated for other soil conditions, pile dimensions, and technologies. Furthermore, for a better examination of this issue, it is necessary to carry out the tests on uplift piles and to examine the bearing capacity of the base and the shaft using the traditional static load test. However, the latter requires conducting a test on fully instrumented piles.
Moreover, further verification of the proposed numerical model requires simulation of other real tests in various ground conditions. In the performed simulations, however, there are some discrepancies in the representation of the level of stresses, deformations, and plastic phenomena in the soil, but this problem is still present in the simulations of the pile installation using the finite element method. Improving the convergence of the solution in these areas would require the application of more complex numerical methods.
Determining the exact relationship of the base and shaft bearing capacity between different types of tests may allow better application of other types of tests, e.g., bidirectional tests to determine the bearing capacity of piles, and consequently to a better design of pile foundations.
Author Contributions
Conceptualization, M.B. and J.R.; Data curation, M.B.; Formal analysis, M.B.; Funding acquisition, J.R.; Methodology, M.B.; Supervision, J.R.; Validation, M.B.; Writing—original draft, M.B.; Writing—review and editing, J.R. All authors have read and agreed to the published version of the manuscript.
Funding
This research received no external funding.
Institutional Review Board Statement
Not applicable.
Informed Consent Statement
Not applicable.
Data Availability Statement
Not applicable.
Conflicts of Interest
The authors declare no conflict of interest.
References
- Tomlinson, M.; Woodward, J. Pile Design and Construction Practice, 5th ed.; CRC Press: Boca Raton, FL, USA, 2007. [Google Scholar]
- Cai, G.J.; Liu, S.Y.; Tong, L.Y.; Du, G.Y. Assessment of direct CPT and CPTU methods for predicting the ultimate bearing capacity of single piles. Eng. Geol. 2009, 104, 211–222. [Google Scholar] [CrossRef]
- Burlon, S.; Frank, R.; Baguelin, F.; Habert, J.; Legrand, S. Model factor for the bearing capacity of piles from pressuremeter test results—Eurocode 7 approach. Geotechnique 2014, 64, 513–525. [Google Scholar] [CrossRef]
- Randolph, M.F. Science and empiricism in pile foundation design. Geotechnique 2003, 53, 847–874. [Google Scholar] [CrossRef]
- Altaee, A.; Fellenius, B.; Evgin, E. Axial load transfer for piles in sand. I. Tests on an instrumented precast pile. Can. Geotech. J. 1992, 29, 11–20. [Google Scholar] [CrossRef] [Green Version]
- Osterberg, J.O. The Osterberg load test method for bored and driven piles the first ten years. In Proceedings of the 7th International Conference and Exhibition on Piling and Deep Foundations, Vienna, Austria, 15–17 June 1998; pp. 1–28. [Google Scholar]
- Rybak, J.; Baca, M.; Zyrek, T. Practical aspects of tubular pile axial capacity testing. In Science and Technologies in Geology, Exploration and Mining, Proceedings of the 15th International Multidisciplinary Scientific Geoconference SGEM 2015, Albena, Bulgaria, 18–24 June 2015; Surveying Geology & Mining Ecology Management (SGEM): Sofia, Bulgaria, 2015; Volume 2, pp. 549–554. [Google Scholar]
- Baca, M.; Muszynski, Z.; Rybak, J.; Zyrek, T. The application of geodetic methods for displacement control in the self-balanced pile capacity testing instrument. In Advances and Trends in Engineering Sciences and Technologies; CRC Press: Boca Raton, FL, USA, 2016; pp. 15–20. [Google Scholar]
- Baca, M.; Rybak, J.; Tamrazyan, A.G.; Zyrek, T. Pile foot capacity testing in various cases of pile shaft displacement. In Science and Technologies in Geology, Exploration and Mining, Proceedings of the 16th International Multidisciplinary Scientific Geoconference SGEM 2016, Albena, Bulgaria, 28 June–6 July 2016; Surveying Geology & Mining Ecology Management (SGEM): Sofia, Bulgaria, 2016; Volume 1, pp. 945–950. [Google Scholar]
- Baca, M.; Muszynski, Z.; Rybak, J.; Zyrek, T.; Tamrazyan, A.G. Cyclic load tests of driven pile base capacity. In Advances and Trends in Engineering Sciences and Technologies II; CRC Press: Boca Raton, FL, USA, 2017; pp. 723–728. [Google Scholar]
- Baca, M.; Brzakala, W.; Rybak, J. Bi-Directional static load tests of pile models. Appl. Sci. 2020, 10, 5492. [Google Scholar] [CrossRef]
- Gavin, K.; Lehane, B. Base load—Displacement response of piles in sand. Can. Geotech. J. 2007, 44, 1053–1063. [Google Scholar] [CrossRef]
- Randolph, M.F.; Dolwin, J.; Beck, R. Design of driven piles in sand. Geotechnique 1994, 44, 427–448. [Google Scholar] [CrossRef]
- Fellenius, B.H. Basics of Foundation Design—A Textbook; Electronic Edition; BiTech Publishers Ltd.: Richmond, BC, Canada, 2019. [Google Scholar]
- Jardine, R.J.; Zhu, B.T.; Foray, P.; Yang, Z.X. Measurement of stresses around closed-ended displacement piles in sand. Geotechnique 2013, 63, 1–17. [Google Scholar] [CrossRef] [Green Version]
- Flynn, K.N.; McCabe, B.A. Shaft resistance of driven cast-in-situ piles in sand. Can. Geotech. J. 2016, 53, 49–59. [Google Scholar] [CrossRef] [Green Version]
- Kishida, H.; Uesugi, M. Tests of the interface between sand and steel in the simple shear apparatus. Geotechnique 1987, 37, 45–52. [Google Scholar] [CrossRef]
- Jardine, R.; Lehane, B.; Everton, S. Friction coefficients for piles in sands and silts. In Offshore Site Investigation and Foundation Behaviour; Springer: Cham, Switzerland, 1993; pp. 661–677. [Google Scholar]
- Muszynski, Z.; Wyjadlowski, M. Assessment of the shear strength of pile-to-soil interfaces based on pile surface topography using laser scanning. Sensors. 2019, 19, 1012. [Google Scholar] [CrossRef] [Green Version]
- De Nicola, A.; Randolph, M.F. Tensile and compressive shaft capacity of piles in sand. J. Geotech. Eng. 1993, 119, 1952–1973. [Google Scholar] [CrossRef]
- Hayden, M. Pile HAY-Proof-System: New test method for static load tests of slender piles. Ground Eng. 2013, 12, 25–28. [Google Scholar]
- Mišove, P.; Velič, P. Projekt Zaťažovacej Skúšky Pilóty Systémom; VUIS-P: Petržalka, Slovakia, 2010. [Google Scholar]
- Berisavljević, D.; Filipović, V.; Stanisavljević, N.; Berisavljević, Z. Experimental analysis of bi-directional pile static load test. Ce Pap. 2018, 2, 415–420. [Google Scholar] [CrossRef]
- Afsharhasani, R.; Karakouzian, M.; Farhangi, V. Effect of competent caliche layers on measuring the capacity of axially loaded drilled shafts using the Osterberg test. Appl. Sci. 2020, 10, 6169. [Google Scholar] [CrossRef]
- Yun, J.; Han, J. Dynamic behavior of pile-supported structures with batter piles according to the ground slope through centrifuge model tests. Appl. Sci. 2020, 10, 5600. [Google Scholar] [CrossRef]
- Dijkstra, J. On the Modelling of Pile Installation. Ph.D. Thesis, Delft University of Technology, Delft, The Netherlands, 2009. [Google Scholar]
- De Nicola, A.; Randolph, M.F. Centrifuge modelling of pipe piles in sand under axial loads. Geotechnique 1999, 49, 295–318. [Google Scholar] [CrossRef]
- White, D.J.; Bolton, M.D. Displacement and strain paths during plane-strain model pile installation in sand. Geotechnique 2004, 54, 375–397. [Google Scholar] [CrossRef]
- Chandrasekaran, S.S.; Boominathan, A.; Dodagoudar, G.R. Group interaction effects on laterally loaded piles in clay. J. Geotech. Geoenviron. Eng. 2010, 136, 573–582. [Google Scholar] [CrossRef]
- George, B.E.; Banerjee, S.; Gandhi, S.R. Helical piles installed in cohesionless soil by displacement method. Int. J. Geomech. 2019, 19. [Google Scholar] [CrossRef]
- Broere, W.; van Tol, A.F. Modelling the bearing capacity of displacement piles in sand. Proc. Inst. Civ. Eng. Geotech. Eng. 2006, 159, 195–206. [Google Scholar] [CrossRef]
- Engin, H.K. Modelling Pile Installation Effects: A Numerical Approach. Ph.D. Thesis, Delft University of Technology, Delft, The Netherlands, 2013. [Google Scholar]
- Krasinski, A. Numerical simulation of screw displacement pile interaction with non-cohesive soil. Arch. Civ. Mech. Eng. 2014, 14, 122–133. [Google Scholar] [CrossRef]
- Brinkgreve, R.; Vermeer, P. Plaxis manual. Version 1998, 7, 5.1–5.18. [Google Scholar]
- Schanz, T.; Vermeer, P.A.; Bonnier, P.G. The hardening soil model: Formulation and verification. In Beyond 2000 in Computational Geotechnics: 10 Years of Plaxis International, Proceedings of the International Symposium Beyond 2000 in Computational Geotechnics, Amsterdam, The Netherlands, 18–20 March 1999; CRC Press Balkema: Rotterdam, The Netherlands, 1999; pp. 281–296. [Google Scholar]
- Wehnert, M.; Vermeer, P. Numerical analyses of load tests on bored piles. In Numerical Methods in Geomechanics, Proceedings of the 9th International Symposium on Numerical Models in Geomechanics, NUMOG IX, Ottawa, ON, Canada, 25–27 August 2004; CRC Press: Boca Raton, FL, USA, 2004; pp. 505–511. [Google Scholar]
- Truty, A.; Obrzud, R. The Hardening Soil Model: A Practical Guidebook; Zace Services Ltd., Software Engineering: Lausanne, Switzerland, 2011. [Google Scholar]
Figure 1.
The behaviour of the pile shaft and base depends on the load applied to the pile: (a) compression loading, (b) uplift loading, (c) bidirectional loading.
Figure 1.
The behaviour of the pile shaft and base depends on the load applied to the pile: (a) compression loading, (b) uplift loading, (c) bidirectional loading.

Figure 2.
Types of test performed with the new device: (a) load applied to the whole pile, (b) load applied to the pile base, (c) bidirectional test with a compressed base and uplift shaft.
Figure 2.
Types of test performed with the new device: (a) load applied to the whole pile, (b) load applied to the pile base, (c) bidirectional test with a compressed base and uplift shaft.

Figure 3.
Method for constructing Q-s curve of the pile shaft.

Figure 4.
Scheme of test stand with installed model of piles.

Figure 5.
Stands for the traditional static load test of pile base (a), whole pile (b), and bidirectional test (c).
Figure 5.
Stands for the traditional static load test of pile base (a), whole pile (b), and bidirectional test (c).

Figure 6.
Test results and constructed pile shaft Q-s curve: (a) pile 1; (b) pile 2; (c) pile 3; (d) pile 4; (e) pile 5; (f) pile 6.
Figure 6.
Test results and constructed pile shaft Q-s curve: (a) pile 1; (b) pile 2; (c) pile 3; (d) pile 4; (e) pile 5; (f) pile 6.

Figure 7.
Calculation area for numerical simulations.

Figure 8.
Scheme of applied load in: (a) static load test of the whole pile, (b) static load test of the pile base, (c) bidirectional test.
Figure 8.
Scheme of applied load in: (a) static load test of the whole pile, (b) static load test of the pile base, (c) bidirectional test.

Figure 9.
Results of bidirectional and traditional static load test simulations for fine sand and different interfaces: (a) R = 0.900, (b) R = 0.750, (c) R = 0.666.
Figure 9.
Results of bidirectional and traditional static load test simulations for fine sand and different interfaces: (a) R = 0.900, (b) R = 0.750, (c) R = 0.666.

Figure 10.
Results of bidirectional and traditional static load test simulations for medium sand and different interfaces: (a) R = 0.900, (b) R = 0.750, (c) R = 0.666.
Figure 10.
Results of bidirectional and traditional static load test simulations for medium sand and different interfaces: (a) R = 0.900, (b) R = 0.750, (c) R = 0.666.

Figure 11.
Results of bidirectional and traditional static load test simulations for coarse sand and different interfaces: (a) R = 0.900, (b) R = 0.750, (c) R = 0.666.
Figure 11.
Results of bidirectional and traditional static load test simulations for coarse sand and different interfaces: (a) R = 0.900, (b) R = 0.750, (c) R = 0.666.


Table 1.
Bearing capacity results from the tests on model piles.
| Pile | Rb (kN) | Rc (kN) | Rs (kN) | Rb,s (kN) | Rs,s (kN) | Rb,s/Rb (kN) | Rs,s/Rs (kN) |
|---|---|---|---|---|---|---|---|
| 1 | 1.63 | 4.69 | 3.96 | 1.60 | 2.16 | 0.98 | 0.55 |
| 2 | 1.71 | 5.22 | 4.17 | 1.56 | 2.11 | 0.91 | 0.51 |
| 3 | 2.60 | 6.07 | 4.54 | 2.54 | 3.08 | 0.98 | 0.68 |
| 4 | 1.74 | 5.32 | 3.69 | 1.80 | 2.82 | 1.03 | 0.76 |
| 5 | 3.19 | 8.66 | 6.07 | 3.25 | 4.62 | 1.02 | 0.76 |
| 6 | 3.26 | 9.49 | 6.39 | 3.29 | 5.66 | 1.01 | 0.89 |
Rc—whole pile bearing capacity; Rb—pile base bearing capacity; Rb,s—pile base bearing capacity from bidirectional test; Rs,s—pile shaft bearing capacity from bidirectional test; Rs—pile shaft bearing capacity from constructed curve.
Table 2.
Soil parameters for the Hardening Soil model.
| LP | Soil | ID | γ | Φ’ | ψ | c’ | K0NC | σoedref | m | Eoedref | E50ref | Eurref |
|---|---|---|---|---|---|---|---|---|---|---|---|---|
| kN/m3 | o | o | kPa | - | kPa | - | MPa | MPa | MPa | |||
| 1 | FSa | 0.35 | 18.5 | 30.5 | 0.5 | 1.0 | 0.5 | 100 | 0.591 | 15.4 | 23.4 | 70.2 |
| 2 | MSa | 0.60 | 19.0 | 34.7 | 4.7 | 1.0 | 0.4 | 100 | 0.513 | 53.1 | 81.7 | 245.2 |
| 3 | CSa | 0.75 | 19.5 | 36.2 | 6.2 | 1.0 | 0.4 | 100 | 0.466 | 92.2 | 139.7 | 419.1 |
γ–unit weight; φ–friction angle; ψ–angle of dilatancy; c–cohesion; K0NC–coefficient of lateral earth pressure for a normally consolidated stress state; σoedref–reference confining pressure; m–power in stress-dependent relation; Eoedref–reference oedometer loading stiffness; E50ref–reference triaxial loading stiffness; Eurref–reference triaxial unloading stiffness.
Table 3.
Parameters of beam elements in the numerical model.
| EA (kN/m) | EI (kNm2/m) | W (kN/m/m) | Ν (-) | |
|---|---|---|---|---|
| Pipe | 1.05∙107 | 2187.5 | 3.9 | 0.3 |
| Pile shoe | 6.30∙107 | 4.30∙105 | 7.7 | 0.3 |
EA–axial stiffness; EI–bending stiffness; w–weight of beam element; ν–Poisson’s ratio.
Table 4.
Bearing capacity obtained from the numerical simulations.
| Soil | Interface | Rb (kN) | Rc (kN) | Rs (kN) | Rb,s (kN) | Rs,s (kN) | Rb,s/Rb (-) | Rs,s/Rs (-) |
|---|---|---|---|---|---|---|---|---|
| FSa | 0.666 | 136 | 298 | 218 | 129 | 176 | 0.95 | 0.81 |
| 0.750 | 136 | 368 | 239 | 133 | 189 | 0.98 | 0.79 | |
| 0.900 | 136 | 423 | 353 | 130 | 248 | 0.96 | 0.70 | |
| MSa | 0.666 | 358 | 534 | 174 | 333 | 173 | 0.93 | 0.99 |
| 0.750 | 358 | 575 | 224 | 346 | 201 | 0.97 | 0.90 | |
| 0.900 | 358 | 740 | 379 | 353 | 263 | 0.99 | 0.69 | |
| CSa | 0.666 | 573 | 716 | 222 | 634 | 188 | 1.11 | 0.85 |
| 0.750 | 573 | 723 | 279 | 596 | 214 | 1.04 | 0.77 | |
| 0.900 | 573 | 1061 | 482 | 505 | 316 | 0.88 | 0.66 |
Publisher’s Note: MDPI stays neutral with regard to jurisdictional claims in published maps and institutional affiliations. |
© 2021 by the authors. Licensee MDPI, Basel, Switzerland. This article is an open access article distributed under the terms and conditions of the Creative Commons Attribution (CC BY) license (https://creativecommons.org/licenses/by/4.0/).
Share and Cite
MDPI and ACS Style
Baca, M.; Rybak, J. Pile Base and Shaft Capacity under Various Types of Loading. Appl. Sci. 2021, 11, 3396. https://doi.org/10.3390/app11083396
AMA Style
Baca M, Rybak J. Pile Base and Shaft Capacity under Various Types of Loading. Applied Sciences. 2021; 11(8):3396. https://doi.org/10.3390/app11083396
Chicago/Turabian StyleBaca, Michał, and Jarosław Rybak. 2021. "Pile Base and Shaft Capacity under Various Types of Loading" Applied Sciences 11, no. 8: 3396. https://doi.org/10.3390/app11083396
Note that from the first issue of 2016, this journal uses article numbers instead of page numbers. See further details here.