Article

Effects of Different Feature Parameters of sEMG on Human Motion Pattern Recognition Using Multilayer Perceptrons and LSTM Neural Networks

1
Institute of Robotics & Intelligent Systems, Xi’an Jiaotong University, Xi’an 710049, China
2
Shaanxi Key Laboratory of Intelligent Robots, Xi’an 710049, China
3
Key Laboratory of Education Ministry for Modern Design and Rotor-Bearing System, Xi’an 710049, China
4
Shenzhen Key Laboratory of Electromagnetic Control, Shenzhen University, Shenzhen 518060, China
*
Author to whom correspondence should be addressed.
Appl. Sci. 2020, 10(10), 3358; https://doi.org/10.3390/app10103358
Submission received: 8 April 2020 / Revised: 7 May 2020 / Accepted: 9 May 2020 / Published: 12 May 2020

Abstract

:

Featured Application

This research is based on a set of wearable EMG acquisition system developed by ourselves, which captures the EMG signals generated by the human body during exercise, and recognizes human movement patterns by training EMG data. This wearable EMG acquisition system can be integrated with the lower extremity exoskeleton robot, so that the exoskeleton can judge the human body’s movement mode and movement intention based on the EMG information. The significance of this study is that accurately identifying different motion patterns can provide basis information for the intelligent motion control of lower extremity exoskeleton robots.

Abstract

In response to the need for an exoskeleton to quickly identify the wearer’s movement mode in the mixed control mode, this paper studies the impact of different feature parameters of the surface electromyography (sEMG) signal on the accuracy of human motion pattern recognition using multilayer perceptrons and long short-term memory (LSTM) neural networks. The sEMG signals are extracted from the seven common human motion patterns in daily life, and the time domain and frequency domain features are extracted to build a feature parameter dataset for training the classifier. Recognition of human lower extremity movement patterns based on multilayer perceptrons and the LSTM neural network were carried out, and the final recognition accuracy rates of different feature parameters and different classifier model parameters were compared in the process of establishing the dataset. The experimental results show that the best accuracy rate of human motion pattern recognition using multilayer perceptrons is 95.53%, and the best accuracy rate of human motion pattern recognition using the LSTM neural network is 96.57%.

1. Introduction

The movement intention of the human body is generated from the brain and transmitted to the muscle cells through the nerves. The form and amplitude of the electrical signal of the muscle directly reflect the movement pattern of the human body [1,2,3]. In order to enable wearable devices such as prosthetics and exoskeletons to switch smoothly between multiple movement modes, many scholars have worked on the recognition of the human movement state. An effective method to identify human movement patterns and movement intentions is by collecting human electromyography (EMG) signals to control the movement of an exoskeleton in real time [4,5]. Young et al. [6,7] trained a model to recognize amputees in different motion modes through mechanical signals and EMG signals. The lower-limb prosthetic system is expected to seamlessly switch among motion modes, and the overall recognition rate can be increased to 86%. Joshi et al. [8] used the Bayesian information criterion (BIC) and some standard feature extraction methods and linear discriminant analysis (LDA) classification algorithms to separate eight different gait phases based on the electromyogram (EMG) signal data of the lower limbs. Simon et al. [9] used pattern recognition to seamlessly and naturally switch among the five motion modes of prosthetics. Collecting and analyzing EMG signals can help the exoskeleton to accurately identify the current state of movement of the human body for matching the best movement mode [10,11,12,13]. Liu et al. [14] used the data obtained by the angle sensor to train the model to achieve better recognition results. Liu et al. [15] used myoelectric sensors, gyroscopes, and pressure sensors to collect data and used a hidden Markov model (HMM) to identify real-time motion states. In this way, the distinction in the intention of the user to walk on five different terrains can be inferred. Capturing images of human motion to analyze motion patterns is a very mature method, but this method requires huge image acquisition equipment and cannot be integrated with wearable devices such as an exoskeleton [16].
We have tried to install a gyroscope on each joint of the lower limbs of the human body, install a pressure sensor on the selected position of the foot, and analyze the human movement pattern by multi-source information fusion, which has showed a good recognition effect on the human movement pattern recognition [
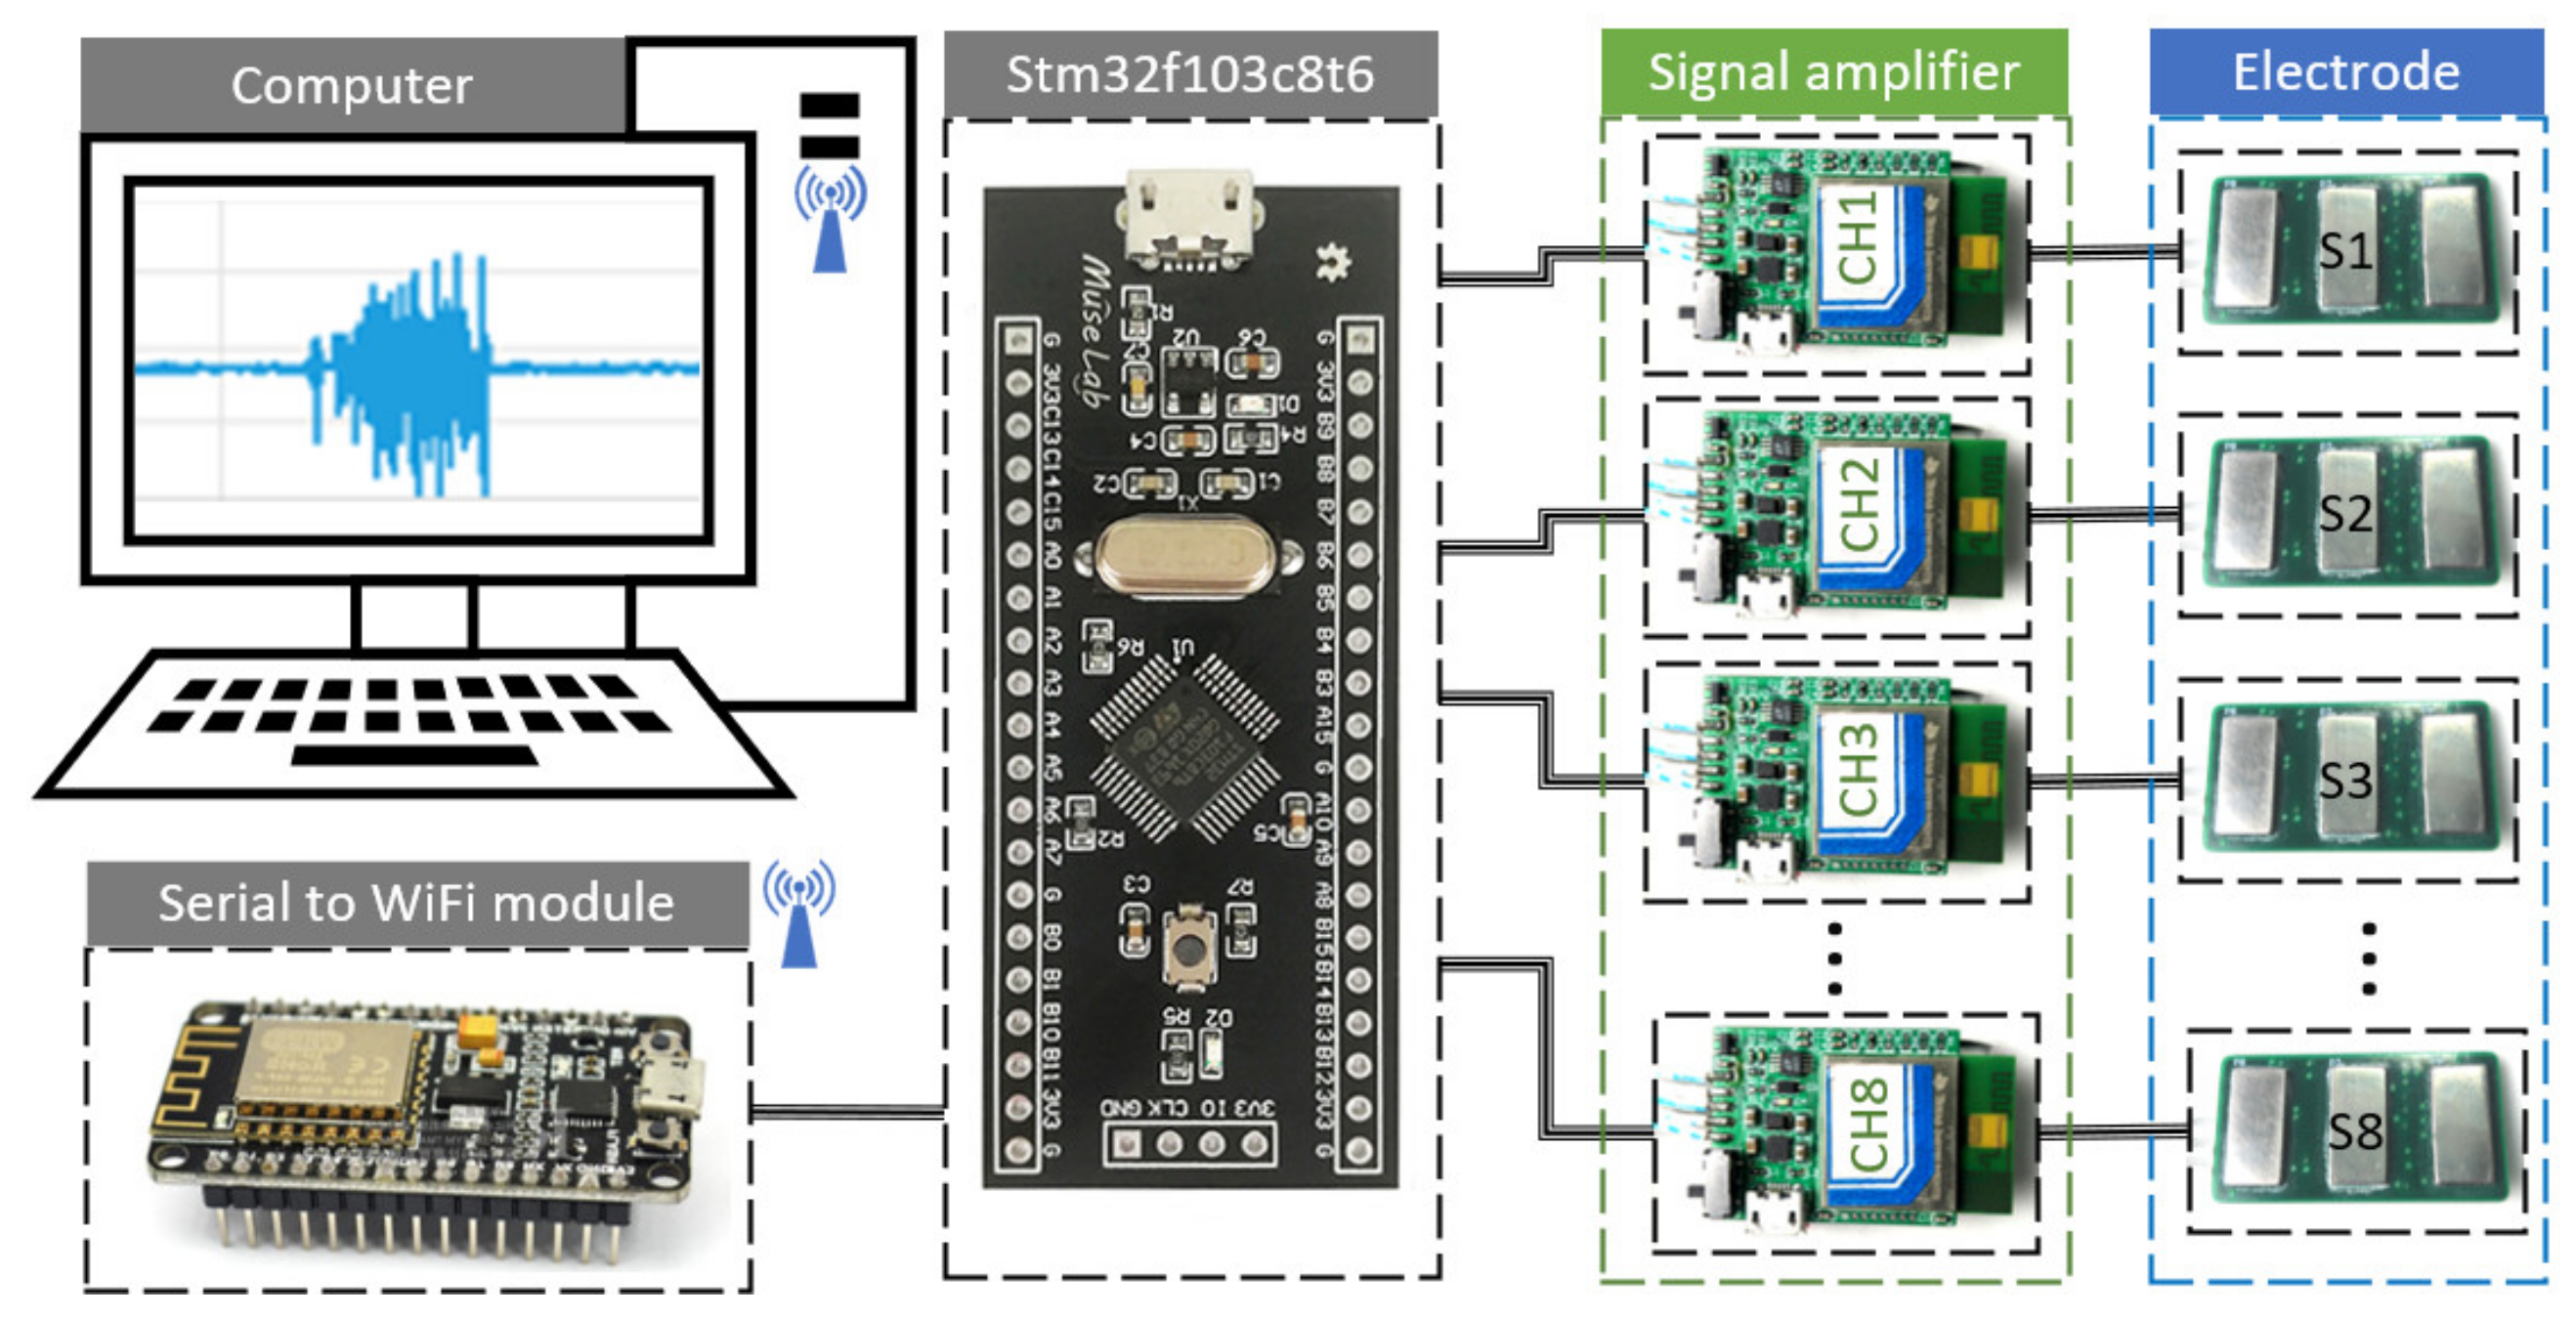
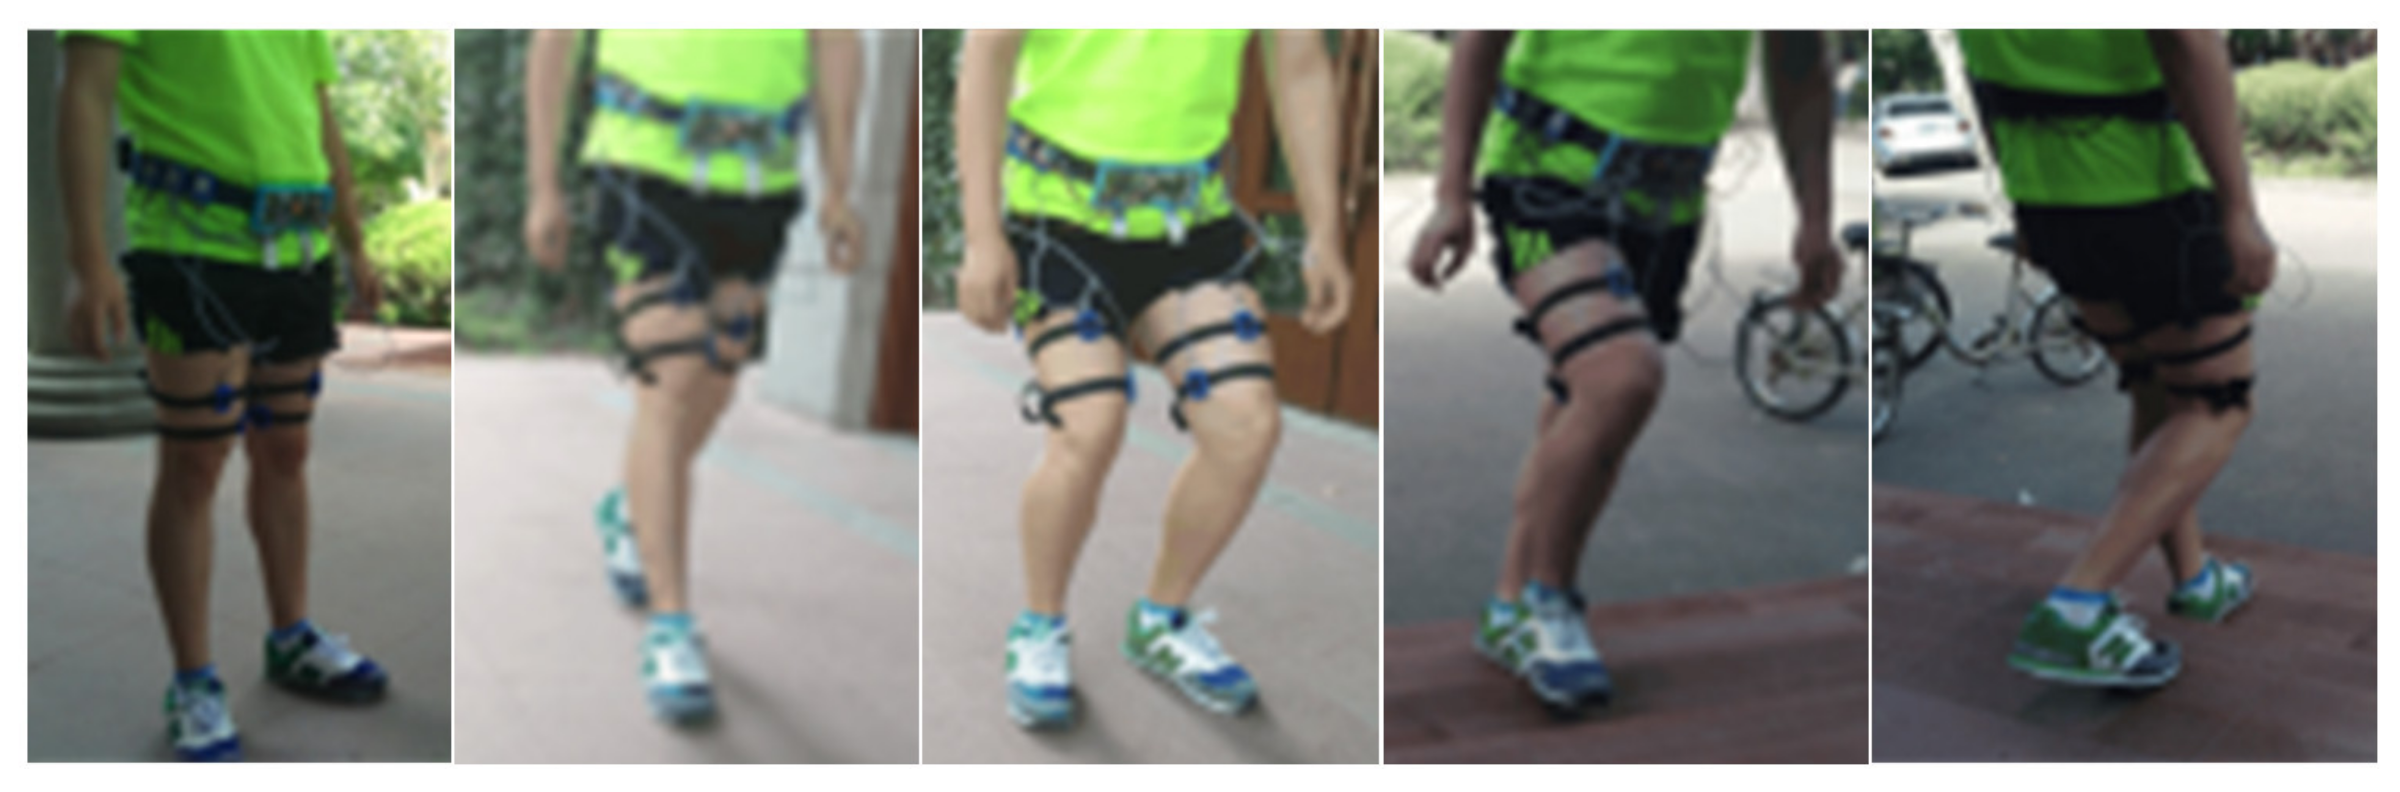
17]. Since the angle information of the lower limbs of the human body and the pressure information of the sole of the foot are generated after the actual movement of the human body, there is a lag in the judgment of the human body’s movement intention and is rather more suitable for identifying the current movement mode of the human body or exoskeleton system. The surface EMG signal of the muscle has the advantage of not being restricted by physical constraints and, thus, not disturbing the actual movement of the human body. Therefore, in order to improve the accuracy of the recognition of common human movement patterns in the daily use of exoskeletons, we designed a wearable EMG acquisition system to collect EMG signals on the surface of the human body and identify common human lower-limb movement patterns. A supervised machine-learning method is used to train a motion pattern classifier, by using the surface EMG signals, to study the effects of different feature parameters on human motion pattern recognition based on multilayer perceptrons and the long short-term memory (LSTM) neural network.

2. Materials and Methods

2.1. Wearable sEMG Signal Acquisition System

The different movement patterns of the lower limbs are the result of the interaction between the muscles of the hip joint and the knee joint. The EMG signals of the deep muscles are difficult to perceive by surface EMG sensors; therefore, four kinds of superficial muscles are selected as the sources of EMG signals, i.e., rectus femoris, medial vastus muscle, vastus lateralis muscle, and semitendinosus. The two legs of the human body have both independent motion and relative motion. In order to study the relationship between the motion pattern and the two-leg EMG signals, the surface EMG signals of the left and right legs were collected simultaneously. The wearable surface EMG signal collection system, we designed, and the EMG acquisition points are shown in Figure 1. The electrode pads are attached to the corresponding collection points on the muscle surface of each leg, and these electrode pads are connected to the signal amplifier and the processor located at the waist in turn. The EMG data of 8 channels is displayed one-by-one according to the sampling time.
The surface EMG signal of the lower limb is collected using a surface EMG sensor. The hardware system is shown in Figure 2. The original EMG signal collected by the dry electrode is filtered and amplified by the signal amplifier and is collected by the 12-bit AD inside the main control board, stm32f103c8t6, in the form of analog quantity. After the EMG data of all channels are packed, they are transferred to the WiFi module through the serial port, and the data is sent to the computer for display and saving.

2.2. Establishment of Surface EMG Datasets under Different Motion Modes

Seven common motion patterns of the daily activities are collected experimentally, including standing still, stepping in place, squatting and standing, standing up and sitting down, walking straight, walking upstairs, and walking downstairs. In order to adapt to the training of the classifier, the 7 movement modes are numbered 0–6, as shown in Table 1.

2.3. Feature Extraction of Surface EMG

The selection of the characteristic value usually determines the classification effect of the classifier. In the surface EMG signal analysis, the main feature analysis methods are the time domain analysis and the frequency domain analysis. Time domain features include absolute average, root mean square, variance, and zero-crossing points. Frequency domain features include average power frequency and median frequency.

2.3.1. MAV

Mean absolute value (MAV) is used as the characteristic parameter, because the surface EMG signal is usually distributed symmetrically in the time domain, which makes the mean approximate to zero.
M A V i = j = i n + 1 i x j N
where x j is the EMG data collection point value at the sampling time j, and N is the length of the sliding window.

2.3.2. RMS

Root mean square (RMS) refers to the maximum likelihood estimation method of the signal amplitude under constant force and muscle contraction without fatigue.
R M S = 1 N j = 1 N ( x j ) 2
where x j is the EMG data collection point value at the sampling time j, and N is the length of the sliding window.

2.3.3. VAR

Variance (VAR) is a measurement that describes the degree of discreteness of a random variable or a set of data.
σ = 1 N i = 1 N ( x i x ¯ ) 2
where x j is the EMG data collection point value at the sampling time j, and N is the length of the sliding window.

2.3.4. ZC

Zero crossing (ZC) describes the number of times that the zero-axis is crossed during the change in the amplitude of a time-series signal over a period of time. This feature estimates the frequency-domain characteristics of the signal from a time-domain perspective.
Z C i = j = i N + 1 i sgn ( x j x j 1 )
where x j is the EMG data collection point value at the sampling time j, and N is the length of the sliding window.
The definition of the sgn ( x ) function is as Formula (5).
sgn ( x ) = 0 , x > 0 1 , x 0

2.3.5. MPF

Mean power frequency (MPF), which uses Fourier transform to convert time-domain signals into frequency-domain signals, performs spectral and power spectral analysis of the signals.
f M P F = 0 + f × P ( f ) d f 0 + P ( f ) d f
where f M P F is the average power frequency to be obtained, while P ( f ) is the power spectral density function of the signal.

2.3.6. MF

Median frequency (MF) is expressed, mathematically, as:
0 f M F P ( f ) d f = f M F + P ( f ) d f = 1 2 0 + P ( f ) d f
where f M P F is the average power frequency to be obtained, while P ( f ) is the power spectral density function of the signal.

2.4. Dataset Establishment of Feature Parameters

The time-domain and the frequency-domain features are extracted using a sliding window method with a certain overlap. Figure 3 shows the surface EMG data of the rectus femoris muscle in the continuous squatting and standing exercise mode. The length of the sliding window is 256 ms, and the sampling interval between the upcoming and the previous window is 50 ms. Finally, the time and frequency-domain features of the surface EMG signal are extracted.
The time-domain and the frequency-domain features are extracted using a sliding window method, as shown in Figure 4, with some overlap; i.e., the time series of surface EMG data is framed according to the specified unit window length. According to the time-domain and the frequency-domain feature calculation Formulas (1)–(7) in Section 2.3, the time-domain and the frequency-domain feature indexes in the frame are calculated as the input of the subsequent classifier model. As the fast Fourier transform, required for the frequency-domain feature extraction, requires the length of the data raised to the power of 2, the subsequent window length is also taken to the power of 2. Here, the length of the sliding window is, primarily, selected as 256 ms, the sampling interval between the next window and the previous window is 50 ms, and the time-domain and the frequency-domain characteristics of the surface EMG signal are extracted.
The changes in the time-domain and the frequency-domain feature parameters of the surface electromyography on rectus femoris, during the squatting-standing motion mode extracted according to the sliding window method, are shown in Figure 5. It can be seen from the figure that the first four time-domain features have a large similarity in the shape and phase of the curve, especially the root mean square and the mean absolute values. Therefore, the mean absolute value is removed from the established feature parameter set to achieve the dimensionality reduction.

3. Experiments and Results

Multiple subjects wore the system, and the data was collected data for each sport mode. Before the experiment, the skin that needed to be in contact with the electrode pads was treated carefully and cleaned with medical alcohol, and the surface EMG data was checked to see if the position of the electrode pads was correct. The acquisition time of each movement mode was kept to 3 min and was ensured to be continuous. After completion of an exercise mode, rest was taken for 15 min. Since the EMG acquisition system we designed is wearable, it was not restricted by the sports environment. Data collection was not limited to being carried out in a laboratory environment, so the subjects wore the EMG collection equipment and moved freely outdoors. The duration of each exercise mode was random and appropriate. Figure 6 shows a case of a subject wearing an EMG acquisition device while exercising outdoors.

3.1. Motion Pattern Recognition Based on Multilayer Perceptrons

Multilayer perceptrons is the simplest multilayer neural network and is the most widely used model in artificial neural networks. This section studies the influence of the selection of feature parameters and the sliding window size on the accuracy of motion pattern recognition in multilayer perceptrons.

3.1.1. Sliding Window Length is 1024 ms Using All Feature Parameters

All time-domain and frequency-domain feature parameters were used. With a sliding window length of 1024 ms and a sliding window interval of 50 ms, a feature parameter dataset for training was established. Seventy percent of the dataset was used for training, and 30% was used for testing. In the 70% of the dataset used for training, 90% of the dataset was used for training, and 10% of it was used for verification. The classifier uses a three-layer multilayer perceptron, and the activation function of the hidden layer selects the sigmoid function, while the activation function of the output layer selects the softmax function. A cross-validation network structure was used to change the number of hidden layer nodes from 4 to 60, and a classifier model was trained, respectively. As can be seen from Figure 7a, the overall classification accuracy rate was basically above 90%. When the number of hidden layers was 28, the classifier showed the highest accuracy rate on the verification set, reaching 95.53%. The classification result of a three-layer multilayer perceptron with a sample number of 1200 and a hidden layer nodes of 28 was compared with the true motion model, as shown in Figure 7b. The confusion matrix corresponding to the data in Figure 7b is in Table A1 of Appendix A.
Figure 8 shows the curve of the mean square error and a histogram of the comprehensive error distribution of the classifier during the training process of the three-layered multilayer perceptron classifier with 28 hidden layer nodes. It can be seen that the error of the verification curve reaches the optimal value at around 280 generations, and the training speed is very fast. The average comprehensive error of the trained classifier is 3.2%.

3.1.2. Trend Term of Surface EMG Signal

The average value of the measured surface electromyographic signal was not zero, because the amplifier will produce a zero drift with temperature changes. The deviation of the external performance in the frequency domain of the sensor and the interference of the surrounding environment of the sensor often cause the distance to change and form a small offset, which is called the trend term. In order to remove the trend items of the data, the least squares method was used to find the trend items of the original data for each time window data, and then the original data was subtracted from the trend item data, and finally, the maximum value and minimum value of the data were normalized.
The characteristic parameter datasets of the unremoved trend item and the removed trend item were established, respectively, with the sliding window length of 1024 ms and the window interval of 50 ms. Seventy percent of the dataset was used for training, and 30% was used for the testing. In the 70% of the dataset used for training, 90% of the dataset was used for training, and 10% of the dataset was used for verification. The classifier used a three-layer multilayer perceptron. The activation function of the input layer selects the sigmoid function, and the activation function of the output layer selects the softmax function. In the cross-validation method, the number of hidden layer nodes was changed from 4 to 60, and the classifier model was trained separately. The number of hidden layer nodes with the highest accuracy was selected as the final classification model.
As shown in Figure 9, the accuracy of the model after removing the trend term is 96.56%, and the number of hidden layer nodes is 25. The accuracy of the unremoved trend term is 79.54%, and the number of hidden layer nodes is 23. The confusion matrix corresponding to the data in Figure 9a is in Table A2 of Appendix A; the confusion matrix corresponding to the data in Figure 9b is in Table A3 of Appendix A.

3.1.3. Different Feature Parameter Sets

In order to study whether it is possible to reduce the number of input parameters of the multilayer perceptrons model and to simplify the structure of the multilayer perceptrons model, four different feature parameter sets were used: i.e., (1) only RMS feature parameters; (2) only time -domain feature parameters (RMS, VAR, and ZC); (3) only frequency-domain feature parameters (MPF and MF); and (4) all the feature parameters (RMS, VAR, ZC, MPF, and MF). These sets were used and compared on the validation set to calculate the accuracy.
The steps for establishing the feature parameter set are the same. The sliding window length was 1024 ms, and the window interval was 50 ms. Seventy percent of the dataset was used for training, and 30% was used for testing. In the 70% of the data-set used for training, 90% of the data-set was used for training, and 10% of the data-set was used for verification. The classifier uses a three-layer multilayer perceptron. The activation function of the hidden layer selects the sigmoid function, and the activation function of the output layer selects the softmax function. In the cross-validation method, the number of hidden layer nodes was changed from 4 to 60, and the classifier model was trained separately. The number of hidden layers with the highest accuracy was selected as the final classification model. The final recognition results are shown in Table 2.
It can be seen from Table 2 that, when the sliding window length is 1024 ms, the classifier using all the feature parameter sets (RMS, VAR, ZC, MPF, and MF) has the highest recognition accuracy, reaching 95.93%. The contribution of the time-domain feature parameters to the classification performance of the classifier was much larger than the frequency-domain feature parameters. However, at the same time, the contribution of the frequency-domain feature parameters to the accuracy of the movement pattern recognition of the lower limb cannot be ignored. After adding the frequency-domain features, the accuracy rate of the movement pattern recognition was further improved, reaching 95.93%. Judging from the time required to make a prediction using the multilayer perceptrons model, a small increase in the number of input features does not significantly increase the time complexity of the operation, and there is no significant difference in the recognition speed of human motion patterns.

3.1.4. Different Sliding Window Lengths

In order to study the influence of the length of the sliding window on the accuracy of recognition, all the time-domain and the frequency-domain feature parameters were used, and the length of the sliding window was set to 256 ms, 512 ms, 1024 ms, and 2048 ms, and the feature parameters dataset was established at an interval of 50 ms. Again, 70% of the dataset was used for training, and 30% was used for testing. In the 70% of the dataset used for training, 90% of the dataset was used for training, and 10% of the dataset was used for verification. The classifier uses a three-layer multilayer perceptron. The activation function of the input layer selects the sigmoid function, and the activation function of the output layer selects the softmax function. In the cross-validation method, the number of hidden layer nodes was changed from 4 to 60, and the classifier model was trained separately. The number of hidden layers with the highest accuracy was selected as the final classification model. The final recognition results are shown in Table 3.
It can be seen from Table 3 that, when using all the time-domain and the frequency-domain feature parameters dataset, the recognition accuracy rate is the best when the sliding window length is 1024 ms, reaching 95.93%. When the length of the sliding window is less than 1024 ms, the recognition accuracy of the optimal three-layer multilayer perceptron on the verification set reduces to less than 66%. When the window length is increased to 2048 ms, the recognition accuracy rate is reduced to 88.65%.

3.2. Motion Pattern Recognition Based on LSTM Neural Network

Long short-term memory (LSTM) is a new type of recurrent neural network to prevent gradient burst and gradient vanishing. Based on the recurrent neural network (RNN) model, the gating cycle feature is introduced to improve the gradient vanishing problem. The LSTM neural network adds state control to the hidden nodes, enabling it to remember the input from a long time ago [18]. Since the action patterns of the human body occur in a time series, not at time nodes, in theory, the LSTM neural network is suitable for EMG signal processing.

3.2.1. Sliding Window Length of 1024 ms Using All Time and Frequency-Domain Features

In order to compare the classification effect of the LSTM classifier with the optimal multilayer perceptrons, all the time-domain and frequency-domain feature parameters were used as inputs to the LSTM model. With a sliding window length of 1024 ms and a sliding window interval of 50 ms, a feature parameter dataset for training was established. Seventy percent of the dataset was used for training, and 30% was used for testing. In the 70% of the dataset used for training, 90% of the data-set was used for training, and 10% of the data-set was used for verification. The number of hidden layer nodes was 128, and the activation function of the input layer was the tanh function.
The results are shown in Figure 10. When the sliding window length is 1024 ms and all the time and frequency-domain features are used, the correct rate of recognition on the verification set is 96.57%, which is slightly higher than 95.93% using the multilayer perceptrons. During the model training process, the accuracy rate of motion pattern recognition is over 90% when the number of iterations of the LSTM classifier is 200. The training process as a whole is steadily increasing, and only a few are poorly identified. The comparison between the highest classification accuracy of the LSTM classifier and the true motion model is shown in Figure 10b. The confusion matrix corresponding to the data in Figure 10b is in Table A4 in Appendix A. The 400 samples are basically classified correctly. The classification errors are mainly concentrated in stepping in place, walking upstairs, and walking downstairs, which are incorrectly identified as walking flat. There is also a misrecognition between walking upstairs and walking downstairs.
The results are shown in Figure 10. When the sliding window length was 1024 ms and all the time and frequency-domain features were used, the accuracy of recognition on the verification set was 96.57%, which was slightly higher than 95.93% using the multilayer perceptrons. During the model training process, the accuracy of motion pattern recognition was over 90% when the number of iterations of the LSTM classifier was 200. The training process as a whole was found to increase the accuracy steadily, and only a few poor identifications were found. The comparison between the highest classification accuracy of the LSTM classifier and the true motion model is shown in Figure 9b. The confusion matrix corresponding to the data in Figure 10b is in Table A4 in Appendix A. The 400 samples were basically classified correctly. The classification errors were mainly concentrated in stepping in place, walking upstairs, and walking downstairs, which were incorrectly identified as walking flat. There was also a misrecognition between walking upstairs and walking downstairs.

3.2.2. Different Activation Functions and Different Sliding Window Lengths

This section studies the accuracy of the motion pattern recognition of the LSTM model when using different activation functions and different window lengths. All time and frequency-domain feature parameters were used as the input of the LSTM model in order to compare the accuracy of sigmoid and rectified linear unit (ReLU) as the activation functions of LSTM with the accuracy of tanh as the activation function of LSTM. We modified the tanh in the activation functions of LSTM, which is applied on the cell state, and then multiplied with the sigmoid of the input to provide the output. Different activation functions were used in LSTM, including the sigmoid, ReLU and tanh. The sliding window lengths selected were 256 ms, 512 ms, 1024 ms, and 2048 ms, and the sliding window interval was 50 ms. Seventy percent of the dataset was used for training, and 30% was used for testing. In the 70% of the dataset used for training, 90% of the dataset was used for training, and 10% of the dataset was used for verification. The number of hidden layer nodes is 128, and the final recognition results are shown in Table 4.
It can be seen from the Table 4 that, when the activation function selected the ReLU function, the LSTM model showed a low recognition accuracy of the motion pattern. Even upon increasing the sliding window length, the improvement of the recognition accuracy was not obvious. For the recognition of motion patterns, it is not appropriate to use the ReLU function as the activation function. The LSTM model using the sigmoid function or the tanh function as the activation function has a higher recognition accuracy rate, and the difference between the two is not so obvious. The recognition accuracy using the tanh as the activation function was slightly higher. With the increase of the window length, the recognition accuracy of the human motion pattern also gradually increased. When the sliding window length was 2048 ms, the recognition accuracy of the human motion pattern using the sigmoid function as the activation function was 97.14%, and the recognition accuracy rate using the tanh function was 98.18%.

3.2.3. Different Sliding Window Lengths and Different Feature Set Types

In order to study the motion pattern recognition effect of the LSTM network model after changing the number of feature inputs and the length of the sliding window, four different feature parameters sets were used: i.e. (1) only RMS feature parameters; (2) only time-domain feature parameters (RMS, VAR, and ZC); (3) only frequency-domain feature parameters (MPF and MF); and (4) all the feature parameters (RMS, VAR, ZC, MPF, and MF) used as the LSTM model inputs separately. The sliding window lengths selected were 256 ms, 512 ms, 1024 ms, and 2048 ms, respectively, and the feature parameter datasets were established at intervals of 50 ms. Seventy percent of the dataset was used for training, and 30% was used for testing. In the 70% of the dataset used for training, 90% of the dataset was used for training, and 10% of the dataset was used for verification. The number of the hidden layer nodes was 128, and the activation function of the input layer was the tanh. The final recognition results are shown in Table 5.
It can be seen from Table 5 that, when all time and frequency-domain features (RMS, VAR, ZC, MPF, and MF) were used and the sliding window length was 2048 ms, the LSTM model showed the best recognition effect of 98.18%. For different sliding window lengths, there were cases where the contribution of the time-domain features to the accuracy of the motion pattern recognition was higher than that of the frequency-domain features. However, the contribution of frequency-domain feature values to lower-limb movement pattern recognition cannot be ignored. After adding time domain-features to the frequency-domain features, the recognition rate of human movement patterns was further improved, which is consistent with the results obtained by multilayer perceptrons. When the sliding window length was 512 ms, the highest recognition accuracy of the LSTM model was 88.84%. Compared with the multilayer perceptrons model, which had a recognition accuracy of 65.98% when the sliding window length was 512 ms, the recognition effect of the LSTM network model was found to be better.
Figure 11 shows the changes in the recognition accuracy and the loss function value when the sliding window length was 512 ms. It can be seen that, when the number of iterations of the LSTM classifier was less than 100 during model training, the accuracy of the motion pattern recognition quickly reached a high value, and the overall trend was found steadily rising. The recognition accuracy of the trained LSTM model on the verification set was 88.84%. The value of the loss function had an opposite trend with respect to the recognition accuracy, which rapidly dropped to about 0.5. This value did not change too much as the number of training iterations increased.
In order to analyze which motion patterns are misrecognized at low sliding window lengths, the results of the model classification on the validation set were compared with the true motion model. Figure 12 shows the recognition results of the LSTM classifier when the sliding window lengths were 256 ms and 512 ms. The red dot in the figure represents the true motion model corresponding to the surface EMG data, and the blue line segment is the motion model predicted by the model. The confusion matrix corresponding to the data in Figure 12a is in Table A5 of Appendix A; the confusion matrix corresponding to the data in Figure 12b is in Table A6 of Appendix A. From the obtained results, it can be seen that, when the window length was 256 ms, recognition errors occurred in each motion mode. However, the main recognition errors occurred in the mode of stepping in place, walking flat, walking upstairs, and walking downstairs. This is because these several movement modes are relatively similar, and they all involve alternating movements of the left and right leg, using the same muscles of the lower limbs. The differences between them mainly lie in the activation time length and amplitude of the EMG signal. When the sliding window length is too short, these differences may not be obvious, which will cause misjudgment.

4. Discussion

We know that when the human body wears an exoskeleton, the accurate recognition of the human movement mode guarantees the switching to the accurate movement mode during the mixed movement control of the exoskeleton. Scholars have tried various methods to identify the movement state of the human body and obtain the accurate movement intention of the human body. Young et al. [6,7] trained an algorithm to recognize amputees in different motion modes through mechanical and EMG signals. The overall recognition rate using EMGs can be increased to 86%. Joshi et al. [8] used the Bayesian information criterion (BIC) along with some standard feature extraction methods and linear discriminant analysis (LDA) classification algorithms to separate eight different gait phases by using the electromyogram (EMG) signal data of the lower limbs, and the maximum accuracy of recognition of the left and the right leg motion patterns was found to be 93.83% and 91.60%, respectively. Simon et al. [9] used pattern recognition to seamlessly and naturally switch control among multiple motion modes of prosthetics. Under five movement modes, the recognition error rate was less than 5%. Liu et al. [14] used angle sensors to obtain human motion data, and the algorithm was trained to achieve the model on the test set with an average accuracy of 87.22%. Liu et al. [15] used myoelectric sensors, gyroscopes, and pressure sensors to collect data and used a hidden Markov model (HMM) to identify real-time motion states. The intention of the prosthetic user to walk on different terrains can be inferred, and the intent pattern recognizer can recognize five typical terrain patterns with an accuracy of 95.8%. We have tried to install gyroscopes on various joints of the lower limbs of the human body and installed pressure sensors at key positions on the sole of the feet. The accuracy of identifying mixed human movement patterns was 92.7% [17].
In this paper, different feature parameters of human surface electromyographic signals are extracted in the seven daily motion modes. Two common neural networks, multilayer perceptrons and LSTM neural networks, are separately trained to identify human motion patterns. In the training process, different feature parameters and different classifier model parameters were used to compare the accuracy of the motion pattern recognition and error impact analysis. In our work done in this paper, the best recognition rate trained by the multilayer perceptrons was 95.53%, and the best recognition rate trained by the LSTM neural network was 96.57%. Compared with the motion recognition rate of the above scholars, it has a slight advantage. At the same time, the motion data acquisition system is compact and easy to integrate with the exoskeleton.
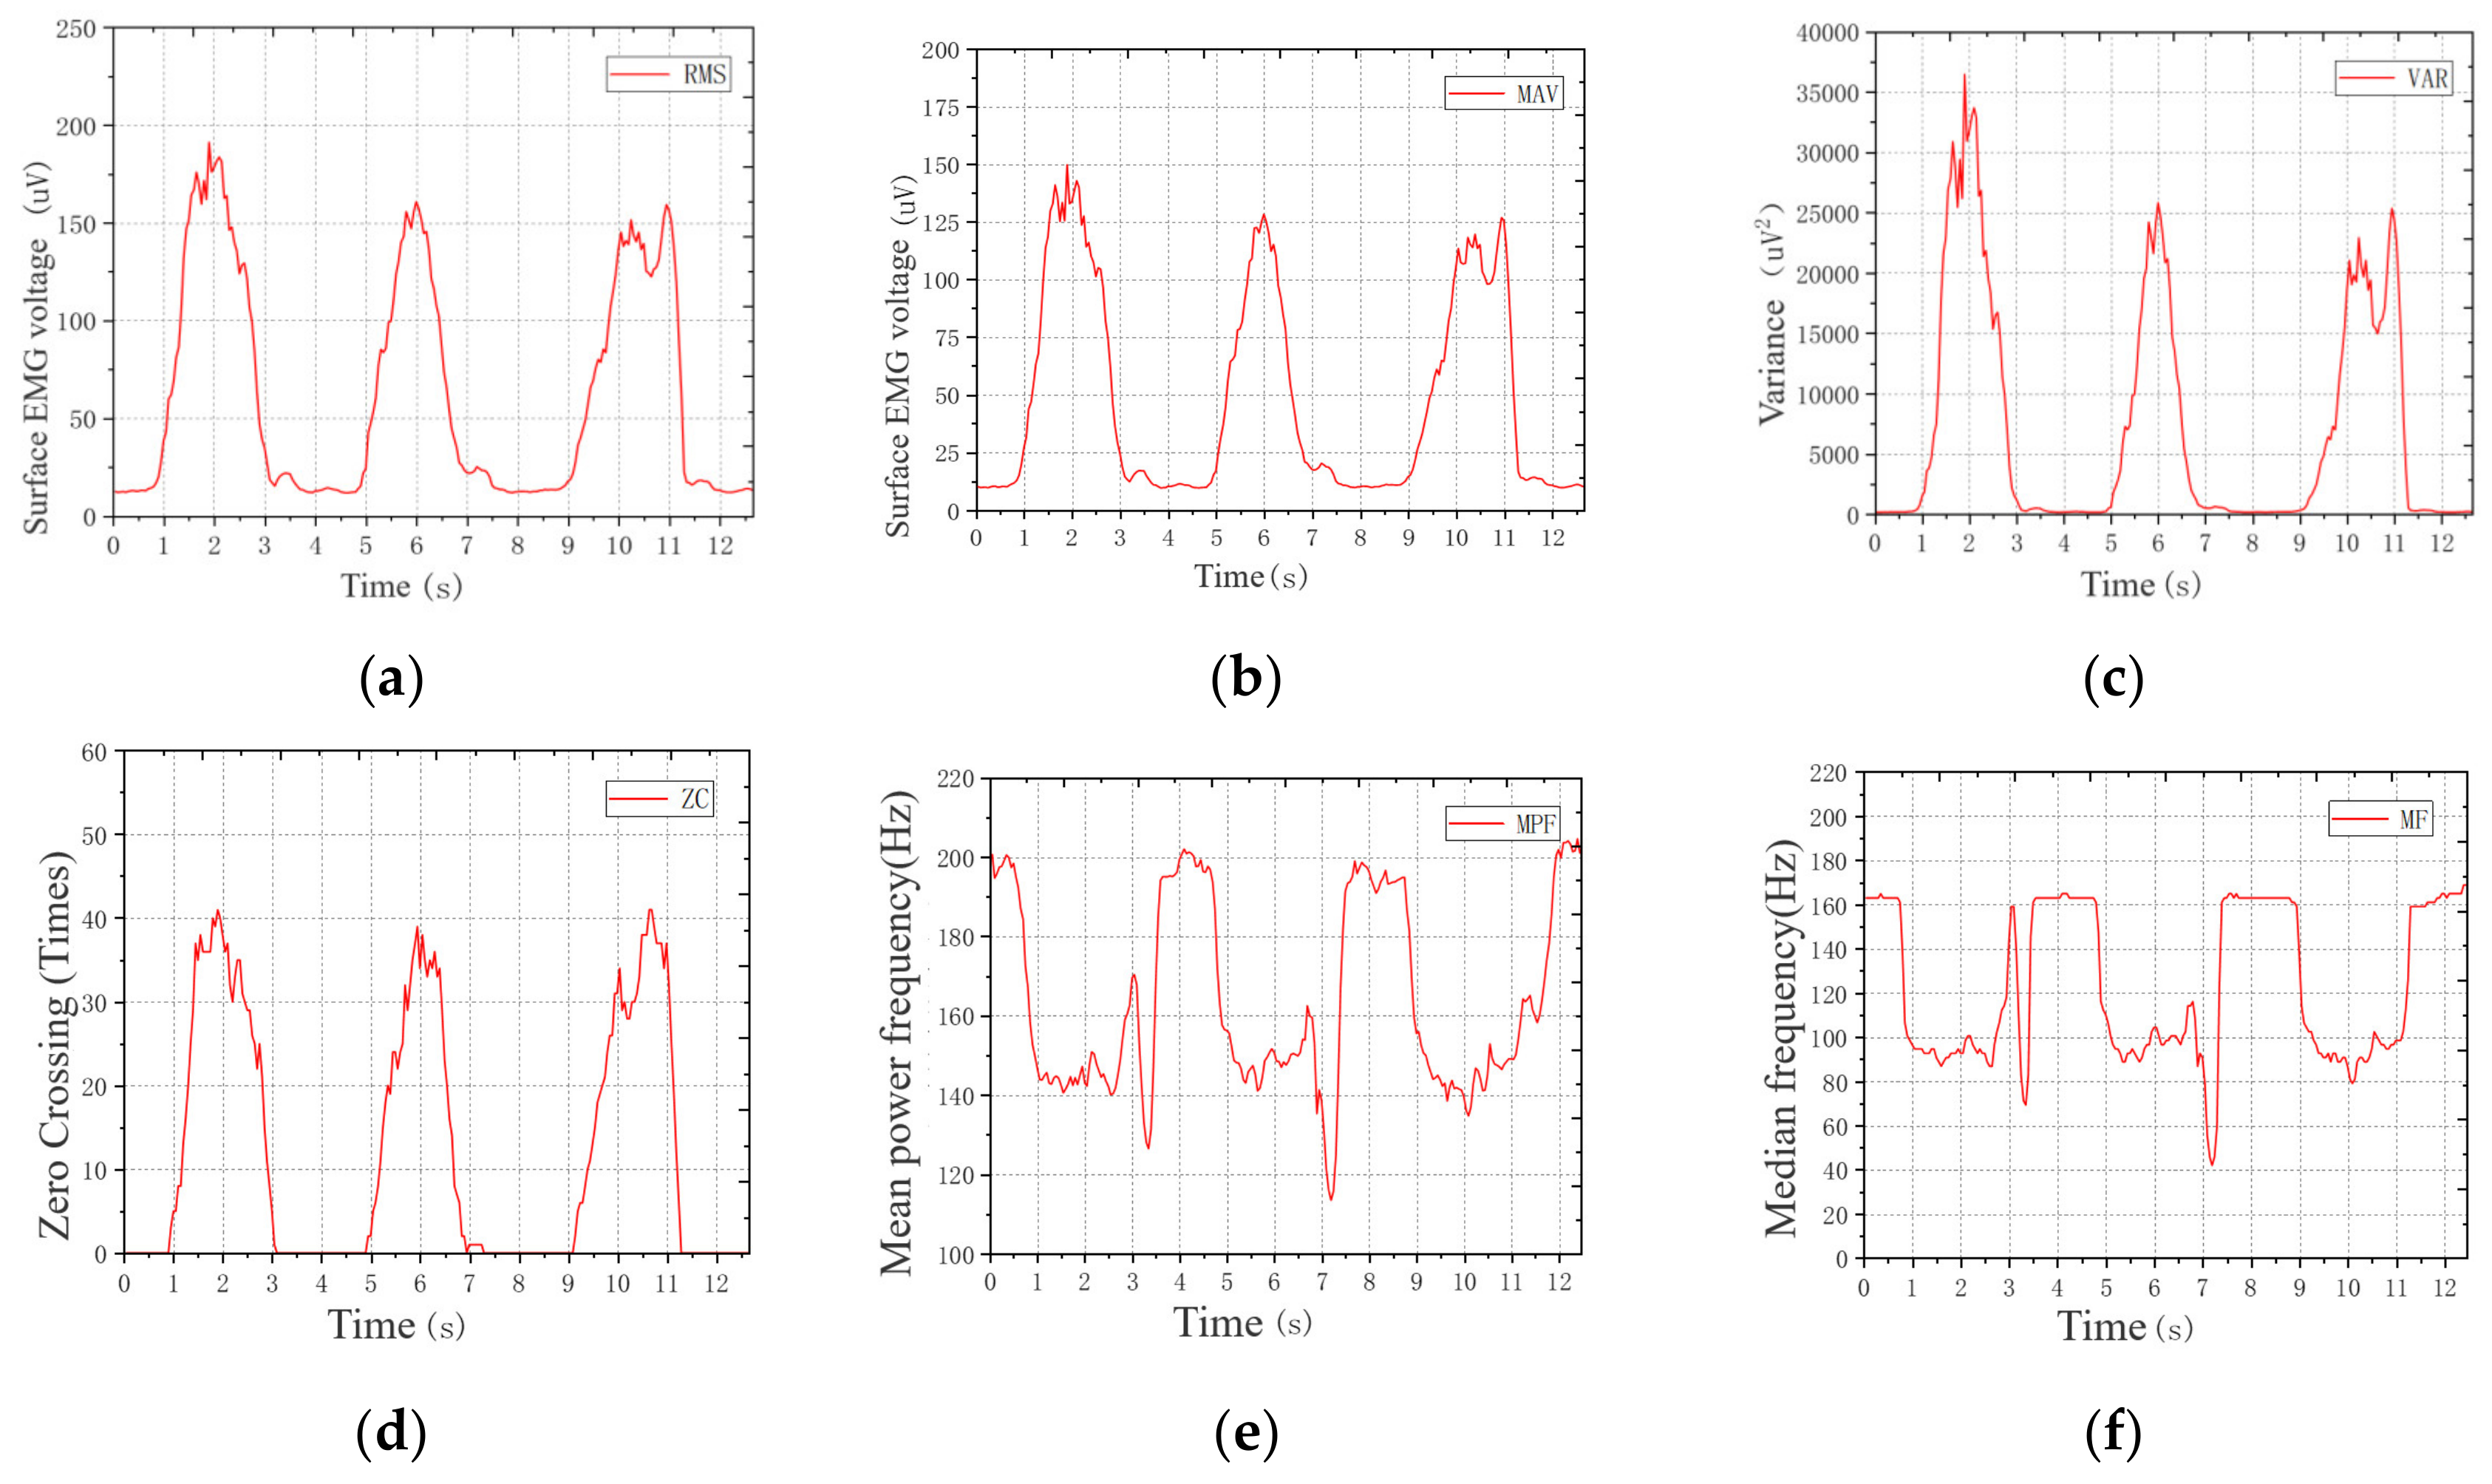
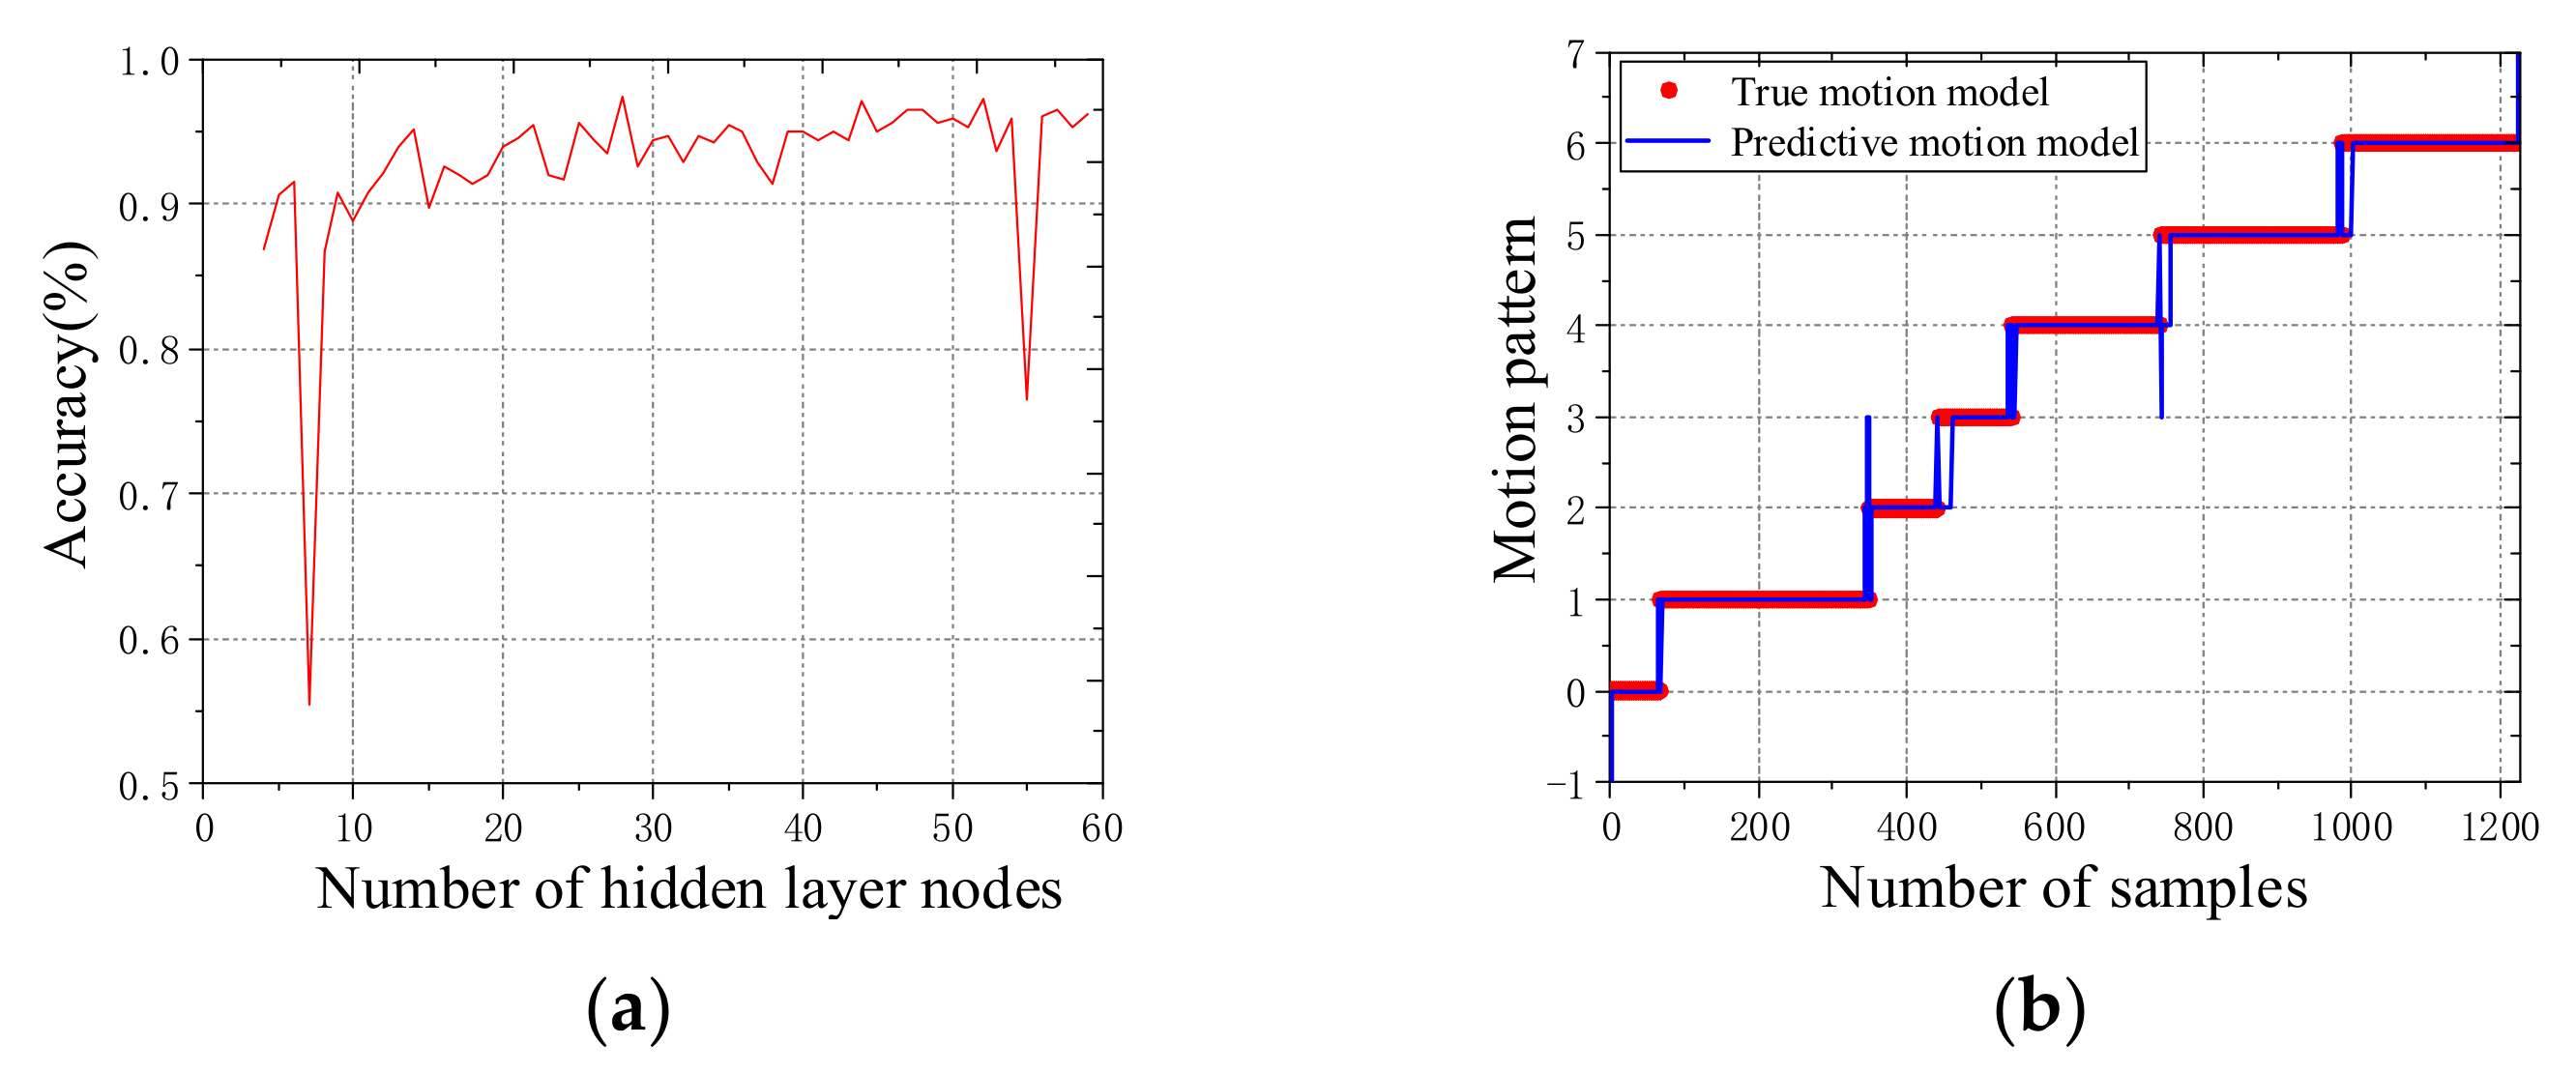
In this study, the reason for the lower accuracy of the training results might be the dataset being not very large. For example, the local minimum in Figure 5a appears to have some "cursed" numbers of hidden neurons. So, in our next work, we intend to add more datasets for the training to nullify this problem. During the establishment of the feature parameters dataset, we found that the data’s absolute mean value (MAV) and the root mean square (RMS) have remarkable similarity, so one of them can be deleted for dimensionality reduction. Generally, we think that the calculation cost of RMS will be high, but we have deleted the mean absolute value (MAV) instead of the root mean square (RMS). The reason is that the amount of data processed was not very large. Of course, it is precisely because of the amount of data this time being not very large that leads to the final motion pattern recognition rate being lower. In the process of mass data processing in the future, we will improve this and reconsider the feature value selection in the process of establishing a feature parameters dataset.
There are five activation functions in a typical LSTM neural network, including three sigmoid and two tanh. In Section 3.2.2, we wanted to modify the tanh in the activation functions of the LSTM, which was applied on cell state and then multiplied with the sigmoid of the input to provide the output. The reason for the modification of the activation function of the LSTM neural network was to find a way to improve the recognition accuracy. We compared the accuracy of the sigmoid and ReLU as activation functions of the LSTM with the accuracy of tanh as the activation function of the LSTM. The results confirmed that tanh has better accuracy as the activation function of the LSTM. Here, we verified that tanh is the optimal activation function for the LSTM in the classification task.
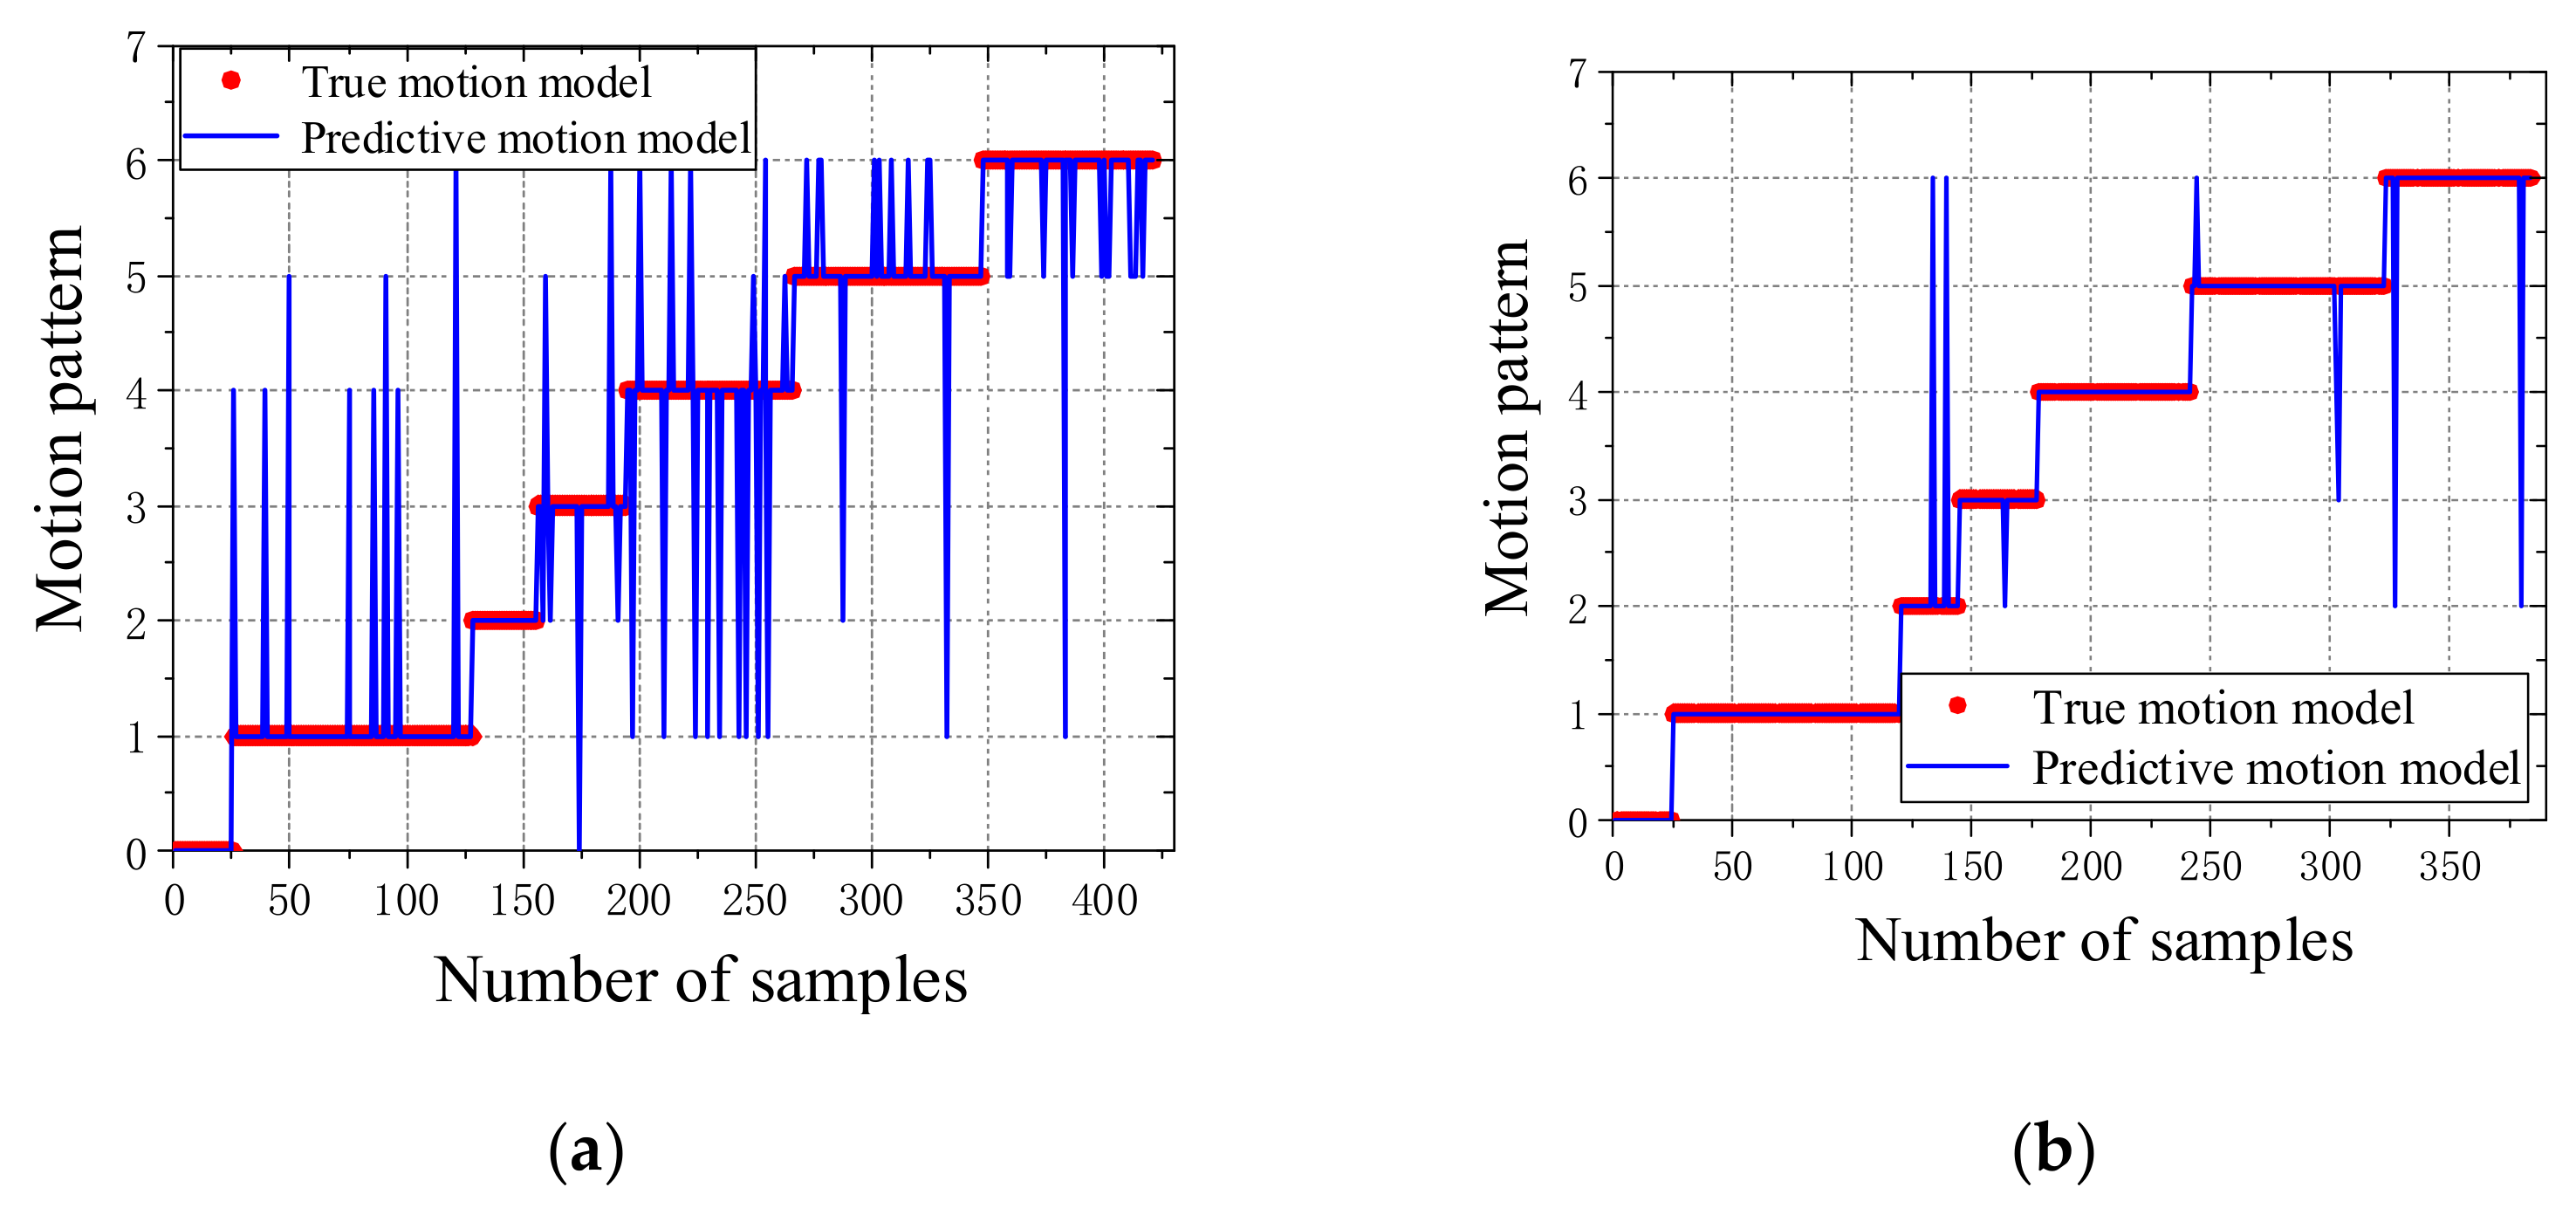
It must be noted that the human motion pattern recognition method adopted in this paper may cause errors in the data collection process, as the sensor cannot be in close contact with the skin in real time, resulting in a lower recognition rate of the final motion pattern. The sensor harness may interfere with the human motion; therefore, the sensor system needs to be further optimized, which will improve the recognition rate of human motion patterns. In this article, the seven selected movement modes were identified, and the errors were most likely occurring during the transition among different movement modes. Therefore, the future intention is to fuse the electromyography information of human motion with the information obtained from other mechanical sensors and strengthen the training of the transition states of different human motion modes to obtain better recognition results.
The wearable EMG acquisition device designed in this paper is compact and can be integrated with the exoskeleton of the lower limbs. The identification of human movement patterns by collecting EMG information is to provide ground information as the human body wears the exoskeleton when switching between different movement modes to the exoskeleton. The research in this article is the first step in judging human movement patterns and intentions for the exoskeletons. Next, we intend to combine this set of wearable EMG acquisition devices and the data processing methods with lower-extremity exoskeletons to aim for the intelligent switching of movement modes of the lower exoskeleton.

5. Conclusions

In response to the need for the exoskeleton to quickly recognize the wearer’s movement state during the mixed movement control, this paper studies the impact of different feature parameters extracted from the surface EMG signals on the accuracy of multilayer perceptrons and the LSTM neural network recognition of human motion patterns. Based on the EMG signals extracted from seven common human motion patterns in daily life, the time-domain and frequency-domain features of the collected information are extracted to build a feature parameter dataset for training the classifier. Using multilayer perceptrons and the LSTM neural network to recognize the motion pattern of human lower limbs, the dataset uses different feature parameters and different classifier model parameters to compare and analyze the accuracy of motion pattern recognition and error impact.
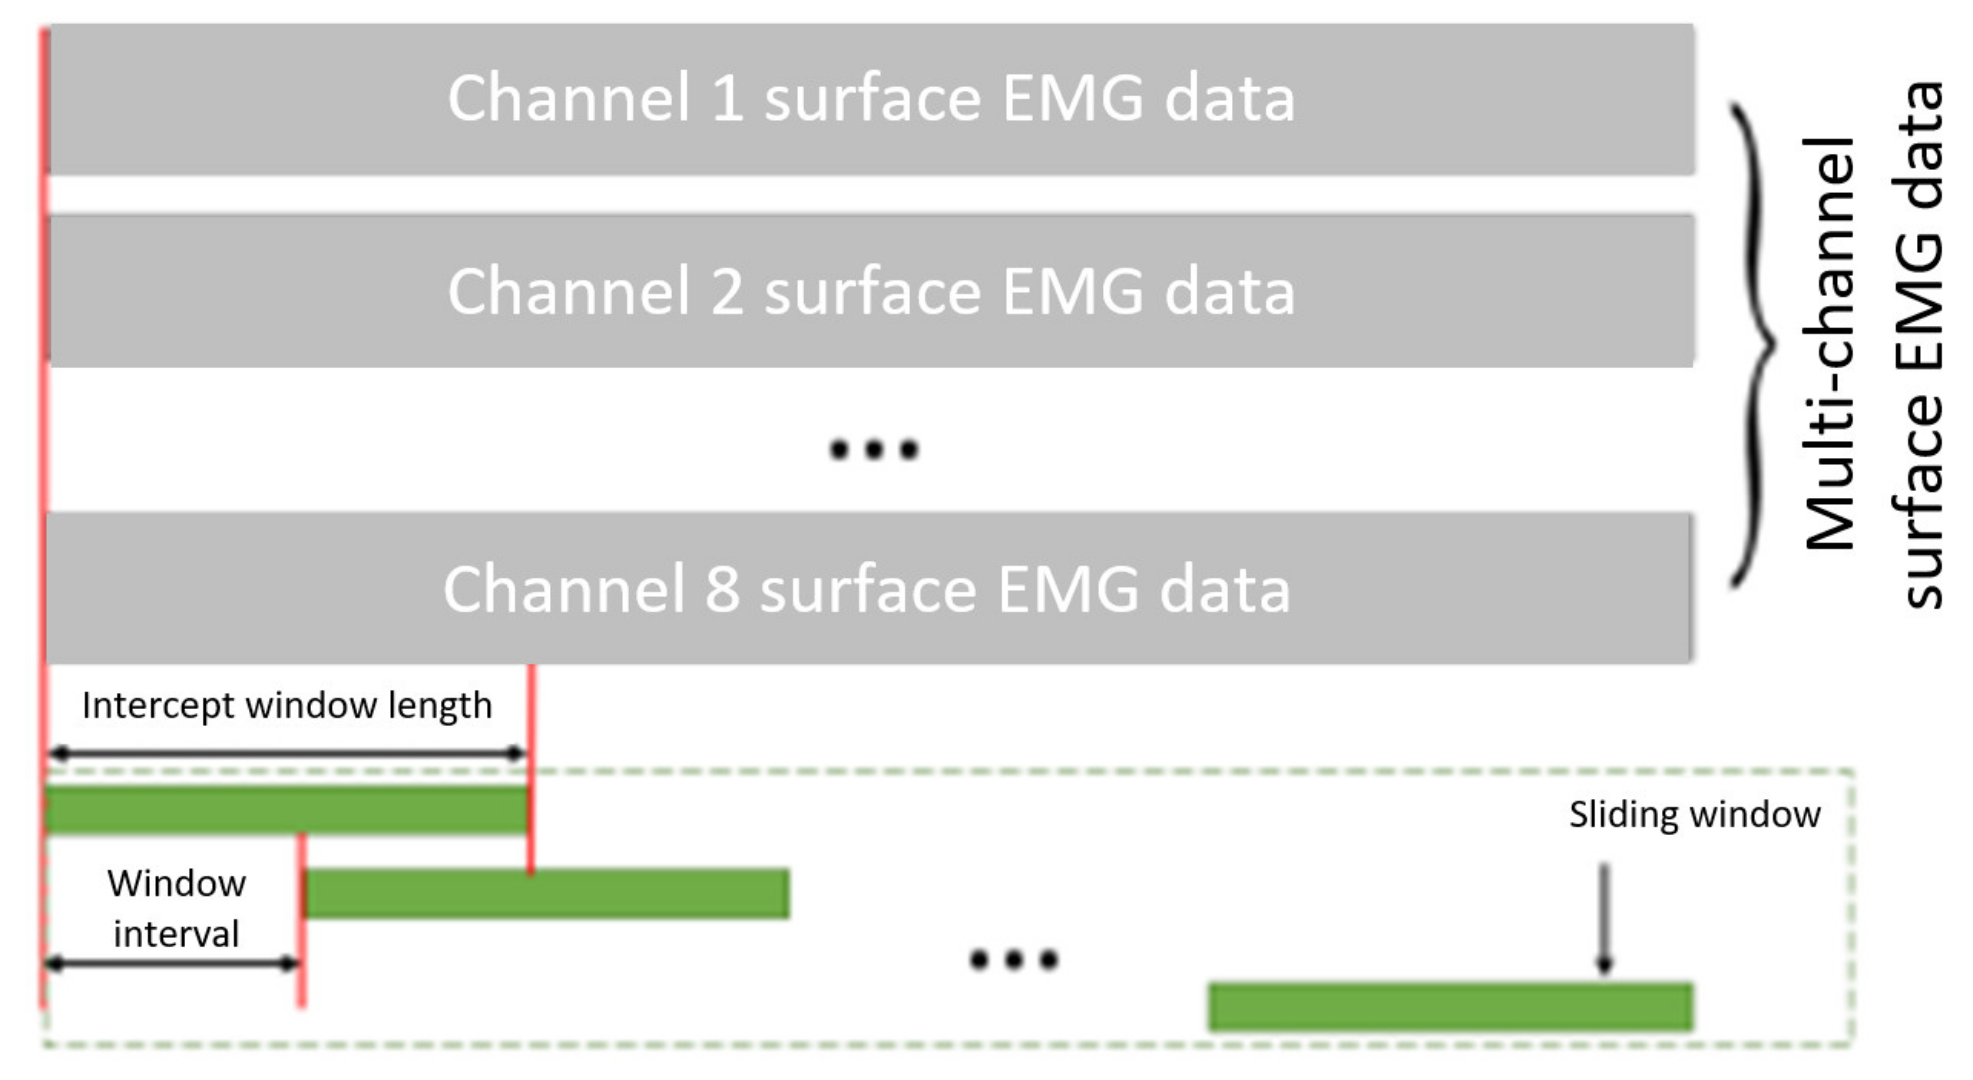
When the offline supervised learning of the surface EMG dataset based on the multilayer perceptrons is carried out with the sliding window length of 1024 ms, and using all the time and frequency-domain feature parameters, the accuracy rate of the human motion pattern recognition is high, reaching 95.53%. The trend term of the surface EMG has a great impact on the accuracy of the recognition and should be removed before the data is used. The time-domain features contribute more to the accuracy of the model recognition than the frequency-domain features. However, in order to achieve the best recognition accuracy, the time-domain and frequency-domain features should be combined. When the sliding window length is shortened, the recognition accuracy rate decreases rapidly, such as 65.98% at 512 ms, which does not satisfy the needs of human motion pattern recognition.
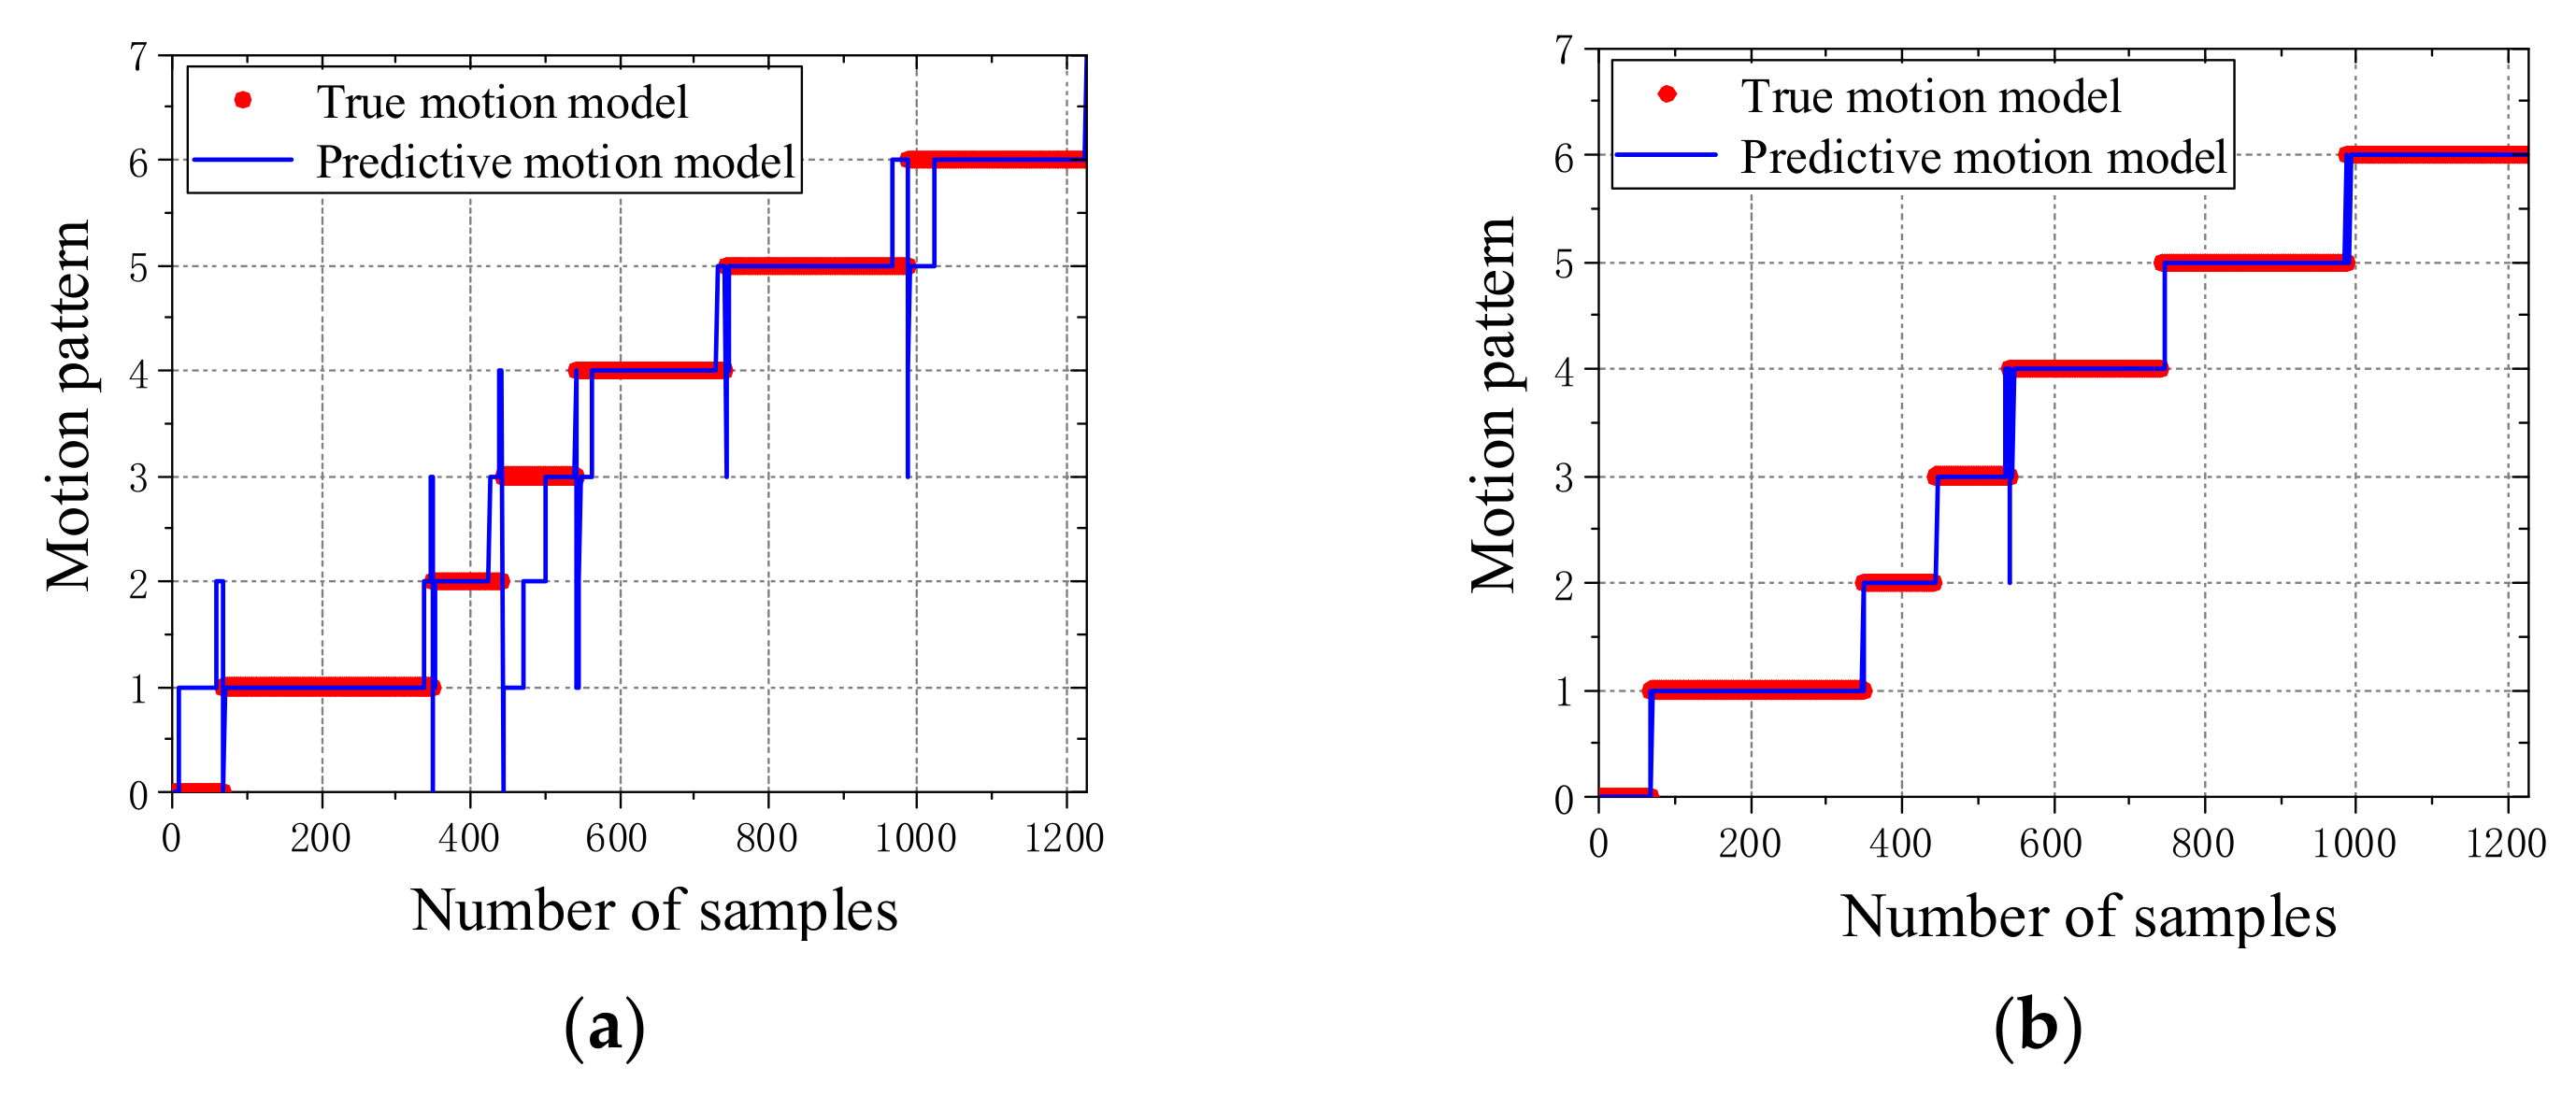
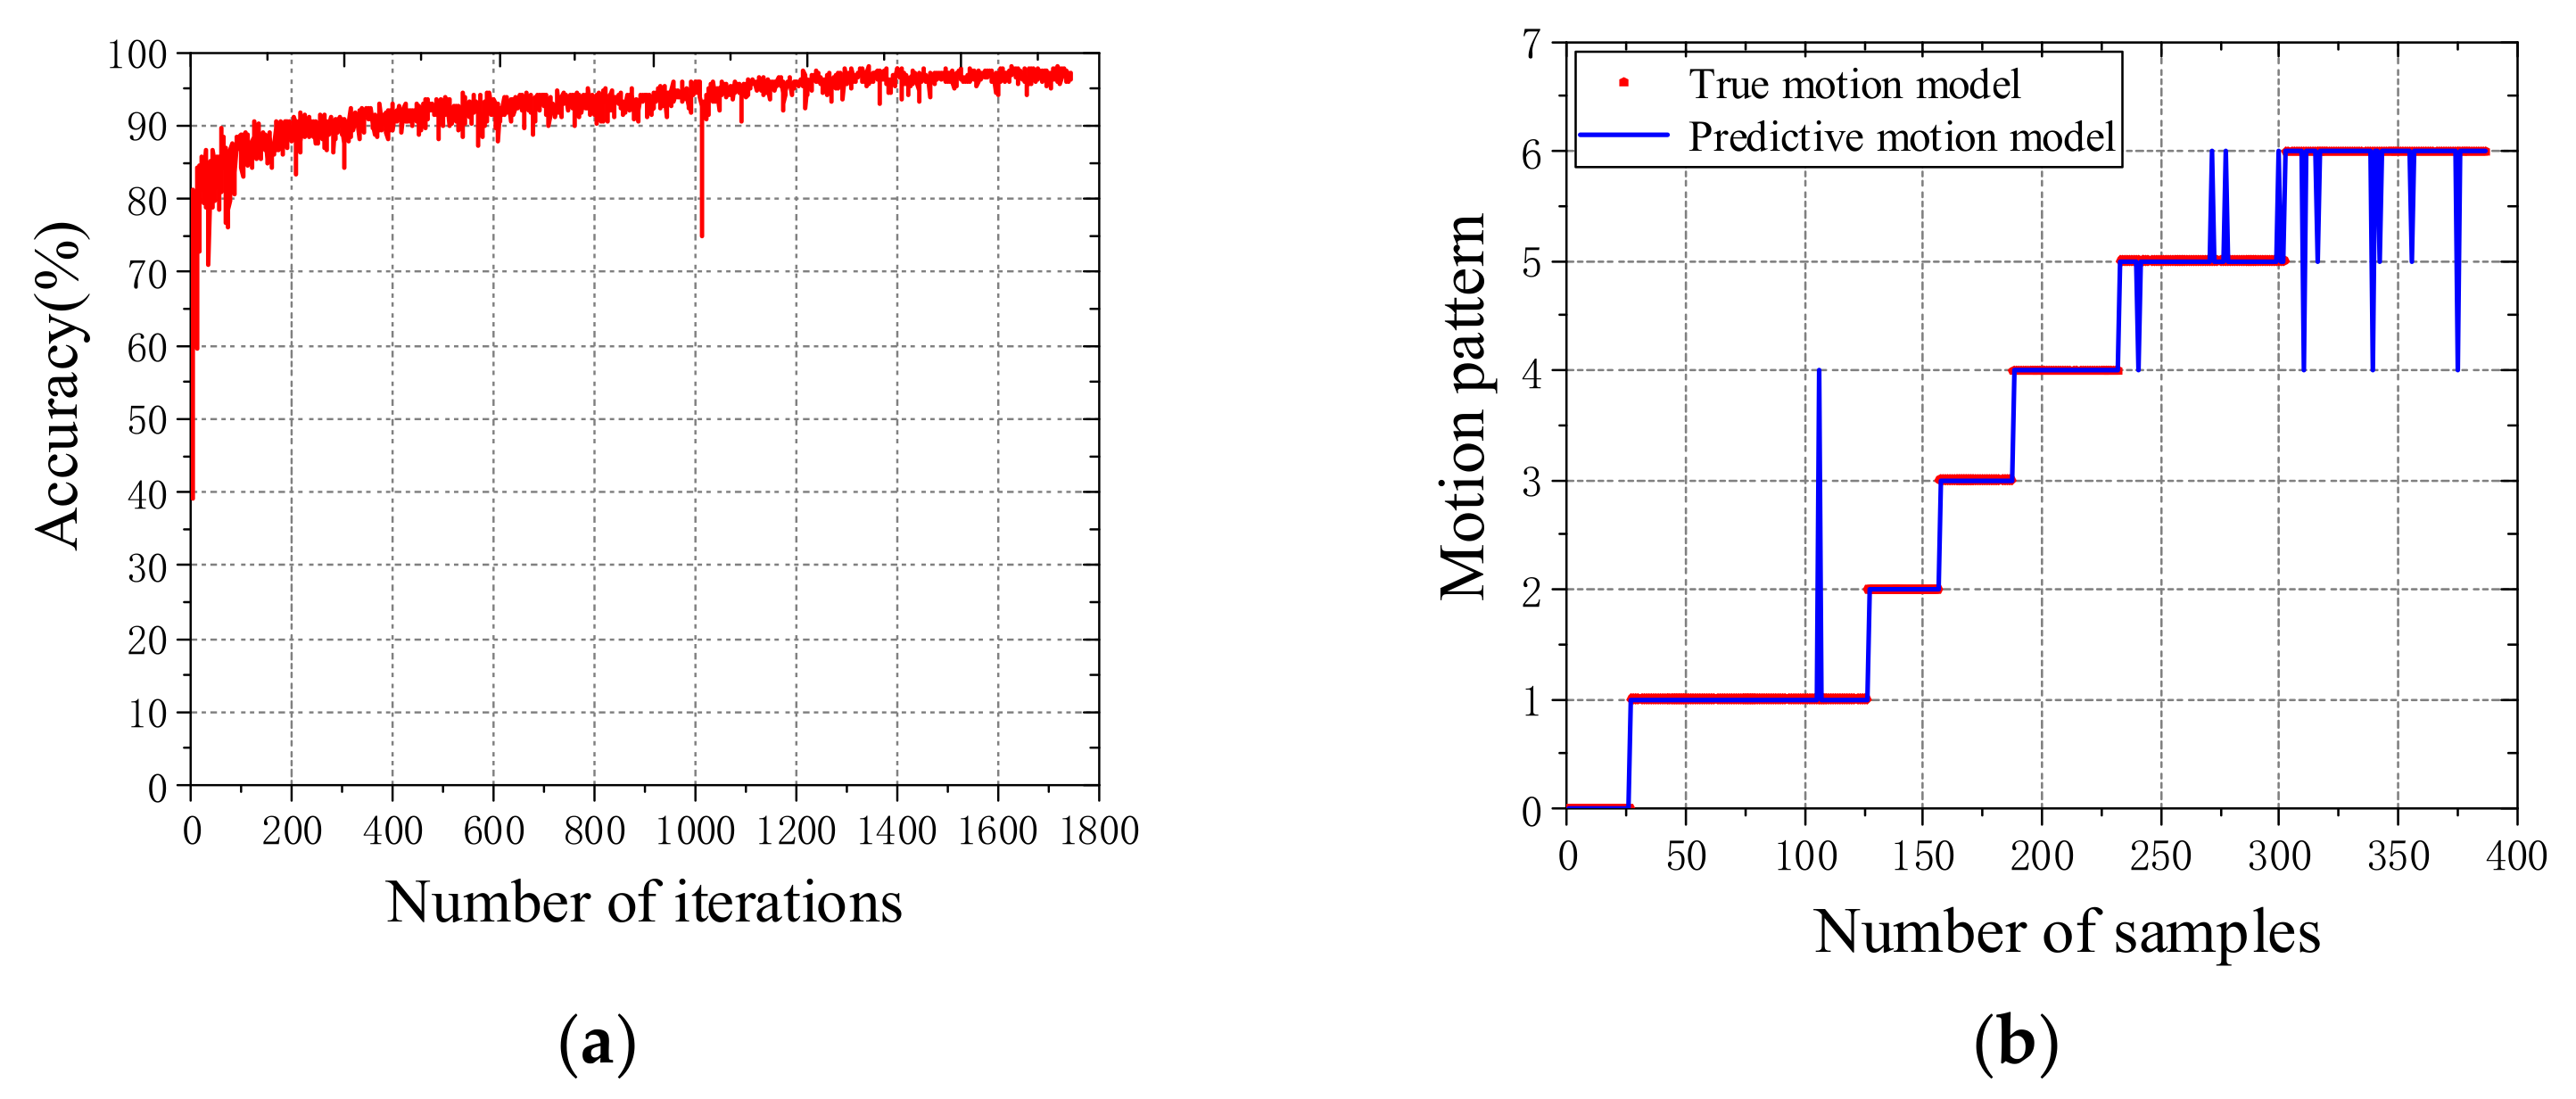
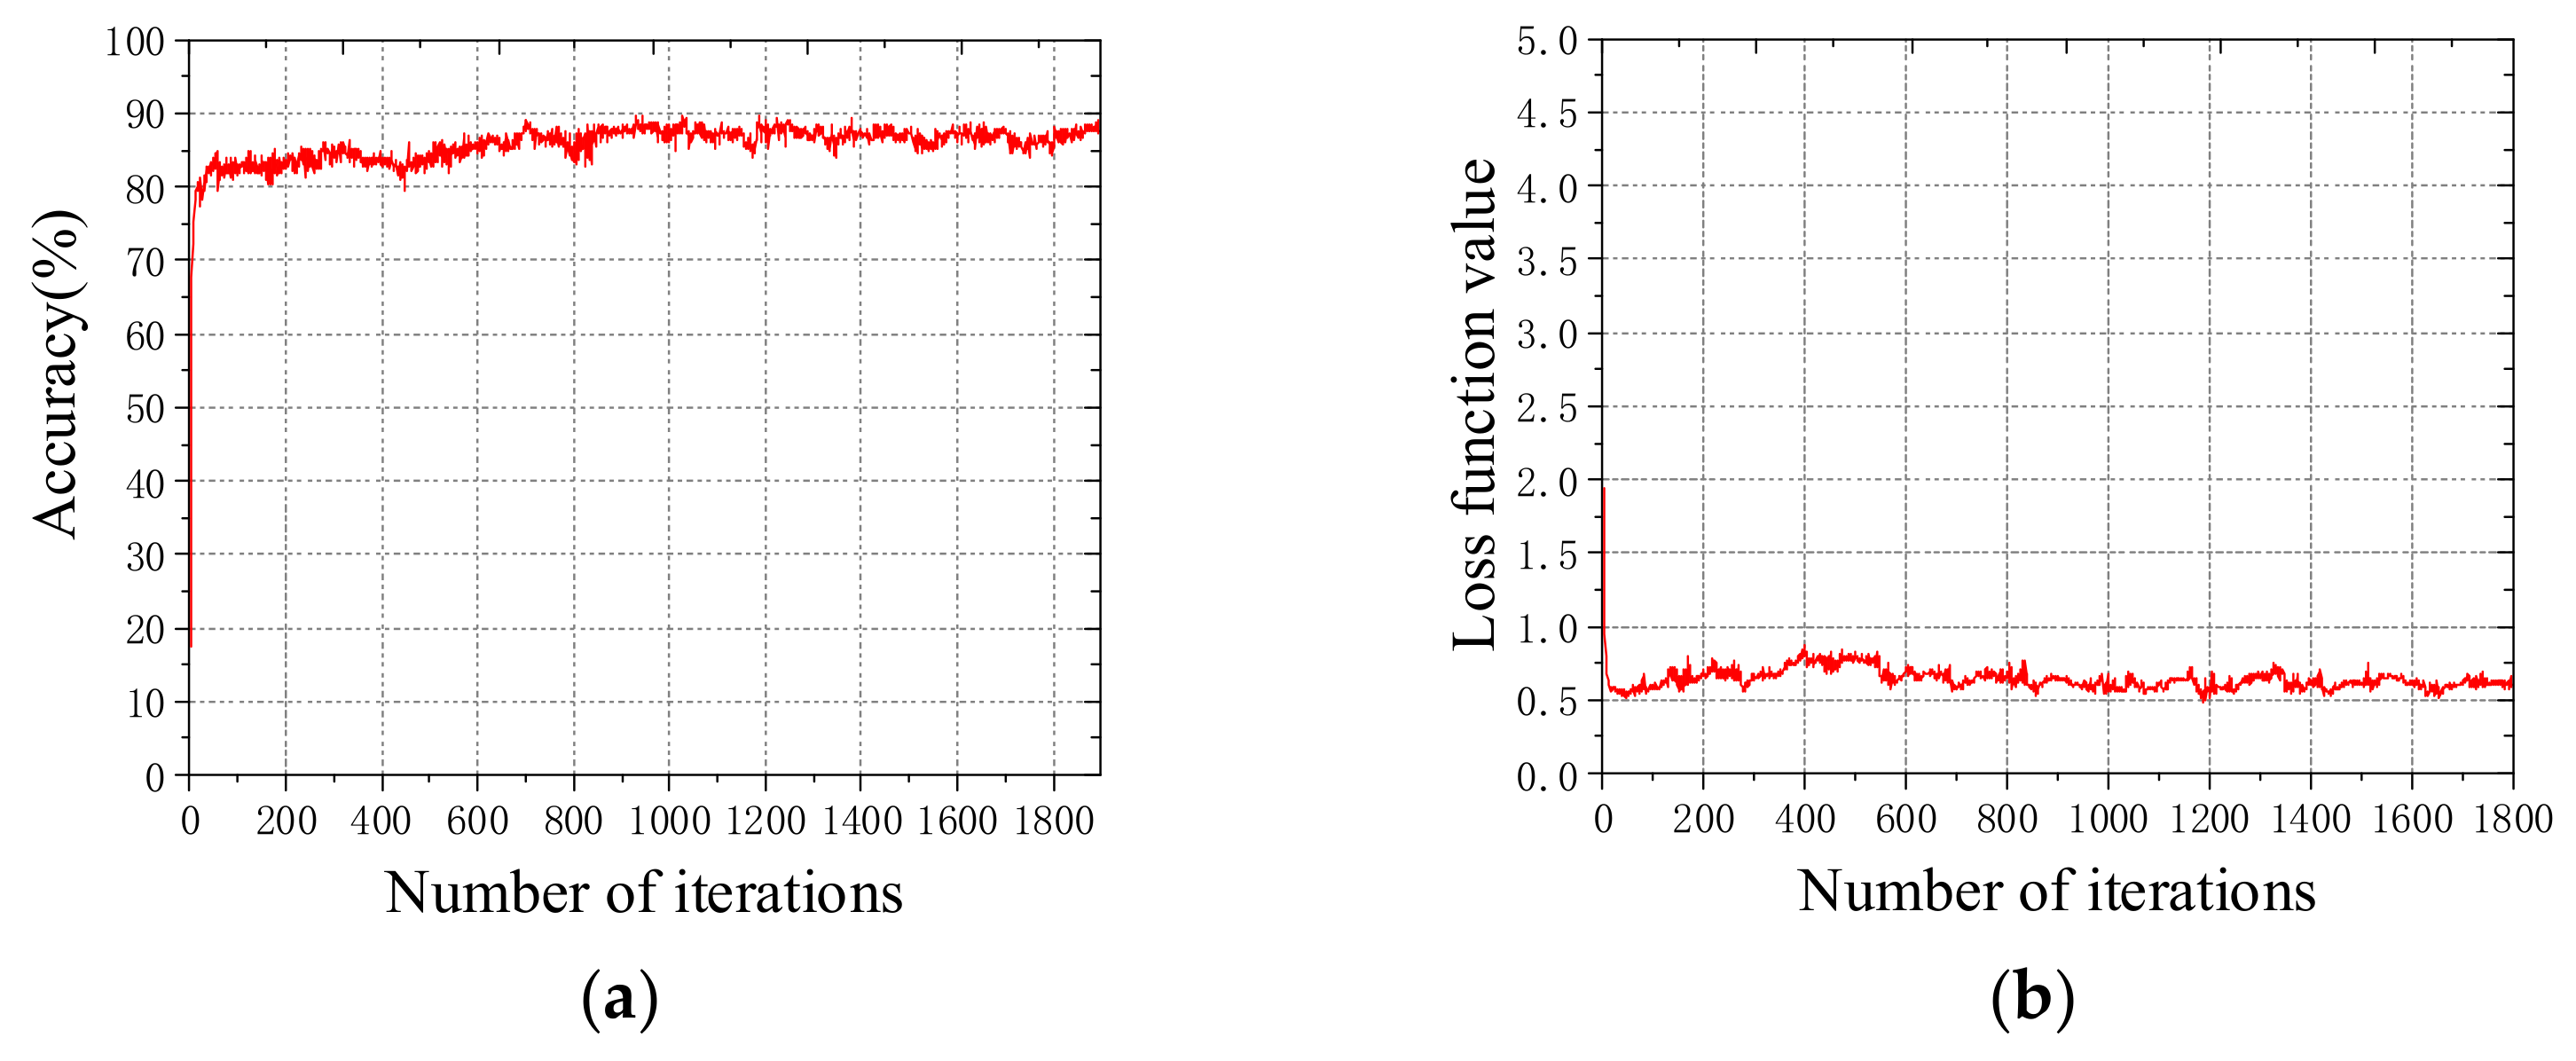
When an offline supervised learning of the surface EMG dataset based on the LSTM classifier is carried out with the sliding window length of 1024 ms, and using all the time and frequency-domain feature parameters, the accuracy rate of the human motion pattern recognition is slightly higher than that of the multilayer perceptrons, reaching 96.57%. The ReLU function is not suitable as the activation function of the model input layer, and the model recognition accuracy using the sigmoid function and tanh function as the activation functions is higher. When the length of the sliding window is shortened, the accuracy rate is still high, e.g., the recognition accuracy rate is 88.84% at 512 ms, so the LSTM classifier performs better than the multilayer perceptrons in the recognition of human motion patterns.

Author Contributions

Conceptualization, J.S. and A.Z.; methodology, Y.T.; software, J.S. and H.H.; validation, J.S., Z.S., and Y.T.; writing—original draft preparation, J.S.; writing—review and editing, A.Z.; visualization, M.A.A. and Y.T.; supervision, A.Z.; snd project administration, A.Z., X.Z., and G.C. All authors have read and agreed to the published version of the manuscript.

Funding

This research was funded by the National Key Research and Development Program for Intelligent Robots of the Ministry of Science and Technology, grant number 2017YFB1300505, and the Shenzhen Joint Key Fund Project of the National Natural Fund, grant number U1813212.

Conflicts of Interest

The authors declare no conflicts of interest.

Appendix A

This section lists the confusion matrices for the data in the "Experiments and Results" section of the article. Table A1 shows the confusion matrix of Figure 7b, Table A2 shows the confusion matrix of Figure 9a, Table A3 shows the confusion matrix of Figure 9b, Table A4 shows the confusion matrix of Figure 10b, Table A5 shows the confusion matrix of Figure 12a, and Table A6 shows the confusion matrix of Figure 12b.
Table A1. The confusion matrix of Figure 7b.
0123456
0631
142754
2 38717
3 237651
4 519312
5 322613
6 6224
Table A2. The confusion matrix of Figure 9a.
0123456
07111
1512683283
291072302
3 213391611
4 5116841
5 1221934
6 21203
Table A3. The confusion matrix of Figure 9b.
0123456
0661
112791
2 19331
3 914
4 51964
5 2394
6 2236
Table A4. The confusion matrix of Figure 10b.
0123456
026
199
2 30
3 31
4 1 4513
5 663
6 379
Table A5. The confusion matrix of Figure 12a.
0123456
025 1
195 911
2 282 1
3 33
4 5 57
5 2 127011
6 1 14962
Table A6. The confusion matrix of Figure 12b.
0123456
024
195
2 231 2
3 321
4 64
5 79
6 2 130

References

  1. Fratini, A.; La Gatta, A.; Bifulco, P.; Romano, M.; Cesarelli, M. Muscle motion and EMG activity in vibration treatment. Med Eng. Phys. 2009, 31, 1166–1172. [Google Scholar] [CrossRef] [PubMed]
  2. Fang, Y.; Liu, H.; Li, G.; Zhu, X. A Multichannel Surface EMG System for Hand Motion Recognition. Int. J. Humanoid Robot. 2015, 12, 1550011. [Google Scholar] [CrossRef]
  3. Li, G.; Li, Y.; Yu, L.; Geng, Y. Conditioning and Sampling Issues of EMG Signals in Motion Recognition of Multifunctional Myoelectric Prostheses. Ann. Biomed. Eng. 2011, 39, 1779–1787. [Google Scholar] [CrossRef] [PubMed]
  4. Kiguchi, K.; Imada, Y. EMG-based control for lower-limb power-assist exoskeletons. IEEE Workshop on Robotic Intelligence in Informationally Structured Space 2009, 19–24. [Google Scholar] [CrossRef]
  5. He, H.; Kiguchi, K. A Study on EMG-Based Control of Exoskeleton Robots for Human Lower-limb Motion Assist. In Proceedings of the 2007 6th International Special Topic Conference on Information Technology Applications in Biomedicine, Tokyo, Japan, 8–11 November 2007. [Google Scholar]
  6. Young, A.J.; Simon, A.M.; Fey, N.P.; Hargrove, L.J. Classifying the intent of novel users during human locomotion using powered lower limb prostheses. In Proceedings of the 2013 6th International IEEE/EMBS Conference on Neural Engineering (NER), San Diego, CA, USA, 5–8 November 2013. [Google Scholar]
  7. Young, A.J.; A Kuiken, T.; Hargrove, L.J. Analysis of using EMG and mechanical sensors to enhance intent recognition in powered lower limb prostheses. J. Neural Eng. 2014, 11, 56021. [Google Scholar] [CrossRef] [PubMed]
  8. Joshi, C.D.; Lahiri, U.; Thakor, N.V. Classification of gait phases from lower limb EMG: Application to exoskeleton orthosis. IEEE Point-of-Care Healthcare Technologies (PHT) 2013, 228–231. [Google Scholar] [CrossRef]
  9. Simon, A.M.; Seyforth, E.A.; Hargrove, L.J. Across-Day Lower Limb Pattern Recognition Performance of a Powered Knee-Ankle Prosthesis. In Proceedings of the 2018 7th IEEE International Conference on Biomedical Robotics and Biomechatronics (Biorob), Enschede, Netherlands, 26–29 August 2018. [Google Scholar]
  10. Pang, M.; Guo, S.; Song, Z. Study on the sEMG Driven Upper Limb Exoskeleton Rehabilitation Device in Bilateral Rehabilitation. J. Robot. Mechatronics 2012, 24, 585–594. [Google Scholar] [CrossRef]
  11. Khokhar, Z.; Xiao, Z.G.; Menon, C. Surface EMG pattern recognition for real-time control of a wrist exoskeleton. Biomed. Eng. Online 2010, 9, 41. [Google Scholar] [CrossRef] [PubMed] [Green Version]
  12. Tang, Z.; Zhang, K.; Sun, S.; Gao, Z.; Zhang, L.; Yang, Z. An Upper-Limb Power-Assist Exoskeleton Using Proportional Myoelectric Control. Sensors 2014, 14, 6677–6694. [Google Scholar] [CrossRef] [PubMed] [Green Version]
  13. Lu, Z.; Chen, X.; Zhang, X.; Tong, K.Y.; Zhou, P. Real-Time Control of an Exoskeleton Hand Robot with Myoelectric Pattern Recognition. Int. J. Neural Syst. 2017, 27, 1750009. [Google Scholar] [CrossRef] [PubMed]
  14. Liu, D.-X.; Wu, X.; Du, W.; Wang, C.; Xu, T. Gait Phase Recognition for Lower-Limb Exoskeleton with Only Joint Angular Sensors. Sensors 2016, 16, 1579. [Google Scholar] [CrossRef] [PubMed] [Green Version]
  15. Liu, Z.; Lin, W.; Geng, Y.; Yang, P. Intent pattern recognition of lower-limb motion based on mechanical sensors. IEEE/CAA J. Autom. Sin. 2017, 4, 651–660. [Google Scholar] [CrossRef]
  16. Fischer, A.; Do, M.; Stein, T.; Asfour, T.; Dillmann, R.; Schwameder, H. Recognition of Individual Kinematic Patterns during Walking and Running - A Comparison of Artificial Neural Networks and Support Vector Machines. Int. J. Comput. Sci. Sport 2011, 10, 63–67. [Google Scholar]
  17. Song, J.; Zhu, A.; Tu, Y.; Wang, Y.; Arif, M.; Shen, H.; Shen, Z.; Zhang, X.; Cao, G. Human Body Mixed Motion Pattern Recognition Method Based on Multi-Source Feature Parameter Fusion. Sensors 2020, 20, 537. [Google Scholar] [CrossRef] [PubMed] [Green Version]
  18. Greff, K.; Srivastava, R.K.; Koutnik, J.; Steunebrink, B.R.; Schmidhuber, J. LSTM: A Search Space Odyssey. IEEE Trans. Neural Networks Learn. Syst. 2017, 28, 2222–2232. [Google Scholar] [CrossRef] [PubMed] [Green Version]
Figure 1. Lower-limb wearable surface electromyography acquisition system.
Applsci 10 03358 g001
Figure 2. Hardware of the wireless surface electromyography (EMG) acquisition system.
Applsci 10 03358 g002
Figure 3. Surface electromyography of the rectus femoris in squatting-standing motion mode.
Applsci 10 03358 g003
Figure 4. Sliding window method to extract the feature dataset.
Applsci 10 03358 g004
Figure 5. Feature extraction of surface electromyography on rectus femoris in the squatting-standing motion mode. (a) Root mean square (RMS), (b) mean absolute value (MAV), (c) variance (VAR), (d) zero crossing (ZC), (e) mean power frequency (MPF), and (f) median frequency (MF).
Applsci 10 03358 g005
Figure 6. Subject wears EMG acquisition equipment to exercise outdoors.
Applsci 10 03358 g006
Figure 7. Recognition accuracy rate using a multilayer perceptron classifier. (a) Model accuracy rate under cross validation. (b) Comparison of the true value of the validation set and the classification result.
Applsci 10 03358 g007
Figure 8. Performance of a multilayer perceptron classifier with 28 hidden layer nodes. (a) Mean square error change during training. It can be seen that as the number of iterations increases, the three curves of training data, validation data, and test data have the same downward trend. The optimal value of the mean square error reached the set mean square error after about 280 iterations. (b) Comprehensive error distribution of the classifier. It can be seen that the error distribution of the training data, test data and verification data, the error in the range of -0.429-0.3771 accounts for about 95.4%.
Applsci 10 03358 g008
Figure 9. Effects of trend term on classification accuracy. (a) Recognition results of unremoved trend term. (b) Recognition results of removed trend term.
Applsci 10 03358 g009
Figure 10. Training accuracy rate of the long short-term memory (LSTM) neural network. (a) Changes in accuracy. (b) Comparison of classification results with the true motion model.
Applsci 10 03358 g010
Figure 11. Performance change of the LSTM model during the sliding window length of 512 ms. (a) Changes in accuracy. (b) Changes of the loss function value.
Applsci 10 03358 g011
Figure 12. Recognition results of the LSTM model in smaller window lengths. (a) Sliding window length of 256 ms. (b) Sliding window length of 512 ms.
Applsci 10 03358 g012
Table 1. Labels and human movement modes.
Label 0123456
Movement ModeStand stillStep in placeSquat and StandStand up and sit downWalk straightUpstairsDownstairs
Graph Applsci 10 03358 i001 Applsci 10 03358 i002 Applsci 10 03358 i003 Applsci 10 03358 i004 Applsci 10 03358 i005 Applsci 10 03358 i006 Applsci 10 03358 i007
Table 2. Recognition accuracy of different feature parameter sets in a three-layer multilayer perceptron model. Root mean square (RMS), variance (VAR), zero crossing (ZC), mean power frequency (MPF), and median frequency (MF).
Feature SetNumber of Hidden NodesRecognition Accuracy Rate (%)Prediction Time (ms)
RMS3474.496.5
RMS, VAR, ZC3889.896.2
MPF, MF3865.286.4
RMS, VAR, ZC, MPF, MF4095.936.4
Table 3. Recognition accuracy using different sliding window lengths.
Window Length (ms)Number of Hidden NodesRecognition Accuracy Rate (%)Prediction Time (ms)
2563549.389
5122665.986.3
10244095.936.4
20482888.656.4
Table 4. Recognition accuracy of the LSTM model with different activation functions and different sliding window lengths. ReLU: rectified linear unit.
Correct Rate (%)Sliding Window Length (ms)
25651210242048
Activation function typeSigmoid75.1886.2294.6197.14
ReLU40.0549.6460.0543.49
Tanh77.7588.8496.5798.18
Table 5. Recognition accuracy of the LSTM model with different feature parameter sets and sliding window lengths.
Correct Rate (%)Sliding Window Length (ms)
25651210242048
Feature SetsRMS68.6284.3294.3696.87
RMS, VAR and ZC73.3087.6596.0897.66
MPF and MF59.0266.0393.1480.21
RMS, VAR, ZC, MPF and MF77.7588.8496.5798.18

