A Computer Vision Based Conveyor Deviation Detection System


1
College of Mechanical and Electronic Engineering, Shandong University of Science and Technology, Qingdao 266590, China
2
Libo Heavy Industries Science and Technology Co., Ltd, Taian 271000, China
*
Authors to whom correspondence should be addressed.
†
Current address: College of Mechanical and Electronic Engineering, Shandong University of Science and Technology, Qingdao 266590, China.
‡
These authors contributed equally to this work.
Appl. Sci. 2020, 10(7), 2402; https://doi.org/10.3390/app10072402
Submission received: 7 March 2020
/
Revised: 27 March 2020
/
Accepted: 28 March 2020
/
Published: 1 April 2020
(This article belongs to the Section Applied Industrial Technologies)
Abstract
:The monitoring of conveyor belt deviation based on computer vision is the research topic of this paper. A belt conveyor system equipped with cameras and a laser generator is used as the test apparatus. Two kinds of conveyor condition monitoring algorithms are developed, applied and compared in this paper. Method 1 is to extract the edges of the conveyor belt based on the methods of edge detection and line fitting, and an analysis method is proposed to quickly determine whether the conveyor belt is off course. This method simplifies the information processing process after edge line extraction and realizes the fast and effective state detection of the conveyor belt. A conveyor belt deviation detection system was built in Method 2 with the aid of laser technology and the Labview platform. The result of deviation detection was more accurate and reliable with the addition of the laser line. It is observed that both methods can perform well for belt deviation detection, especially Method 2 that resulted in higher reliability and accuracy with faster processing speed. It provides new ideas for ensuring the safe and efficient operation of the conveyor.
1. Introduction
The belt conveyor is the most widely used piece of equipment in coal mine undergrounds and surface production systems with continuous transportation capacities. Due to the complicated force conditions of the conveyor belt, it is very prone to failures such as tearing, deviation, and surface damage, which poses serious threats to the safe and efficient production of enterprises. When a conveyor belt failure occurs, it usually results in a conveyor running resistance increases, the speed of wear and tear increases, and even leads to downtime.
A deviation accident is the most common failure during the operation of the belt conveyor [1], which accounts for 70∼80% of the total accidents. It is generally defined as the distance between the centerline of the belt surface and the centerline of the rack exceeding 5% of the bandwidth length. Deviation is a kind of extremely harmful belt conveyor failure, and its failure usually manifests itself as follows: the edges of the belt are worn, the actual width of the belt used to carry the conveying material becomes smaller, and the friction of the roller frame causes the belt to tear, or directly increases the running resistance of the conveyor, causing slippage, which in turn causes a series of other safety accidents. Conveyor belt running deviation is caused by a variety of factors. Reference [2] put forward the reasons and solutions from the aspects of strength, installation accuracy and maintenance quality of conveyor parts. Reference [3] combined with the specific situation of the coal mines in the Huaibei area of China, from the aspects of equipment selection and installation, analyzed the causes of conveyor belt deviation, and specific solutions were given.
It has been recognized for a long time that it is very necessary to establish a conveyor state detection system. Radio frequency identification (RFID) technology [4], Embedded conductive detection (ECD) technology [5], and an X-ray testing model [6] were proposed one after another. However, due to the technical conditions and the use cost, these technologies have not been successfully practiced in the field. Specifically for the problem of conveyor belt deviation, the methods to detect the deviation of conveyor belt mainly include manual detection, mechanical deviation correction and photoelectric deviation correction [7] at present. However, they also have a variety of problems, such as the poor accuracy of mechanical deviation correction equipment, high cost of photoelectric deviation correction equipment, and that they cannot achieve the visualization of deviation data.
With the development of computer vision technology, its application in fault detection of conveyors is becoming more and more extensive. A multispectral visual detection method for conveyor belt longitudinal tear was proposed in [8] to solve the drawbacks of the existing conveyor belt longitudinal tear detection technology, and its reliability and real-time were verified to meet the requirements in the industrial field. Reference [9] presented a mathematical model for measuring bulk material flow on the conveyor belt using laser scanning technology, providing a basis for intelligent speed regulation of conveyor. A non-contact monitoring method was proposed based on image processing and pattern recognition in Reference [10], which provided new ideas for real-time and non-blind zone conveyor belt monitoring. In Reference [11], an algorithm combined wavelet packet decomposition with the canny operator was proposed, and this algorithm was also proved in laboratory experiments not only can ensure the validity and reliability of extracting line but also to reduce the calculation to improve the real-time performance of the system. An online visual belt inspection system was developed in Reference [12] used for detecting longitudinal rip and belt deviation from binary belt images. Reference [13] put forward a real-time conveyor belt detection algorithm based on a multi-scale feature fusion network, in particular, a new weighted loss function was designed to optimize the network and to improve the detection effect on the conveyor belt edge. Laboratory experiments proved that it more reliable than the Canny algorithm, FCNs, UNet, and Deeplab v3 networks. A multi-scale Retinex method was proposed in Reference [14] to enhance multi-view images of mine conveyor belt adaptively, which can remove the influence of uneven illumination and harsh underground environments on image quality, and make the details of dark areas in the images more obvious. A method based on machine vision and image processing techniques was proposed in Reference [15] for the estimation of volume and size distribution of aggregate transported on conveyor belts. Reference [16] proposed an on-line belt state detection method based on the line laser technology, to accomplish conveyor belt longitudinal rip detection rapidly and accurately, and also the monitoring system was designed. A new non-contact belt conveyor speed measurement system was proposed in Reference [17], which can meet the measurement speed requirements in the long time operation of conveying.
Motivated by the above observations, most scholars focus their attention on the effective extraction of the edge of the conveyor belt but do not analyze the specific relationship between edge line feature and deviation behavior. In this paper, while analyzing the relationship between edge line characteristics and deviation, two deviation detection algorithms are proposed, verified and compared, which provide powerful technical assistance for the deviation detection of the conveyor.
2. Experimental Setup
Image data acquisition and processing are carried out on the experimental setup as shown in Figure 1a. The main elements of the setup are the computer, belt conveyor, cameras, lighting, Arduino microcontroller, laser generator, proximity sensor sensor, and motor controller. The laser generator is installed vertically above the conveyor and the conveyor belt, located in the center of the whole frame width direction, which is used to produce two laser lines perpendicular to each other, as shown in Figure 1a (Laser 1 and Laser 2). The Arduino microcontroller and a proximity sensor are used to detect the presence of material on the conveyor belt and signaled a camera to acquire the images. The acquired images are processed both offline and in real-time using Matlab and Labview. Figure 1b shows the structure model of the conveyor tail drum. Here are four main parts: roller shaft, bolt, bearing chock, and adjusting bracket. The adjusting bracket is fixed on the conveyor frame, the roller shaft is mounted in the bearing chock, and the bolt is connected to the bearing chock by a nut fixed to the bearing chock. Then the movement of the bearing chock in the adjusting bracket can be realized by rotating the bolt, so as to realize the movement of roller shaft.
In this paper, the feasibility of the device and algorithm is verified by the above experimental setup. Each experiment was divided into four stages: running normally, manufactured running deviation artificially, corrected running deviation artificially, and running normally. In the running normally stage, the conveyor was correctly identified, with no deviation phenomenon. During the test, the roller shaft of the tail drum of the conveyor was adjusted manually by turning the bolt clockwise, so that its axis was not perpendicular to the centerline of the conveyor frame, to cause the deviation. After running for a period of time, we turn the same bolt counterclockwise to correct the conveyor belt back to the normal position. We only adjusted the bolt on one side of the conveyor instead of the two sides during the experiment. The reliability of the algorithm is verified by the above experimental device.
3. Methodology
The deviation of the conveyor belt is divided into two types: one is deflection and the other is overall offset. The deflection of the conveyor belt indicates that there is an angle between the centerline of the conveyor belt and the centerline of the conveyor. If the elastoplastic deformation of the conveyor belt in the width direction is not considered, it can be considered that there is an angle between the edge of the conveyor belt and the running direction of the conveyor belt, as shown in Figure 2b. The overall offset means that the centerline of the conveyor belt is offset a distance from the centerline of the conveyor, but there is no deflection angle as shown in Figure 2c.
In order to address the two types of deviations mentioned above, two methods were proposed for quickly detecting deviations in this paper. The principle of the two algorithms is illustrated in Figure 3.
3.1. Method 1
The detection principle of Method 1 is shown in Figure 3a.
A rectangular coordinate system consisting of x-axis and y-axis was given, the edge of the conveyor belt is always parallel to the y-axis direction and consistent with the speed when the conveyor belt runs normally and no deviation occurs. At this point, we define the distance from any point on the right edge of the conveyor belt to the y-axis, d. When the conveyor belt is deflected or completely offset, the intersection point of the right edge of the conveyor belt and the x-axis will change. As shown in Figure 3a, after the conveyor belt is deflected to the left, , and a deflection angle will appear at the same time.
Based on the above detection principle, we propose to use a combination of Canny edge detection and Hough straight line detection to obtain a straight line that effectively fits the edge of the conveyor belt, and then extract the slope of the straight line, the abscissa of the intersection of the straight line and the x-axis, that is, extract , shown in Figure 3a.
Canny Edge detection algorithm and the Hough line fitting algorithm were proposed to effectively extract the edges of the conveyor belt, and directly extract and detect the slope of the fitted straight line and the intersection of the straight line and the coordinate axis. The canny operator is a multi-stage optimization operator that integrates filtering, enhancement, and detection, which was proposed by John Canny in 1986 [18], is optimized to deal with the step edge affected by white noise. The process of the Canny edge detection algorithm consists of four steps:
- Step 1:
- Apply a Gaussian filter to smooth the image to remove the noise.
- Step 2:
- Find the intensity gradients of the image.
- Step 3:
- Apply non-maximum suppression to get rid of spurious response to edge detection.
- Step 4:
- Apply a double threshold to determine potential edges and connect edges.
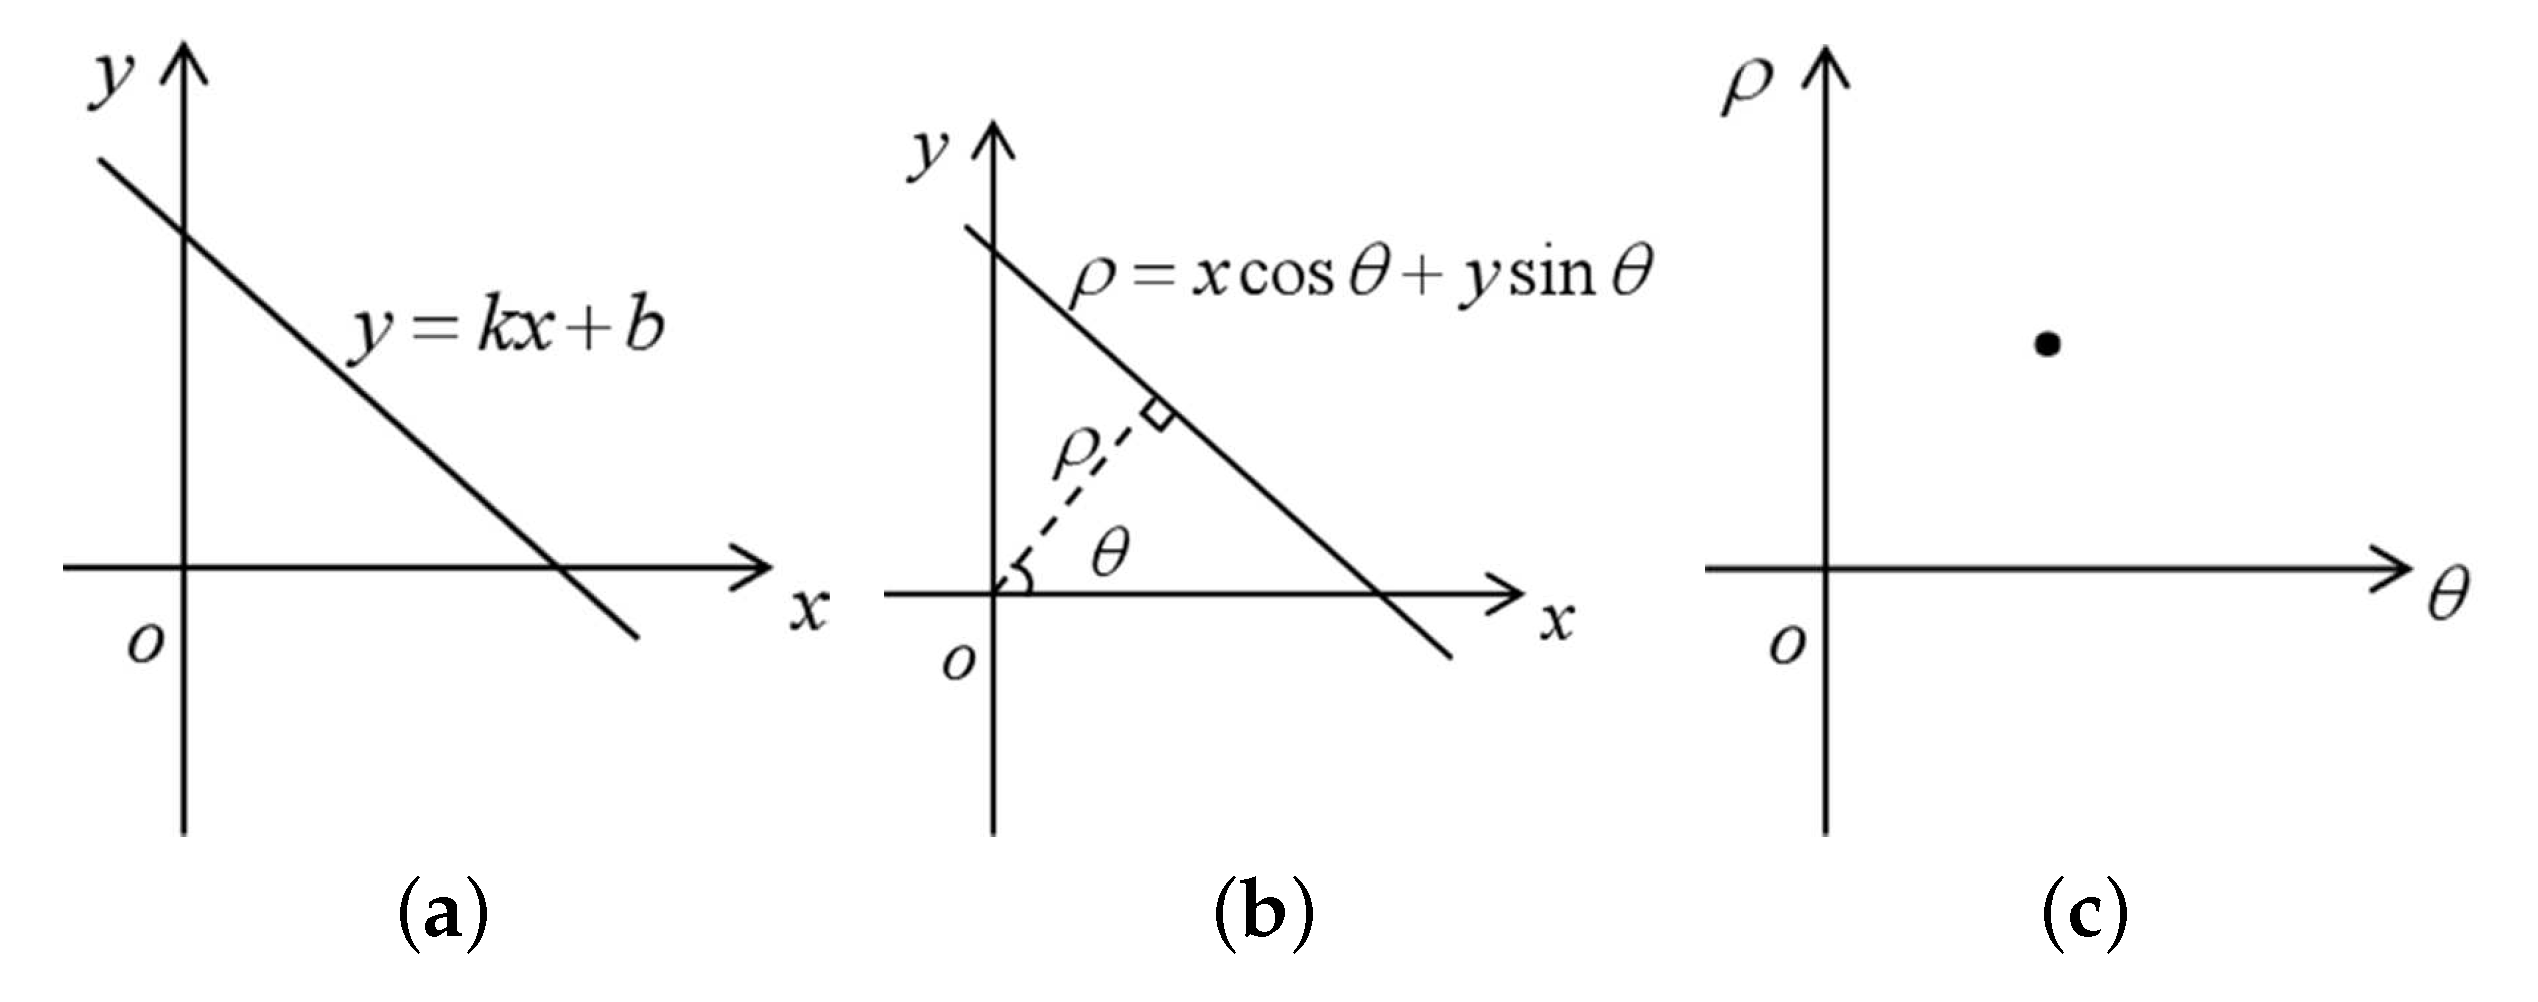
The Hough transform was used to detect the line after the edge detecting by canny algorithm, the basic principle of the algorithm is to transform the image from image space to parameter space. The transformation formula is as follows:
After transformation, the relationship between image space and parameter space is as follows: a point in the image space is a curve in the parameter space, and the points of the colinear image space correspond to the curves at a point in the parameter space.
The basic principle of Hough transformation is to use the transformation between two coordinate spaces, as shown in Figure 4, to map the line in the Cartesian coordinate system to a point in the polar coordinate space to form a peak, thus transforming the problem of detecting the line into a problem of the statistical peak.
3.2. Method 2
The second method is a monitoring method based on laser technology. The laser emitted from the laser generator provides us with a more obvious reference. In this method, the distance between the two edges of the conveyor belt and the laser line in the center is directly detected to realize deviation detection. As shown in Figure 1, the laser generator produces two mutually perpendicular lasers. Among them, laser 1 is used for the cross-sectional area detection of materials and combined with the conveyor belt speed, it is used to realize the amount detection of materials. Laser 2 provides a reference for the edge detection of the conveyor belt. By directly detecting the distance between the edge of the conveyor belt and the reference line, it can more intuitively reflect the deviation of the conveyor belt.
We realized this process in Labview, the steps implemented to perform object detection are as follows:
- (1)
- Image acquisition;
- (2)
- Extraction of the “Value” plane from RGB to HSV color space conversion for better extraction of edge line and laser line [19]. RGB color space describes colors in terms of the amount of Red, Green, and Blue planes. HSV color space describes colors in terms of Hue, Saturation, and Value. HSV image than the RGB image can better reflect the color of the tested object information, RGB image and HSV image can be converted by the following formula:
- (3)
- Segmentation using the clustering thresholding method [20].
- (4)
- Create a Region Of Interest (ROI).
- (5)
- Caliper measurement. The region of interest contains several search lines along which the step searches for sharp transitions in pixel intensities, which typically characterize the edge of an object in the image. The step searches for two edge points along each search line and computes the distance between the two detected edge points. The step returns the minimum or maximum distance measurement of all the search lines as the caliper measurement.
- (6)
- Define a set of two thresholds to determine whether the result of the previous step is within this threshold range, and to determine whether a deviation has occurred.
4. Results
4.1. Experimental Results of Method 1
As the mentioned experimental process in Section 2, the test results of Method 1 with the detection distance and deflection angle as the core fully reproduce our test process, to achieve the purpose of deviation detection.
Figure 5a shows an original image acquired by the camera 1. Before edge detection, we selected a ROI in the original image to reduce the amount of data and calculation time. It is the part of the green rectangular frame in Figure 5a, also as shown in Figure 5b,c is the result of the binarization of the ROI region. Edge detection after binarization can further simplify the grayscale image, make the information in the image purer, and make the changes in edge brightness more obvious.
Figure 5d shows the edge detection results of the Canny algorithm. We performed a Hough transform on the edge detection results to get the straight line in the parameter space shown in Figure 5e, and the straight lines in image space shown in Figure 5f. Then we extracted the abscissa of the intersection of the straight line and the x-axis in the image space and the angle in the parameter space. The results are shown in Figure 6.
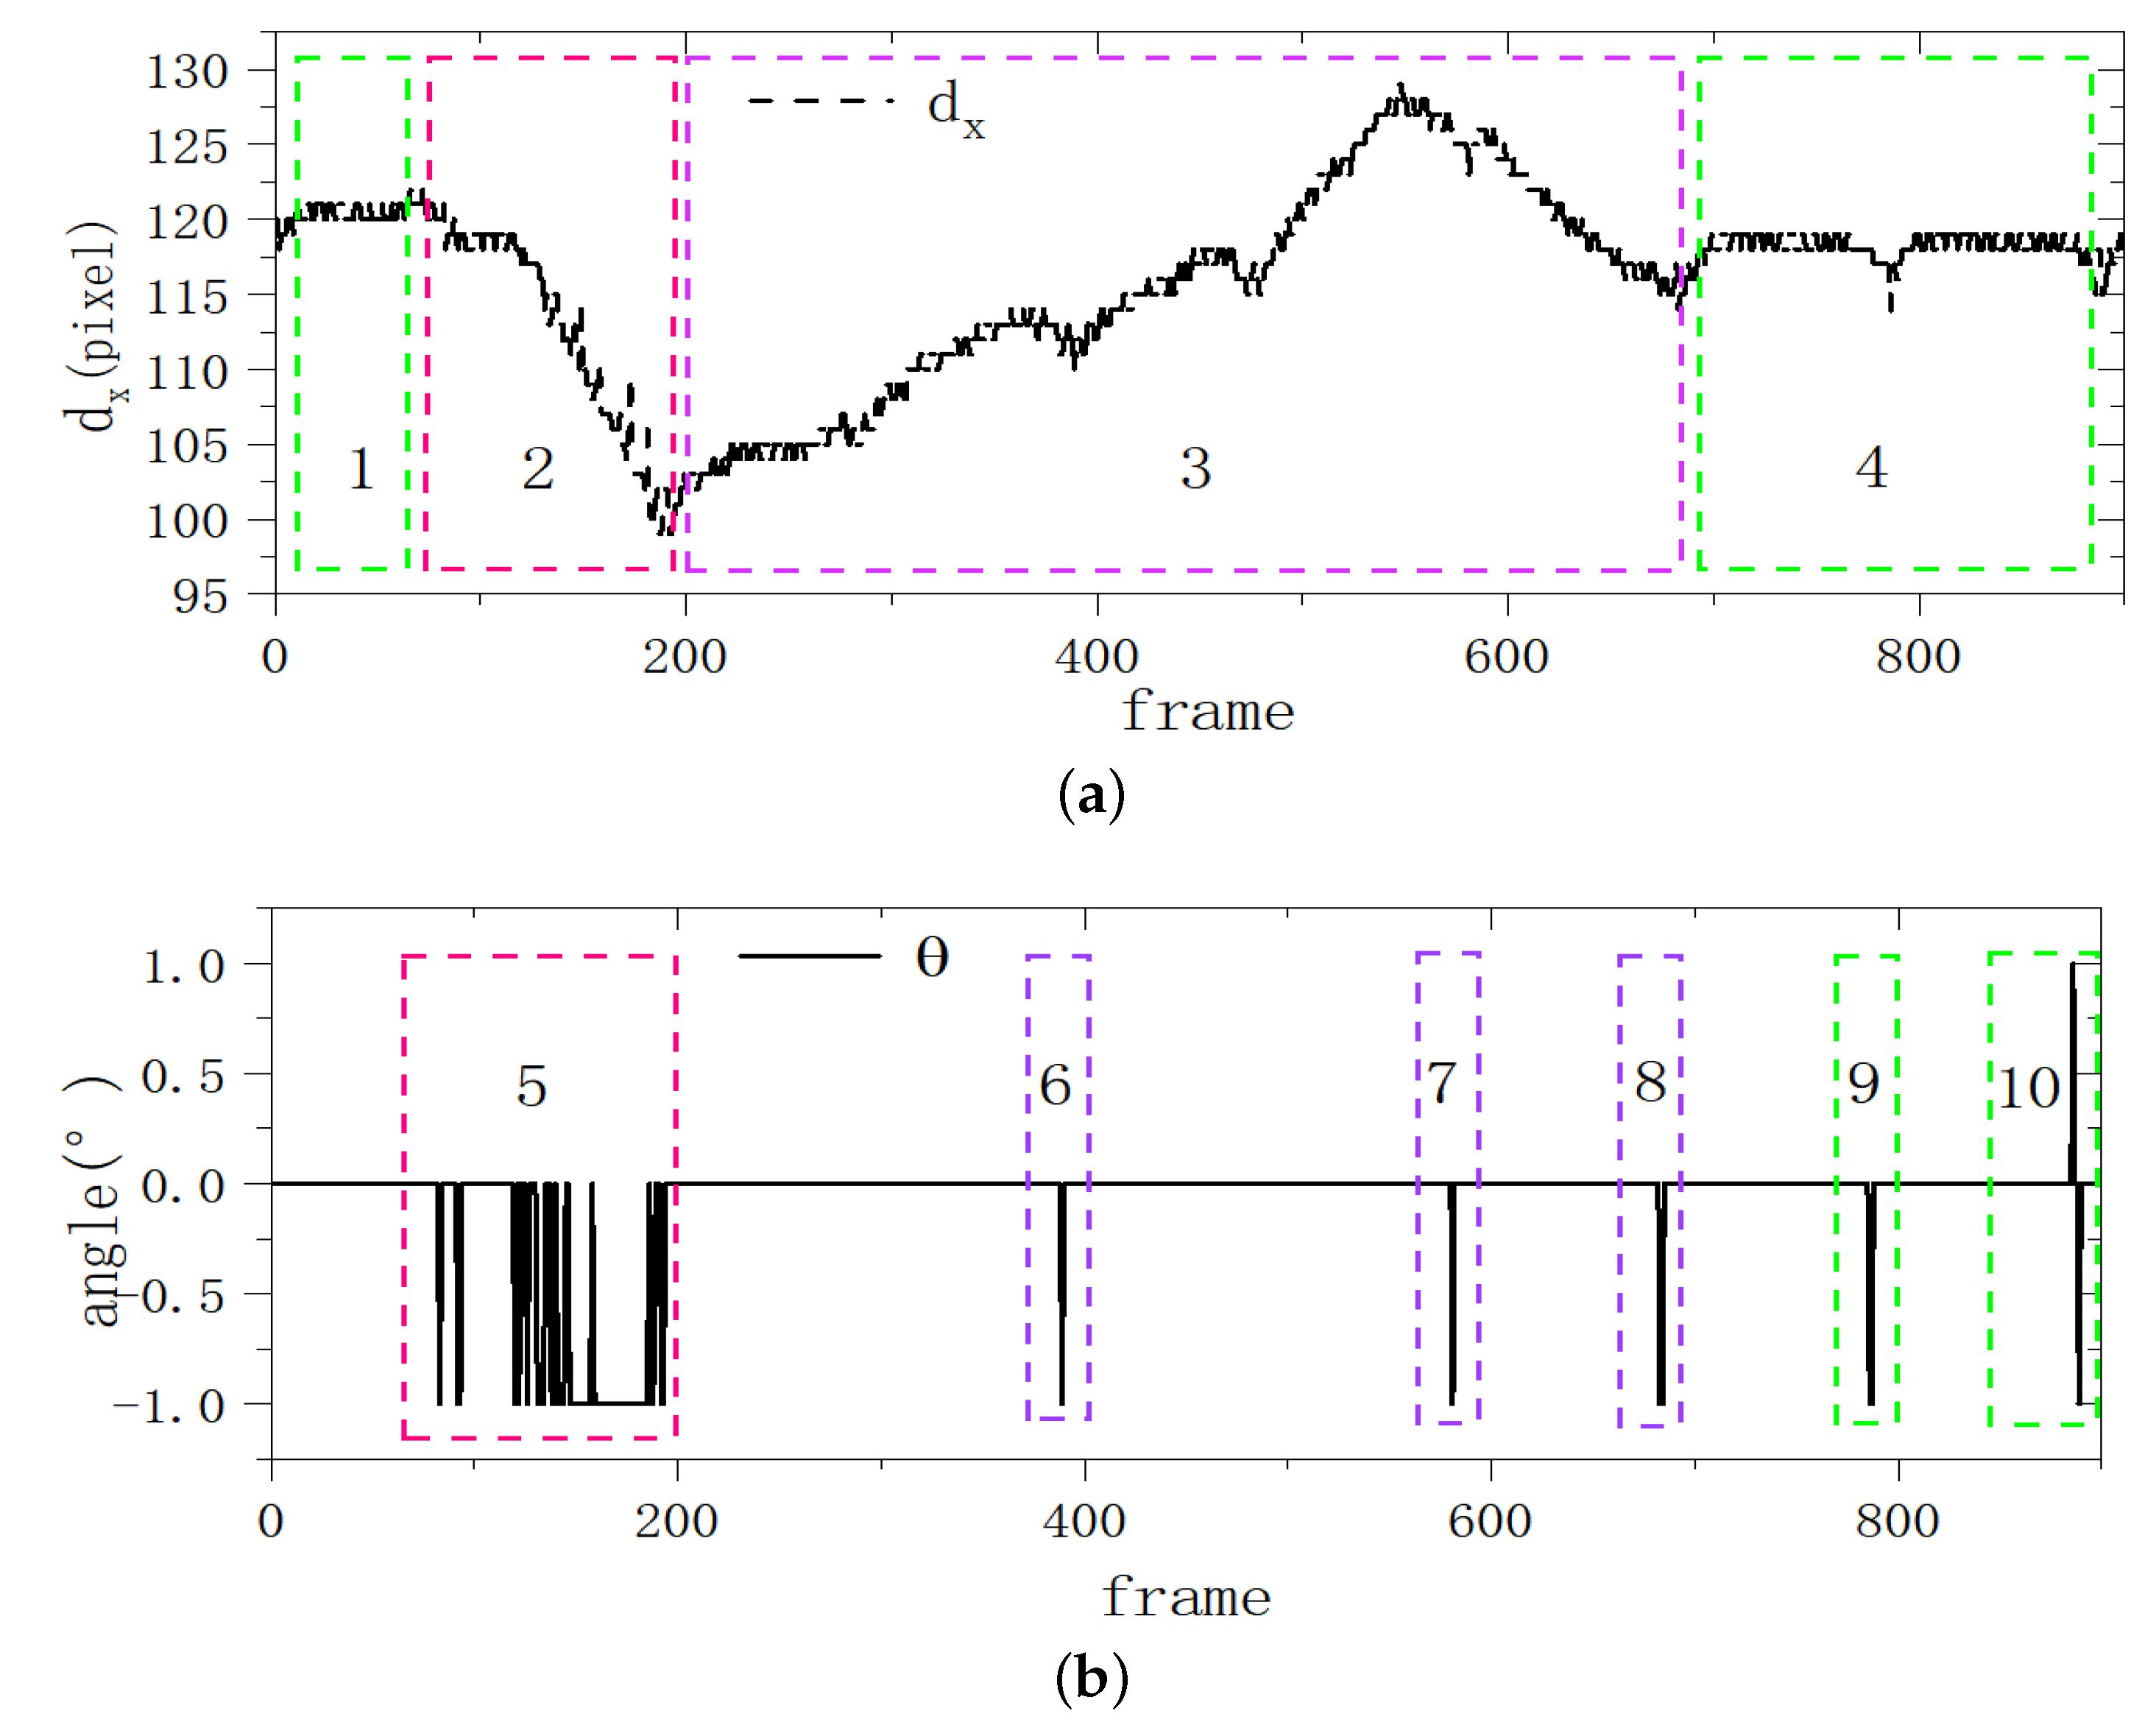
We divided the image in Figure 6 into 10 regions to better explain the experimental results, the region 1∼4 shows the entire experimental process more completely among them. As mentioned in the experimental setup, our experimental process is divided into four parts: running normally, manufactured running deviation artificially, corrected running deviation artificially, and running normally. The region 1∼4 correspond to these four parts one by one.
Figure 6b shows the slope change of the line detected by the algorithm during the experiment. The region 5∼10 indicates that there is a 1 angle between the detected edge line and the Y-axis (velocity direction).
The experimental results of method 1 confirmed that the edge recognition and detection algorithm proposed by this paper based on Canny and Hough could effectively extract the parameters ( and ) of the edge line to achieve our off-tracking detection.
4.2. Experimental Results of Method 2
In experiment 2, we obtained the image shown in Figure 7a through camera 2 and built an image deviation detection platform with the help of the Labview platform to achieve a fast belt deviation detection.
Figure 7a is the raw data image obtained by camera 2. There are two mutually perpendicular laser lines on the conveyor belt surface. Among them, the laser along the bandwidth is used to detect the cross-sectional area of the material. The laser line is used as the measurement reference line for deviation. Figure 7b is the HSV image obtained by converting the RGB image, Figure 7c is the binary image after threshold segmentation, and Figure 7d is the distance information obtained by caliper processing, and its unit is a pixel. All the measurement data during the entire experiment were output to Figure 8.
The two curves in Figure 8a respectively represent the distance between the left and right edges of the conveyor belt and the laser reference line, and Figure 8b shows the difference between the two distances. When we set a threshold T in Figure 8b, when the difference between the two distances exceeds this threshold T, the system will issue an alarm and make the deviation device act and adjust the deviation in time to avoid failure. This method also accurately reproduces the process of simulating the deviation of the conveyor belt.
5. Discussion
By analyzing the experimental results of the two methods, it is clear that both methods can achieve better deviation detection of the conveyor belt. However, in the results of Method 1, we found that the angle detection result does not match the result of our distance change. From our field observation and experience, when the belt deflection occurs, the angle and position of the edge of the belt usually change at the same time. While we have not achieved such an effect through Method 1, when we carefully compare Figure 6a and Figure 6b, we judge that the area where angle exists in Figure 6b corresponds to the fastest change in distance in Figure 6a, that is, the larger this angle is, the faster the conveyor deviates. In the results of Method 1, the position information changes more obvious, while the angle information does not. Therefore, when setting up the conveyor deviation detection system, we can judge whether the deviation occurs by the position information , and judge the severity of the deviation according to the existence of the angle , and then take different corrective measures.
Although there is no angle information in the detection results of Method 2, we can see the distance between the left and the right conveyor belt edge and the laser reference line more clearly and intuitively. The comparison and verification of the two distance information make the output result more reliable and the experimental error smaller.
6. Conclusions
Considering the problem of deviation of a conveyor belt, combined with the unique advantages of computer vision in non-contact measurement, two belt deviation detection methods based on computer vision were proposed. The first method is based on Canny edge detection and the Hough transform, which simplifies the analysis method by directly extracting straight line features. At the same time, by analyzing the experimental results of Method 1, the different roles of position and angle information in deviation detection are pointed out. The second method is to use the line laser generator and Labview platform to build a conveyor belt deviation detection system to perfectly realize the conveyor belt deviation detection, and the results of Method 2 are more reliable.
Laboratory experiments show that both algorithms have high reliability, stability, and real-time performance. Especially the second method, the processing speed can reach 26 frames per second. Besides, these experiments have realized the visualization of the deviation data, which is of great significance for studying the deviation rule and correcting deviation, and has important guiding significance for the safe and efficient operation of the conveyor. In addition, considering the impact of transportation materials on the experimental results will be the next step. Laser-based computer vision technology has a broad application prospect in the running state monitoring of belt conveyor. A more comprehensive conveyor safe running protection system will be established based on this tech to monitor the material flow and tear detection of conveyor belt in the future.
Author Contributions
Methodology, M.Z. (Mengchao Zhang) and H.S.; software and writing–original draft preparation, M.Z. (Mengchao Zhang); writing–review and editing, Y.Y. and M.Z. (Manshan Zhou). All authors have read and agreed to the published version of the manuscript.
Funding
This research received no external funding.
Acknowledgments
The authors wish to acknowledge Vedang Chauhan, Assistant Professor of Western New England University for his help in building the experimental setup.
Conflicts of Interest
The authors declare no conflict of interests.
References
- Chu, Q.Y.; Meng, G.Y.; Fan, X. Analysis of Speed and Belt Deviation of the Conveyor Belt. Adv. Mater. Res. 2011, 339, 444–447. [Google Scholar] [CrossRef]
- Zhao, L. Typical Failure Analysis and Processing of Belt Conveyor. Procedia Eng. 2011, 26, 942–946. [Google Scholar] [CrossRef]
- Zhang, M.; Gao, H.L.; Zhang, Y.; Wang, P.Z. Analysis and Dispose of Deviation of Mine Belt Conveyor. Appl. Mech. Mater. 2014, 608–609, 685–688. [Google Scholar] [CrossRef]
- Tiensai, N. RF identification in the use of belt rip detection [mining product belt haulage]. In Proceedings of the Sensors, Vienna, Austria, 24–27 October 2004. [Google Scholar] [CrossRef]
- Pang, Y.; Lodewijks, G. A Novel Embedded Conductive Detection System for Intelligent Conveyor Belt Monitoring. In Proceedings of the 2006 IEEE International Conference on Service Operations and Logistics, and Informatic (SOLI ’06), Shanghai, China, 21–23 June 2006. [Google Scholar] [CrossRef]
- Guan, Y.; Zhang, J.; Shang, Y.; Wu, M.; Liu, X. Embedded Sensor of Forecast Conveyer Belt Breaks. In Proceedings of the 2008 Fifth International Conference on Fuzzy Systems and Knowledge Discovery (FSKD ’08), Shandong, China, 18–20 October 2008. [Google Scholar] [CrossRef]
- Wang, C.Q.; Zhang, J. The Research on the Monitoring System for Conveyor Belt Based on Pattern Recognition. Adv. Mater. Res. 2012, 466–467, 622–625. [Google Scholar] [CrossRef]
- Qiao, T.; Li, X.; Pang, Y.; Lü, Y.; Wang, F.; Jin, B. Research on conditional characteristics vision real-time detection system for conveyor belt longitudinal tear. IET Sci. Meas. Technol. 2017, 11, 955–960. [Google Scholar] [CrossRef] [Green Version]
- Zeng, F.; Wu, Q.; Chu, X.; Yue, Z. Measurement of bulk material flow based on laser scanning technology for the energy efficiency improvement of belt conveyors. Measurement 2015, 75, 230–243. [Google Scholar] [CrossRef]
- Aichun, Z.; Gang, H.; Yongxing, W. The research on the detection method of belt deviation by video in coal mine. In Proceedings of the 2011 International Conference on Mechatronic Science, Electric Engineering and Computer (MEC), Jilin, China, 19–22 August 2011; pp. 430–433. [Google Scholar] [CrossRef]
- Wang, J.; Liu, Q.; Dai, M. Belt vision localization algorithm based on machine vision and belt conveyor deviation detection. In Proceedings of the 2019 34rd Youth Academic Annual Conference of Chinese Association of Automation (YAC), Jinzhou, China, 6–8 June 2019; pp. 269–273. [Google Scholar] [CrossRef]
- Yang, Y.; Miao, C.; Li, X.; Mei, X. On-line conveyor belts inspection based on machine vision. Optik 2014, 125, 5803–5807. [Google Scholar] [CrossRef]
- Zeng, C.; Zheng, J.; Li, J. Real-Time Conveyor Belt Deviation Detection Algorithm Based on Multi-Scale Feature Fusion Network. Algorithms 2019, 12, 205. [Google Scholar] [CrossRef] [Green Version]
- Gao, R.; Miao, C.; Miao, D.; Li, X. Multi-view image adaptive enhancement method for conveyor belt fault detection. J. China Coal Soc. 2017. [Google Scholar] [CrossRef]
- Kontny, M. Machine vision methods for estimation of size distribution of aggregate transported on conveyor belts. Vibroeng. Procedia 2017, 13, 296–300. [Google Scholar] [CrossRef] [Green Version]
- Li, X.; Shen, L.; Ming, Z.; Zhang, C.; Jiang, H. Laser-based on-line machine vision detection for longitudinal rip of conveyor belt. Optik 2018, 168, 360–369. [Google Scholar] [CrossRef]
- Gao, Y.; Qiao, T.; Zhang, H.; Yang, Y.; Pang, Y.; Wei, H. A contactless measuring speed system of belt conveyor based on machine vision and machine learning. Measurement 2019. [Google Scholar] [CrossRef]
- Canny, J. A Computational Approach To Edge Detection. IEEE Trans. Pattern Anal. Mach. Intell. 1986, PAMI-8, 679–698. [Google Scholar] [CrossRef]
- Chernov, V.; Alander, J.; Bochko, V. Integer-based accurate conversion between RGB and HSV color spaces. Comput. Electr. Eng. 2015, 46, 328–337. [Google Scholar] [CrossRef]
- Sezgin, M.; Sankur, B. Survey over image thresholding techniques and quantitative performance evaluation. J. Electron. Imaging 2004, 13, 146–166. [Google Scholar] [CrossRef]
Figure 1.
Experimental setup: (a) actual experimental setup, (b) structure model of conveyor tail drum.
Figure 1.
Experimental setup: (a) actual experimental setup, (b) structure model of conveyor tail drum.

Figure 2.
Schematic diagram of deviation: (a) normal condition, (b) deflection condition, (c) overall offset condition, v represents the speed direction of the conveyor belt, and represents the deflection angle of the conveyor belt, represents the lateral displacement of the conveyor belt along the bandwidth direction.

Figure 3.
Principle of deviation detection: (a) principle of Method 1, (b) principle of Method 2.

Figure 4.
Diagram of coordinate system transformation: (a) the expression of line in image space, (b) the expression of line in image space, (c) the expression of line in parameter space. These three expressions are equivalent.
Figure 4.
Diagram of coordinate system transformation: (a) the expression of line in image space, (b) the expression of line in image space, (c) the expression of line in parameter space. These three expressions are equivalent.

Figure 5.
Image processing results using Method 1: (a) original image, (b) region of interest, (c) binary image, (d) result of Canny algorithm, (e) line in the parameter space, (f) result of Hough transform.
Figure 5.
Image processing results using Method 1: (a) original image, (b) region of interest, (c) binary image, (d) result of Canny algorithm, (e) line in the parameter space, (f) result of Hough transform.

Figure 6.
Image processing results using Method 1: (a) , the x-coordinate where the line intersects the X-axis, (b) , the angle between the line and the Y-axis.
Figure 6.
Image processing results using Method 1: (a) , the x-coordinate where the line intersects the X-axis, (b) , the angle between the line and the Y-axis.

Figure 7.
Image processing results using Method 1: (a) original image, (b) HSV image, (c) binary image, (d) detection result.
Figure 7.
Image processing results using Method 1: (a) original image, (b) HSV image, (c) binary image, (d) detection result.

Figure 8.
Image processing results using Method 2: (a) the distance between the left and right boundary to center line, (b) the difference between the two distances.
Figure 8.
Image processing results using Method 2: (a) the distance between the left and right boundary to center line, (b) the difference between the two distances.

© 2020 by the authors. Licensee MDPI, Basel, Switzerland. This article is an open access article distributed under the terms and conditions of the Creative Commons Attribution (CC BY) license (http://creativecommons.org/licenses/by/4.0/).
Share and Cite
MDPI and ACS Style
Zhang, M.; Shi, H.; Yu, Y.; Zhou, M. A Computer Vision Based Conveyor Deviation Detection System. Appl. Sci. 2020, 10, 2402. https://doi.org/10.3390/app10072402
AMA Style
Zhang M, Shi H, Yu Y, Zhou M. A Computer Vision Based Conveyor Deviation Detection System. Applied Sciences. 2020; 10(7):2402. https://doi.org/10.3390/app10072402
Chicago/Turabian StyleZhang, Mengchao, Hao Shi, Yan Yu, and Manshan Zhou. 2020. "A Computer Vision Based Conveyor Deviation Detection System" Applied Sciences 10, no. 7: 2402. https://doi.org/10.3390/app10072402
Note that from the first issue of 2016, this journal uses article numbers instead of page numbers. See further details here.