Performance and Usability of Smartglasses for Augmented Reality in Precision Livestock Farming Operations


1
Department of Agricultural Science, University of Sassari, 07100 Sassari, Italy
2
Agricultural Research Agency of Sardinia, Animals Research Station, 07100 Sassari, Italy
*
Authors to whom correspondence should be addressed.
Appl. Sci. 2020, 10(7), 2318; https://doi.org/10.3390/app10072318
Submission received: 30 January 2020
/
Revised: 12 March 2020
/
Accepted: 26 March 2020
/
Published: 28 March 2020
(This article belongs to the Special Issue Augmented Reality: Current Trends, Challenges and Prospects)
Abstract
:In recent years, smartglasses for augmented reality are becoming increasingly popular in professional contexts. However, no commercial solutions are available for the agricultural field, despite the potential of this technology to help farmers. Many head-wearable devices in development possess a variety of features that may affect the smartglasses wearing experience. Over the last decades, dairy farms have adopted new technologies to improve their productivity and profit. However, there remains a gap in the literature as regards the application of augmented reality in livestock farms. Head-wearable devices may offer invaluable benefits to farmers, allowing real-time information monitoring of each animal during on-farm activities. The aim of this study was to expand the knowledge base on how augmented reality devices (smartglasses) interact with farming environments, focusing primarily on human perception and usability. Research has been conducted examining the GlassUp F4 smartglasses during animal selection process. Sixteen participants performed the identification and grouping trials in the milking parlor, reading different types of contents on the augmented reality device optical display. Two questionnaires were used to evaluate the perceived workload and usability of the device. Results showed that the information type could influence the perceived workload and the animal identification process. Smart glasses for augmented reality were a useful tool in the animal genetic improvement program offering promising opportunities for adoption in livestock operations in terms of assessing data consultation and information about animals.
1. Introduction
Augmented reality (AR) is a relatively new technology that allow superimposing virtual objects (computer-generated graphics) over the real world. The term AR was born in the 1990s from Caudell and Mizell [1], at which time AR was classified for the first time into the virtuality continuum “space” that includes other hierarchical levels such as the environments, augmented virtuality and virtual environments. In this classification, AR is closely-related to the real environment that is augmented—not replaced—with computer-generated objects. This is in contrast with augmented virtuality that expands virtual environments with real elements. In general, when real and virtual objects are simultaneously accessible in a display, we refer to this as mixed reality [2]. Likewise, the concept of AR may be applied to all those technologies, e.g., PCs, laptops, tablets, smartphones and wearables that combine and register (align) 3D physical and virtual objects in tangible environments, and in real-time [3]. The importance and strength of an AR system lies in its ability to provide information to users that otherwise would not be available to the handler’s senses and help them in solving tasks at the same time [4].
Moreover, a branch of AR supported from portable devices is named mobile augmented reality (MAR). A MAR system has the same characteristics of an AR system and otherwise display the augmented contents on a mobile device. As a result of their nature, the most important MAR devices are smartphones, tablets and smartglasses. Currently the MAR world is predominantly associated with hand-held devices such as smartphones and tablets, due to their high portability, reduced dimensions (in particular mobile phones) and social acceptance. However, in the near future, they are expected to be replaced by smartglasses (SGs), since they enable users to visualize computer-generated contents without the use of hands and on a front display [5,6]. Some reports suggest there will be an exponential growth of the AR and Virtual Reality (VR) market and of the number of SG distributed by 2025 [7,8].
The first SG protype was developed in 1997 for urban exploration and consisted of several devices (wearable see-through display, handheld computer, GPS receiver, desktop computer in the back, etc.) brought to the user [9]. It was a cumbersome system in contrast with the actual SG available devices.
Currently, smartglasses are essentially head-wearable miniature mobile computer that provide a see-through display, at eye level, where the augmented content (e.g., image, text, video) is projected without occluding the real-word view. Several companies are developing SG devices for AR with large differences in design, incorporating technology and existing functions. In particular, we can differentiate SGs by optical/video see-through display, available sensors (accelerometer, gyroscope, magnetometer, GPS, etc.), tangible interface (external controller, trackpad and button), operating system (Android, Windows, Linux), processors, memory, battery life, weight, field of view and price [10,11]. These overall features are important factors that can affect the SG-wearing experience, leading to different acceptance levels by the users.
Another important element that characterizes an AR system is the tracking and registration process that allow to superimpose the virtual object on the physical ones with several methods. This process can be sensor-based (inertial, magnetic, electromagnetic and ultrasonic method) and video-based (marker-based, feature-based method). Another one can be the hybrid method, which blends the previous systems to reduce their limitations [5].
In recent years, AR technology and SG devices are being increasingly tested, especially in professional contexts, such as the industrial [12,13], medical [14], educational and research sectors and many others like the agricultural sector [15,16,17], besides the SG producer companies, are more focused in developing solutions primarily for manufacturing and engineering field [18,19,20]. Interestingly, however, one of first widespread AR results was in the entertainment field with Pokemon Go smartphone application [21].
Nevertheless, there are usability problems related to human-machine interactions that can limit the spread of SG devices for AR technology [10,22]. These are linked to low computational power and that the available applications are still basic [5], thus the final user may have problems with using the SG if proper applications related to his field of work are not available.
Over the past decades, dairy farms have adopted innovative technologies to improve their productivity, profit and animal welfare [23,24]. Modern milking systems allow recording of milk yields, milking times, electrical conductivity, milk flow rates and alarms for each animal [25,26]. Currently, the level of technology available largely differs according to dairy-producing species. Dairy sheep farms, for instance, have the lowest technological potential, with a majority relying on conventional milking systems.
Historical knowledge and individual productivity are fundamental for flock grouping [27], especially for feeding strategies [28,29] and genetic improvement programs [30], which consist of identifying and grouping animals with predetermined characteristics (mainly milk yield and prolificacy). Moreover, these programs require a considerable amount of human, animal and material resources [31,32]. The identification and grouping of animals for breeding purposes is often highly labor-intensive, commonly involving from two to three operators. It is normally performed in a milking parlor during the milking session. Therefore, the accessibility of real-time information (e.g., milk yield per year, number of live offspring per parturition, etc.) per single animal represents a valuable step forward for breeders. Consequently, linking the individual information of each animal to SG for AR may prove useful for dairy farmers, allowing the completion of work tasks with less workforce thanks to the free use of both hands [33].
To support the effective and safe agriculture adoption of smartglasses for augmented reality, there is a need to provide evidence-based results for SG use in on-farms activities. Additionally, the information type, such as colors and symbols used in a user interface may affects work performance [34].
However, the scientific literature to date fails to address the application of augmented reality in livestock farms. Previous research has highlighted the influence of SG design/category and data composition type on worker safety and performance [35,36,37] and on the obstacles crossing strategies adopted to the wearers to minimize the trip risks [38].
Moreover, the information disposition on the see-through display and walking/sitting behavior affect the text comprehension on the SG [39]. Nevertheless, more studies are needed to support the widespread diffusion of SG for AR in the agricultural and livestock field.
The overall aim of this study is to extend the breadth of knowledge on the interaction of AR devices with a farming environment. Specifically, this work focuses on: (i) the feasibility and performances of animal identification for grouping activities using smartglasses for augmented reality; (ii) the human perception and the usability of smartglasses in on-farm activities. Moreover, the composition of the animal information (i.e., text vs. graphic) displayed through a commercially available SG was also evaluated.
2. Materials and Methods
2.1. Task Equipment and Participants
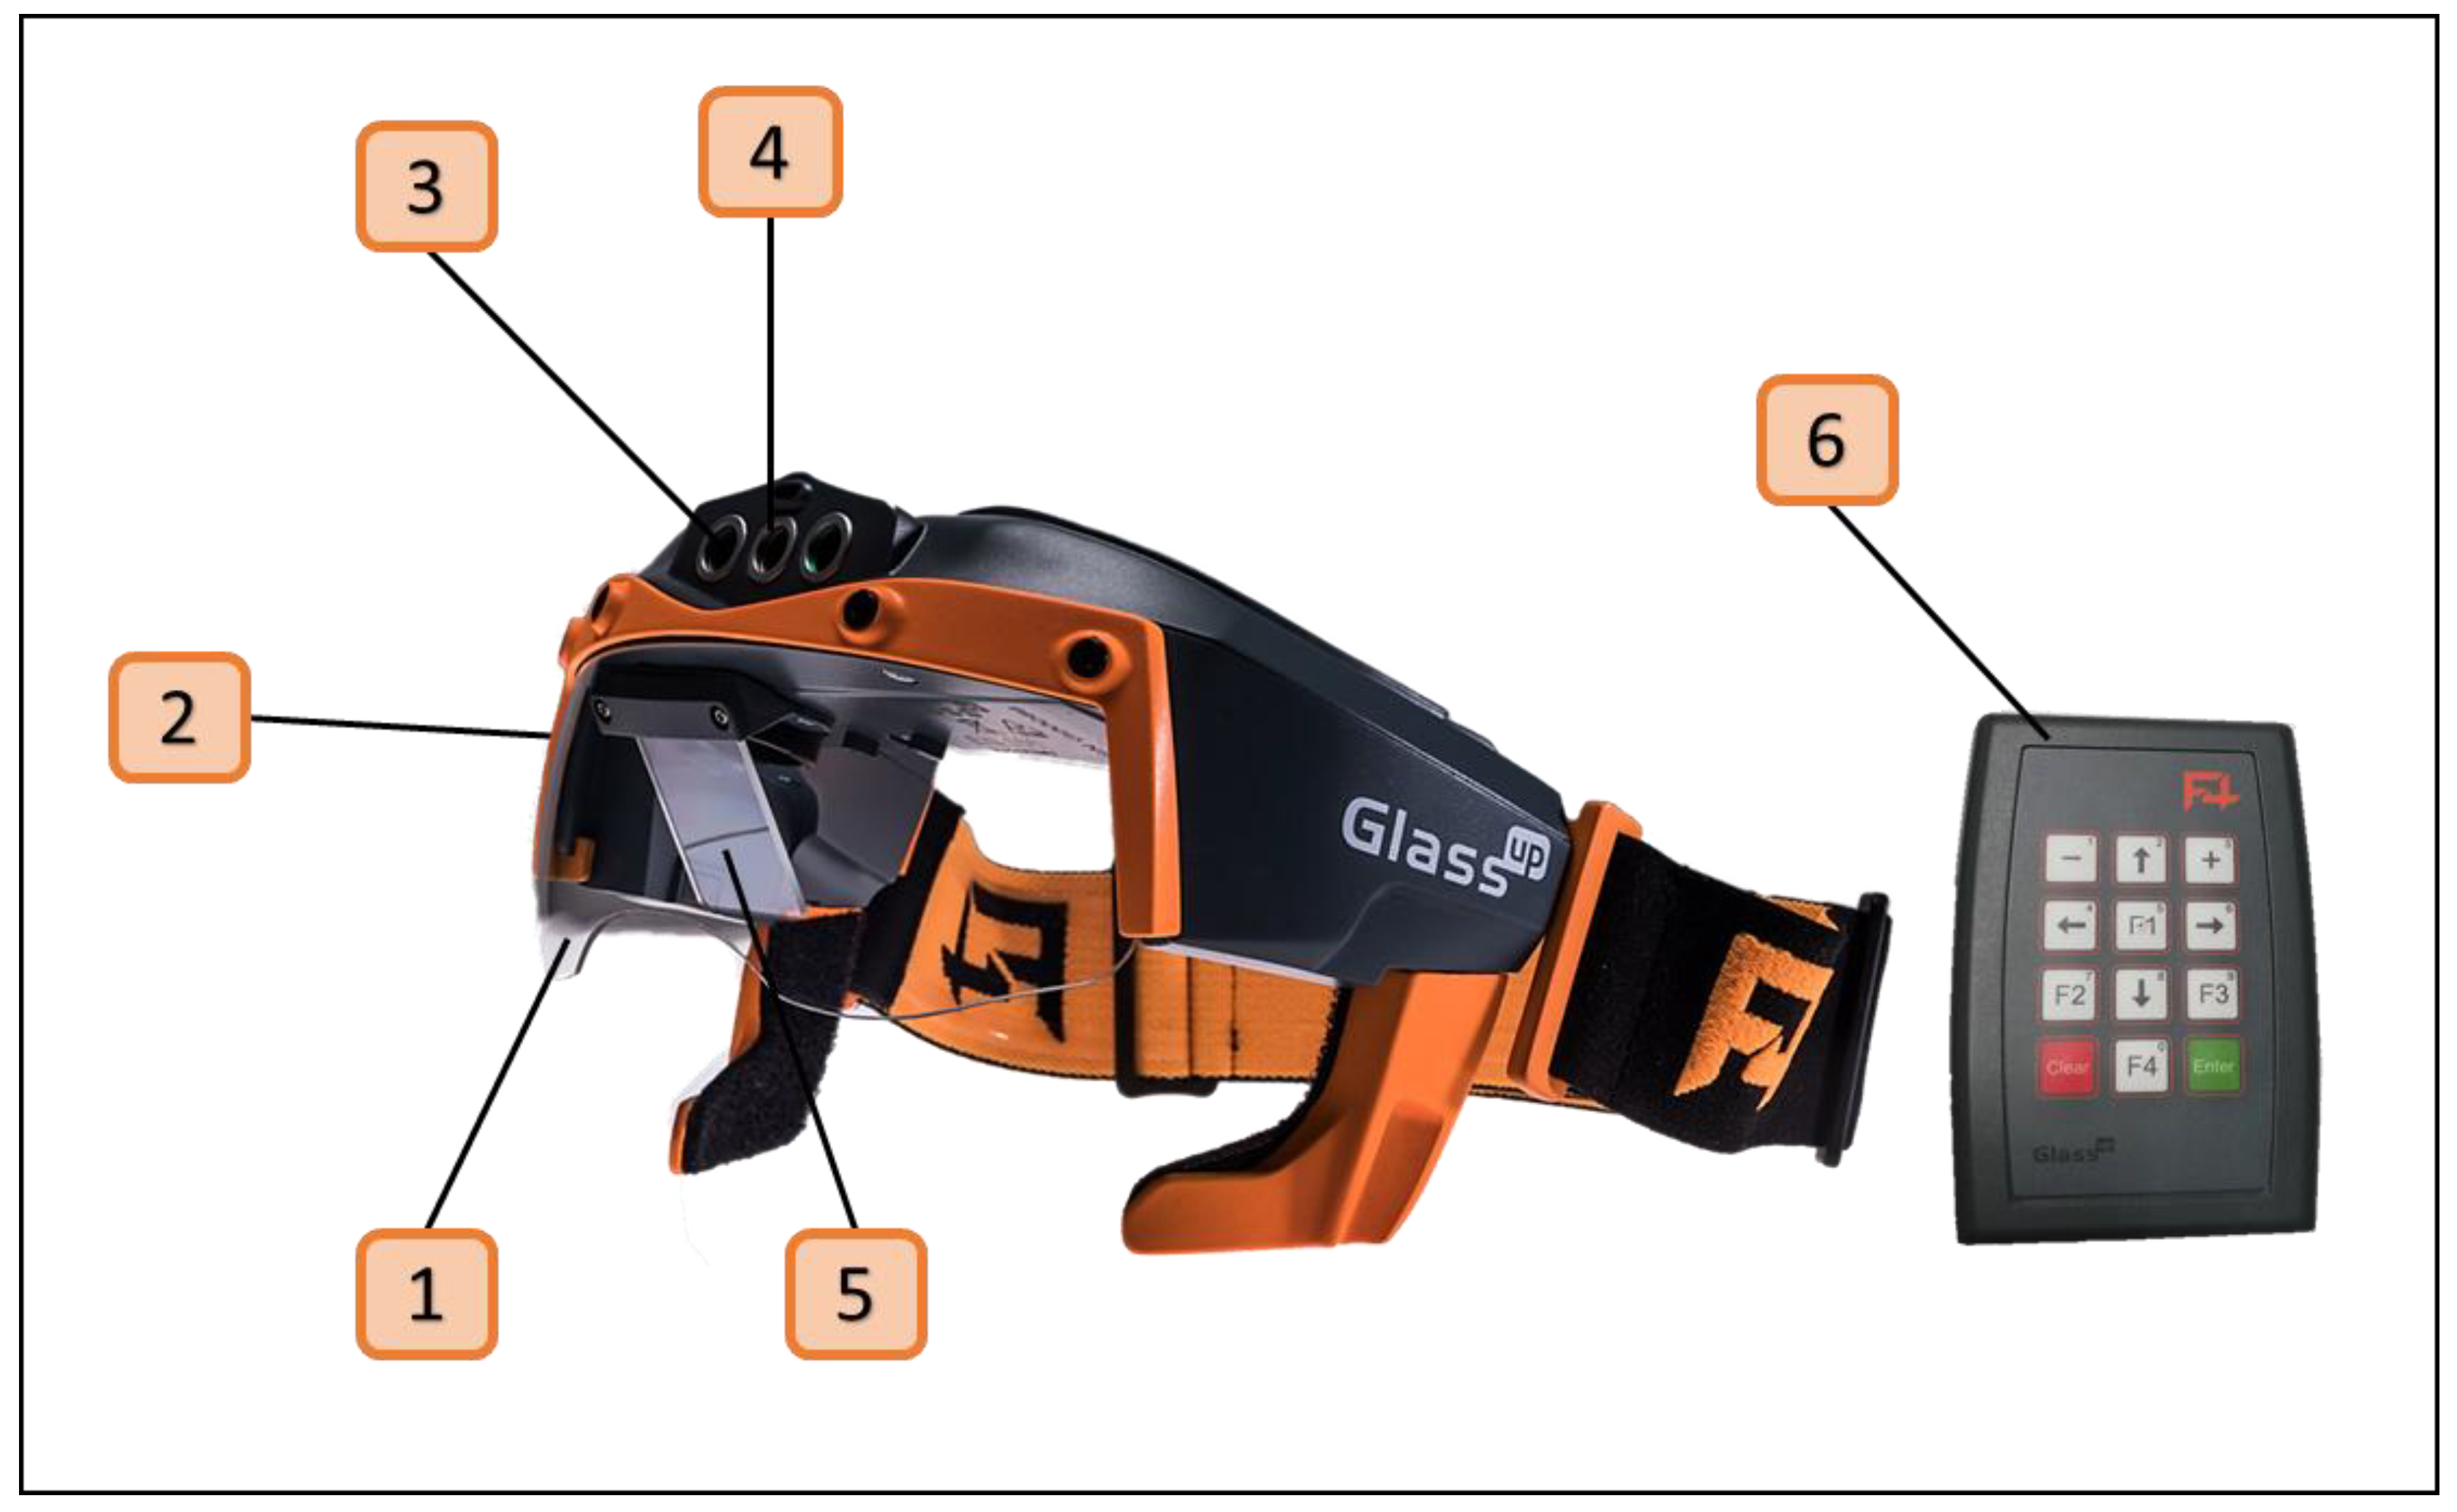
The GlassUp F4 smartglasses (F4SG), produced by an Italian company (GlassUp, Modena, Italy), were used in this study. The F4SG were selected for their features, specifically, since they were certified IP31 (International Protection for solid particles and liquids ingress), they came with protection lens and an elastic band to ensure that the glasses remain in position. Thus, this device was particularly suitable to perform, both indoor and outdoor, agricultural on-farm activities—also demonstrated by the results of a recent study, where the F4SG where tested in laboratory and field environments [40]. The F4SG are combined with an external joypad named “box”. It provides energy and allows control of the glasses via navigation buttons (enter, clear, arrows up, down, etc.) and five function keys that can be set with various tasks, such as front lighting, photo capturing, video recording and scan-code function (Figure 1).
Only the latter function was utilized in this study to scan Quick Response (QR) codes containing information linked to individual sheep. These particular smartglasses allow storing files (image, text, video, audio) on the flash memory. Each file was associated to a unique QR code that once scanned allow to see the augmented file on the SG display. This process could be performed also without internet connection. The scan-code function was coupled to the right-side key button on the F4SG to render task flow more efficient.
The evaluation trials were carried out at the Agricultural Research Agency of Sardinia (Italy) at the Bonassai Animals Research Station (AGRIS). The task consisted of identifying and selecting animals during milking that are well-suited for genetic improvement programs based on the information provided by the QR code of each ewe. The work was realized in the milking parlor with 16 participants, as found in a similar study [35]. The age range, mean and standard deviation (SD) of the participants were 29–62 and 48.4 (8.3) years, respectively. The education level of the participants was: middle school title (31%); high school diploma (31%); bachelor’s degree for (38%). All the participants were expert milkers working with the milking machine. All participants received a training session the day preceding the trials that explained the underlying concept of AR and demonstrated the functions and operation of the F4SG. The trials were conducted in the DeLaval MidiLine milking system composed of 24 groups for 48 stalls with an automatic cluster removal and a pit height of 85 cm.
2.2. Sheep Information Sheet and QR Code
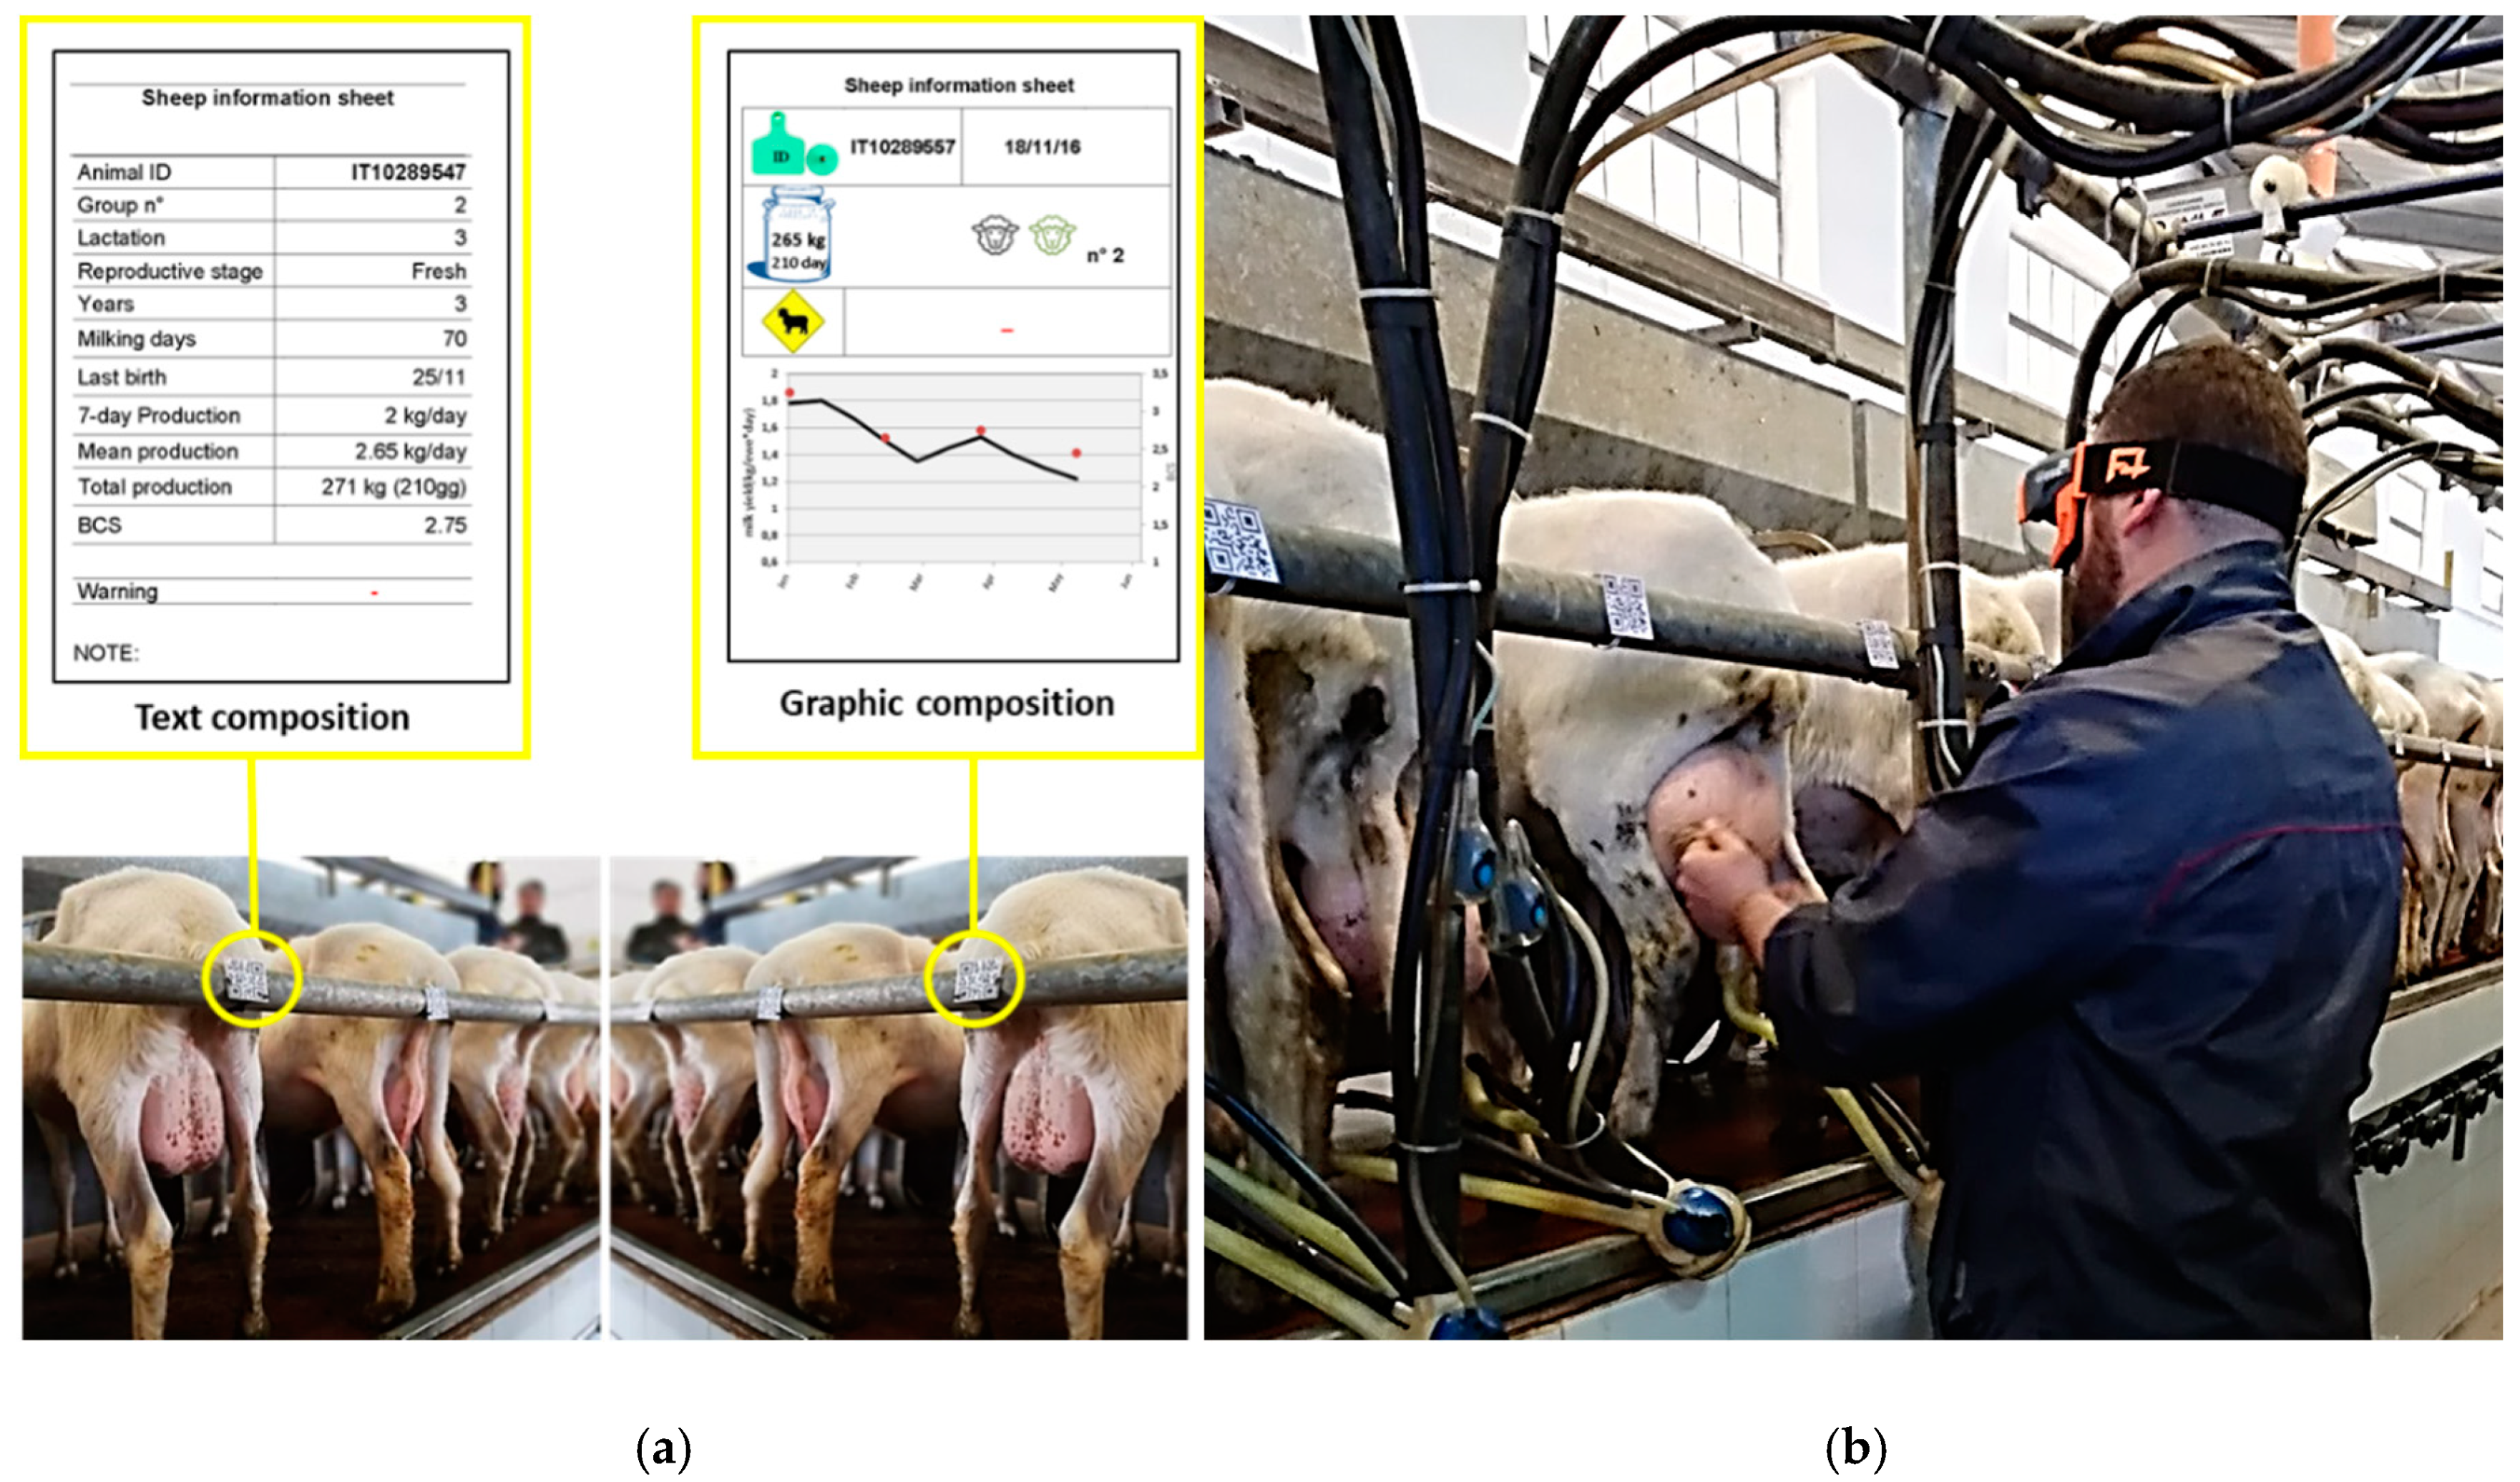
In regard to user interface scheme, two types of documents were created containing information on sheep identification (ID), yearly milk production, health status, body condition score (BCS), warning message and other related data. The first type was text format (TXT) with information summarized in a table. The second type was graphic format (GRH) where the same information was outlined with the aid of illustrations and graphics. Specifically, the augmented visual stimuli presented to the farmers, in the graphic format, consisted in four main representative images adopted to represent the identification number (ear tag), the milk yield (milk churn), the number of birthed lambs (stylized lambs) and the warning message (animal crossing sign). Moreover, a graph representing the evolution of the milk lactation curve along to the body condition score has been included in the GRH format. The QR codes had 21 × 21 modules and they were printed with a size of 4 cm per side. The QR code size was based on the average distance between the QR code and the milker wearing the SG. As suggested by [40], the optimal scanning distance between the QR code and the device corresponded to ten times the QR code size. The QR code was scanned from the F4SG camera and once it has been identified the linked information sheet was opened and showed on the optical see-through display. In order to avoid delays during milking procedures, the individual QR codes were placed on a specific support at the same height as the sheep’s tail corresponding to 150 cm from the ground (Figure 2).
2.3. Experiment and Evaluation Procedure
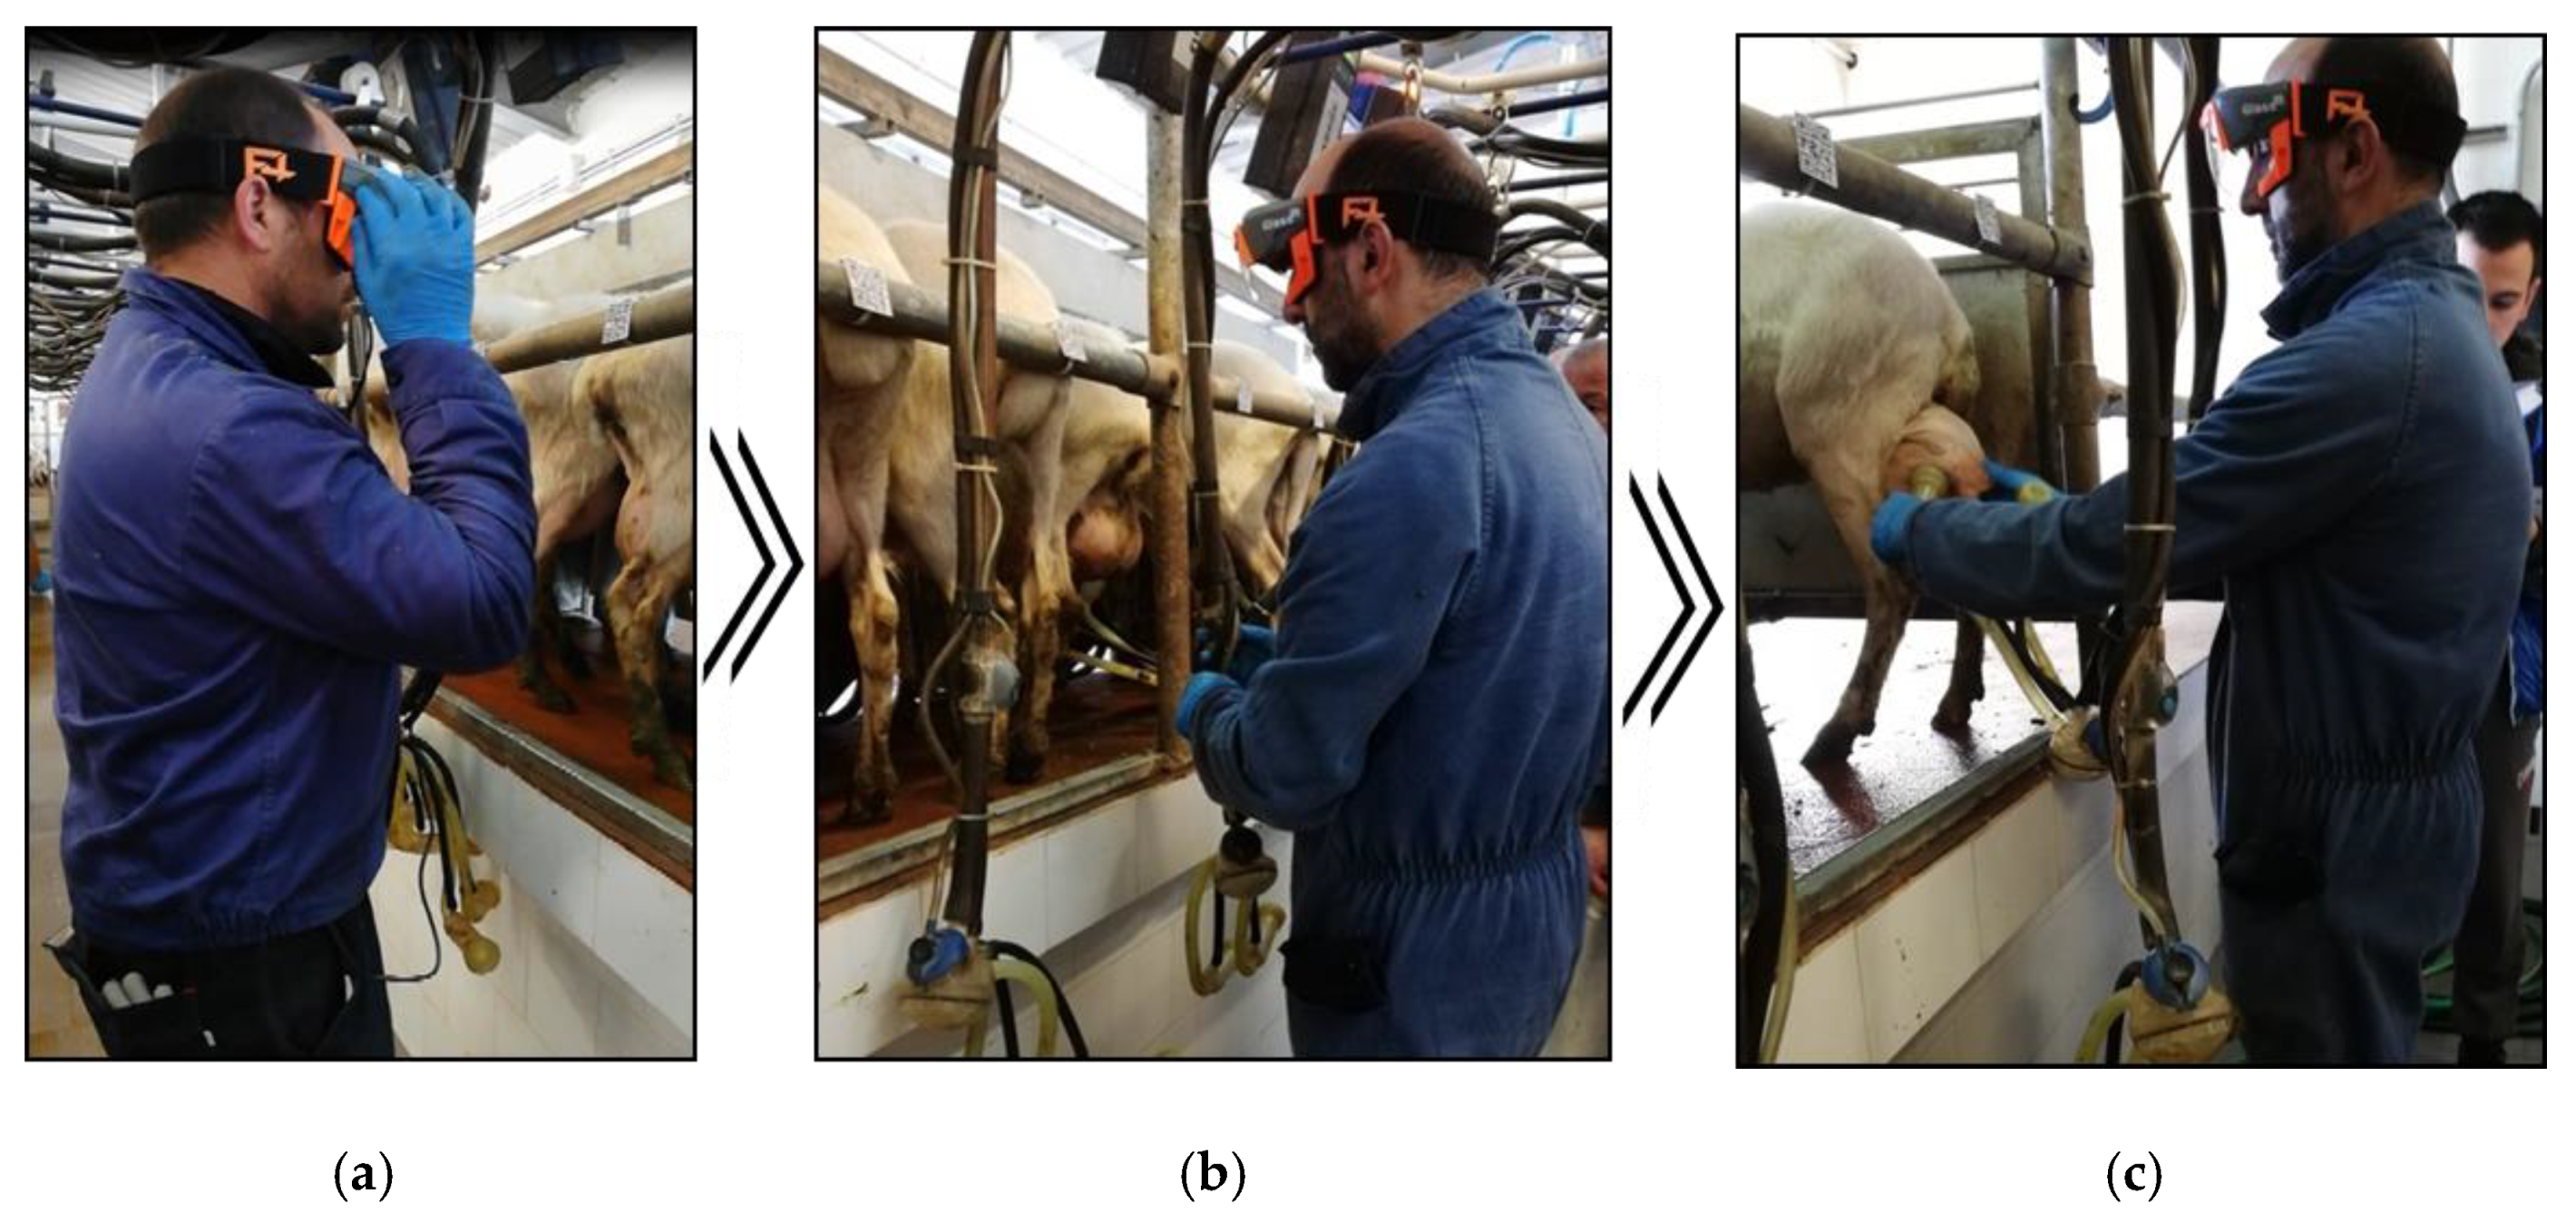
The task was performed in the milking parlor and consisted of the identification and selection of sheep with milk production exceeding 250 kg/year. For the identification and selection, SG was used, and the operator visualized the augmented information of the sheep during milking processes (Figure 3). The operator had to scan the sheep QR code to visualize the individual datasheets and identify the ewes that had high milk yield. The task duration and the error rate in sheep identification were monitored. After having scanned 48 sheep, each milker was asked to complete two questionnaires. The first one was the NASA Task Load Index (NASA-TLX) [41,42] used to evaluate perceived workload among info mode while visualizing TXT information or GRH information on SG optical display, as also observed in other studies [35,43].
The second questionnaire was the IBM Computer System Usability Questionnaire (CSUQ), considered a universal tool that encompasses all the usability criteria that we need for the evaluation of the system (effectiveness, efficiency, satisfaction, discriminability, etc.) [44]. The CSUQ was adopted to evaluate the SG ease-of-use for animal selection and identification [45]. The CSUQ comprised four categories: system usefulness (SYSUSE); information quality (INFOQUAL); interface quality (ITERQUAL); overall satisfaction (OVERALL). We adapted the original statements to our evaluation purpose; we asked how much the participants agree with this statement in a five-point scale: 1 strongly disagree, 2 disagree, 3 neutral, 4 agree and 5 strongly agree [35]. Table 3 reports the CSUQ revised statements used.
2.4. Statistical Analysis
Descriptive statistics (arithmetic average, standard deviation) were calculated for each of the weighted scores of the NASA-TLX based on scale of 0–100, for each statement and categories scores of the CSUQ. Statistical analysis was carried out by comparing the overall scores of the NASA-TLX between info mode, using the Wilcoxon Rank-Sum Test due to non-parametric data trends. To perform the statistical analysis the R Studio software (version: 3.4.4) was used.
3. Results and Discussion
Each milker scanned and read 48 files during milking operations to select animals with high levels of milk yield. Grouping ewes are generally performed several times per year during the milking routine and the time to complete this task depends on the number of operators involved. Conventionally, two operators—as well as the milkers—are needed, one to read the animal ID and another to read the related information. The smartglasses for AR enabled to conduct animal selection and grouping, during milking procedures, involving only one working unit instead of three, obtaining a work completion time per side (24 milking stalls) averaged 11.1 min (Table 1).
When the milking routine is modified by the addition of a new task, such as pressing a button and scanning a code, the milking operating time invariably increases. In fact, the milking sessions with a conventional routine, where only milking procedures are carried out, take about 3 minutes to attach 24 clusters [46]. Anyway, the use of SG to read the information related to each animal is strongly recommended when a specific activity is required for effective management of the flock.
We also measured text comprehension based on the number of reading errors by asking milkers to identify the ewes that had a “yearly milk yield higher than 250 kg”. In every case, the errors during the trials were caused by a failure to recognize the information requested. The frequency of failures per side of milking parlor was approximately 3.3%, which did not seem to affect the quality of work. Specifically, the total number of errors was 16 and 11 for graphic and text composition, respectively, which corresponded to 16.6% and 11.5% of all milk yields signed per each of them. The 43.8% of milkers correctly read all the information reported in the QR codes scanned, allowing the recognition of the animals that need to be separated. This is an encouraging result since the operators performed an agricultural task using for the first time a modern device with which they did not have a high level of confidence. Four workers out of nine made errors reading both graphic and text composition files; furthermore, these were responsible for the highest number of errors.
Table 2 summarizes the results for NASA-TLX scores. The statistical analysis has no underlined significant differences on the overall scores or for each categories of the NASA-TLX but we can observe that the perceived workload for the TXT composition type were basically higher (overall workload 40.21 vs. 34.90), as obtained also by [35] in a study where they compared two different user interface designs in simulated warehouse order picking. In particular, the graphic-based (vs. text-based) information led to decreases of 21.1% for mental demand, 19.7% for temporal demand and 6.4% for physical demand. As a consequence, the graphic-based information type was more usable by the farmers. These results are also in accordance with the visual dominance theory where visual inputs tend to dominate other modalities in perceptual and memorial reports and speeded responses [47]. Nonetheless, these low difference percentages may be explained by the human propensity for memorizing the position of the information in the text-based type requested during the experiment.
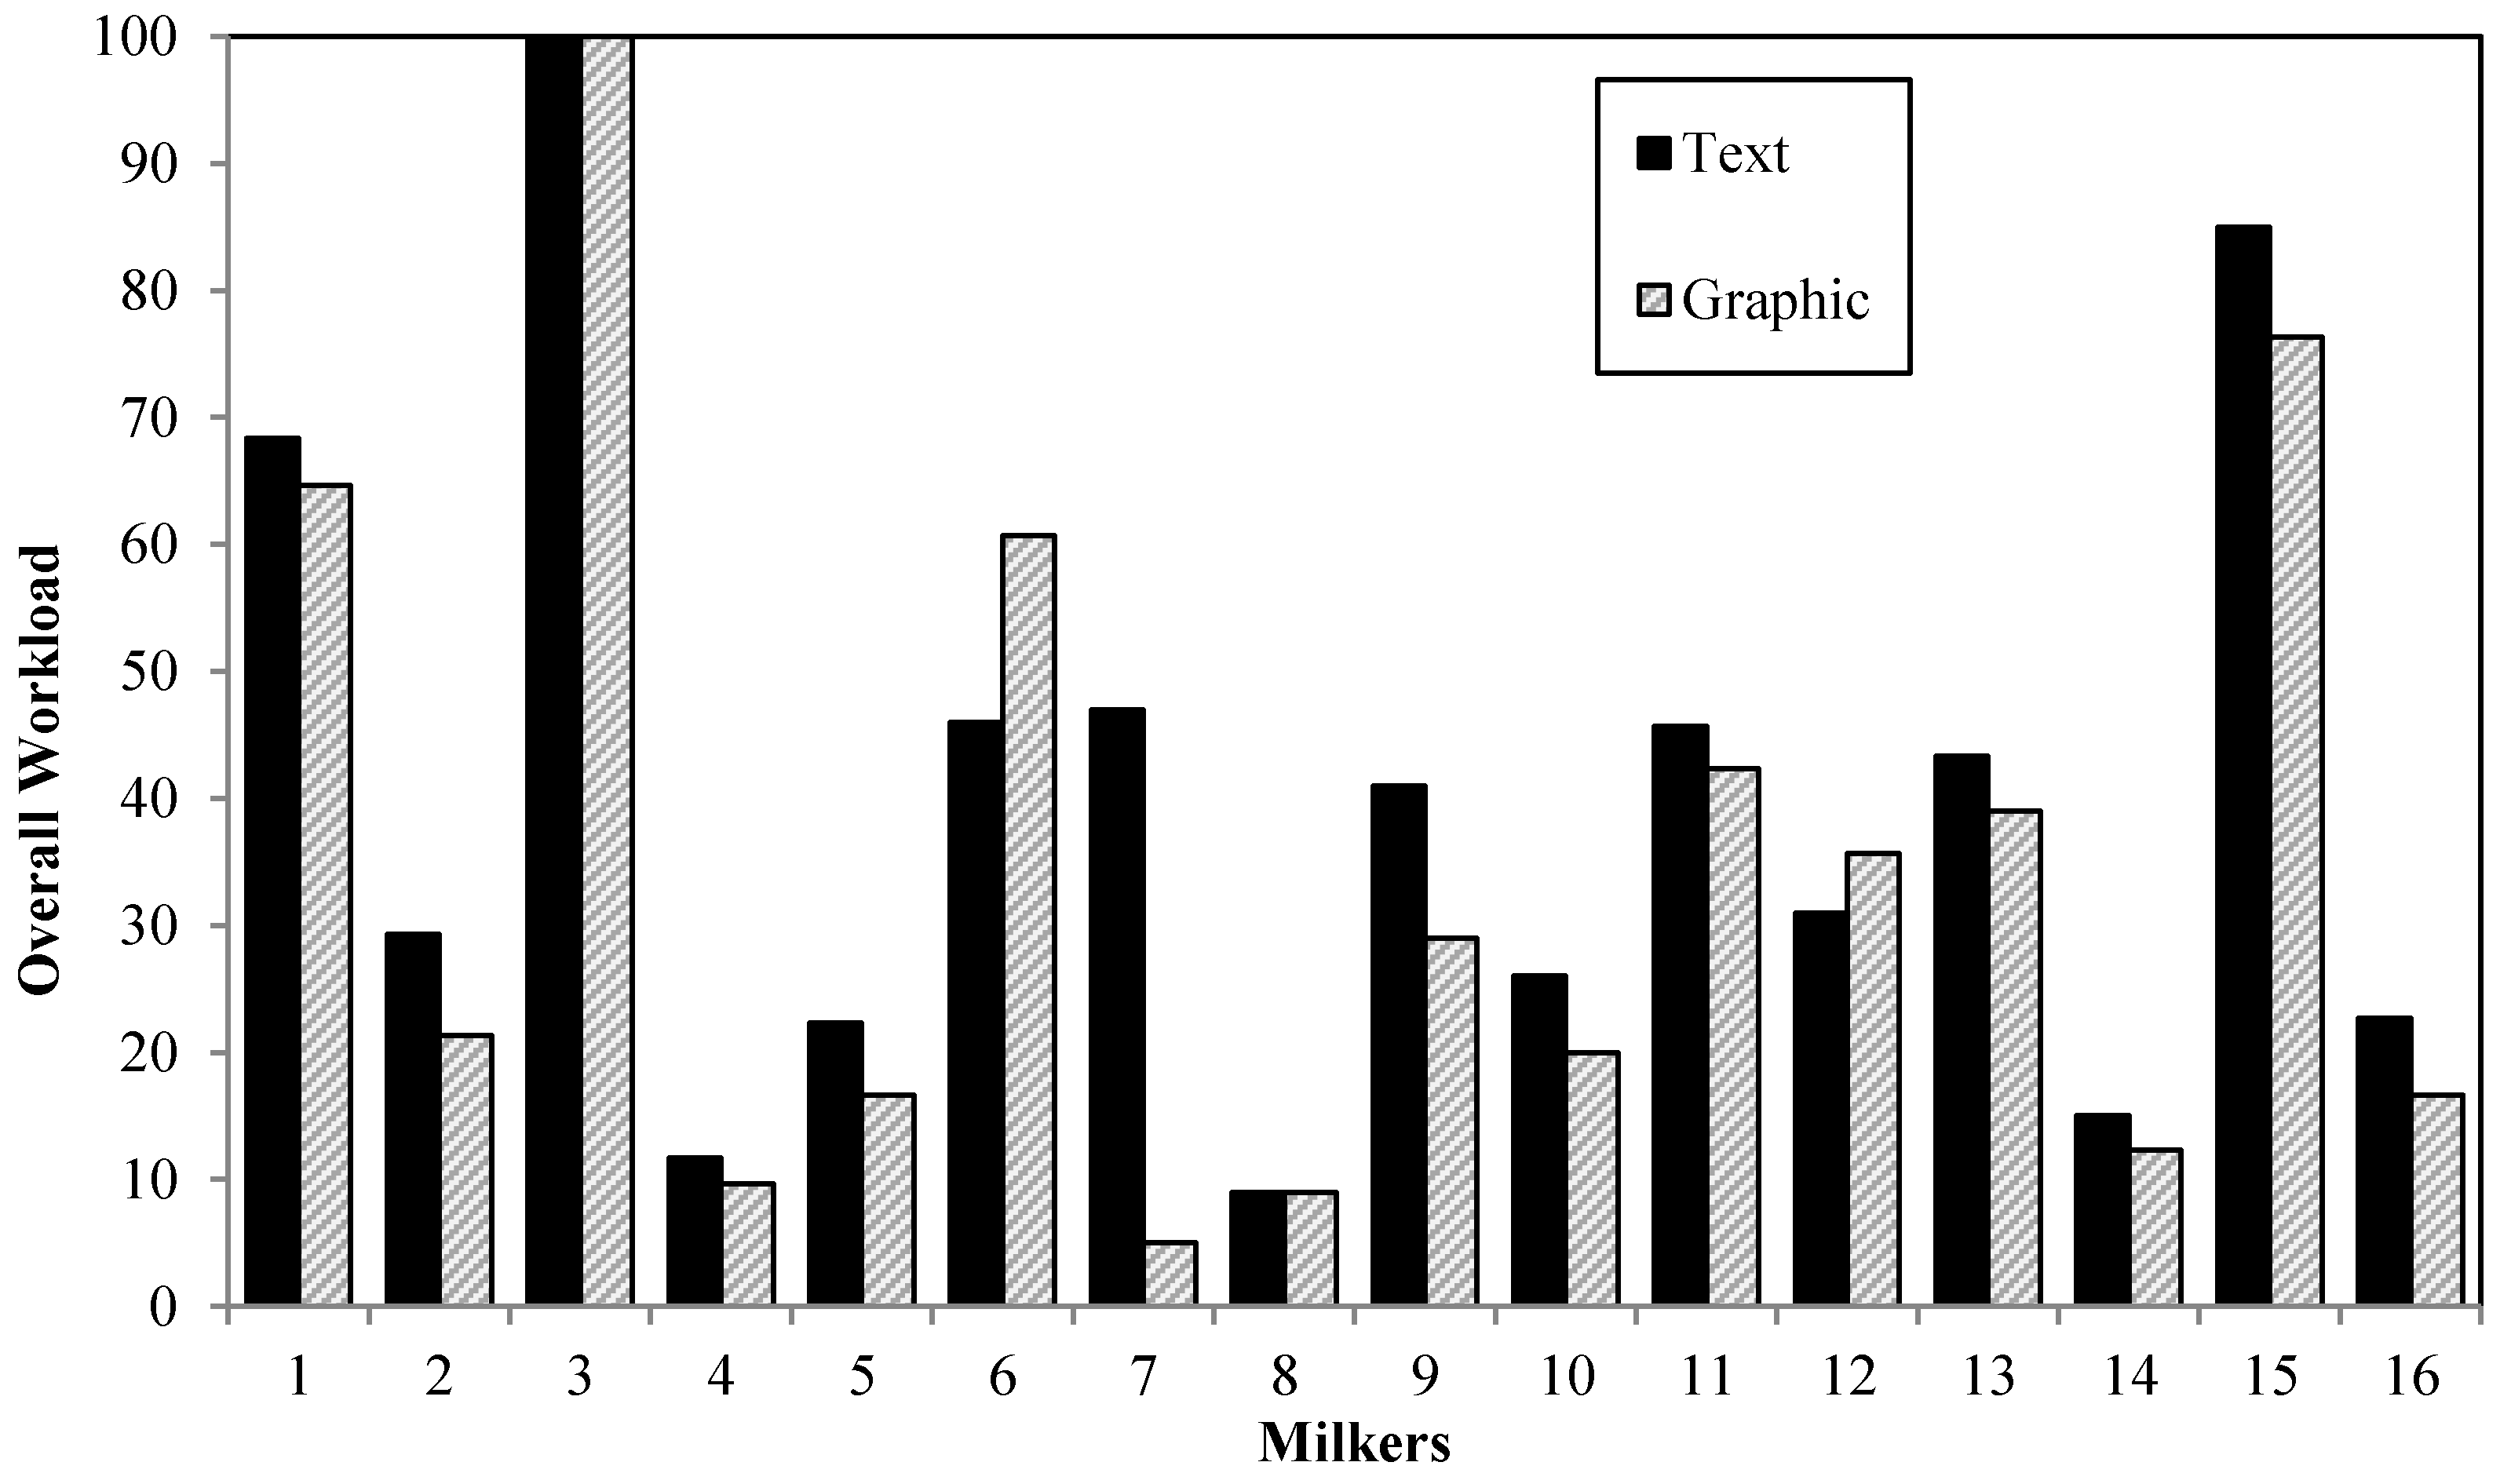
Observing the perceived overall workload for each milker, the text-based information was higher in 75% of milkers than was the graphic-based information (Figure 4). These results confirmed that the arrangement of information influences its receptivity.
Table 3 summarizes the score of the IBM CSUQ. The mean of each statement and category (SYSUSE, INFOQUAL, ITERQUAL, OVERALL) is reported. Considering the device usefulness category (SYSUSE), for statements four, five and eight, concerning efficiency, speed and productivity to complete the task with the SG, respectively, the participants gave a neutral score (i.e., neither agreed nor disagreed).
This score was likely related to SG QR code scanning and file opening time since this aspect slowed down the milking procedures. However, the use of SG enabled the completion of the overall task (identification, selection and milking) employing only one worker (statement 3).
The seventh statement suggested that the SG are relatively easy to learn and use; in fact, participants strongly agreed with this statement, receiving the highest score (4.69 ± 0.48). In the information quality section (INFOQUAL), we observed that participants strongly agreed with statements nine and ten regarding the ease of finding the information in the document. Moreover, the milkers agreed that this information is helpful for task completion. As expected, the information in text-format displayed on the SG is less clear than information in graphic-format (statements 12 and 13), in accordance with the results highlighted in the NASA-TLX. Thus, these results confirmed that the graphic composition was more usable by the workers. Specifically, the farmers usually find the information related to the evolution of milk production and body condition score as a graph representation. The overall satisfaction on the usability of the SG was positive, with a mean score of 4.38 ± 0.81. This suggested that the device is helpful for the identification and selection of the animals during the milking session.
4. Conclusions
This study is the first contribution to improving the knowledge on how AR devices interact with a farm environment, focusing primarily on human perception and usability. We investigated two combinations of content presentation for reading animal information through SG for AR while milking. We examined the overall completion time and failures rate to perform the task, further supporting our survey with subjective data. Results showed that presenting information in text-based format results in a higher workload relative to a graphic-based format. Moreover, the type of augmented visual stimuli presented to the farmers, represents an important aspect that needs to be carefully analyzed in future studies. The overall satisfaction on the usability of the SG has been positive, allowing milkers to properly complete the animal identification and selection process during milking (approximately 3% of failures). The development of SG with specific features for application in the livestock sector may be relevant to improve the performance of farm activities. The possibility to perform hands-free tasks will allow the reduction of the workforce involved.
Author Contributions
M.C., G.S. and G.T. conceived and designed the experiments, wrote the manuscript and analyzed the data. G.S. and M.P. collected the data. M.C., G.T. and A.P. revised the manuscript. All authors have read and agreed to the published version of the manuscript.
Funding
This work was funded by the University of Sassari with the Fund for the Financing of Academic Research Activities, 2019.
Acknowledgments
The authors are grateful to the Agricultural Research Agency of Sardinia (Italy), Animals Research Station (AGRIS) and their technicians for the valuable help during data collection.
Conflicts of Interest
The authors declare no conflict of interest. The funders had no role in the design of the study; in the collection, analyses or interpretation of data; in the writing of the manuscript or in the decision to publish the results.
References
- Caudell, T.P.; Mizell, D.W. Augmented reality: An application of heads-up display technology to manual manufacturing processes. In Proceedings of the IEEE 25th Hawaii International Conference on System Sciences, Kauai, HI, USA, 7–10 January 1992; Volume 2, pp. 659–669. [Google Scholar]
- Milgram, P.; Kishino, F. A Taxonomy of Mixed Reality Visual Displays. IEICE Trans. Inf. Syst. 1994, 77, 1321–1329. [Google Scholar]
- Azuma, R.; Baillot, Y.; Behringer, R.; Feiner, S.; Julier, S.; MacIntyre, B. Recent advances in augmented reality. IEEE Comput. Graph. Appl. 2001, 21, 34–47. [Google Scholar] [CrossRef] [Green Version]
- Azuma, R. A Survey of Augmented Reality. Presence Teleoperators Virtual Environ. 1997, 6, 355–385. [Google Scholar] [CrossRef]
- Chatzopoulos, D.; Bermejo, C.; Huang, Z.; Hui, P. Mobile augmented reality survey: From where we are to where we go. IEEE Access 2017, 5, 6917–6950. [Google Scholar] [CrossRef]
- Höllerer, T.H.; Feiner, S. Mobile augmented reality. In Telegeoinformatics: Location-Based Computing and Services; Taylor & Francis: London, UK, 2004; pp. 221–260. [Google Scholar]
- Tractica. Smart Augmented Reality Glasses. 2019. Available online: https://www.tractica.com/research/smart-augmented-reality-glasses/ (accessed on 14 October 2019).
- Bellini, H.; Chen, W.; Sugiyama, M.; Shin, M.; Alam, S.; Takayama, D. Goldman Sachs Global Investment Research Technical Report: Virtual and Augmented Reality—Understanding the Race for the Next Computing Platform. 2016. Available online: http://www.goldmansachs.com/our-thinking/pages/technology-drivinginnovation-folder/virtual-and-augmented-reality/report.pdf (accessed on 15 October 2019).
- Feiner, S. A Touring Machine: Prototyping 3D Mobile Augmented Reality Systems for Exploring the Urban Environment. In Proceedings of the IEEE First International Symposium on Wearable Computers, Cambridge, MA, USA, 13–14 October 1997; pp. 74–81. [Google Scholar]
- Lee, L.H.; Hui, P. Interaction Methods for Smart Glasses: A Survey. IEEE Access 2018, 6, 28712–28732. [Google Scholar] [CrossRef]
- Syberfeldt, A.; Danielsson, O.; Gustavsson, P. Augmented Reality Smart Glasses in the Smart Factory: Product Evaluation Guidelines and Review of Available Products. IEEE Access 2017, 5, 9118–9130. [Google Scholar] [CrossRef]
- Fraga-Lamas, P.; Fernández-Caramés, T.M.; Blanco-Novoa, Ó.; Vilar-Montesinos, M.A. A review on industrial augmented reality systems for the industry 4.0 shipyard. IEEE Access 2018, 6, 13358–13375. [Google Scholar] [CrossRef]
- De Pace, F.; Manuri, F.; Sanna, A. Augmented Reality in Industry 4.0. Am. J. Compt. Sci. Inform. Technol. 2018, 6, 1–17. [Google Scholar] [CrossRef]
- Eckert, M.; Volmerg, J.S.; Friedrich, C.M. Augmented Reality in Medicine: Systematic and Bibliographic Review. JMIR Mhealth Uhealth 2019, 7. [Google Scholar] [CrossRef]
- Huuskonen, J.; Oksanen, T. Soil sampling with drones and augmented reality in precision agriculture. Comput. Electron. Agric. 2018, 154, 25–35. [Google Scholar] [CrossRef]
- Kumar, N.M.; Singh, N.K.; Peddiny, V.K. Wearable Smart Glass: Features, Applications, Current Progress and Challenges. In Proceedings of the IEEE ICGCIoT, Bangalore, India, 16–18 August 2018; pp. 577–582. [Google Scholar]
- Cupial, M. Augmented reality in agriculture. In Proceedings of the 5th International Scientific Symposium: Farm Machinery and Process Management in Sustainable Agriculture, Lublin, Poland, 23–24 November 2011; pp. 23–24. [Google Scholar]
- Vuzix M400 Smart-Glasses. Available online: https://www.vuzix.eu/Products/M400-Smart-Glasses (accessed on 10 September 2019).
- Epson. Available online: https://www.epson.co.uk/products/see-through-mobile-viewer (accessed on 10 September 2019).
- GlassUp F4 Smart Glasses. Available online: https://www.glassup.com/en/ (accessed on 11 September 2019).
- Shea, R.; Fu, D.; Sun, A.; Cai, C.; Ma, X.; Fam, X.; Gong, W.; Liu, J. Location-based augmented reality with pervasive smartphone sensors: Inside and beyond Pokemon Go! IEEE Access 2017, 5, 9619–9631. [Google Scholar] [CrossRef]
- Kim, M.; Choi, S.H.; Park, K.-B.; Lee, J.Y. User Interactions for Augmented Reality Smart Glasses: A Comparative Evaluation of Visual Contexts and Interaction Gestures. Appl. Sci. 2019, 9, 3171. [Google Scholar] [CrossRef] [Green Version]
- Halachmi, I.; Guarino, M.; Bewley, J.; Pastell, M. Smart Animal Agriculture: Application of Real-Time Sensors to Improve Animal Well-Being and Production. Annu. Rev. Anim. Biosci. 2019, 7, 403–425. [Google Scholar] [CrossRef] [PubMed]
- Todde, G.; Murgia, L.; Caria, M.; Pazzona, A. A multivariate statistical analysis to characterize mechanization, structural and energy profile in Italian dairy farms. Energy Rep. 2016, 2, 129–134. [Google Scholar] [CrossRef] [Green Version]
- Caria, M.; Todde, G.; Pazzona, A. An Evaluation of automated in-line precision dairy farming technology implementation in three dairy farms in Italy. Front. Agric. Sci. Eng. 2019, 6, 181–187. [Google Scholar] [CrossRef]
- Todde, G.; Caria, M.; Gambella, F.; Pazzona, A. Energy and carbon impact of precision livestock farming technologies implementation in the milk chain: From dairy farm to cheese factory. Agriculture 2017, 7, 79. [Google Scholar] [CrossRef] [Green Version]
- Valergakis, G.E.; Arsenos, G.; Basdagianni, Z.; Banos, G. Grouping strategies and lead factors for ration formulation in milking ewes of the Chios breed. Livest. Sci. 2008, 115, 211–218. [Google Scholar] [CrossRef] [Green Version]
- Wu, Y.; Liang, D.; Shaver, R.D.; Cabrera, V.E. An income over feed cost nutritional grouping strategy. J. Dairy Sci. 2019, 102, 4682–4693. [Google Scholar] [CrossRef]
- Lobeck-Luchterhand, K.M.; Silva, P.R.B.; Chebel, R.C.; Endres, M.I. Effect of prepartum grouping strategy on displacements from the feed bunk and feeding behavior of dairy cows. J. Dairy Sci. 2014, 97, 2800–2807. [Google Scholar] [CrossRef] [Green Version]
- Kariuki, C.M.; van Arendonk, J.A.M.; Kahi, A.K.; Komen, H. Multiple criteria decision-making process to derive consensus desired genetic gains for a dairy cattle breeding objective for diverse production systems. J. Dairy Sci. 2017, 100, 4671–4682. [Google Scholar] [CrossRef] [Green Version]
- Leroy, G.; Baumung, R.; Notter, D.; Verrier, E.; Wurzinger, M.; Scherf, B. Stakeholder involvement and the management of animal genetic resources across the world. Livest. Sci. 2017, 198, 120–128. [Google Scholar] [CrossRef]
- Camara, Y.; Sow, F.; Govoeyi, B.; Moula, N.; Sissokho, M.M.; Antoine-Moussiaux, N. Stakeholder involvement in cattle-breeding program in developing countries: A Delphi survey. Livest. Sci. 2019, 228, 127–135. [Google Scholar] [CrossRef]
- Okayama, T.; Miyawaki, K. The “Smart Garden” using Augmented Reality. IFAC Proc. Vol. 2013, 46, 307–310. [Google Scholar] [CrossRef]
- Baumann, H.; Starner, T.; Iben, H.; Lewandowski, A.; Zschaler, P. Evaluation of graphical user-interfaces for order picking using head-mounted displays. In Proceedings of the ICMI’11 13th International Conference on Multimodal Interfaces, ACM Request Permissions, Alicante, Spain, 14–18 November 2011; pp. 377–384. [Google Scholar] [CrossRef]
- Kim, S.; Nussbaum, M.A.; Gabbard, J.L. Influence of augmented reality head-worn display type and user interface design on performance and usability in simulated warehouse order picking. Appl. Ergon. 2019, 74, 186–193. [Google Scholar] [CrossRef] [PubMed]
- Liu, D.; Jenkins, S.A.; Sanderson, P.M.; Watson, M.O.; Leane, T.; Kruys, A.; Russell, W.J. Monitoring with head-mounted displays: Performance and safety in a full-scale simulator and part-task trainer. Anesth. Analg. 2009, 109, 1135–1146. [Google Scholar] [CrossRef] [PubMed] [Green Version]
- Patterson, R.; Winterbottom, M.D.; Pierce, B.J. Perceptual issues in the use of headmounted visual displays. Hum. Factors 2006, 48, 555–573. [Google Scholar] [CrossRef]
- Kim, S.; Nussbaum, M.A.; Ulman, S. Impacts of using a head-worn display on gait performance during level walking and obstacle crossing. J. Electromyogr. Kinesiol. 2018, 39, 142–148. [Google Scholar] [CrossRef]
- Rzayev, R.; Woźniak, P.W.; Dingler, T.; Henze, N. Reading on Smart Glasses: The Effect of Text Position, Presentation Type and Walking. In Proceedings of the CHI Conference on Human Factors in Computing Systems, Montreal, QC, Canada, 21–26 April 2018. [Google Scholar]
- Caria, M.; Sara, G.; Todde, G.; Polese, M.; Pazzona, A. Exploring smart glasses for augmented reality: A valuable and integrative tool in the precision livestock farming. Animals 2019, 9, 903. [Google Scholar] [CrossRef] [Green Version]
- Bracco, F.; Chiorri, C. Italian validation of the NASA-TLX in a sample of bikers. In Proceedings of the National Congress of the Italian Psychological Association, Rovereto, Italy, 13–15 September 2006; Volume 47. [Google Scholar]
- Hart, S.G. NASA-Task Load Index (NASA-TLX); 20 years later. In Proceedings of the Human Factors and Ergonomics Society 50th Annual Meeting, Santa Monica, CA, USA, 16–20 October 2006; pp. 904–908. [Google Scholar]
- Wang, C.-H.; Tsai, N.-H.; Lu, J.-M.; Wang, M.-J. Usability evaluation of an instructional application based on Google Glass for mobile phone disassembly task. Appl. Ergon. 2019, 77, 58–69. [Google Scholar] [CrossRef]
- Assila, A.; de Oliveira, K.M.; Ezzedine, H. Standardized Usability Questionnaires: Features and Quality Focus. Electron. J. Comput. Sci. Inf. Technol. 2016, 6, 15–31. [Google Scholar]
- Lewis, J.R. IBM computer usability satisfaction questionnaires: Psychometric evaluation and instructions for use. Int. J. Hum. Comput. Interact. 1995, 7, 57–78. [Google Scholar] [CrossRef] [Green Version]
- Caria, M.; Boselli, C.; Murgia, L.; Rosati, R.; Pazzona, A. Influence of low vacuum levels on milking characteristics of sheep, goat and buffalo. J. Agric. Eng. 2013, 44, 217–220. [Google Scholar] [CrossRef]
- Posner, M.I.; Nissen, M.J.; Klein, R.M. Visual dominance: An information-processing account of its origins and significance. Psychol. Rev. 1976, 83, 157–171. [Google Scholar] [CrossRef] [PubMed]
Figure 1.
GlassUp F4 smartglasses used in this study: (1) frontal protection lens; (2) right side key button; (3) video/photo camera; (4) front light; (5) optical system/see-through display; (6) joypad “box”.
Figure 1.
GlassUp F4 smartglasses used in this study: (1) frontal protection lens; (2) right side key button; (3) video/photo camera; (4) front light; (5) optical system/see-through display; (6) joypad “box”.

Figure 2.
Sheep information sheet text and graphic format (a) and participant reading an animal’s information on GlassUp F4 smartglasses (F4SG) while milking (b).
Figure 2.
Sheep information sheet text and graphic format (a) and participant reading an animal’s information on GlassUp F4 smartglasses (F4SG) while milking (b).

Figure 3.
Operation flow carried out in the milking parlor: QR code scanning function activation (a); QR code reading (b); information visualization and animal identification/selection while milking cluster attachment (c).
Figure 3.
Operation flow carried out in the milking parlor: QR code scanning function activation (a); QR code reading (b); information visualization and animal identification/selection while milking cluster attachment (c).

Figure 4.
Overall workload by information composition type (text and graphic-based) per milker.


Table 1.
Means and standard deviations of milkers’ operating time and number of errors per side (24 stalls) of the milking parlor for animal selection and grouping.
Table 1.
Means and standard deviations of milkers’ operating time and number of errors per side (24 stalls) of the milking parlor for animal selection and grouping.
| Work Completion Time (min) | Number of Errors | |
|---|---|---|
| Total (N = 32) † | 11.1 ± 3.70 | 0.8 ± 1.44 |
† sixteen milkers per two milking parlor sides.
Table 2.
Summary of NASA Task Load Index (NASA-TLX) subscales scores (mean and standard deviation).
| Information Composition Type | ||
|---|---|---|
| Text | Graphic | |
| Mental Demand | 47.50 ± 28.75 | 37.50 ± 29.21 |
| Physical Demand | 39.06 ± 32.10 | 36.56 ± 29.31 |
| Temporal Demand | 47.50 ± 28.93 | 38.13 ± 28.51 |
| Performance | 35.00 ± 29.94 | 33.13 ± 28.63 |
| Effort | 32.50 ± 30.39 | 30.63 ± 31.30 |
| Frustration | 24.38 ± 28.45 | 22.50 ± 27.99 |
Table 3.
Mean score for each statement of the modified IBM Computer System Usability Questionnaire (CSUQ). The four categories are reported: System usefulness (SYSUSE), Information quality (INFOQUAL), Interface quality (ITERQUAL), Overall satisfaction (OVERALL).
Table 3.
Mean score for each statement of the modified IBM Computer System Usability Questionnaire (CSUQ). The four categories are reported: System usefulness (SYSUSE), Information quality (INFOQUAL), Interface quality (ITERQUAL), Overall satisfaction (OVERALL).
| Category | N † | Statement | Mean | SD | Category Mean |
|---|---|---|---|---|---|
| SYSUSE | 1 | Overall, I am satisfied with how easy it is to use this device | 4.19 | 0.98 | |
| 2 | It was simple to use the device | 4.19 | 1.17 | ||
| 3 | I could effectively complete my work using this device | 4.00 | 1.26 | ||
| 4 | I was able to complete my work quickly using this device | 3.69 | 1.14 | ||
| 5 | I was able to efficiently complete my work using this device | 3.63 | 0.96 | ||
| 6 | I felt comfortable using this device | 4.06 | 1.18 | ||
| 7 | It was easy to learn to use this device | 4.69 | 0.48 | ||
| 8 | I believe I could become productive quickly using this device | 3.44 | 1.26 | 3.98 | |
| INFOQUAL | 9 | It was easy to find the information on mastitis I needed | 4.69 | 0.48 | |
| 10 | It was easy to find the information on milk production I needed | 4.56 | 0.63 | ||
| 11 | The information was effective in helping me complete the task and scenarios | 4.50 | 0.63 | ||
| 12 | The organization of text-format information on the device display was clear | 3.56 | 1.15 | ||
| 13 | The organization of graphic-format information on the device display was clear | 4.06 | 1.00 | 4.28 | |
| INTER QUAL | 14 | This device has all the functions and capabilities I expect it to have | 3.75 | 1.06 | 3.75 |
| OVERALL | 15 | Overall, I am satisfied with this device | 4.38 | 0.81 | 4.38 |
† refers to the question numbers.
© 2020 by the authors. Licensee MDPI, Basel, Switzerland. This article is an open access article distributed under the terms and conditions of the Creative Commons Attribution (CC BY) license (http://creativecommons.org/licenses/by/4.0/).
Share and Cite
MDPI and ACS Style
Caria, M.; Todde, G.; Sara, G.; Piras, M.; Pazzona, A. Performance and Usability of Smartglasses for Augmented Reality in Precision Livestock Farming Operations. Appl. Sci. 2020, 10, 2318. https://doi.org/10.3390/app10072318
AMA Style
Caria M, Todde G, Sara G, Piras M, Pazzona A. Performance and Usability of Smartglasses for Augmented Reality in Precision Livestock Farming Operations. Applied Sciences. 2020; 10(7):2318. https://doi.org/10.3390/app10072318
Chicago/Turabian StyleCaria, Maria, Giuseppe Todde, Gabriele Sara, Marco Piras, and Antonio Pazzona. 2020. "Performance and Usability of Smartglasses for Augmented Reality in Precision Livestock Farming Operations" Applied Sciences 10, no. 7: 2318. https://doi.org/10.3390/app10072318
Note that from the first issue of 2016, this journal uses article numbers instead of page numbers. See further details here.