Article

Towards a Reliable Comparison and Evaluation of Network Intrusion Detection Systems Based on Machine Learning Approaches

by
Roberto Magán-Carrión
1,*,
Daniel Urda
2,
Ignacio Díaz-Cano
3 and
Bernabé Dorronsoro
1
1
Department of Computer Science & Engineering, School of Engineering, University of Cádiz, 11519 Cádiz, Spain
2
Department of Computer Engineering, School of Engineering, University of Burgos, 09006 Burgos, Spain
3
Department of Automatic, Electronic, Computer Architecture & Communication Networks Engineering, School of Engineering, University of Cádiz, 11519 Cádiz, Spain
*
Author to whom correspondence should be addressed.
Appl. Sci. 2020, 10(5), 1775; https://doi.org/10.3390/app10051775
Submission received: 23 January 2020 / Revised: 24 February 2020 / Accepted: 27 February 2020 / Published: 4 March 2020

Abstract

:
Presently, we are living in a hyper-connected world where millions of heterogeneous devices are continuously sharing information in different application contexts for wellness, improving communications, digital businesses, etc. However, the bigger the number of devices and connections are, the higher the risk of security threats in this scenario. To counteract against malicious behaviours and preserve essential security services, Network Intrusion Detection Systems (NIDSs) are the most widely used defence line in communications networks. Nevertheless, there is no standard methodology to evaluate and fairly compare NIDSs. Most of the proposals elude mentioning crucial steps regarding NIDSs validation that make their comparison hard or even impossible. This work firstly includes a comprehensive study of recent NIDSs based on machine learning approaches, concluding that almost all of them do not accomplish with what authors of this paper consider mandatory steps for a reliable comparison and evaluation of NIDSs. Secondly, a structured methodology is proposed and assessed on the UGR’16 dataset to test its suitability for addressing network attack detection problems. The guideline and steps recommended will definitively help the research community to fairly assess NIDSs, although the definitive framework is not a trivial task and, therefore, some extra effort should still be made to improve its understandability and usability further.

Graphical Abstract

1. Introduction

Presently, the implementation of digital technologies in all areas and business processes has involved a continuous positive trend in the global connection growth concerning communications and the number of interconnected devices. In this scenario, systems and communications networks are continually being threatened by attackers, thus monitoring and detecting security events play an essential role in preserving vital security services as confidentiality, integrity, availability (CIA), and privacy. For instance, it is worth mentioning two recent attacks, Dyn (2016) [1,2] and VPNFilter (2018) [3], where thousands of Internet of Things (IoT) devices were compromised causing, on the one hand, a high economic impact and, on the other hand, and even worse, personal costs. In this sense, Intrusion Detection Systems (IDSs) are the most widely used defence line in Information and Communication Technology (ICT) for monitoring and detecting security events, arising as powerful tools to fight against different types of security threats.
IDSs are traditionally classified into Network IDS (NIDS) and Host IDS (HIDS) [4]. The former is focused on analyzing network traffic flows or traces which usually come from firewalls, routers, switches or some other network devices, while the latter takes into account host-based data sources (e.g., Syslog files or CPU load). Depending on the attack detection procedure, IDSs can also be functionally catalogued as Signature-based IDS (SIDS), which typically determine a malicious behaviour by comparison to predefined attack signatures, and Anomaly-based IDS (AIDS), which detect anomalies in the system as those events that are somehow deviated from the normal behaviour [5].
The assessment of this kind of system is traditionally performed by using predefined datasets from simulated or emulated scenarios very similar to the final application network or system [6,7,8,9]. In particular, Machine Learning (ML)-based solutions implementing NIDSs are commonly found [10,11]. Thus, we can also differentiate among supervised, semi-supervised and unsupervised approaches [10]. In supervised models, labelled datasets (i.e., each sample in the dataset has an assigned label) are needed to classify known attacks. However, it is not necessary in unsupervised learning though labelled data is also recommended in order to validate the performance of the methods. Finally, in semi-supervised learning, both previous approaches are found. Thanks to the unsupervised part, an anomalous behaviour can be detected to be afterwards classified in the supervised part [12].
Apart from the nature of the classification method, ML-based algorithms can be grouped into classical ones and deep learning techniques [11]. Some examples of the first ones are Support Vector Machine (SVM), Linear Regression (LR), Decision Trees (DT) or Random Forest (RF), among others. In contrast, Deep Neural Networks (DNNs), Recurrent Neural Networks (RNNs) or Generative Adversarial Networks (GANs) are some examples of deep learning-based solutions. Both approaches have drawbacks and advantages concerning model training time, learning and generalization capabilities, feature representativeness, or model interpretability. Besides, ML models need homogeneous input data for their correct operation, i.e., features considered for the training process must be later available in the scenario where the models will be deployed. Nevertheless, current existing datasets are heterogeneous, each of them comprising specific features which are not measured or may not be possible to collect in other datasets easily. Consequently, this ends up in a situation where not all ML methods, algorithms or techniques can be used to detect security events. Selecting one or another ML technique is not a trivial task, and it strongly depends on the demanded characteristics and the final application.
Additionally, the evaluation of IDS systems usually relies just on performance comparison, where the authors share few or no details regarding the methodology followed [13]. Moreover, there are no standard adopted methodologies for IDS evaluation, with standardized steps, especially the ones related to data preparation and homogenization. In this sense, recent relevant works surveying ML-based NIDS systems [2,11] highlight the importance of Feature Extraction/Engineering and Feature Selection processes for accurate, reliable and enhanced NIDS solutions which are not always found or mentioned in the literature. In the end, fair NIDS evaluation and comparison needs of standard and consolidated ways comprising mandatory steps accepted by all the research community. Otherwise, the goodness of the proposed solutions could be called into question.
Throughout the present work, we firstly introduce a comprehensive study of recent and relevant work in NIDS concluding the absence of common and standardized ways to evaluate IDSs in general, and NDISs in particular, for fair performance comparisons. In this sense, a simple framework comprising all the necessary steps for accurate and reliable NIDSs evaluation is proposed: from the feature engineering process to the performance metrics. All together, not only provides a structured guide to deal with network attack classification problems but also increases the usability of every ML-based NIDS to be deployed in network environments different from the one they were trained. Finally, the proposed framework is tested by comparing classical supervised approaches against semi-supervised and unsupervised techniques by using the recently built dataset UGR’16 [14].
The rest of the paper is organized as follows. Section 2 studies recent works and methods involved in developing ML-based NIDS. Section 3 introduces the recently built UGR’16 dataset as an alternative to the most used and widely accepted datasets. After that, Section 4 describes the proposed methodology and stages for ML-based NIDS evaluation and comparison. The experimentation and results for network attack classification are discussed in Section 5. Finally, remarked conclusions and future work are introduced in Section 6.

2. Related Work

Throughout this section, recent works addressing network attack detection using ML-based NIDS techniques are described in detail, especially the methodology and steps followed to address the problem of network attack classification.
All works studied here are summarized in 
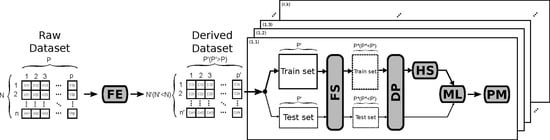
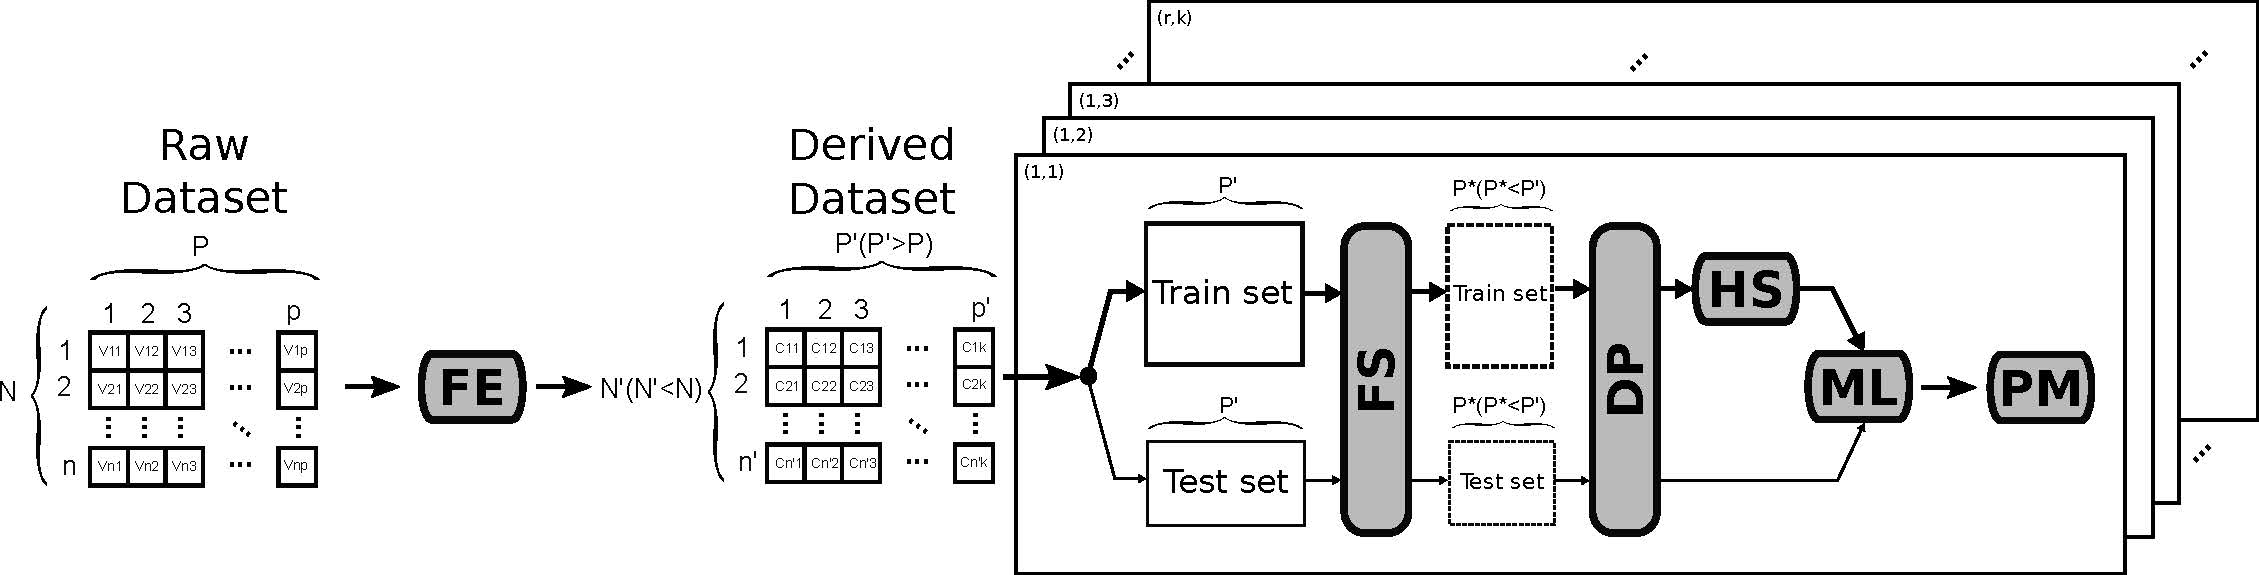
Table 1. It shows the involved dataset and the proposed solution according to what we consider should be the standard steps to be performed in network attack detection using ML-based solutions. This way, the whole detection procedure should comprise, at least, the following steps: Feature Engineering (FE), Data Pre-processing (DP), Feature Selection (FE), Hyper-parameter Selection (HS), Machine Learning method (ML) and Performance Metrics (PM). In the table, symbol ‘–’ denotes the involved step could not be found in the referred work, which does not mean that the authors did not use any technique or procedure to accomplish the related task. Finally, the specific steps used in this work to test the proposed methodology are highlighted in bold in the last row of Table 1.

Recent Works and Methods

The study published in [13] highlighted the deficiencies found in many previous works addressing network attacks classification when they consider an outdated dataset such as KDDCup’99 for performance evaluation. Other works similar to this one usually achieve high classification performance rates, although this is mainly motivated by the flaws found in KDDCup’99 dataset. This assumption is confirmed by comparing accuracy results obtained in [15] through classical ML algorithms against the ones obtained by using the same ML methods but, in this case, considering a recent and realistic dataset: NGIDS-DS [16]. Although the same ML algorithms were used for comparison, no specific details were mentioning the methodology followed by the authors.
The authors in [15] proposed an IDS architecture addressing new challenges on managing vast volumes of network traffic in real time. To evaluate the system, attack classification performance was tested by using very well known ML algorithms on the old-fashion KDDCup’99 dataset. Additionally, an interesting study about the impact of specific feature selection techniques on the classification performance is provided. Finally, a proposed FS method combining manual exploratory feature analysis and two of the considered FS techniques (FSR (Forward Selection Ranking) and BER (Backward Selection Ranking)), got the best results in terms of modelling and detection time. However, the authors did not mention anything about FE, DP and HS, making the reported results hard to reproduce and compare.
A realistic network dataset comprising up-to-date attack and normal traffic patterns from an emulated network environment is introduced by Sharafaldin et al. [17]. They corroborated the feasibility of the dataset in order to detect network-based attack with up to seven classical ML algorithms. To this end, they extracted several network traffic flow-based characteristics employing a specific tool. Then, they performed an FS procedure called Random Forest Regressor for relevance feature weighting depending on the attack. However, neither HS nor DP methods were described.
A deep learning approach for network anomaly detection is introduced by Li et al. [18]. In this work, authors evaluated an LSTM (Long Short-Term Memory) neural network and BLS (Broad Learning Techniques) deep learning-based techniques for anomaly detection. In this sense, two network datasets were used: NSL-KDD and a BGP (Border Gateway Protocol)-based dataset. A manual HS process was carried out to select the optimal neural network architecture. On the other hand, a dataset normalization and a dummy FE approach were done as part of their methodology. Finally, they supported the BLS technique as a feasible alternative to sophisticated deep learning methods since it offered similar performance rates with less training time. Although this solution almost contemplated all the stages according to our recommended procedure, an important step such as FS was not taken into account and should not be eluded.
A novel greedy FS approach was proposed in [19] to improve the attack detection classification performance in communication networks. NSL-KDD and ICSX12 datasets were considered to evaluate their proposal together with several deep learning and ML classical approaches. The authors concluded the feasibility of the approach in terms of classification performance and memory consumption. However, no FE, DP and HS steps were mentioned nor proposed in this work.
A tool to enhance previously generated network datasets was introduced by Cordero et al. [20]: the I2DT tool. I2DT can add a diverse type of attacks to existing datasets, thus providing a useful tool that, as the authors claim, hardly reduces the time spent in building an adequate dataset for NIDSs evaluation. This way, I2DT was used to enhance MAWI dataset and later used in an RNN (Replicator Neural Networks)-based approach for DoS and port scan attack detection [28]. RNN-based solutions provide an anomaly score such that values exceeding a certain threshold are marked as an anomaly. As with other works, there were no mentions to DP and FS techniques.
The authors in [12] improve the MSNM (Multivariate Statistical Network Monitoring) [
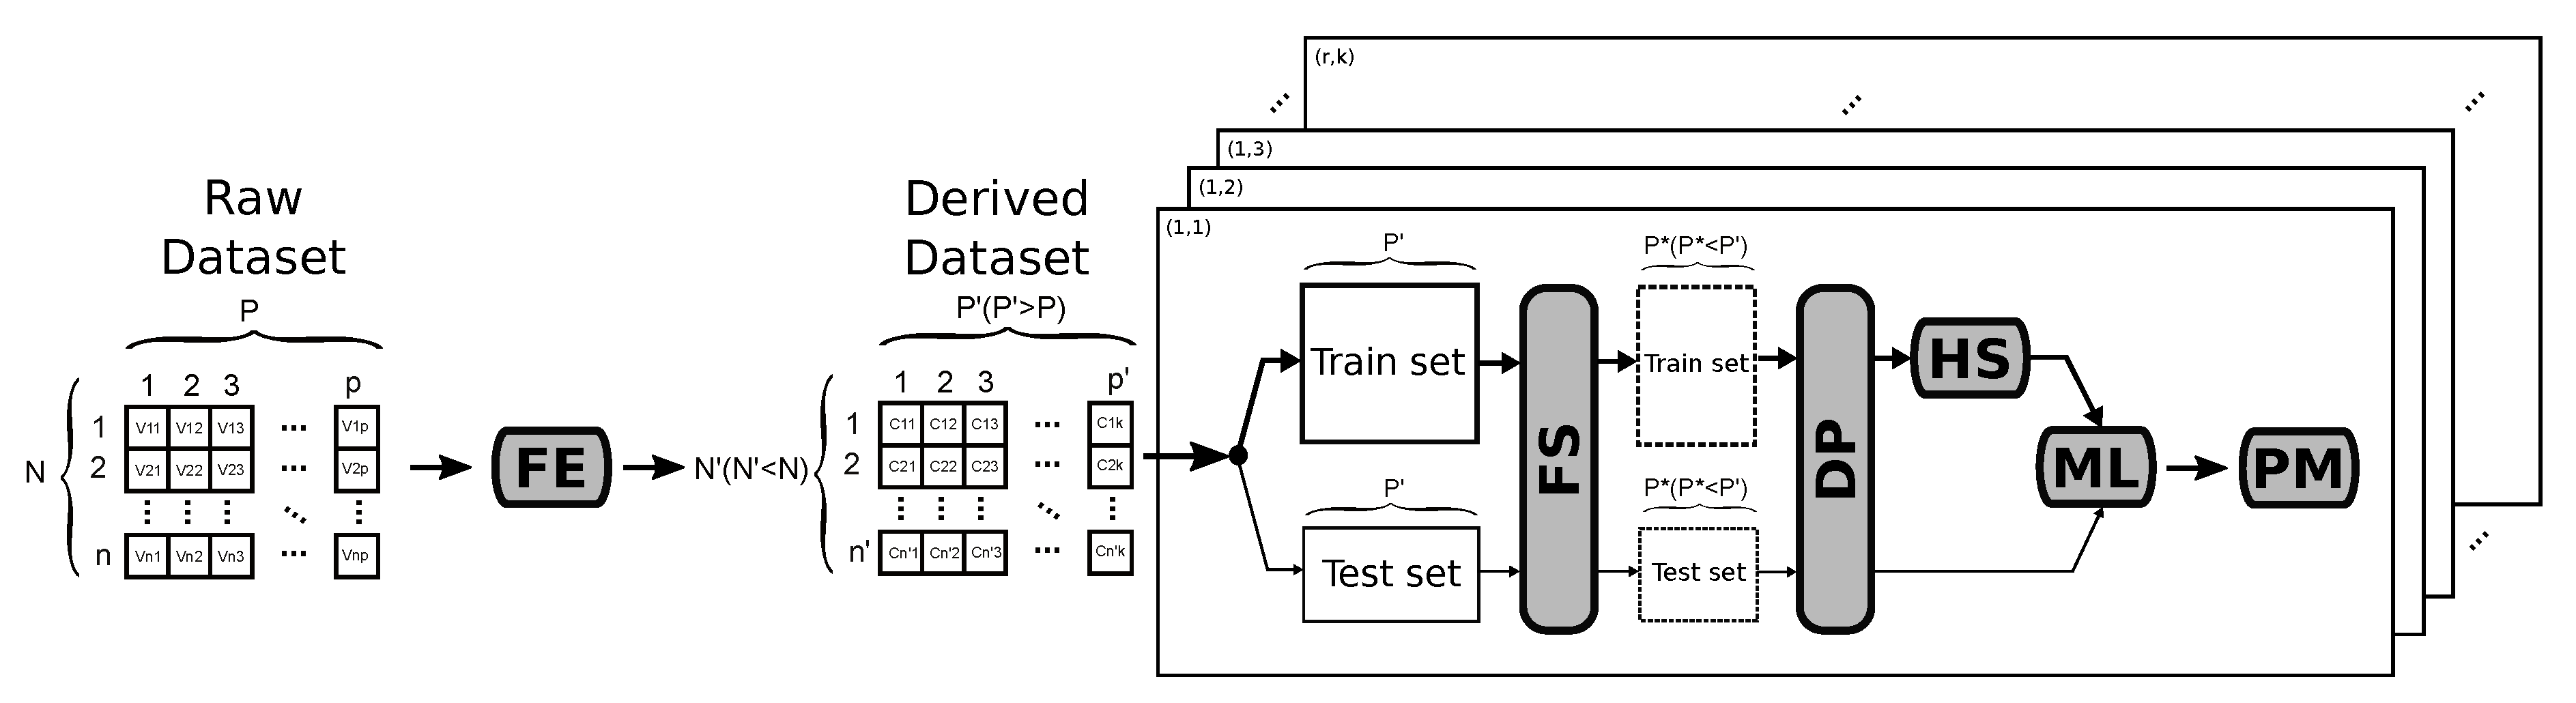
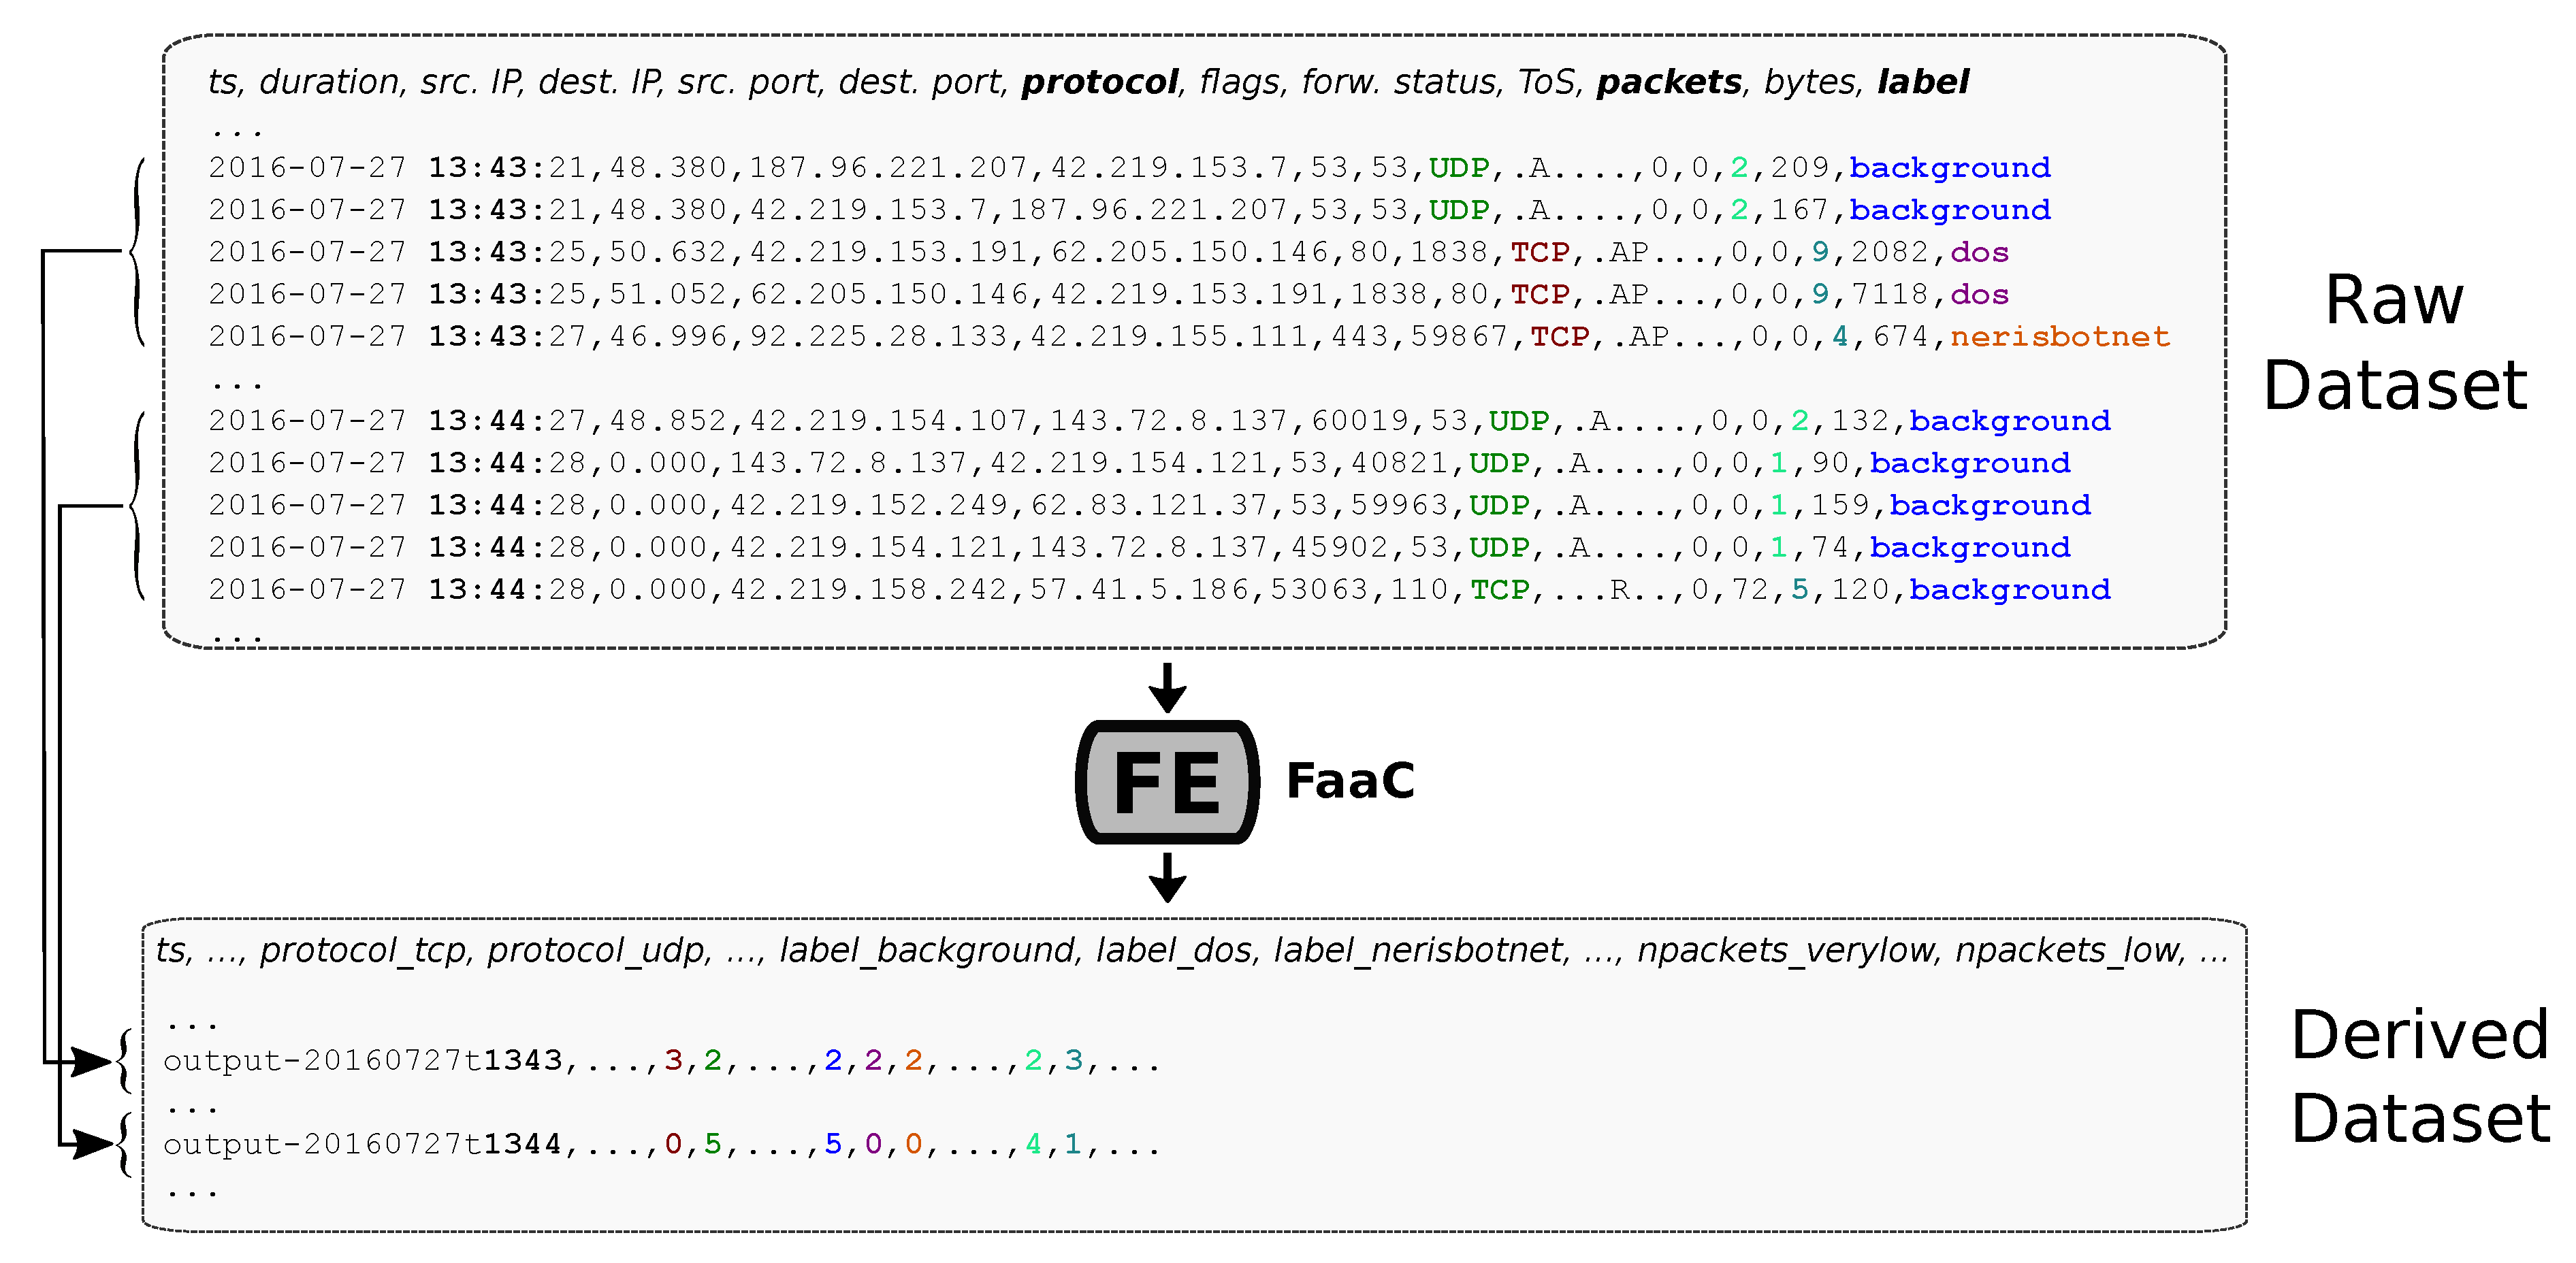
29] for anomaly detection. In this sense, a semi-supervised approach of MSNM that relies on the use of PLS (Partial Least Squares) optimization techniques was proposed to adjust features’ weights according to the targeted attack dynamically. MSNM is based on statistical ML models (namely PCA). The FaaC (Feature as a Counter) that transforms original variables into counters in a specific time interval is validated here as a promising FE method (see Section 4 for a detailed explanation). Altogether, it improves the MSNM detection capabilities on the diversity of attacks provided in the UGR’16 dataset [14].
An Optimal Allocation Least Square SVM (or OA-LS-SVM) method was proposed in [21] for incremental datasets. When working with incremental datasets, the size of the dataset may eventually be too large to train the models in a reasonable time. To handle this problem, the proposed method first used the Optimal Allocation technique to select representative samples from the dataset, and then applied an LS-SVM model to learn the classification problem, just using the selected samples. This technique was tested to detect anomalies in the KDDCup’99 dataset [6]. The authors compared two versions of the method: using all features available in the dataset, or just a subset of them obtained through PCA [30]. Avoiding critical stages, such as FE, DP and HS, is not recommended for fair NIDS comparison.
In [22], the authors proposed a hybrid approach for anomaly-based IDS consisting of two different evolutionary algorithms, namely Artificial Bee Colony (ABC) and Artificial Fish Swarm (AFS). The hybrid algorithm was used to create rules for anomaly detection, based on a reduced subset of features which were generated with a primary correlation method. In this sense, bio-inspired alternatives may overcome classical and deep learning-based techniques for network attack detection, but the lack of details concerning the methodology or steps used makes comparison harder to perform.
Divekar et al. [23] pointed out some flaws in KDDCup’99 [6] for the evaluation of modern NIDS, and proposed a study on the performance of several classical ML models on two alternatives to the mentioned benchmark, as an attempt to analyze its suitability for modern NIDS. Mean Decrease Impurity technique was used to discard irrelevant features (the string values of some features were mapped onto integer numbers). Besides SMOTE was used for oversampling, followed by a random undersampling method in order to generate a dataset of reasonable size with a balanced number of samples of every class. ML models’ hyper-parameters were configured using randomized grid search and 5-fold cross-validation. Once more, no mention of FE methods was provided.
In [24], the authors proposed the application of several classical ML models for NIDS on the UNSW-NB15 dataset, considering all available features. The performance of the considered models was evaluated using Apache Spark. Naïve Bayes was the fastest method to train, while Random Forest provided the most accurate predictions. The authors provided some numbers on the obtained run times, although they did not provide any details about the computation platform used or most of the recommended steps (FE, FS, etc.).
The authors in [25] evaluated an extensive set of classical ML-based algorithms for anomaly detection in networks. To this end, well-known network datasets were used: KDDCup’99 and NSL-KDD. Besides, the influence of adding noise to data in NSL-KDD was also tested. On the one hand, almost all algorithms performed better with more realistic datasets, i.e., with NSL-KDD and its noisy versions. On the other hand, every algorithm had its own relevant set of features leading to better results. For that, a Performance-based Method of Ranking (PMR) FS algorithm was also proposed. As with previous works, FE, DP and FS were not considered nor mentioned.
The CTU-13 dataset for botnet anomaly detection was created and introduced by Garcia et al. [26]. The authors compared three NIDS methods in their work: Cooperative Adaptive Mechanism for Network Protection (CAMNEP), BCplus and BotHunter. Besides, a methodology for comparison of the previous methods and NIDS solutions was proposed, which are, in general, fed with NetFlow-based data sources. Such a methodology just compares predictions obtained by the methods under evaluation for each observation in terms of standard and well-known metrics such as F1, precision, accuracy, etc., and another one proposed by the authors: the error metric. However, a common way to do crucial tasks in network attack detection such as FE, DP, or FS is also not proposed.
Through the work in [27], the authors consider all the steps we claim as mandatory for network attack detection and remark the importance of feature extraction and feature selection steps for DoS, DDoS and network attacks classification in general. Firstly, they chose and extracted a vast number of network traffic features from previous works in the field. Secondly, they proposed a new feature selection method that mixes the Random Forest and Pearson’s correlation coefficient, called Random Forest and Pearson wrap (RFPW) algorithm. Their approach was tested through the MAWI dataset with a Gradient Boosted Decision Tree (GBDT) algorithm and some other classical ML algorithms, showing improvements introduced not only in the performance of the algorithms but also in the time required for the training phases.
In summary, almost all studied proposals avoid, elude or do not mention critical steps to evaluate ML-based algorithms for network attack detection. Therefore, the authors of this paper claim that it is hard and, sometimes, impossible to reproduce the obtained performance. Additionally, carrying out a fair comparison between different NIDS solutions only having information about the performance results is questionable. It is also worth noting that one of the most used datasets is the obsolete KDDCup’99 and its derived and improved version NSL-KDD which could be a handicap when evaluating NIDSs. In conclusion, some standard procedures or methodologies comprising all necessary steps, from the considered raw data to the outcome, should be proposed allowing honest and equitable comparisons.

3. Network Datatasets for NIDSs Evaluation

The network security research community is aware of the lack of existing network datasets for training and evaluating NIDSs. Because of that, some efforts have been made to generate them. Among other characteristics, they differ from the data format (flow- and packet-based mainly), the recording environment (synthetic, emulated or real), the duration and the freshness (up-to-date network traffic) [14,31].
As authors claim in [31], there is no perfect dataset. Two reasons support such an affirmation: a) the ever-increasing number and kind of attacks [1,3], that makes very difficult to have up-to-date datasets; and b) specific applications may probably need specific datasets, thus considering all the previous characteristics unnecessary.
Even in the case that no ideal network dataset exists, authors are confident enough that some of them are more appropriate than others, according to the previous premises. For example, it is expected that the use of the famous and obsolete KDDCup’99 [6] dataset will lead the NIDS system to outcome erroneous results. In this sense, it would be recommended to consider updated and more realistic datasets, such as the recently released UGR’16 [14].
The rest of the section briefly describes the UGR’16 dataset, which will be later evaluated in Section 5 through the proposed methodology for NIDS evaluation and comparison (see Section 4).

3.1. UGR’16 Dataset

The UGR’16 [14] consists of 4 months of anonymized network traffic flows (netflow) gathered from a Spanish Internet Service Provider (ISP) facilities. The authors of UGR’16 split it into two different parts: CAL and TEST. The first one, obtained from March to June of 2016, contains incoming and outgoing ISP network traffic. The second one, obtained from July to August of 2016, contains mostly synthetically generated attacks flows which are added to the normal ISP use network traffic. These attacks were launched in a controlled environment, within the ISP facilities, in order to guarantee the correct ISP operation. Most of them were synthetically generated from up-to-date tools covering harmful and difficult to detect attacks such as low- and high-rate DoS, Port scanning or Botnet. Apart from the previous ones, the authors labelled real attacks after an in-depth inspection of traffic flows where several state-of-the-art anomaly detectors suggested anomalous behaviours. They identify UDP port scanning, SSH scanning and Spam campaigns. Last but not least, some flows were labelled as Blacklist if their IP was found in well-known blacklist open sources.
The dataset is publicly available with a total of 23 files, one per week: 17 for CAL and 6 for TEST. Each file size is 14 GB (compressed) being all of them available in nfcapd and CSV format.
A preliminary descriptive analysis of classes distribution of the dataset in the TEST part is numerically shown in Table 2. As expected, in the context of the problem addressed here, the number of traffic flows corresponding to attack and regular background traffic (Background) substantially differs. The attack with the highest number of flows (Spam) supposes only 1.96 % of total flows in TEST. Besides, the TEST part contains all of the mentioned attacks, i.e., those synthetically generated and the ones discovered from anomalous behaviours. Because of that, the authors decided to use this part of the whole UGR’16 dataset to perform supervised classification through several ML-based techniques in this work.

4. Methodology

Throughout this section, the recommended methodology followed in this work is described in order to evaluate ML-based NIDSs and detect different kinds of network communications attacks, which is sketched in Figure 1. As it can be seen there, the available raw data is first processed with a total of N observations and P features using an FE technique called the Feature as a Counter (FaaC) method, which will be introduced in Section 4.1. FaaC generates a new Derived Dataset (DD) with a reduced number of observations N < N and extends the feature space to P P whose variables are counters of the originals ( C n p ). Afterwards, the dataset is used to train and test the considered ML models. For the training phase, we perform k-fold cross-validation by splitting the data into k disjoint sets of similar size (most of them used in the training phase and some other for testing). It is important to note that each fold should be generated in such a way that the classes distribution observed in the whole dataset is maintained within each fold.
Training ML models is a significant phase, no matter the tackled problem. This way, a reliable methodology that automatizes such a process could reduce the related issues (e.g., underfitting or overfitting) and, consequently, increases the trust of the calibrated system. As observed in Figure 1, the training phase (upper thicker black line in the figure) considers almost all the proposed stages of the methodology.
After splitting the dataset into two main parts, train and test sets, the FS mechanism (see Section 4.2) is carried out in order to select the most meaningful features P * P out of all available ones. Although the FS algorithm only considers the train set, thus not being polluted by the test set, the non-selected features are removed from both train and test sets. Afterwards, data is pre-processed (see Section 4.3) to adequate the feature’s value range. Once these two steps are accomplished, the HS method is executed to find the best configuration for the considered ML method (see Section 4.4). As with the FS stage, the HS does not consider the test set.
Furthermore, the test set is used in order to evaluate the performance of the considered ML-based NIDS model (see Section 4.5). Depending on the involved problem and the underlying dataset, choosing one or another performance metric could lead the system to hide its real behaviour as is explained in Section 4.6. In this section, authors recommend using the ones they consider most appropriate for NIDSs evaluation, especially in scenarios with unbalanced classes, an inherent characteristic of network traffic data for attack classification.
Finally, as is commonly seen in data science problems no matter the field of application, the procedure should be repeated a certain number of times for a well statistical representation and confidence in the obtained results. For this purpose, an iterative process of r repetitions of k-folds each is done, with a total of r × k executions.

4.1. Feature Engineering (FE)

Information from network traffic usually comes in the shape of huge (binary) files containing highly heterogeneous information. This issue makes it impossible to directly apply ML techniques to identify the different kinds of attacks. However, it is possible to overcome this issue by processing the data in order to build a more suitable input for automatic classifiers.
In this sense, the application of some feature engineering technique is proposed to build a well-structured dataset, suitable for ML-based NIDSs. Thus, Feature as a Counter (FaaC) [32] is used as a functional solution to the problem of learning from large heterogeneous datasets. It consists of merging and transforming different data sources (structured or not) of information and their variables into new variables, which are just counters of the original ones, in a given interval of time. For instance, it could be interesting to count the number of accesses to port 22 in a given time lapse, because a high number might mean a brute force SSH attack. The FaaC approach has been successfully tested in unsupervised ML-based NIDS approaches [12,29,33].
In this work, authors make use of FaaC to transform the TEST part of UGR’16 dataset, a structured data source with N 4000 M observations of P = 11 features of Netflow traces, into N 47,000 observations of P = 132 new features that extend the original feature space. Table 3 shows the new variables. According to [29], a time-lapse of 1 min is enough for anomaly detection in network communications. Note that the application of this technique leads to a reduction in the number of observations, as can be seen in Table 4 and Figure 2. In that figure, an example of how the FaaC approach works is shown. For each minute time interval, FaaC transforms raw samples (traffic flows) falling into that corresponding time slot (ts) into new observations which will comprise valuable information from the original variables in the form of counters. For example, the protocol raw variable is transformed in two new ones: protocol_tcp and protocol_udp. These new variables counts how many times UDP and TCP protocol, highlighted in bold green and red in the figure respectively, are seen in a minute. In the case of packets raw variable we binning it into what we consider a low, very low, medium, high or very high value according to its distribution. It allows transforming the original variable in five new ones which are npackets_verylow, npackets_low, npackets_medium, npackets_high and npackets_veryhigh respectively. Figure 2 show an example of this transformation where several packets in the interval [ 0 , 4 ) are considered very low while those in the interval [ 4 , 21 ) are low. Same approach is used for the bytes variable but with different magnitude. Of course, such intervals can be customized on demand.
Regarding the class identifiers, authors will also create new variables containing the number of times every class has happened during the considered time interval. Therefore, it may happen to have situations in which more than one class took place in the same observation, a new issue not present in the original dataset. This fact is illustrated in Figure 2 where observation output-20160727t1343 comprises three different class labels: background, dos and nerisbotnet. In that case, the most frequent one will be chosen as the associated class or label for that specific observation, i.e., background in the illustrated example.
Thanks to the FaaC approach, ML-based NIDSs can be used in network environments different from where they are trained with just a little customization. Moreover, it can also be seen as an interface to translate heterogeneous data sources into the correct format the models need, which is a real handicap limiting the application of most of the studied ML-based NIDSs in real environments. The FaaC tool is an open source project available for downloading from a public Github code repository [34].

4.2. Feature Selection (FS)

As the application of the FaaC method considerably increases the number of variables that compose one sample of the dataset compared to the original one, a feature selection step is required to reduce the number of variables keeping the most meaningful ones and removing irrelevant features. In this work, a Least Absolute Shrinkage and Selection Operator (LASSO) [35] model was used to perform feature selection. LASSO is a simple linear model which is typically used to address problems where the number of input variables P is high. Let us suppose a dataset defined as D = { x i , y i } i = 1 N consisting of N samples, where x i R P is a P-dimensional vector representing the input variables and y i being the response variable for the i-th sample. In a binary classification problem, where the response variable takes two values (e.g., 0/1, or negative/positive, etc.), LASSO includes an l 1 -penalty term to the minimization problem solved in a linear regression to find the optimal β coefficients, as shown in Equation (1):
β ^ λ = arg min β | | y f ( β X T ) | | 2 2 + λ | | β | | 1
where f ( β X T ) is the logistic or sigmoid function and λ is the regularization rate which controls how many input features are selected. In this case, the problem addressed consists of a multi-label classification problem with K = 5 labels, i.e., y i [ 0 , 1 , , K 1 ] . In this sense, K LASSO models are trained in parallel as described before, but with an extra grouped-lasso penalty added on all the K coefficients for a particular input feature, which makes them all be zero or nonzero together, i.e., the retained variables will be those which are significant to predict all K labels. The final response of this multinomial LASSO is obtained through the softmax function depicted in Equation (2):
P r ( y i = k | X ) = P r ( y i = k | X ) z = 0 K 1 P r ( y i = z | X )

4.3. Data Pre-processing (DP)

Machine learning models usually require normalized input features in order to account for differences among variables distribution. In this work, a standard normalization procedure is applied to each numeric input variable, as depicted in Equation (3), in such a way that normalized features have zero mean and unit variance:
z j = x j μ j σ j j [ 1 , P ]
where x j is the raw input variable, μ j and σ u are the mean and standard deviation of the given variable, and z j is the standardized feature.

4.4. Hyper-parameters Selection (HS)

Machine Learning (ML) models need their hyper-parameters to be tuned in order to perform accurately in the addressed problem. Two well-known strategies have been traditionally used for this purpose: Grid Search [23,36] and Random Search [37]. The former explores several combinations of certain values provided for each of the hyper-parameters to be tuned, while the latter simply try a given number of random settings obtained from a specified range of values for each hyper-parameters. On the one hand, a Grid Search has the disadvantage of only exploring a subset of the entire search space limited by the values provided for the hyper-parameters. Additionally, this strategy is very costly, in terms of computational time, for ML models with more than 2-3 hyper-parameters, since the search space increases exponentially. On the other hand, a Random Search strategy may be faster and independently of the number of hyper-parameters to be tuned, but its main drawback is that some irrelevant settings may be tested using this strategy (e.g., two hyper-parameters may be linked in such a way that either both have high or low values, but not high/low or low/high at the same time).
Even though a Grid Search strategy was applied in [38] providing acceptable results, a more recent and powerful hyper-parameters selection strategy, which has provided excellent results overcoming the limitations mentioned above, has been used in this study: Bayesian optimization [39]. In this strategy, hyper-parameters search is modelled by an underlying Gaussian process in such a way that, on each step of the iterative search, the next hyper-parameters setting to be tested is the one with more uncertainty (higher variance) defined by this Gaussian process. Therefore, this strategy ensures that a pseudo-optimal hyper-parameters setting will be achieved in a few number iterations. Bayesian optimization is performed within the train set to obtain the optimal hyper-parameters setting, fit a ML model to the train set using this optimal hyper-parameters setting, and finally evaluate the performance of the fitted ML model on unseen test data (see Figure 1).

4.5. Machine Learning (ML) Models

Several well-known ML models have been used in this work to detect security attacks in network communications. Next, a brief description of each ML model used is provided:
  • Multinomial Logistic Regression (LR). It is the simplest linear model [40] that has been widely applied to several and diverse tasks. For a binary classification problem, LR models the dependent variable y i [ 0 , 1 ] as a linear combination of the independent variables x i as shown in Equation (4),
    y i = f ( β 0 + β 1 x i 1 + β 2 x i 2 + + β p x i p ) ,
    where P is the number of features describing one sample in the dataset, and f ( β X T ) is the logistic or sigmoid function. The parameters vector β is learned by solving the minimization problem depicted in Equation (5):
    β * = arg min β | | y f ( β X T ) | | 2 2
    Since the problem addressed consists of several ( > 2 ) labels or classes, a One-vs-All approach was used in such a way that K logistic regression models are trained (K being the number of labels or classes), each one focusing on solving the corresponding binary classification problem, and the overall prediction of the LR model is computed using the softmax function depicted in Equation (2).
  • Support Vector Machine (SVC). It is a kernel-based method that uses a kernel function (radial basis, linear, polynomial, or any other) to map the original input space into a new space where predictions can be made more accurately. In this sense, the performance of an SVC is determined by the type of kernel function. In this work, the Linear Function (SVC-L) and Radial Basis Function (SVC-RBF) were tested. Linear and Gaussian kernel functions are depicted in Equations (6) and (7), respectively.
    K ( x , z ) = x T z
    K ( x , z ) = e x p | | x z | | 2 2 σ 2
  • Random Forest (RF). It is a tree-based non-linear bagging model for which multiple decision trees are fitted to different views of the observed data [41]. In this sense, each decision tree is fitted to a subset of the N samples (randomly sampled). Moreover, a random subset of the P input features is used within each node of a tree to determine which of them is used to expand it further. Overall RF predictions are computed by calculating the average (or weighted average according to the performance of each single decision tree on the out-of-bag samples) of the individual predictions provided by the multiple decision trees.

4.6. Performance Metrics (PM)

Choosing one or another performance metric to evaluate and compare NIDSs can be erroneously interpreted especially by practitioners. For instance, the accuracy metric is not recommended when considering unbalanced data which is, in fact, a common characteristic of network traffic data for attack classification. Because of that, the authors recommend using R e c a l l ( R ) , P r e c i s i o n ( P ) , F 1 or Area Under the Curve (AUC) to evaluate ML-based NDISs when dealing with this kind of data. Next, a brief description is provided for each of the performance metrics considered.
  • Recall (R). It is also known as sensitivity or TPR (True Positive Rate) and represents the ability of the classifier to detect all the positive cases, as depicted by Equation (8),
    R e c a l l ( R ) = T P T P + F N
    where TP (True Positive) is the number of times a positive sample is correctly classified. Instead, FN (False Negative) counts how many times a negative sample is miss-classified.
  • Precision (P). It evaluates the ability of the classifier to avoid positive samples miss-classification and it is defined in Equation (9),
    P r e c i s i o n ( P ) = T P T P + F P
    where FP (False Positive) counts how many times negative samples are classified as positive.
  • F1 score. It is the harmonic mean of the previous two values, as depicted in Equation (10). A high F1 score value (close to 1) means an excellent performance of the classifier.
    F 1 = 2 × R × P R + P
  • AUC. The AUC is a quantitative measurement of the area under the Receiver Operating Characteristic (ROC) curve which is widely used as a performance metric in NIDSs in particular and IDSs in general [10,42]. The ROC curve compares the evolution of the TP rate versus the FP rate for different values of the classifying threshold. Consequently, the AUC is a performance indicator such that classifiers with AUC = 1 behave perfectly, i.e., it is able to correctly classify all the observations, while a random classifier would get an AUC value around 0.5.
  • Weighted average. For each class i = 1 , , C , the w e i g h t e d _ a v g ( P M i ) computes the weighted average of each metric P M i previously introduced times by the corresponding support q i (the number of true observations of each class), being Q the total number of observations. These weighted metrics are defined as shown in Equation (11).
    w e i g h t e d _ a v g ( P M i ) = i = 1 C P M i × q i Q

5. Experimentation: UGR’16 as a Case Study

Please define it. To validate the suitability of the proposed methodology to evaluate and compare ML-based NIDSs approaches, the experimental environment and the obtained results are described and discussed in the following.

5.1. Experimental Environment

The experimental environment was devised to run the proposed methodology. All the methods and functions have been developed in python language under the well-known python framework scikit-learn for data science. Additionally, a set of tools called scikit-optimize, also developed in python, was used to perform the hyper-parameters selection using Bayesian optimization. In this sense, they are all together included in the project ff4ml (Free Framework for Machine Learning, see Supplementary Materials), which implements the proposed methodology [43].
UGR’16 dataset, previously introduced in Section 3.1, has been selected to test ML algorithms to classify network attacks. Such algorithms must initially learn from a training dataset, and its accuracy is later on tested on unseen data. For this reason, the dataset is transformed in a derived form of the original one (DD) and split into two different parts: 80% of DD used for training, and the rest (20% of DD) used for testing. Different train and test disjoint sets are selected performing a k = 5 -fold cross-validation process which is repeated r = 20 times. As a result, a total of r × k = 100 executions of the methodology steps have been carried out, attempting to look for statistical results significance.
Although the DD includes up to seven different class of malicious traffic, authors decide only to use Botnet, DoS, Scan and Spam. Blacklist was removed due to its appearance in all the observations, showing no differences from regular traffic observations at all. SSH scan and UDP scan were also removed because of the low number of samples available representing these attacks, which will be hard to learn by ML models and may reduce the efficacy of the overall NIDSs. Since the problem addressed is a multi-label classification task, every ML model has been calibrated and tested following a One-Vs-All approach, where a model per class is built in such a way that one specific model will identify its assigned class and will consider the rest of the samples as instances.
All the experiments were executed on the super-computing centre facilities at the University of Cádiz, which is composed of 48 nodes, each one containing two Intel Xeon E5 2670 2.6 GHz octa-core processors, and equipped with 128 GB RAM.

5.2. Results and Discussion

In this subsection, the obtained results are introduced both numerically, in Table 5, and graphically, in Figure 3. To get statistical confidence in our conclusions, tests were performed to assess statistical significance on the results achieved by the ML models tested. After analyzing the recommendations given in [44], the authors decided to apply pairwise Wilcoxon signed-rank test comparisons among all algorithms for all attack classes and accuracy metrics. The obtained p-values were corrected with Holm post-hoc method for multi-comparisons, and a 95% confidence level was considered. The differences in the presented accuracy of the models are statistically significant in all cases, except for:
  • DoS: Precision (SVC-RBF vs SVC-L), Recall (RF vs SVC-L), F1 (LR vs SVC-L, RF vs SVC-L, and LR vs RF), and AUC (LR vs SVC-L;
  • Botnet: Precision (LR vs SVC-L), Recall (LR vs SVC-L and LR vs SVC-RBF), F1 (LR vs SVC-L and LR vs SVC-RBF), AUC (LR vs SVC-L and LR vs SVC-RBF);
  • Scan: Recall (LR vs SVC-L, RF vs SVC-L and LR vs RF), F1 (RF vs SVC-L), AUC (LR vs SVC-L and RF vs SVC-L);
  • Spam: Recall (LR vs SVC-L).
We also applied the Friedman test to corroborate with 95% statistical confidence that there are significant differences in the accuracy of the models for all considered attacks and metrics.
In general terms, all models offer good classification accuracy for those attacks synthetically generated (DoS, Botnet, Scan). However, a lower performance rate is observed when classifying real attacks (Spam) and real network traffic (Background). This behaviour was expected since real-network and real-attack traffic patterns are hard to model. Thus, existing or intentionally developed tools are not able to fully mimic such kind of real behaviours.
Specifically, RF provides the best results for almost all classes, followed by SVC-RBF. Note that RF is also overcoming the rest of the ML models tested when considering the weighted average of each performance metric. In this sense, RF is also a robust model for NIDSs when dealing with unbalanced classification where attack samples are considerably less than those found in the majority class, which might be a consequence of its internal ensemble classification procedure.
The greater performance results achieved for Botnet attacks are also remarkable. Note that this attack is inherently devised to hide its network traffic. Despite its synthetic nature, authors can conclude the suitability of ML-based NIDS supervised approaches to fighting against this kind of attacks.
Regarding the Background class, all algorithms behave similarly: they offer less accurate results than for the other classes. This behaviour is unexpected, and authors envision that it might be due to the reduction of the number of observations concerning the original ones as a consequence of the FaaC approach. Consequently, it is highly likely to find more than one class per observation. Moreover, the higher the number of original class samples is, the higher the probability of finding them in every new observation. Particularly, Table 5 and Figure 3 show how the accuracy of the algorithms degrades for those classes with a high number of samples (e.g., Spam). As a conclusion, our approach can be applied to ML-based NIDSs dealing with unbalanced data which is, on the other hand, a typical problem found in network attack detection.

Proposal Comparison of the Proposed ML-based NIDS with a Previously Published One

The current ML-based NIDS proposed in this paper is compared to one of the state-of-the-art NIDSs proposals previously introduced in Table 1. In particular, authors considered here the approach proposed by Camacho et al. [12] which used the same UGR’16 dataset, as well as the FaaC approach, analyzed in this work. In [12], the anomaly detection problem in network communications is addressed by applying multivariate statistical techniques, called Multivariate Statistical Network Monitoring (MSNM). Their approach considered all the steps suggested in our methodology, but it differs from ours in the methods used for the FS, HS and ML stages.
The comparison results are numerically and graphically shown in Table 6 and Figure 4, respectively. The work published by Camacho et al. introduced unsupervised (MSNM-MC and MSNM-AS) and semi-supervised (MSNM-R2R-PLS) solutions based on the MSNM approach. These approaches were also compared to a supervised ML model such as SVC with RBF (MSNM-SVC-RBF) and linear (MSNM-SVC-L) kernels. Finally, they evaluated and compared all these methods in terms of the AUC metric. According to the results published in [12], only the performance of the ML methods for the DoS, Botnet and Scan attacks can be compared.
Regarding the numerical performance results, authors can conclude that the Botnet attack is hard to detect by unsupervised approaches due to the inherent characteristic of hiding its own traffic. However, they perform well for the DoS and Scan attacks, probably because the behaviour of these attacks highly differs from regular traffic due to their synthetic nature. Semi-supervised approaches outperform the unsupervised ones in all the cases, but they never perform better than supervised ones.
Focusing on the performance of supervised ML-based solutions, and especially for the SVC-[RBF,L] and MSNM-SVC-[RBF,L] models, one can see remarkable differences between them. However, one would expect that SVC models using the same type of kernel should perform similarly, probably with minor differences in their performance due to the random nature of the experimentation followed by the authors. Although the same dataset and FE approach were considered in both studies, it is not clear which were the techniques used in [12] for the rest of the steps proposed in the methodology. This issue demonstrates that the accuracy of the models highly depends on the methodology followed, and all the critical steps must be described in detail to allow reproducibility and fair comparisons of the models.
Therefore, it is hard to compare ML-based NIDSs, even more difficult considering the heterogeneity of all the involved techniques, its dependence on the nature of the classification method (unsupervised, semi-supervised and supervised) and the final objective of the NIDS solution. However, new frameworks or methodologies, such as the one proposed in this paper, may help the research community to provide novel and relevant approaches that can be used to provide a fair comparison and evaluation of ML-based NIDSs among state-of-the-art solutions.

6. Conclusions and Future Work

This work introduced a comprehensive study of the current NIDSs proposals pointing out the lack of standard ways to perform a reliable ML-based NIDS assessment. Most of the state-of-the-art approaches do not appropriately describe or avoid necessary steps followed in the methodology used to evaluate their proposals, making it hard to perform a fair comparison and evaluation of ML-based NIDSs, and to be confident about the results published by different authors addressing similar types of problems. To overcome this issue, a methodology comprising what the authors consider are mandatory steps in NIDSs evaluation has been introduced, covering aspects in a wide range varying from the raw network dataset to the recommended performance metrics. The framework suitability has been tested with classical ML algorithms and a real and updated network dataset. Moreover, a comparison to state-of-the-art ML-based NIDS approaches has also been performed.
The results showed that the methodology proposed can help the research community to build better NIDS solutions to allow honest comparisons. However, defining a definitive evaluation guide or framework is not a trivial task, as there could be more than one valid methodology per application field or objective, e.g., to fight against one kind of attack in specific network environments. Besides, not all the steps proposed in the methodology of this paper could always be necessary, i.e., some of them can be counter-productive depending on the context of the application. Furthermore, it is not clear what the impact is of the network dataset on the NIDS performance, where real and updated ones may improve the performance and feasibility of the solutions so that, later on, they can be deployed in real production environments.
In summary, extra work should be done in order to propose common and standard frameworks to compare and evaluate ML-based NIDS solutions that are entirely accepted by the research community. In this sense, future work will focus on determining the impact of the network dataset and the considered methodology steps on the ML-based or DL-based NIDSs performance, with particular attention on the feature engineering procedures allowing NIDS generalization and, consequently, its real deployment in production environments.

Supplementary Materials

The source code of the proposed framework is available online on https://github.com/ucadatalab/ff4ml. We encourage readers to contribute to the project for adding new functionalities and improvements.

Author Contributions

Conceptualization, R.M.-C.; Methodology, R.M.-C. and D.U.; Software, R.M.-C., I.D.-C. and D.U.; Validation, R.M.-C., I.D.-C. and D.U.; Formal Analysis, R.M.-C., D.U. and B.D.; Investigation, R.M.-C., D.U. and I.D.-C.; Resources, R.M.-C. and I.D.-C.; Data curation, R.M.-C. and I.D.-C.; writing–original draft preparation, R.M.-C.; writing–review and editing, R.M.-C., D.U. and B.D. All authors have read and agreed to the published version of the manuscript.

Funding

The authors would like to acknowledge the Spanish Ministerio de Ciencia, Innovación y Universidades and ERDF for the support provided under contracts RTI2018-100754-B-I00 (iSUN) and RTI2018-098160-B-I00 (DEEPAPFORE).

Acknowledgments

The authors acknowledge support given by the supercomputing center at the University of Cádiz as well as José Camacho (University of Granada) whose support on anomaly detection methods based on the use of multivariate statistical techniques was greatly appreciated.

Conflicts of Interest

The authors declare no conflict of interest.

Abbreviations

The following abbreviations are used in this manuscript:
ABCArtificial Bee Colony
AFSArtificial Fish Swarm
AIDSAnomaly-based IDS
AUCArea Under the Curve
BGPBorder Gateway Protocol
DDDerived Dataset
DDNDeep Neural Network
DoSDenial of Service
DTDecision Tree
FaaCFeatures as a Counter
FNRFalse Negative Rate
FPRFalse Positive Rate
FEFeature Engineering
FSRForward Selection Ranking
GANGenerative Adversarial Networks
GBDTGradient Boosted DT
HSHyper-parameter Selection
HTTPHyper Text Transport Protocol
ICMPInternet Control Messaging Protocol
ICTInformation and Communication Technology
IDSIntrusion Detection System
IGMPInternet Gateway Messaging Protocol
IoTInternet of Things
ISPInternet Service Provider
LASSOLeas Absolute Shrinkage and Selection Operator
LSTMLong Short-Term Memory
LRLinear Regression
MLMachine Learning
MSNMMultivariate Statistical Network Monitoring
NIDSNetwork IDS
PLSPartial Least Squares
PMPerformance Metric
RNNRecurrent Neural Network
RFRandom Forest
ROCReceiving Operating Characteristic
SIDSSignature-based IDS
SMTPSimple Mail Transport Protocol
SNMPSimple Network Management Protocol
SSHSecure SHell
SVMSupport Vector Machine
TCPTransport Control Protocol
ToSType of Service
TPRTrue Positive Rate
UDPUser Datagram Protocol

References

  1. ENISA. ENISA Threat Landscape Report 2017. Available online: https://www.enisa.europa.eu/publications/enisa-threat-landscape-report-2017 (accessed on 22 September 2019).
  2. Chaabouni, N.; Mosbah, M.; Zemmari, A.; Sauvignac, C.; Faruki, P. Network Intrusion Detection for IoT Security Based on Learning Techniques. IEEE Commun. Surv. Tutor. 2019, 21, 2671–2701. [Google Scholar] [CrossRef]
  3. ENISA. ENISA Threat Landscape Report 2018. Available online: https://www.enisa.europa.eu/publications/enisa-threat-landscape-report-2018 (accessed on 22 September 2019).
  4. Di Pietro, R.; Mancini, L.V. Intrusion Detection Systems; Springer: New York, NY, USA, 2008; Volume 38, p. XIV, 250. [Google Scholar]
  5. García-Teodoro, P.; Díaz-Verdejo, J.; Maciá-Fernández, G.; Vázquez, E. Anomaly-based network intrusion detection: Techniques, systems and challenges. Comput. Secur. 2009, 28, 18–28. [Google Scholar] [CrossRef]
  6. University of California. KDD Cup 1999 Dataset. Available online: http://kdd.ics.uci.edu/databases/kddcup99/kddcup99.html (accessed on 20 September 2019).
  7. Tavallaee, M.; Bagheri, E.; Lu, W.; Ghorbani, A.A. A detailed analysis of the KDD CUP 99 data set. In Proceedings of the 2009 IEEE Symposium on Computational Intelligence for Security and Defense Applications, Ottawa, ON, Canada, 8–10 July 2009; pp. 1–6. [Google Scholar]
  8. Moustafa, N.; Slay, J. UNSW-NB15: A comprehensive data set for network intrusion detection systems (UNSW-NB15 network data set). In Proceedings of the 2015 Military Communications and Information Systems Conference (MilCIS), Canberra, Australia, 10–12 November 2015; pp. 1–6. [Google Scholar]
  9. Moustafa, N.; Slay, J. The Evaluation of Network Anomaly Detection Systems: Statistical Analysis of the UNSW-NB15 Data Set and the Comparison with the KDD99 Data Set. Inf. Sec. J. Glob. Perspect. 2016, 25, 18–31. [Google Scholar] [CrossRef]
  10. Bhuyan, M.H.; Bhattacharyya, D.K.; Kalita, J.K. Network Anomaly Detection: Methods, Systems and Tools. IEEE Commun. Surv. Tutor. 2014, 16, 303–336. [Google Scholar] [CrossRef]
  11. Liu, H.; Lang, B. Machine Learning and Deep Learning Methods for Intrusion Detection Systems: A Survey. Appl. Sci. 2019, 9, 4396. [Google Scholar] [CrossRef] [Green Version]
  12. Camacho, J.; Maciá-Fernández, G.; Fuentes-García, N.M.; Saccenti, E. Semi-supervised Multivariate Statistical Network Monitoring for Learning Security Threats. IEEE Trans. Inf. Forensics Secur. 2019, 14, 2179–2189. [Google Scholar] [CrossRef] [Green Version]
  13. Siddique, K.; Akhtar, Z.; Aslam Khan, F.; Kim, Y. KDD Cup 99 Data Sets: A Perspective on the Role of Data Sets in Network Intrusion Detection Research. Computer 2019, 52, 41–51. [Google Scholar] [CrossRef]
  14. Maciá-Fernández, G.; Camacho, J.; Magán-Carrión, R.; García-Teodoro, P.; Therón, R. UGR‘16: A new dataset for the evaluation of cyclostationarity-based network IDSs. Comput. Secur. 2018, 73, 411–424. [Google Scholar] [CrossRef] [Green Version]
  15. Rathore, M.M.; Ahmad, A.; Paul, A. Real time intrusion detection system for ultra-high-speed big data environments. J. Supercomput. 2016, 72, 3489–3510. [Google Scholar] [CrossRef]
  16. Haider, W.; Hu, J.; Slay, J.; Turnbull, B.P.; Xie, Y. Generating realistic intrusion detection system dataset based on fuzzy qualitative modeling. J. Netw. Comput. Appl. 2017, 87, 185–192. [Google Scholar] [CrossRef]
  17. Sharafaldin, I.; Lashkari, A.H.; Ghorbani, A.A. Toward Generating a New Intrusion Detection Dataset and Intrusion Traffic Characterization. In Proceedings of the 4th International Conference on Information Systems Security and Privacy (ICISSP), Funchal, Portugal, 22–24 January 2018; pp. 108–116. [Google Scholar]
  18. Li, Z.; Rios, A.L.G.; Xu, G.; Trajković, L. Machine Learning Techniques for Classifying Network Anomalies and Intrusions. In Proceedings of the 2019 IEEE International Symposium on Circuits and Systems (ISCAS), Sapporo, Japan, 26–29 May 2019; pp. 1–5. [Google Scholar]
  19. Le, T.T.H.; Kim, Y.; Kim, H. Network Intrusion Detection Based on Novel Feature Selection Model and Various Recurrent Neural Networks. Appl. Sci. 2019, 9, 1392. [Google Scholar] [CrossRef] [Green Version]
  20. Cordero, C.G.; Vasilomanolakis, E.; Wainakh, A.; Mühlhäuser, M.; Nadjm-Tehrani, S. On generating network traffic datasets with synthetic attacks for intrusion detection. arXiv 2019, arXiv:1905.00304. [Google Scholar]
  21. Kabir, E.; Hu, J.; Wang, H.; Zhuo, G. A novel statistical technique for intrusion detection systems. Future Gener. Comput. Syst. 2018, 79, 303–318. [Google Scholar] [CrossRef] [Green Version]
  22. Hajisalem, V.; Babaie, S. A hybrid intrusion detection system based on ABC-AFS algorithm for misuse and anomaly detection. Comput. Netw. 2018, 136, 37–50. [Google Scholar] [CrossRef]
  23. Divekar, A.; Parekh, M.; Savla, V.; Mishra, R.; Shirole, M. Benchmarking datasets for Anomaly-based Network Intrusion Detection: KDD CUP 99 alternatives. In Proceedings of the 2018 IEEE 3rd International Conference on Computing, Communication and Security (ICCCS), Kathmandu, Nepal, 25–27 October 2018; pp. 1–8. [Google Scholar]
  24. Belouch, M.; El Hadaj, S.; Idhammad, M. Performance evaluation of intrusion detection based on machine learning using Apache Spark. Procedia Comput. Sci. 2018, 127, 1–6. [Google Scholar] [CrossRef]
  25. Hussain, J.; Lalmuanawma, S. Feature Analysis, Evaluation and Comparisons of Classification Algorithms Based on Noisy Intrusion Dataset. Procedia Comput. Sci. 2016, 92, 188–198. [Google Scholar] [CrossRef] [Green Version]
  26. García, S.; Grill, M.; Stiborek, J.; Zunino, A. An empirical comparison of botnet detection methods. Comput. Secur. 2014, 45, 100–123. [Google Scholar] [CrossRef]
  27. Zhang, J.; Liang, Q.; Jiang, R.; Li, X. A Feature Analysis Based Identifying Scheme Using GBDT for DDoS with Multiple Attack Vectors. Appl. Sci. 2019, 9, 4633. [Google Scholar] [CrossRef] [Green Version]
  28. García Cordero, C.; Hauke, S.; Mühlhäuser, M.; Fischer, M. Analyzing flow-based anomaly intrusion detection using Replicator Neural Networks. In Proceedings of the 2016 14th Annual Conference on Privacy, Security and Trust (PST), Auckland, New Zealand, 12–14 December 2016; pp. 317–324. [Google Scholar]
  29. Camacho, J.; Pérez-Villegas, A.; García-Teodoro, P.; Maciá-Fernández, G. PCA-based multivariate statistical network monitoring for anomaly detection. Comput. Secur. 2016, 59, 118–137. [Google Scholar] [CrossRef] [Green Version]
  30. Gupta, K.K.; Nath, B.; Kotagiri, R. Layered Approach Using Conditional Random Fields for Intrusion Detection. IEEE Trans. Dependable Secur. Comput. 2010, 7, 35–49. [Google Scholar] [CrossRef]
  31. Ring, M.; Wunderlich, S.; Scheuring, D.; Landes, D.; Hotho, A. A survey of network-based intrusion detection data sets. Comput. Secur. 2019, 86, 147–167. [Google Scholar] [CrossRef] [Green Version]
  32. Camacho, J.; Maciá-Fernández, G.; Díaz-Verdejo, J.; García-Teodoro, P. Tackling the Big Data 4 vs for anomaly detection. In Proceedings of the 2014 IEEE Conference on Computer Communications Workshops (INFOCOM WKSHPS), Toronto, ON, Canada, 27 April–2 May 2014; pp. 500–505. [Google Scholar]
  33. Camacho, J.; García-Giménez, J.M.; Fuentes-García, N.M.; Maciá-Fernández, G. Multivariate Big Data Analysis for intrusion detection: 5 steps from the haystack to the needle. Comput. Secur. 2019, 87, 101603. [Google Scholar] [CrossRef] [Green Version]
  34. Pérez-Villegas, A.; García-Jiménez, J.; Camacho, J. FaaC (Feature-as-a-Counter) Parser—Github. Available online: https://github.com/josecamachop/FCParser (accessed on 20 December 2019).
  35. Friedman, J.; Hastie, T.; Tibshirani, R. Regularization Paths for Generalized Linear Models via Coordinate Descent. J. Stat. Softw. 2010, 33, 1–22. [Google Scholar] [CrossRef] [PubMed] [Green Version]
  36. Freeman, D.; Chio, C. Machine Learning and Security; O’Reilly Media: Newton, MA, USA, 2018. [Google Scholar]
  37. Bergstra, J.; Bengio, Y. Random Search for Hyper-Parameter Optimization. J. Mach. Learn. Res. 2012, 13, 281–305. [Google Scholar]
  38. Magán Carrión, R.; Diaz-Cano, I. Evaluación de Algoritmos de Clasificación para la Detección de Ataques en Red Sobre Conjuntos de Datos Reales: UGR’16 Dataset como caso de Estudio. In Proceedings of the V Jornadas Nacionales de Investigación en Ciberseguridad, Cáceres, Spain, 5–7 June 2019; Universidad de Extremadura, Servicio de Publicaciones: Badajoz, Spain, 2019; pp. 46–52. [Google Scholar]
  39. Snoek, J.; Larochelle, H.; Adams, R.P. Practical Bayesian Optimization of Machine Learning Algorithms. In Advances in Neural Information Processing Systems 25; Curran Associates, Inc.: New York, NY, USA, 2012; pp. 2951–2959. [Google Scholar]
  40. Bishop, C. Pattern Recognition and Machine Learning; Information Science and Statistics; Springer Inc.: New York, NY, USA; Berlin, Germany, 2006. [Google Scholar]
  41. Breiman, L. Random Forests. Mach. Learn. 2001, 45, 5–32. [Google Scholar] [CrossRef] [Green Version]
  42. Salo, F.; Injadat, M.; Nassif, A.B.; Shami, A.; Essex, A. Data Mining Techniques in Intrusion Detection Systems: A Systematic Literature Review. IEEE Access 2018, 6, 56046–56058. [Google Scholar] [CrossRef]
  43. Free Framework for Machine Learning. Cámara UI-3250CP-C-HQ. Available online: https://github.com/ucadatalab/ff4ml (accessed on 26 December 2019).
  44. García, S.; Molina, D.; Lozano, M.; Herrera, F. A Study on the use of Non-parametric Tests for Analyzing the Evolutionary Algorithms’ Behaviour: A Case Study on the CEC’05 Special Session on Real Parameter Optimization. J. Heuristics 2009, 15, 617–644. [Google Scholar] [CrossRef]
Figure 1. Diagram of the methodology followed in this work.
Applsci 10 01775 g001
Figure 2. Example illustration on how the FaaC approach works as a feature engineering process.
Applsci 10 01775 g002
Figure 3. Performance results of each ML model tested, for each class in the dataset and including a weighted average of the corresponding performance metric.
Applsci 10 01775 g003
Figure 4. Comparison of the AUC performance result among the ML-based solutions proposed in this work and a previously published NIDS based on MSNM techniques.
Applsci 10 01775 g004
Table 1. Methodology comparison for NIDS evaluation.
WorkDatasetMethodology
FEFSDPHSMLPM
Siddique et al. [13]KDDCup’99, NGIDS-DSclassicalA, TFR
Rathore et al. [15]KDDCup’99proposedclassicalTFR
Sharafaldin et al. [17]CICIDS2017existingexistingclassicalF1, P, R
Li et al. [18]BGP, NSL-KDDproposednormalizationmanualdeep learningA, F1
Le et al. [19]ISCX12, NSL-KDDproposeddeep learningA, TFR, ROC
Cordero et al. [20]MAWIproposedmanualdeep learningO
Camacho et al. [12]UGR’16proposedproposedmean, normalizationmanualstatisticalAUC
Kabir et al. [21]KDDCup’99existingclassicalF1, P, R
Hajisalem et al. [22]NSL-KDD, UNSW-NB15existingotherA, TFR
Divekar et al. [23]KDDCup’99, NSL-KDD,UNSW-NB15existingmeanexistingclassicalA, F1
Belouch et al. [24]UNSW-NB15classicalA, TFR
Hussain et al. [25]KDDCup’99, NSL-KDDproposedclassicalA, TFR, AUC
García et al. [26]CTU-13otherA, TFR, O, F1, P, R
Zhang et al. [27]MAWIproposedproposednormalizationexisting, manualother, classicalA, TFR, F1, P, R
Magán-Carrión et al.UGR’16existingexistingnormalizationexistingclassicalF1, P, R, AUC
FE (Feature Engineering): existing (existing proposal), proposed (author’s proposal). DP (Data Pre-processing): mean, normalization. FS (Feature Selection): existing, proposed, manual. HS (Hyper-parameter Selection): existing, proposed. ML (Machine Learning): classical, deep learning, statistical, other. PM (Performance Metric): A (Accuracy), TFR (TP (True Positive Rate), FP (False Positive Rate), TN (True Negative Rate) or FN (False Negative Rate)), F1, R (Recall), P (Precision), ROC, AUC, O (Others).
Table 2. Number of flows per class found in UGR’16 dataset.
Class# of Flows%
Background 4000 M 97.14
Blacklist 18 M 0.46
Botnet 2 M 0.04
DoS 9 M 0.23
SSH scan64∼0
Scan 6 M 0.14
Spam 78 M 1.96
UDP scan 1 M 0.03
Table 3. New variables in the derived dataset after the application of FaaC method.
Description#Values
Source IP2public, private
Destination IP2public, private
Source port52HTTP, SMTP, SNMP, …
Destination port52HTTP, SMTP, SNMP, …
Protocol5TCP, UDP, ICMP, IGMP, Other
Flags6A, S, F, R, P, U
ToS30, 192, Other
# packets5very low, low, medium, high, very high
# bytes5very low, low, medium, high, very high
label8background, blacklist, botnet, dos, sshscan, scan, spam, udpscan
Table 4. Number of observations per class of the derived dataset after FaaC application.
Class# of Observations%
Background 30,091 63.65
Botnet594 1.26
DoS417 0.88
SSH scan176 0.06
Scan27 0.37
Spam 15,961 33.76
UDP scan9 0.02
Table 5. Average test performance results obtained by the different ML models considered.
ModelClassPM
PRF1AUC
LRBackground0.8140.9190.8630.775
Dos0.9330.9150.9230.957
Botnet0.9650.8910.9260.945
Scan0.8010.9160.8520.957
Spam0.7970.6060.6880.764
Weighted avg.0.8100.8120.8050.776
RFBackground0.8850.9060.9210.871
Dos0.9730.8840.9250.942
Botnet0.9770.9220.9480.961
Scan0.9320.9250.9280.962
Spam0.9170.7490.8240.857
Weighted avg.0.8970.8870.8880.868
SVC-RBFBackground0.8390.9370.8850.810
Dos0.9600.8310.8890.915
Botnet0.9720.8860.9270.943
Scan0.9410.5360.6520.768
Spam0.8240.6380.7170.790
Weighted avg.0.8370.8320.8270.806
SVC-LBackground0.8190.930.8710.785
Dos0.9570.8980.9260.948
Botnet0.9680.8990.9320.949
Scan0.9440.910.9260.955
Spam0.8290.610.7030.773
Weighted avg.0.8260.8210.8150.785
Table 6. Comparison of the classification performance between MSNM approaches in a state-of-the-art publication and the ML-based ones proposed in this work.
NIDSModelClassAUC
Our ProposalLRDos0.957
Botnet0.945
Scan0.957
RFDos0.942
Botnet0.961
Scan0.962
SVC-RBFDos0.915
Botnet0.943
Scan0.768
SVC-LDos0.948
Botnet0.949
Scan0.955
Camacho et al.MSNM-MCDos0.969
Botnet0.512
Scan0.979
MSNM-ASDos0.983
Botnet0.62
Scan0.994
MSNM-R2R-PLSDos0.999
Botnet0.771
Scan1
MSNM-SVC-RBFDos0.999
Botnet0.884
Scan0.997
MSNM-SVC-LDos0.998
Botnet0.808
Scan0.997

