Distribution and Antioxidant Efficiency of Resveratrol in Stripped Corn Oil Emulsions


Abstract
:1. Introduction


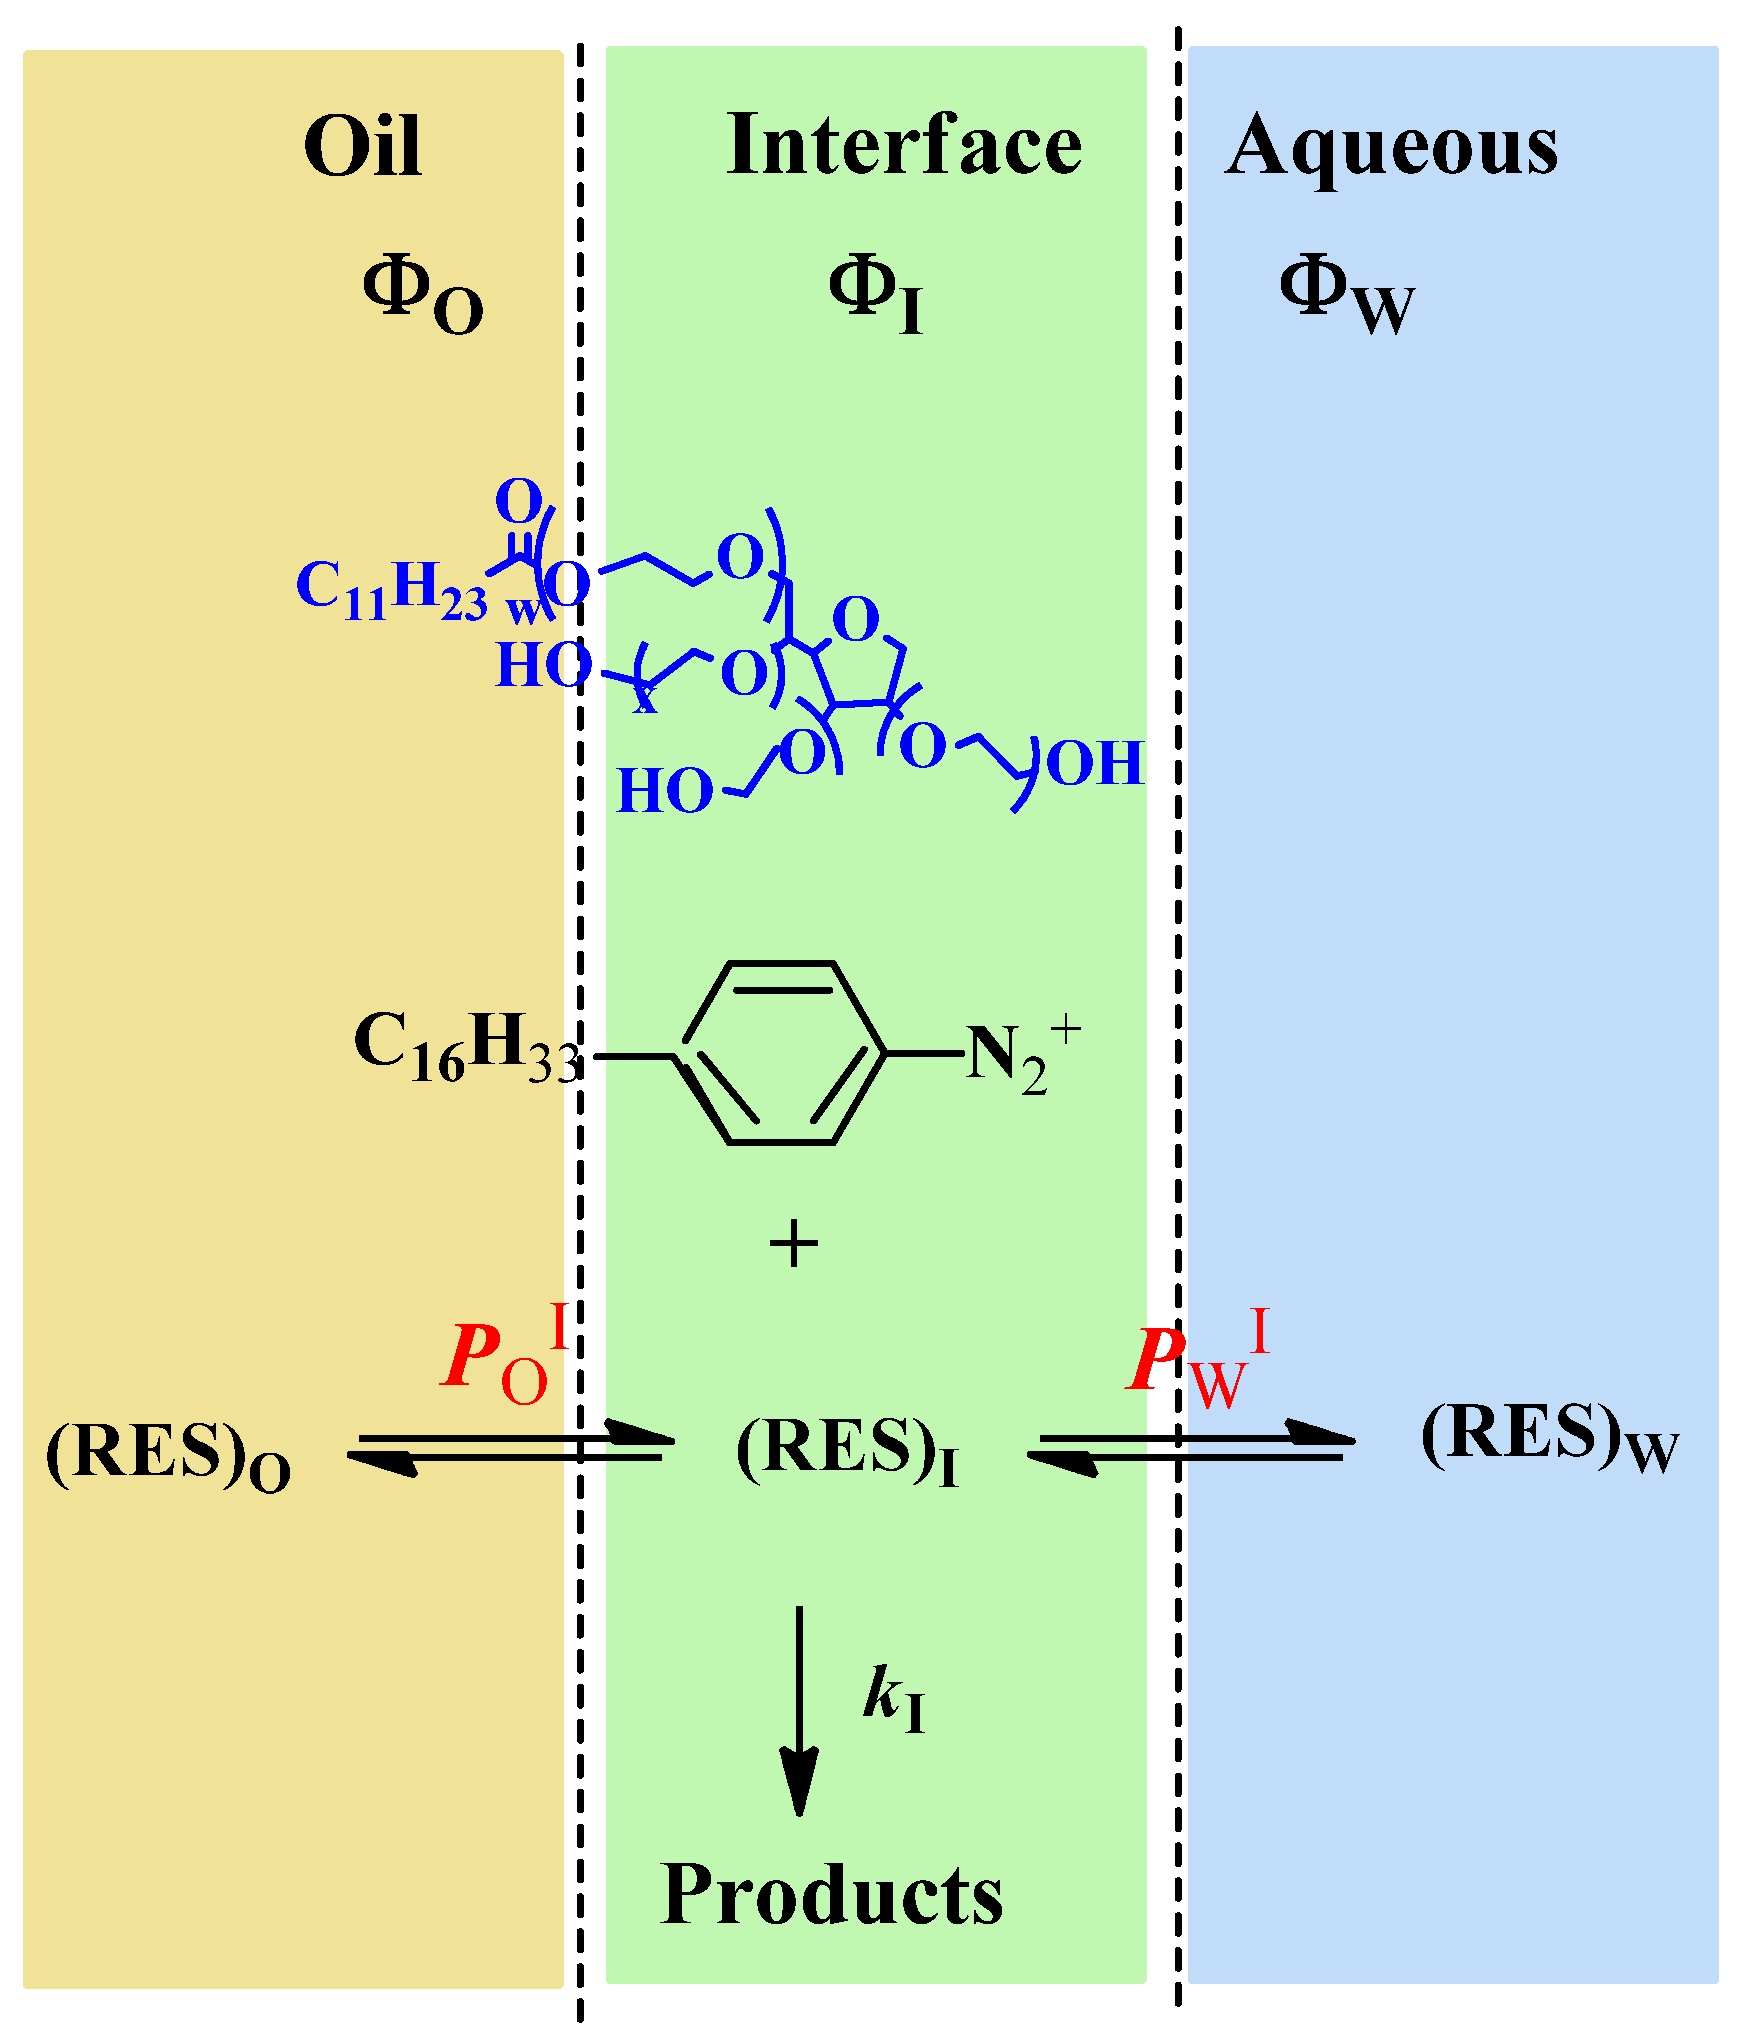
Relationships between the Observed Rate Constant, kobs, and the Partition Constants, PWI and POI: The Pseudophase Kinetic Model


2. Experimental Section
2.1. Materials
2.2. Emulsion Preparation
2.3. Methods
2.3.1. DPPH Radical Scavenging Method
2.3.2. Oxidative Stability of Emulsions
2.3.3. Determining the Partition Constant, PWO, of Resveratrol in Binary Stripped Corn Oil-Water Mixtures in the Absence of Emulsifier

2.3.4. Determining kobs Values in Emulsions: Derivatization Method

 -) and ln plot (-
  -), according to Equation (10). Reaction conditions: ФI (Tween 20) = 0.0289, [16-ArN2+] = 1 × 10⁻⁴ M, [RES] = 1.3 mM, pH 2.14 (0.04 M citric-citrate buffer), T = 25 °C.
-) and ln plot (- -), according to Equation (10). Reaction conditions: ФI (Tween 20) = 0.0289, [16-ArN2+] = 1 × 10⁻⁴ M, [RES] = 1.3 mM, pH 2.14 (0.04 M citric-citrate buffer), T = 25 °C.
-), according to Equation (10). Reaction conditions: ФI (Tween 20) = 0.0289, [16-ArN2+] = 1 × 10⁻⁴ M, [RES] = 1.3 mM, pH 2.14 (0.04 M citric-citrate buffer), T = 25 °C.
-) and ln plot (- -), according to Equation (10). Reaction conditions: ФI (Tween 20) = 0.0289, [16-ArN2+] = 1 × 10⁻⁴ M, [RES] = 1.3 mM, pH 2.14 (0.04 M citric-citrate buffer), T = 25 °C.
3. Results and Discussion
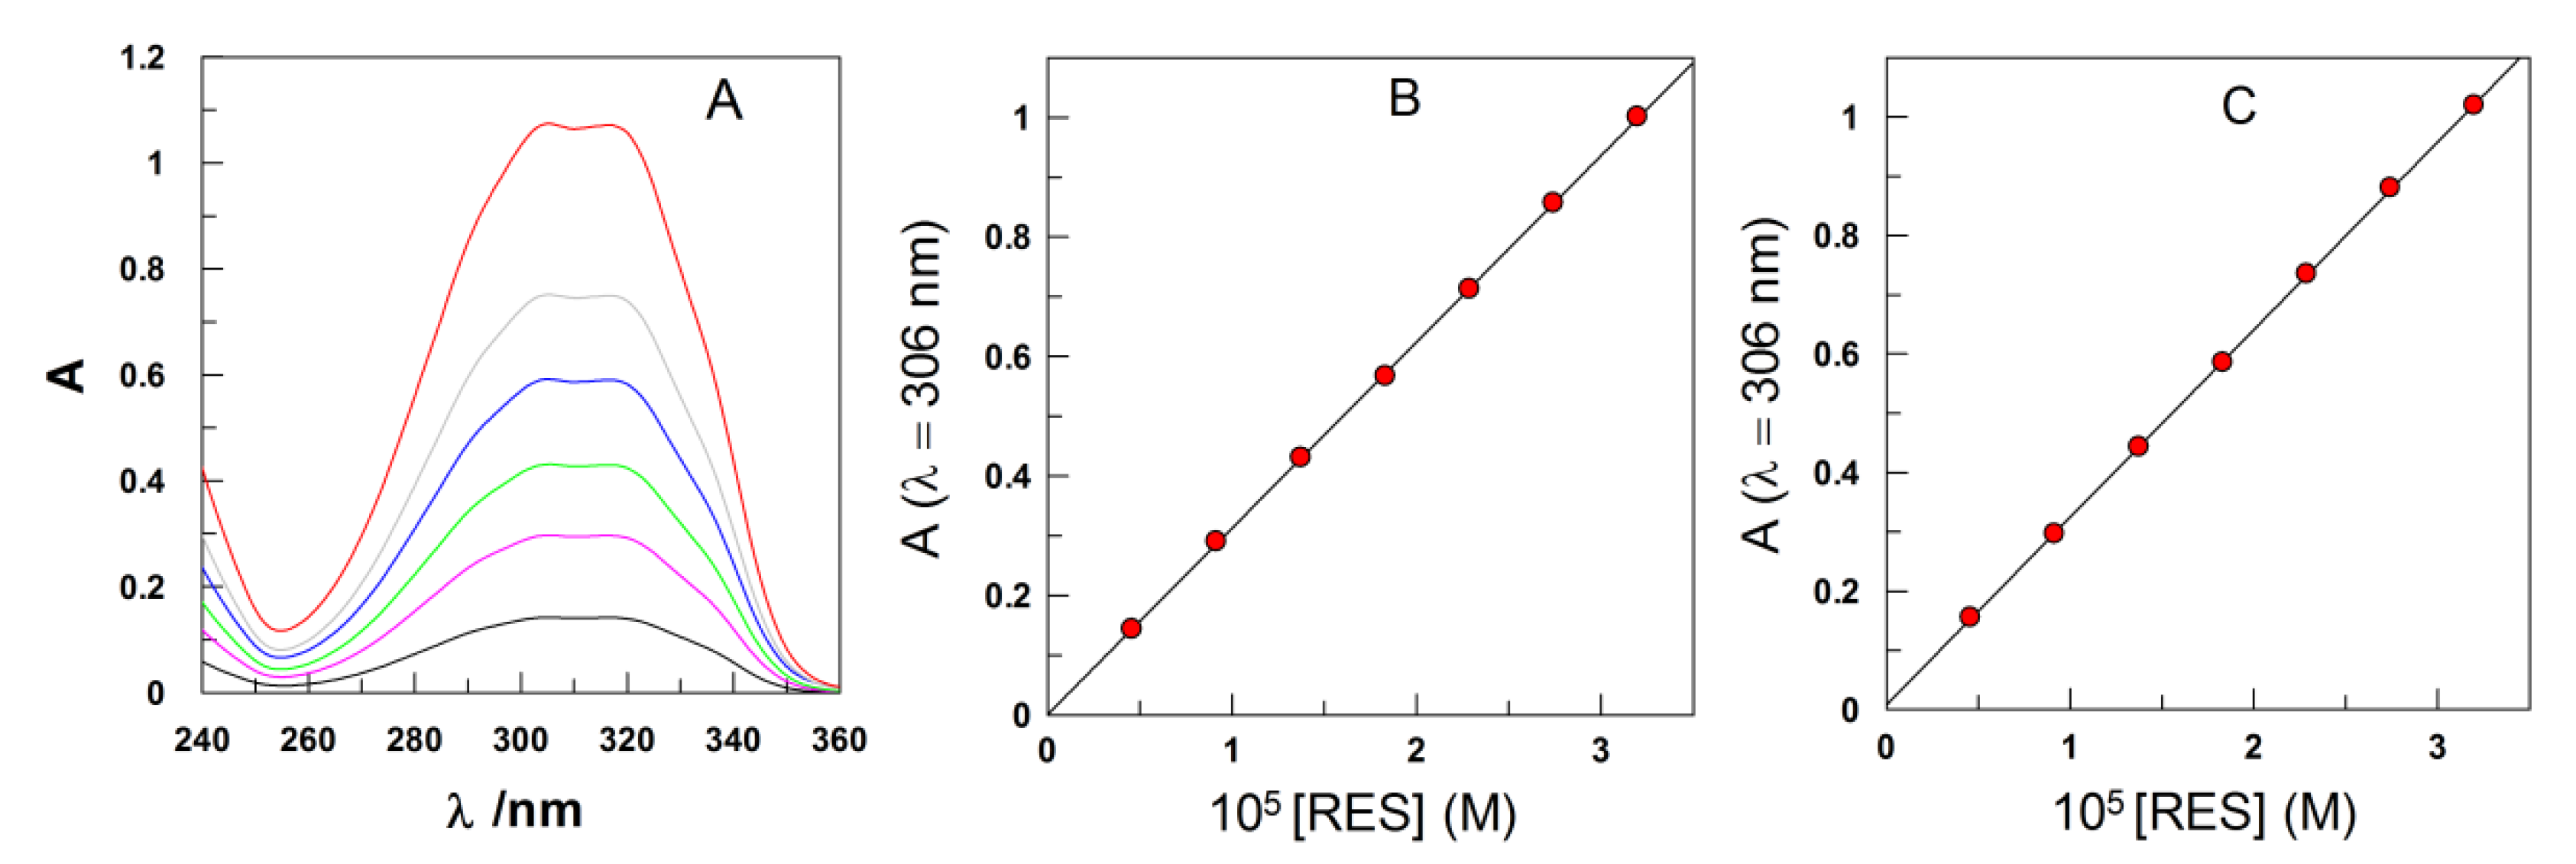
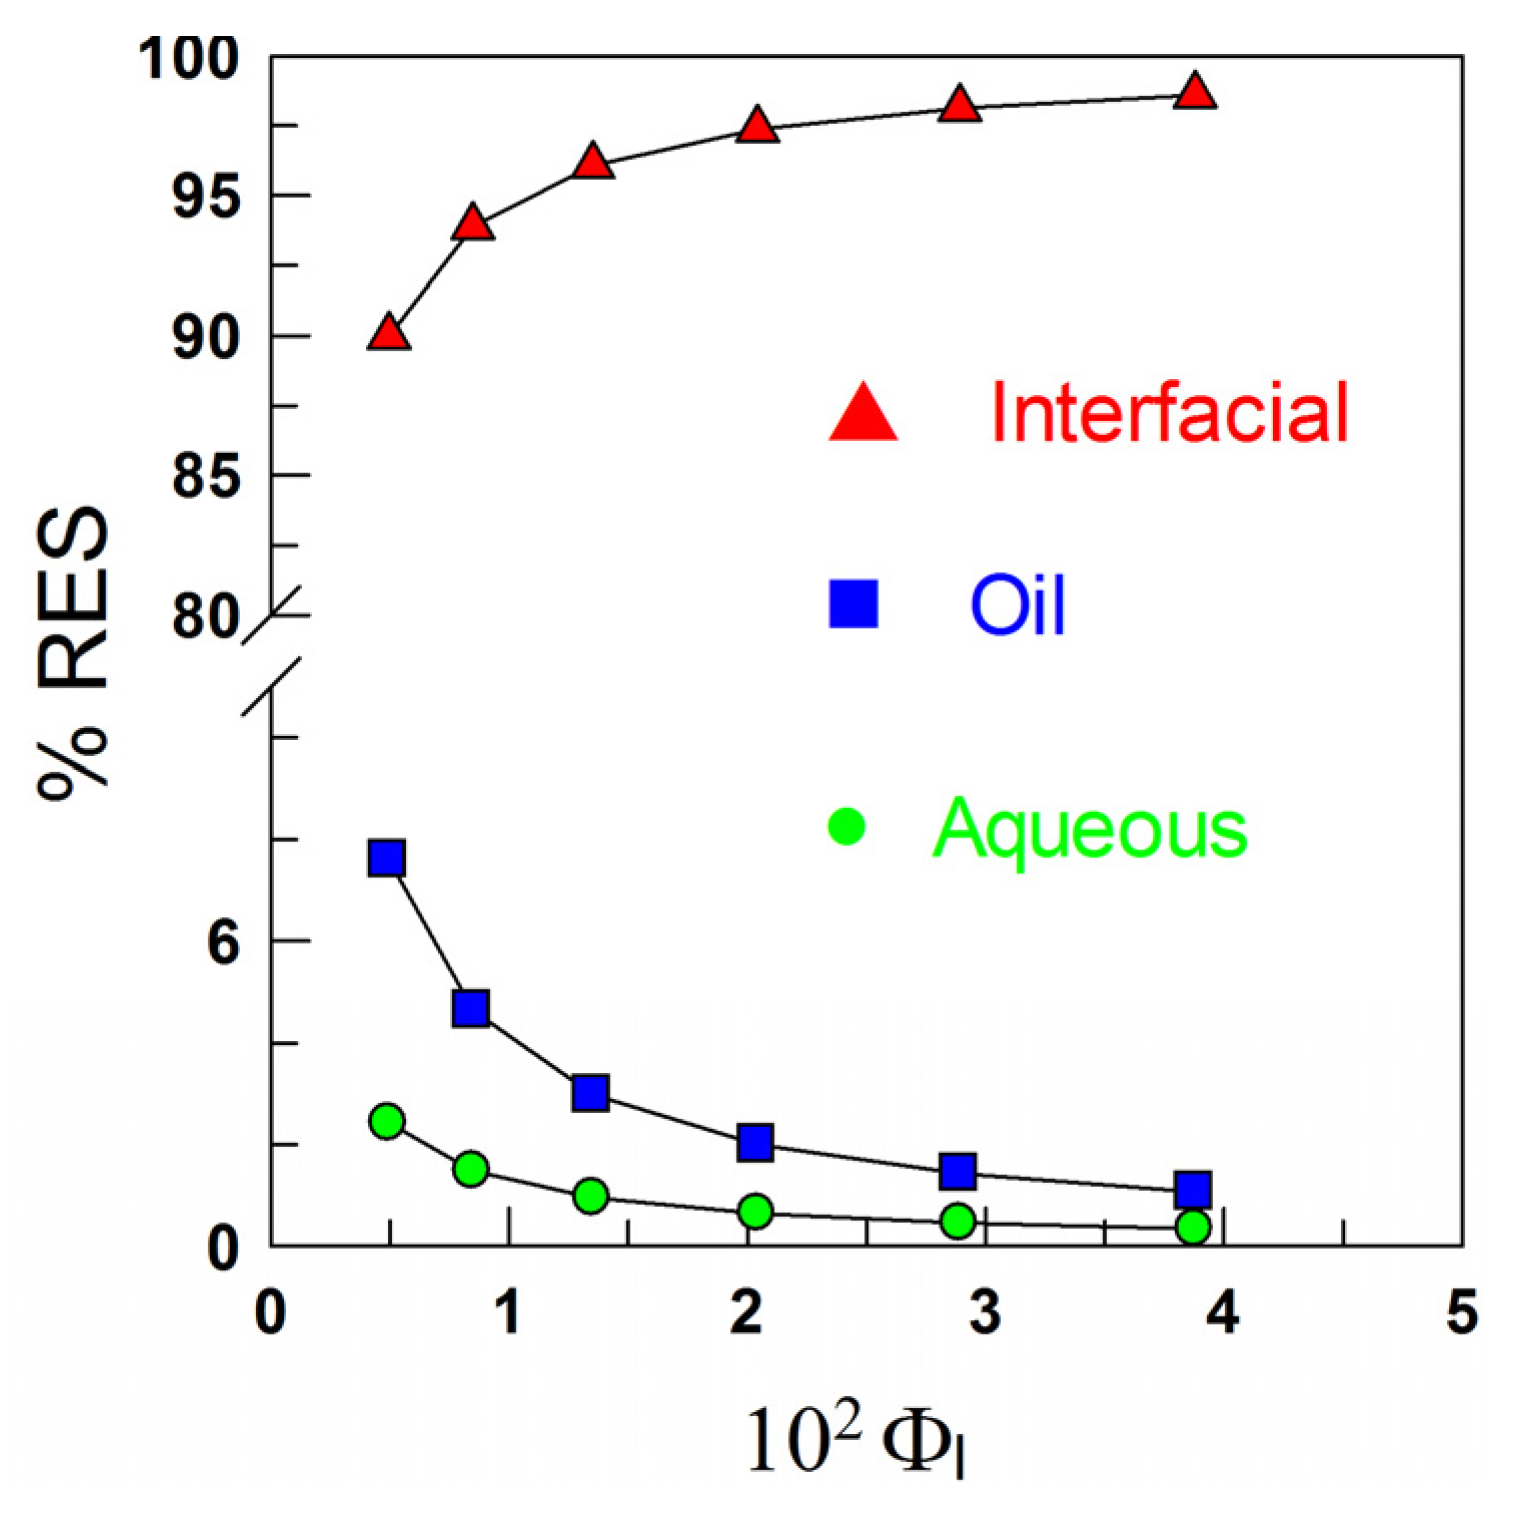
3.1. Distribution of RES in Stripped Corn Oil Emulsions


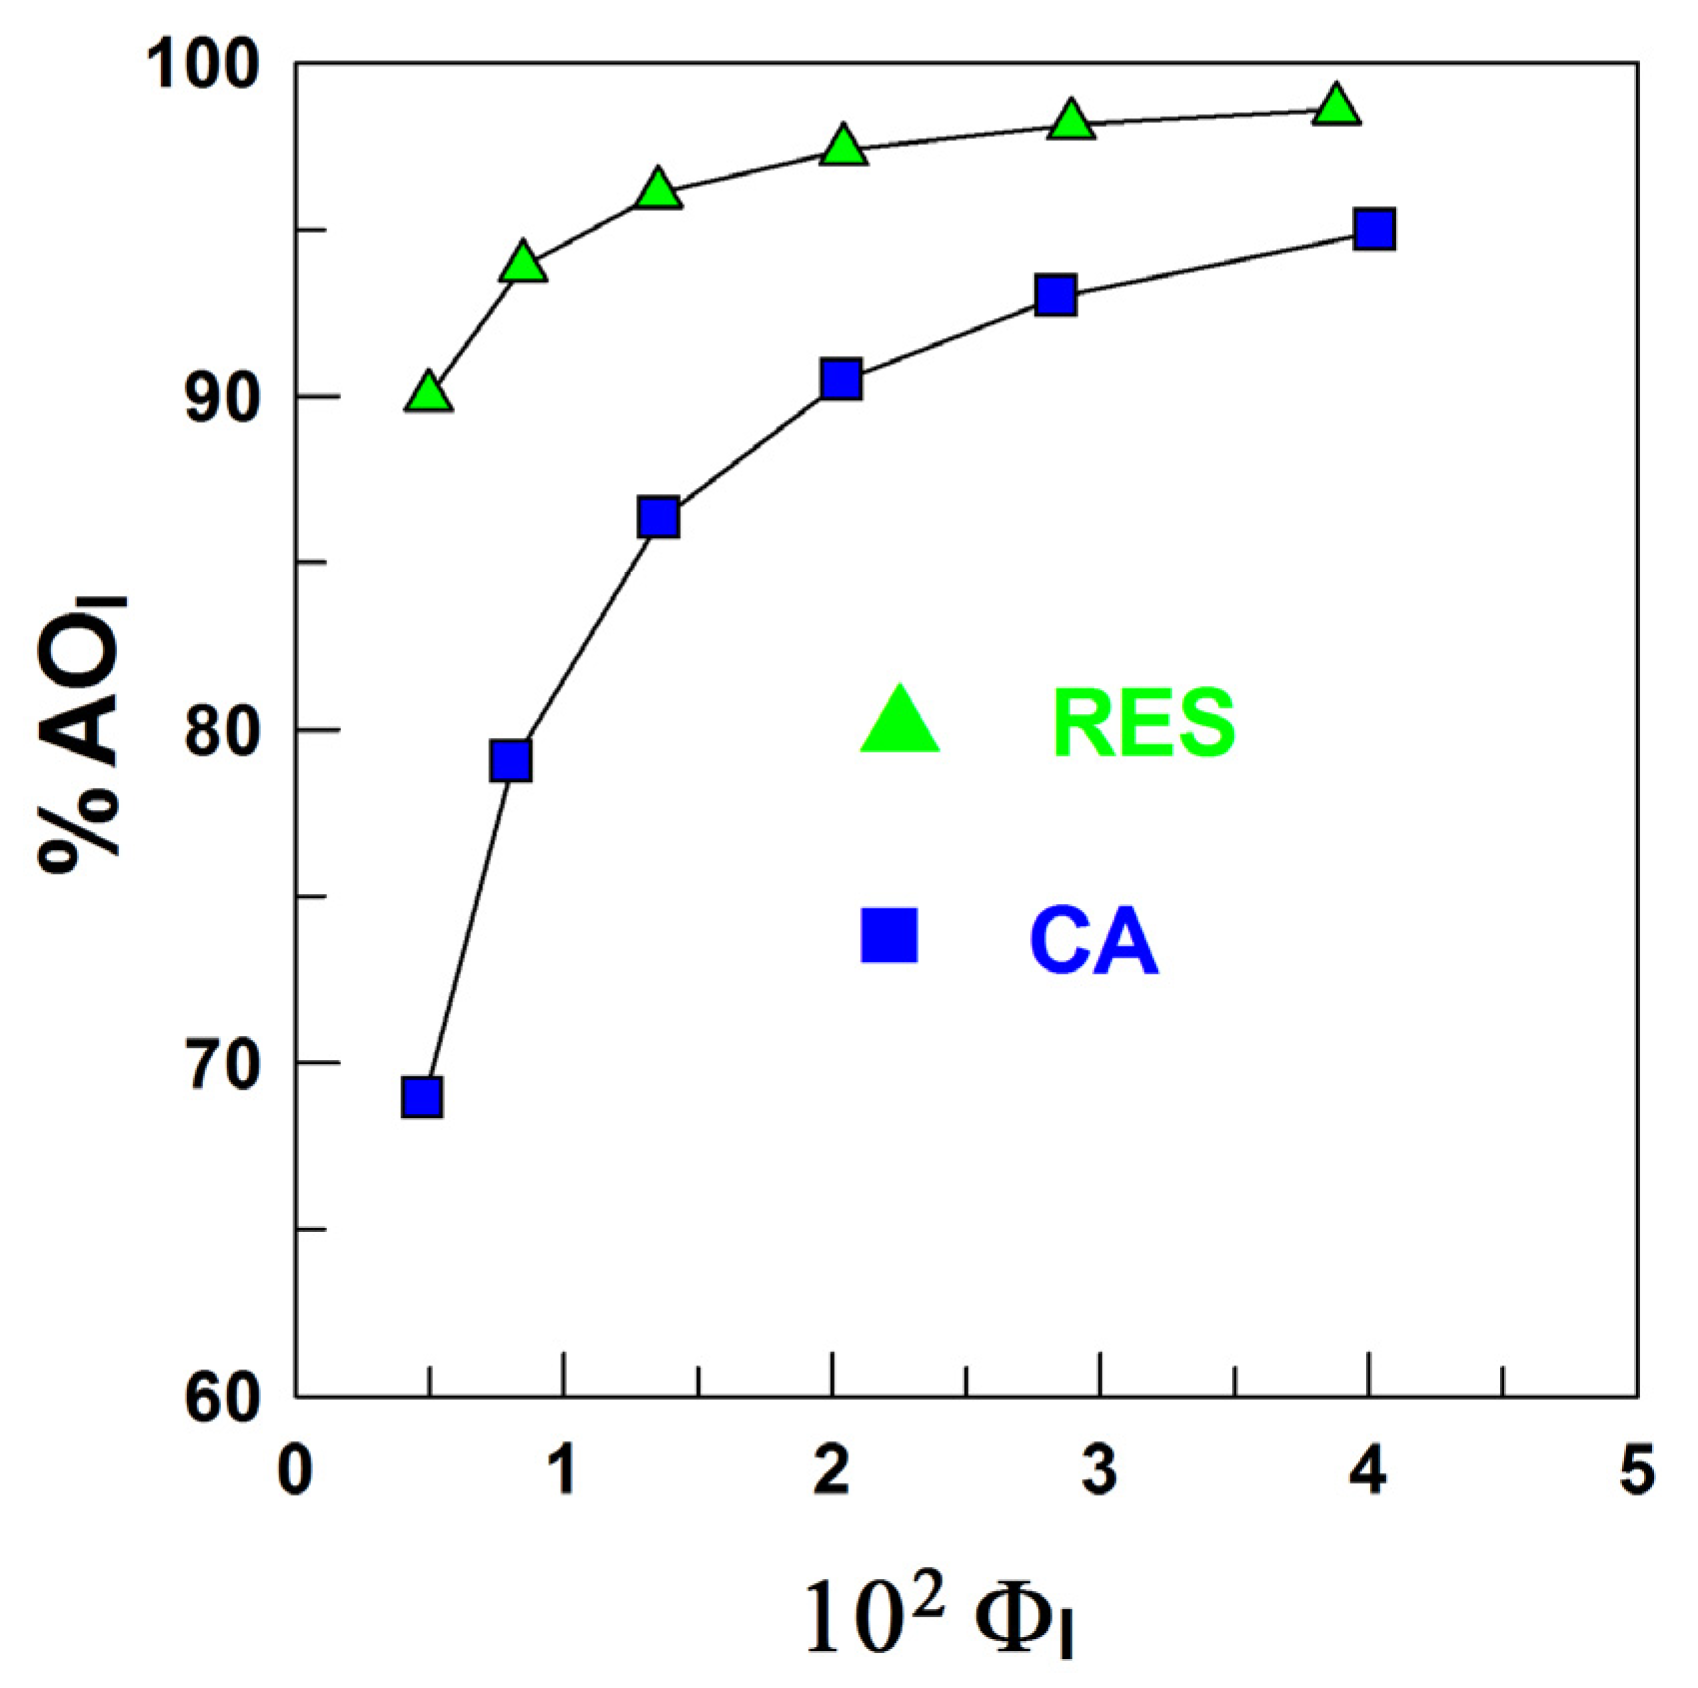
3.2. Oxidative Stability of Emulsions

 -) and caffeic acid (-
  -) in the interfacial region of corn oil in water emulsion (4:6, O/W). Experimental conditions: [RES] = 1.3 mM, [CA] = 4.4 mM, citrate buffer 0.04 M (pH 2.14 for RES and pH 3.65 for CA). T = 25 °C. Data for CA were taken from [30].
-) and caffeic acid (- -) in the interfacial region of corn oil in water emulsion (4:6, O/W). Experimental conditions: [RES] = 1.3 mM, [CA] = 4.4 mM, citrate buffer 0.04 M (pH 2.14 for RES and pH 3.65 for CA). T = 25 °C. Data for CA were taken from [30].
-) in the interfacial region of corn oil in water emulsion (4:6, O/W). Experimental conditions: [RES] = 1.3 mM, [CA] = 4.4 mM, citrate buffer 0.04 M (pH 2.14 for RES and pH 3.65 for CA). T = 25 °C. Data for CA were taken from [30].
-) and caffeic acid (- -) in the interfacial region of corn oil in water emulsion (4:6, O/W). Experimental conditions: [RES] = 1.3 mM, [CA] = 4.4 mM, citrate buffer 0.04 M (pH 2.14 for RES and pH 3.65 for CA). T = 25 °C. Data for CA were taken from [30].
 - 0.1854 mol RES/mol DPPH -
  - 0.2223 mol RES/mol DPPH, -
  - 0.2966 mol RES/mol DPPH, -
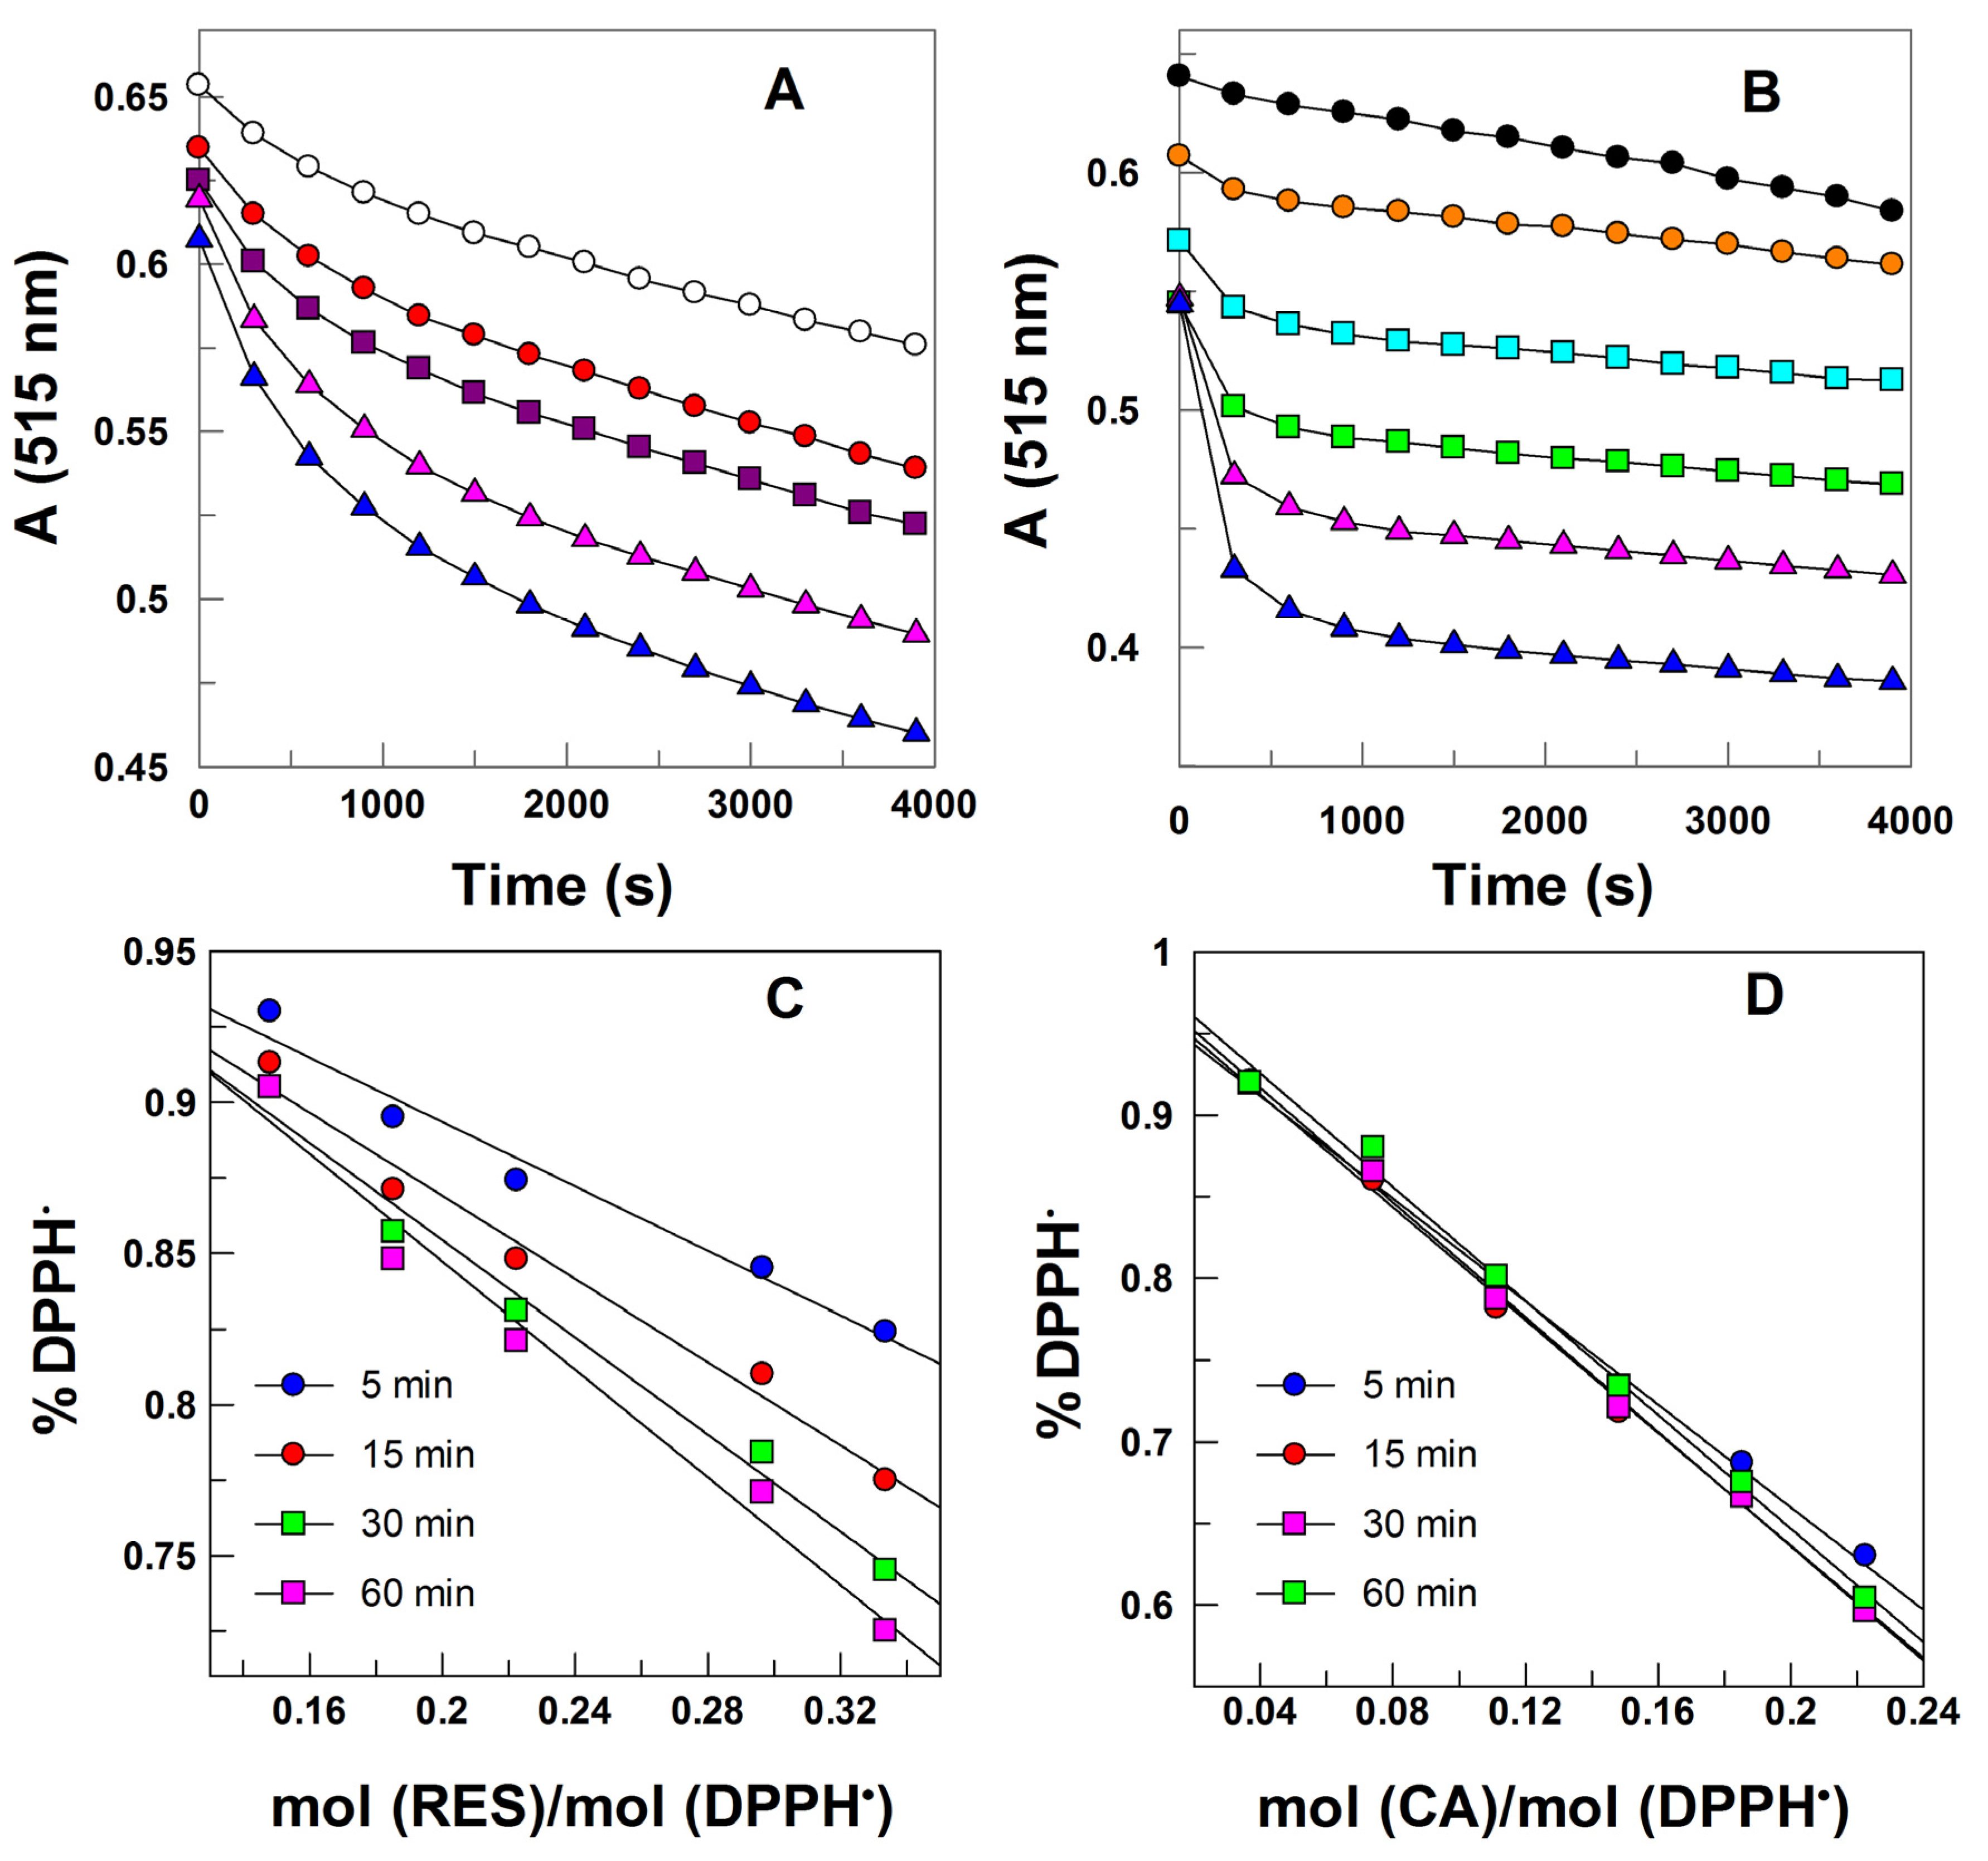
  - 0.3337 mol RES/mol DPPH); (B) variation of the absorbance of DPPH in the presence of different concentrations of CA at T = 25 °C (-●- 0.0371 mol RES/mol DPPH, -
  - 0.0742 mol RES/mol DPPH, -
  - 0.1113 mol RES/mol DPPH, -
  - 0.1484 mol RES/mol DPPH, - - 0.1855 mol RES/mol DPPH, -▲- 0.2226 mol RES/mol DPPH). (C,D) Determination of EC50 values of RES; (C) and CA; (D) towards DPPH free radicals.
- 0.1854 mol RES/mol DPPH - - 0.2223 mol RES/mol DPPH, - - 0.2966 mol RES/mol DPPH, - - 0.3337 mol RES/mol DPPH); (B) variation of the absorbance of DPPH in the presence of different concentrations of CA at T = 25 °C (-●- 0.0371 mol RES/mol DPPH, - - 0.0742 mol RES/mol DPPH, - - 0.1113 mol RES/mol DPPH, - - 0.1484 mol RES/mol DPPH, - - 0.1855 mol RES/mol DPPH, -▲- 0.2226 mol RES/mol DPPH). (C,D) Determination of EC50 values of RES; (C) and CA; (D) towards DPPH free radicals.
- 0.1484 mol RES/mol DPPH, - - 0.1855 mol RES/mol DPPH, -▲- 0.2226 mol RES/mol DPPH). (C,D) Determination of EC50 values of RES; (C) and CA; (D) towards DPPH free radicals.
- 0.1854 mol RES/mol DPPH - - 0.2223 mol RES/mol DPPH, - - 0.2966 mol RES/mol DPPH, - - 0.3337 mol RES/mol DPPH); (B) variation of the absorbance of DPPH in the presence of different concentrations of CA at T = 25 °C (-●- 0.0371 mol RES/mol DPPH, - - 0.0742 mol RES/mol DPPH, - - 0.1113 mol RES/mol DPPH, - - 0.1484 mol RES/mol DPPH, - - 0.1855 mol RES/mol DPPH, -▲- 0.2226 mol RES/mol DPPH). (C,D) Determination of EC50 values of RES; (C) and CA; (D) towards DPPH free radicals.

| Antioxidant | t = 5 min | t = 15 min | t = 30 min | t = 60 min |
|---|---|---|---|---|
| RES | 0.9080 | 0.6991 | 0.5991 | 0.5256 |
| CA | 0.3016 | 0.2791 | 0.2775 | 0.2843 |
4. Conclusions
Acknowledgments
Conflicts of Interest
References
- Brewer, M.S. Natural antioxidants: Sources, compounds,mechanisms of action, and potential applications. Compr. Rev. Food Sci. Food Saf. 2011, 10, 221–247. [Google Scholar] [CrossRef]
- Carrizzo, A.; Forte, M.; Damato, A.; Trimarco, V.; Salzano, F.; Bartolo, M.; Maciag, A.; Pucaf, A.A. Mechanisms involved in oxidative stress regulation: Antioxidant effects of resveratrol in cardiovascular, cerebral and metabolic diseases. Food Chem. Toxicol. 2013, 61, 215–226. [Google Scholar] [CrossRef] [Green Version]
- Nadtochiy, S.M.; Redman, E.K. Mediterranean diet and cardioprotection: The role of nitrite, polyunsaturated fatty acids, and polyphenols. Nutrition 2011, 27, 733–744. [Google Scholar] [CrossRef]
- Orallo, F. Comparative studies of the antioxidant effects of cis- and trans-resveratrol. Curr. Med. Chem. 2006, 13, 87–98. [Google Scholar] [CrossRef]
- Fan, E.; Chang, L.; Jiang, S.; Bai, Y. Beneficial effects of resveratrol on atherosclerosis. J. Med. Food 2008, 11, 610–614. [Google Scholar] [CrossRef]
- Jang, M.S.; Cai, E.N.; Udeani, G.O.; Slowing, K.V.; Thomas, C.F.; Beecher, C.W.; Fong, H.H.S.; Farnsworth, N.R.; Kinghorn, A.D.; Mehta, R.G.; et al. Cancer chemopreventive activity of resveratrol, a natural product derived from grapes. Science 1997, 275, 218–220. [Google Scholar] [CrossRef]
- Olas, B.; Wachowicz, B. Resveratrol, a phenolic antioxidant with effects on blood platelet functions. Platelets 2005, 16, 251–260. [Google Scholar] [CrossRef]
- Amri, A.; Chaumeil, J.C.; Sfar, S.; Charrueau, C. Administration of resveratrol: What formulation solutions to bioavailability limitations? J. Control. Release 2012, 158, 182–193. [Google Scholar] [CrossRef]
- Wang, M.; Jin, Y.; Ho, C.-T. Evaluation of resveratrol derivatives as potential antioxidants and identification of a reaction product of resveratrol and 2,2-diphenyl-1-picryhydrazyl radical. J. Agric. Food Chem. 1999, 47, 3974–3977. [Google Scholar] [CrossRef]
- Medina, I.; Alcántara, D.; González, M.J.; Torres, P.; Lucas, R.; Roque, J.; Plou, F.J.; Morales, J.C. Antioxidant activity of resveratrol in several fish lipid matrices: Effect of acylation and glucosylation. J. Agric. Food Chem. 2010, 58, 9778–9786. [Google Scholar] [CrossRef]
- Filip, V.; Plocková, M.; Šmidrkal, J.; Špičková, Z.; Melzoch, K.; Schmidt, Š. Resveratrol and its antioxidant and antimicrobial effectiveness. Food Chem. 2003, 83, 585–593. [Google Scholar] [CrossRef]
- Losada-Barreiro, S.; Sánchez Paz, V.; Bravo-Díaz, C. Effects of emulsifier hydrophile–lipophile balance and emulsifier concentration the distributions of gallic acid, propyl gallate, and a-tocopherol in corn oil emulsions. J. Colloid Interface Sci. 2013, 389, 1–9. [Google Scholar] [CrossRef]
- Losada-Barreiro, S.; Bravo Díaz, C.; Paiva Martins, F.; Romsted, L.S. A maximum in antioxidant distributions and efficiencies with increasing hydrophobicity of gallic acid and its alkyl esters. The pseudophase model interpretation of the “cut-off effect”. J. Agric. Food Chem. 2013, 61, 6533–6543. [Google Scholar] [CrossRef]
- Costa, M.; Losada-Barreiro, S.; Paiva-Martins, F.; Bravo-Díaz, C. Effects of acidity, temperature and emulsifier concentration on the distribution of caffeic acid in stripped corn and olive oil-in-water emulsions. J. Am. Oil Chem. Soc. 2013, 90, 1629–1636. [Google Scholar] [CrossRef]
- Losada-Barreiro, S.; Sánchez Paz, V.; Bravo Díaz, C.; Paiva Martins, F.; Romsted, L.S. Temperature and emulsifier concentration effects on gallic acid distribution in a model food emulsion. J. Colloid Interface Sci. 2012, 370, 73–79. [Google Scholar] [CrossRef]
- Lisete-Torres, P.; Losada-Barreiro, S.; Albuquerque, H.; Sánchez-Paz, V.; Paiva-Martins, F.; Bravo-Díaz, C. Distribution of hydroxytyrosol and hydroxytyrosol acetate in olive oil emulsions and their antioxidant efficiency. J. Agric. Food Chem. 2012, 60, 7318–7325. [Google Scholar] [CrossRef]
- Berthod, A.; Carda-Bosch, S. Determination of liquid-liquid partition coefficients by separation methods. J. Chromatogr. A 2004, 1037, 3–14. [Google Scholar] [CrossRef]
- Leo, A.; Hansch, C.; Elkins, D. Partition coefficients and their uses. Chem. Rev. 1971, 71, 525–616. [Google Scholar] [CrossRef]
- Romsted, L.S.; Bravo-Díaz, C. Modelling chemical reactivity in emulsions. Curr. Opin. Colloid Interface Sci. 2013, 18, 3–14. [Google Scholar] [CrossRef]
- Gunaseelan, K.; Romsted, L.S.; Pastoriza-Gallego, M.J.; González-Romero, E.; Bravo-Díaz, C. Determining a-tocopherol distributions betweeen the oil, water and interfacial regions of macroemulsions: Novel applications of electrocanalytical chemistry and a pseudophase kinetic model. Adv. Colloid Interface Sci. 2006, 123–126, 303–311. [Google Scholar] [CrossRef]
- Garcia-Meijide, M.C.; Bravo-Diaz, C.; Romsted, L.S. A novel method for monitoring dediazoniations: Simultaneous monitoring of rates and product distributions of 4-methylbenzenediazonium tetrafluoroborate. Int. J. Chem. Kinet. 1998, 30, 31–39. [Google Scholar] [CrossRef]
- Sharma, O.P.; Bhat, T.K. Dpph antioxidant assay revisited. Food Chem. 2009, 113, 1202–1205. [Google Scholar] [CrossRef]
- Shang, Y.J.; Qian, Y.P.; Liu, X.D.; Xian-Ling, F.D. Radical-scavenging activity and mechanism of resveratrol-oriented analogues: Influence of the solvent, radical, and substitution. J. Org. Chem 2009, 74, 5025–5031. [Google Scholar] [CrossRef]
- Villaño, D.; Fernández-Pachón, M.S.; Moyá, M.L.; Troncoso, A.M.; Garcia-Parrilla, M.C. Radical scavenging ability of polyphenolic compounds towards dpph free radical. Talanta 2007, 71, 230–235. [Google Scholar] [CrossRef]
- Lu, L.-L.; Lu, X.-Y. Solubilities of gallic acid and its esters in water. J. Chem. Eng. Data 2007, 52, 37–39. [Google Scholar] [CrossRef]
- Mota, F.L.; Queimada, A.J.; Pinho, S.; Macedo, E. Aqueous solubility of some natural phenolic compounds. Ind. Eng. Chem. Res. 2008, 47, 5182–5189. [Google Scholar] [CrossRef]
- Sánchez-Paz, V.; Pastoriza-Gallego, M.J.; Losada-Barreiro, S.; Bravo-Diaz, C.; Gunaseelan, K.; Romsted, L.S. Quantitative determination of α-tocopherol distribution in a tributyrin/brij 30/water model food emulsion. J. Colloid Interface Sci. 2008, 320, 1–8. [Google Scholar] [CrossRef]
- Martinez-Aranda, N.; Losada-Barreiro, S.; Bravo-Díaz, C.; Romsted, L.S. Influence of temperature on the distribution of catechin in corn oil-in-water emulsions and some relevant thermodynamic parameters. Food Biophys. 2014, in press. [Google Scholar]
- Pastoriza-Gallego, M.J.; Sánchez-Paz, V.; Losada-Barreiro, S.; Bravo-Diaz, C.; Gunaseelan, K.; Romsted, L.S. Effects of temperature and emulsifier concentration on a-tocopherol distribution in a stirred, fluid, emulsion. Thermodynamics of a-tocopherol transfer between the oil and interfacial regions. Langmuir 2009, 25, 2646–2653. [Google Scholar] [CrossRef]
- Costa, M.; Losada-Barreiro, S.; Paiva-Martins, F.; Bravo-Díaz, C.; Romsted, L.S. A direct correlation between the efficiencies of caffeic acid alkyl esters and their mole fractions in the interfacial region of olive oil emulsions. The pseudophase model interpretation of the “cut-off” effect. Food Chem. 2013. submitted for publication. [Google Scholar]
- Waraho, T.; McClements, D.J.; Decker, E.A. Mechanisms of lipid oxidation in food dispersions. Trends Food Sci. Technol. 2011, 22, 3–13. [Google Scholar] [CrossRef]
- Frankel, E.N. Lipid Oxidation; The Oily Press, PJ Barnes & Associates: Bridgwater, UK, 2005. [Google Scholar]
- Laguerre, M.; Decker, E.A.; Lecomte, J.; Villeneuve, P. Methods for evaluating the potency and efficacy of antioxidants. Curr. Opin. Clin. Nutr. Metab. Care 2010, 13, 518–525. [Google Scholar] [CrossRef]
- Teixieria, S.; Siquet, C.; Alves, C.; Boal, I.; Marques, M.P.; Borges, F.; Lima, J.L.F.C.; Reis, S. Structure-property studies of the antioxidant activity of flavonoids present in diet. Free Radic. Biol. Med. 2005, 39, 1099–1108. [Google Scholar] [CrossRef]
© 2014 by the authors; licensee MDPI, Basel, Switzerland. This article is an open access article distributed under the terms and conditions of the Creative Commons Attribution license (http://creativecommons.org/licenses/by/3.0/).
Share and Cite
Losada-Barreiro, S.; Costa, M.; Bravo-Díaz, C.; Paiva-Martins, F. Distribution and Antioxidant Efficiency of Resveratrol in Stripped Corn Oil Emulsions. Antioxidants 2014, 3, 212-228. https://doi.org/10.3390/antiox3020212
Losada-Barreiro S, Costa M, Bravo-Díaz C, Paiva-Martins F. Distribution and Antioxidant Efficiency of Resveratrol in Stripped Corn Oil Emulsions. Antioxidants. 2014; 3(2):212-228. https://doi.org/10.3390/antiox3020212
Chicago/Turabian StyleLosada-Barreiro, Sonia, Marlene Costa, Carlos Bravo-Díaz, and Fátima Paiva-Martins. 2014. "Distribution and Antioxidant Efficiency of Resveratrol in Stripped Corn Oil Emulsions" Antioxidants 3, no. 2: 212-228. https://doi.org/10.3390/antiox3020212