Genome-Wide Assessment of Runs of Homozygosity in Chinese Wagyu Beef Cattle
by
 ,
,
Guoyao Zhao
1,†, 
Tianliu Zhang
1,†,
Yuqiang Liu
1, 
Zezhao Wang
1,2,
Lei Xu
1,2,
Bo Zhu
1,
Xue Gao
1,
Lupei Zhang
1,
Huijiang Gao
1,
George E. Liu
3,
Junya Li
1,* and
Lingyang Xu
1,* 1
Key Laboratory of Animal Genetics Breeding and Reproduction, Ministry of Agriculture and Rural Affairs, Institute of Animal Science, Chinese Academy of Agricultural Sciences, Beijing 100193, China.
2
National Engineering Laboratory for Animal Breeding, Key Laboratory of Animal Genetics, Breeding and Reproduction, Ministry of Agriculture, College of Animal Science and Technology, Chinese agriculture University, Beijing 100193, China
3
Animal Genomics and Improvement Laboratory, United States Department of Agriculture-Agricultural Research Service, Beltsville, MD 20705, USA
*
Authors to whom correspondence should be addressed.
†
These authors contributed equally to this work.
Animals 2020, 10(8), 1425; https://doi.org/10.3390/ani10081425
Submission received: 12 July 2020
/
Revised: 6 August 2020
/
Accepted: 10 August 2020
/
Published: 14 August 2020
(This article belongs to the Collection Advances in Cattle Breeding, Genetics and Genomics)
Abstract
:Simple Summary
Runs of homozygosity (ROH) are continuous homozygous regions that generally exist in the DNA sequence of diploid organisms. Identifications of ROH leading to reduction in performance can provide valuable insight into understanding the genetic architecture of complex traits. We assessed genome-wide homozygosity patterns and inbreeding levels in Chinese Wagyu beef cattle. We identified several high frequency regions overlapped with QTLs which are associated with body weight, calving ease, and stillbirth. Based on these regions, we carried out a region-based association for eight economically important traits. Of these, nine regions were significantly associated with six traits including body height, chest circumference, fat coverage, backfat thickness, ribeye area, and carcass length. Our study identified that many candidate regions and genes overlapped with ROH for several important traits, which could be unitized to assist the design of a selection mating strategy in beef cattle.
Abstract
Runs of homozygosity (ROH) are continuous homozygous regions that generally exist in the DNA sequence of diploid organisms. Identifications of ROH leading to reduction in performance can provide valuable insight into the genetic architecture of complex traits. Here, we evaluated genome-wide patterns of homozygosity and their association with important traits in Chinese Wagyu beef cattle. We identified a total of 29,271 ROH segments from 462 animals. Within each animal, an average number of ROH was 63.36 while an average length was 62.19 Mb. To evaluate the enrichment of ROH across genomes, we initially identified 280 ROH regions by merging ROH events across all individuals. Of these, nine regions containing 154 candidate genes, were significantly associated with six traits (body height, chest circumference, fat coverage, backfat thickness, ribeye area, and carcass length; p < 0.01). Moreover, we found 26 consensus ROH regions with frequencies exceeding 10%, and several regions overlapped with QTLs, which are associated with body weight, calving ease, and stillbirth. Among them, we observed 41 candidate genes, including BCKDHB, MAB21L1, SLC2A13, FGFR3, FGFRL1, CPLX1, CTNNA1, CORT, CTNNBIP1, and NMNAT1, which have been previously reported to be related to body conformation, meat quality, susceptibility, and reproductive traits. In summary, we assessed genome-wide autozygosity patterns and inbreeding levels in Chinese Wagyu beef cattle. Our study identified many candidate regions and genes overlapped with ROH for several important traits, which could be unitized to assist the design of a selection mating strategy in beef cattle.
1. Introduction
Runs of homozygosity (ROH) are continuous homozygous regions that generally exist in the DNA sequence of diploid organisms [1]. Several studies have suggested that an individual inherits the chromosomal fragment from both parents, resulting in homozygous segments in the offspring’s genome [2,3]. Many factors can contribute to the formation of ROH, including paternal founder effects, genetic drift, inbreeding, and intensive selection [4]. Long ROH are most likely derived from a recent ancestor while shorter ones are from a more distant ancestor [5].
With the development of high-density array and whole-genome sequencing technologies, they provided unprecedented opportunities to explore homozygosity segments in high resolution [6].
Initially, Broman et al. proposed that ROH exist widely in the human genome and has an important impact on human health [7]. Jane et al. further explored different distribution frequencies of ROH with various lengths using high-density SNP arrays, promoting the development for the ROH study in humans [1]. Additional analyses found that ROH can provide insights into the population structure and demography in humans [8,9,10] and genetic relationships [11,12,13,14,15,16]. The enrichment of ROH may increase the harmful recessive alleles, and reduce the survival ability of individuals [17]. Several papers have also found a significant association between ROH and the occurrence of recessive diseases [18,19]. Other investigations suggested that ROH were related to human diseases, including schizophrenia [20], rheumatoid arthritis [21], and Alzheimer’s disease [22].
In recent years, ROH have been widely utilized to assess the genome-wide inbreeding level and genetic relationship in farm animals [11,15,23,24,25,26,27,28,29,30,31]. ROH can provide a novel perspective for detecting detrimental variations in the genome by assessing the inbreeding level and offering important information of genetic and demographic history [32].
In cattle, Ferencakovic et al. investigated genome-wide ROH patterns and revealed that inbreeding coefficients calculated by ROH were useful for assessing inbreeding levels [11]. Moreover, a more accurate estimation based on ROH can be obtained for inbreeding coefficients, when compared with the pedigree data [28]. Moreover, ROH can reflect the genetic relationship and inbreeding levels among groups, and affect the selection on the genomic region in cattle [30,33]. Previous studies suggested that the formation of ROH may involve the selection and some regions of ROH are related to economical important traits in farm animals [31,34,35]. The Chinese Wagyu population has been generated between Wagyu cattle and Fuzhou local cattle in China. It is well-known for its meat quality including beef flavor and tenderness. Based on this population, we have previously identified many candidate genes associated with body measurement traits and fatty acid composition [36,37]. However, there is no systematic assessment of ROH patterns and their association with important traits in Chinese Wagyu beef cattle. The aims of this study were to (i) assess genome-wide ROH patterns and inbreeding levels using a high density array; (ii) characterize profiles of ROH with different sizes and the gene contents with ROH hotspots; and (iii) identify potential ROH regions associated with economically important traits in the Chinese Wagyu beef cattle population.
2. Materials and Methods
2.1. Genotyped Samples
The BovineHD chip data of Chinese Wagyu beef cattle was extracted from our previous publication [36]. The population was established in Dalian XueLong Co. Ltd., Liaoning Province, China. Only autosomal SNP markers were analyzed for subsequent analysis. Then, individuals with missing SNPs exceeding 5% were removed. The PLINK v1.90 software was used to check the quality of the dataset [38], and quality control standards were set as follows: Minor allele frequency (MAF) > 0.05, genotype missing rate < 10%. After quality control, 503,579 SNPs from 462 individuals were used for subsequent analyses.
2.2. ROH Estimation
In this study, we used PLINK v1.90 to detect ROH on the autosomes for each individual. Since the linkage disequilibrium (LD) can cause short and common ROH throughout the genome, ROH were defined to be at least 0.5 Mb in this study. The specific parameters were as follows: 50 SNPs sliding windows slid along the chromosome to detect homozygous segments in each individual, and the sliding window allowed no more than one heterozygote. Several important parameters of defining ROH are involved: (1) The minimum length was 500 kb; (2) the proportion of homozygous overlap window was 0.05; (3) the minimum number of consecutive SNPs included in a ROH was 100; (4) the minimum SNP density was set to 50 kb/SNP; (5) the maximum gap between continuous homozygous SNPs was 100 kb; and (6) a maximum of two SNPs with missing genotypes and up to one heterozygous genotype were allowed in a ROH.
2.3. ROH Classification and Inbreeding Coefficients
The length of ROH were divided into three classes: Small (0.5−1 Mb), Medium (1−5 Mb), or Large (>5 Mb). Two methods were used to calculate the inbreeding coefficient for each individual, including: (1) FHOM was assessed based on the proportion of homozygotes using PLINK v1.90; (2) FROH was calculated as described by McQuillan et al., i.e., an individual’s summed ROH length was normalized by the length of the autosomal genome covered by SNPs [39]. Correlations of the inbreeding coefficient for two methods were estimated using the cor.test function in R v3.2.4 (https://www.r-project.org/).
2.4. QTL Regions and Genomic Regions within ROH
To explore the potential QTL related to economic traits and diseases, we adopted an approach plugged in PLINK v1.90 (http://www.cog-genomics.org/plink/1.9/) [38,40] (–homozyg -group) to estimate the consensus regions across individuals, which represent ROH pools of overlapping and potentially matching segments. Then, based on these consensus regions, we annotated QTL and reference genes, based on QTLdb and the UMD3.1 genome assembly, respectively, when ROH frequencies exceeded 10%. Function annotations of the identified genes and GO terms were further assessed using the DAVID platform [41,42].
2.5. Region Association
ROH regions were generated by aggregating overlapping CNVs (by at least 1 bp) across samples using Bedtools v2.26.0 (https://bedtools.readthedocs.io/en/latest/) [43]. The proportion of ROH coverage for each region within an individual were considered as variable. The raw phenotype was adjusted by the general linear model. The fixed effects included farm, age, gender, and generation. Eight traits, including fat coverage, slaughter weight, backfat thickness, ribeye area, carcass length, body height, chest circumference, and body length were utilized for analyses. Association analyses between ROH region and the adjusted phenotype were conducted using a linear regression, and candidate regions were considered statistically significant when p < 0.01. Accordingly, a multiple correction was carried out for each region using the q-value package [44], and the suggestive threshold for multiple tests was set to 0.1. All statistical analyses were carried out using R version 3.2.4 (https://www.r-project.org/).
2.6. Ethics Statement
An ethics statement was not required for this study. The dataset from the animals included in this study were from previous analyses that obtained specific permissions [36].
3. Results
3.1. Genomic ROH Distribution
We identified a total of 29,271 ROH in 462 Chinese Wagyu beef cattle. The longest ROH were identified on BTA10 (48.6 Mb with 10,015 SNPs), while the shortest ROH were detected on BTA3 (0.5 Mb with 130 SNPs). We found that most of the ROH (98.50%) were relatively short. In addition, we observed that the number of ROH varied across chromosomes, with the highest number of ROH on BTA1 (2463 ROH segments) and the minimum number of ROH on BTA25. In each animal, we identified an average number of 63.36 ROH segments, with an average length of 62.19 Mb, covering a relatively small portion of the genome (Supplementary Materials Figure S1).
3.2. ROH Region and Inbreeding Coefficients
ROH regions were generated by merging ROH identified across all individuals using previously published protocols, implemented in Bedtools [43]. We identified 280 nonredundant ROH regions in 462 individuals. Then, we estimated inbreeding coefficients of the studied population using two different approaches, including FHOM and FROH. The inbreeding coefficient of FHOM varied from −0.13 to 0.27, and the values of FROH varied from 0.01 to 0.33. Our results also showed that FHOM and FROH were highly correlated (r = 0.96, p < 2.2 × 10⁻⁶).
3.3. Genomic Patterns of Homozygosity
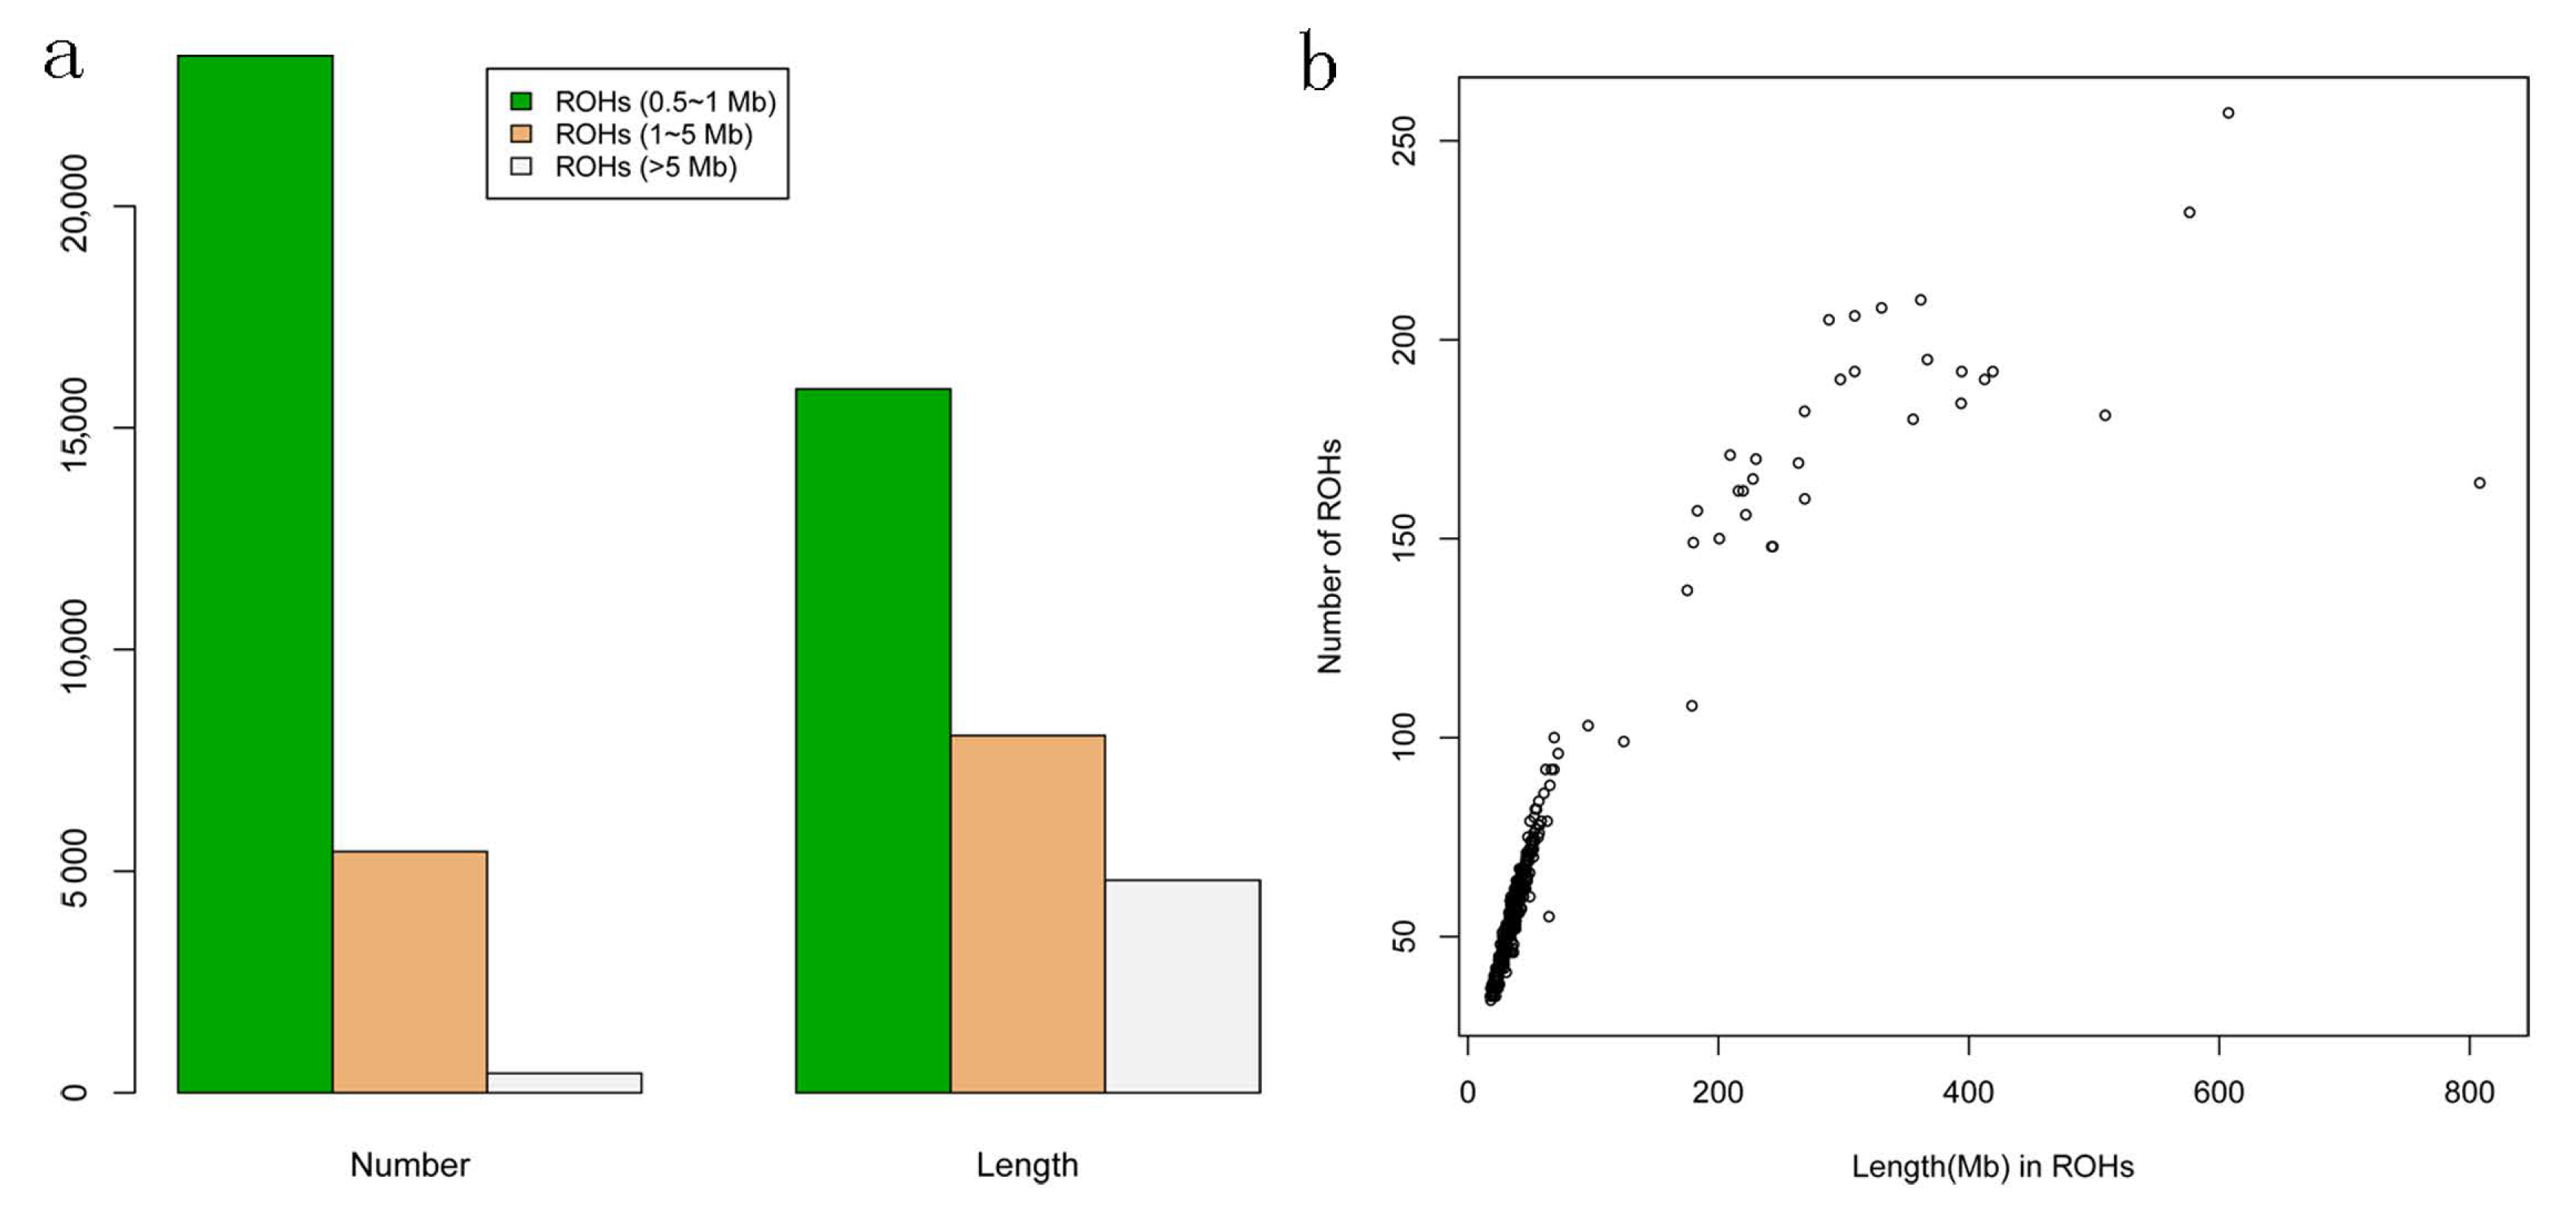
To evaluate the genomic pattern of ROH, we divided the length of ROH into three size classes: a. Small (500 kb to 1 Mb), b. Medium (1 to 5 Mb), or c. Large (>5 Mb), as described in the previous study [8]. The ROH distributions in terms of total number and length were shown in Figure 1a. We observed a total of 23,390 Small (500 kb to 1 Mb) with a total length of 15,876.92 Mb, while a total of 440 Large (>5 Mb) with a total length of 4797.37 Mb. Moreover, we found that the total lengths of ROH and the numbers of ROH were highly correlated (r = 0.91, p < 2.2 × 10⁻⁶), and the numbers of ROH were positively correlated with the lengths of autosomes (Figure 1b).
3.4. The Consensus of ROH within the Population
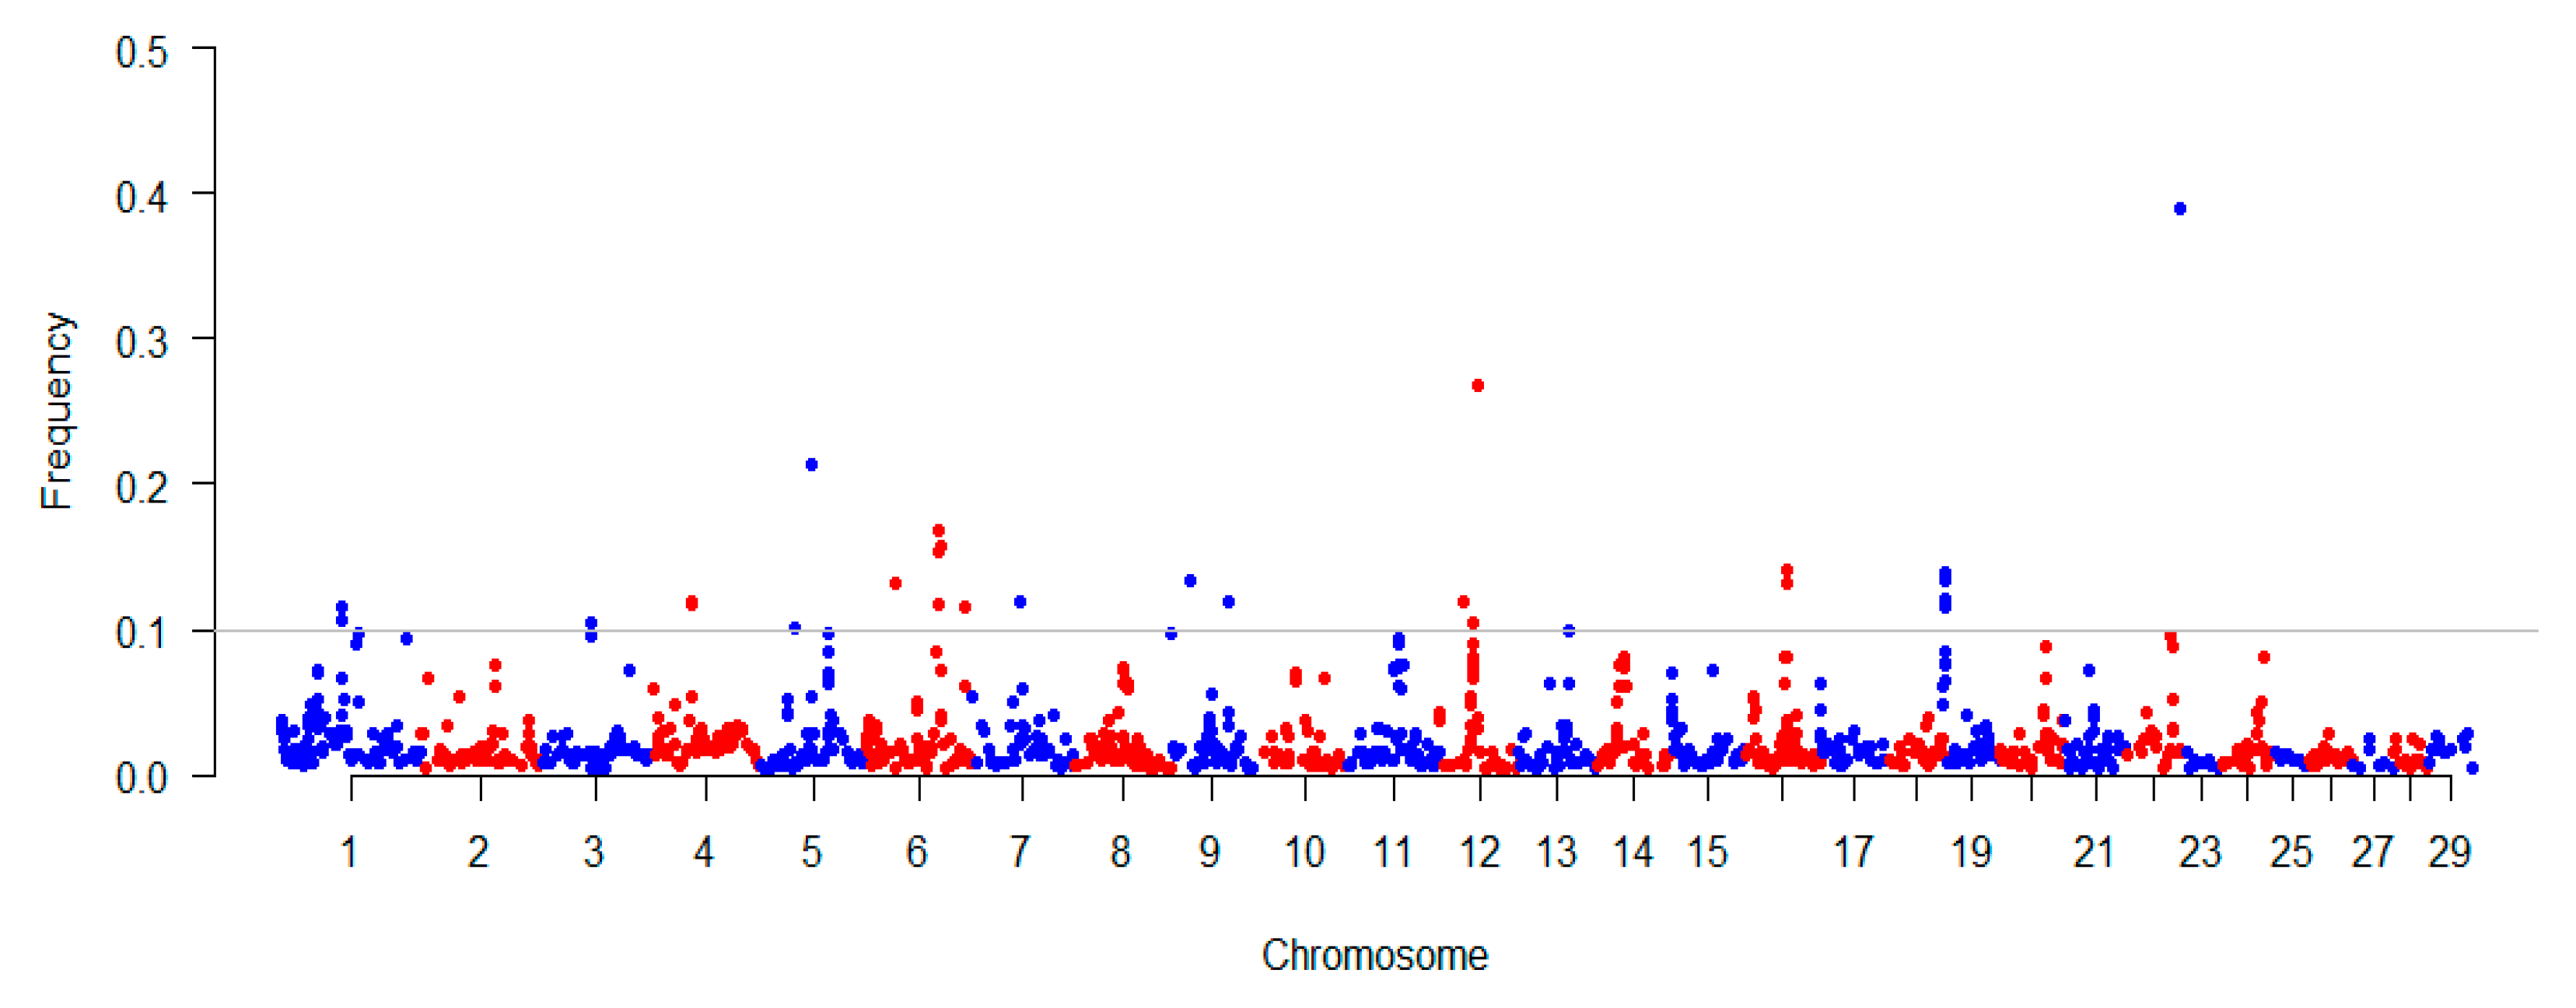
To explore the occurrence of ROH within our studied population, we estimated the consensus ROH (common ROH among the population) using the PLINK command (-homozyg -group) across the genome. We found that the distribution of consensus of ROH among different chromosomes was uneven (Figure 2). For instance, the highest frequency of ROH (~39%) was observed in the middle part of BTA23. We also found that two ROH regions with frequencies of ~26% and ~21% were located at BTA12 and BTA5, respectively. We totally detected 26 regions with the ROH frequency exceeding 10% among the studied population, and these regions overlapped with 41 RefGenes based on UMD 3.1 (Supplementary Materials Table S1). Additionally, based on the cattle QTLdb, 35 QTLs were found to be overlapped with 26 regions. Notably, we found that the high frequency regions were overlapped with QTLs, which are associated with body weight (at BTA4) and calving ease (at BTA6 and BTA23). Moreover, it was noted that these overlaps included several important QTLs for traits including gestation length (at BTA5), lean meat yield (at BTA12), and stillbirth (at BTA23) (Table 1). Among the detected 26 regions with the ROH frequency exceeding 10%, we observed 41 RefGenes, and these genes including BCKDHB, MAB21L1, SLC2A13, FGFR3, FGFRL1, CPLX1, CTNNA1, CORT, CTNNBIP1, and NMNAT1, which have been previously reported are related to several important traits including body conformation, meat quality, susceptibility, and reproductive efficiency in cattle.
3.5. ROH Region-Based Association Analysis
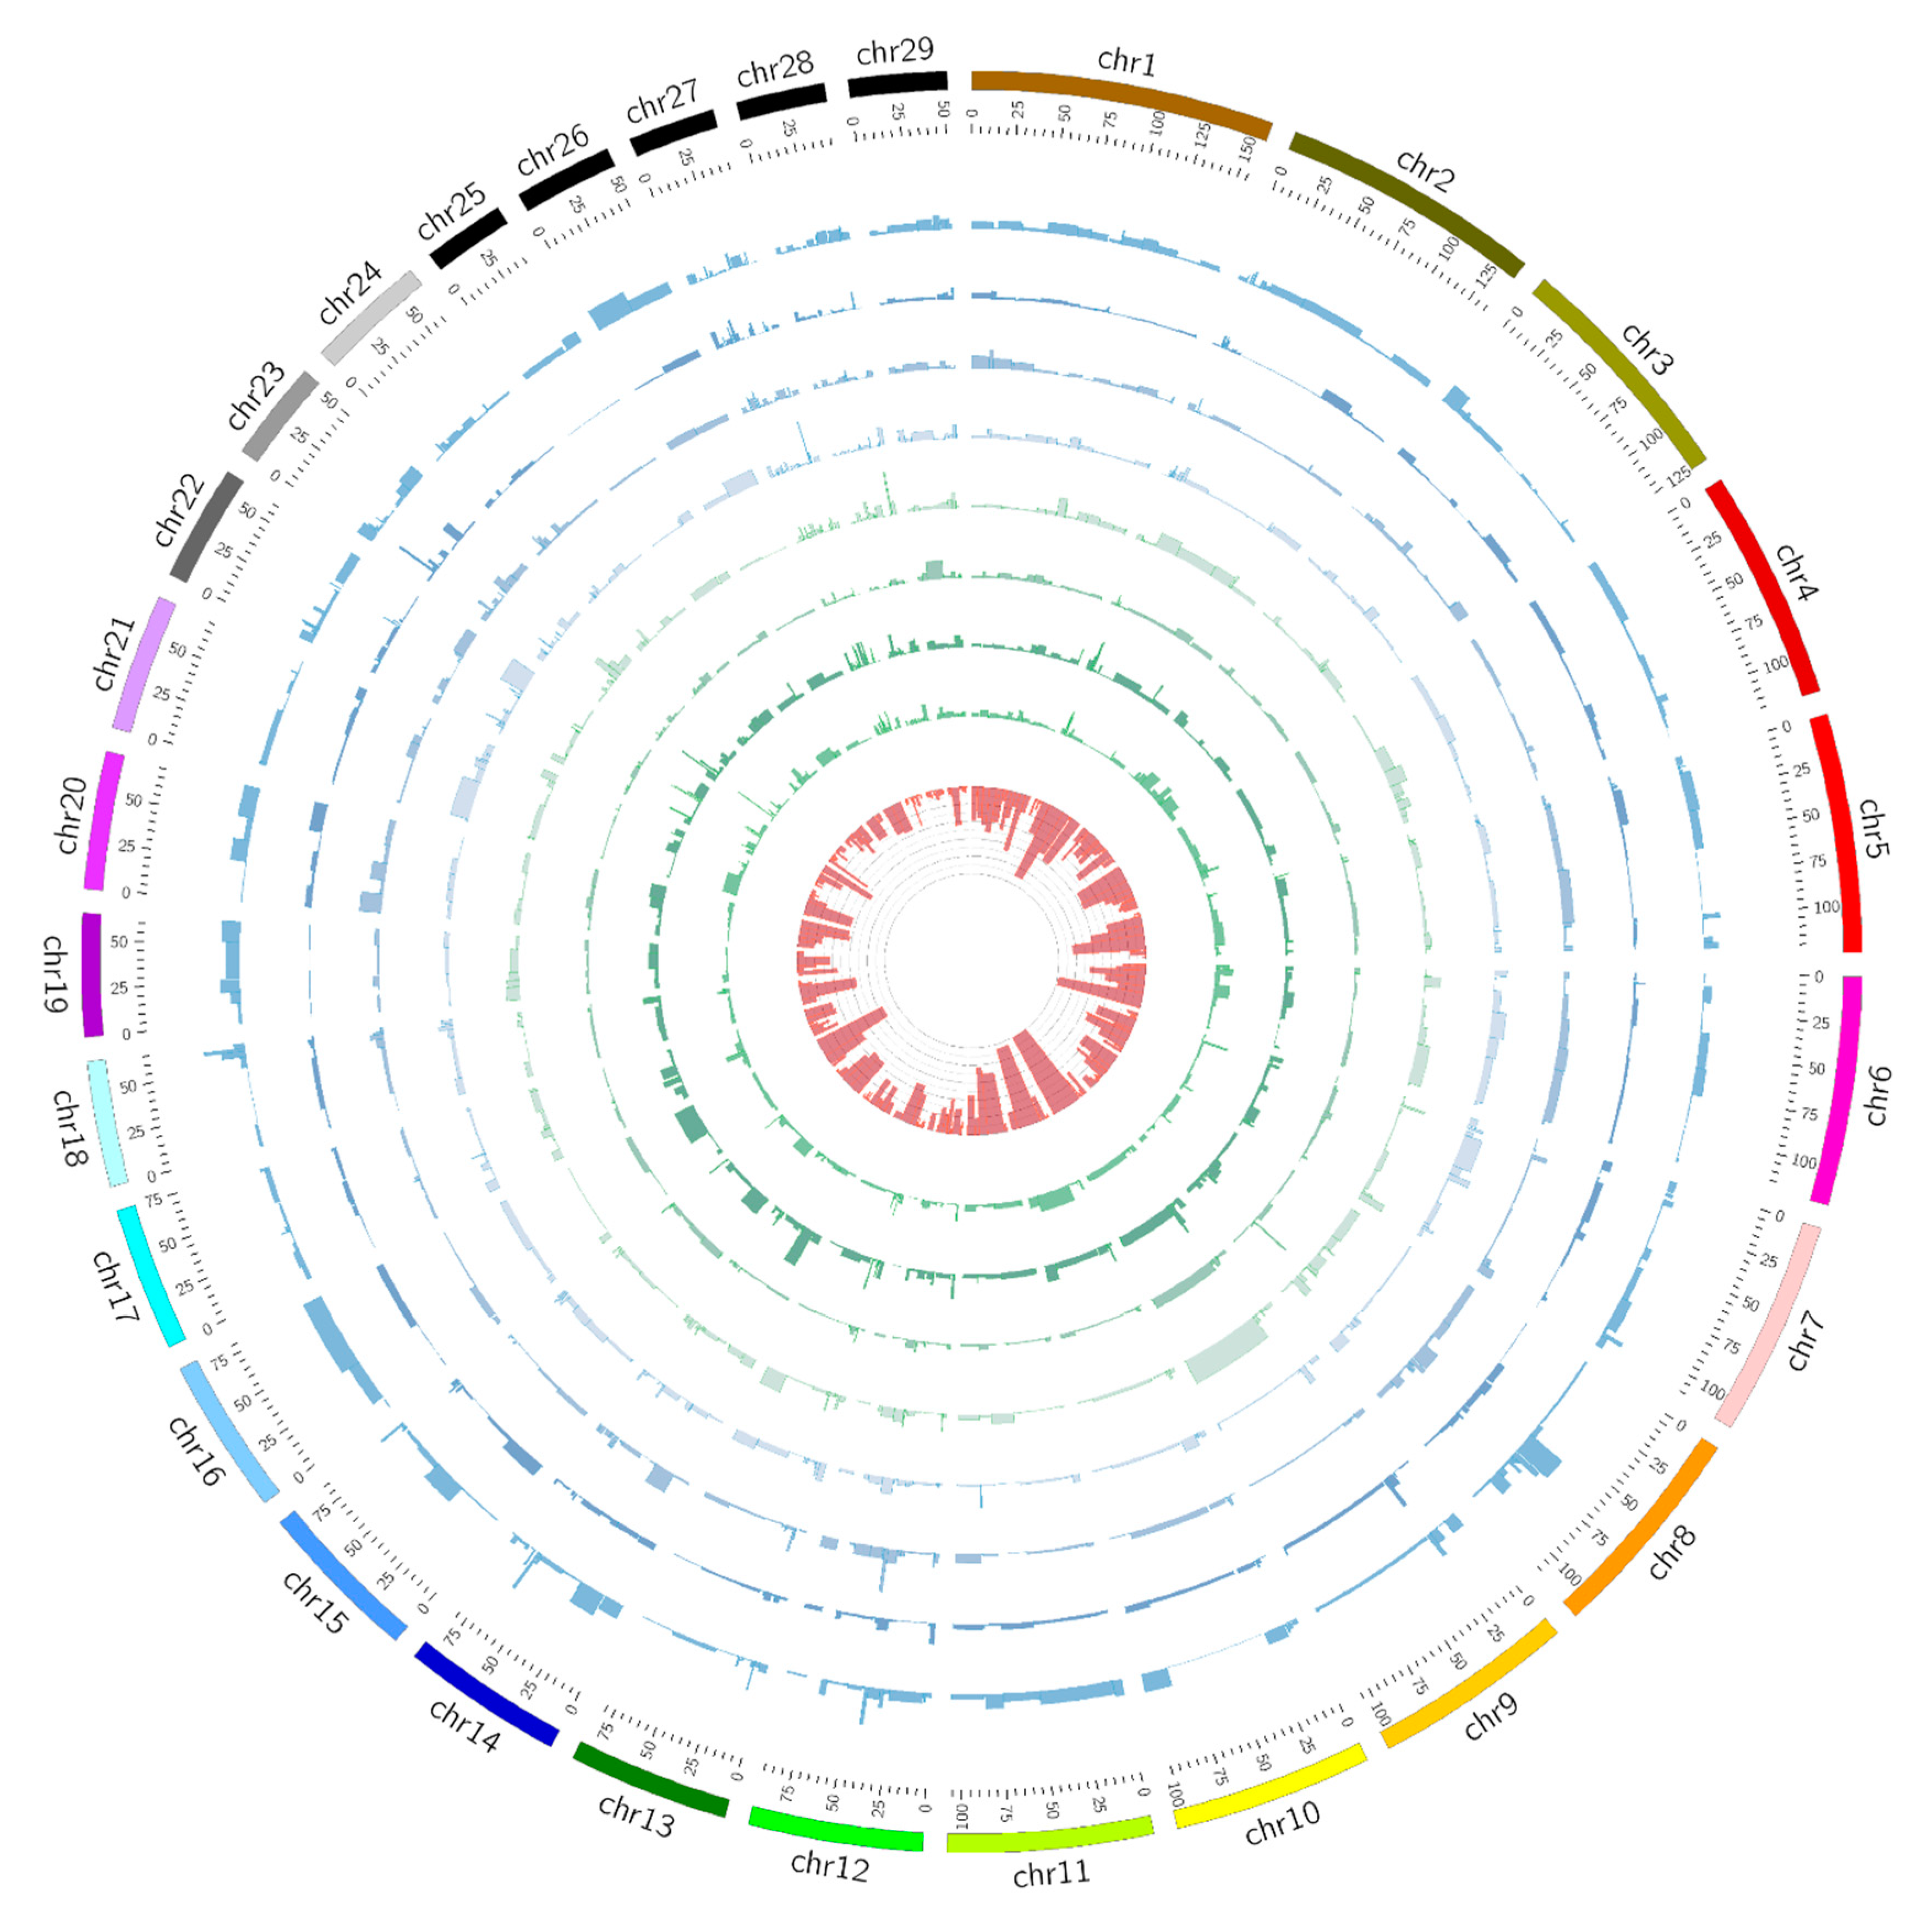
We totally identified 280 regions and performed an association analysis using a linear model for eight economical important traits. The summary statistics of ROH regions were presented in (Supplementary Materials Table S2). We generated a genome-wide ROH region plot using Circos (http://circos.ca/), which illustrated ROH regions and association results for eight traits (Figure 3). For body height, two significant ROHs were found at BTA23 and BTA7, which in turn spanned approximately 1.2 and 3.6 Mb, covering 34 and 56 candidate genes. Moreover, we identified one significant ROH (p < 0.01) for the chest circumference (BTA8, 1.9 Mb, containing 33 candidate genes), the backfat thickness (BTA27, 0.6 Mb, 22 genes), the ribeye area (BTA12, 2.1 Mb, no gene), and the fat coverage (BTA28, 1 Mb, 4 genes), respectively. In addition, we detected three significant ROH regions at BTA9, BTA23, and BTA27 for the carcass length. Among them, three regions pass the suggestive threshold (q-value < 0.1) after multiple tests with the false discovery rate (FDR). In Table 2, we presented the genomic coordinates of ROH regions and the numbers of their overlapped genes for important traits using a region-based association analysis.
4. Discussion
Many studies have explored the genome-wide ROH pattern and inbreeding depression in cattle populations [3,23,45]. Our study attempted to investigate the occurrence and distribution of ROH in Chinese Wagyu beef cattle using the high-density SNP array. A previous study suggested that high-density SNP arrays are more sensitive to determine small segments, thus Bovine SNP50K arrays may underestimate the number of fragments with the length of 1−4 Mb [46]. In the present study, our results showed that the most abundant ROH segments ranged from 0.5 to 1 Mb, which implied the power of high-density SNP arrays for identification of small ROH.
We estimated inbreeding coefficients using two methods, including FROH and FHOM. In general, the correlation between FROH and FHOM varies across studies. A previous study found that the estimated correlation ranged from 0.78 to 0.85, and FROH has a high correlation with FHOM, thus FROH can be used as an accurate estimate of the proportion of IBD (identity by descent) genomes [47]. In this study, the significant correlation (r = 0.96) was observed between FROH and FHOM, which is consistent with the previous report [48].
Many studies have shown significant differences in the total numbers and lengths of ROH in cattle, as well as the genetic relationships between individuals [9,49]. The distribution patterns of ROH count and length may indicate the differences in breed formation and recent breed management. For instance, analysis of the British Isles breeds including Hereford, Guernsey, Angus, and Jersey cattle displayed the highest total number of ROH events per animal when compared to other breeds, while African breeds displayed high variability in the total number of ROH among breeds [9]. As described by a previous study, the average total length of ROH was 106 and 371 Mb for Piedmontese and Brown cattle, and the ROH identified in dairy breeds was longer than those in beef and dual-purpose cattle [50]. Several studies suggest that the short ROH reflects ancient inbreeding, and the long ROH may reveal recent inbreeding [32,50]. Most ROH identified in our study belonged to the Short and Medium classes, and this indicated that the Chinese Wagyu population has a low inbreeding level, which was in line with its population history, i.e., this population has undergone a recent hybrid process. Since the SNP array is still limited by its probe density and non-uniform distribution across the genome, the ascertainment biases limit a formal statistical testing of the evidence for the selection of ROH. In addition, it should be noted that population bottlenecks and genetic drift can also affect the formation of ROH [8]. Moreover, a previous simulation study has tested out ROH calling programs and optimal settings [6], the ROH calling methods and their settings are still challenging [9,46]. Moreover, to avoid bias and overestimation for ROH detection using PLINK, more options should be considered carefully according to the genome coverage and the density of SNPs array [51].
Our study identified many consensuses of ROH in the Chinese Wagyu population, and the distribution of ROH across genomic regions may indicate a potential selection effect for traits. We detected 26 regions with ROH frequency exceeding 10%. Of these, we identified several genes to be related to body conformation, meat quality, susceptibility, and reproductive efficiency. For instance, BCKDHB was found to be related to the attachment width in Chinese Holstein cattle [52], and this gene was also reported to display a significant expression associated with RFI in Australian Angus cattle [53]. MAB21L1 were detected with a higher expression in longissimus lumborum and psoas major [54], which may result in distinct metabolic patterns and physiological processes for meat quality. Notably, SLC2A13 have been implicated in susceptibility to the Mycobacterium avium ssp. paratuberculosis tissue infection [55] and resistance to clinical mastitis [56]. Moreover, we observed two genes (FGFR3 and FGFRL1), which were identified as negative regulators of endochondral ossification [57] and body size [58]. Several genes, including CTNNA1, LRRTM2, SIL1, and NMNAT1, have been implicated under the selection [59,60,61,62] and overlapped with the previously identified regions of ROH [49,63]. We also found two genes (CTNNBIP1 and NMNAT1) to be related to reproductive efficiency. CTNNBIP1 has been previously reported to be related to prenatal death in Nordic Red [64] and retained placenta in Canadian Holstein dairy cows [65]. NMNAT1 was found to affect age at first calving in Nellore cattle [66], and this gene was also implicated in influencing the female reproductive efficiency in cattle [67]. In addition, we observed one gene named CPLX1 to be related to recombination features in multiple cattle breeds [68]. CPLX1 has been reported to be associated with the recombination rate in human and cattle studies, respectively [69,70].
Many studies have investigated the regions of homozygosity and their impacts on complex traits in humans [20,21,22,71]. For instance, several methods have been utilized to explore the association between ROH region and complex diseases [16,49,72,73]. In the present study, we utilized the region-based approach to investigate the candidate ROH regions associated with important traits in cattle, and we totally obtained 280 regions by merging all individual ROH events with the population. The proportion of ROH coverage varied for each individual, which may reflect the potential dosage effect of homozygosity for traits. Therefore, the association test was conducted between the proportion of ROH coverage and traits. We identified nine significant ROH regions, corresponding to 154 redundant genes. However, several regions contain many genes due to their large sizes, and it is difficult to pinpoint the precise site of associated ROH for studied traits. Therefore, a further assessment is warranted to attain reasonable statistical power by using sufficient sample numbers and developing new statistical approach.
5. Conclusions
Our study investigated the homozygosity patterns and population inbreeding level in Chinese Wagyu beef cattle. Our findings suggested that some candidate ROH regions may have potential impacts on performance for an important trait in beef cattle.
Supplementary Materials
The following are available online at https://www.mdpi.com/2076-2615/10/8/1425/s1. Table S1: The occurrence of the consensus ROH in Chinese Wagyu beef cattle, and the consensus ROH were estimated using the PLINK command (–homozyg -group) across animals; Table S2: Summary of statistics of the ROH region including chromosome, start, end, and frequency, average of length of each ROH, and average of SNP count within each region. The ROH region was generated by aggregating overlapping CNVs (by at least 1 bp) across samples using Bedtools; Figure S1: (a) The distribution of lengths of ROH in Chinese Wagyu beef cattle, (b) the distribution of total counts of ROH across chromosomes.
Author Contributions
Data curation, G.Z., T.Z. and L.X. (Lei Xu); formal analysis, G.Z., Y.L. and T.Z.; funding acquisition, L.X. (Lingyang Xu); investigation, H.G., B.Z., Z.W., L.Z., X.G., G.E.L. and L.X. (Lei Xu); methodology, G.Z. and L.X. (Lei Xu); software, G.Z.; supervision, J.L. and L.X. (Lingyang Xu); writing—original draft, G.Z.; writing—review and editing, L.X. (Lingyang Xu) and T.Z. All authors have read and agreed to the published version of the manuscript.
Funding
This study was supported by the Agricultural Science and Technology Innovation Program in the Chinese Academy of Agricultural Sciences (CAAS-ZDXT2018006, ASTIP-IAS-TS-16, and ASTIP-IAS03) and National Beef Cattle Industrial Technology System (CARS-37) for the design of the study and data collection. The project was also partly supported by the Beijing City Board of Education Foundation (PXM2016_014207_000012) for the data analysis and interpretation of the study. L.Y.X was supported by the Elite Youth Program in the Chinese Academy of Agricultural Sciences.
Acknowledgments
The authors would like to thank all staff at the cattle experimental unit in Beijing and Ulagai for the animal care and sample collection.
Conflicts of Interest
The authors declare that they have no competing interests.
Abbreviations
The following abbreviations are used in this manuscript: SNP: Single nucleotide polymorphism; ROH: Runs of homozygosity; BTA: Bos taurus autosomes; MAF: Minor allele frequency; QTL: Quantitative trait loci; LD: Linkage disequilibrium; IBD: Identity by descent; GO: Gene ontology; DAVID: The Database for Annotation, Visualization, and Integrated Discovery.
References
- Jane, G.; Morton, N.E.; Andrew, C. Extended tracts of homozygosity in outbred human populations. Hum. Mol. Genet. 2006, 15, 789–795. [Google Scholar]
- Ceballos, F.C.; Joshi, P.K.; Clark, D.W.; Ramsay, M.; Wilson, J.F. Runs of homozygosity: Windows into population history and trait architecture. Nat. Rev. Genet. 2018, 19, 220–234. [Google Scholar] [CrossRef] [PubMed]
- Peripolli, E.; Munari, D.P.; Silva, M.; Lima, A.L.F.; Irgang, R.; Baldi, F. Runs of homozygosity: Current knowledge and applications in livestock. Anim. Genet. 2017, 48, 255–271. [Google Scholar] [CrossRef]
- Falconer, D.S.; Mackay, T.F.C. Introduction to Quantitative Genetics; Pearson Education India: New Delhi, India, 1996. [Google Scholar]
- Curik, I.; Ferencakovic, M.; Sölkner, J. Inbreeding and runs of homozygosity: A possible solution to an old problem. Livest. Sci. 2014, 166, 26–34. [Google Scholar] [CrossRef]
- Howrigan, D.P.; Simonson, M.A.; Keller, M.C. Detecting autozygosity through runs of homozygosity: A comparison of three autozygosity detection algorithms. BMC Genom. 2011, 12. [Google Scholar] [CrossRef] [Green Version]
- Broman, K.W.; Weber, J.L. Long homozygous chromosomal segments in reference families from the centre d’Étude du Polymorphisme Humain. Am. J. Hum. Genet. 1999, 65, 1493–1500. [Google Scholar] [CrossRef] [Green Version]
- Bosse, M.; Megens, H.J.; Madsen, O.; Paudel, Y.; Frantz, L.A.; Schook, L.B.; Crooijmans, R.P.; Groenen, M.A. Regions of homozygosity in the porcine genome: Consequence of demography and the recombination landscape. PLoS Genet 2012, 8, e1003100. [Google Scholar] [CrossRef] [Green Version]
- Purfield, D.C.; Berry, D.P.; McParland, S.; Bradley, D.G. Runs of homozygosity and population history in cattle. BMC Genet. 2012, 13. [Google Scholar] [CrossRef] [Green Version]
- Herrero-Medrano, J.M.; Megens, H.-J.; Groenen, M.A.; Ramis, G.; Bosse, M.; Pérez-Enciso, M.; Crooijmans, R.P. Conservation genomic analysis of domestic and wild pig populations from the Iberian Peninsula. BMC Genet. 2013, 14, 106. [Google Scholar] [CrossRef] [Green Version]
- Ferencakovic, M.; Hamzic, E.; Gredler, B.; Curik, I.; Sölkner, J. Runs of homozygosity reveal genome-wide autozygosity in the Austrian Fleckvieh cattle. Agric. Conspec. Sci. 2011, 76, 325–329. [Google Scholar]
- Ferenčaković, M.; Hamzić, E.; Gredler, B.; Solberg, T.; Klemetsdal, G.; Curik, I.; Sölkner, J. Estimates of autozygosity derived from runs of homozygosity: Empirical evidence from selected cattle populations. J. Anim. Breed. Genet. 2013, 130, 286–293. [Google Scholar] [CrossRef] [PubMed]
- Kim, E.-S.; Cole, J.B.; Huson, H.; Wiggans, G.R.; Van Tassell, C.P.; Crooker, B.A.; Liu, G.; Da, Y.; Sonstegard, T.S. Effect of artificial selection on runs of homozygosity in US Holstein cattle. PLoS ONE 2013, 8, e80813. [Google Scholar]
- Karimi, S. Runs of Homozygosity Patterns in Taurine and Indicine Cattle Breeds. Master’s Thesis, BOKU-University of Natural Resources and Life Sciences, Vienna, Austria, 1 July 2013. [Google Scholar]
- Zavarez, L.B.; Utsunomiya, Y.T.; Carmo, A.S.; Neves, H.H.; Carvalheiro, R.; Ferenčaković, M.; Pérez O’Brien, A.M.; Curik, I.; Cole, J.B.; Van Tassell, C.P. Assessment of autozygosity in Nellore cows (Bos indicus) through high-density SNP genotypes. Front. Genet. 2015, 6. [Google Scholar] [CrossRef] [PubMed] [Green Version]
- Zhang, Q.; Guldbrandtsen, B.; Bosse, M.; Lund, M.S.; Sahana, G. Runs of homozygosity and distribution of functional variants in the cattle genome. BMC Genom. 2015, 16. [Google Scholar] [CrossRef] [Green Version]
- Bosse, M.; Megens, H.J.; Madsen, O.; Crooijmans, R.P.M.A.; Cara, M.A.R.D. Using genome-wide measures of coancestry to maintain diversity and fitness in endangered and domestic pig populations. Genome Res. 2015, 25. [Google Scholar] [CrossRef] [Green Version]
- Vine, A.E.; McQuillin, A.; Bass, N.J.; Pereira, A.; Kandaswamy, R.; Robinson, M.; Lawrence, J.; Anjorin, A.; Sklar, P.; Gurling, H.M.D. No evidence for excess runs of homozygosity in bipolar disorder. Psychiatr. Genet. 2009, 19, 165–170. [Google Scholar] [CrossRef]
- Szpiech, Z.A.; Xu, J.; Pemberton, T.J.; Peng, W.; Zöllner, S.; Rosenberg, N.A.; Li, J.Z. Long runs of homozygosity are enriched for deleterious variation. Am. J. Hum. Genet. 2013, 93, 90–102. [Google Scholar] [CrossRef] [Green Version]
- Lencz, T.; Lambert, C.; DeRosse, P.; Burdick, K.E.; Morgan, T.V.; Kane, J.M.; Kucherlapati, R.; Malhotra, A.K. Runs of homozygosity reveal highly penetrant recessive loci in schizophrenia. Proc. Natl. Acad. Sci. USA 2007, 104, 19942–19947. [Google Scholar] [CrossRef] [Green Version]
- Yang, H.C.; Chang, L.C.; Liang, Y.J.; Lin, C.H.; Wang, P.L. A genome-wide homozygosity association study identifies runs of homozygosity associated with rheumatoid arthritis in the human major histocompatibility complex. PLoS ONE 2012, 7, e34840. [Google Scholar] [CrossRef] [Green Version]
- Nalls, M.A.; Guerreiro, R.J.; Simon-Sanchez, J.; Bras, J.T.; Traynor, B.J.; Gibbs, J.R.; Launer, L.; Hardy, J.; Singleton, A.B. Extended tracts of homozygosity identify novel candidate genes associated with late-onset Alzheimer’s disease. Neurogenetics 2009, 10, 183–190. [Google Scholar] [CrossRef] [Green Version]
- Bjelland, D.; Weigel, K.; Vukasinovic, N.; Nkrumah, J. Evaluation of inbreeding depression in Holstein cattle using whole-genome SNP markers and alternative measures of genomic inbreeding. J. Dairy Sci. 2013, 96, 4697–4706. [Google Scholar] [CrossRef] [PubMed]
- Gomez-Raya, L.; Rodríguez, C.; Barragán, C.; Silió, L. Genomic inbreeding coefficients based on the distribution of the length of runs of homozygosity in a closed line of Iberian pigs. Genet. Sel. Evol. 2015, 47. [Google Scholar] [CrossRef] [PubMed] [Green Version]
- Manunza, A.; Noce, A.; Serradilla, J.M.; Goyache, F.; Martínez, A.; Capote, J.; Delgado, J.V.; Jordana, J.; Muñoz, E.; Molina, A.; et al. A genome-wide perspective about the diversity and demographic history of seven Spanish goat breeds. Genet. Sel. Evol. 2016, 48, 52. [Google Scholar] [CrossRef] [Green Version]
- Mastrangelo, S.; Sardina, M.T.; Tolone, M.; Di Gerlando, R.; Sutera, A.M.; Fontanesi, L.; Portolano, B. Genome-wide identification of runs of homozygosity islands and associated genes in local dairy cattle breeds. Animal 2018, 12, 2480–2488. [Google Scholar] [CrossRef] [PubMed]
- Silió, L.; Rodríguez, M.C.; Fernández, A.; Barragán, C.; Benítez, R.; Óvilo, C.; Fernández, A.I. Measuring inbreeding and inbreeding depression on pig growth from pedigree or SNP-derived metrics. J. Anim. Breed. Genet. 2013, 130, 349–360. [Google Scholar] [CrossRef] [PubMed]
- Keller, M.C.; Visscher, P.M.; Goddard§, M.E. Quantification of inbreeding due to distant ancestors and its detection using dense single nucleotide polymorphism data. Genetics 2011, 189, 237–249. [Google Scholar] [CrossRef] [Green Version]
- Kim, E.S.; Sonstegard, T.S.; Tassell, C.P.V.; Wiggans, G.; Rothschild, M.F. The relationship between runs of homozygosity and inbreeding in jersey cattle under selection. PLoS ONE 2015, 10, e0129967. [Google Scholar] [CrossRef] [Green Version]
- Upadhyay, M.R.; Chen, W.; Lenstra, J.A.; Goderie, C.R.J.; MacHugh, D.E.; Park, S.D.E.; Magee, D.A.; Matassino, D.; Ciani, F.; Megens, H.-J. Genetic origin, admixture and population history of aurochs (Bos primigenius) and primitive European cattle. Heredity 2017. [Google Scholar] [CrossRef]
- Mastrangelo, S.; Ciani, E.; Sardina, M.T.; Sottile, G.; Portolano, B. Runs of homozygosity reveal genome-wide autozygosity in Italian sheep breeds. Anim. Genet. 2018, 49, 1. [Google Scholar] [CrossRef] [Green Version]
- Kirin, M.; McQuillan, R.; Franklin, C.S.; Campbell, H.; McKeigue, P.M.; Wilson, J.F. Genomic runs of homozygosity record population history and consanguinity. PLoS ONE 2010, 5, e13996. [Google Scholar] [CrossRef] [Green Version]
- Reverter, A.; Porto-Neto, L.R.; Fortes, M.R.S.; Kasarapu, P.; Lehnert, S.A. Genomic inbreeding depression for climatic adaptation of tropical beef cattle. J. Anim. Sci. 2017, 95, 3809–3821. [Google Scholar] [CrossRef]
- Pryce, J.E.; Haile-Mariam, M.; Goddard, M.E.; Hayes, B.J. Identification of genomic regions associated with inbreeding depression in Holstein and Jersey dairy cattle. Genet. Sel. Evol. 2014, 46. [Google Scholar] [CrossRef] [Green Version]
- Metzger, J.; Karwath, M.; Tonda, R.; Beltran, S.; Agueda, L.; Gut, M.; Gut, I.G.; Distl, O. Runs of homozygosity reveal signatures of positive selection for reproduction traits in breed and non-breed horses. BMC Genom. 2015, 16. [Google Scholar] [CrossRef] [PubMed] [Green Version]
- Wang, Z.; Zhu, B.; Niu, H.; Zhang, W.; Xu, L.; Xu, L.; Chen, Y.; Zhang, L.; Gao, X.; Gao, H. Genome wide association study identifies SNPs associated with fatty acid composition in Chinese Wagyu cattle. J. Anim. Sci. Biotechnol. 2019. [Google Scholar] [CrossRef] [PubMed] [Green Version]
- Wang, Z.; Ma, H.; Xu, L.; Zhu, B.; Liu, Y.; Bordbar, F.; Chen, Y.; Zhang, L.; Gao, X.; Gao, H.; et al. Genome-Wide scan identifies selection signatures in Chinese Wagyu cattle using a high-density SNP array. Animals (Basel) 2019, 9, 6. [Google Scholar] [CrossRef] [PubMed]
- Chang, C.C.; Chow, C.C.; Tellier, L.C.; Vattikuti, S.; Purcell, S.M.; Lee, J.J. Second-generation PLINK: Rising to the challenge of larger and richer datasets. GigaScience 2015, 4. [Google Scholar] [CrossRef] [PubMed]
- McQuillan, R.; Leutenegger, A.L.; Abdel-Rahman, R.; Franklin, C.S.; Pericic, M.; Barac-Lauc, L.; Smolej-Narancic, N.; Janicijevic, B.; Polasek, O.; Tenesa, A.; et al. Runs of homozygosity in European populations. Am. J. Hum. Genet. 2008, 83, 359–372. [Google Scholar] [CrossRef] [Green Version]
- Purcell, S.; Neale, B.; Todd-Brown, K.; Thomas, L.; Ferreira, M.A.; Bender, D.; Maller, J.; Sklar, P.; de Bakker, P.I.; Daly, M.J.; et al. PLINK: A tool set for whole-genome association and population-based linkage analyses. Am. J. Hum. Genet. 2007, 81, 559–575. [Google Scholar] [CrossRef] [Green Version]
- Huang, D.W.; Sherman, B.T.; Lempicki, R.A. Bioinformatics enrichment tools: Paths toward the comprehensive functional analysis of large gene lists. Nucleic Acids Res. 2009, 37, 1–13. [Google Scholar] [CrossRef] [Green Version]
- Huang, D.W.; Sherman, B.T.; Lempicki, R.A. Systematic and integrative analysis of large gene lists using DAVID bioinformatics resources. Nat. Protoc. 2009, 4, 44–57. [Google Scholar] [CrossRef]
- Quinlan, A.R.; Hall, I.M. BEDTools: A flexible suite of utilities for comparing genomic features. Bioinformatics 2010, 26, 841–842. [Google Scholar] [CrossRef] [PubMed] [Green Version]
- Storey, J.D.; Tibshirani, R. Statistical significance for genomewide studies. Proc. Natl. Acad. Sci. USA 2003, 100, 9440–9445. [Google Scholar] [CrossRef] [PubMed] [Green Version]
- Ferencakovic, M.; Solkner, J.; Kaps, M.; Curik, I. Genome-wide mapping and estimation of inbreeding depression of semen quality traits in a cattle population. J. Dairy Sci. 2017, 100, 4721–4730. [Google Scholar] [CrossRef] [PubMed]
- Ferencakovic, M.; Solkner, J.; Curik, I. Estimating autozygosity from high-throughput information: Effects of SNP density and genotyping errors. Genet. Sel. Evol. 2013, 45. [Google Scholar] [CrossRef] [PubMed] [Green Version]
- Peripolli, E.; Stafuzza, N.B.; Munari, D.P.; Lima, A.L.F.; Irgang, R.; Machado, M.A.; Panetto, J.; Ventura, R.V.; Baldi, F.; da Silva, M. Assessment of runs of homozygosity islands and estimates of genomic inbreeding in Gyr (Bos indicus) dairy cattle. BMC Genom. 2018, 19, 34. [Google Scholar] [CrossRef] [PubMed]
- Zhang, Q.; Calus, M.P.; Guldbrandtsen, B.; Lund, M.S.; Sahana, G. Estimation of inbreeding using pedigree, 50k SNP chip genotypes and full sequence data in three cattle breeds. BMC Genet. 2015, 16. [Google Scholar] [CrossRef] [Green Version]
- Xu, L.; Zhao, G.; Yang, L.; Zhu, B.; Chen, Y.; Zhang, L.; Gao, X.; Gao, H.; Liu, G.E.; Li, J. Genomic patterns of homozygosity in chinese local cattle. Sci. Rep. 2019, 9, 16977. [Google Scholar] [CrossRef] [Green Version]
- Marras, G.; Gaspa, G.; Sorbolini, S.; Dimauro, C.; Ajmone-Marsan, P.; Valentini, A.; Williams, J.L.; Macciotta, N.P. Analysis of runs of homozygosity and their relationship with inbreeding in five cattle breeds farmed in Italy. Anim. Genet. 2015, 46, 110–121. [Google Scholar] [CrossRef] [PubMed]
- Meyermans, R.; Gorssen, W.; Buys, N.; Janssens, S. How to study runs of homozygosity using PLINK? A guide for analyzing medium density SNP data in livestock and pet species. BMC Genom. 2020, 21, 94. [Google Scholar] [CrossRef]
- Yan, Z.; Wang, Z.; Zhang, Q.; Yue, S.; Yin, B.; Jiang, Y.; Shi, K. Identification of whole-genome significant single nucleotide polymorphisms in candidate genes associated with body conformation traits in Chinese Holstein cattle. Anim. Genet. 2020, 51, 141–146. [Google Scholar] [CrossRef] [Green Version]
- de Las Heras-Saldana, S.; Clark, S.A.; Duijvesteijn, N.; Gondro, C.; van der Werf, J.H.J.; Chen, Y. Combining information from genome-wide association and multi-tissue gene expression studies to elucidate factors underlying genetic variation for residual feed intake in Australian Angus cattle. BMC Genom. 2019, 20, 939. [Google Scholar] [CrossRef] [PubMed] [Green Version]
- Yu, Q.; Tian, X.; Sun, C.; Shao, L.; Li, X.; Dai, R. Comparative transcriptomics to reveal muscle-specific molecular differences in the early postmortem of Chinese Jinjiang yellow cattle. Food Chem. 2019, 301, 125262. [Google Scholar] [CrossRef] [PubMed]
- Kiser, J.N.; Neupane, M.; White, S.N.; Neibergs, H.L. Identification of genes associated with susceptibility to Mycobacterium avium ssp. paratuberculosis (Map) tissue infection in Holstein cattle using gene set enrichment analysis–SNP. Mamm. Genome 2017, 29, 1–11. [Google Scholar] [CrossRef] [PubMed]
- Cai, Z.; Guldbrandtsen, B.; Lund, M.S.; Sahana, G. Prioritizing candidate genes post-GWAS using multiple sources of data for mastitis resistance in dairy cattle. BMC Genom. 2018. [Google Scholar] [CrossRef] [PubMed]
- Usha, A.P.; Lester, D.H.; Williams, J.L. Dwarfism in Dexter cattle is not caused by the mutations in FGFR3 responsible for achondroplasia in humans. Anim. Genet. 1997, 28, 55–57. [Google Scholar] [CrossRef] [PubMed]
- Zhang, X.; Chu, Q.; Guo, G.; Dong, G.; Wang, Y. Genome-wide association studies identified multiple genetic loci for body size at four growth stages in Chinese Holstein cattle. PLoS ONE 2017, 12, e0175971. [Google Scholar] [CrossRef]
- Shen, J.; Hanif, Q.; Cao, Y.; Yu, Y.; Lei, C.; Zhang, G.; Zhao, Y. Whole genome scan and selection signatures for climate adaption in yanbian cattle. Front. Genet. 2020, 11, 94. [Google Scholar] [CrossRef]
- Peripolli, E.; Metzger, J.; de Lemos, M.V.A.; Stafuzza, N.B.; Kluska, S.; Olivieri, B.F.; Feitosa, F.L.B.; Berton, M.P.; Lopes, F.B.; Munari, D.P.; et al. Autozygosity islands and ROH patterns in Nellore lineages: Evidence of selection for functionally important traits. BMC Genom. 2018, 19, 680. [Google Scholar] [CrossRef]
- Qanbari, S.; Gianola, D.; Hayes, B.; Schenkel, F.; Miller, S.; Moore, S.; Thaller, G.; Simianer, H. Application of site and haplotype-frequency based approaches for detecting selection signatures in cattle. BMC Genom. 2011, 12, 318. [Google Scholar] [CrossRef] [Green Version]
- Randhawa, I.A.; Khatkar, M.S.; Thomson, P.C.; Raadsma, H.W. Composite selection signals can localize the trait specific genomic regions in multi-breed populations of cattle and sheep. BMC Genet. 2014, 15, 34. [Google Scholar] [CrossRef] [Green Version]
- Szmatoła, T.; Gurgul, A.; Ropka-Molik, K.; Jasielczuk, I.; Ząbek, T.; Bugno-Poniewierska, M. Characteristics of runs of homozygosity in selected cattle breeds maintained in Poland. Livest. Sci. 2016, 188, 72–80. [Google Scholar]
- Wu, X.; Mesbah-Uddin, M.; Guldbrandtsen, B.; Lund, M.S.; Sahana, G. Novel haplotypes responsible for prenatal death in Nordic Red and Danish Jersey cattle. J. Dairy Sci. 2020, 103, 4570–4578. [Google Scholar] [CrossRef] [PubMed] [Green Version]
- Guarini, A.R.; Lourenco, D.A.L.; Brito, L.F.; Sargolzaei, M.; Baes, C.F.; Miglior, F.; Misztal, I.; Schenkel, F.S. Genetics and genomics of reproductive disorders in Canadian Holstein cattle. J. Dairy Sci. 2019, 102, 1341–1353. [Google Scholar] [CrossRef] [PubMed] [Green Version]
- Mota, R.R.; Guimarães, S.E.F.; Fortes, M.R.S.; Hayes, B.; Silva, F.F.; Verardo, L.L.; Kelly, M.J.; de Campos, C.F.; Guimarães, J.D.; Wenceslau, R.R.; et al. Genome-wide association study and annotating candidate gene networks affecting age at first calving in Nellore cattle. J. Anim. Breed. Genet. 2017, 134, 484–492. [Google Scholar] [CrossRef] [PubMed] [Green Version]
- Khatkar, M.; Randhawa, I.; Raadsma, H. Meta-assembly of genomic regions and variants associated with female reproductive efficiency in cattle. Livest. Sci. 2014, 166, 144–157. [Google Scholar] [CrossRef]
- Shen, B.; Jiang, J.; Seroussi, E.; Liu, G.E.; Ma, L. Characterization of recombination features and the genetic basis in multiple cattle breeds. BMC Genom. 2018, 19, 304. [Google Scholar] [CrossRef]
- Ma, L.; O’Connell, J.R.; VanRaden, P.M.; Shen, B.; Padhi, A.; Sun, C.; Bickhart, D.M.; Cole, J.B.; Null, D.J.; Liu, G.E.; et al. Cattle sex-specific recombination and genetic control from a large pedigree analysis. PLoS Genet. 2015, 11, e1005387. [Google Scholar] [CrossRef] [Green Version]
- Kong, A.; Thorleifsson, G.; Gudbjartsson, D.F.; Masson, G.; Sigurdsson, A.; Jonasdottir, A.; Walters, G.B.; Jonasdottir, A.; Gylfason, A.; Kristinsson, K.T.; et al. Fine-scale recombination rate differences between sexes, populations and individuals. Nature 2010, 467, 1099–1103. [Google Scholar] [CrossRef]
- Ku, C.S.; Naidoo, N.; Teo, S.M.; Pawitan, Y. Regions of homozygosity and their impact on complex diseases and traits. Hum. Genet. 2011, 129, 1–15. [Google Scholar] [CrossRef]
- Goszczynski, D.; Molina, A.; Terán, E.; Morales-Durand, H.; Ross, P.; Cheng, H.; Giovambattista, G.; Demyda-Peyrás, S. Runs of homozygosity in a selected cattle population with extremely inbred bulls: Descriptive and functional analyses revealed highly variable patterns. PLoS ONE 2018, 13, e0200069. [Google Scholar] [CrossRef] [Green Version]
- Szmatola, T.; Gurgul, A.; Jasielczuk, I.; Zabek, T.; Ropka-Molik, K.; Litwinczuk, Z.; Bugno-Poniewierska, M. A comprehensive analysis of runs of homozygosity of eleven cattle breeds representing different production types. Animals (Basel) 2019, 9, 12. [Google Scholar] [CrossRef] [PubMed] [Green Version]
Figure 1.
(a) The total numbers and lengths of runs of homozygosity (ROH) of three classes including Small (0.5 to 1 Mb), Medium (1 to 5 Mb), and Large (>5 Mb) classes. (b) Correlation of total ROH numbers and lengths. The ROH number (y-axis) is plotted against the ROH length (x-axis, i.e., the length of Mb covered by ROH) in each individual.

Figure 2.
Distribution characteristics of ROH on chromosomes in Chinese Wagyu beef cattle. The horizontal axis is the single nucleotide polymorphism (SNP) position, which is ordered by the physical location of the genome; the vertical axis is the ROH frequency at this SNP. The horizontal line in the graph is where the ROH frequency equals 10%.

Figure 3.
Circos plot illustrating ROH regions and association results for eight traits. Association significance test for each of ROH was plotted based on −log10 (p) values using histograms within the gray inner circle. The ROH frequency was determined by occurrence of ROH with each region within the population. The estimated frequency values were shown in the innermost circle. The outermost circle displays the cattle autosomes. The circles from inside to outside represent association results for body height, body length, chest circumference, fat coverage, backfat thickness, ribeye area, carcass length, and slaughter weight, respectively.


Table 1.
Summary of the identified ROHs and their overlapping candidate quantitative trait loci (QTLs) and related traits. The consensus ROH across the population were sorted by the frequency of ROH, and only ROH regions overlapped with QTLs (frequency exceeding 10%) were listed.
Table 1.
Summary of the identified ROHs and their overlapping candidate quantitative trait loci (QTLs) and related traits. The consensus ROH across the population were sorted by the frequency of ROH, and only ROH regions overlapped with QTLs (frequency exceeding 10%) were listed.
| BTA | ROH-BP1 | ROH-BP2 | Frequency | QTL-Trait |
|---|---|---|---|---|
| 3 | 54343407 | 54587989 | 0.103896 | Muscularity |
| 4 | 45165956 | 45671950 | 0.119048 | Body weight |
| 5 | 41528650 | 41751952 | 0.101732 | Body weight gain |
| 5 | 58882448 | 59612173 | 0.214286 | Gestation length |
| 6 | 33396376 | 33893065 | 0.132035 | Body weight |
| 6 | 80611486 | 80829499 | 0.116883 | Calving ease, facial pigmentation |
| 6 | 108950251 | 109844160 | 0.114719 | Average daily gain, body depth, rump width, calving ease, stillbirth, Stature, strength |
| 9 | 20006714 | 20523719 | 0.134199 | Scrotal circumference |
| 12 | 25997505 | 26782472 | 0.119048 | Lean meat yield |
| 16 | 43814264 | 44664782 | 0.132035 | Subcutaneous fat |
| 23 | 578821 | 1017051 | 0.38961 | Calving ease, stillbirth |
Table 2.
Summary of the associated ROH regions for important traits using a region-based association analysis.
Table 2.
Summary of the associated ROH regions for important traits using a region-based association analysis.
| Chr | ROH_Left | ROH_Right | Length | ROH Count | Frequency | p-Value | q-Value | Traits | Count of Genes within ROH Region |
|---|---|---|---|---|---|---|---|---|---|
| 7 | 12040557 | 15624148 | 3583591 | 33 | 0.071429 | 0.00835 | 0.6002 | Body height | 56 |
| 8 | 75872649 | 77763089 | 1890440 | 33 | 0.071429 | 0.000273 | 0.0765 | Chest circumference | 33 |
| 9 | 19317920 | 21949240 | 2631320 | 106 | 0.229437 | 0.001418 | 0.1985 | Carcass length | 4 |
| 12 | 39693710 | 41835914 | 2142204 | 95 | 0.205628 | 0.001376 | 0.3851 | Ribeye area | 0 |
| 23 | 7177811 | 8413638 | 1235827 | 6 | 0.012987 | 0.000394 | 0.0995 | Body height | 34 |
| 23 | 7177811 | 8413638 | 1235827 | 6 | 0.012987 | 0.000171 | 0.0480 | Carcass length | 34 |
| 27 | 36930734 | 37557668 | 626934 | 3 | 0.006494 | 0.000614 | 0.1564 | Backfat thickness | 9 |
| 27 | 13977424 | 15257628 | 1280204 | 5 | 0.010823 | 0.009542 | 0.8906 | Carcass length | 13 |
| 28 | 40886907 | 41889675 | 1002768 | 4 | 0.008658 | 0.001264 | 0.3540 | Fat coverage | 4 |
© 2020 by the authors. Licensee MDPI, Basel, Switzerland. This article is an open access article distributed under the terms and conditions of the Creative Commons Attribution (CC BY) license (http://creativecommons.org/licenses/by/4.0/).
Share and Cite
MDPI and ACS Style
Zhao, G.; Zhang, T.; Liu, Y.; Wang, Z.; Xu, L.; Zhu, B.; Gao, X.; Zhang, L.; Gao, H.; Liu, G.E.; et al. Genome-Wide Assessment of Runs of Homozygosity in Chinese Wagyu Beef Cattle. Animals 2020, 10, 1425. https://doi.org/10.3390/ani10081425
AMA Style
Zhao G, Zhang T, Liu Y, Wang Z, Xu L, Zhu B, Gao X, Zhang L, Gao H, Liu GE, et al. Genome-Wide Assessment of Runs of Homozygosity in Chinese Wagyu Beef Cattle. Animals. 2020; 10(8):1425. https://doi.org/10.3390/ani10081425
Chicago/Turabian StyleZhao, Guoyao, Tianliu Zhang, Yuqiang Liu, Zezhao Wang, Lei Xu, Bo Zhu, Xue Gao, Lupei Zhang, Huijiang Gao, George E. Liu, and et al. 2020. "Genome-Wide Assessment of Runs of Homozygosity in Chinese Wagyu Beef Cattle" Animals 10, no. 8: 1425. https://doi.org/10.3390/ani10081425
Note that from the first issue of 2016, this journal uses article numbers instead of page numbers. See further details here.