Article

Identification of Wheat Cultivars for Low Nitrogen Tolerance Using Multivariable Screening Approaches

1
Division of Crop Improvement, ICAR-Indian Institute of Wheat and Barley Research, Karnal 132001, India
2
Division of Plant and Crop Science, School of Biosciences, University of Nottingham, Sutton Bonington, Loughborough, Leicestershire LE12 5RD, UK
*
Author to whom correspondence should be addressed.
Agronomy 2020, 10(3), 417; https://doi.org/10.3390/agronomy10030417
Submission received: 27 January 2020 / Revised: 11 March 2020 / Accepted: 13 March 2020 / Published: 19 March 2020

Abstract

:
A set of thirty-six wheat cultivars were grown for two consecutive years under low and high nitrogen conditions. The interactions of cultivars with different environmental factors were shown to be highly significant for most of the studied traits, suggesting the presence of wider genetic variability which may be utilized for the genetic improvement of desired trait(s). Three cultivars, i.e., RAJ 4037, DBW 39 and GW 322, were selected based on three selection indices, i.e., tolerance index (TOL), stress susceptibility index (SSI), and yield stability index (YSI), while two cultivars, HD 2967 and MACS 6478, were selected based on all four selection indices which were common in both of the study years. According to Kendall’s concordance coefficient, the consistency of geometric mean productivity (GMP) was found to be highest (0.778), followed by YSI (0.556), SSI (0.472), and TOL (0.200). Due to the high consistency of GMP followed by YSI and SSI, the three selection indices could be utilized as a selection tool in the identification of high-yielding genotypes under low nitrogen conditions. The GMP and YSI selection indices had a positive and significant correlation with grain yield, whereas TOL and SSI exhibited a significant but negative correlation with grain yield under both high and low nitrogen conditions in both years. The common tolerant genotypes identified through different selection indices could be utilized as potential donors in active breeding programs to incorporate the low nitrogen tolerant genes to develop high-yielding wheat varieties for low nitrogen conditions. The study also helps in understanding the physiological basis of tolerance in high-yielding wheat genotypes under low nitrogen conditions.

1. Introduction

Wheat is an important cereal crop, accounting for about 20 percent of the calories consumed by the human population across the globe. Global wheat production was 749 million tons in 2016 [1], while that of India recorded an all-time high of 102.19 million tons in 2019. The rate of global yield increase in wheat is declining, and is currently about 1.1 percent per annum [2]. Nitrogen is the most important macronutrient for plants, but is costly to supply and can adversely affect the environment. Up to 50%–70% of nitrogen applied to the wheat cropping system is not utilized by the plants [3]; moreover, globally, wheat accounts for nearly one-third of crop fertilizer use. India is the second largest consumer of nitrogenous fertilizers in the world after China [1]. The development of wheat genotypes with high nitrogen use-efficiency would be of economic benefit to farmers, and help to reduce environmental pollution associated with the excessive use of nitrogen fertilizers [4,5]. Wheat breeders acknowledge the need to raise yield potential while decreasing the environmental impact of fertilizers by developing N-efficient genotypes [6]. The higher yield levels achieved during the green revolution were mainly due to the increased harvest index and the use of nitrogenous fertilizers. Furthermore, to increase the grain yield of wheat crop, the aboveground biomass should be increased without compromising the harvest index. This implies an additional requirement of nitrogen (N) to support the increased photosynthesis and biomass production [7,8].
The N use-efficiency can be defined as the grain dry matter yield divided by the supply of available N from the soil and fertilizer [9]. The existence of genotype × nitrogen supply interaction for nitrogen use-efficiency could be exploited to develop high N use efficient genotypes [10,11,12,13]. However, genotypes that perform well under optimal and/or high nitrogen conditions might not perform well under low N conditions. Therefore, selection under low as well as high N environments is of paramount importance to identify high nitrogen use-efficient and/or tolerant wheat genotypes, with the potential to perform well under both high and low N conditions. The characterization of traits contributing to improved nitrogen use-efficiency could be an important resource to the breeding community across the globe [5,11,12]. Earlier studies conducted at different nitrogen levels indicated that genetic progress had been achieved under both high and low N conditions, but that the rate of genetic progress was higher for the former [4,14]. Genetic studies in wheat indicated the existence of variability for nitrogen use efficiency in terms of N uptake as well as N utilization efficiency [4,11,14,15]. Once the traits that improve the efficiency of genotypes to give stable and superior performance under low N conditions are identified, it is necessary to quantify the magnitude and direction of correlation with grain yield and yield components traits. The concept of genetic correlation between other traits and yield has been reported in wheat [15,16,17], which enable breeders to select efficient genotypes under low input conditions through indirect selection. Heritability within each production system and the magnitude of genotype × production system interactions are very important when comparing direct or indirect selection strategies for low N input farming systems [18].
Various selection indices (SSI, GMP, YSI and TOL) under stress and non-stress environments have been reported for the identification of tolerant genotypes. The SSI relies on identifying only those genotypes which show minimum reduction under stress compared to non-stress environments [19]. Thus, the SSI helps us to identify tolerant genotypes under stress conditions, but it may fail to identify genotypes with both high yield and stress tolerance. YSI is the other yield-based method of evaluating the stability of genotype under both stress and non-stress conditions [20]. The various selection indices are based on either the tolerance or susceptibility of genotypes, and have been reported in wheat [21,22]. The development of high nitrogen use-efficient wheat genotypes would be both an economical and an environmentally-friendly approach. Therefore, it is necessary to develop genotypes with high yield potential and better disease resistance coupled with high nitrogen use-efficiency. The identification of tolerant genotypes under low N conditions through various selection indices is both a timely and efficient approach for the development of high nitrogen use efficient genotypes in different breeding programs across the globe.
Therefore, the present study aimed: (1) To identify the tolerant genotypes under low N conditions by different selection indices (TOL, SSI, GMP and YSI), and their physiological basis of tolerance to low N stress. (2) To estimate the effects of low N on grain yield, yield components, and physiological traits. (3) To identify the most consistent selection index under low N conditions. (4) To estimate correlations of different kinds of yield-based selection indices, yield components, and physiological traits with grain yield under high and low N conditions.

2. Materials and Methods

2.1. Plant Materials and Field Experiments

The field experiments were conducted at research farm of the ICAR-Indian Institute of Wheat and Barley Research, Karnal (29°43′ N, 76°48′ E, 245 m ASL), India in 2014 and 2015. The previous crop was rice in both years. A set of 36 elite wheat cultivars were evaluated under both high N (HN) and low N (LN) field conditions to identify the better performing cultivars in low N conditions. The experimental material of the present study is a representative set of the most widely grown cultivars in the major wheat growing regions, and most of the genotypes are selections from CIMMYT material. All the selected cultivars were semi-dwarf except for two (KH 65 and BH 1146). Out of 36 cultivars, 32 belong to bread wheat, while the remaining four were durum wheat cultivars (MACS 2496, MACS 3125, HI 8498 and PDW 314). The information regarding the pedigree, year of release, and other details of the 36 tested wheat cultivars is given in Table 1. Each cultivar was planted in a four-row plot of 2.5 m length, maintaining a row spacing of 23 cm and 10 cm between plants within a row, following a randomized complete block design with three replications. The sowing of both the experiments (high and low N) was done in the second fortnight of November, and harvesting in the months of April–May during both the 2014 and 2015 seasons. The experimental field was prepared, and seed was placed manually in the furrows.
In the present study, two level of N fertilizer treatment, i.e., high and low N, were applied. For the high N fertilizer, N amount was estimated according to previous knowledge of the field, taking into consideration the soil N availability. The soil type of the experimental field was sandy loam and the organic matter content was 0.57%, whereas the residual N of the field was 150 kg/ha. In the high N (HN) experiment, the dose of N:P:K fertilizers was applied in the ratio of 150:60:40 per hectare as granules of urea, triple super phosphate (TSP), and muriate of potash (MOP), respectively. The full dose of P and K, and 1/2 N fertilizers was applied as a basal dose at the time of field preparation, and the remaining 1/2N was top dressed in two splits at the crown root initiation stage (CRI), i.e., at 21 days after sowing (DAS), and the booting stage. i.e., at 45 DAS. In the low N (LN) experiment, the recommended doses of P and K fertilizers and zero N were applied at the time of field preparation. In each year, the crop was irrigated at an interval of 21 days, typically at four stages (CRI, booting, pre-heading and grain filling stages) or when irrigation was needed to avoid water stress. Standard agronomic practices were followed to raise the healthy crop. The crop was harvested above ground level carefully at maturity as full plot size for each cultivars (100% dry matter above ground level used as total biological yield) in both high and low N conditions in both years, and threshed using a power threshing machine.

2.2. Phenotypic Evaluation of Yield, Yield Components, and Physiological Traits

Observations were recorded on plant height (PH), fertile shoots m−1 (FS), 1000-kernel weight (TKW), grain number/spike (GNPS), grain weight/spike (GWPS), biological yield/plot (BY), harvest index (HI), and grain yield/plot (GY) under high and low N conditions. Plant height (cm) was measured from base of soil surface to tip of spike excluding awns of five randomly selected plants from each plot. Fertile shoots/m (tillers with fully fertile spike) were counted from one meter-long segment of a single row of four row plots from each genotype. A random sample of 1000 grains was counted with the help of automatic seed counter from each plot, weighed in a weighing balance, and recorded as TKW (g). Grain number/spike (five spikes selected randomly, harvested, threshed in bulk, and total grains of five spikes was counted using a seed counter and averaged to get the grain number/spike). Five spikes were selected randomly, harvested, threshed in bulk and weight by weighing balance, and averaged to get grain weight/spike. Total grain yield/plot is divided by a total biological yield/plot and multiplied by 100 to obtain the harvest index. Biological yield/plot was measured as total dry matter harvested above ground level from the four-row plot of 2.5m length, and grain yield as the total grains harvested from the same.
Three observations were recorded for the physiological traits, viz., normalized difference vegetation index (NDVI), canopy temperature (CT), chlorophyll content (CHL), ratio of variable fluorescence and maximum fluorescence (FV/FM), ratio of variable fluorescence and initial fluorescence (FV/FO) in both high N and low N conditions at 50% heading stage between 11AM to 2PM, when the temperature is maximum during the day. FV/FM and FV/FO were recorded with Opti sciences (OS-30p), CHL was recorded with SPAD-502plus, NDVI with Green seeker trembler, and CT with the help of HTC MT4 instrument.

2.3. Evaluation of Various Yield Based Selection Indices

To identify the best performing genotypes under stress condition, several yield-based selection indices have been proposed on the basis of mathematical relationships between stress and normal conditions [23]. In the present study, four kinds of yield-based selection indices viz., tolerance index (TOL), stress susceptibility index (SSI), geometric mean productivity (GMP), and yield stability index (YSI), were used to identify the tolerant genotypes and/or best performing genotypes under HN and LN conditions in wheat.
  • Percentage reduction of grain yield (PRGY) = (Yield under high N − Yield under low N)/Yield under high N × 100 [24].
  • Tolerance index (TOL) = (Yp − Ys) [25].
  • Stress susceptible index (SSI) = (1 − Ys/Yp)/SI [19].
    Where Stress intensity (SI) was calculated as 1 − (Xs/Xp) and SSI value < 1 is more resistant to stress condition
  • Geometric mean productivity (GMP) = (Ys × Yp)0.5 [26].
  • Yield Stability Index (YSI) = Ys/Yp [20].
    Where Yp and Ys are the grain yield of a cultivar under high N and low N conditions, respectively. The Xp and Xs represents mean grain yield of all cultivars under high N and low N conditions, respectively.

2.4. Statistical Analysis

The data was subjected to combined analysis of variance (ANOVA) using GenStat 18th Edition (VSN International Ltd., Hemel Hempstead, UK). The estimates of genetic variability and biplot procedures for genetic correlation coefficients among yield components, selection indices, and also with grain yield under both high N and low N conditions were calculated with adjusted mean. The biplots were generated from the first two PCAs, without scaling, centering (2), or singular value partitioning (SVP) (2) using the factoextra R package. In the PCA biplot, a vector drawn from the origin to each trait facilitates the visualization of interrelationships among traits. The vector length of the trait measures the magnitude of its effects on the yield. The polygon view of the GT biplot allowed us to visualize the interaction pattern between genotypes and traits, as long as the biplot provides a sufficient amount of total variation. The correlation coefficient between any two traits is approximated by the cosine of the angle between their vectors. On this premise, two traits are positively correlated if the angle between their vectors is an acute angle (<90°), while they are negatively correlated if their vectors are an obtuse angle (>90°) [27].

3. Results

3.1. Analysis of Variance and Genotype × Year Interaction

The pooled analysis of variance is presented in Table 2. The genotype effect is significant for all the studied traits, whereas genotype × year effect was significant for all the studied traits except GWPS, CHL, GY under high N and FS, GWPS, CT under low N conditions. Year effect was significant for FS, GWPS, BY, HI, NDVI, CT under high N whereas for TKW, GNPS, HI, CT, CHL and GY under low N conditions. The average reduction in GY under low N compared to high N conditions across the cultivars was 46.01% in 2014, 42.72% in 2015, with an average reduction across the years of 44.31%. The cultivars showed minimum reduction percentage in GY under low N was HD2967 (31.44%), MACS 6478 (31.57%), MACS 3125 (32.31%), NIAW 301 (33.16) and DBW 39 (33.44%) whereas maximum reduction was observed in KH 65 (70.63%), NW 1067 (70.67%), DBW 88 (70.26%), KRL 1-4 (68.24%) and RAJ 4238 (60.02%) in 2014. During 2015 the minimum reduction was observed in HD 2967 (31.00%), MACS 6478 (31.15%), MACS 3125 (32.52%), CBW 38 (35.02) and GW 322 (34.11%), whereas maximum reduction was observed in DBW 88 (66.72%), WH 1021 (66.06%), KH 65 (57.94%), KRL 1-4 (55.85%) and RAJ 4238 (55.84%). Based on the minimum reduction percentage in GY across the years, the most tolerant cultivars were HD 2967 (31.19%), MACS 6478 (31.38%), MACS 3125 (32.43%), GW 322 (34.63%) and CBW 38 (34.72%), while, based on maximum reduction in GY, the most susceptible cultivars were DBW 88 (68.45%), KH 65 (63.53%), WH 1021 (62.65%), KRL 1-4 (61.85%) and NW 1067 (61.52%) under low N conditions (Table S3). The high tolerance of HD 2967, MACS 6478, MACS 3125 and low tolerance of DBW 88, KH 65 and KRL 1-4 in low N conditions was observed in both years (2014 and 2015).
The genotypes with the minimum reduction percentages are considered to be tolerant to the low nitrogen condition, whereas maximum reduction genotypes are sensitive to the low nitrogen conditions. Therefore, tolerant genotypes could be potential donors to develop high nitrogen use efficient wheat varieties.
However, some cultivars changed their ranking; for example, DBW 17 dropped from 3rd under HN to 8th under LN conditions in 2014, and from 4th under HN to 8th under LN conditions in 2015; DBW 88 also changed, ranking relatively higher under LN than HN conditions. The differential ranking of genotypes shows the crossover type of genotype × year effects. BY was relatively higher under LN conditions for HD2967 (−19.50%), MACS 6478 (−17.64%) and MACS 3125 (−11.35%) as compared to DBW88 (−28.19%) and KRL1-4 (−42.64%). These responses partly explain the GY responses to N treatments. There was also a large range of responses amongst cultivars to low N supply for TKW from −2.63 to +29.82%; for GNPS from −16 to +31.74% and for GWPS from −16 to +34.46% (Table S2). Averaging the two years, there was a positive and significant linear relationship among the cultivars between BY and GY under HN (R2 = 0.584) and LN (R2 = 0.200) conditions (Figure 1A,B). There was a significant positive correlation between GY under HN and GY under LN conditions in both years (2013–2014: r = 0.81, p < 0.000; 2014–2015: r = 0.79, p < 0.000). Although the relationships were positive and significant, the relationship between BY and GY under high N was moderate, while a relatively weaker relationship was observed between BY and GY under LN.

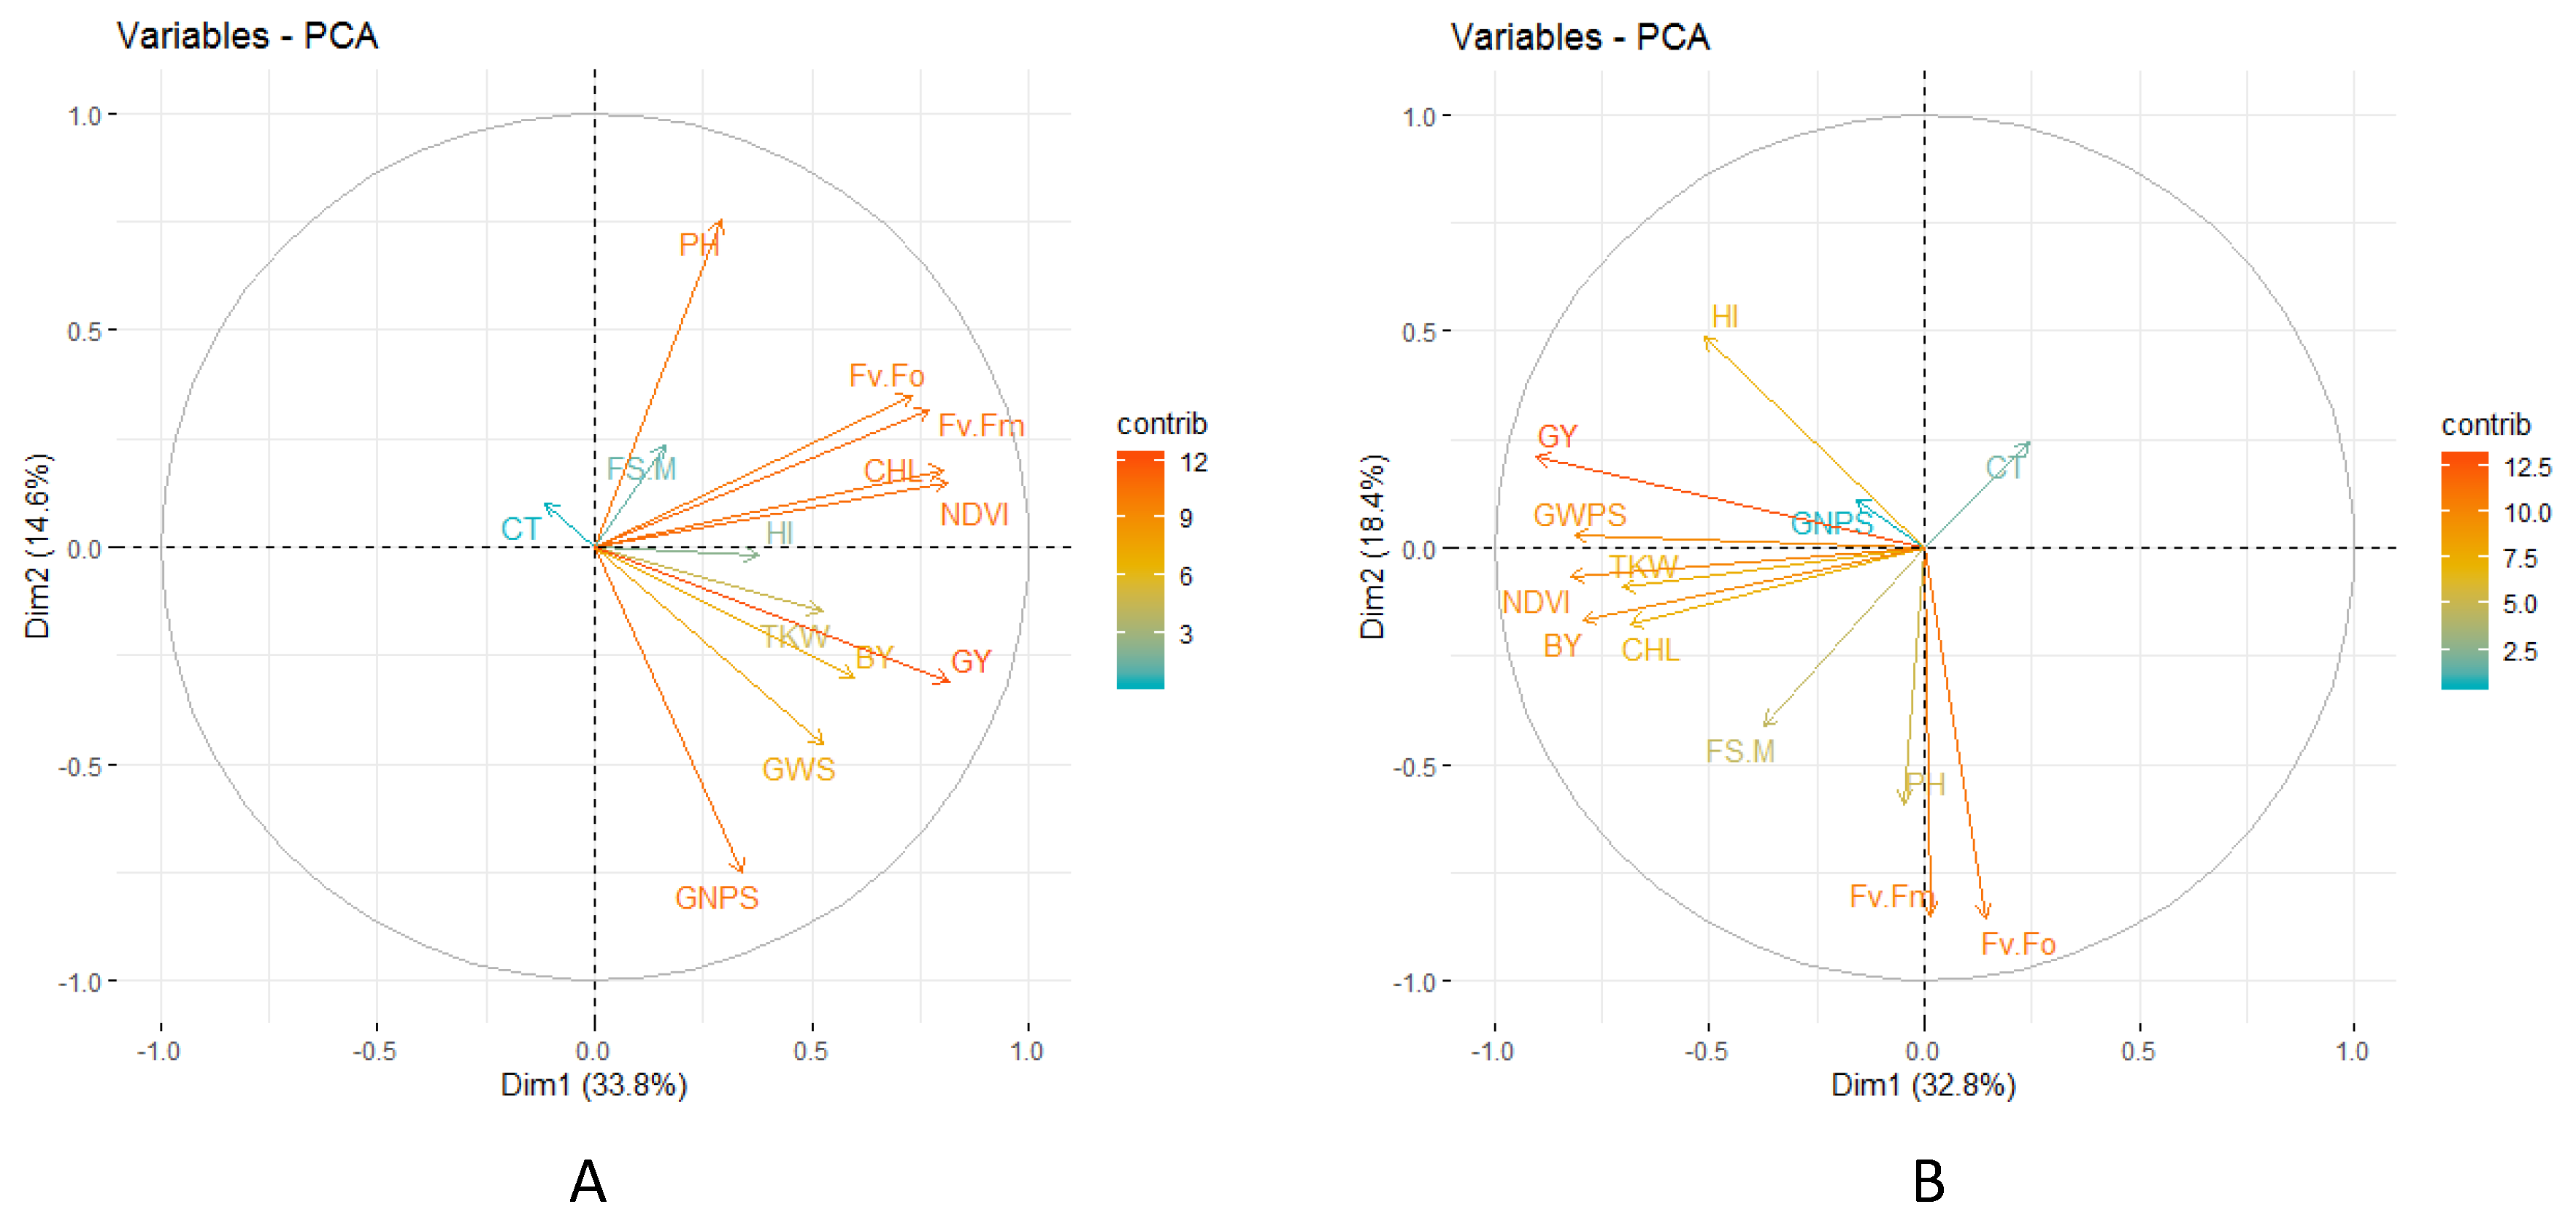
3.2. Phenotypic Variability

The phenotypic variability expressed by mean and range for GY and its components under both HN and LN conditions is presented in Table 3. A wide range of variation was observed in the breeding material for all the studied traits under both HN and LN conditions.

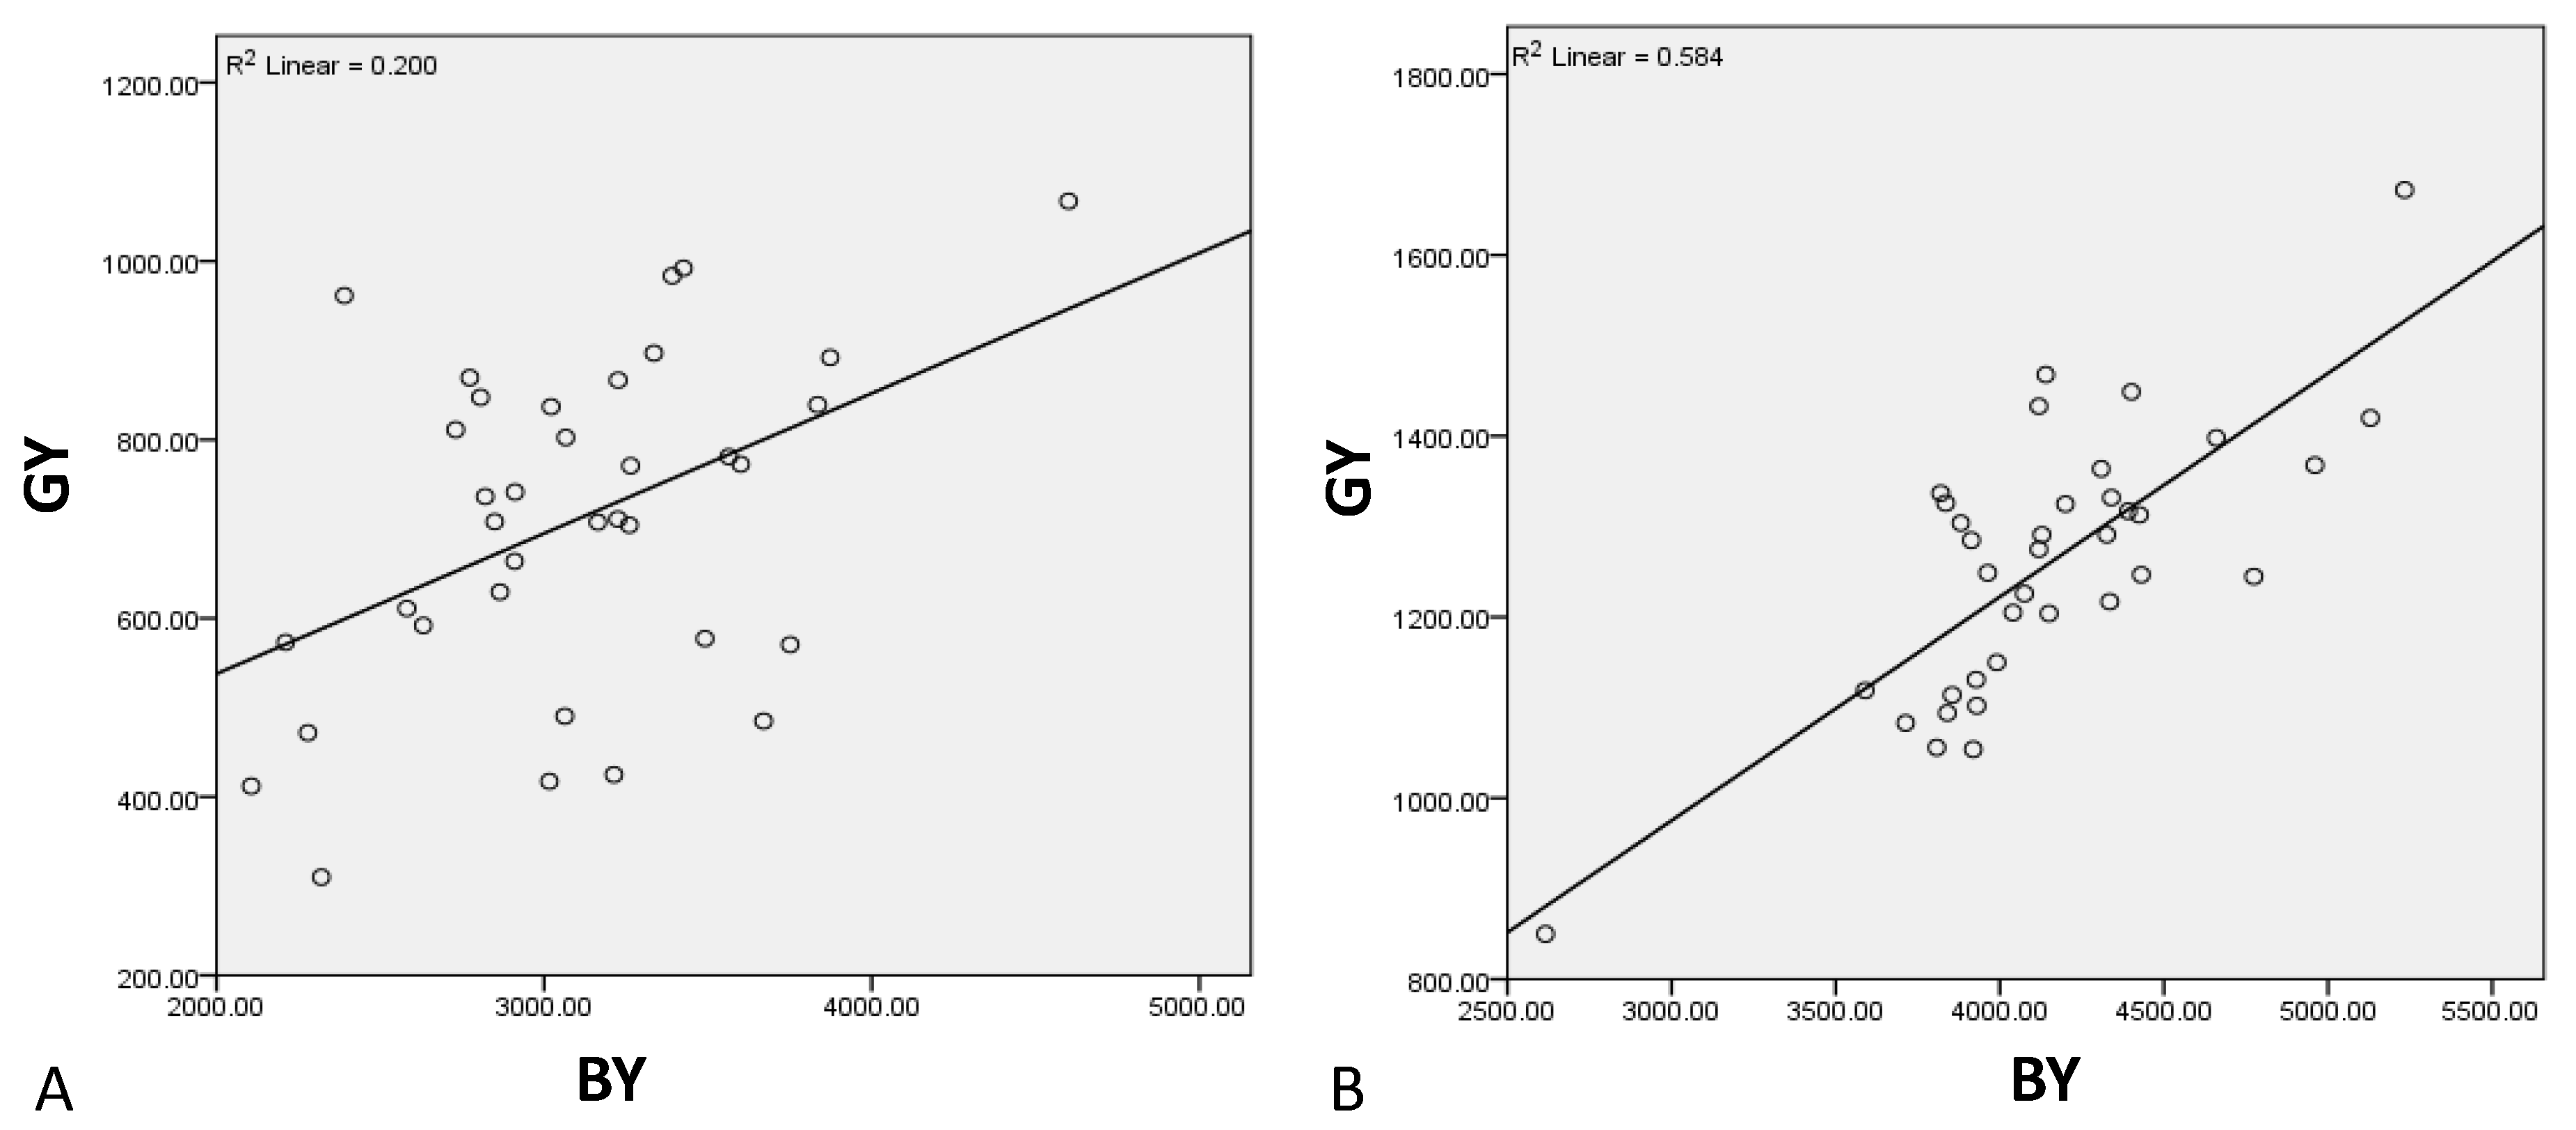
3.3. Yield Performance under High N and Low N Conditions

The grain yields of all 36 wheat cultivars under HN and LN conditions are presented (Table S3). Based on yields during in 2014, the top five highest yielding cultivars under HN conditions were DPW 621-50, followed by MACS 6478, MACS 3125, HD 2967 and DBW 17, whereas KH 65, MACS 2496, KRL 19, KRL 1-4 and DBW 14 were five lowest yielding cultivars. Under LN condition, the five highest yielding cultivars were DPW 621-50, followed by MACS 6478, MACS 3125, HD 2967 and DBW 39, whereas the five lowest yielding cultivars were KH 65, followed by KRL 1-4, DBW 88, NW 1067 and MACS 2496. In 2015, five highest yielding cultivars under HN conditions were DPW 621-50, followed by MACS 6478, MACS 3125, HD 2967 and BH 1146, whereas KH 65, followed by KRL 19, GW 322, WH 1021 and MACS 2496 were five lowest yielding cultivars. Under LN condition, DPW 621-50, followed by MACS 6478, MACS 3125, DBW 17 and BH 1146, whereas the lowest yielding cultivars were KH 65, followed by WH 1021, DBW 88, KRL 1-4, Raj 4238, KRL 19, GW 322, and MACS 2496. The best performing cultivars were DPW 621-50, MACS 3125, DBW 17, MACS 6478, and BH 1146 under HN condition, whereas DPW 621-50, MACS 6478, MACS 3125, HD 2967 and BH 1146 under LN conditions. Cultivars DPW 621-50, followed by MACS 6478, MACS 3125 and BH 1146 were best performing cultivars with respect to GY under both conditions (HN and LN) in both years.

3.4. Correlation Studies

Correlation coefficients were estimated between grain yield, yield components, and physiological traits under both HN and LN conditions (Figure 2 and Figure 3, Table S4). Significant and positive correlations were recorded for TKW, GWPS, BY, HI, NDVI, and CHL with GY under both HN and LN conditions in both years, except HI (Table S5). Two physiological traits, viz., FV/FM and FV/FO, were significantly and positively correlated with GY under HN condition, whereas negatively correlated with GY under LN conditions in both years. The GNPS had positive and significant correlation with GY under HN whereas it had positive but non-significant correlation with GY under LN conditions in both years (Table S5).

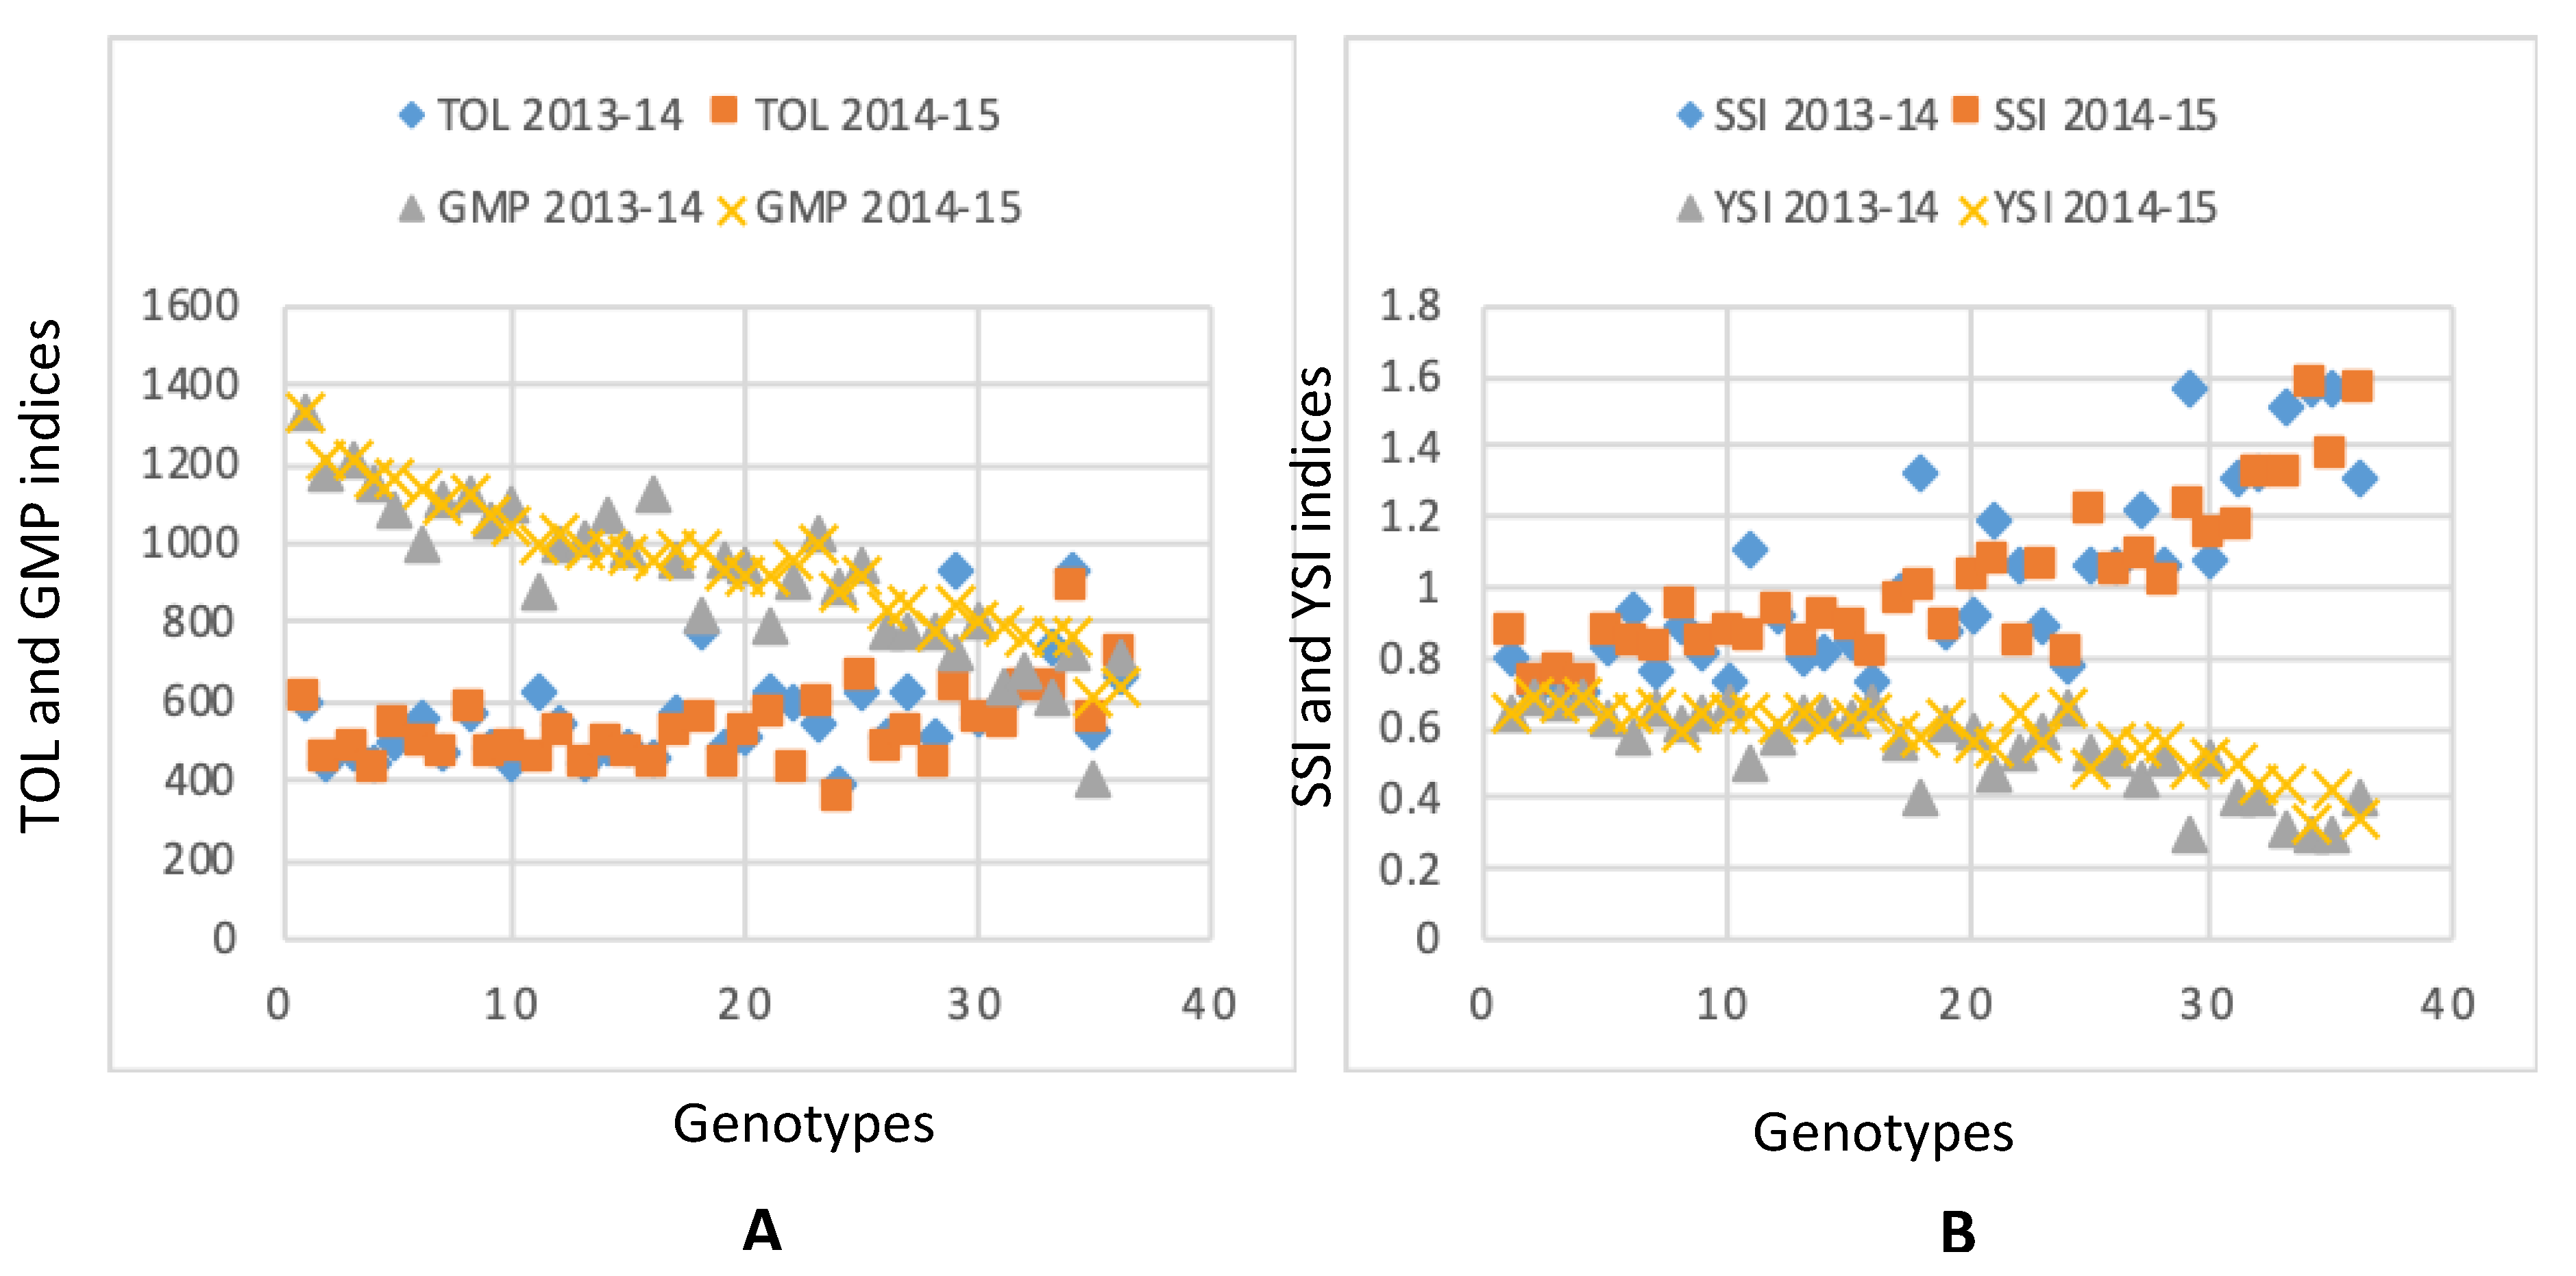
3.5. Phenotypic Variation in Yield Based Selection Indices

Selection indices were calculated based on the mathematical relationship of grain yield under both HN and LN conditions. The mean and range of all the selection indices are presented in Figure 4. A wide range of variation was observed among the studied genotypes.

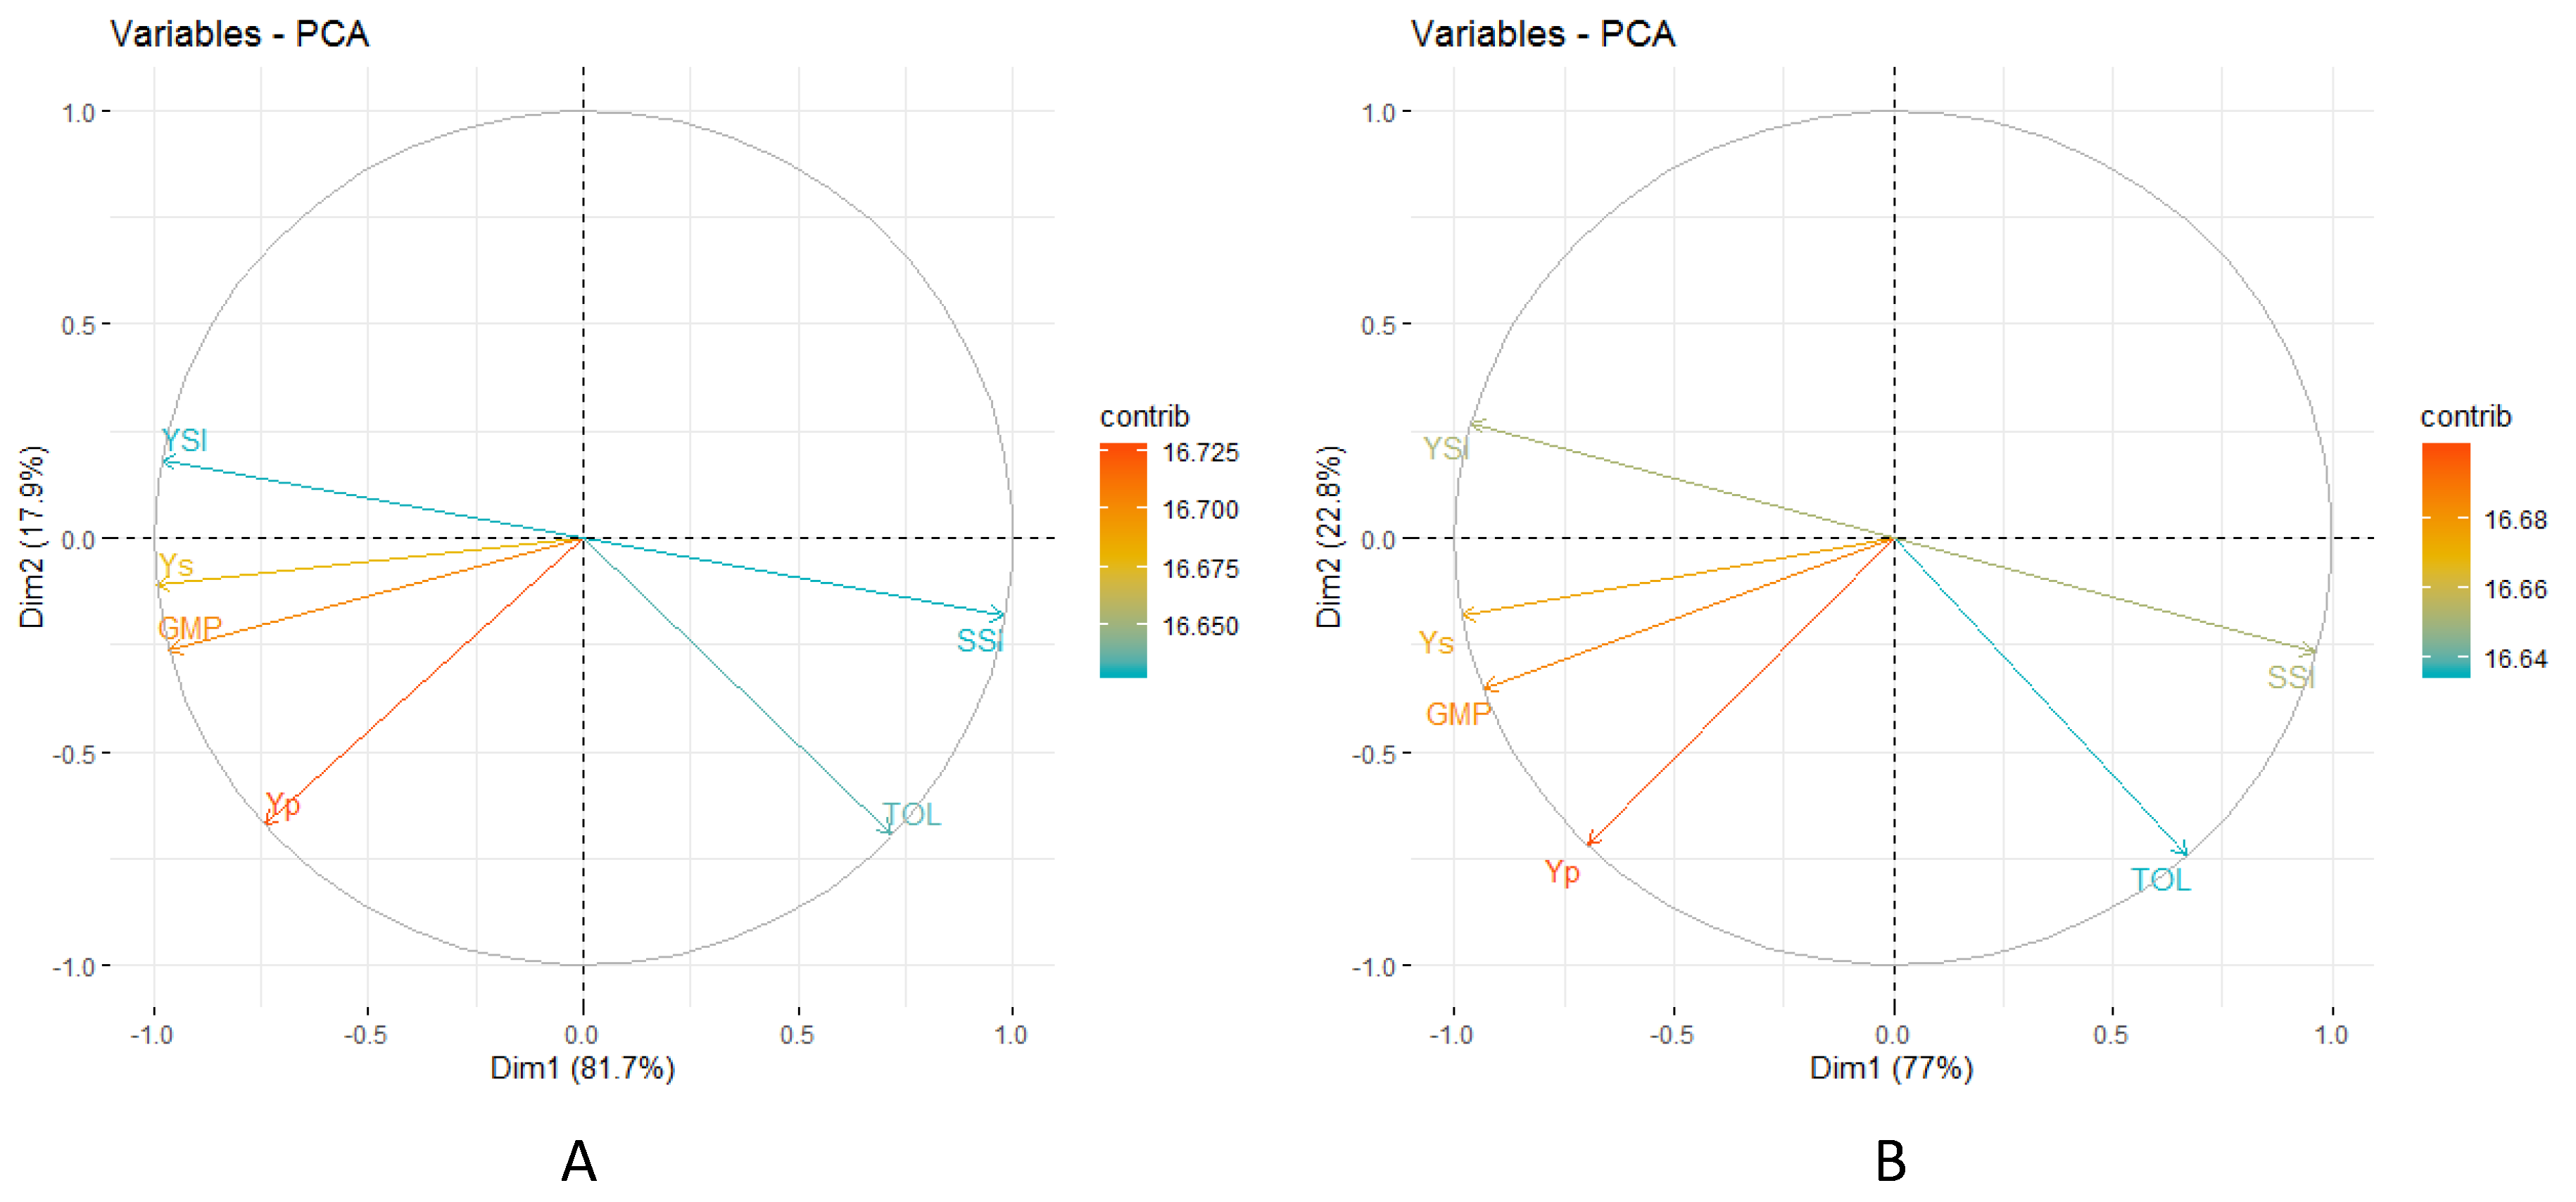
3.6. Correlation Studies for Selection Indices

The correlation coefficient between various selection indices and GY under HN and LN conditions was calculated for 2014 and 2015 (Figure 5). The results indicated that GMP and YSI had positive and high significant correlation with GY under HN and LN conditions. The indices, viz., TOL and SSI, exhibited a high significant but negative correlation with GY under HN and LN conditions in both years; therefore, the GMP, YSI, TOL, and SSI selection indices are the best predictors of yield under both HN and LN conditions.

3.7. Consistency of the Stress Tolerance Indices

The genetic correlation coefficients between GY and yield-based tolerance indices were determined for both years (Table 4). Highly significant correlations were recorded for all the indices, viz., TOL, SSI, GMP, and YSI, indicating the consistency of correlation among the observed selection indices across the years. Kendall’s coefficient of concordance (W) and discordance (1-W) and Friedman’s chi-square statistic were used to test the significance for consistency of mean yields and stress tolerance indices (Table 5). The W values varied from 0.200 (TOL) to 0.778 (GMP) among the indices. Apart from GMP, the W values for YSI were also shown to be high, whereas the SSI and TOL indices recorded low values. The consistency of the GMP selection index was found to be highest (0.778), followed by those of YSI (0.556), SSI (0.472) and TOL (0.200).

3.8. Identification of Promising Cultivarsbased on Selection Indices

It was observed that the correlation between various selection indices was significant under HN and LN conditions in both years, indicating that these selection indices could be utilized to select tolerant cultivars under LN and HN conditions. Considering tolerance or sensitivity equations, larger values for GMP and YSI would be desirable, whereas lower values would be desirable for SSI and TOL that represent relatively more tolerance under LN conditions. Based on a comparison of the estimates of SSI and TOL values in ascending order and the estimates of GMP and YSI in descending order for the 36 wheat cultivars, the top 10 best performing cultivars selected in each year (2014 and 2015) along with their indices values are presented in (Table S1).
Based on TOL index, the top 10 cultivars identified were HD 2967, MACS 6478, MACS 3125, NIAW 301, DBW 39, CBW 38, GW 322, KRL 213, RAJ 4037, and MACS 6273 in 2014, whereas HD 2967, MACS 6478, K 0307, RAJ 4037 DBW 39, KRL 213, DBW 51, GW 322, KRL 19, and MACS 6273 were the best in 2015 under LN conditions. The top 10 selected cultivars based on SSI index were DPW 621-50, HD 2967, MACS 6478, MACS 3125, CBW 38, NIAW 301, RAJ 4037, MACS 6222, DBW 39, and GW 322 in 2014, and DPW 621-50, HD 2967, MACS 6478, MACS 3125, KRL 210, CBW 38, RAJ 4229, K 0307, RAJ 4037, and DBW 39 in 2015 under LN conditions. Higher values of GMP and YSI have been reported as selection criteria for the identification of tolerant cultivars with high yield potential in wheat crop. The top 10 selected cultivars based on GMP were DPW 621-50, MACS 6478, MACS 3125, HD 2967, BH 1146, KRL 210, CBW 38, DBW 17, MACS 4229, and NIAW 301 in both years. The top 10 selected cultivars based on YSI were DPW 621-50, MACS 6478, MACS 3125, HD 2967, CBW 38, MACS 4229, NIAW 301, RAJ 4037, DBW 39, and GW 322 in 2014, and MACS 6478, MACS 3125, HD 2967, KRL 210, CBW 38, MACS 4229, K 0307, RAJ 4037, DBW 39, and GW 322 in 2015.
The top five cultivars, viz., MACS 6478, HD 2967, RAJ 4037, DBW 39, and GW 322 were selected based on TOL and SSI indices, which were common in both years. In contrast, five cultivars, viz., MACS 6478, MACS 3125, HD 2967, CBW 38, and RAJ 4229, were selected based on GMP and YSI indices, which were common in both years. Three cultivars, viz., RAJ 4037, DBW 39, and GW 322 were selected based on three indices, viz., TOL, SSI, YSI, while two cultivars, HD 2967 and MACS 6478, were selected based on all four indices which were common in both years.

4. Discussion

4.1. Phenotypic Variation

ANOVA revealed significant variation for most of the studied traits, suggesting the presence of wider genetic variability to be used for the genetic improvement of desired trait(s). The genotype effect is significant for all the studied traits, whereas genotype × year effect was significant for all the studied traits except GWPS, CHL, and GY under HN and FS, GWPS, and CT under LN conditions. Significant environments and genotypes effects under low and HN conditions were also reported [28] for plant height, grain yield, and NDVI in wheat. Significant genotypes, environments, and genotypes × environments effects for GY and test weight were also reported [29]. A significant G × N interaction for grain yield in wheat was also reported in earlier studies [4,11]. Therefore, improvement of the traits which are sensitive to various environmental conditions is possible, but genetic progress is slow due to their polygenic nature and strong G × E interactions. The genetic components of any trait will respond to selection and not environmental components; therefore, improvement of environmentally sensitive traits is difficult.

4.2. Correlation Studies

The improvement in yield components and knowledge of their correlation with GY is beneficial in designing a breeding methodology. The correlation of yield components and physiological traits with GY under HN and LN conditions is presented in Figure 2. In the present study, positive and significant correlation between GY and TKW, GWPS, BY, HI, NDVI, and CHL was recorded under both HN and LN conditions in both years. Similar results of positive and significant correlation of BY with GY in high and LN conditions have been previously reported [28] in wheat. Positive and significant correlation between TKW and GY was also reported [30], which supports the findings of the present study, and also indicates that grain yield can be enhanced by increasing grain weight. Grain yield may be increased by increasing the kernel weight under normal conditions [31]. The positive and significant correlation of NDVI with GY under both HN and LN conditions indicates that NDVI could be utilized for the enhancement of GY. The physiological traits FV/FM and FV/FO showed significant and positive correlation with GY under HN condition, but negative but non-significant correlation with GY under LN conditions in both years. The traits like 1000-grain weight, seed yield, and biomass have been successfully utilized in breeding programs to screen wheat genotypes for their performance under stress conditions [32]. The positive and significant correlation of yield component and physiological traits with GY will enable breeders to select high-yielding genotypes through the indirect selection of associated traits under both HN and LN conditions.

4.3. Correlation Studies of Selection Indices

In the present study (Figure 3), TOL had positive correlation with GY under HN condition, while it was negatively associated with GY under LN conditions. Similar results were also observed in different studies, wherein the TOL index had positive and significant correlation with yield under normal condition, but significant negative correlation under stress conditions in wheat [21,22,33,34]. The selection based on SSI and TOL will result in increased yield under high fertility conditions as the genotypes that are high-yielding under HN conditions suffered more yield reduction; therefore, relative value often leads to the selection of genotypes with the lowest absolute yield levels. In the present study, the SSI is significantly and negatively associated with yield. SSI has been utilized as a selection criterion to identify best performing genotypes under stress conditions in earlier studies in wheat [21,22,34]. In the present study, the positive and significant correlation between GY under normal and stress conditions corroborates earlier findings on wheat [22,29,35]. The GMP and YSI selection indices have positive and significant correlation with yield under both stress and normal conditions. A positive correlation of GMP and YSI with yield were similarly observed in previous studies [22,35]. The indices SSI, TOL, GMP, and YSI showed a similar pattern of correlation with GY under both HN and LN conditions in both years; therefore, either SSI or TOL, and GMP or YSI can be utilized to select tolerant cultivars for LN conditions in wheat.

4.4. Consistency of the Tolerance Indices

According to Kendall’s concordance coefficient, the consistency of the GMP selection index was found to be highest, followed by YSI, SSI, and TOL. Similar findings on the consistency of selection indices have also been reported in previous studies [21,22,34,35]. The low value of Kendall’s concordance coefficient for the TOL index was observed because of the significant difference in the TOL value for individual year. The high consistency of GMP followed by YSI and SSI could be utilized as a selection tool in the identification of high-yielding genotypes under LN conditions.

4.5. Selection of Promising Cultivars Based on Selection Indices

To develop high-yielding wheat varieties suitable for low input (LN) conditions, the identification of donor parents with high yield under LN conditions is of paramount importance. The cultivars selected based on each selection indices with their indices value for LN tolerance in both years are presented in (Table S1). HD 2967, MACS 6478, DBW 39, GW 322, KRL 213, RAJ 4037, and MACS 6273 were shown to be common tolerant genotypes for LN conditions in both years based on TOL selection index. In contrast, the cultivars DPW 621-50, HD 2967, MACS 6478, MACS 3125, CBW 38, RAJ 4037, and DBW 39 are common tolerant genotypes based on the SSI selection index for both years. SSI was also used to identify stress-sensitive and tolerant genotypes [22,33,36]; it showed year to year variation for genotypes and their ranking patterns [33].
Based on desirable values of SSI and TOL, the cultivars HD 2967, MACS 6478, DBW 39, and RAJ 4037 were identified as tolerant ones under LN conditions in both years. Higher GMP and YSI values have been reported as selection criteria for the identification of tolerant cultivars with high yield potential [22]. The best cultivars were selected based on GMP are DPW 621-50, MACS 6478, MACS 3125, HD 2967, BH 1146, KRL 210, CBW 38, DBW 17, MACS 4229, and NIAW 301, which were common in both years. The larger GMP values were also used to identify the tolerant genotypes for normal and stress conditions in wheat [22].
Tolerant cultivars selected based on YSI were MACS 6478, MACS 3125, HD 2967, CBW 38, MACS 4229, RAJ 4037, DBW 39, and GW 322 YSI in both years. In contrast, five cultivars, viz., MACS 6478, MACS 3125, HD 2967, CBW 38, and RAJ 4229, were selected based on GMP and YSI indices, which were common in both years. Three cultivars, RAJ 4037, DBW 39, and GW 322, were selected based on three indices (TOL, SSI, and YSI), while two, HD 2967 and MACS 6478, were selected based on all four indices which were common in both years. Some of the cultivars (HD 2967, GW 322, and MACS 6478) which were common in different selection indices are popular mega varieties in different wheat growing regions and conditions. These varieties are highly responsive to high input (particularly nitrogen) levels; different studies of nitrogen use efficiency also support the present investigations [37]. The high yield under LN conditions of the selected genotypes could be due to a plethora of activities like efficient absorption from soil, mobilization in the plant system, and conversion in to the sink.
Coincidentally, the common tolerant genotype (HD2967) in all four selection indices was found to be the best candidate for physiological traits like high biological yield, NDVI, and CHL compared to the overall population grand mean under LN conditions. Other tolerant genotypes like DBW 39 were also found superior for some of the physiological traits, i.e., high BY, NDVI, Fv/Fm, and Fv/Fo; RAJ 4037 showed superior performance for NDVI and Fv/Fo; MACS 6478 showed superior performance for CHL compared to the overall population grand mean under LN conditions. Tolerant cultivars selected based on different selection indices indicated different physiological parameters of tolerance under LN conditions.
The indices TOL, SSI, GMP, and YSI were also used to identify tolerant genotypes under normal and stress conditions in bread wheat [22] and durum wheat [34], and GMP and YSI in bread wheat [35]. Therefore, the selection indices that showed highly significant and desirable correlation with GY under normal and stress conditions are generally suitable for selecting tolerant genotypes in wheat.
The material used in the study consists of genotypes having diverse adaptation from India as well as selection from CIMMYT material. The CIMMYT shares the material through nurseries and trials across the globe, and the same material is released as varieties in different countries with different names, even though the pedigree is same. Therefore, this study would be useful for countries where spring wheat is important.
Nitrogen Use Efficiency (NUE) is defined as total grain yield or biomass produced per unit of applied N fertilizer [38]. It can be expressed as a ratio of output (total grain yield biomass, grain N, plant N) and input N in the form of fertilizers [39]. The NUE reported in cereals is about 40%, and the remaining 60% of the applied fertilizer is lost and goes on to pollute the environment [40]. Therefore, growing wheat cultivar with improved NUE will ultimately result in a reduction of excessive fertilizer input without a reduction in yield. The importance of growing NUE genotypes has already been emphasized [5]. NUE is a complex phenomenon involving both genetic and environmental factors. The various components of NUE are N uptakes by root, assimilation, and remobilization in the shoot. Reports in the literature suggest genetic variability in NUE in spring wheat [41]. In the present study, the nitrogen use efficient genotypes were HD 2967, DBW 39, RAJ 4037, and MACS 6478. The genotype HD 2967 was efficient in all the four selection indices, and was also found to be superior for biological yield, NDVI, and CHL under LN conditions. HD 2967 was the most nitrogen use efficient genotype, as revealed by a significant increase in root dry weight due to N-stress [37].

5. Conclusions

Thirty-six wheat cultivars were evaluated for LN tolerance in 2014 and 2015 under both HN and LN conditions. RAJ 4037, DBW 39, and GW 322 were the most tolerant common genotypes under LN conditions based on the three selection indices (TOL, SSI and YSI), while HD 2967 and MACS 6478 were the common genotypes tolerant under LN conditions in all four selection indices (GMP, TOL, SSI and YSI). The GMP selection index was found to be the most consistent, followed by YSI, SSI, and TOL, which could be utilized as a selection tool in the identification of high-yielding genotypes under LN conditions. Three out of five tolerant genotypes were selections from CIMMYT, and might already be in cultivation in different parts of the world. Therefore, these common tolerant genotypes identified through different selection indices could be utilized as potential donors in active breeding programs to incorporate the LN-tolerant genes to develop high-yielding wheat varieties for LN conditions. This study also improves our understanding of the physiological basis of tolerance in high-yielding wheat genotypes under LN conditions. The tolerant genotype HD 2967 was found to be the best candidate for physiological traits like high biological yield, NDVI, and CHL compared to the overall population grand mean under LN conditions. The other tolerant genotypes like DBW 39 were also found to be superior for some of the physiological traits, i.e., high BY, NDVI, Fv/Fm, and Fv/Fo. RAJ 4037 showed superior performance for NDVI and Fv/Fo, while MACS 6478 showed superior performance for CHL compared to the overall population grand mean under LN conditions.

Supplementary Materials

The following are available online at https://www.mdpi.com/2073-4395/10/3/417/s1, Table S1: Mean performance of 36 wheat genotypes for various yield based selection indices under Low N conditions over the years (2013–2014 and 2014–2015), Table S2: Percent reduction in the mean performance of seven yield components under low N and high N conditions over two years (2013–2014 and 2014–2015), Table S3: Percent reduction in grain yield under low N and high N conditions in 2013–2014, 2014–2015 and across the year. Table S4: Parameters of PCA for low and high N conditions during 2013–2014 and 2014–2015 for the indices. Table S5: Correlation between grain and agronomic traits under high nitrogen and low nitrogen conditions during 2014 and 2015.

Author Contributions

Conceptualization, B.S.T.; Data curation, M.B. and J.S.K.; Formal analysis, M.R.B., G.K. and I.P.K.; Funding acquisition, B.S.T.; Investigation, B.S.T., P.K., V.G., G.K. and A.O.; Methodology, B.S.T., J.F., G.S. and S.S.; Project administration, B.S.T.; Resources, G.P.S.; Software, V.G., G.K. and J.S.K.; Supervision, G.P.S.; Visualization, B.S.T.; Writing—original draft, G.S., P.K. and G.K.; Writing—review & editing, B.S.T., J.F., S.S., I.P.K. and G.P.S. All authors have read and agreed to the published version of the manuscript.

Funding

This research was funded by BBSRC/DBT/ICAR.

Acknowledgments

The authors acknowledge the financial support given by BBSRC/DBT/ICAR and also to the cooperators for providing experimental data that enabled this manuscript publication jointly.

Conflicts of Interest

The authors declare no conflict of interest.

References

  1. FAO. FOASTAT, Food and Agriculture Data. 2016. Available online: http://www.fao.org/faostat (accessed on 20 November 2018).
  2. Hall, A.J.; Richards, R.A. Prognosis for genetic improvement of yield potential and water-limited yield of major grain crops. Field Crops Res. 2013, 143, 18–33. [Google Scholar] [CrossRef] [Green Version]
  3. Hodge, A.; Robinson, D.; Fitter, A. Are microorganisms more effective than plants at competing for nitrogen? Trends Plant Sci. 2000, 5, 304–308. [Google Scholar] [CrossRef]
  4. Guarda, G.; Padovan, S.; Delogu, G. Grain yield, nitrogen use efficiency and baking quality of old and modern Italian bread-wheat cultivars grown at different nitrogen levels. Eur. J. Agron. 2004, 2, 181–192. [Google Scholar] [CrossRef]
  5. Foulkes, M.; Hawkesford, M.; Barraclough, P.; Holdsworth, M.; Kerr, S.; Kightley, S.; Shewry, P. Identifying traits to improve the nitrogen economy of wheat: Recent advances and future pros pects. Field Crops Res. 2009, 114, 329–342. [Google Scholar] [CrossRef]
  6. Swain, E.Y.; Leonidas, R.; Caroline, H.O.; Hall, G.; Chapman, R.; Almadni, M.; Elizabeth, A.S.; Kidd, J.; Carlo, L.; Julia, M. Optimizing nitrogen use efficiency in wheat and potatoes: Interactions between genotypes and agronomic practices. Euphytica 2014, 199, 119–136. [Google Scholar] [CrossRef]
  7. Reynolds, M.; Foulkes, J.; Furbank, R.; Griffiths, S.; King, J.; Murchie, E.; Parry, M.; Slafer, G. Achieving yield gains in wheat. Plant Cell Environ. 2012, 35, 1799–1823. [Google Scholar] [CrossRef] [PubMed]
  8. Aisawi, K.; Reynolds, M.; Singh, R.; Foulkes, M. The physiological basis of the genetic progress in yield potential of CIMMYT spring wheat cultivars from 1966 to 2009. Crop Sci. 2015, 55, 1749–1764. [Google Scholar] [CrossRef]
  9. Moll, R.H.; Kamprath, E.J.; Jackson, W.A. Analysis and interpretation of factors which contribute to efficiency of nitrogen-utilization. Agron, J. 1982, 74, 562–564. [Google Scholar] [CrossRef]
  10. Muurinen, S.; Slafer, G.A.; Peltonen-Sainio, P. Breeding effects on nitrogen use efficiency of spring cereals under northern conditions. Crop Sci. 2006, 46, 561–568. [Google Scholar] [CrossRef]
  11. Barraclough, P.B.; Howarth, J.R.; Jones, J.; Lopez-Bellido, R.; Parmar, S.; Shepherd, C.E.; Hawkesford, M.J. Nitrogen efficiency of wheat: Genotypic and environmental variation and prospects for improvement. Eur. J. Agron. 2010, 33, 1–11. [Google Scholar] [CrossRef]
  12. Gaju, O.; Allard, V.; Martre, P.; Snape, J.W.; Heumez, E.; LeGouis, J.; Moreau, D.; Bogard, M.; Griffiths, S.; Orford, S.; et al. Identification of traits to improve the nitrogen-use efficiency of wheat genotypes. Field Crops Res. 2011, 123, 139–152. [Google Scholar] [CrossRef]
  13. Gaju, O.; Allar, V.; Martre, P.; LeGouis, J.; Moreau, D.; Bogard, M.; Hubbart, S.; Foulkes, M.J. Nitrogen partitioning and remobilization in relation to leaf senescence, grain yield and grain nitrogen concentration in wheat cultivars. Field Crops Res. 2014, 155, 213–223. [Google Scholar] [CrossRef]
  14. Brancourt-Hulmel, M.; Doussinault, G.; Lecomte, C.; Berard, P.; Le-Buanec, B.; Trottet, M. Genetic improvement of agronomic traits of winter wheat cultivars released in France from 1946 to 1992. Crop Sci. 2003, 43, 37–45. [Google Scholar] [CrossRef]
  15. Cormier, F.; Faure, S.; Dubreuil, P.; Heumez, E.; Beauchene, K.; Lafarge, S.; Praud, S.; LeGouis, J. A multi-environmental study of recent breeding progress on nitrogen use efficiency in wheat (Triticum aestivum L.). Theor. Appl Genet. 2013, 126, 3035–3048. [Google Scholar] [CrossRef] [PubMed]
  16. Brancourt-Hulmel, M.; Heumez, E.; Pluchard, P.; Beghin, D.; Depatureaux, C.; Giraud, A.; Le, G.J. Indirect versus direct selection of winter wheat for low-input or high-input levels. Crop Sci. 2005, 45, 1427–1431. [Google Scholar] [CrossRef]
  17. Przystalski, M.; Osman, A.M.; Thiemt, E.M.; Rolland, B.; Ericson, L.; Ostergard, H.; Levy, L.; Wolfe, M.S.; Buchse, A.; Piepho, H.P.; et al. Comparing the performance of cereal varieties in organic and non-organic cropping systems in different European countries. Euphytica 2008, 16, 417–433. [Google Scholar] [CrossRef]
  18. Annicchiarico, P.; Chiapparino, E.; Perenzin, M. Response of common wheat varieties to organic and conventional production systems across Italian locations and implications for selection. Field Crops Res. 2010, 116, 230–238. [Google Scholar] [CrossRef]
  19. Fischer, R.A.; Maurer, R. Drought resistance in spring wheat cultivars, 1. Grain yield responses. Aust. J. Agric. Res. 1978, 29, 897–912. [Google Scholar] [CrossRef]
  20. Bouslama, M.; Schapaugh, W.T. Stress tolerance in soybean. Part 1: Evaluation of three screening techniques for heat and drought tolerance. Crop Sci. 1984, 24, 933–937. [Google Scholar] [CrossRef]
  21. Sio-Se Mardeh, A.; Ahmadi, A.; Poustini, K.; Mohammadi, V. Evaluation of drought resistance indices under various environmental conditions. Field Crops Res. 2006, 98, 222–229. [Google Scholar] [CrossRef]
  22. Singh, G.; Singh, M.K.; Tyagi, B.S.; Singh, J.B.; Kumar, P. Germplasm characterization and selection indices in bread wheat for waterlogged soils in India. Indian J. Agric. Sci. 2017, 87, 1139–1148. [Google Scholar]
  23. Clarke, J.M.; Towenley-Smith, T.M.; McCaig, T.N.; Green, D.G. Growth analysis of spring wheat cultivars of varying drought resistance. Crop Sci. 1984, 24, 537–541. [Google Scholar] [CrossRef]
  24. Choukan, R.; Taherkhani, T.; Ghannadha, M.R.; Khodarahmi, M. Evaluation of drought tolerance in grain maize inbred lines using drought tolerance indices. Iranian J. Crop Sci. 2006, 8, 79–89. [Google Scholar]
  25. Hossain, A.B.S.; Sears, A.G.; Cox, T.S.; Paulsen, G.M. Desiccation tolerance and its relationship to assimilate partitioning in winter wheat. Crop Sci. 1990, 30, 622–627. [Google Scholar] [CrossRef]
  26. Fernandez, G.C.J. Effective selection criteria for assessing plant stress tolerance. In Adaptation of Vegetables and Other Food Crops to Temperature Water Stress; Asian Vegetable Research and Development Center: Tainan, Taiwan, 1992; pp. 257–270. [Google Scholar]
  27. R Core Team. R: A Language and Environment for Statistical Computing; R Foundation for Statistical Computing: Vienna, Austria, 2013. [Google Scholar]
  28. Hitz, K.; Clark, J.A.; Sanford, D.A.V. Identifying nitrogen-use efficient soft red winter wheat lines in high and low nitrogen environments. Field Crops Res. 2017, 200, 1–9. [Google Scholar] [CrossRef] [Green Version]
  29. Sarcevic, H.; Jukic, K.; Ikic, I.; Lovric, A. Estimation of quantitative genetic parameters for grain yield and quality in winter wheat under high and low nitrogen fertilization. Euphytica 2014, 199, 57–67. [Google Scholar] [CrossRef]
  30. Singh, G.; Kulshreshtha, N.; Singh, B.N.; Setter, T.L.; Singh, M.K.; Saharan, M.S.; Tyagi, B.S.; Verma, A.; Sharma, I. Germplasm characterization, association and clustering for salinity and water logging tolerance in bread wheat (Triticum aestivum). Indian J. Agric. Sci. 2014, 84, 1102–1110. [Google Scholar]
  31. Richards, R.A. Defining selection criteria to improve yield under drought. Plant Growth Regul. 1996, 20, 157–166. [Google Scholar] [CrossRef]
  32. Joshi, A.K.; Mishra, B.; Chatrath, R.; Ortiz-Ferrara, G.; Singh, R.P. Wheat improvement in India: Present status, emerging challenges and future prospects. Euphytica 2007, 157, 431–446. [Google Scholar] [CrossRef]
  33. Clarke, J.M.; DePauw, R.M.; Townley-Smith, T.F. Evaluation of methods for quantification of drought tolerance in wheat. Crop Sci. 1992, 32, 728–7232. [Google Scholar] [CrossRef]
  34. Mohammadi, R. Efficiency of yield-based drought tolerance indices to identify tolerant genotypes in durum wheat. Euphytica 2016, 211, 71–89. [Google Scholar] [CrossRef]
  35. Singh, G.; Kumar, P.; Gupta, V.; Tyagi, B.S.; Singh, C.; Sharma, A.K.; Singh, G.P. Multivariate approach to identify and characterize bread wheat (Triticum aestivum) germplasm for waterlogging tolerance in India. Field Crops Res. 2018, 221, 81–89. [Google Scholar] [CrossRef]
  36. Bansal, K.C.; Sinha, S.K. Assessment of drought resistance in 20 accessions of Triticum aestivum and related species total dry matter and grain yield stability. Euphytica 1991, 56, 7–14. [Google Scholar]
  37. Nagar, C.K.; Gayatri, B.A.; Sinha, S.K.; Venkatesh, K.; Mandal, P.K. Nitrogen stress induced changes in root system architecture (RSA) in diverse wheat (T. aestivum L.) genotypes at seedling stage. Wheat Barley Res. 2018, 10, 93–101. [Google Scholar] [CrossRef] [Green Version]
  38. Xu, Y.; Ma, B.; Nussinov, R. Structural and functional consequences of phosphate–arsenate substitutions in selected nucleotides: DNA, RNA, and ATP. J. Phys. Chem. 2012, 116, 4801–4811. [Google Scholar] [CrossRef]
  39. Pathak, R.R.; Ahmad, A.; Lochab, S.; Raghuram, N. Molecular physiology of plant nitrogen use efficiency and biotechnological options for its enhancement. Curr. Sci. 2008, 94, 1394–1403. [Google Scholar]
  40. Raghuram, N.; Sachdev, M.S.; Abrol, Y.P. Towards an integrative understanding of reactive nitrogen. Agric. Nitrogen Use Environ. Implic. 2007, 1–6. [Google Scholar]
  41. Mansour, E.; Merwad, A.M.A.; Yasin, M.A.T.; Abdul-Hamid, M.I.E.; El-Sobky, E.E.A.; Oraby, H.F. Nitrogen use efficiency in spring wheat: Genotypic variation and grain yield response under sandy soil conditions. J. Agric. Sci. 2017, 155, 1407–1423. [Google Scholar] [CrossRef]
Figure 1. Relationship between grain yield (GY) and biological yield (BY) under LN (A) and HN (B) among 36 wheat cultivars.
Agronomy 10 00417 g001
Figure 2. Phenotypic correlation between grain yield (GY) and its component traits under HN (A) and LN (B) in 2014 among 36 wheat cultivars.
Agronomy 10 00417 g002
Figure 3. Phenotypic correlation between grain yield (GY) and its component traits under HN (A) and LN (B) in 2015 among 36 wheat cultivars.
Agronomy 10 00417 g003
Figure 4. Phenotypic variation in yield based selection indices of TOL and GMP (A) and YSI and SSI (B) among 36 wheat cultivars.
Agronomy 10 00417 g004
Figure 5. Phenotypic correlation between grain yield (GY) and selection indices during 2014 (A) and 2015 (B) under LN conditions among 36 wheat cultivars.
Agronomy 10 00417 g005
Table 1. List of wheat cultivars used in field trials under high and low N conditions in 2014 and 2015.
Sr. No.VarietyPedigreeYear of ReleaseProduction Condition
1DPW 621-50KAUZ//ALTAR84/AOS/3/MILAN/KAUZ/4/HUITES2011TS, IR
2MACS 3125RAJ 1555/CPAN61202003TS, RF
3BH 1146*EONTA PONTA GROSSA 1//FRETES/MARTIN1987-
4GW 322PBW 173/GW 1962002TS, IR
5MACS 2496SERI”S”1991TS, IR
6DBW 46*PBW 343/INQ212011-
7MACS 6222HD 2189*2//MACS 24962010TS, IR
8K 0307K 8321/UP 20032007TS, IR
9MACS 6478CS/TH.SC//3*PVN/3/MIRLO/BUC/4/MILAN/5/TILHI2014TS, IR
10HD 2932KAUZ/STAR//HD 26432008TS, IR
11Kharchia 65KHARCHIA LOCAL/EG 9531970TS, IR
12DBW 16RAJ 3765/WR 484//HUW 4682006TS, IR
13CBW 38CNDO/R143//ENTE/MEXI-2/3/Ae.SQUARROSA (TAUS)/4/WEAVER/5/2*PASTOR2008TS, IR
14KRL 1-4KHARCHIA 65/WL 7111990TS, IR
15WH 1021NYOT 95/SONAK2007LS, IR
16HI 8498CR ‘S’-GS’S’//A-9-30-1/RAJ 9111999TS, IR
17DBW 17CMH79A.95/3*CNO79//RAJ 37772007TS, IR
18DBW 51SITE/MILAN2010LS, IR
19PDW 314AJAIA 12/F3LOCAL(SEL.ETHIO.135.85)//PLATAI 13/3/SOMAT3/4/SOOTY/RASCON372010TS, IR
20DBW 39ATTILA/HUI2010TS, IR
21NW 1067TR 380-16-3-614/CHAT’S’2004TS, IR
22DBW 88KAUZ//ALTAR84/AOS/3/MILAN/KAUZ/4/HUITES2014TS, IR
23KRL 210PBW65/2*PASTOR2010TS, IR
24HW 2044HD 226*5/SUNSTAR*6/C-80-11999TS, IR
25MACS 6273KAUZ*2/CHEN//BCN/MILAN-LS, IR
26DBW 71PRINIA/UP 24252013LS, IR
27KRL 213CNDO/R143//ENTE/MEXI-2/3AEGILOPS SQUARROSA(TAUS)/4/WEAVER/5/2*KAUZ2010TS, IR
28NIAW 917GW 244/BOB WHITE2006TS, IR
29NIAW 301SERI82/3/MRS/JUP//HOK’S’ 2002TS IR
30RAJ 4037DL 788-2/RAJ 37172004TS, IR
31HD 2733ATTILA/3/TUI/CARC//CHEN/CHTO/4/ATILA2001TS, IR
32RAJ 4238HW 2021/RAJ 37652012LS, IR
33RAJ 4229HW 2048/RAJ 40002012TS, IR
34DBW 14RAJ 3765/PBW 3432002LS, IR
35KRL 19PBW 255/KRL 1-42000TS, IR
36HD 2967ALD/COC//USER/HD 2160M/HD22782011TS, IR
TS: Timely Sown; LS: Late Sown; IR: Irrigated; RF: Rainfed; * Brazilian variety.
Table 2. Combined analysis of variance for yield and its attributes in 36 wheat cultivars grown under high N and low N conditions in 2014 and 2015.
Source of VariationdfEnvironmentMean Sum of Square (MSS)
PH (cm)FSTKW (g)GNPSGWPSBY (g)HI (%)NDVICTCHL (%)FV/FMFV/FOGY (g)
Replication2High N1.612.566.00 *7.400.00113,688.360.090.00 *0.0753.40 **0.000.07 *550.06
Low N3.423.750.116.420.04121,150.860.000.00 *0.1329.74 **0.00 **0.131755.34
Year1High N10.02770.06 **6.673.360.001 **275,187.67 **7.60 *0.03 *4.74 *1.280.000.002686.69
Low N19.5015.344.34 *158.34 *0.03859,008.5038.44 **0.0029.64 *3309.31 **0.000.4860,557.00 *
Genotypes35High N232.79 **391.53 **37.97 **119.62 **0.48 **864,731.56 **23.30 **0.02 **3.27 **77.40 **0.01 **1.84 **90,515.34 **
Low N259.99 **136.37 **20.70 **172.15 **0.47 **1,116,397.63 **101.77 **0.04 **1.27 **105.44 **0.00 **0.41 **220,564.14 **
Genotypes × Year35High N5.68 **60.54 **3.37 **25.73 **0.0546,287.67 **2.15 **0.00 **1.53 **2.130.00 **0.06 **3978.23
Low N8.97 **6.162.52 *15.12 *0.0350,134.57 **5.33 **0.01 **0.1945.69 **0.00 *0.10 *8015.27 **
Pooled error70High N2.8221.102.046.180.0421,365.510.970.000.092.710.000.013800.22
Low N3.7510.591.518.890.0220,488.361.730.000.153.710.000.053424.94
* Significance at 5% (p = 0.05); ** Significance at 1% (p = 0.01); GY: grain yield/plot; PH: plant height; FS: fertile shoots/meter; TKW: 1000-kernel weight; GNPS: Grains number/spike; GWPS: Grain weight /spike; BY: Biological yield/plot; HI: Harvest index; NDVI: Normalized difference vegetation index; CT: Canopy temperature; CHL: Chlorophyll content; FV/FM: Variable/maximum florescence; FV/FO: Variable/initial florescence.
Table 3. Mean, range and reduction percentage of yield and its attributes in 36 wheat cultivars grown under high nitrogen and low nitrogen conditions in 2014 and 2015.
YearConditionsPH (cm)FSTKW (g)GNPSGWPSBY (g)HI (%)NDVICTCHL (%)FV/FMFV/FOGY (g)
2014High N
Mean92.64114.5943.1660.212.62410330.670.75622.4545.580.7783.8071254
Minimum80.4298.0038.5052.751.99221526.280.60521.1331.050.6152.200749
Maximum118.33145.0055.5075.503.50521335.620.87023.9551.700.8824.8611682
Low N
Mean840178.9439.2955.002.32307034.170.50024.5139.550.7202.631730
Minimum72.9267.0033.9543.001.50206323.030.31323.1533.730.6501.890370
Maximum115.0092.5045.3266.503.15459845.400.68525.5046.160.7703.6151066
RP9.2131.379.118.6511.8025.68−11.4234.60−9.2313.667.4530.9645.70
2015High N
Mean93.24109.8743.5959.952.63419030.210.78722.0845.780.7773.8071263
Minimum84.0091.5035.5044.502.02301824.650.60018.6532.080.6552.247951
Maximum118.50142.5057.5076.003.65533035.310.88524.6050.150.8924.8251681
Low N
Mean83.2578.2739.6252.922.29311035.200.49525.4229.960.7102.515689
Minimum71.0068.1733.8041.101.60192524.580.33024.1017.670.6401.871220
Maximum115.0091.5044.5070.503.00460546.270.66527.5044.300.7693.2431069
RP10.8028.879.1611.8213.0226.20−16.5337.68−15.1335.438.5833.7342.76
GY: grain yield/plot; PH: plant height; FS: fertile shoots/meter; TKW: 1000-kernel weight; GNPS: grains number/spike; GWPS: grain weight /spike; BY: biological yield/plot; HI: harvest index; NDVI: normalized difference vegetation index; CT: canopy temperature; CHL: chlorophyll content; FV/FM: variable/maximum florescence; FV/FO: variable/initial florescence; RP: reduction percentage.
Table 4. Phenotypic correlation between yield-based selection indices measured for both years under LN conditions.
Yp2014/Yp2015Ys2014/Ys2015TOL2014/TOL2015SSI2014/SSI2015GMP2014/GMP2015YSI2014/YSI2015
0.967 **0.980 **0.968 *0.979 **0.983 **0.979 **
* Significance at 5% (p = 0.05); ** Significance at 1% (p = 0.01).
Table 5. Kendall’s coefficient of concordance (W) and discordance (1-W) and significance test for various selection indices for 2014/2015 in 36 wheat cultivars.
StatisticsHigh N (Yp)Low N (Ys)TOLSSIGMPYSI
W0.7500.6110.2000.4720.7780.556
1-W0.2500.3890.80005280.2220.444
Friedman’s χ2 test27.022.07.214.028.020.0
p value0.0000.0000.0070.0000.0000.000

