Evaluating Dry Matter Production and Grain Yield of Dual-Purpose Winter Wheat Using Field Experiment and Modelling

1
School of Agricultural and Wine Sciences, Charles Sturt University, Wagga Wagga, NSW 2650, Australia
2
Graham Centre for Agricultural Innovation, Wagga Wagga, NSW 2650, Australia
Agronomy 2020, 10(3), 338; https://doi.org/10.3390/agronomy10030338
Submission received: 6 February 2020
/
Revised: 27 February 2020
/
Accepted: 28 February 2020
/
Published: 2 March 2020
(This article belongs to the Special Issue Environmental Sustainability of Crop-Livestock Systems)
Abstract
:The potential of a winter wheat (Triticum aestivum L.) cultivar Wedgetail to provide grazing and grain yield under different sowing times, grazing times, and watering regimes, under current and future climate, was investigated using field experiment and simulation modelling. For the field experiment, there were two watering treatments (unirrigated (D) and irrigated (I)) and four simulated grazing treatments (ungrazed, simulated grazed at growth stage (GS) 25, simulated grazed at growth stage (GS) 32, and grazed at both GS 25 and GS 32). These were designated as D0, D1, D2, and D3, respectively, for the unirrigated treatment and I0, I1, I2, and I3, respectively, for the irrigated treatment. It was found that the soil water depletion was significantly higher (p < 0.05) for the irrigated/ungrazed treatment than that for the simulated grazed treatment. The crop simulated grazed at GS 25 recovered quicker than the crop grazed at GS 32, especially for the unirrigated treatment. As the sowing time is delayed, above-ground dry matter (AGDM) production decreases. For D2 and D3, the amount of simulated grazed AGDM was 3.46 t ha−1 and 3.55 t ha−1, respectively. For I2 and I3, the amount of simulated grazed AGDM was 4.73 t ha−1 and 4.34 t ha−1, respectively. For D1, simulated grazing increased grain yield by 7%, while for D2 and D3, it increased by 18% and 24%, respectively. For I1, simulated grazing reduced grain yield by 16%, while for I2 and I3, it decreased by 42% and 42%, respectively. Simulation using the Agricultural Production Systems sIMulator (APSIM) showed that, for winter wheat sown in the second week of March, the maximum AGDM expected one in two years at the ends of May, June, and July is 4.5 t ha−1, 5.8 t ha−1, and 6.8 t ha−1, respectively. If the crop is sown mid-April, these values are 0.8 t ha−1, 2.2 t ha−1, and 4.3 t ha−1, respectively. Yield did not show response to times of sowing from March to early April. The maximum value reached was about 4.5 t ha−1 when sown in the fourth week of March, after which it started decreasing and reached the lowest value of about 4.1 t ha−1 when sown by the end of May. The total above-ground dry matter (AGDM) obtained by grazing earlier during the feasible grazing period and again towards the end of this period was not significantly different from grazing only once towards the end of this period. The simulation results showed that winter wheat Wedgetail flowering date was less sensitive to sowing time and that yield did not show a significant response to times of sowing, with the maximum occurring for the fourth week of March sowing and the lowest for the fourth week of May sowing.
1. Introduction
In the mixed-farming systems of south-eastern Australia, livestock grazing of pastures grown in rotation with crops and stubble during the summer is commonly practiced [1]. This practice increases the total farm productivity and profitability, from both crop and livestock. However, as the supplies of stubble residue and pasture are exhausted during the period from late autumn to winter months (May–July), a critical livestock feed-gap occurs. One of the options to fill this feed-gap is grazing of dual-purpose cereal crops, for both grazing and grain, during this period [2,3]. Dual-purpose crops are grown in different regions, among them are the following: the U.S. Great Plains [4], southern Spain [5], southern Australia [2], and Western China [6]. Grazing of dual-purpose crops can have other benefits such as reducing crop height, reducing frost risk, and increasing water use efficiency by reducing leaf area and conserving soil water so that it can be efficiently used latter in the season during anthesis and grain filling stages [7,8,9,10].
Wheat is one of the cereals grown as a dual-purpose crop. Because of their vernalization requirement for flowering (−2 °C to 15 °C), compared with spring cultivars, winter wheats spend a long period of time in the vegetative phase before flowering and setting seed [11]. This provides a greater biomass for grazing over an extended period before the reproductive phase. In regions where the start of the autumn rainy period is extremely variable, such as in the south-eastern Australia, owing to their broad potential establishment period, winter wheats are preferred alternatives to spring cultivars, which have a defined optimal establishment and flowering period [12]. The broad establishment period was also reported to be an advantage in increasingly large farm sizes in Australian dryland farming systems, as it allows the farmers to sow over a more flexible sowing schedule [13]. Wedgetail, the winter wheat cultivar used in this study, is a mid-winter cultivar with a long vegetative period (March to mid-July) if sown early [13]. It is particularly adapted to the medium–high rainfall regions of southern and central New South Wales.
In seasons where there is sufficient soil moisture from an early start of the autumn rain, stored soil moisture from the fallow period or irrigation, early sown dual-purpose cereals into mild-warm soil and air temperatures offer a high dry matter quantity and quality [2]. Early sown crops develop a deeper rooting system to explore soil moisture and develop a high canopy, which increases radiation interception [14,15]. In Southern Australia, using the crop simulation model APSIM [16], Moore [17] found that establishment opportunities for winter cultivars, 15 mm or more of rain over a three-day period during April and May, occurred between 58% and 98% of the sites and years (1955–2006) combinations considered. Although the occurrence of soil moisture sufficient to allow germination and emergence before this establishment period is a major factor limiting establishment opportunities for early sown winter cultivars, it is important to explore the potential of early sown wheat in the seasons with early rainfall break or irrigation water availability for crop establishment. Depending on the soil type and soil moisture conservation practices such as stubble cover and weed control, fallow period-stored soil water can enable early sowing in seasons with no early rainfall break [18]. However, information on soil water and canopy cover dynamics is limited. From their extensive review of literature, Harrison et al. [19] reported that grazing has a positive effect on grain yield of wheat if done at the right time. Grazing after the critical time of the development of the first hollow stem (GS 31) can result in a large reduction in grain yield. Assessment of potential dry matter production at different grazing times and grain yield for different potential sowing dates can be efficiently implemented using simulation modelling. However, this specific application of simulation modelling for winter wheat has not been explored in light of changing climate. Using field experiment and simulation, this study was designed to (i) determine the effect of different grazing managements on dry matter production, grain yield, and water productivity; (ii) determine soil water and canopy growth dynamics under irrigated and non-irrigated conditions; (iii) determine the potential dry matter production at different times of the feed-scarce period and grain yield for different sowing dates; and (iv) assess the impact of climate change on the yield and dry matter production of wheat (cv. Wedgetail).
2. Materials and Methods
2.1. Field Experiment
2.1.1. Description of Field Setup and Soil Water Measurement
The experiment was conducted in the Riverina region of south-eastern Australia. The farming system in this region is mainly mixed-farming, with most of the farms having both cropping and livestock. The region has a transition rainfall distribution, a characteristic between the mainly summer dominant norther region and winter dominant southern region. The hydrologic characteristics of the Red Kandosol sandy clay loam soil of the experimental site are given in Table 1. The soil has organic carbon of 1.4% and pH of 6.5 [20]. The experimental area consists of 24 experimental plots that are physically and hydrologically separated from each other by 24 buffer plots. Each of the experimental and buffer plots are 5 m long and 1.8 m wide. Between each plot, there is a 0.5 m gap on each side providing access for monitoring, sampling, and data collection. That means there is a 2.8 m gap between the experimental plots. A completely randomised factorial design with two watering regimes and four grazing treatments as factors and three replications was used. The two watering regimes were unirrigated treatment and irrigated treatment. The grazing treatments were “ungrazed”, “grazed” on 31 May (Zadoks growth stage (GS) 25), grazed on 25 July (GS 32), and grazed both on 31 May (GS 25) and 25 July (GS 32) [21]. These were designated as D0, D1, D2, and D3, respectively, for dryland/unirrigated treatment and I0, I1, I2, and I3, respectively, for the irrigated treatment (Table 2). One meter length of each plot was mowed to a height of 7 cm above the ground level.
The crop was sown on 16 March after 10 mm of water was applied to all the plots. Six rows of wheat per plot, at 30 cm row spacing, were sown per plot for a target population of 150 plants/m2. The crop emergence was on 22 March. As there was no rainfall, one week after emergence, another 15 mm of water was applied to all the plots for establishment. Grazing or mechanical mowing of vegetative part can induce N stress during the grain filling period, as the accumulated N in the vegetative part is removed during grazing or mowing [6]. In order to encourage crop recovery after grazing, split nitrogen fertiliser application was used. At the time of sowing, nitrogen fertiliser was applied to all the plots at a rate of 100 kg N ha−1. All the plots were top-dressed with 50 kg N ha−1 on 7 June 2018. After the second grazing on 25 July 2018, the irrigated plots were top-dressed with another 50 kg N ha−1. This was to avoid nitrogen being the limiting factor in the well-watered treatments.
Soil moisture was measured using a neutron probe calibrated at the site [20]. One access tube per plot was installed to a 1.5 m depth. Soil moisture content was measured at 15, 30, 45, 60, 90, and 120 cm depths at a fortnightly interval, on average.
2.1.2. Rainfall and Irrigation
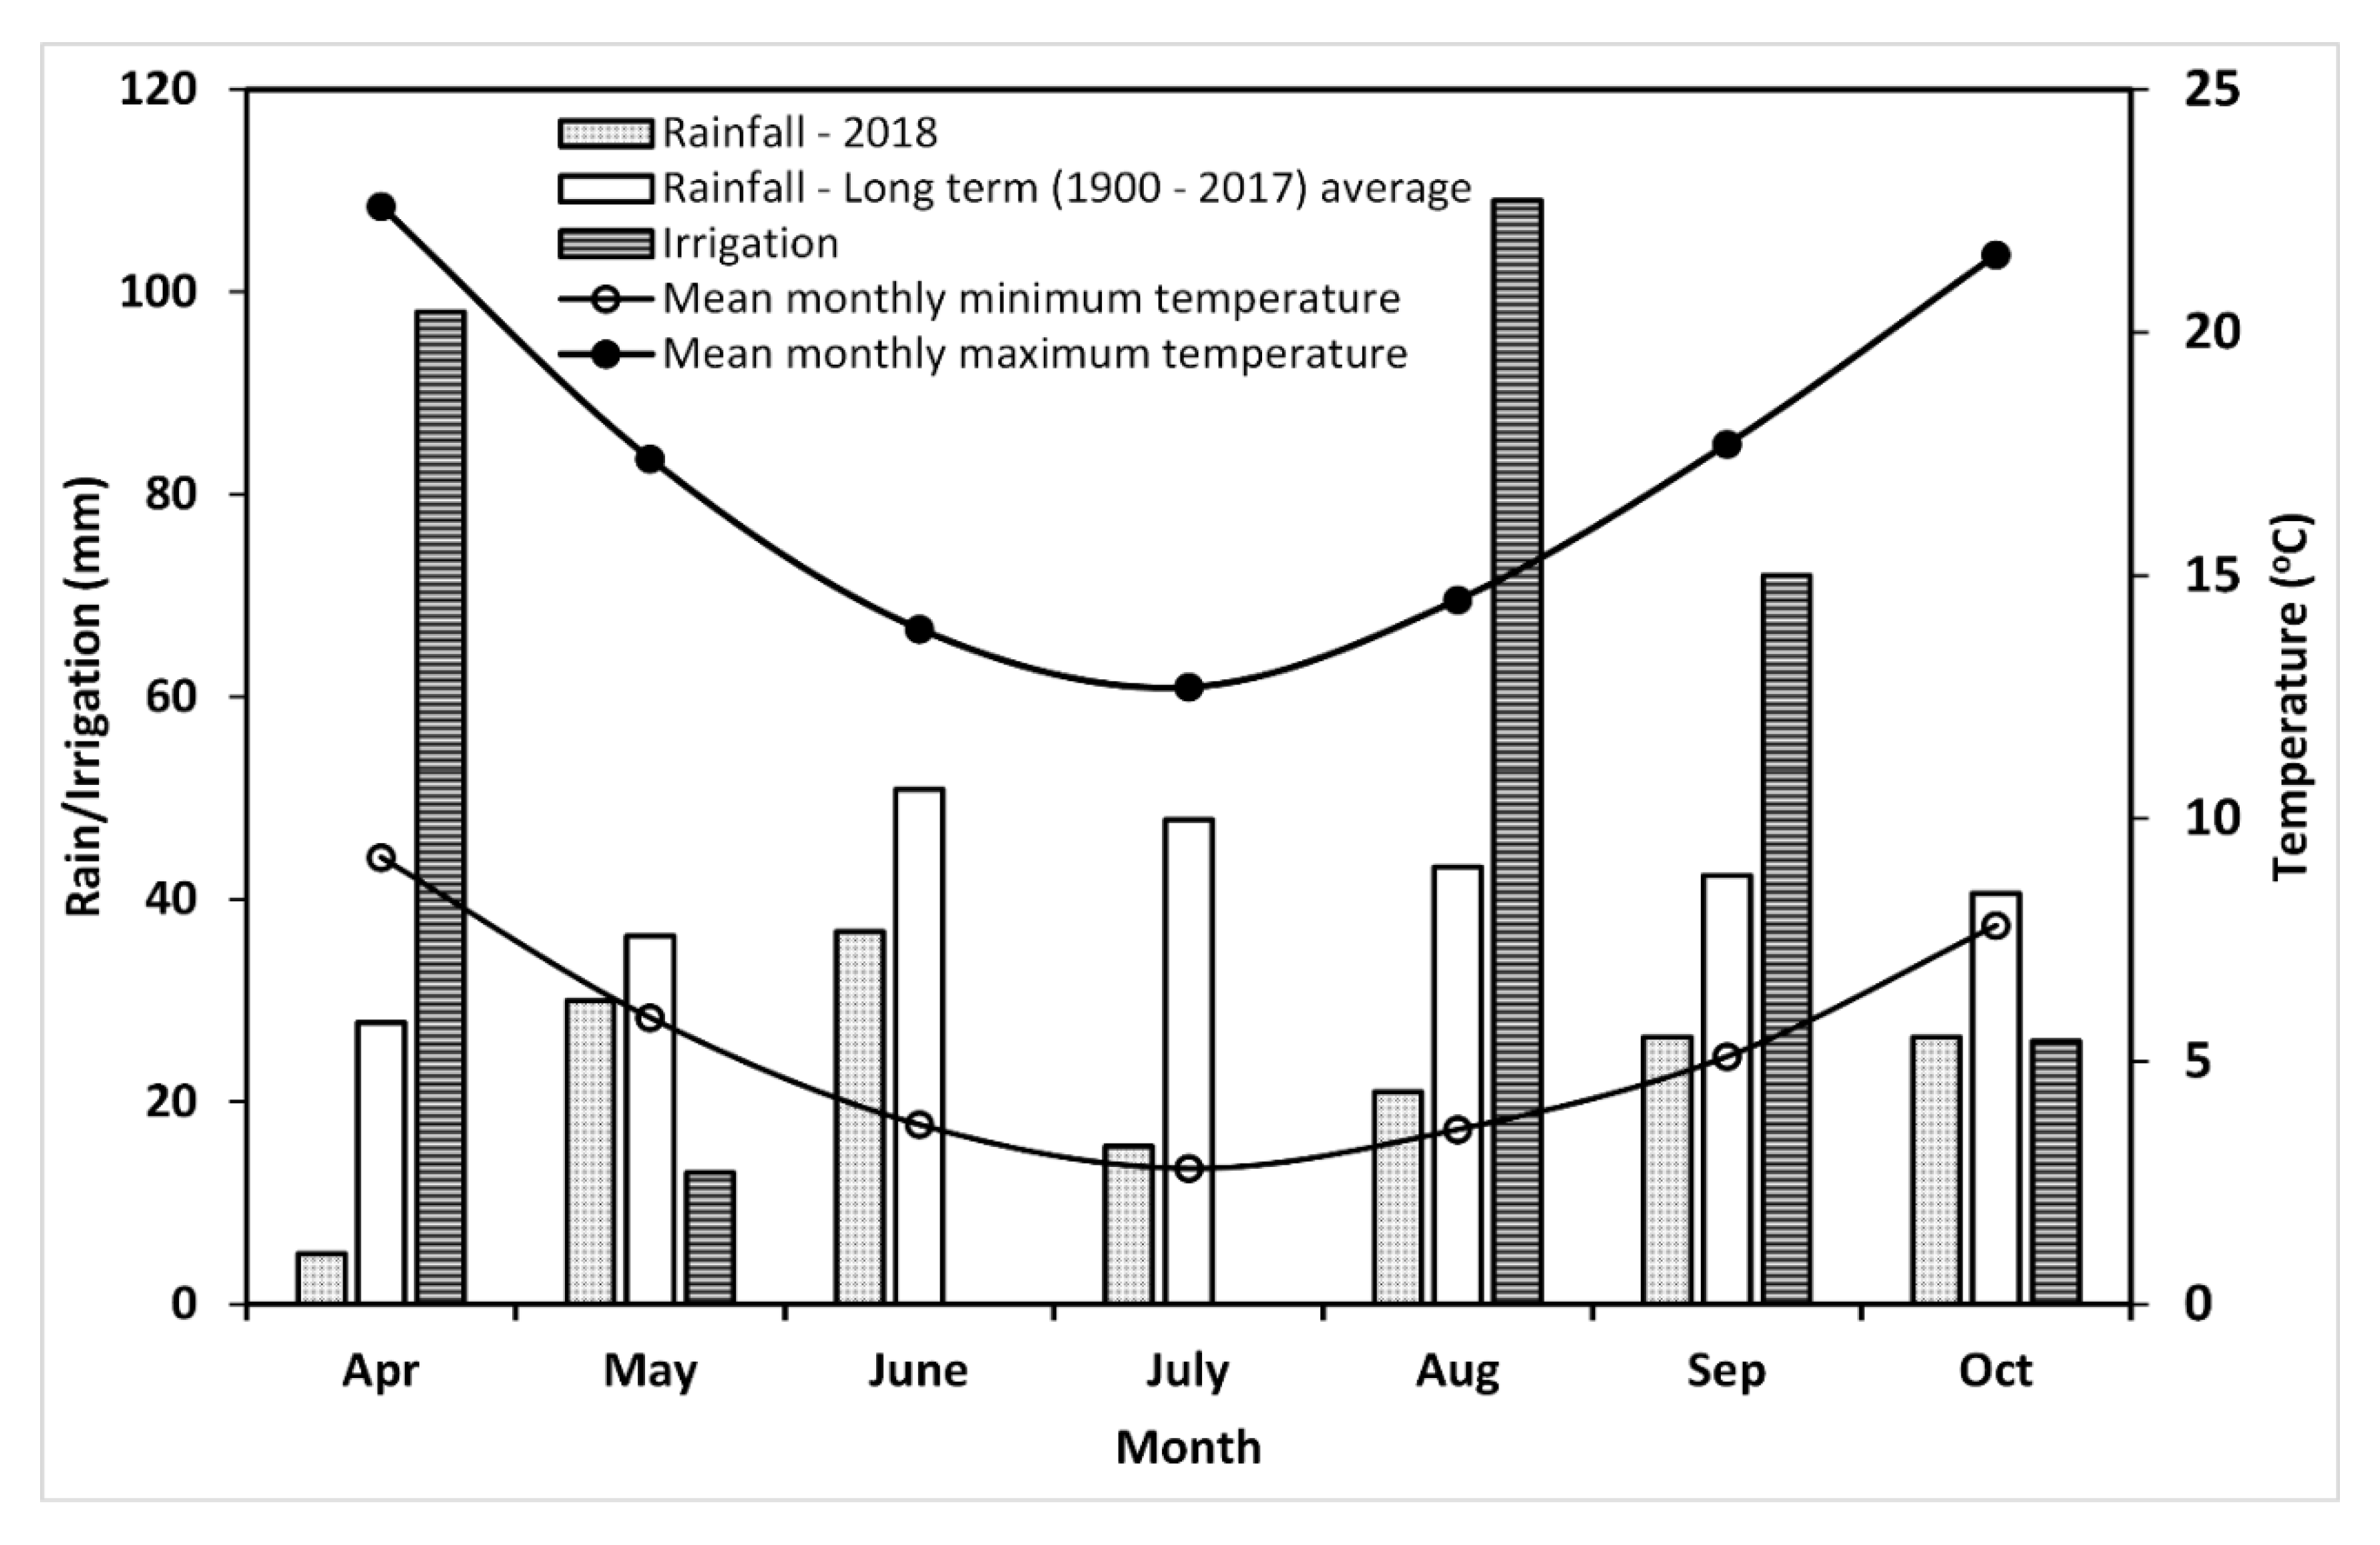
The weather data for the study site, Wagga Wagga, were obtained from the Australian Bureau of Meteorology (http://www.bom.gov.au/) and the Scientific Information for Land Owners (SILO) climate database (https://www.longpaddock.qld.gov.au/silo) (Figure 1). The historical average annual and winter cropping season (April–October) rainfall are 515 mm and 330 mm, respectively. However, the 2018 winter cropping season rainfall was only 161 mm (only about 50% of the long term average); the 2018 season was one of the driest on record. Irrigation was applied using a drip irrigation system. For each irrigated plot, four drip laterals with drippers of discharge 1.6 L h−1 and 30 cm spacing were used. An automatic valve was used to control the amount of irrigation. Buffer plots on either sides of the irrigated treatments were also irrigated. For the irrigated treatment, the amount of irrigation water applied was 328 mm. Rainfall plus irrigation (489 mm) constitutes 50% more than the historical average rainfall in the region. The irrigated treatments simulate a wet, above-normal season. Historical average annual maximum and minimum temperatures are 22.5 and 9.2 °C, respectively. Potential evapotranspiration follows the temperature trend shown in Figure 1, with potential evapotranspiration being higher than average monthly rainfall for all the months except June and July. Irrigation was not applied during these two winter months.
2.1.3. Crop Data
The normalised difference vegetation index (NDVI) was measured throughout the season at a set distance of 80 cm over the vegetation using a hand-held GreenSeeker© (NTech Industries Inc., Ukiah, CA, USA). Grazing was simulated by mechanically mowing the crop from 1 m length of the plot at 7 cm height. It is important to note that mechanical mowing is a not a realistic grazing scenario. Genuine livestock grazing involves other aspects such as soil compaction and excrement, which can affect soil quality and crop growth. The mowed biomass was dried in an oven at 70 °C. On 16 May, 30 May, 22 June, 3 July, and 25 July, the total above-ground dry matter was determined by cutting 60 cm of plant row at the ground level, from either end of the plots, excluding the central 1 m length of the plot. Dates of sowing, emergence, heading, flowering, and harvesting were noted. By 25 September, all the treatments, except D2, D3, I2, and I3, had started flowering and ended flowering on 4 October. However, D2, D3, I2, and I3 treatments started flowering only on 5 October and ended flowering on 12 October. Plant height was determined in-situ by measuring the average height of the top of the head above the ground level at maturity. At the end of the season, the crop was harvested by cutting the central 2 m × 1.8 m of each plot. The harvested plant material was dried in an oven at 70 °C and weighed to determine the AGDM at harvest. Harvested plant material was thrashed to separate out the grain using a trasher. The separated grain was weighed to determine the grain yield. The 1000 seed weight was determined by counting 1000 seeds using a seed counter and weighing. The harvest index was calculated as a ratio of grain yield and AGDM.
2.1.4. Crop Evapotranspiration and Water Use Efficiency
Crop water use was determined using the following water balance equation:
where ETa is actual evapotranspiration; R is rainfall; I is irrigation water; DP is deep percolation; RO is runoff; and ∆S is change in soil moisture storage. The exceptionally low amount and intensity of rainfall during the season and drip-irrigation mean that no runoff and deep percolation below the maximum rooting depth were expected. For the dryland/non-irrigated treatment, the simulation results using APSIM confirmed this to be case, no runoff and no deep percolation below the root zone. For the irrigated treatment, APSIM simulation indicated 70 mm of deep percolation and no runoff.
The change in soil moisture content was determined from successive soil moisture measurements made using the neutron probe.
Water use efficiency on an AGDM basis (WUEdm) was calculated as follows:
Water use efficiency on a grain yield basis (WUEgr) was determined as follows:
where WUEdm = water use efficiency on dry matter basis (kg ha−1 mm−1); AGDM = above–ground dry matter (biomass) production (kg ha−1); ETa = actual evapotranspiration (mm); WUEgr = water use efficiency on grain yield basis (kg ha−1 mm−1); Y = grain yield (kg ha−1).
Irrigation water use efficiency (IWUE) was calculated as follows:
where Yi is irrigated grain yield, Yd is dryland/unirrigated grain yield (kg ha−1), and I is the amount of irrigation (mm).
2.1.5. Statistical Analysis
The analysis of variance package of the statistical software R [22] was used for the analysis of variance of crop growth and harvest parameters. Significance was considered at p < 0.05 and, where differences occur within significant interactions, Fisher’s Least Significant Difference (LSD) test was used to detect the interactions.
2.2. Simulation Analysis
The Agricultural Production Systems sIMulator (APSIM) [16,23] version 7.10 was used to simulate the effects of sowing date on the winter wheat AGDM and grain yield. APSIM is a farming system modelling framework comprising weather, soil, and crop biophysical processes and managements. In the APSIM specific crop (wheat in this case) module, soil water module (SOILWAT), nitrogen module (SOILN), and residue module (RESIDUE) are linked. Development stage dependent empirical coefficients were used to partition the AGDM into different organs. Abiotic, water, and nitrogen stresses were used to adjust dry matter accumulation. The Scientific Information for Land Owners (SILO) patched point climate dataset of the Wagga Wagga Agricultural Institute station was used (https://www.longpaddock.qld.gov.au/silo). The soil information required by the APSIM model was obtained from the APSOIL data base (https://www.apsim.info/Products/APSoil.aspx). APSIM has been already calibrated and tested for wheat growth, development, and yield over a wide range of environments in Australia [24,25]. In this study, the measured soil water content, grain yield, and dry matter data of the experiment conducted at Wagga Wagga, NSW were used to test the model performance.
The potential AGDM at different growth stages was simulated for rainfed wheat (cv. Wedgetial) sown at weekly intervals from March to May for the period 1950–2018. A non-limiting amount of nitrogen fertiliser (150 kg N ha−1) was applied. The crop was sown when there would be 25 mm of rainfall in the past seven days and there would be 100 mm of plant available water in the rootzone. However, if these conditions are not satisfied, the crop would be sown at the end of the given sowing window. The sowing rate was for 150 plants m−2 at a row spacing of 20 cm. The soil water profile was set to 75% full at the time of sowing. For the 12 sowing windows (weeks in March, April, May) of 1950–2018, the amount of AGDM at the end of each month was simulated, from which the AGDM at the end of each of the three months (May, June, July) was determined. The probability of exceedance was determined by ranking the simulated AGDM for each month in a descending order and plotted for different sowing dates. Polynomial regression equations were developed for the rate of decrease of the AGDM as the sowing date is delayed from March to May. In order to see the effect of the sowing dates on yield, potential yield was simulated and presented as a box-plot for the crop sown at weekly intervals from March to May. The change in harvest index for different sowing dates from March to May was also determined and presented as a box plot.
The consistent climate change scenarios (CCS) database of the Department of Science, Information Technology, and Innovation of the Queensland Government (Australia) provides spatially and temporally complete historical baseline climate datasets (https://legacy.longpaddock.qld.gov.au/climateprojections/about.html). It also provides easy to access climate change projections in model-ready formats for individual locations or regions across Australia (https://www.longpaddock.qld.gov.au/silo). In the projections data, 19 General Circulation Models (GCMs) composites are available, as using climate projections from a single GCM can lead to large errors because of the inherent assumptions in the models, model bias, and suitability for a given region (https://legacy.longpaddock.qld.gov.au/climateprojections/index.html?csrt=7138017442188222990). Four representative concentration pathways (RCPs) are identified in the IPCC AR5 (Intergovernmental Panel on Climate Change, Assessment Report 5), namely, RCP2.6, RCP4.5, RCP6, and RCP8.5. In this study, RCP4.5—which corresponds to an anthropogenic radioactive forcing reaching 4.5 W/m2 by 2100 relelative to the preindustrial level—and RCP8.5—a high emmision scenario with a radiative forcing of 8.5 W/m2 by 2100—were used [26]. A baseline period centred 1985 (1971–2000) and three future periods, centered 2030, 2050, and 2070, were selected.
3. Results and Discussion
3.1. Field Experiment
Field experimental results of soil water content, crop canopy and biomass growth, harvest parameters, and water use efficiency are presented and discussed.
3.1.1. Soil Water Dynamics
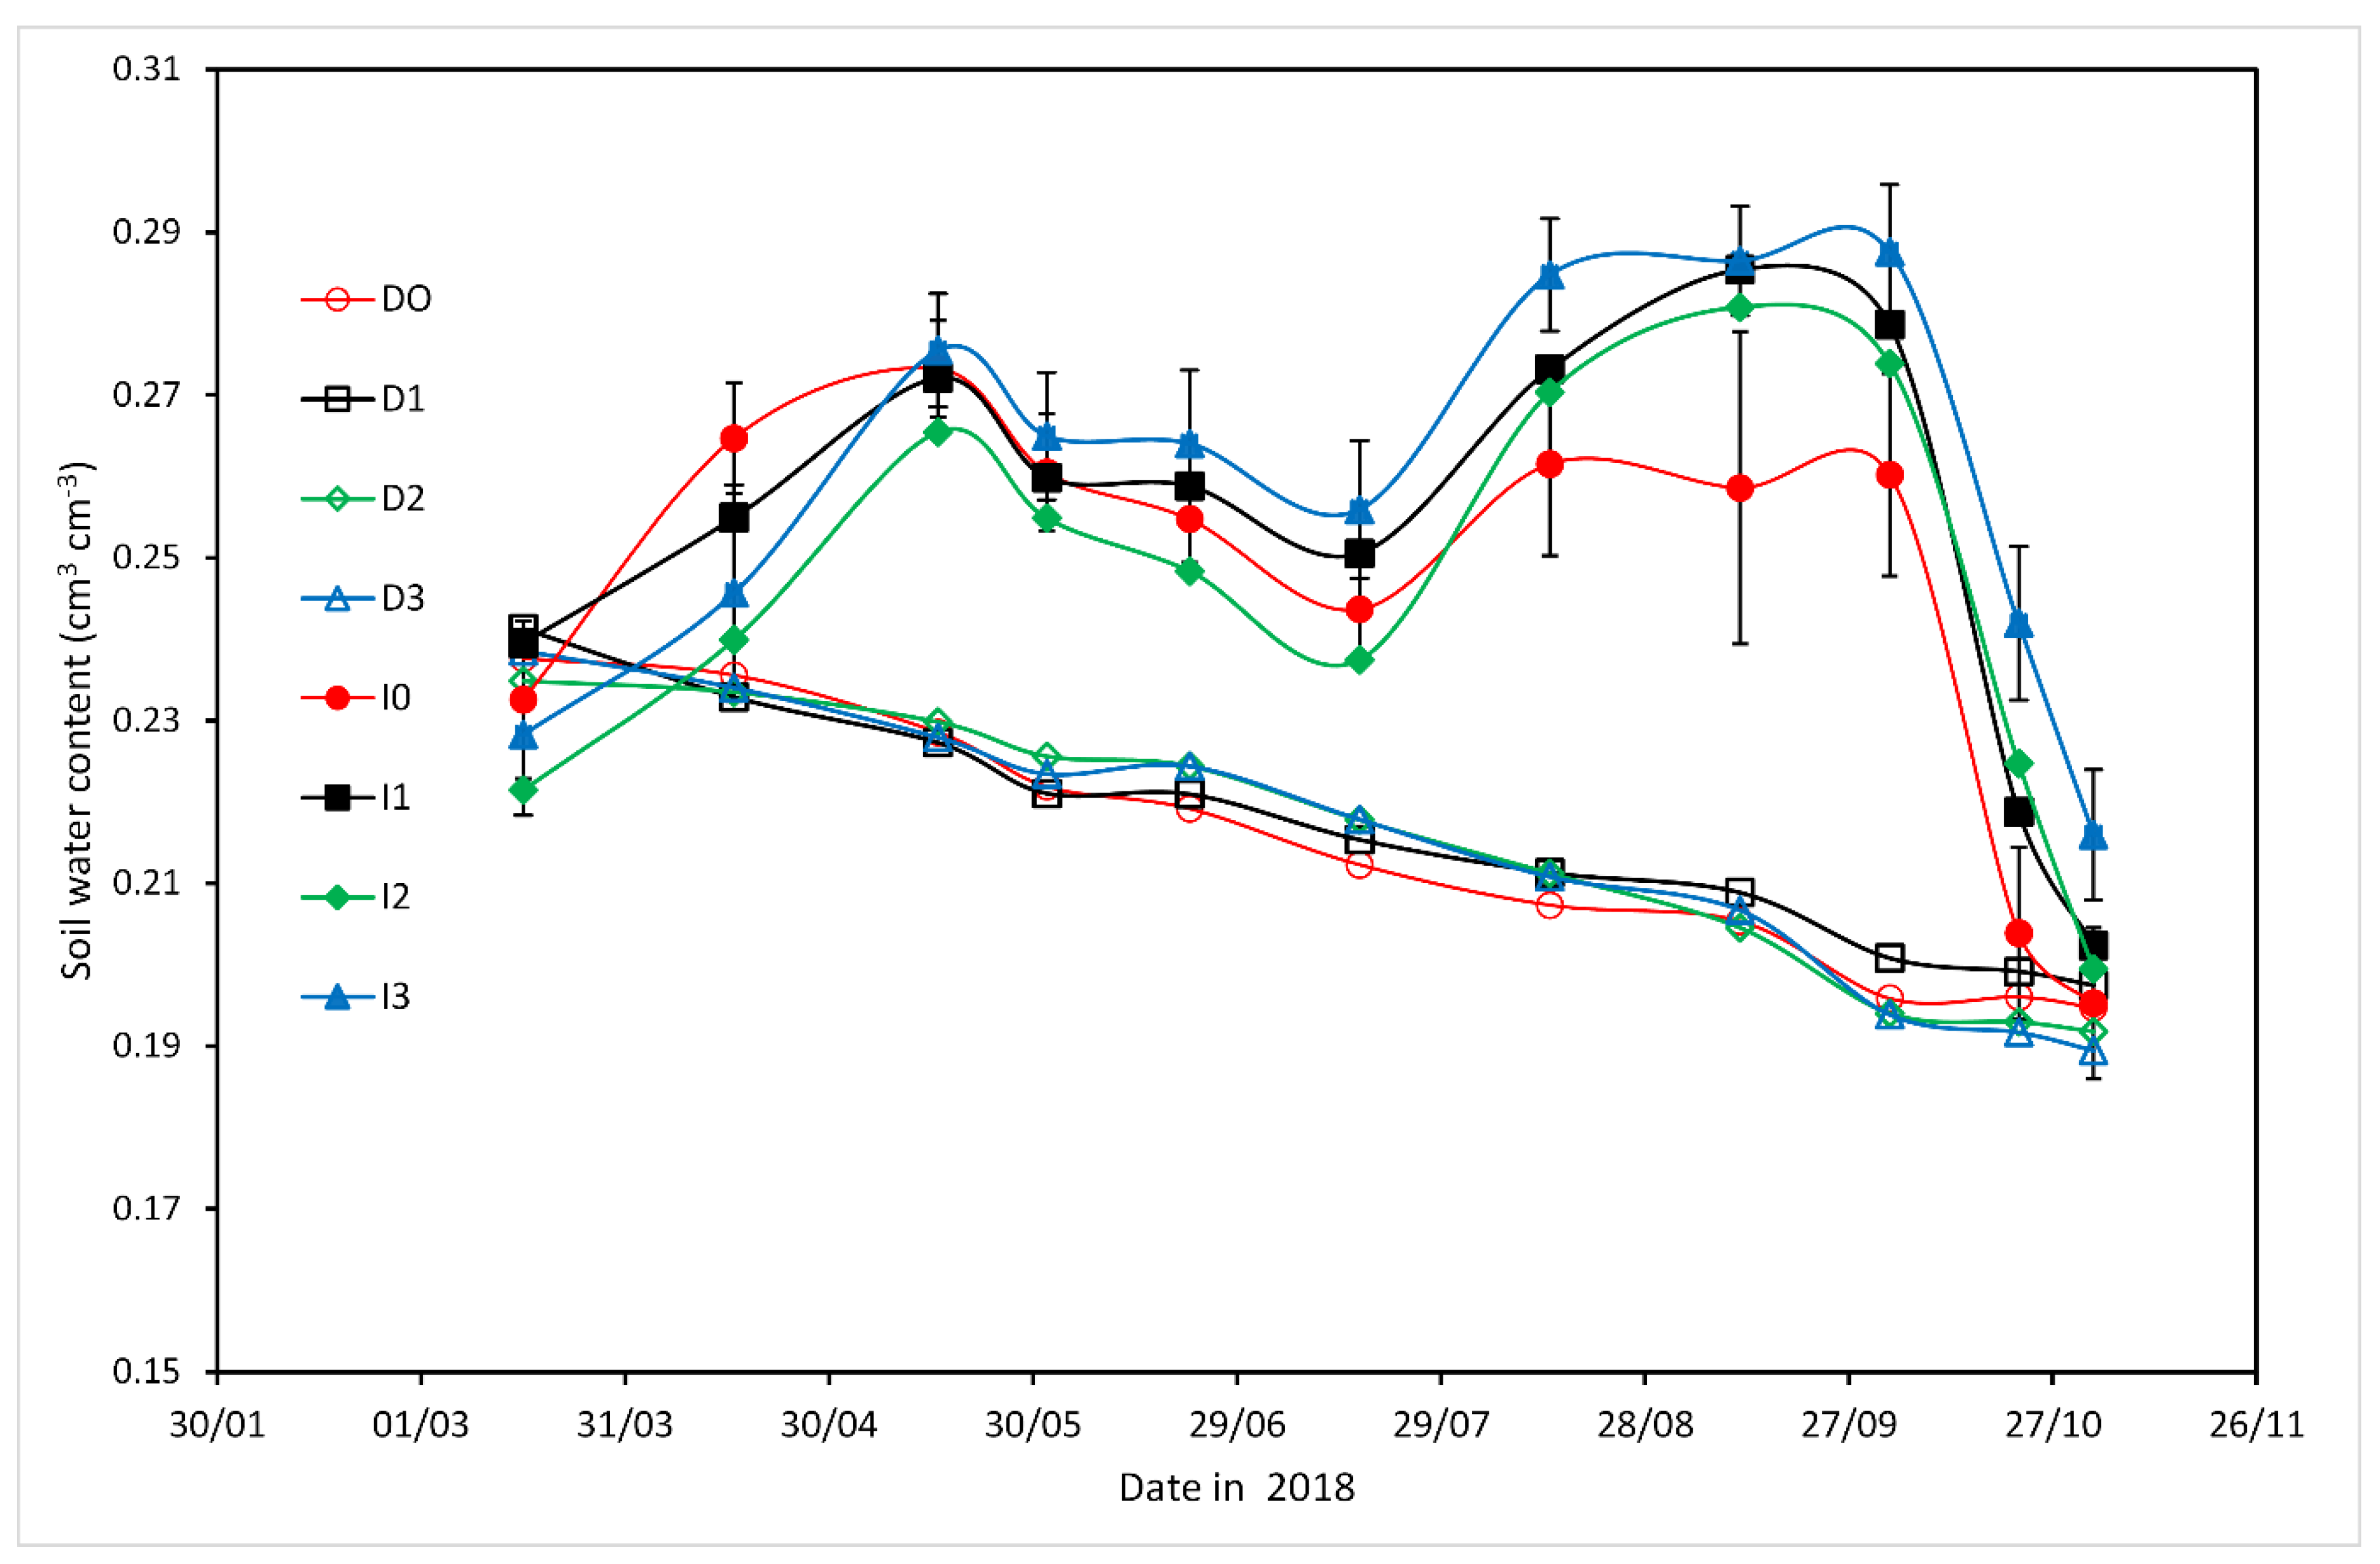
Figure 2 shows the change in soil water content during the season for non-irrigated, irrigated, and different grazing treatments. Throughout the season, except at the end of the season, the water content of the irrigated treatment was higher than the initial/starting soil water content. The soil water content of non-irrigated treatment decreased almost linearly owing to low rainfall during the season, which was not sufficient to meet crop water demand. As the crop roots grew deeper and the canopy developed, the crop extracted more water from the soil.
For the irrigated treatment, the undefoliated treatment appears to have significantly depleted the soil water content compared with the defoliated treatment. This indicates that defoliated crop extracted less water from the soil, which could be because of the grazed crop having lower canopy cover and less evapotranspiration. When soil water is not limited, grazing can be used to conserve soil water during the vegetative stage and use it more effectively during the reproductive stage.
3.1.2. Crop Canopy Cover
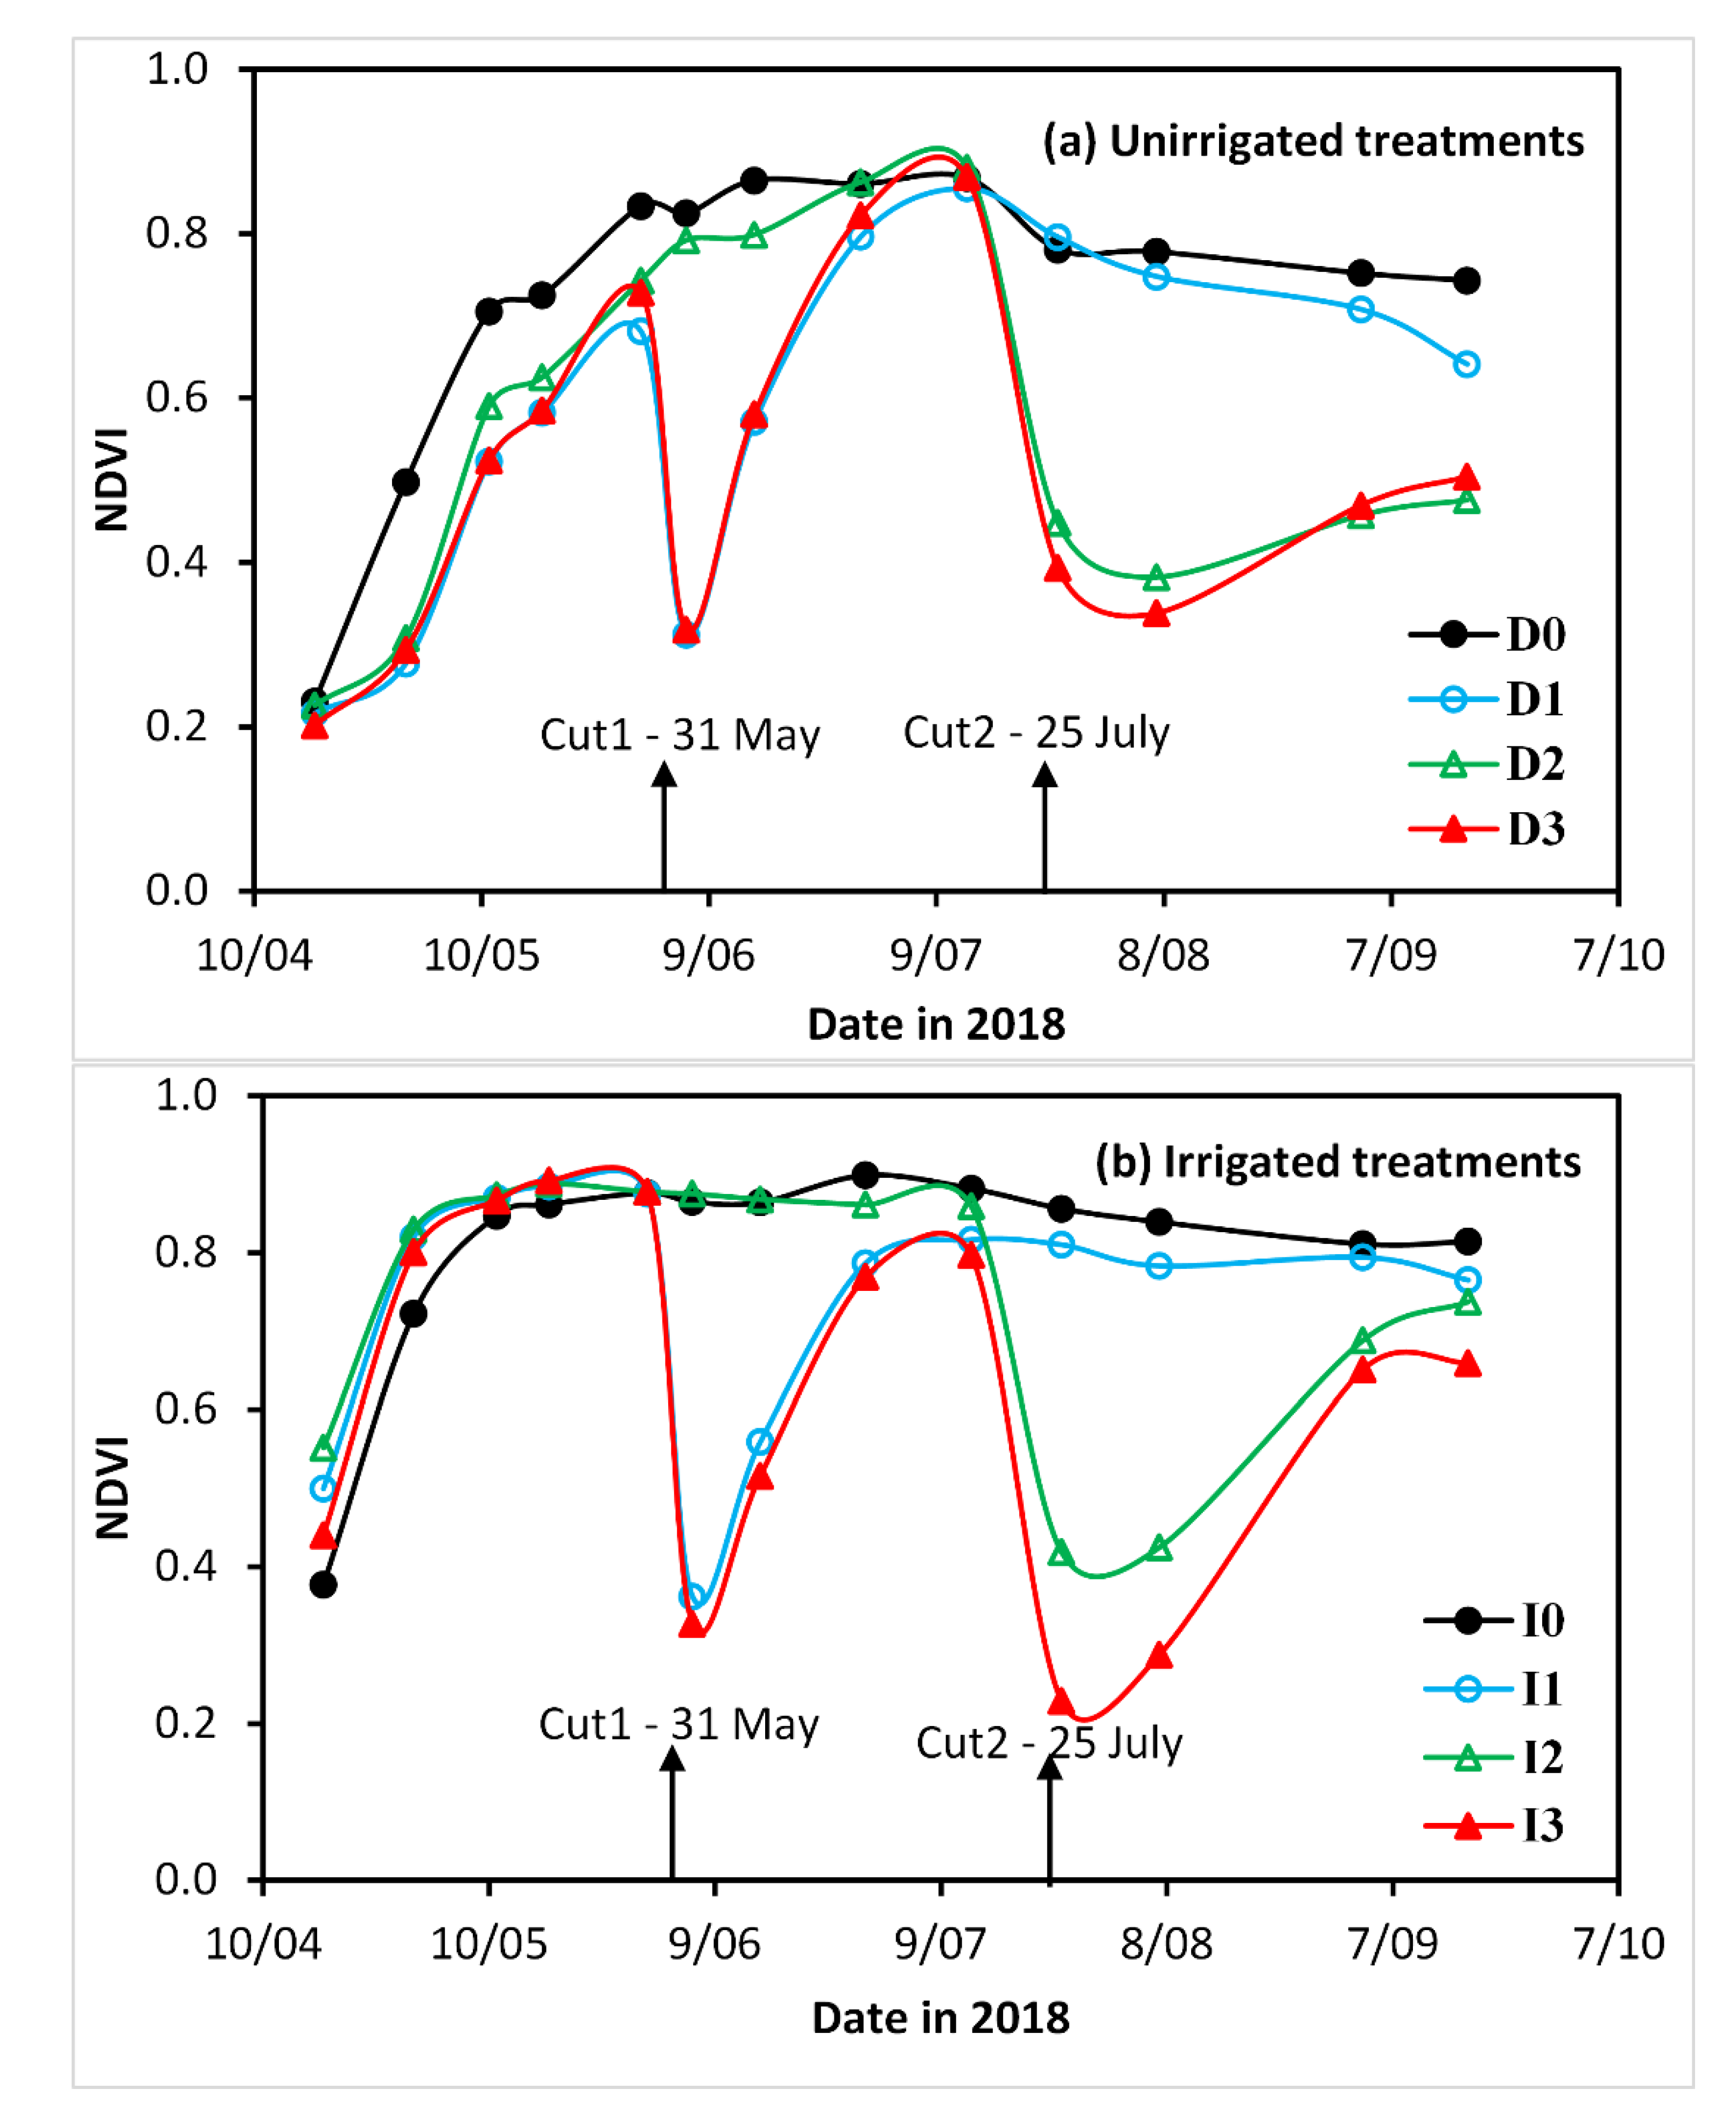
Normalized difference vegetation index (NDVI) monitored until mid-September is shown in Figure 3. It can be seen that the canopy cover of “ungrazed” treatments of both non-irrigated and irrigated treatments remained high throughout this period. All the treatments recovered quickly from the first grazing on 31 May. However, the recovery was not that quick for the second grazing on 25 July. This is especially the case for the unirrigated treatment, which remained at the NDVI value of 0.5 for both D2 and D3 treatments. The irrigated treatments were able to recover to the NDVI values of about 0.7. There appears to be no significant difference between the recovery of the treatments “grazed” for the first time at GS 32 (D2 and I2) and those “grazed” twice at GS 25 and GS 32 (D3 and I3), respectively. As indicated in Table 3 as well, there is no significant difference between grazing once at GS 25 and grazing twice at GS 25 and GS 32. Therefore, the timing of grazing is determined by the feed requirement of the livestock during the season.
3.1.3. Above-Ground Dry Matter
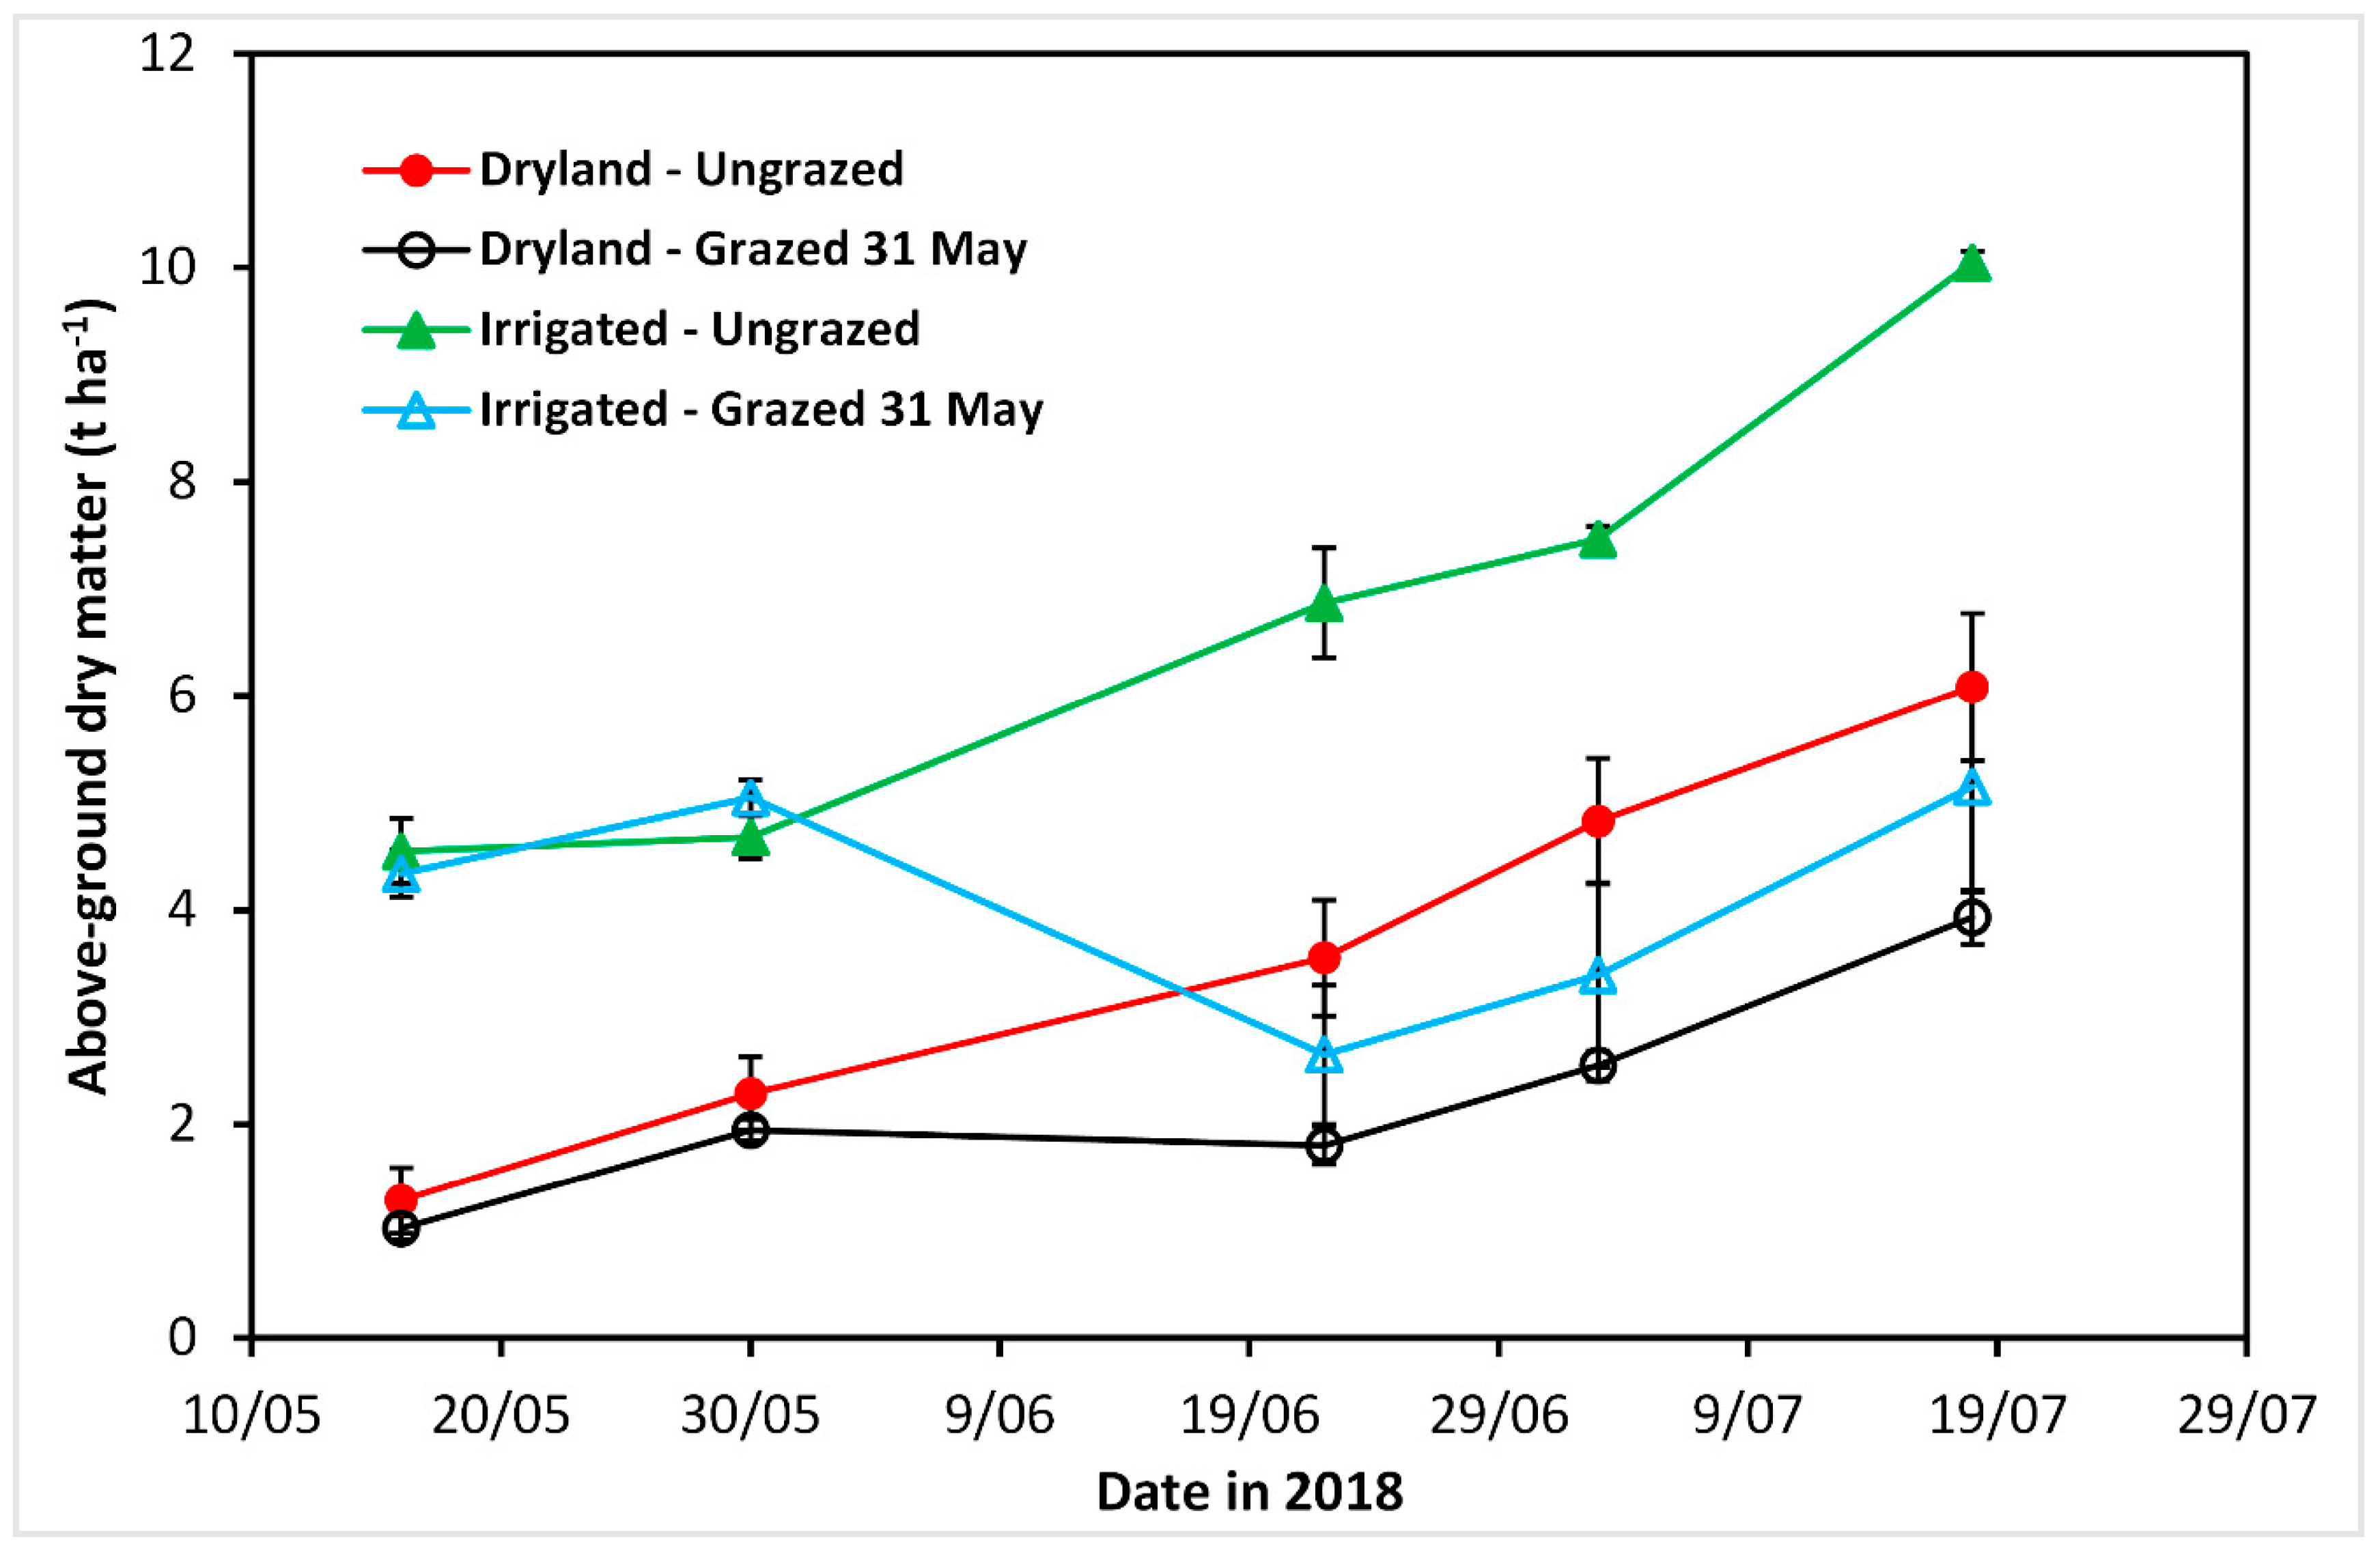
The analysis of variance is presented in Table 3 and Table 4. Figure 4 shows the AGDM of the different grazing and watering regime treatments for the wheat grazed on 31 May. The time of grazing had a significant effect (p < 0.05) on the forage dry matter. However, re-grazing an already grazed crop did not have significant effect on the dry matter. The total above-ground dry matter (AGDM) obtained by grazing only once towards the end of the feasible grazing period was not significantly different from the AGDM obtained by grazing earlier during this period and grazing it again towards the end of this period.
At the first biomass cut (31 May), the total AGDM obtained by mowing the wheat to the ground level of the unirrigated treatment was 2.29 t ha−1 (Figure 4), the grazed AGDM obtained by mowing the wheat at 7 cm above ground level was 1.01 t ha−1, and the residual AGDM (the difference between total and grazed AGDM) was 1.28 t ha−1 (Table 3). For the irrigated treatment, the total AGDM was 4.68 t ha−1, the grazed AGDM was 3.32 t ha−1, and the residual AGDM was 1.36 t ha−1. For the first grazing time (31 May), irrigation increased the amount of grazed AGDM by 229%. Similarly, from Table 3, for the twice-grazed treatment, irrigation increased the amount of grazed AGDM only by 37% compared with dryland treatment. For the once-only-grazed (25 July) treatment, irrigation increased the amount of grazed AGDM by 22%. At harvest, the AGDM for all the grazed/unirrigated treatments was significantly low. This was because of the dry winter and spring seasons with only 45% of long term average rainfall. In both unirrigated (8.11 t ha−1) and irrigated (13.86 t ha−1) treatments, the ungrazed treatments had a significantly (p < 0.05) higher AGDM at harvest than the grazed treatments.
For the unirrigated treatment, the amount of grazed AGDM was 3.46 t ha−1 and 3.55 t ha−1 when grazed only once (mid-July) or grazed twice (31 May and 25 July), respectively (Table 3). For the irrigated treatment, the amount of grazed AGDM at the end of May was 4.73 t ha−1, while grazing twice (31 May and 25 July) resulted in AGDM of 4.34 t ha−1. This result, no significant difference (p > 0.05) between the AGDM available for grazing (AGDM removed) on 31 May and 25 July, shows that there was no significant biomass growth during the winter period. If dual-purpose winter wheat is sown early, it develops a high amount of biomass during the autumn months before the temperature drops. AGDM of 1.01 (31 May), 3.46 (25 July), and 3.55 t ha−1 (both 31 May and 25 July) provide a high-value forage at a time of low feed availability. In irrigated treatments (normal/above normal rainfall year), these results were 3.32 (31 May), 4.73 (25 July), and 4.34 t ha−1 (both 31 May and 25 July).
3.1.4. Crop Height
Both the watering regime and grazing had a significant effect (p < 0.05) on crop height. The ungrazed and early (31 May) grazed irrigated treatments were the tallest, while all the unirrigated/grazed (D1, D2, D3) treatments were the shortest, only half as tall has the ungrazed irrigated treatment. The twice-grazed crops were about 20% shorter than the ungrazed treatments.
3.1.5. Crop Yield and Harvest Index
Long term (2004–2010) average yield of early sown Wedgetail in south-eastern NSW is 3.01 t ha−1 (https://www.nvtonline.com.au/). From Table 3, it can be seen that, for the unirrigated treatment, grazing at the end of May (31 May) increased grain yield by 7%, while single grazing on 25 July and grazing twice (31 May and again 25 July) increased grain yield by 18% and 24%, respectively, compared with the control/ungrazed treatment. However, for the irrigated treatments, these values were −16%, −42%, and −42%, respectively. These yield increases can be the result of moisture saving as a result of smaller crop canopy. The conserved water is used later in the season for grain filling [7]. The seasonal conditions, dry winter and dry spring, limited the yield potential in the ungrazed treatment. It hindered grain filling and resulted in smaller grains, while the defoliated crops were able to compensate and produce similar grain yields. In the limited soil water condition (unirrigated treatment), the ungrazed crop uses the soil water before anthesis and grain filling. However, grazing conserves soil water by limiting crop water use before anthesis. In water-limited environments, grazing can be used as a means of deterring excessive water use before anthesis.
In the irrigated treatment, the higher canopy growth of ungrazed treatment was converted to grain yield as soil water during anthesis and grain filling was not limited. For the irrigated treatment, grazing at the end of May (31 May) reduced grain yield by 16%, while grazing on 25 July and double grazing (31 May and again 25 July) reduced grain yield by 42% and 42%, respectively, compared with the control/ungrazed treatment. In seasons with a higher yield potential, such as the irrigated treatment, a higher anthesis biomass is needed, which defoliated crops may not be able to produce. The treatment that was grazed later had a significantly reduced biomass at anthesis and suffered a significant grain yield penalty.
When grazing of winter wheat continues beyond the critical stage (GS 31), it can result in a large reduction in AGDM, and when grazing stops sufficiently early, it allows sufficient time for the crop to recover and achieve similar grain yields to ungrazed crops [7]. This is especially the case when there is adequate soil moisture, as shown by the yield of rainfed versus irrigated treatments. When there is adequate soil moisture, grazing hampers the high grain potential. However, in a dryland situation, grazing can conserve soil water and result in a similar yield to that of ungrazed treatments. The late-grazed or twice-grazed treatments in the irrigated treatment had a high AGDM. However, the yield was significantly lower than the ungrazed and early grazed treatments. This is probably because of the fact that even if the crop had recovered its biomass, as it is sown early, it is already at an advanced stage of development. The ungrazed and early grazed irrigated treatments had the highest harvest. The ungrazed unirrigated treatment has the lowest harvest index owing to the relatively higher AGDM, compared with the grazed treatment, which depletes the soil water before the grain forming and grain filling period. Late flowering genotypes like Wedgetail have a low harvest index. To encourage re-growth of dual-purpose wheat and increase grain yield and dry matter production, split application of nitrogen fertilizer, at sowing and top-dressing, needs to be considered.
3.1.6. Seed Weight
There was no significant (p > 0.05) difference between the seed sizes from different grazing scenarios of the unirrigated treatment. However, there was significant main effect of irrigation on seed size; generally, the seeds from the irrigated treatments (31 mg) were bigger than the ones from the unirrigated treatment (29 mg). The ungrazed/irrigated treatment had the lowest grain size (28.8 mg) compared with the other irrigated treatments (32 mg). However, this treatment had the highest grain yield. The number of seeds in the grazed/irrigated treatments was 33% less than that of the ungrazed/irrigated treatment. This could be because of the relatively small head size. However, this treatment had the highest grain yield. This shows that there was a competition effect between the high numbers of grains in this ungrazed/irrigated treatment.
3.1.7. Water Use Efficiency
For the unirrigated treatment, the grazed treatments did not have significantly higher (p > 0.05) water use efficiency (6.9 kg m−3) compared with the ungrazed treatments (6.0 kg m−3). For the irrigated treatment, the ungrazed treatments had significantly higher water use efficiency (10.5 kg m−3) compared with the grazed treatments (7.3 kg m−3). The watering regime had a significant effect on dry matter water productivity, with unirrigated treatments having higher water use efficiency (28.75 kg m−3, average of the unirrigated treatments)) compared with the irrigated treatments (21 kg m−3, average of the irrigated treatments). For both the unirrigated and irrigated treatments, the ungrazed treatments had higher dry matter water use efficiency compared with the grazed treatments; 39.1 kg m−3 versus 25.3 kg m−3 (average of the grazed treatments) for the unirrigated treatment and 26.0 kg m−3 versus 19.3 kg m−3 (average of the grazed treatments) for the irrigated treatment. Grazing reduced the grain and dry matter irrigation water use efficiency. Delayed grazing significantly reduced the grain water use efficiency, with 10.95 kg m−3 for early grazing versus 4.5 kg m−3 for delayed grazing. Decisions about if and when to graze depend on the seasonal rainfall condition and whether the primary interest is on grain yield or dry matter production.
3.2. Simulation Analysis
The Agricultural Processes SIMulator (APSIM) was used to simulate the AGDM of a dual-purpose winter wheat Wedgetail sown at different times from March to May for the period 1950–2018.
3.2.1. Evaluation of APSIM
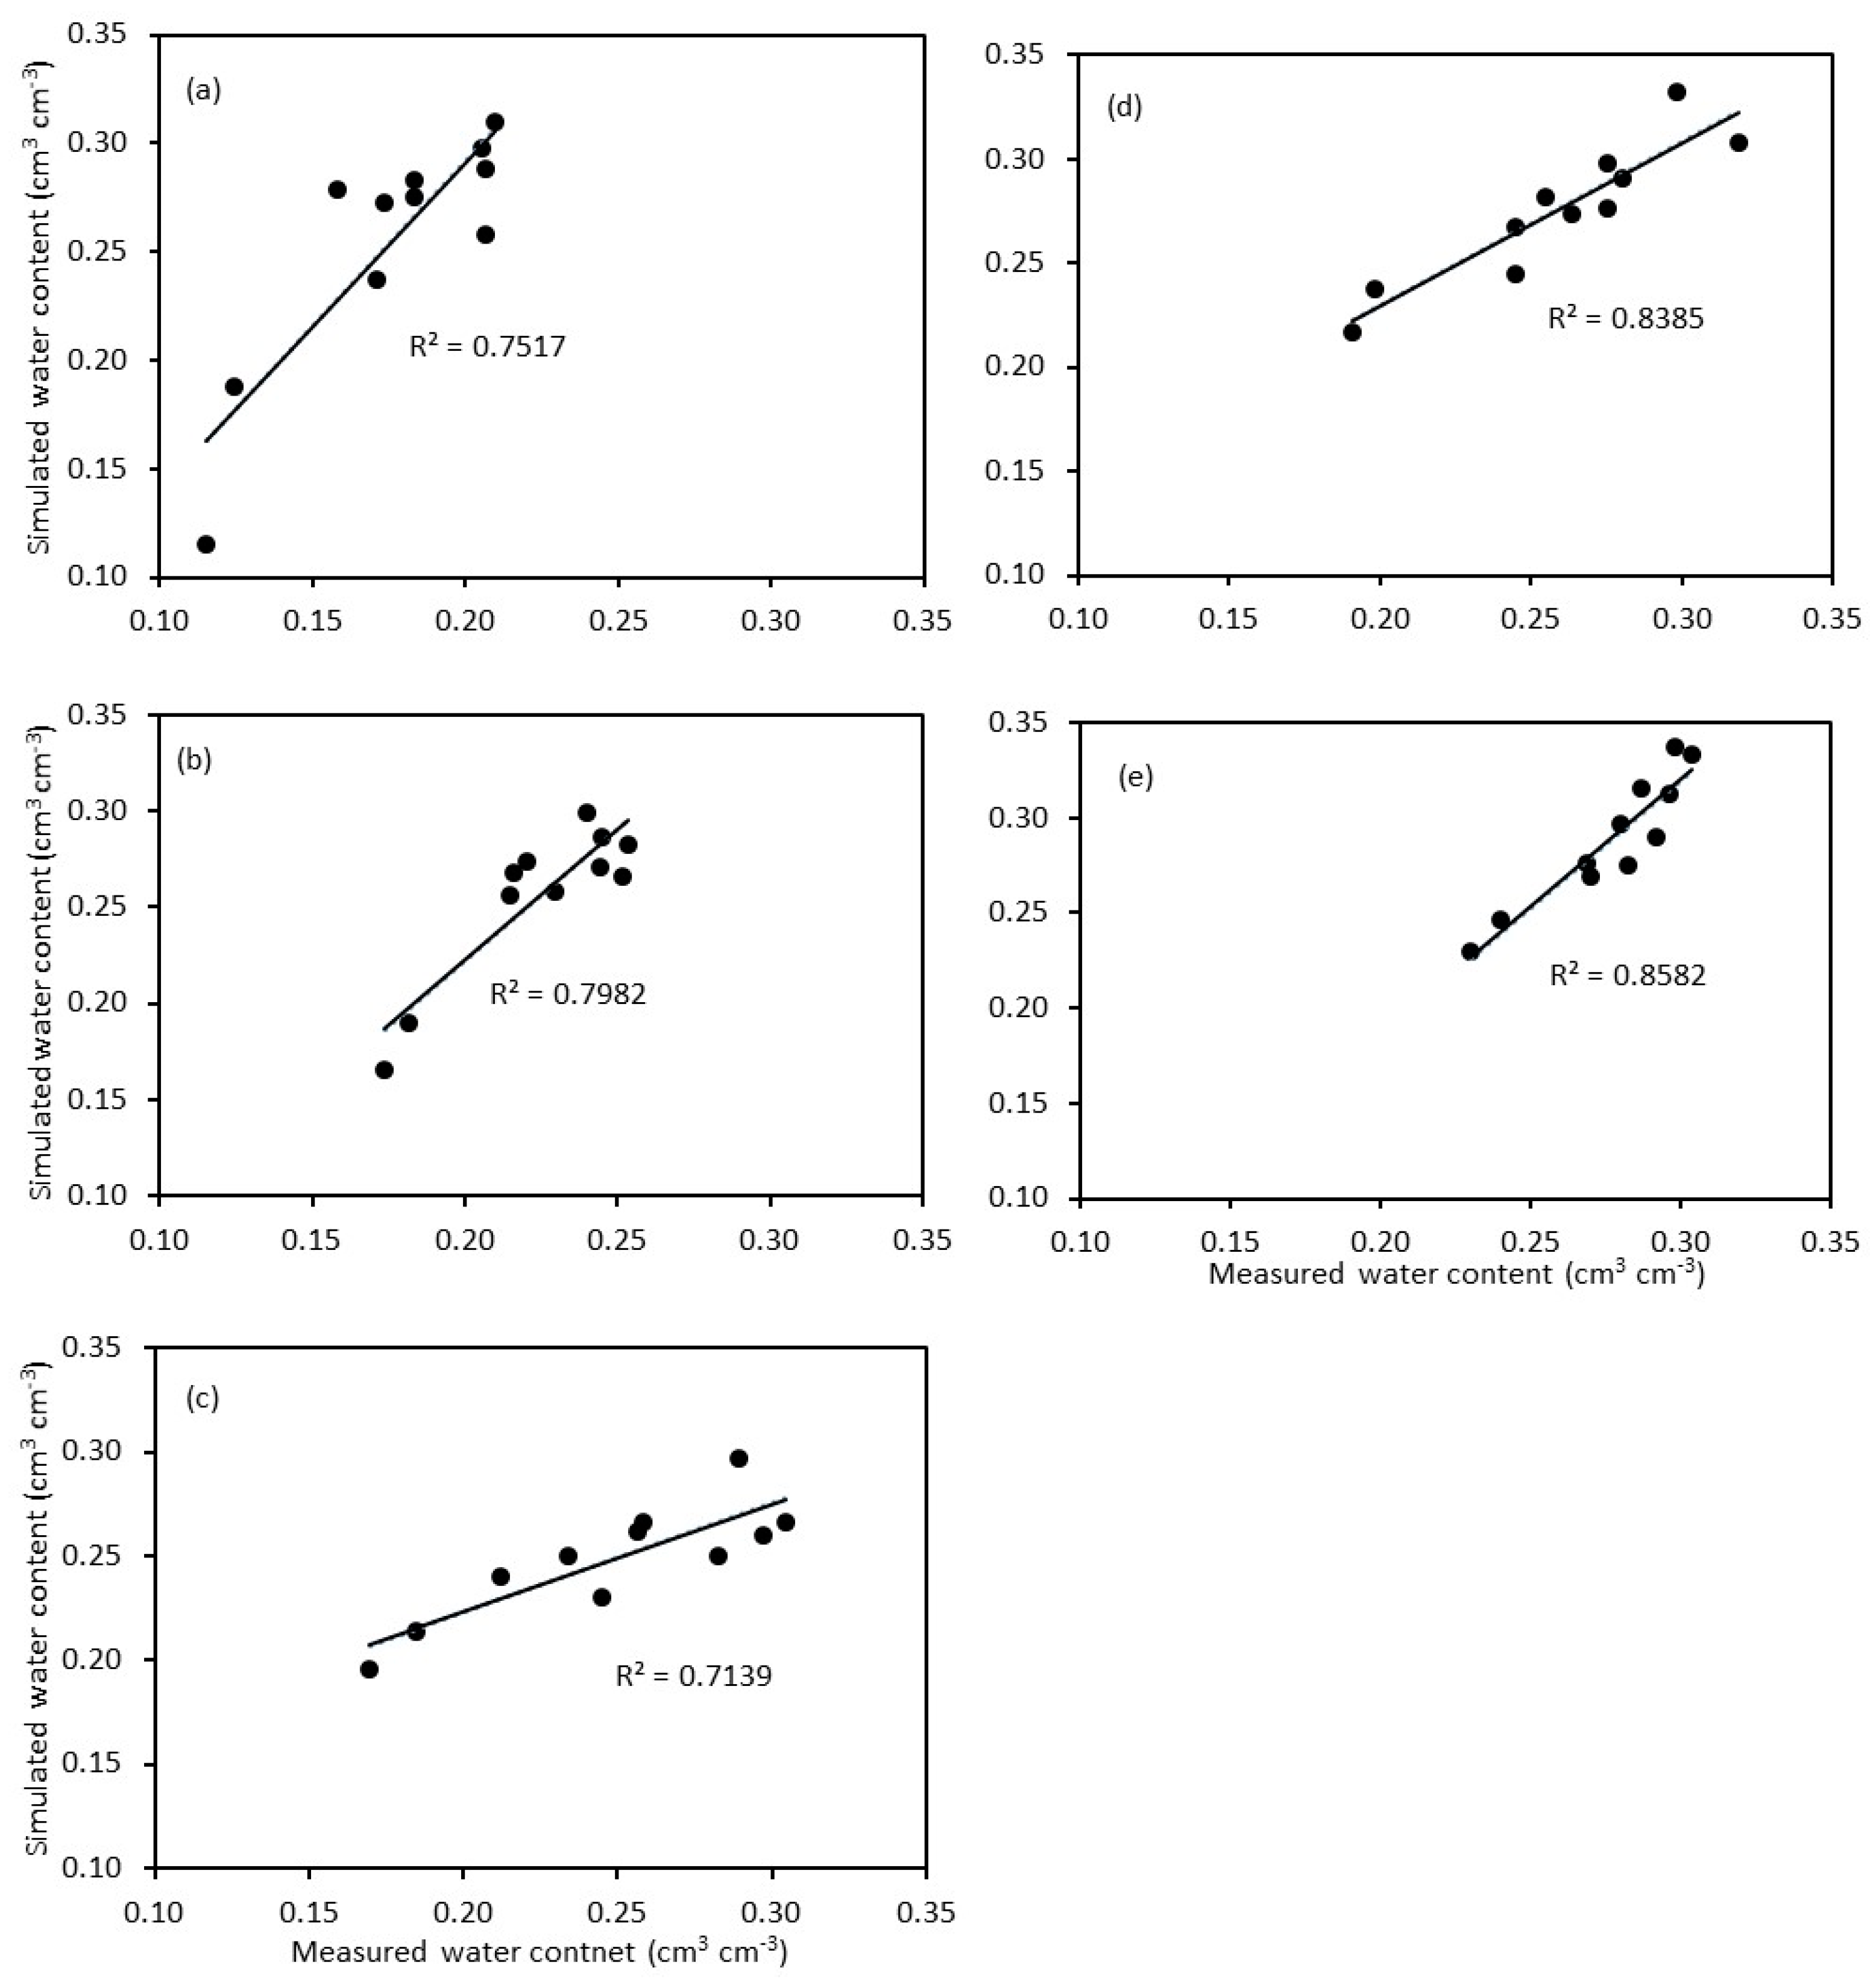
The performance of APSIM was tested by comparing the measured and simulated grain yield, above-ground dry matter, evapotranspiration, and soil water content at different depths for wheat (cv. Wedgetail) sown mid-March 2018. Accordingly, the observed and simulated yields of the unirrigated treatment were 1.25 (±0.15) t ha−1 (mean ± standard error) and 1.59 t ha−1 (0.34 t ha−1 deviation), respectively, while the observed and simulated yields of the irrigated treatment were 4.83 (±0.05) t ha−1 and 5.03 t ha−1 (0.20 t ha−1 deviation), respectively. In comparison with some earlier APSIM evaluation reports, this is an acceptable performance. In the evaluation of the APSIM—Wheat model for different wheat cultivars in the North China Plain, Zhang et al. [27] reported yield deviation varying 0.17–0.87 t ha−1. For APSIM—Wheat evaluation in South Australia, Yunusa et al. [28] reported 0.447 t ha−1 between measured and simulated grain yield. The observed and simulated above-ground dry matter of the unirrigated treatment were 8.11 (±0.43) t ha−1 and 9.6 t ha−1 (1.49 t ha−1 deviation), respectively, while the observed and simulated yields of the irrigated treatment were 13.9 (±2.06) t ha−1 and 15.7 t ha−1 (1.8 t ha−1 deviation), respectively. The observed and simulated evapotranspiration of the unirrigated treatment were 207 (±9.5) mm and 231 mm (24 mm deviation), respectively, while the observed and simulated evapotranspiration of the irrigated treatment were 460 (±12.8) mm and 466 (6 mm deviation), respectively. The measured and simulated soil water content at different soil depths is shown in Figure 5. The model has predicted the soil water content with a reasonable accuracy, as indicated by the relatively higher R2 values, except for a slight underestimation of high soil moisture content values.
3.2.2. Above-Ground Dry Matter
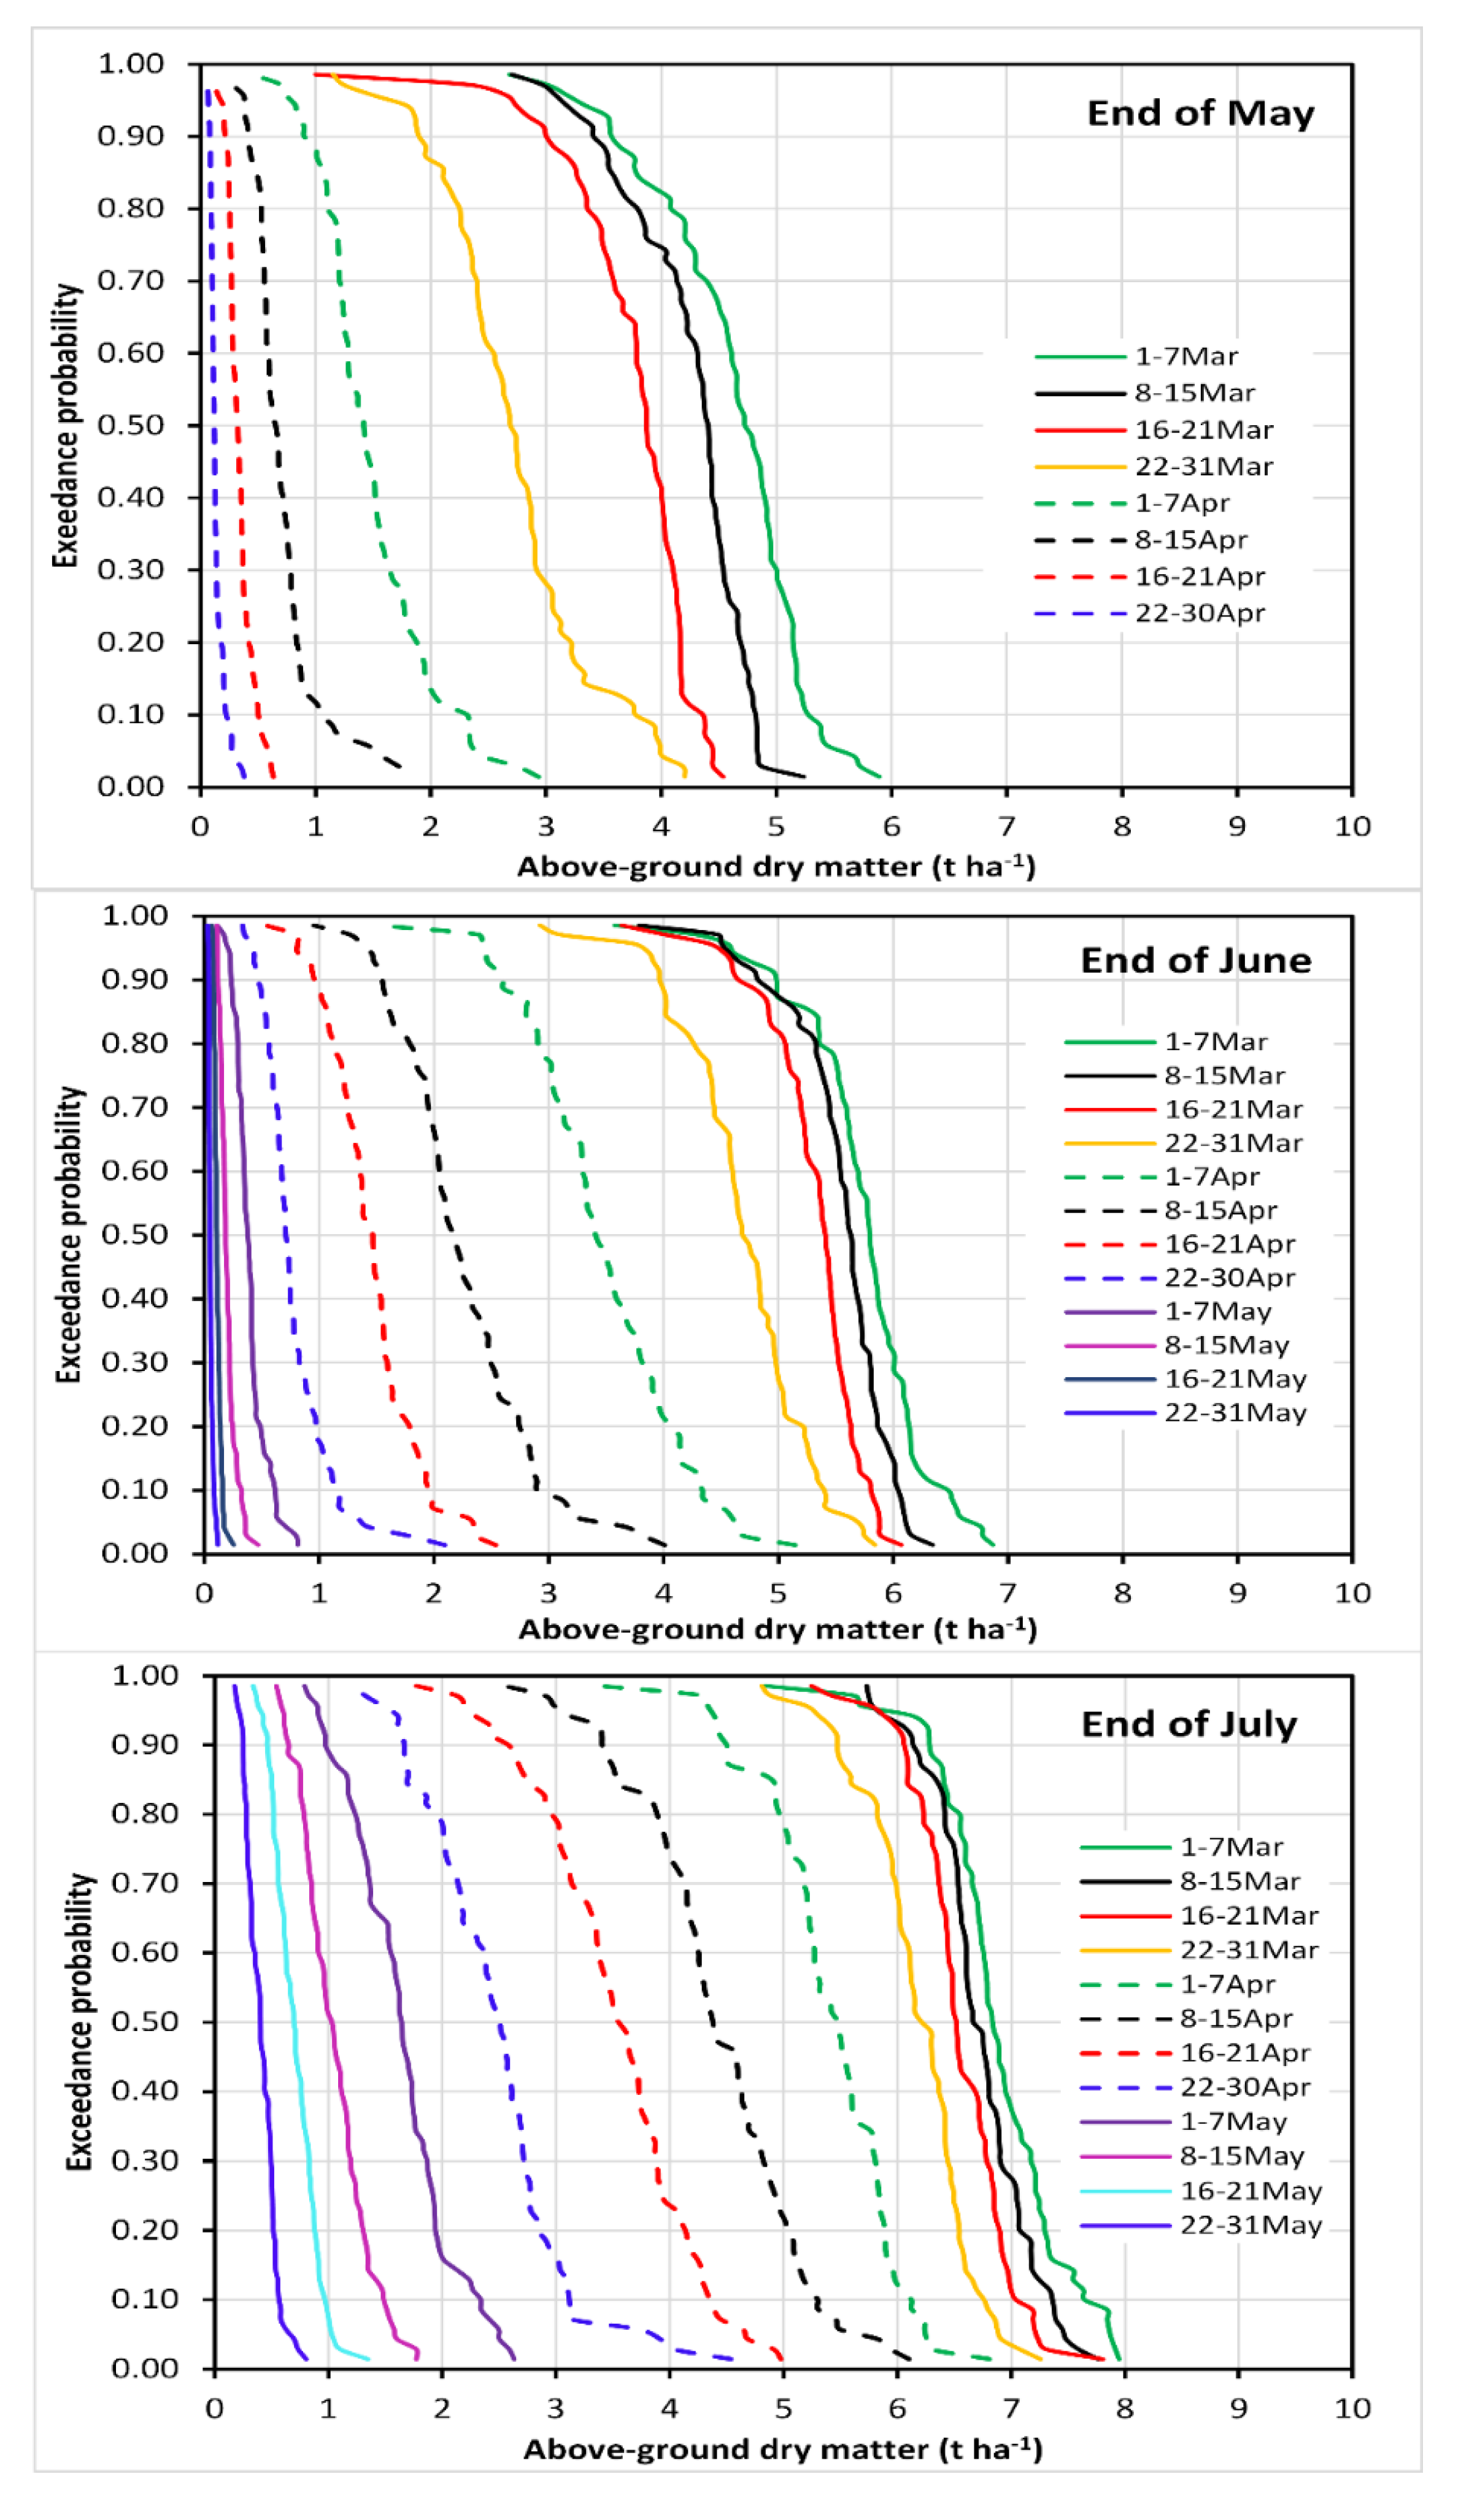
For the winter wheat sown at weekly time intervals from March to May, the cumulative exceedance probability of potential above-ground dry matter (AGDM) by the end of May, June, and July is shown in Figure 6. When sown in the second week of March, the maximum AGDM expected in two years at the ends of May, June, and July is 4.5 t ha−1, 5.8 t ha−1, and 6.8 t ha−1, respectively. If the crop is sown mid-April, these values are 0.8 t ha−1, 2.2 t ha−1, and 4.3 t ha−1, respectively. There is a sharp decrease in the AGDM when the crop is sown in April instead of March. For example, for the 50% exceedance probability, the AGDM at the end of May, when the crop is sown in the first and fourth weeks of March, is 4.8 t ha−1 and 2.8 t ha−1 (42% decrease), respectively, while these values are 1.5 t ha−1 and 0.2 t ha−1 (87% decrease) for the crop sown in the first and fourth weeks of April, respectively. At the end of May, the 50% exceedance probability AGDM values are 6.2 t ha−1 and 4.8 t ha−1 (23% decrease) and 3.4 t ha−1 and 0.8 t ha−1 (76% decrease) for the crop sown in the first and fourth weeks of March and first and fourth weeks of April, respectively. At the end of May, the 50% exceedance probability AGDM values are 7.2 t ha−1 and 6.2 t ha−1 (14% decrease) and 4.5 t ha−1 and 2.5 t ha−1 (44% decrease) for the crop sown in the first and fourth weeks of March and first and fourth weeks of April, respectively. The yield of early sown winter wheat is less affected by grazing (14% yield loss when sown in April) compared with the one sown late (33% yield loss when sown in May).
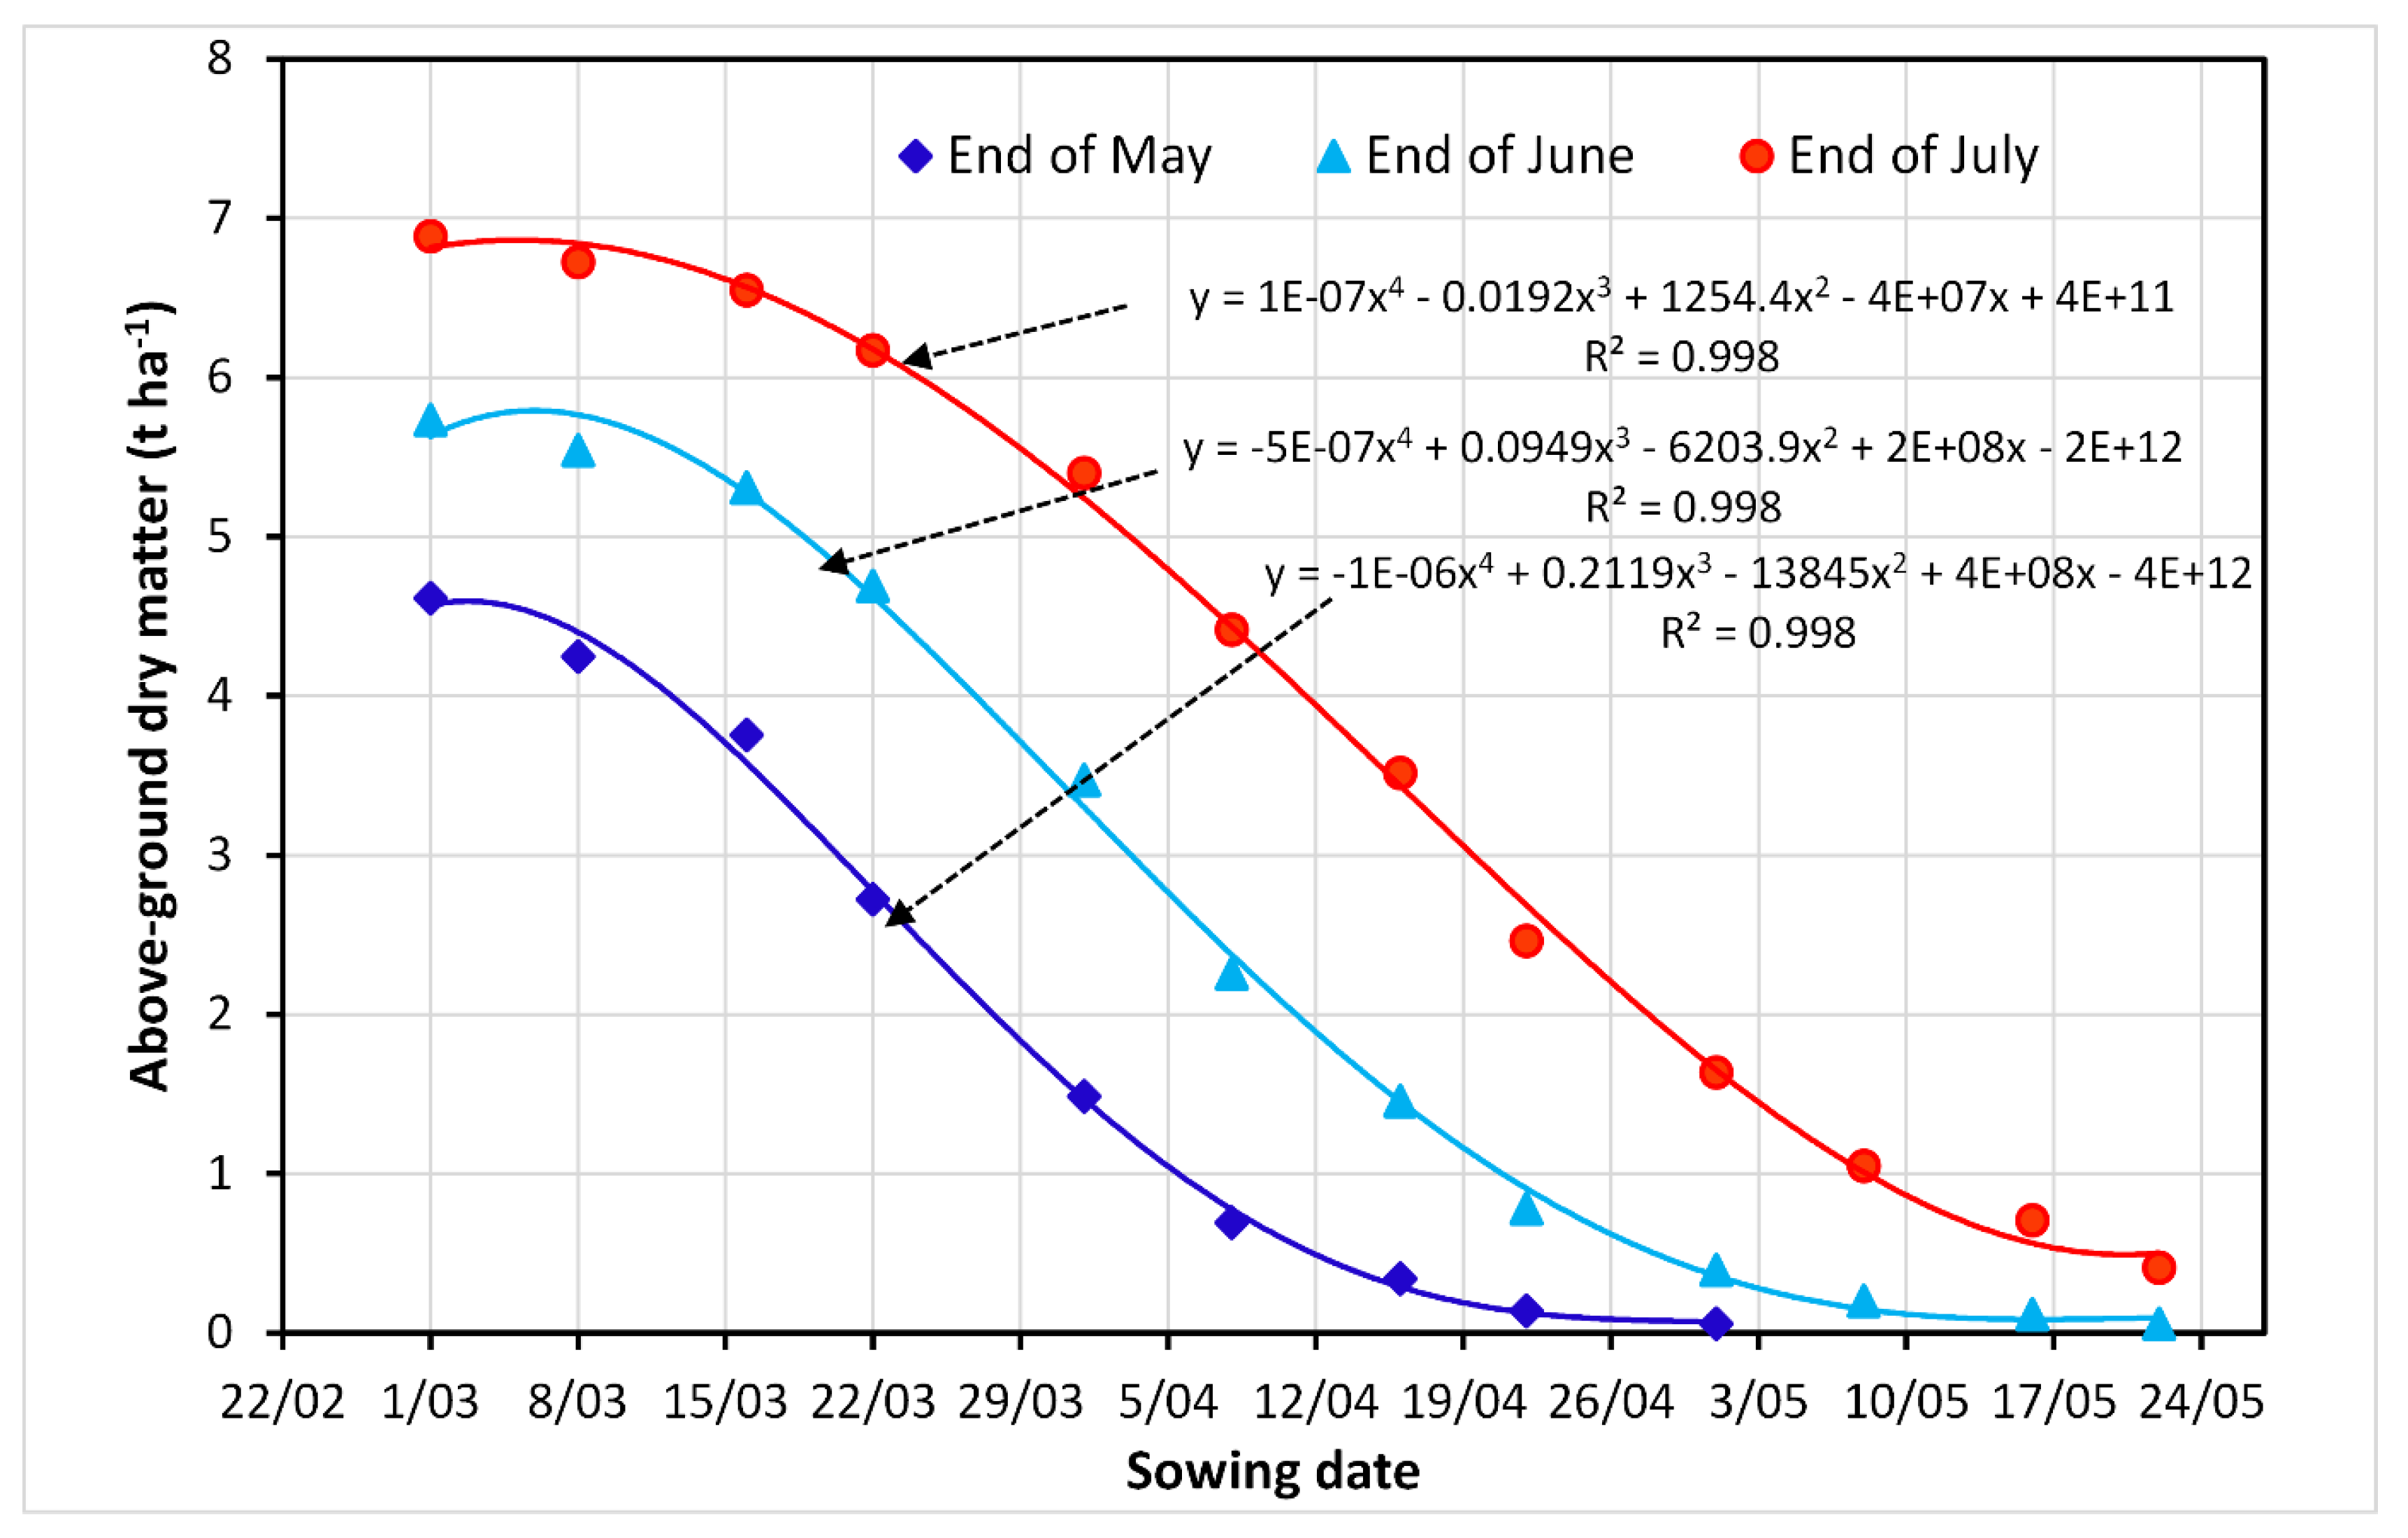
Figure 7 shows the simulated AGDM at the end of May, end of June, and end of July for winter wheat sown from the first week of March to the last week of May. For the crop sown in March and April, the difference in AGDM at the end of May and at the end of June is 1.41 t ha−1, and the difference between the AGDM at the end of June and at the end of July is 1.61 t ha−1. When the crop is sown in May, the difference in AGDM at the end of May and at the end of June is 0.21 t ha−1 and the difference in AGDM between the end of June and the end of July is 0.76 t ha−1. Early (March) sown wheat performed best in terms of dry matter available for grazing (AGDM removed). The amount of dry matter obtained from late sown wheat is significantly low. The crop grows fast during the autumn months while the temperature is still high. Sowing relatively late reduces the amount of dry matter available for grazing (AGDM removed). In seasons with above normal rainfall, early sown wheat can develop excessive biomass, which is prone to lodging if not grazed. Therefore, if livestock feed availability from grazing crops is a major priority, early sowing is important. In semiarid regions, early sowing depends on the availability of enough soil moisture for germination and crop establishment. In years with no early rainfall break, this moisture can be from stored soil water during the fallow period, which requires fallow period management, such as stubble retention and weed control, to increase soil water storage efficiency. If water is available, pre-irrigation can be applied.
3.2.3. Grain Yield and Harvest Index
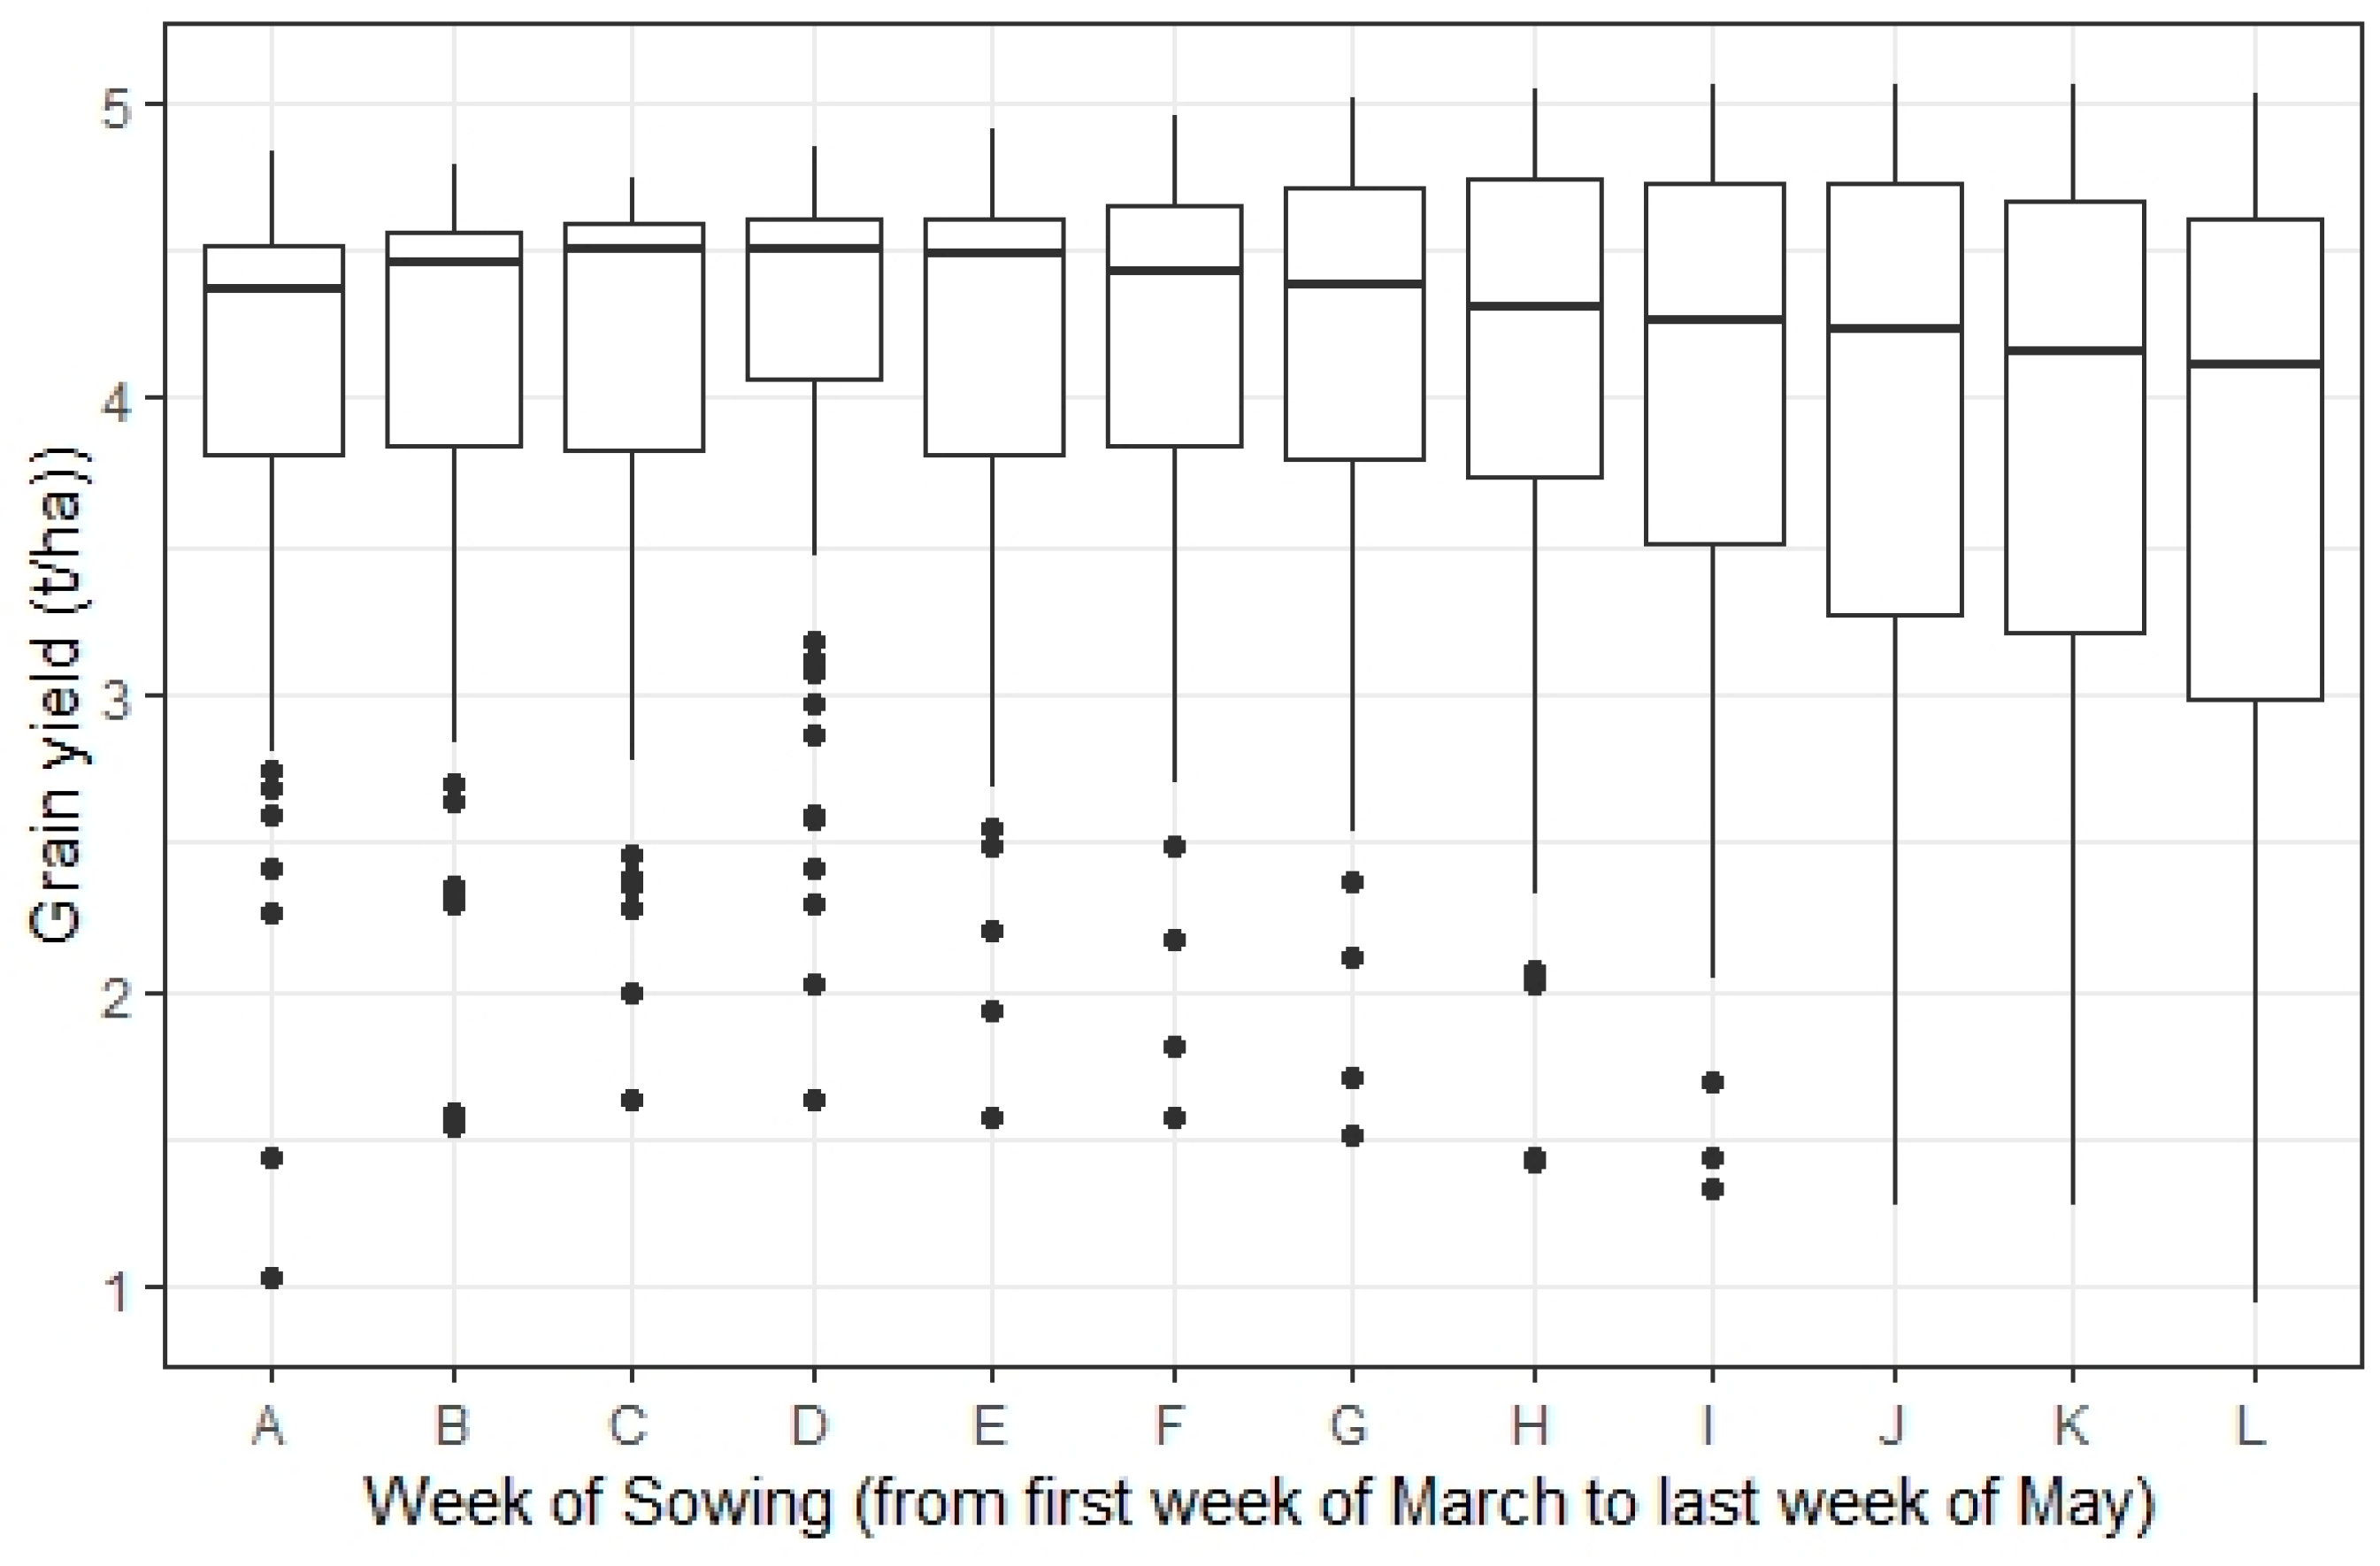
The box plot of simulated grain yield for winter wheat sown from the first week of March to the fourth week of May is shown in Figure 8. For March to early April sowing, yield did not show a response to times of sowing. This can be seen from the median yield, which showed only a slightly increasing trend as the sowing was delayed from the first week of March to the fourth week of March. It reached a maximum value when sown in the fourth week of March, after which it started decreasing, and reached the lowest value when sown by the end of May. Not only was the yield maximum when sown in the fourth week of March, but also there was the lowest variation in yield, as can be seen from the lowest inter-quartile range of the box plot for this time of sowing. Yield variability increases as the sowing is delayed to April and May, which means that winter wheat cultivars can potentially offer a broad establishment window for farmers in south-eastern Australia.
Winter cultivars have a broad range of establishment period without yield penalty; they have relative yield advantage over spring cultivars when sown both early and late [29]. Provided there is enough soil moisture for establishment, they can be sown early. In southern Australia, recommended sowing time for Wedgetail is from the fourth week of March to the second week of May [30]. As shown in Figure 8, the fourth week of March sowing results in the highest grain yield and least year-to-year variability. Simulation [31] and field experiments [32] have shown winter cultivars show only very little response to times of sowing in late-February to April. Figure 9 also shows that the fourth week of March sowing results in the lowest year-to-year harvest index variability. As sowing is delayed, grain yield decreases and also becomes less reliable.
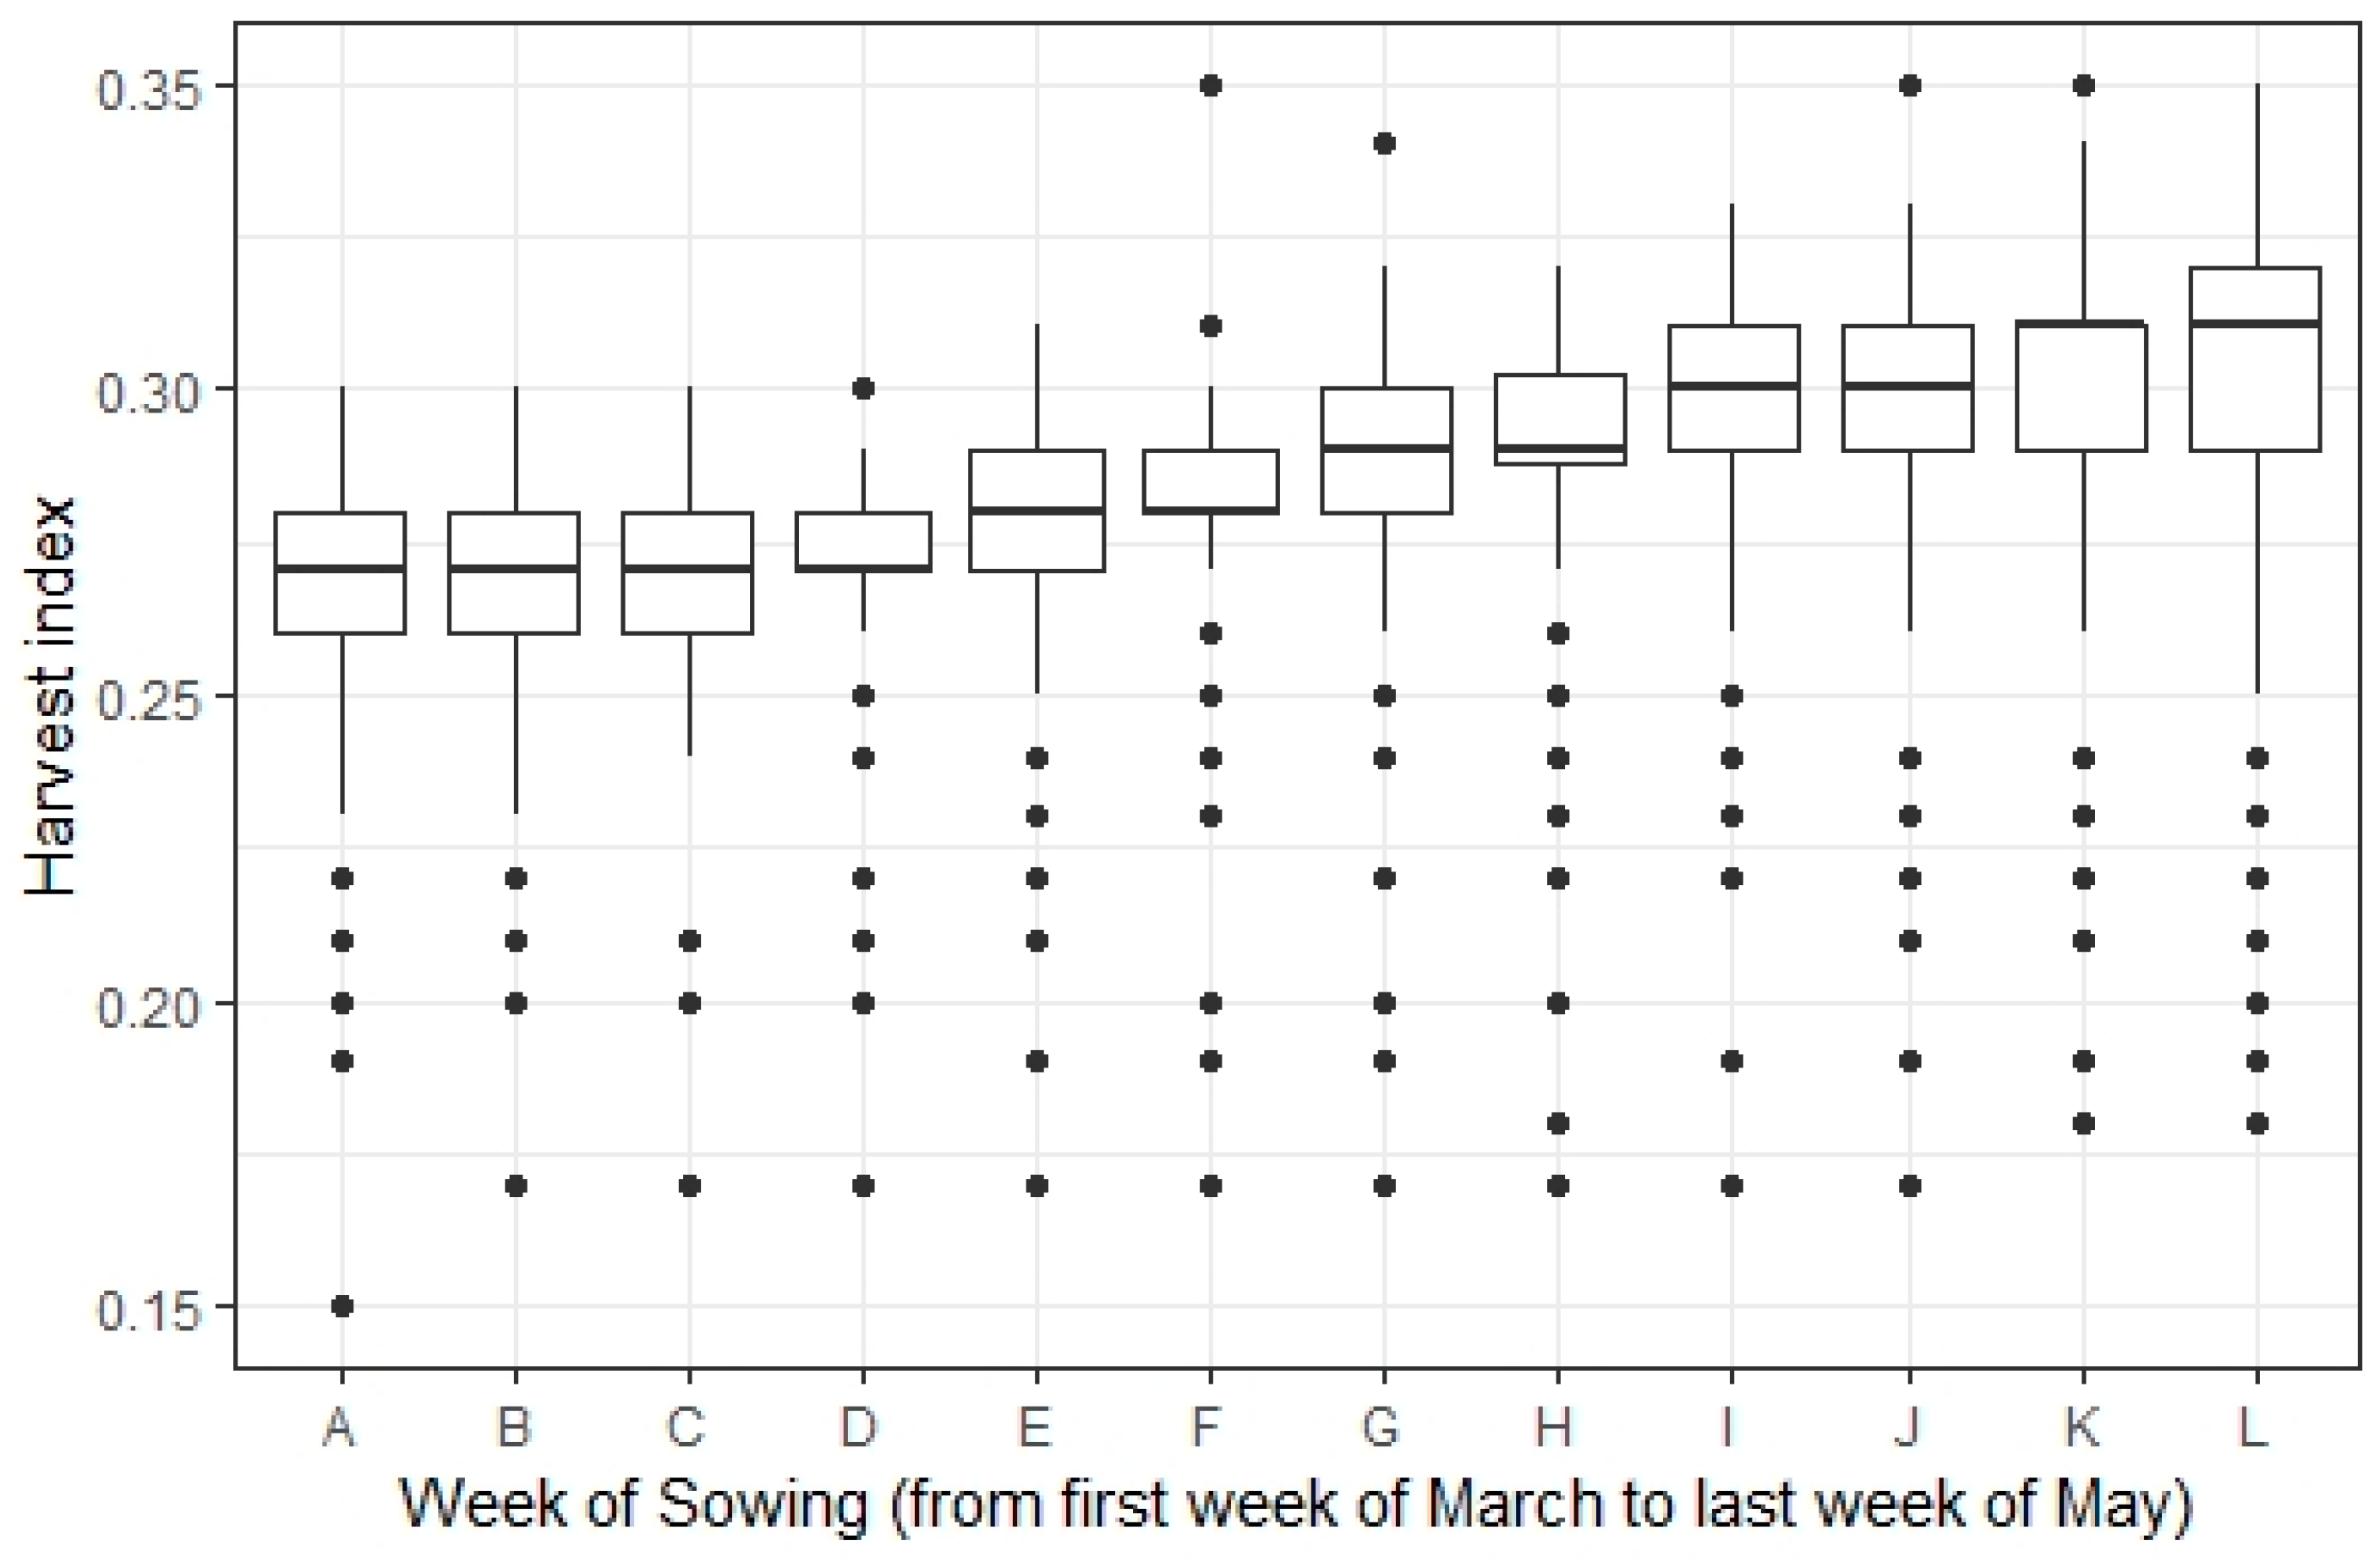
The box plot of the variation in harvest index for winter wheat sown from March to May is presented in Figure 9. The harvest index remained almost constant for winter wheat sown in the first three weeks of March. The crop sown in the fourth week of March showed the lowest variation in harvest index and its value is also slightly higher than that of the crop sown in the first three weeks of March. From the first week of April onwards, the harvest index is increasing, reaching a maximum value for the crop sown in the fourth week of May. The variability of harvest index for a given sowing week increases as the sowing date is delayed. A similar observation was made by the authors of [33] from their field experiments; early sown, slow developing winter cultivars have a lower harvest index compared with late sown, fast developing spring cultivars. This is mostly the case in seasons where soil moisture is the limiting factor. However, in seasons with a full soil moisture profile, early sown crops explore more soil water owing to a deeper rooting system [14,15]. This is in agreement with the results of the field experiment of this study (Table 3), which was sown early (mid-March). The harvest index of the rainfed treatment was significantly lower than that of the irrigated treatment.
As indicated in Figure 6 and Figure 7, in south-eastern Australia, early sowing of winter wheat increases dry matter production. The increase in harvest index with the time of sowing indicates that dual-purpose winter wheat needs to be sown early (in March). However, if grain-only is the primary purpose, it needs to be sown late (in April or later) (Figure 9). Wheat yield is maximized if plants flower in an optimal flowering window. Early-sown wheat flowers earlier than the optimal window and produces a low yield. Early sown winter cultivars have a longer season, which enables deeper root growth and better stored soil water extraction. As the crop covers the soil quicker, there will be less evaporation and more biomass production. However, if there is no stored soil water, early sown winter wheat will hay off and result in a low yield.
3.2.4. Flowering Time
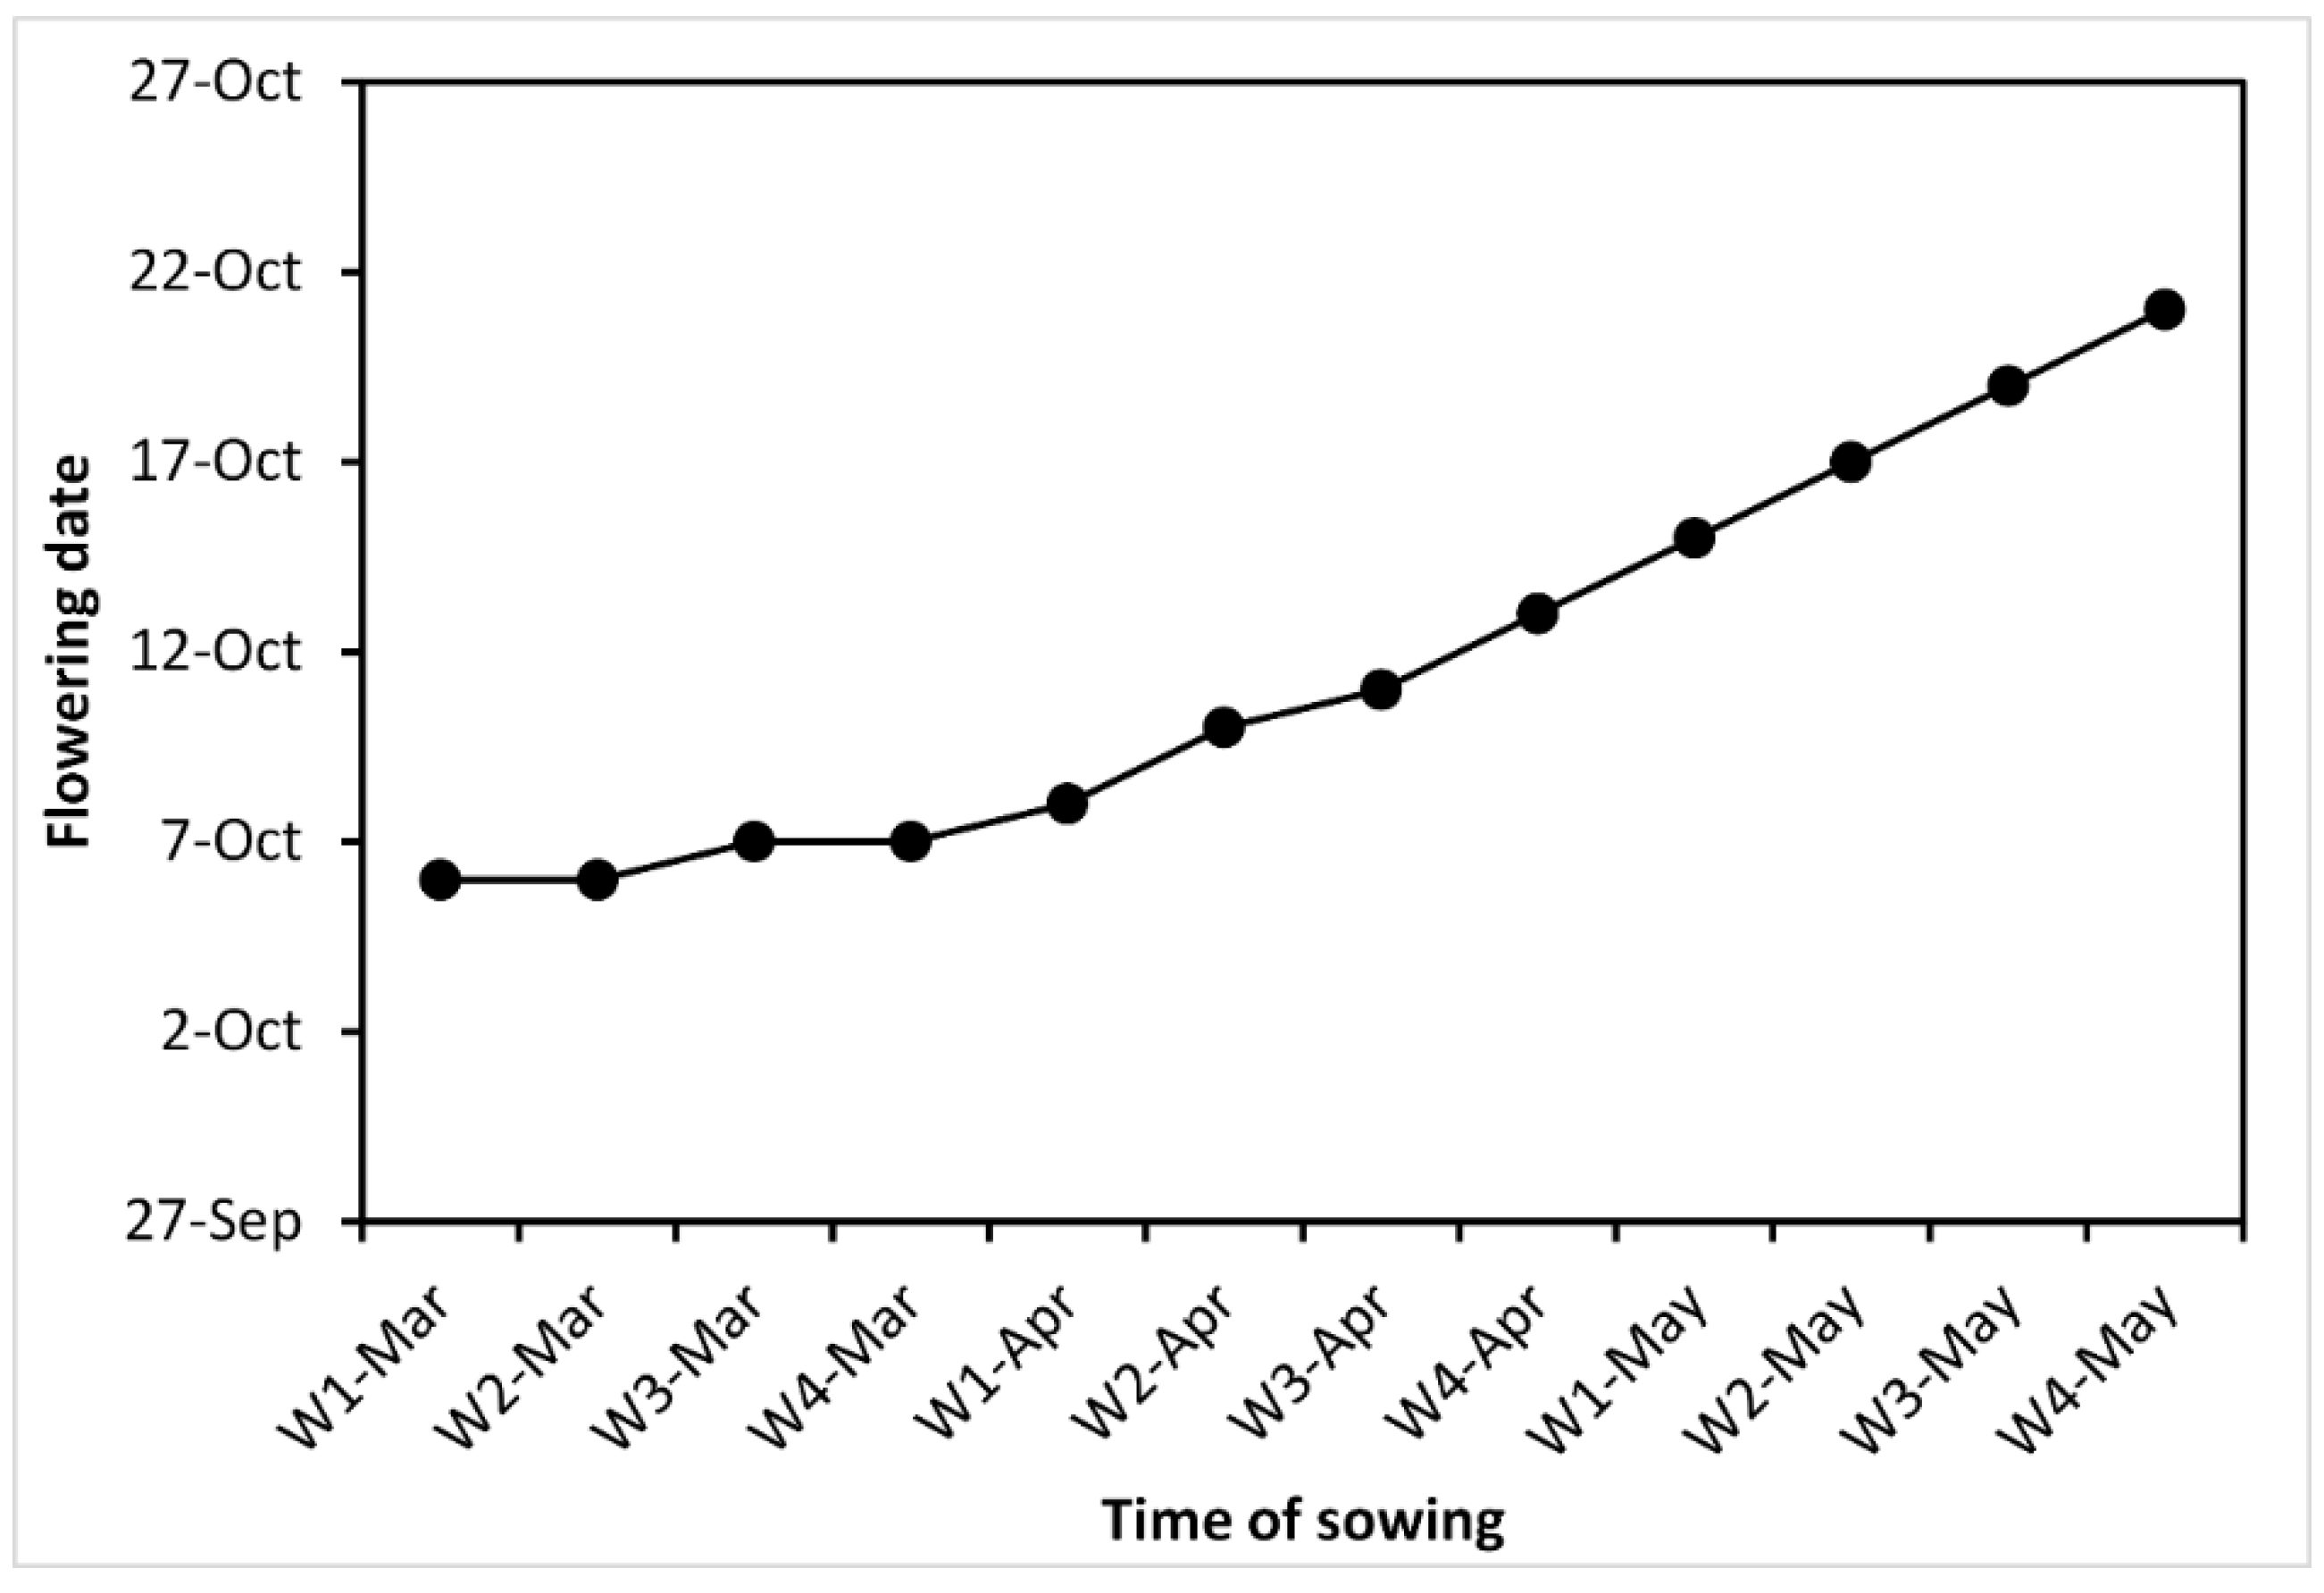
The average flowering time for winter wheat Wedgetail sown from first of March to end of May is shown in Figure 10. The crop sown in March flowers around 7 October. However, the flowering time increases as the sowing is delayed to April and May. The flowering time of long season wheat cultivars such as Wedgetail is not as sensitive to sowing date as spring cultivars. Early sown (late March–early April) spring cultivars can flower as early as late August and early September. However, late sown (Late April and May) spring cultivars can flower as late as mid-October. However, winter cultivars sown from March to end of May can flower during the optimal flowering period from 25 September to 7 October [34]. From Figure 10, it can be seen that the Wedgetail flowering time is less sensitive to the sowing date. For example, from first to fourth week of March, it showed only one day difference; from the first week of April to the fourth week of April, it showed five days’ difference; and from the first week of May to the fourth week of May, it showed six days’ difference. Because of their very stable flowering dates, winter wheat cultivars have a broad range of establishment dates, which can be even earlier that April, and as a result, a stable grain yield [12].
3.2.5. Effect of Climate Change
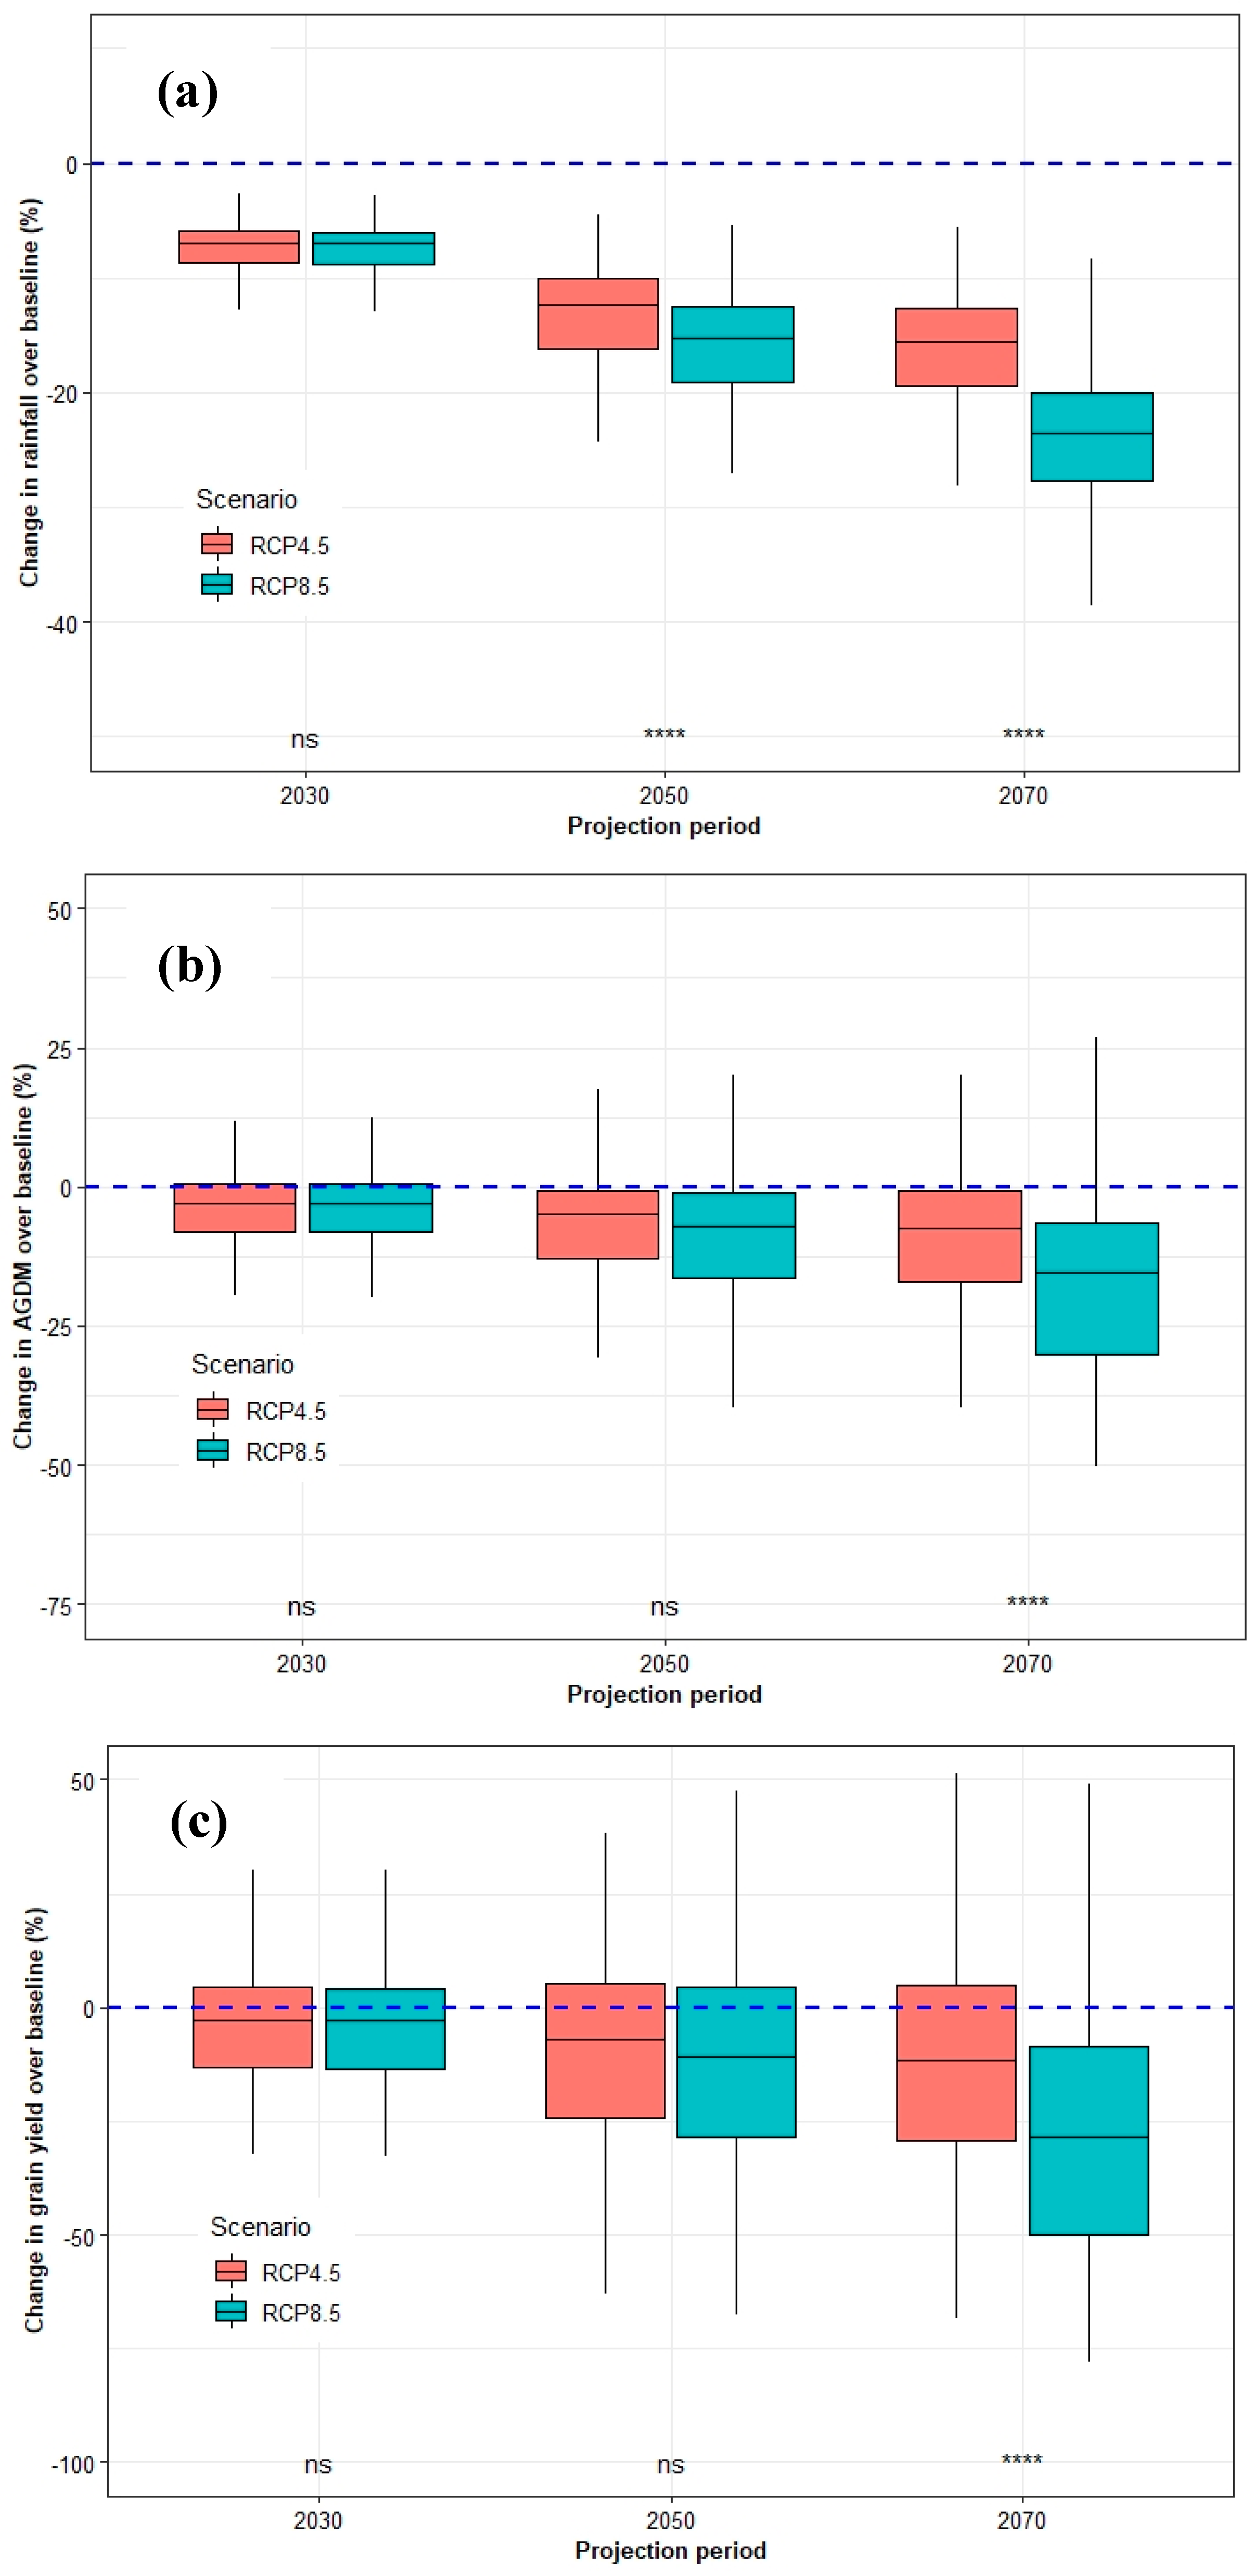
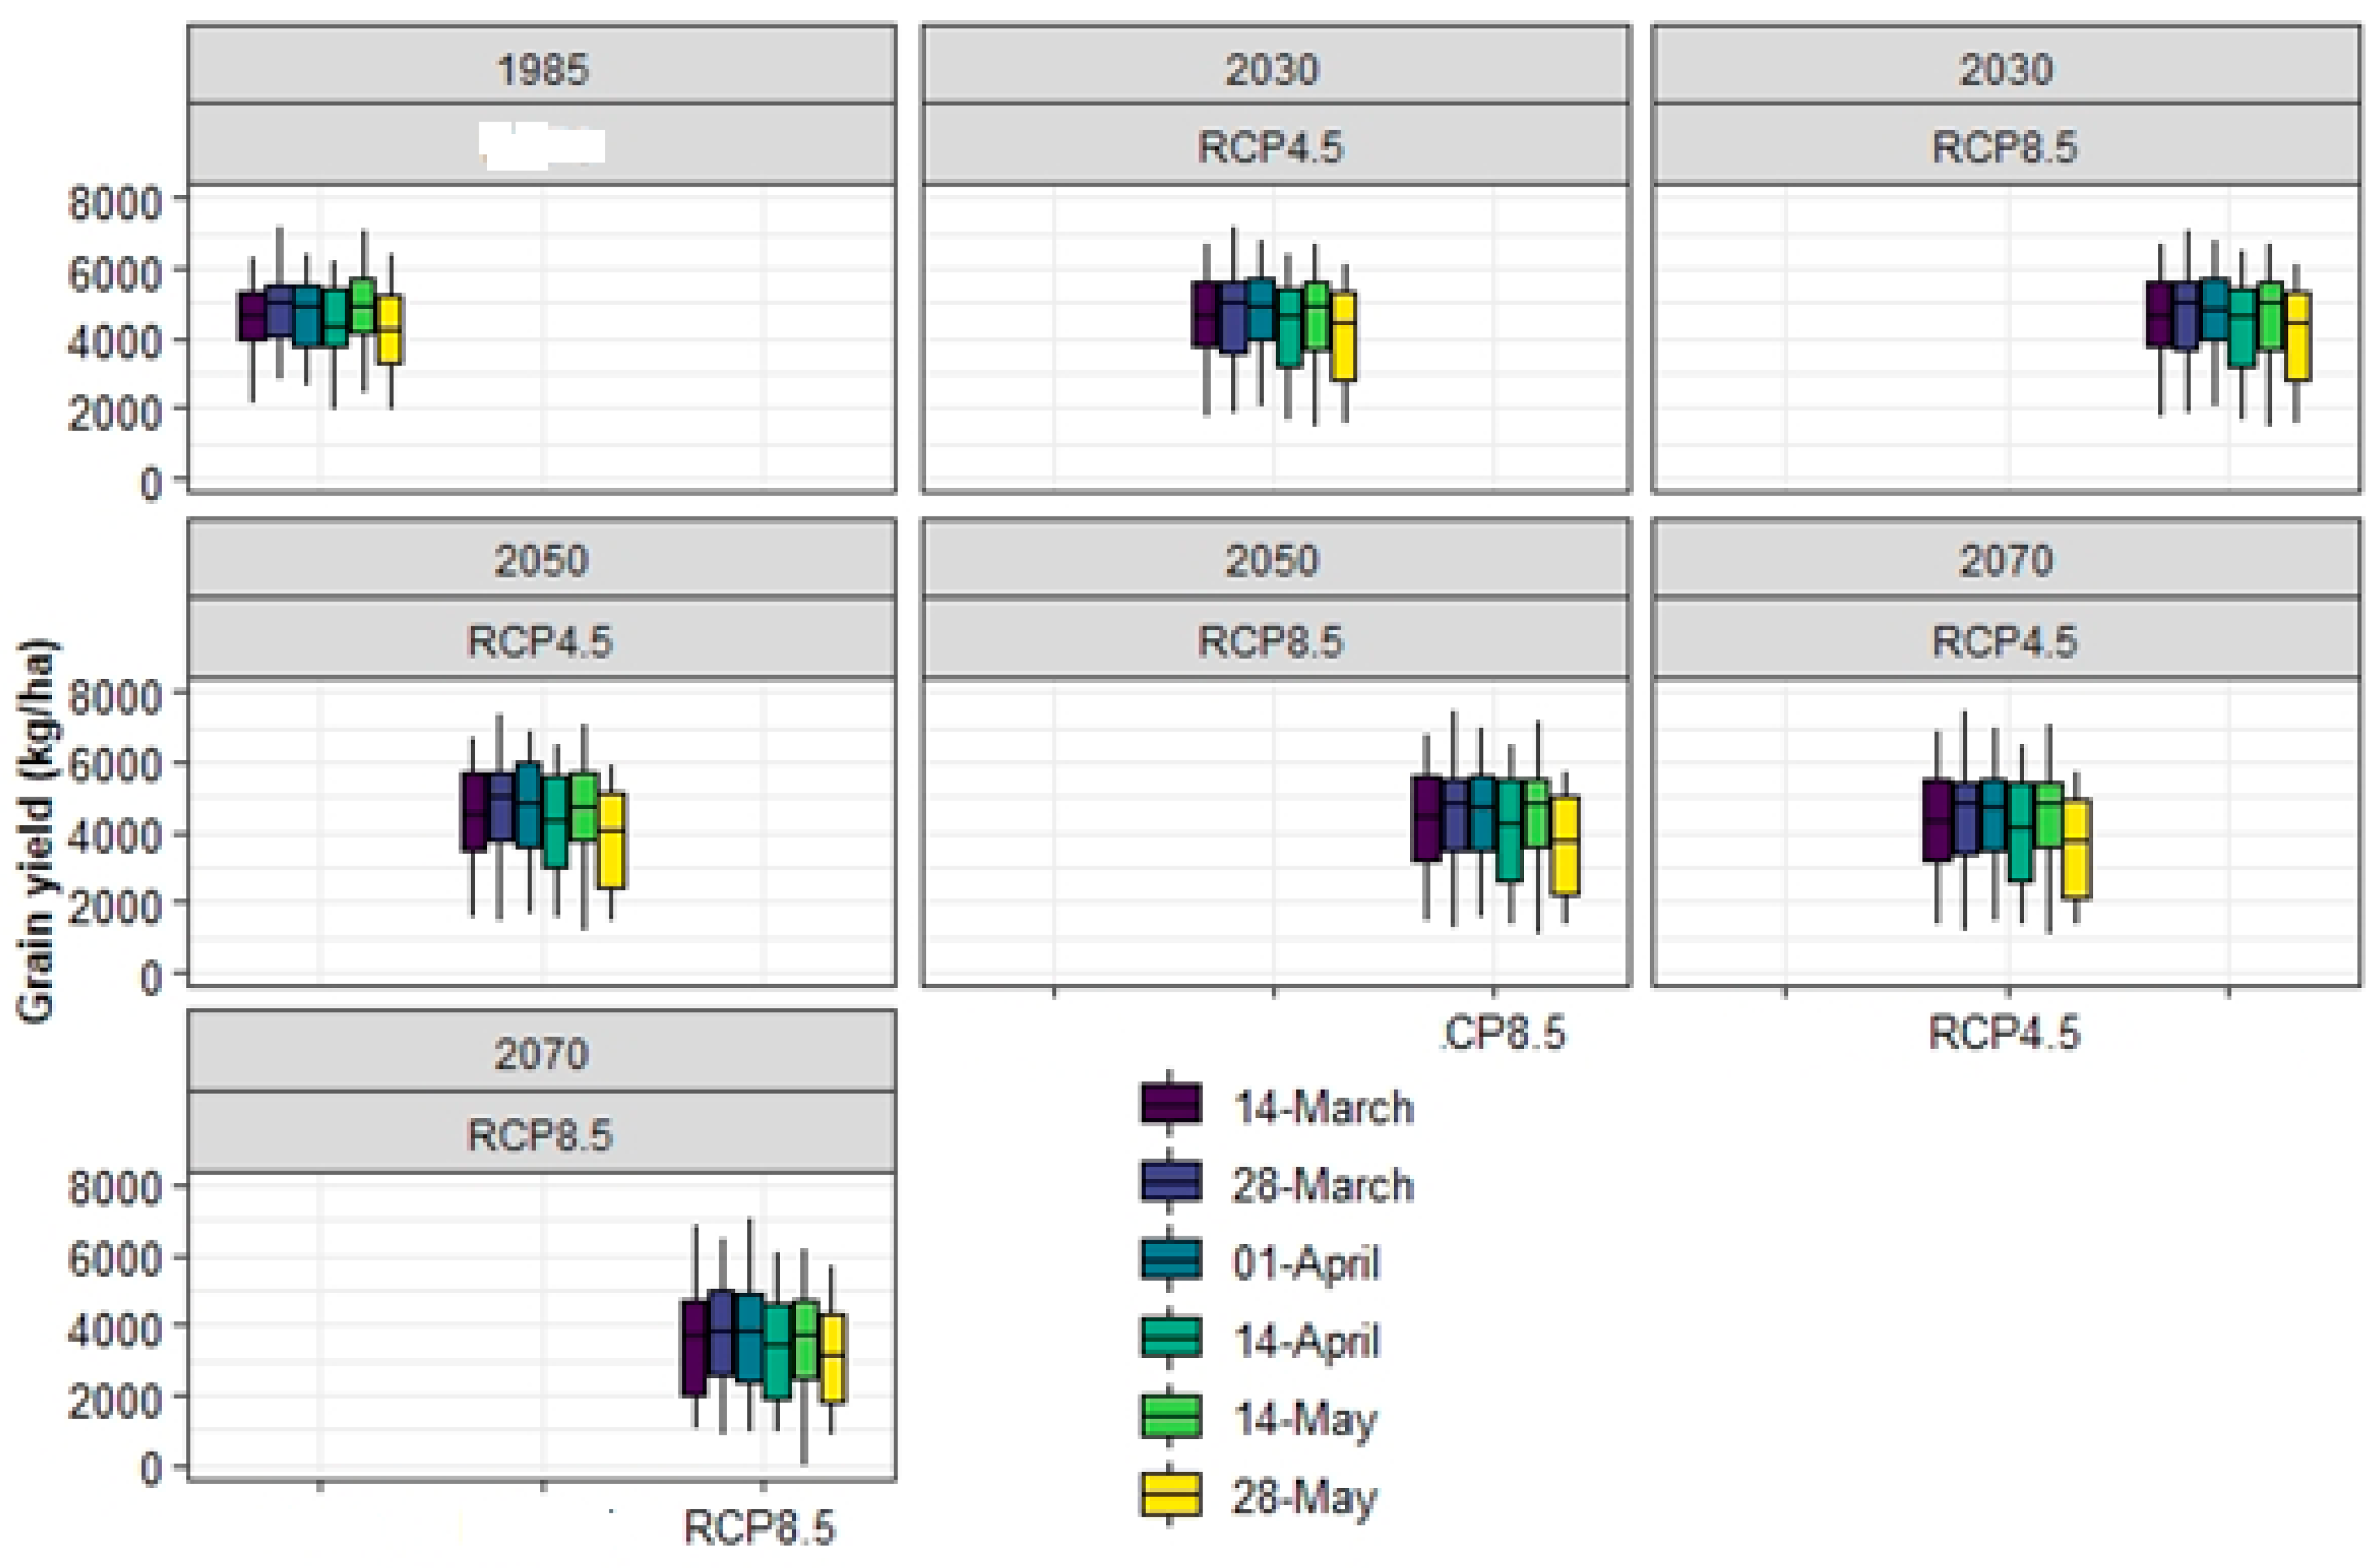
The changes in rainfall, above-ground dry matter and grain yield in the near (2030), mid (2050), and distant (2070) future periods are given in Figure 11. The changes were given relative to the baseline period 1971–2000 and two emission scenarios RCP4.5 and RCP8.5. The effect of sowing date on the yield of wheat (cv. Wedgetail) for the baseline and projection periods and two emission scenarios is presented in Figure 12. The rainfall declines by 9% (2030), 12% (2050—RCP4.5), 15% (2050—RCP8.5), 15% (2070—RCP4.5), and 25% (2070—RCP8.5). There is no significant difference between the declines in rainfall of two emission scenarios in 2030. However, the difference would be significant in 2050 and 2070. Both grain yield and dry matter decrease in the future climate in a trend similar to that of rainfall decline. The decline in grain yield would be 5% (2030), 8% (2050—RCP4.5), 12% (2050—RCP8.5), 12% (2070—RCP4.5), and 25% (2070—RCP8.5) relative to the baseline. Figure 12 shows that early sowing results in a higher grain yield both in the baseline and projection periods, with the effect becoming more pronounced in the future climate.
4. Conclusions
The early sown/established winter wheat increased dry matter production for grazing over a longer duration and also increased grain yield compared with the late sown wheat. Early-grazed winter wheat recovered quicker than late-grazed wheat. Grazing of unirrigated winter wheat increased grain yield, while grazing of irrigated wheat reduced the grain yield compared with the ungrazed checks for each irrigation regime. The yield limiting factor in the unirrigated treatment was a lack of moisture, however, the yield limiting factor in the irrigated treatments was loss of leaf area at GS 32. Grazing reduced the grain and dry matter water use efficiency. The AGDM decreased sharply when the crop was sown in April instead of March; there is more than 50% probability that the AGDM at the end of May decreased by 42% when the crop is sown in the fourth week of March instead of the first week of March. However, it decreased by 87% when sown in the fourth of April instead of the first week of April. The amount of dry matter obtained from late sown wheat was significantly low. Grazing in a moisture limiting situation can increase grain yield. Defoliation of winter wheat prior to GS 32 allowed the crop to recover its yield to similar levels to ungrazed crop, while defoliation after GS 32 resulted in significant reductions in grain yield. Grain yield and dry matter production would decrease in the future climate in both medium and high emission scenarios, although significant difference between the two scenarios would occur only in the second half of this century.
Funding
This research was funded by Graham Centre for Agricultural Innovation.
Conflicts of Interest
The authors declare no conflict of interest.
References
- Ewing, M.A.; Flugge, F.; Kingwell, R. The benefits and challenges of crop–livestock integration in Australian agriculture. In Proceedings of the 4th International Crop Science Congress’, Brisbane, QLD, Australia, 26 September–1 October 2004. [Google Scholar]
- Moore, A.D.; Bell, L.W.; Revell, D.K. Feed gaps in mixed–farming systems: Insights from the Grain & Graze program. Anim. Prod. Sci. 2009, 49, 736–748. [Google Scholar]
- Dove, H.; Kirkegaard, J. Using dual–purpose crops in sheep–grazing systems. J. Sci. Food Agric. 2014, 94, 1276–1283. [Google Scholar] [CrossRef] [PubMed]
- Pinchak, W.E.; Worrall, W.D.; Caldwell, S.P.; Hunt, L.J.; Worrall, N.J.; Conoly, M. Interrelationships of forage and steer growth dynamics on wheat pasture. J. Range Manag. 1996, 49, 126–130. [Google Scholar] [CrossRef]
- Bonachela, S.; Orgaz, F.; Fereres, E. Winter cereals grown for grain and for the dual purpose of forage plus grain. 1. Production. Field Crops Res. 1995, 44, 1–11. [Google Scholar] [CrossRef]
- Tian, L.H.; Bell, L.W.; Shen, Y.Y.; Whish, J.P.M. Dual–purpose use of winter wheat in western China: Cutting time and nitrogen application effects on phenology, forage production, and grain yield. Crop Past. Sci. 2012, 63, 520–528. [Google Scholar] [CrossRef]
- Bell, L.; Sprague, S.; Lilley, J.; Kirkegaard, J.; Graham, J.; Murray, A. Grazing Strategies and Timing of Stock Removal from Dual Purpose Cereals and Canola; Grain Research Development Cooperation: Canberra, Australia, 2014. [Google Scholar]
- Virgona, J.M.; Gummer, F.A.J.; Angus, J.F. Effects of grazing on wheat growth, yield, development, water use, and nitrogen use. Aust. J. Agric. Res. 2006, 57, 1307–1319. [Google Scholar] [CrossRef]
- Harrison, M.T.; Kelman, W.M.; Moore, A.D.; Evans, J.R. Grazing winter wheat relieves plant water stress and transiently enhances photosynthesis. Funct. Plant Biol. 2010, 37, 726–736. [Google Scholar] [CrossRef]
- Winter, S.R.; Musick, J.T. Grazed wheat–grain yield relationships. Agron. J. 1991, 83, 130–135. [Google Scholar] [CrossRef]
- Porter, J.R.; Gawith, M. Temperatures and the growth and development of wheat: A review. Eur. J. Agron. 1999, 10, 23–36. [Google Scholar] [CrossRef]
- Hunt, J.R.; Kirkegaard, J.A. Re–evaluating the contribution of summer fallow rain to wheat yield in southern Australia. Crop Past. Sci. 2011, 62, 915–929. [Google Scholar] [CrossRef]
- Hunt, J. Winter wheat cultivars in Australian farming systems: A review. Crop Past. Sci. 2017, 68, 501–515. [Google Scholar] [CrossRef]
- Kirkegaard, J.A.; Lilley, J.M.; Hunt, J.R.; Sprague, S.J.; Ytting, N.K.; Rasmussen, I.S.; Graham, J.M. Effect of defoliation by grazing or shoot removal on the root growth of field–grown wheat (Triticum aestivum L.). Crop Past. Sci. 2015, 66, 249–259. [Google Scholar] [CrossRef]
- Zeleke, K.T. Effect of sowing time, sowing rate and soil water regime on yield, water productivity and soil water dynamics of faba bean (Vicia faba L.). In Proceedings of the 19th Australian Agronomy Conference, Wagga, Australia, 25–29 August 2019. [Google Scholar]
- Holzworth, D.P.; Huth, N.I.; deVoil, P.G.; Zurcher, E.J.; Herrmann, N.I.; McLean, G.; Chenu, K.; van Oosterom, E.J.; Snow, V.; Murphy, C.; et al. APSIM–evolution towards a new generation of agricultural systems simulation. Environ. Model. Softw. 2014, 62, 327–350. [Google Scholar] [CrossRef]
- Moore, A.D. Opportunities and trade–offs in dual–purpose cereals across the southern Australian mixed–farming zone: A modelling study. Anim. Prod. Sci. 2009, 49, 759–768. [Google Scholar] [CrossRef]
- Zeleke, K.T. Fallow management increases soil water and nitrogen storage. Agric. Water Manag. 2017, 186, 12–20. [Google Scholar] [CrossRef]
- Harrison, M.T.; Evans, J.R.; Dove, H.; Moore, A.D. Dual–purpose cereals: Can the relative influences of management and environment on crop recovery and grain yield be dissected? Crop Past. Sci. 2011, 62, 930–946. [Google Scholar] [CrossRef]
- Zeleke, K.T.; Luckett, D.J.; Cowley, R.B. Calibration and testing of the FAO AquaCrop model for canola. Agron. J. 2011, 103, 1610–1618. [Google Scholar] [CrossRef]
- Zadoks, J.C.; Chang, T.T.; Konzak, C.F. A decimal code for the growth stages of cereals. Weed Res. 1974, 14, 415–421. [Google Scholar] [CrossRef]
- R Core Team. R: A Language and Environment for Statistical Computing; Foundation for Statistical Computing: Vienna, Austria, 2013. [Google Scholar]
- Keating, B.A.; Carberry, P.S.; Hammer, G.L.; Probert, M.E.; Robertson, M.J.; Holzworth, D.; Huth, N.I.; Hargreaves, J.N.G.; Meinke, H.; Hochman, Z.; et al. An overview of APSIM, a model designed for farming systems simulation. Eur. J. Agron. 2003, 18, 267–288. [Google Scholar] [CrossRef] [Green Version]
- Asseng, S.; Keating, B.A.; Fillery, I.R.P.; Gregory, P.J.; Bowden, J.W.; Turner, N.C.; Palta, J.A.; Abrecht, D.G. Performance of the APSIM–wheat model in Western Australia. Field Crops Res. 1998, 57, 163–179. [Google Scholar] [CrossRef]
- Zeleke, K.T.; Nendel, C. Analysis of options for increasing wheat (Triticum aestivum L.) yield in south–eastern Australia: The role of irrigation, cultivar choice and time of sowing. Agric. Water Manag. 2016, 166, 139–148. [Google Scholar] [CrossRef]
- Van Vuuren, D.P.; Edmonds, J.; Kainuma, M.; Riahi, K.; Thomson, A.; Hibbard, K.; Hurtt, G.C.; Kram, T.; Krey, V.; Lamarque, J.; et al. The representative concentration pathways: An overview. Clim. Chang. 2011, 109, 5. [Google Scholar] [CrossRef]
- Zhang, Y.; Feng, L.; Wang, E.; Wang, J.; Li, B. Evaluation of the APSIM–wheat model in terms of different cultivars, management regimes and environmental conditions. Can. J. Plant Sci. 2012, 92, 937–949. [Google Scholar] [CrossRef] [Green Version]
- Yunusa, I.A.M.; Bellotti, W.D.; Moore, A.D.; Probert, M.E.; Baldock, J.A.; Miyan, S.M. An exploratory evaluation of APSIM to simulate growth and yield processes for winter cereals in rotation systems in South Australia. Aust. J. Exp. Agric. 2004, 44, 787–800. [Google Scholar] [CrossRef]
- Penrose, L. Yield of early dryland sowing of wheat with winter and spring habit in southern and central New South Wales. Aust. J. Exp. Agric. 1993, 33, 601–608. [Google Scholar] [CrossRef]
- Matthews, P.; McCaffery, D.; Jenkins, L. Winter Crop Variety Sowing Guide; NSW Department of Primary Industries: Sydney, Australia, 2017. [Google Scholar]
- Bell, L.W.; Lilley, J.M.; Hunt, J.R.; Kirkegaard, J.A. Optimising grain yield and grazing potential of crops across Australia’s high–rainfall zone: A simulation analysis. 1 Wheat. Crop Past. Sci. 2015, 66, 332–348. [Google Scholar] [CrossRef]
- Frischke, A.; Hunt, J.; McMillan, D.; Browne, C. Forage and grain yield of grazed or defoliated spring and winter cereals in a winter–dominant, low–rainfall environment. Crop Past. Sci. 2015, 66, 308–317. [Google Scholar] [CrossRef]
- Riffkin, P.A.; Evans, P.M.; Chin, J.F.; Kearney, G.A. Early–maturing spring wheat outperforms late–maturing winter wheat in the high rainfall environment of south–western Victoria. Aust. J. Agric. Res. 2003, 54, 193–202. [Google Scholar] [CrossRef]
- Kirkegaard, K.; Sprague, S.; Lilley, J.; Bell, L. Managing Dual Purpose Crops to Optimise Profit from Grazing and Grain Yield North. Available online: https://grdc.com.au/resources-and-publications/grdc-update-papers/tab-content/grdc-update-papers/2016/02/managing-dual-purpose-crops-to-optimise-profit-from-grazing-and-grain-yield-north (accessed on 5 October 2019).
Figure 1.
Long-term average rainfall and temperature and experimental season rainfall and irrigation at Wagga Wagga.
Figure 1.
Long-term average rainfall and temperature and experimental season rainfall and irrigation at Wagga Wagga.

Figure 2.
Average rootzone (120 cm) soil water content for unirrigated (D) and irrigated (I) treatments of winter wheat. D0 and I0 (“ungrazed”), D1 and I1 (“grazed” 31 May), D2 and I2 (grazed 25 July), and D3 and I3 (grazed 31 May and 25 July). Indicated are also standard error bars.
Figure 2.
Average rootzone (120 cm) soil water content for unirrigated (D) and irrigated (I) treatments of winter wheat. D0 and I0 (“ungrazed”), D1 and I1 (“grazed” 31 May), D2 and I2 (grazed 25 July), and D3 and I3 (grazed 31 May and 25 July). Indicated are also standard error bars.

Figure 3.
Normalized difference vegetation index (NDVI) used as a proxy for crop canopy cover of a dual-purpose wheat at different times during the crop growing season. The times of grazing are indicated by the arrows. D0 and I0 (ungrazed), D1 and I1 (grazed 31 May), D2 and I2 (grazed 25 July), and D3 and I3 (grazed 31 May and 25 July).

Figure 4.
Above-ground dry matter of unirrigated and irrigated treatments after the first grazing (31 May). Indicated are also standard error bars.
Figure 4.
Above-ground dry matter of unirrigated and irrigated treatments after the first grazing (31 May). Indicated are also standard error bars.

Figure 5.
Measured and simulated water content for different soil depths: (a) 0–15 cm, (b) 15–30 cm, (c) 30–60 cm, (d) 60–90 cm, (e) 90–120 cm.
Figure 5.
Measured and simulated water content for different soil depths: (a) 0–15 cm, (b) 15–30 cm, (c) 30–60 cm, (d) 60–90 cm, (e) 90–120 cm.

Figure 6.
Exceedance probability of above-ground dry matter at different grazing times (end of May, end of June, and end of July) for a dual-purpose winter wheat sown from the first week of March to the last week of May.
Figure 6.
Exceedance probability of above-ground dry matter at different grazing times (end of May, end of June, and end of July) for a dual-purpose winter wheat sown from the first week of March to the last week of May.

Figure 7.
The change in potential above-ground dry matter at the ends of May, June, and July for a dual-purpose wheat sown at different times from the first week of March to the last week of May. Simulated using 1950–2018 weather data.
Figure 7.
The change in potential above-ground dry matter at the ends of May, June, and July for a dual-purpose wheat sown at different times from the first week of March to the last week of May. Simulated using 1950–2018 weather data.

Figure 8.
Box plot of grain yield of dual-purpose winter wheat sown at different times (from the first week of March to the last week of May). The box plots show the 25th, 50th, and 75th percentiles.
Figure 8.
Box plot of grain yield of dual-purpose winter wheat sown at different times (from the first week of March to the last week of May). The box plots show the 25th, 50th, and 75th percentiles.

Figure 9.
Box plot of the harvest index of a dual-purpose winter wheat sown at different times (from the first week of March to the last week of May). The box plots show the 25th, 50th, and 75th percentiles.
Figure 9.
Box plot of the harvest index of a dual-purpose winter wheat sown at different times (from the first week of March to the last week of May). The box plots show the 25th, 50th, and 75th percentiles.

Figure 10.
Flowering time of a dual-purpose wheat sown at different times (from the first week of March to the last week of May).
Figure 10.
Flowering time of a dual-purpose wheat sown at different times (from the first week of March to the last week of May).

Figure 11.
Effect of climate change on (a) rainfall, (b) above-ground dry matter, and (c) grain yield of wheat (cv. Wedgetail) for different emission scenarios and projection periods. *** significant at p < 0.001, ns = non-significant. RCP, representative concentration pathway.
Figure 11.
Effect of climate change on (a) rainfall, (b) above-ground dry matter, and (c) grain yield of wheat (cv. Wedgetail) for different emission scenarios and projection periods. *** significant at p < 0.001, ns = non-significant. RCP, representative concentration pathway.

Figure 12.
Grain yield of wheat (cv. Wedgetail) for different sowing times, emission scenarios, and projection periods.
Figure 12.
Grain yield of wheat (cv. Wedgetail) for different sowing times, emission scenarios, and projection periods.


Table 1.
Water holding characteristics of the Red Kandosol soil at Wagga Wagga, NSW, Australia (http://www.apsim.info/).
Table 1.
Water holding characteristics of the Red Kandosol soil at Wagga Wagga, NSW, Australia (http://www.apsim.info/).
| Depth (cm) | Bulk Density (g cm−3) | Wilting Point (LL15) * (cm3 cm−3) | Field Capacity (DUL) + (cm3 cm−3) | Saturation Moisture Content (cm3 cm−3) |
|---|---|---|---|---|
| 0–15 | 1.48 | 0.11 | 0.29 | 0.35 |
| 15–30 | 1.50 | 0.13 | 0.27 | 0.34 |
| 30–45 | 1.45 | 0.15 | 0.25 | 0.32 |
| 45–60 | 1.37 | 0.15 | 0.28 | 0.36 |
| 60–90 | 1.43 | 0.15 | 0.29 | 0.35 |
| 90–120 | 1.55 | 0.15 | 0.31 | 0.34 |
* LL15 is the soil water content at 15 bar pressure, which is the lower limit of the plant available water. + DUL (drainable upper limit) is the soil water content at field capacity.
Table 2.
Identification of the experimental treatments.
| Watering Regime | Grazing Treatment | |||
|---|---|---|---|---|
| Ungrazed | Simulated Grazed 31 May | Simulated Grazed 25 July | Simulated Grazed 31 May and 25 July | |
| Dryland | DO | D1 | D2 | D3 |
| Irrigated | I0 | I1 | I2 | I3 |
Table 3.
Analysis of variance of the crop growth, dry matter, harvest parameters, and water productivity for unirrigated and irrigated dual-purpose wheat.
Table 3.
Analysis of variance of the crop growth, dry matter, harvest parameters, and water productivity for unirrigated and irrigated dual-purpose wheat.
| Water | Cut | Grain Yield | AGDM Harvest | Harvest Index | 1000 Seed | ETa | WUEgr | WUEdm | Plant Height | IWUEgr | IWUEdm | AGDM Removed/Grazed | AGDM Residual |
|---|---|---|---|---|---|---|---|---|---|---|---|---|---|
| (t ha−1) | (t ha−1) | (−) | (g) | (mm) | (kg m−3) | (kg m−3) | (cm) | (kg m−3) | (kg m−3) | (t ha−1) | (t ha−1) | ||
| Rainfed | 0 | 1.25d | 8.11bc | 0.15c | 29.1c | 207c | 6.0bc | 39.1a | 69c | ||||
| 1 | 1.34d | 5.48cd | 0.25bc | 28.2c | 207c | 6.5bc | 26.8bc | 57cd | 1.01c | 1.28 | |||
| 2 | 1.47d | 5.84cd | 0.26bc | 30.0bc | 206c | 7.1bc | 28.3b | 57cd | 3.46ab | 2.70 | |||
| 3 | 1.55d | 4.56d | 0.33ab | 28.7c | 214c | 7.0bc | 20.9bcd | 55d | 3.55ab | ||||
| Irrigated | 0 | 4.83a | 13.86a | 0.36ab | 28.8c | 460a | 10.5a | 29.9bc | 118a | 12.5a | 20.0a | ||
| 1 | 4.05b | 7.85bcd | 0.46a | 32.6a | 459a | 8.8ab | 17.1d | 113a | 9.4a | 8.2b | 3.32b | 1.36 | |
| 2 | 2.79c | 10.07b | 0.28bc | 30.4abc | 441ab | 6.3c | 22.8c | 95b | 4.5b | 14.7a | 4.73a | 5.41 | |
| 3 | 2.82c | 9.84b | 0.29bc | 31.9ab | 427b | 6.7c | 23.1c | 93b | 4.5b | 18.4a | 4.34ab |
AGDM = above-ground dry matter, WUEgr = water use efficiency of grain yield, WUEdm = water use efficiency of dry matter, ETa = actual evapotranspiration, IWUEgr = irrigation water use efficiency of grain yield, IWUEgr = irrigation water use efficiency of dry matter. In a given column, values followed by the same letter are not significantly different at p > 0.05.
Table 4.
Significance and interaction effect.
| Grain Yield | AGDM Harvest | Harvest Index | Seed Weight | Plant Height | ETa | WUEgr | WUEdm | DMCut | |
|---|---|---|---|---|---|---|---|---|---|
| Water | *** | *** | ** | ** | *** | *** | ns | *** | *** |
| Cut | *** | * | ns | ns | *** | ns | * | *** | *** |
| Water: Cut | *** | ns | ** | ns | ns | ns | *** | ns | ns |
*** = significant at p < 0.001, ** = significant at p < 0.01, * = significant at p < 0.05, ns = non–significant.
© 2020 by the author. Licensee MDPI, Basel, Switzerland. This article is an open access article distributed under the terms and conditions of the Creative Commons Attribution (CC BY) license (http://creativecommons.org/licenses/by/4.0/).
Share and Cite
MDPI and ACS Style
Zeleke, K.T. Evaluating Dry Matter Production and Grain Yield of Dual-Purpose Winter Wheat Using Field Experiment and Modelling. Agronomy 2020, 10, 338. https://doi.org/10.3390/agronomy10030338
AMA Style
Zeleke KT. Evaluating Dry Matter Production and Grain Yield of Dual-Purpose Winter Wheat Using Field Experiment and Modelling. Agronomy. 2020; 10(3):338. https://doi.org/10.3390/agronomy10030338
Chicago/Turabian StyleZeleke, Ketema Tilahun. 2020. "Evaluating Dry Matter Production and Grain Yield of Dual-Purpose Winter Wheat Using Field Experiment and Modelling" Agronomy 10, no. 3: 338. https://doi.org/10.3390/agronomy10030338
Note that from the first issue of 2016, this journal uses article numbers instead of page numbers. See further details here.