
Soundscape Approach in the Seaport of Ancona: A Case Study


Department of Industrial Engineering and Mathematical Sciences, Università Politecnica delle Marche, Brecce Bianche 12, 60131 Ancona, Italy
*
Author to whom correspondence should be addressed.
†
These authors contributed equally to this work.
Acoustics 2022, 4(2), 492-516; https://doi.org/10.3390/acoustics4020031
Submission received: 23 March 2022
/
Revised: 19 May 2022
/
Accepted: 2 June 2022
/
Published: 14 June 2022
Abstract
:Today, the art of knowing how to listen is more urgent than ever. The perceptive sound system of the human being is stimulated daily by countless artificial sounds that dominate natural ones. When it comes to the idea of the soundscape, the terminology was initially referred to by composer and environmentalist Raymond Murray Shafer, who defined “soundscape” as a relationship between the ear, humans, built environments, and society. This paper aims to apply the sound landscape approach in the seaport area of Ancona (Italy); a large area, frequented daily by many people, which is divided into passenger and ferry terminals, container terminals, plants for solid bulk, and commercial and recreational activities. The purpose of the study was to evaluate the perception that a human has of the urban layout of the port area by correlating the parameters of traditional acoustics with psychoacoustics. To evaluate the subjective parameters, a questionnaire was developed and applied, enabling the analysis of demographic and behavioral factors such as age, visit frequency, and length of stay of the participants in the clusters of the seaport. This way, it was possible to give an indication of the sound quality of the different clusters of the port area, from an acoustic and emotional point of view, and this information could be particularly helpful in the planning phase of new attractions for the Ancona seaport.
1. Introduction
In this historical moment, where there is so much talk of environmental sustainability, the study of the sound landscape and the World Soundscape Project by M. Schafer [1] are very important aspects of research in terms of acoustic ecology; that is, the balanced relationship between sounds and their environment. By accepting this approach, we see how the concept of sound landscape is closely related to the definition of sound ecology, since it is able to accommodate various aspects related to practices that deal with studying the acoustic habitats of natural or human-generated sounds. The aim of this project is to restore dignity to the background noise of the environment, always putting at the center of the discussion our relationship with the sound environment.
1.1. Background
The theory of soundscape distinguishes three fundamental sound elements [1]:
- 1.
- Keynotes: Sounds present more frequently to which we no longer pay attention, such as the natural ones of wind, birds, and animals, in general. Furthermore, many common urban sounds have to be considered keynotes: for example, sounds produced by road traffic, domestic air conditioning systems, and industrial plants.
- 2.
- Soundsignal: emergency sirens, bells, alarm clocks, horns, etc., are sounds heard in the foreground with a strong semantic character and are easily assimilated to a condition of annoyance.
- 3.
- Soundmarks: These are the so-called sound imprints that are closely linked to a territory. They represent the acoustic identity of a place and, due to their importance, they should be protected alongside animals in danger of extinction and the dignity of the human being.
Among the practical experiences included in the definition of soundscape, useful for identifying the aforementioned soundmarks, an important role is played by the soundwalk. Previous studies talk about soundwalk procedures, aimed precisely at investigating the subjective reactions of the participants during a walk in the city or in another place [2,3,4]. The reactions of the participants can be investigated with due consideration given to the type of area, the position chosen for the sound evaluation, and the atmospheric conditions at the time of the measurement. Adams et al. [5] describes the development of the soundwalking methodology and its use as a tool to engage professionals who work in the area of urban design and urban development. Their paper reflects on the utility of soundwalking as a methodological practice. It has been found that the perceptions of the soundscape are varied and diverse. Hyun et al. in [6] investigated the effect of the appropriateness of the sound environment on urban soundscape perception through individuals’ subjective evaluation in laboratory conditions. Kang [7] considers sound environments to be psychological factors because they have an important influence on the levels of human comfort and how human beings can integrate with the landscape. This approach could complement decibel-based metrics into existing (national) regulations, shifting the focus from noise control to a more holistic approach. The steps to achieve this have to include: soundscape characterization, by capturing acoustic environments and establishing a comprehensive database; and key factors identification, with evaluation of their influence on soundscape quality based on the database by conducting laboratory psychological evaluations, acoustic and psychoacoustic factor analysis, and by researching the neural and psychophysiological underpinnings of sound.
William et al. [8] found that soundscape perception is influenced by cognitive effects such as the meaning of a soundscape and its elements and how information is conveyed by a soundscape; for example, how the behaviors of people are influenced by the soundscape. Furthermore, in the study of Jennings [9], they proposed that the understanding of a public space as positive is quite different for three types of people, each with a different level of direct engagement with the soundscape, such as planners (serious listeners), engineers, and various other humans. The first two are influenced by the soundscape itself, either in meeting legislation and reducing nuisance, or as an artistic or creative opportunity. However the third, probably most important group of people, the users of the space, are more interested in the space itself and have their perception of it influenced by the soundscape, which is a highly complex intermediate step. This influence is largely determined by their activity.
It is known that the sound pressure level (SPL) does not fully represent acoustic comfort since the parameter “does not take into account the complicated interaction between sounds and human perception of noise” [10]. The term “background noise”, for example, has been known for many years. Its characteristic is often described by parameters such as SPL[dB(A)], Lday, Levening, Lnight, etc. These parameters can be measured and calculated [11]. When one moves into the field of sound quality, the psychoacoustic parameters such as loudness, sharpness, roughness and others, take over. This is a concept where environmental noise is not reduced to an averaged quantity evoking only unpleasant feelings, estimated by statistical probabilities, but understanding noise as a valuable resource, which can be purposefully utilized.
At an international level, the standards available are the ISO 532-1 [12] and ISO 532-2 [13] The relatively young term “soundscape” is standardized, however, in ISO 12913-1 [14]. In the literature, there are some case studies that demonstrate how the soundscape becomes important for the acoustic impact assessment. The purpose of an ISPRA study [15], through the drafting of guidelines, is to propose a new methodology to integrate the soundscape approach to the national environmental impact assessment procedures for large infrastructures. The new methodology introduces some extensions to the classic approach of the environmental impact assessment procedure. The soundscape descriptors are evaluated on the basis of how people perceive the acoustic environment. The soundscape is different from the acoustic environment. The first refers to a perceptual construct, where the human perception of the acoustic environment dominates, the second refers to a physical phenomenon [16,17,18]. A procedure for characterizing urban soundscapes, which can be used in the design of soundscape is described in [19]. The study provides an informative annex with three alternative methods: two are based on soundwalks and questionnaires, whilst the third refers to narrative interviews. This study was conducted in accordance with the ISO/TS 12913-2 [20] technical specifications. A systematic soundwalk has many quantitative advantages, thanks to the realization of a real-time measurement, and it has also important advantages from a qualitative point of view since during the walk the individual intensely experiences soundscapes as multisensory experiences. This allows a real correlation between the noise measurements and the subjective sensations of the participants [21,22]. Therefore, the original soundwalk was mainly focused on educating the human being to lead them to rediscover the sense of hearing and appreciate the sounds of the surrounding environment. However, the detail of the soundwalk procedures varies depending on the target of the study. In [23], the aim of the study was to understand the sound environment of an urban park through the landscape elements, based on the three different primary data sets collected. In the study, the methods adopted for the collection of data included measurement of background sound, observation through soundwalk using the ISO/TS 129132:2018 [20] questionnaire (Method-B), and a perception survey of the users. Landscape factors have been considered in many previous studies in relation to sound and soundscape perception [24]. Soundscape is usually interpreted by means of identifying and describing different sound sources in a place.
Kang et al. [7] demonstrated that human evaluation of subjective loudness and acoustic comfort depends on a series; for example, a large-scale subjective survey was undertaken in underground shopping streets in Harbin, China, to determine how individual sound sources influenced subjective loudness and acoustic comfort evaluation [25]. Yang [26] suggested that the background sound level has been found to be an important index in evaluating soundscape in urban open public spaces, while a lower background level tends to make people feel quieter. Analyses of individual sound elements show that the acoustic comfort evaluation is greatly affected by the sound source type. The sound field can be calculated by summing the individual contribution due to the monopoles and taking the limit of a vanishing small separation. The noise sources can be modeled successfully by using a dipole. In view of this, the concept of environmental load is relevant, because at a given noise level, inhabitants of small towns seem to be less annoyed than those in a large urban city [2].
In order to study the influence of the interaction between geographic landscape and acoustic stimuli on the perception of the environment, several authors have attempted to identify the informational, aesthetic, or affective qualities of sound, which help to confer quality on a given landscape [27,28,29].
In an urban environment, there are different zones, and in each zone there is a dominant sound. On the basis of a series of case studies in Europe and China and an intensive literature review, Zhang [4] evaluated the basic elements for soundscape: sound, space, people, and environment. In their work, factors affecting soundscape evaluation in urban open spaces included acoustic psychological social characteristics of various sounds and, consequently, a system for soundscape description was established. To quantitatively describe sound evaluation, such as annoyance, researchers often refer to parameters such as the equivalent continuous level, Leqt[dBA], day and night level (Ldn[dBA], Lnight[dBA], Levening[dBA]) and, in some cases, the sound exposure level, SEL[dBA]. These parameters can be measured and calculated [30]. Ambient noise and soundscape are not synonymous, for example a low noise level does not mean that there is good sound quality [3]. Moreover, as it considers human perception including cognitive aspects, context, and interaction, it goes beyond physics and psychoacoustics. As Smith [31] points out, muteness in cultural geography is problematic for a number of reasons. For example, it leads us to underestimate the role of all the senses in structuring and experiencing space and place, and it could also exclude an important form of expression such as the production of sound. Sound can make important contributions to the re-definition of spaces in a more complete way than the classical approaches.
To investigate the acoustic environment of a urban open space, it is important to develop an appropriate description of this. Raimbault [32] suggested that three categories of analysis should be considered for urban open public spaces: activities such as human presence or transport, spatial attributes, such as location, and time history, including moment. A good model for describing the soundscape of urban open spaces is proposed by Cain et al. [33].
Another aspect of a sound source in an urban open space, the psychological and social characteristic, is discussed in [34,35,36,37]. The results showed that Shaffer’s perspective not only encapsulated the sound sources themselves, but viewed the sonic environment as a subjective, and somewhat personal, interpretation. Hence, just as important as the acoustic signal is the relationship between the individual experience and subjectivity within a physical and a cultural context.
1.2. Contribution of This Work
The aim of this work is to propose a sound landscape procedure for the evaluation of the urban space. Previous studies have adopted group-soundwalk methodologies. In this case study, a real acoustic environment was considered and a recorded soundwalk procedure was developed. After an in-depth investigation of the area, the assessment positions in which any positive or negative characteristics of the urban soundscape could be perceived as positive or negative were selected. The evaluation of the relationship between the acoustic/auditor environment and the responses of the people who live within it turns out to be a very important correlation to characterize the human perception of everyday environmental noise. It is an important starting point to develop ways to improve the sound of the built environment and, thus, recognize the essence of soundscapes. The case study was located in the seaport area of the city of Ancona, Italy. Soundscape data collection was carried out in situ by an operator, through binaural recording and video recording. Data collected was used to design a listening test. The listening test was created on an online platform and shared with people who frequently live this area. Data on how people perceive the seaport area acoustic environment were investigated by a questionnaire, implemented in the same online platform. The results of the subjective tests were then correlated with the acoustic measurements by means of statistical analysis. The study tried to move away from the concept of negative noise and identified a means through which the concept of soundscapes could be effectively incorporated into urban planning. In this way, the aim is to propose interventions that could be called “acoustic planning” in order to increase the environmental quality perceived by humans.
The paper is organized as follows: Section 2 presents the methods, focusing on the case study, measurements, and subjective investigation. In Section 3, the discussion of the statistical model is presented. Conclusions are reported in Section 4. The methodology developed in this research could be applicable to seaport of the other cities, after a specific analysis of the characteristics of the place.
2. Materials and Methods
2.1. Seaport Noise: Legislation and Implementation
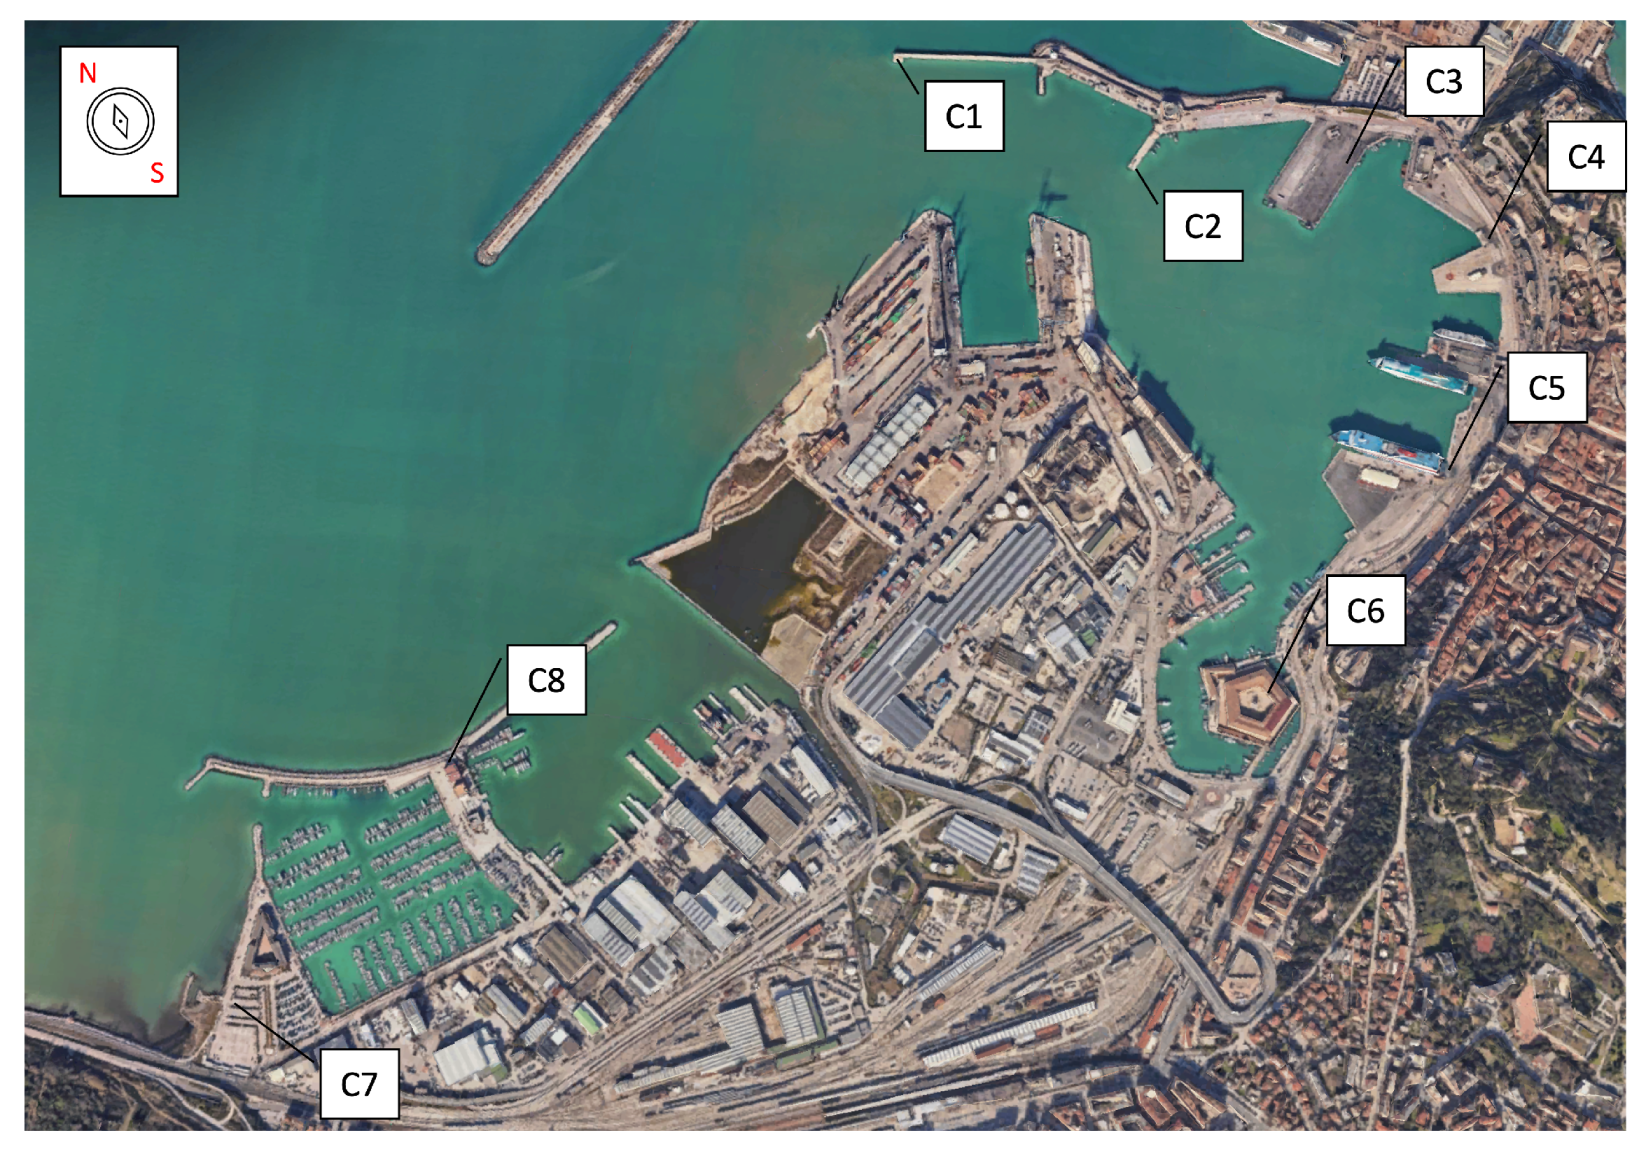
The investigated area is the seaport of Ancona, Italy. The seaport of Ancona is located in the center of the Adriatic Sea. The seaport area is over 1.4 million square meters; it is divided into passenger and ferry terminals, container terminals, and plants for solid bulk; moreover, the seaport area is full of commercial and recreational activities, and it is a meeting point for the community. The seaport has a strategic function in the Adriatic–Ionian macro region, and it is a terminal for international ferry lines to Greece, Croatia, and Albania. This site was selected because it represents a delimited area, and it is frequented by people who use the area every day for different aims. The sound environment of the seaport was considered to be characterized by a variety of sound source types (natural sound, traffic, noise related to industry and machines, and human voices). For the analysis of soundscape, it was decided to consider only the areas of the seaport accessible to the public in order to carry out the investigation as realistically as possible. Therefore, the docks used as building sites or warehouses were excluded. As the seaport has areas with different intended uses, these are split into eight locations that are called: Cluster 1 [C1] (North Pier Area (Red Lantern)), Cluster 2 [C2] (Area of the Clementino pier), Cluster 3 [C3] (Area of the Rizzo pier), Cluster 4 [C4] (Area of the Santa Maria pier), Cluster 5 [C5] (Area of the XXIX Settembre pier), Cluster 6 [C6] (Urban functions area), Cluster 7 [C7] (Sailing area (Doric navy)), and Cluster 8 [C8] (Naval League Area). The selected clusters are shown in Figure 1.
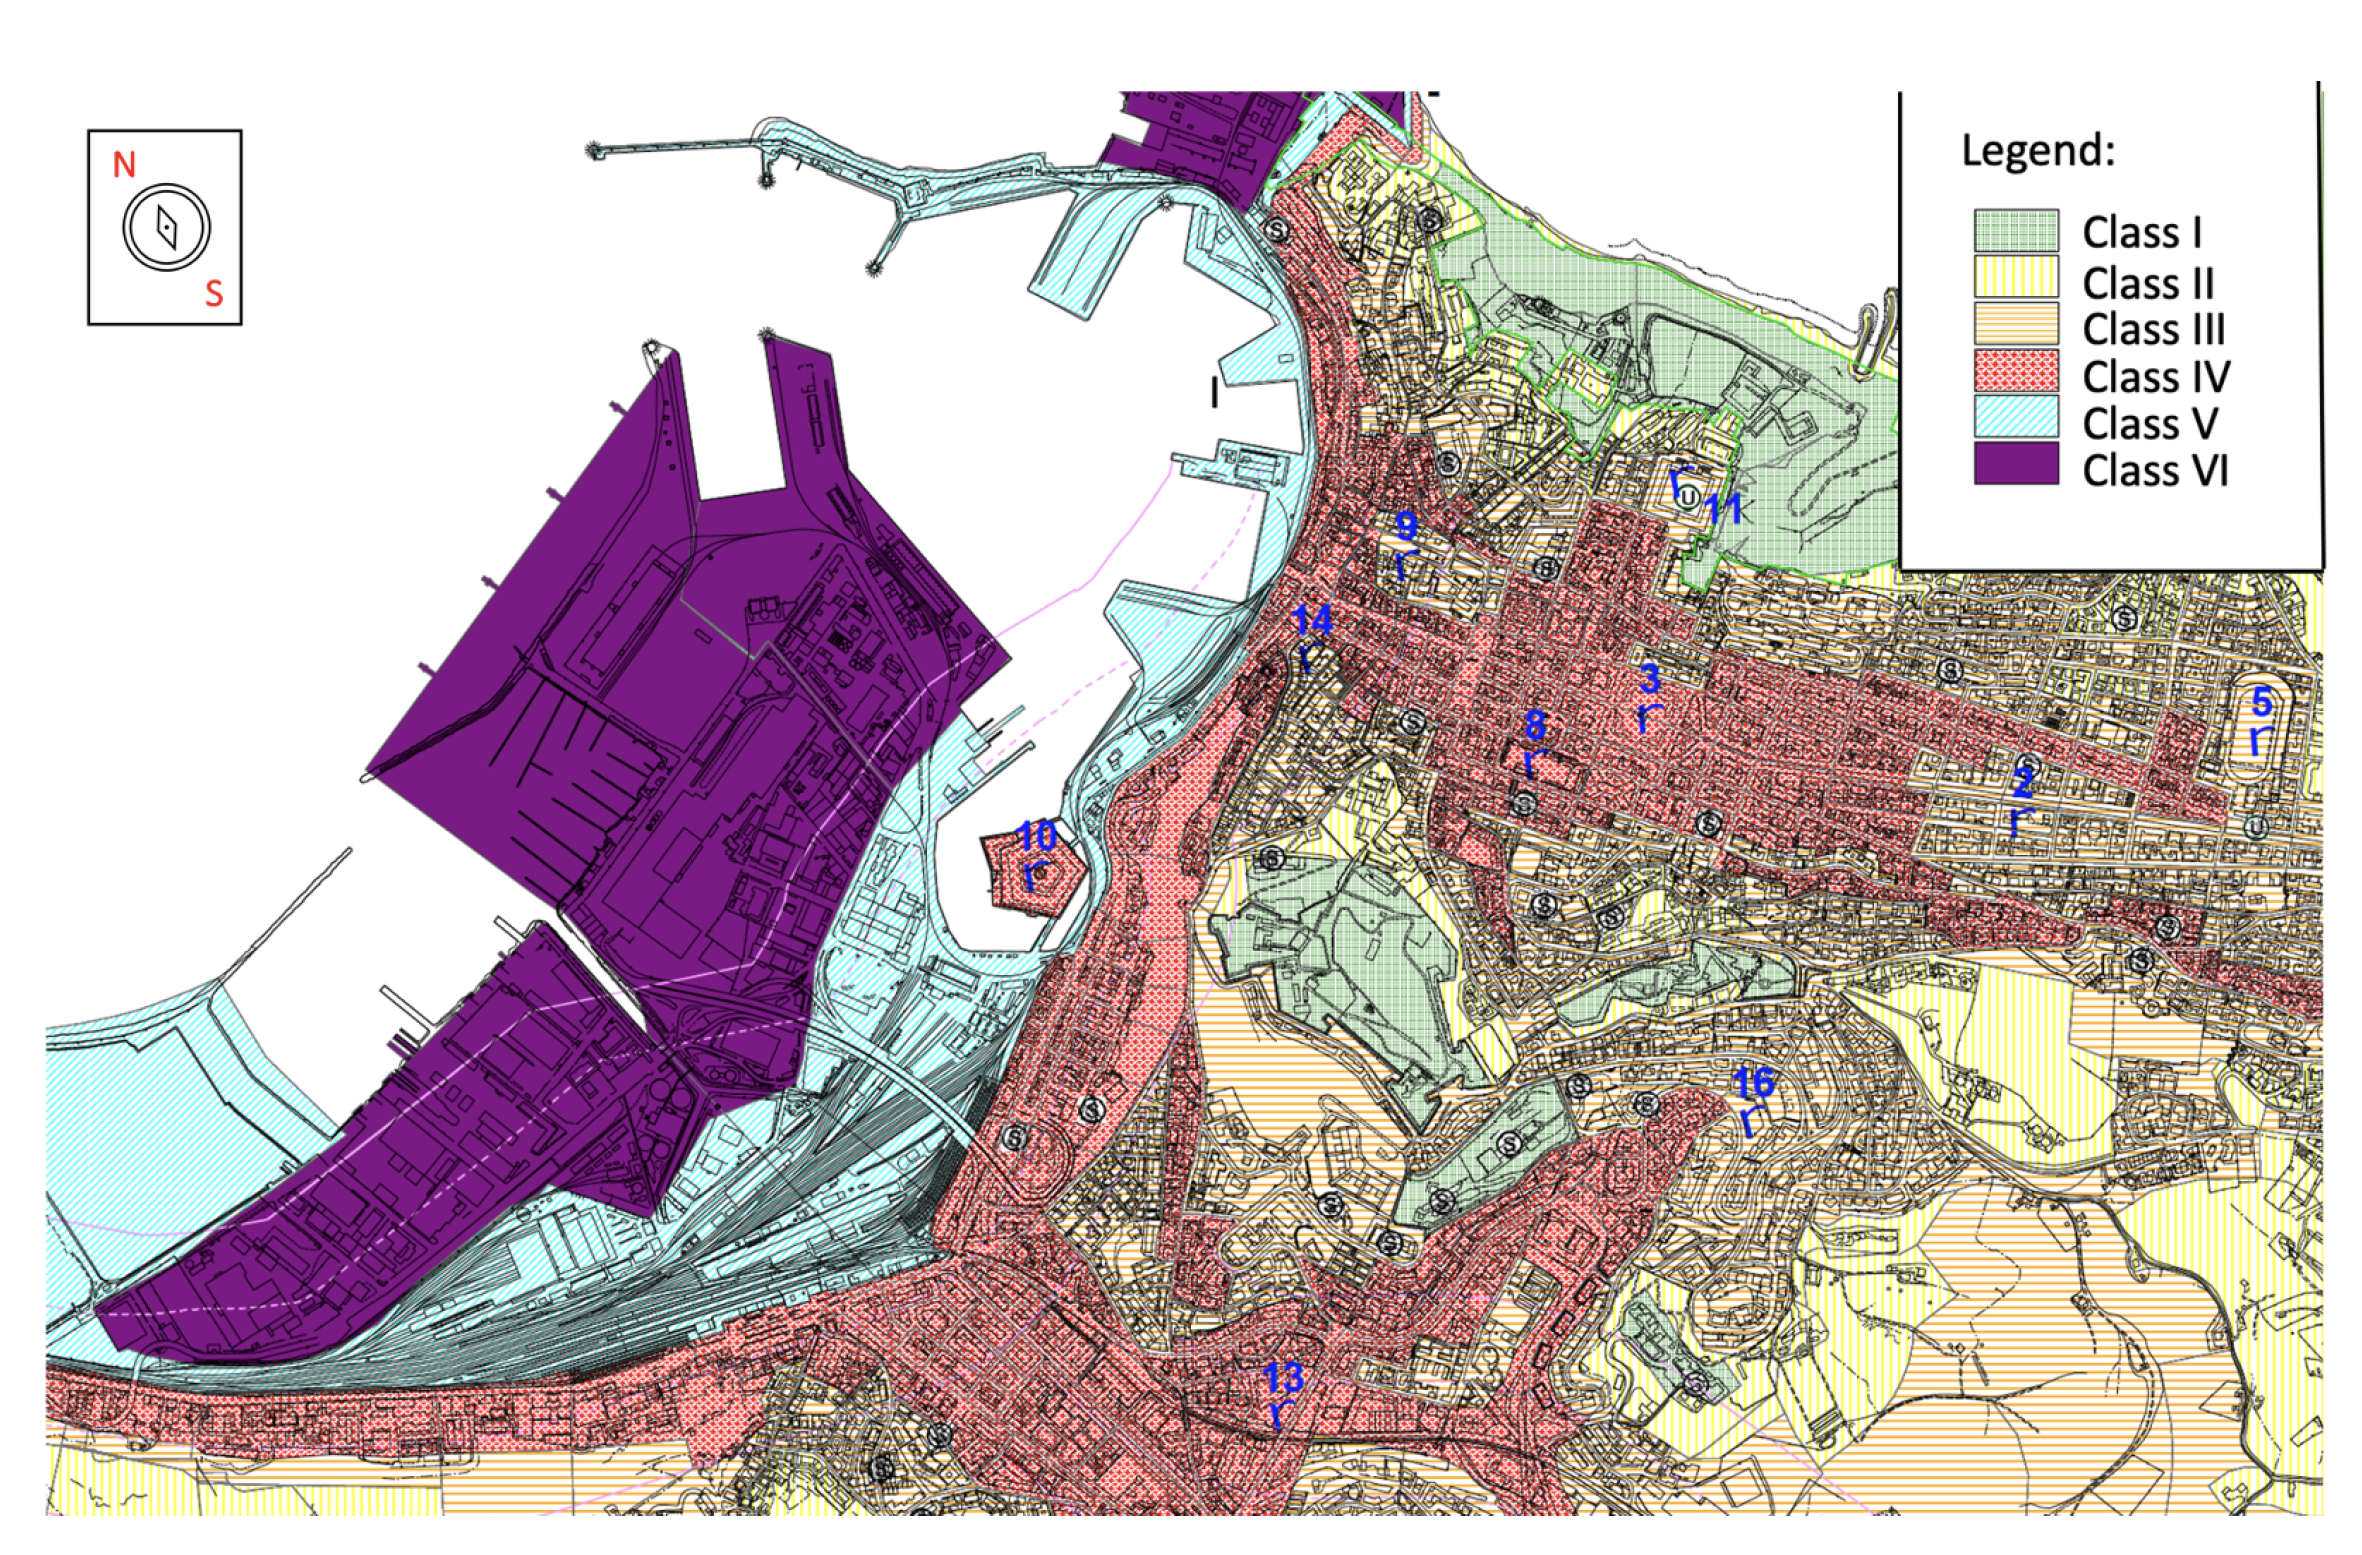
From the acoustic point of view, the interest of the seaport area originates from the diversification of the noise sources presented: goods handling, shipbuilding operations, noise emissions by on-board systems, etc. A further element of interest is the coexistence of an impact on the inhabited environment (noise propagated through the air). The noise of transport infrastructures is governed by Art.11 of L.447/95. The noise produced in the seaport area is not regulated by national specific recommendation, therefore there is great confusion, as the limits are often exceeded, both for the existence of severe acoustic classifications and for the probable overcoming of the differential criteria in the near structures. This insufficiency of conventional methods creates the need to experiment with alternative approaches to environmental management, such as those focused on soundscape. At first, it was necessary to collect information for the geographical and acoustic characterization of the area under examination. Using the technical report on the acoustic classification plan of the Ancona area approved by the Marche Region, information such as the influence of the port area, the acoustic classification, and the measurement points of the noise-monitoring network were collected and examined. As shown in Figure 2, the seaport currently operates within the limits prescribed by the Italian DPCM decree 14/11/97 [38]. In [38], the environmental acoustic classification of areas is explained, as well as the fact that the seaport area of Ancona city includes public land of three classes, these being class IV, affected by vehicular traffic, with high population density, and presence of commercial activities, and classes V and VI, which relate to the industrial zone. Figure 2 shows the acoustic classification of Ancona; the focus is on the seaport zone.
2.2. Binaural Recordings and Video Recordings
The acquisition of the objective parameters of psychoacoustics was carried out in each cluster. The experimental measurements allowed the determination of acoustic parameters such as sound pressure levels (SPL) [39] and the main objective parameters of psychoacoustics: loudness and relative percentiles, sharpness, roughness, and fluctuation strength [12,40,41]. The sound levels for the calculation of the psychoacoustic parameters were measured thanks to a head and torso simulator [42,43], type 4100, and binaural headphones, CS 10-EM Roland (24-bit/96 kHz recording, high-resolution audio). The head and torso simulator is equipped with microphones at the entrance of the auditory channels to simulate the separation that exists between the right ear and the left ear of a human head [44,45]. The head and torso simulator enables maintaining the shape, size, and acoustic impedance of the head and torso of the listener; it is also able to maintain, unaltered, the directionality of the sound. The head and torso simulator was appropriately calibrated before making recordings. The model 4231 sound level calibrator was used to calibrate the binaural head. The calibrator generates a stable sound pressure at frequency 1 kHz, with minimal susceptibility external factor. The CS-10EM offers combined in-ear monitoring and binaural recording, enhancing the convenience of field recording. This choice was made to simulate the real sensation that a human being feels when they observe their surroundings. For headphone playback, we chose to use the track acquired with the binaural head.
The analysis was performed using Soundbook MK2 software (Spectra) and Sound Quality software (PULSE, B&K).
All data from the eight sites were collected under the same conditions: daytime (11:00 a.m. to 16:00 p.m.) in October 2021 (first week of the month), clear weather and temperature between 18 °C and 21 °C degrees.
Visual data were recorded in 8k resolution as recommended in ITU-R BT.2020 [46].
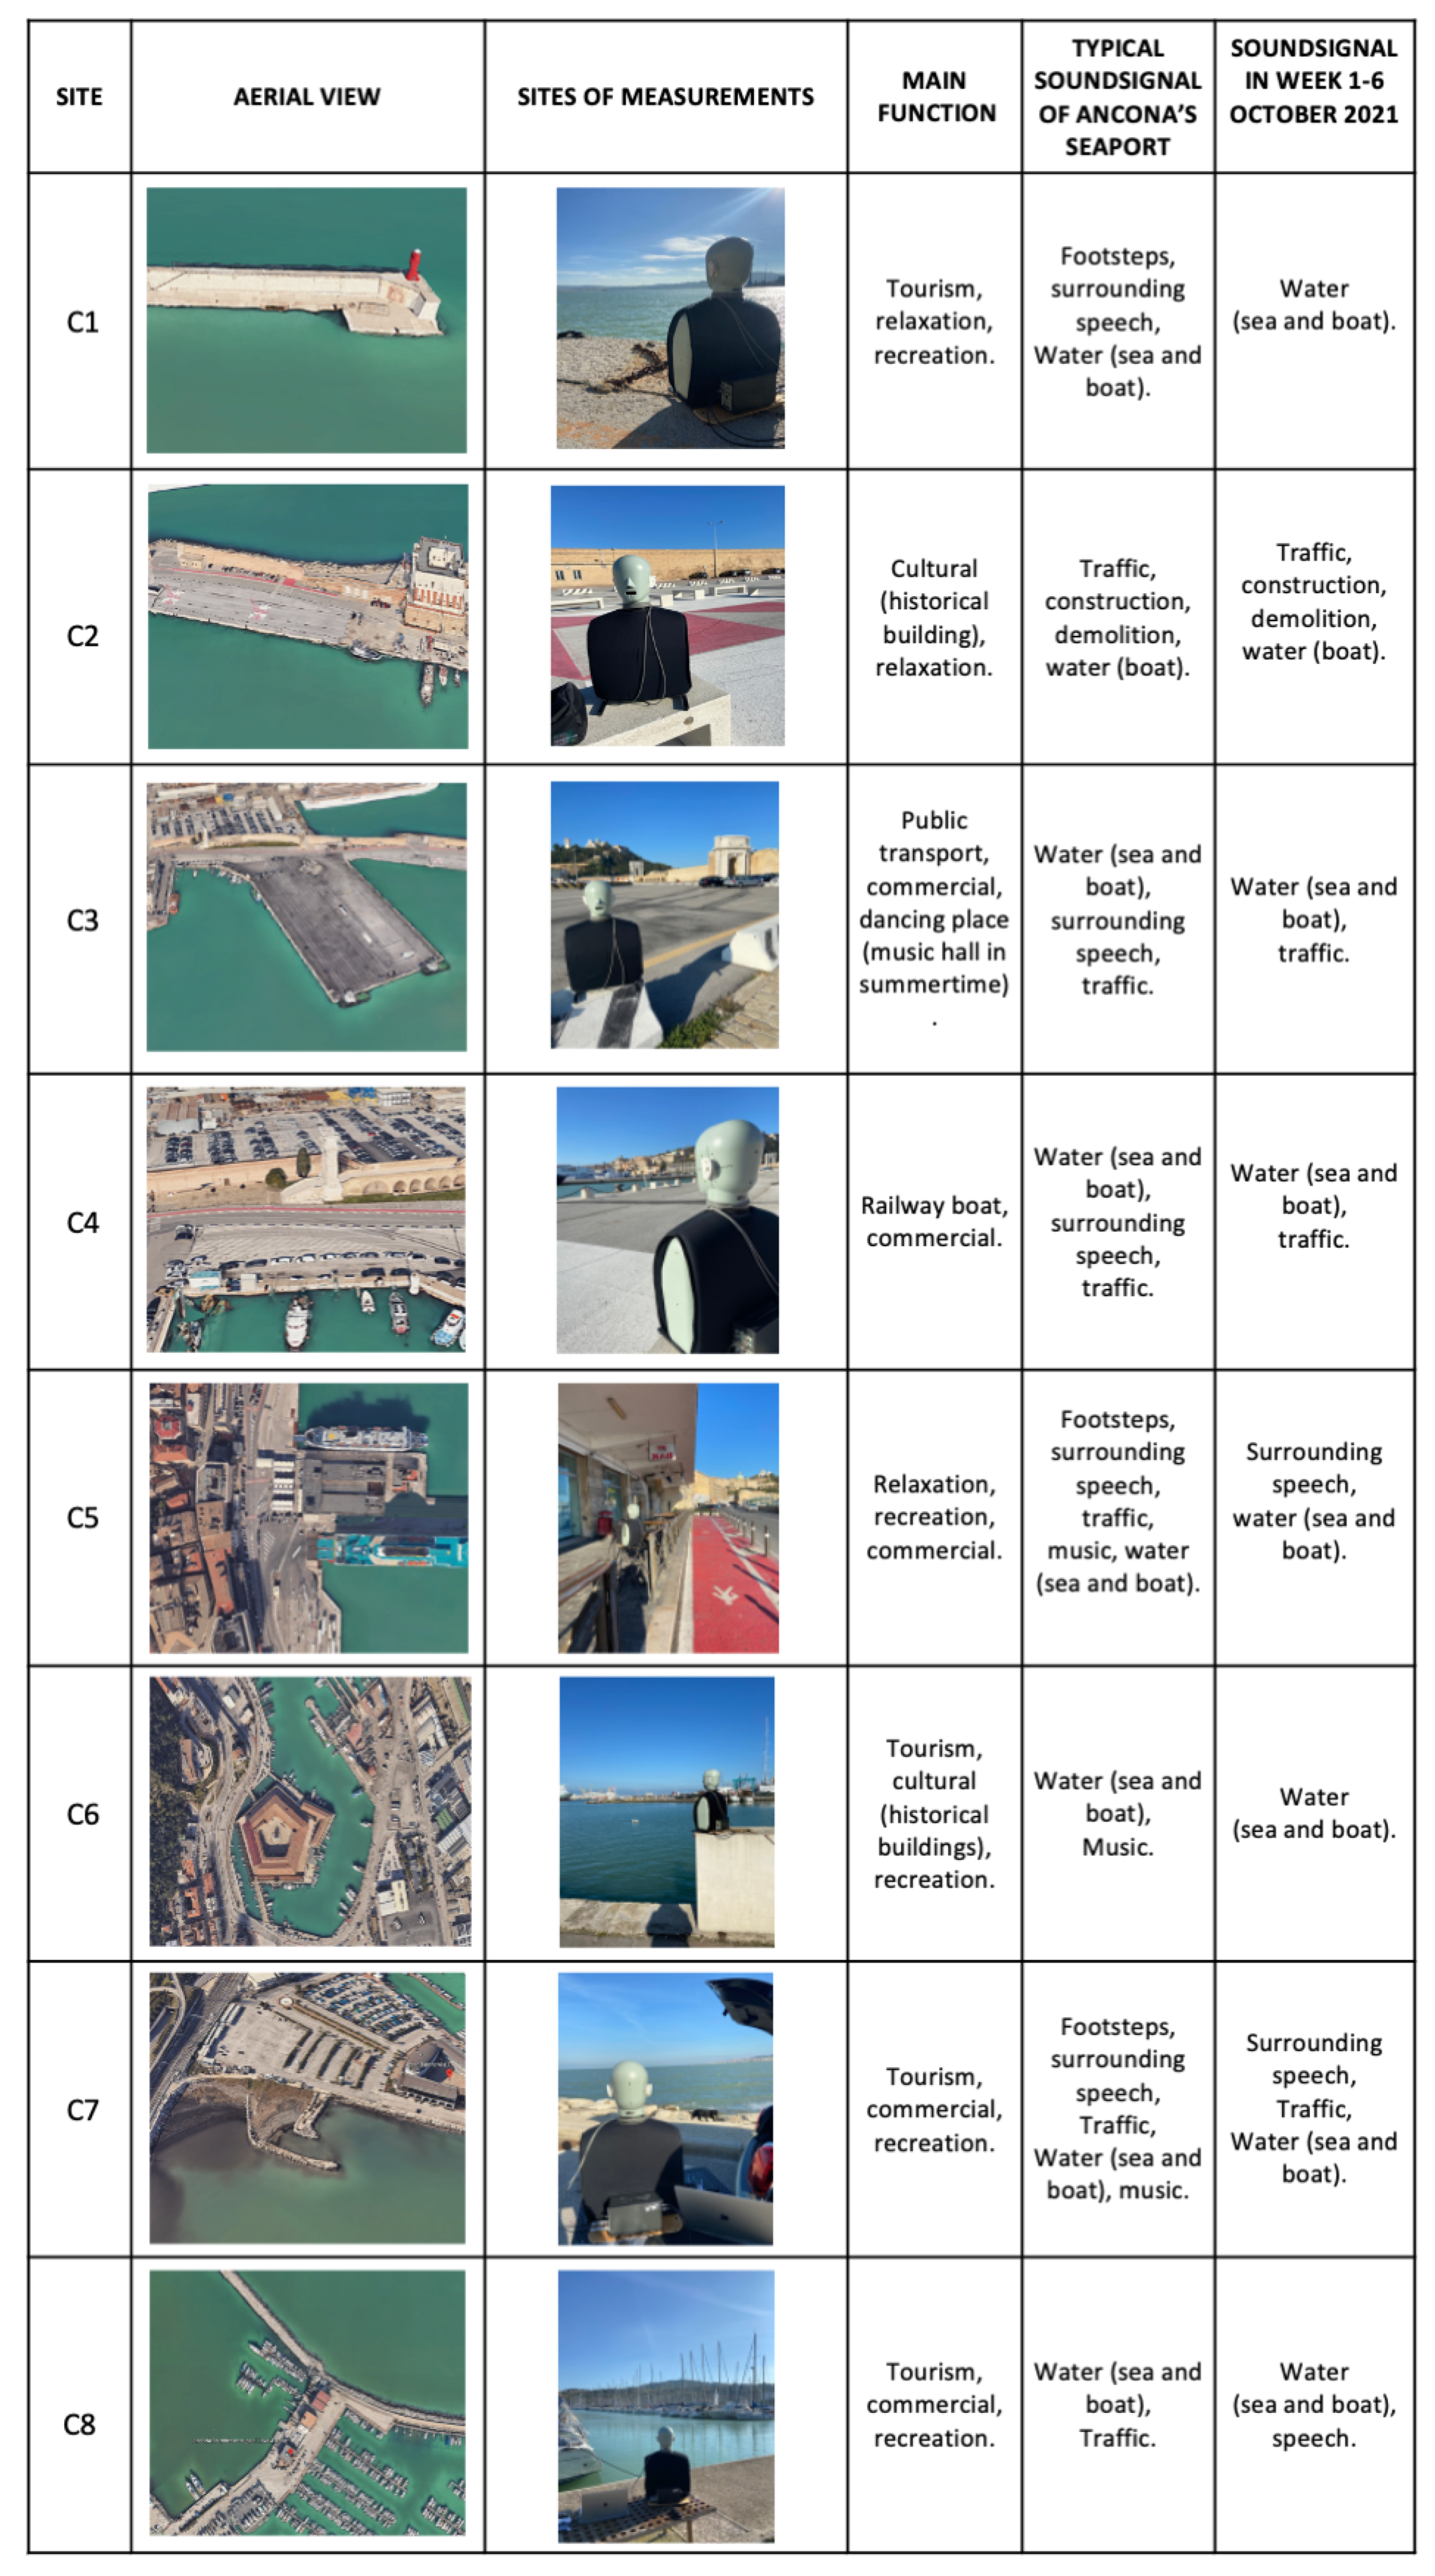
For greater understanding, Figure 3 shows the site plan, the main function, the main sound sources, and the point of measurements for each site. It can be seen that the eight sites showed a wide variation. In terms of function, the clusters included high-traffic areas, areas affected from noise by naval industries, and particularly quiet areas.
2.3. Subjective Evaluation: Questionnaires and Listening Test
Previous research has shown that visual environments are closely related to the sound environments, and the quality of the visual environment plays an important role in assessing the qualities of the soundscape [47,48,49,50,51]. The qualitative analysis was made through the subjective responses given by the listeners in the listening test; it refers, for each cluster, to a general impression of acoustic comfort, annoyance, pleasantness, and unpleasantness of the sounds that are used to compose the test. The tests did not take into account non-auditory factors, such as daylight and fragrance (smell), because they were not decisive for this type of analysis, although they appear to be important aspects of soundscapes. The questionnaire was created on an online platform and shared through web forms. Participants were asked to describe the sound environment of the seaport during a virtual sound-walking built using a Google form.
The online test transmission mode allows you to standardize the playback of the audio track. Each participant in the listening test listened to the same track containing the same type of noise. This is very important for a correct statistical analysis.
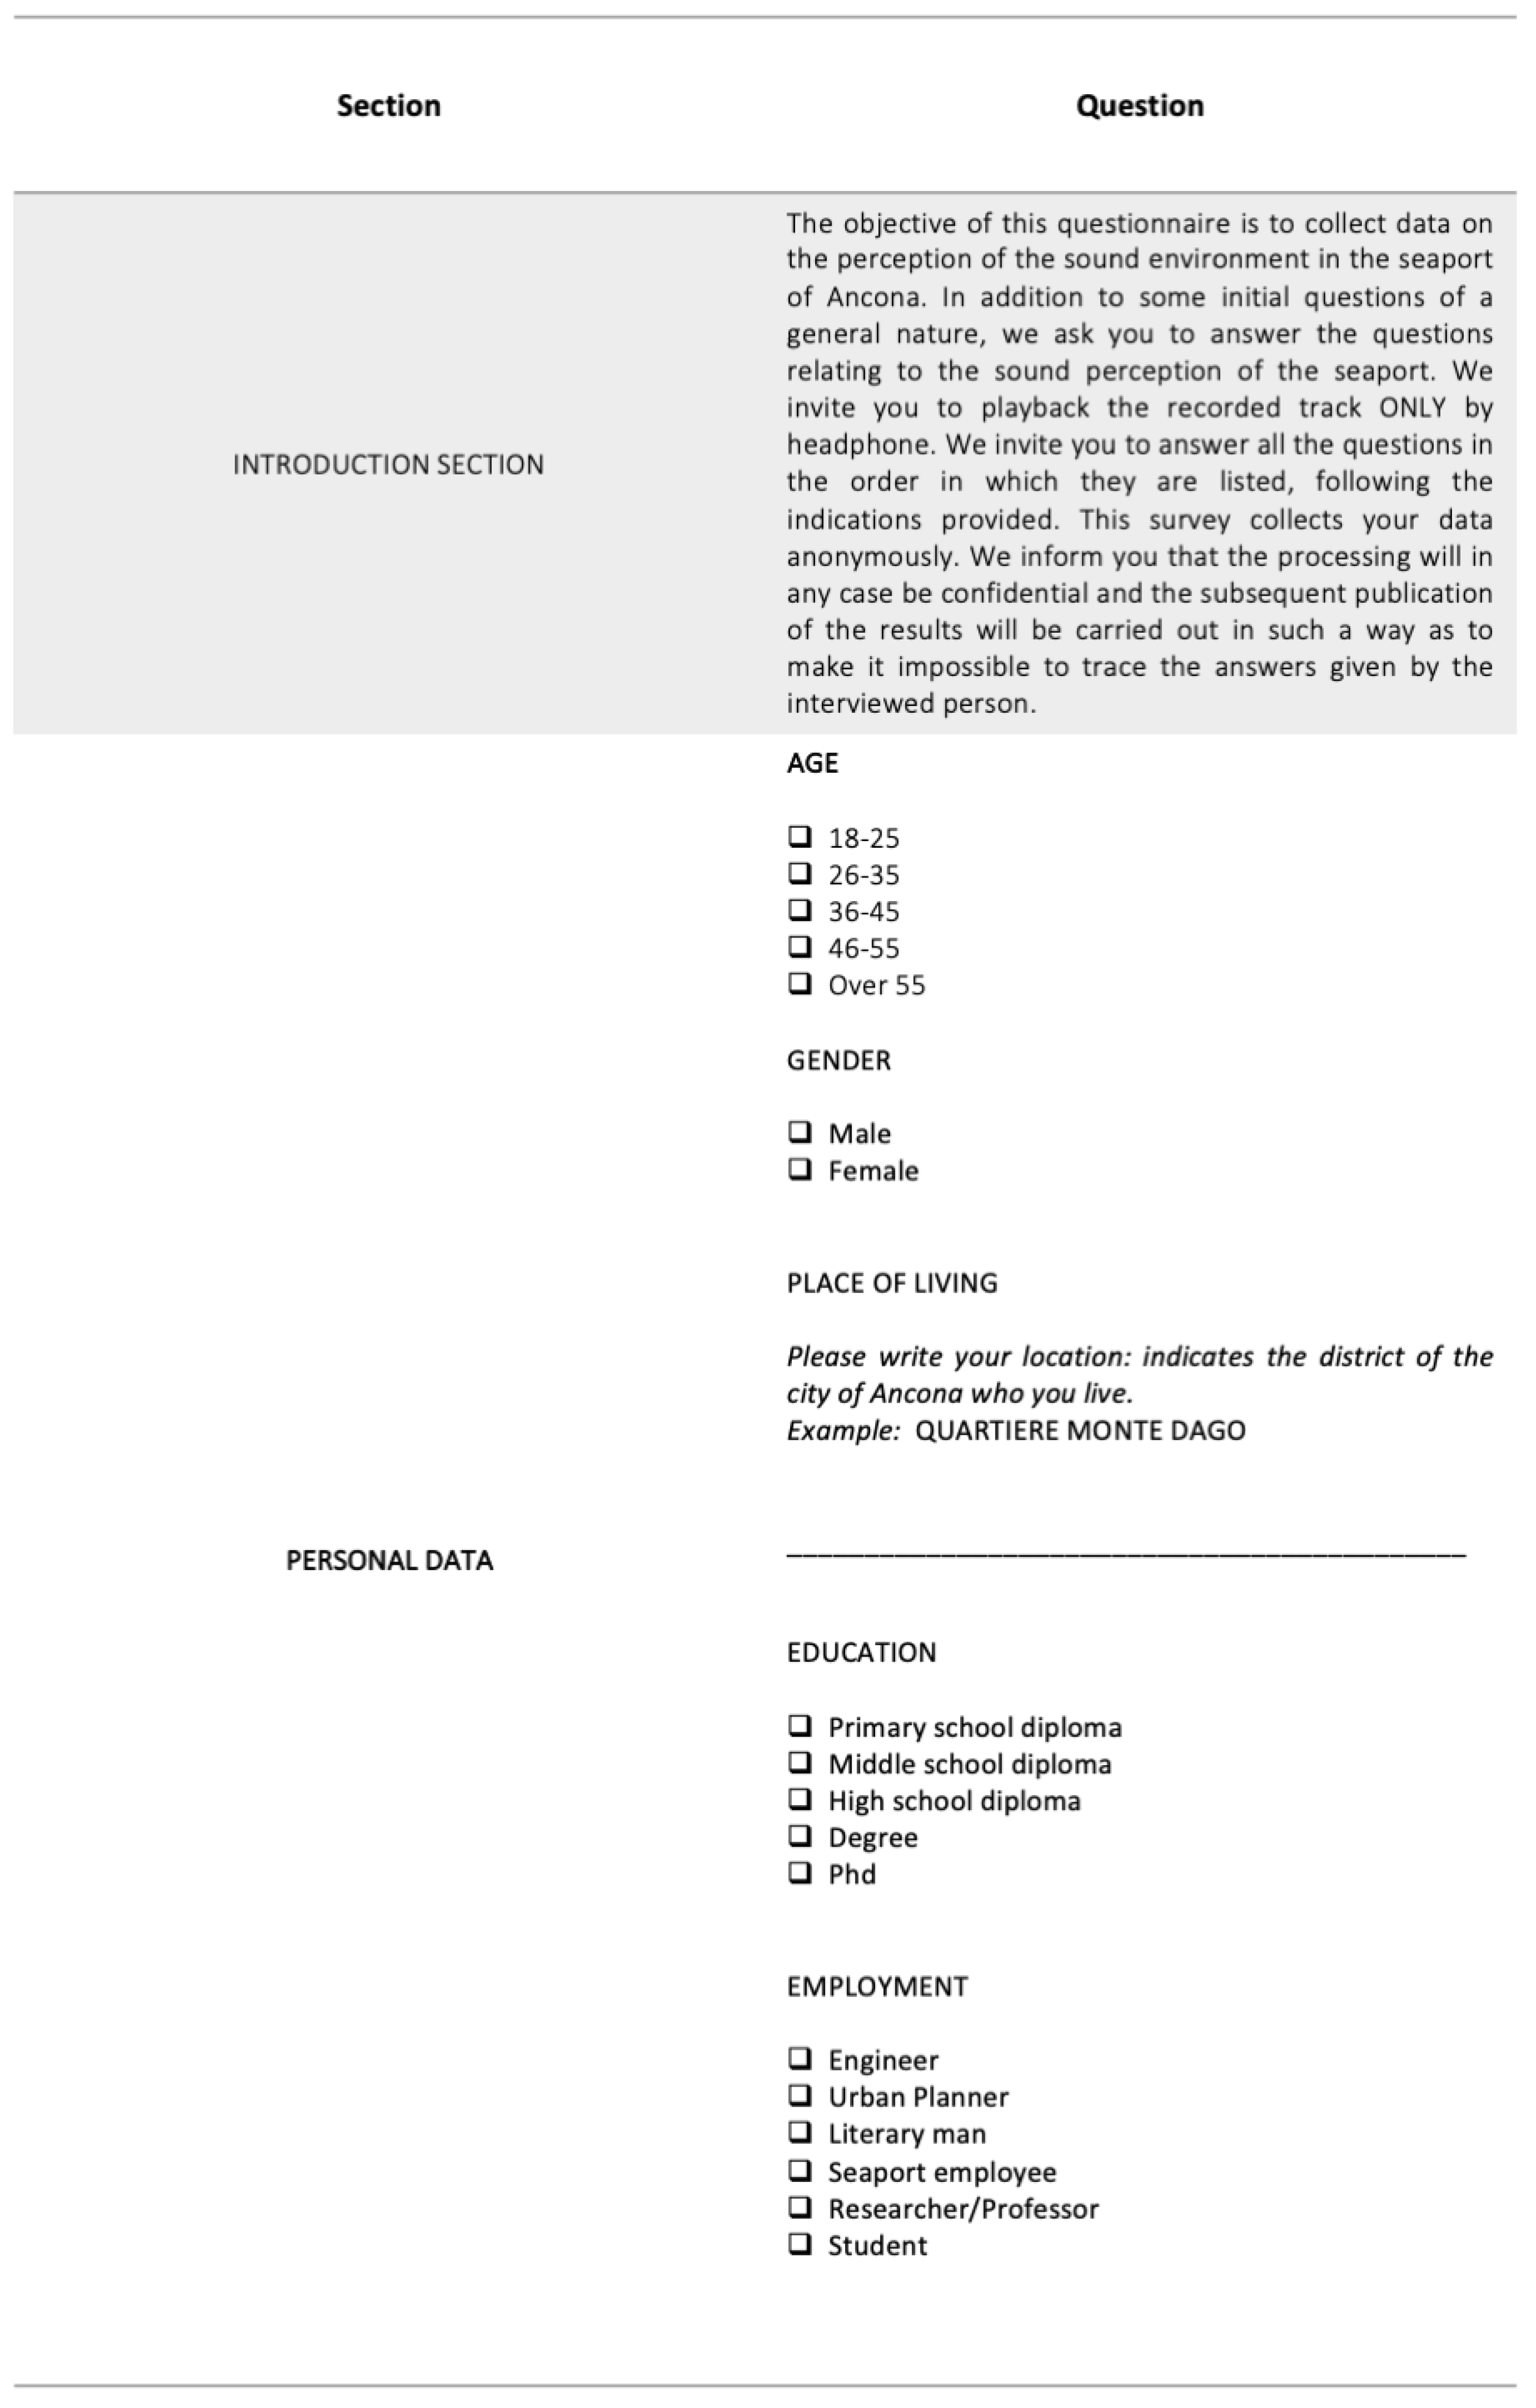
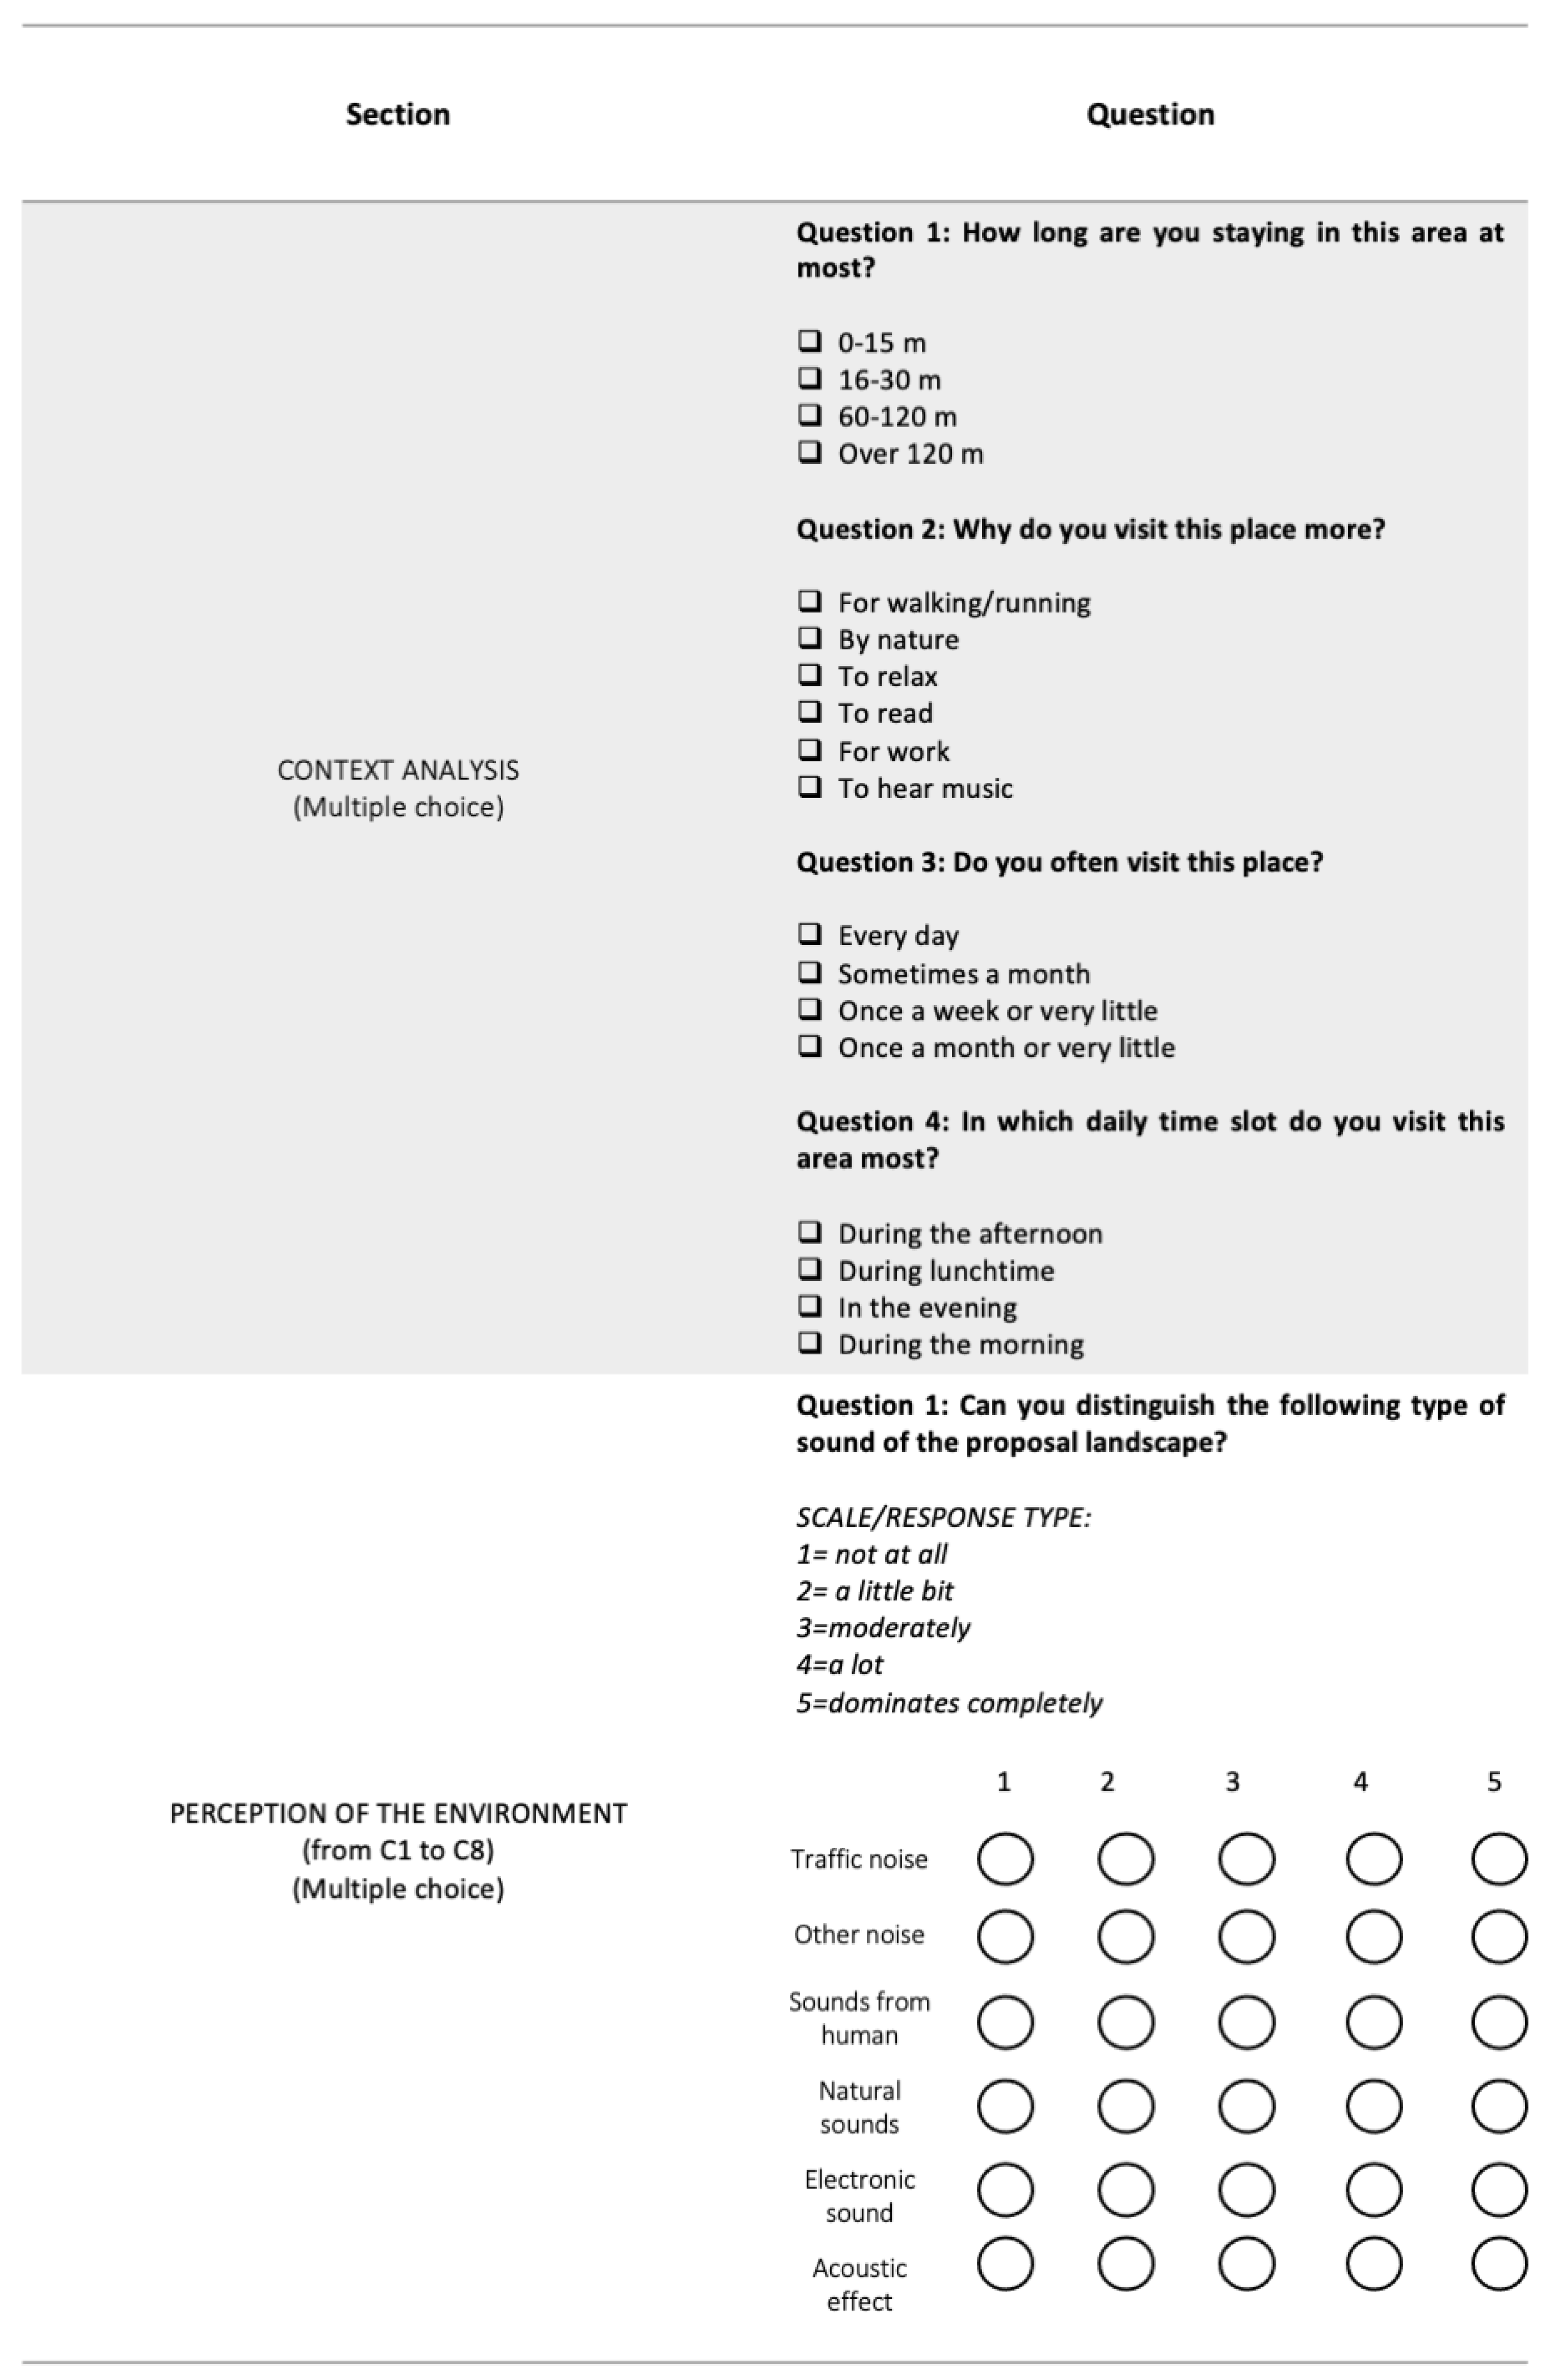
For this case study, the questionnaire was made up of 10 sections:
- In the introduction section, the finality and method to compile the questionnaire were explained to the subjects. In particular, most attention was given regarding the modality of the playback of the noise seaport recording. Participants were asked to reproduce the track only with headphones.
- In the first section, the subjects were asked to write down information of a cognitive type, for example: “how much do you frequent the place”, “how much you are addicted to it in terms of time”, “how much would you like to live there, if it were not for the surrounding conditions (work, obsession with the place, perhaps, life in general’)”⋯
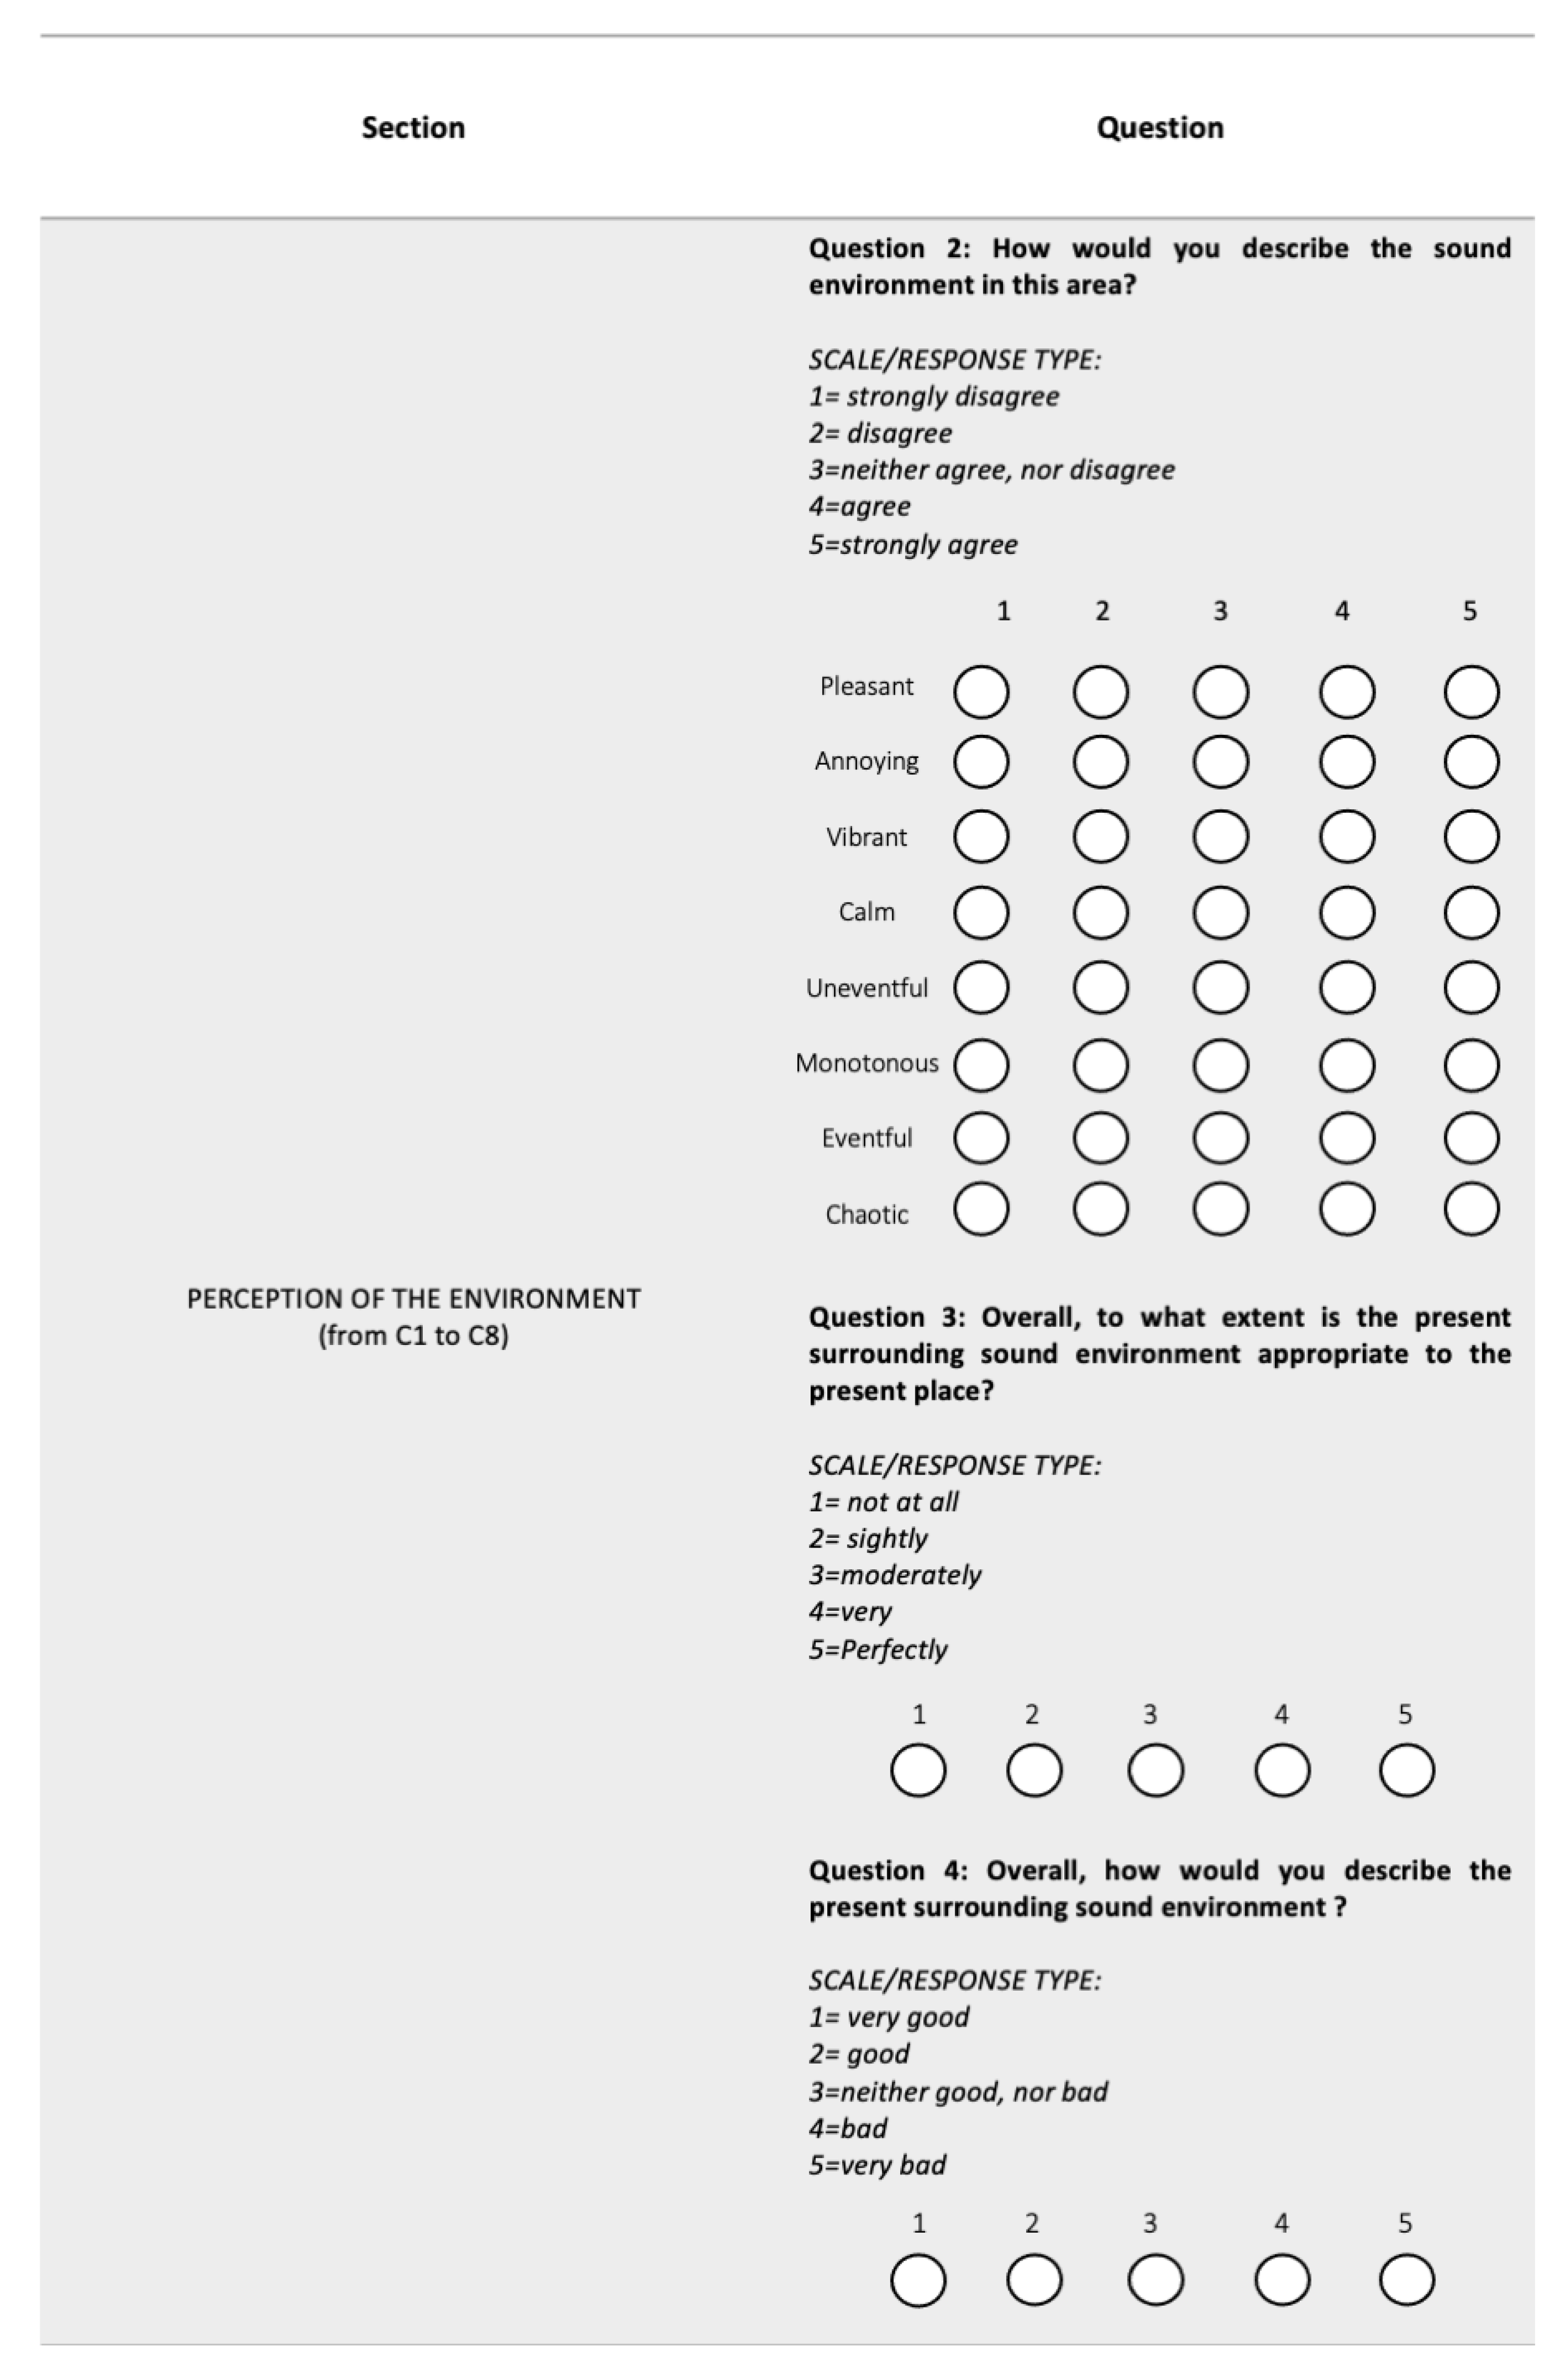
- For the second section of nine, the subjects were asked to evaluate their overall impression of each of the eight clusters under examination. A video of the landscape suitably mixed with the binaural recording was presented to the listeners. All preference ratings were made on a 5-point numerical scale (1—not at all and 5—extremely).
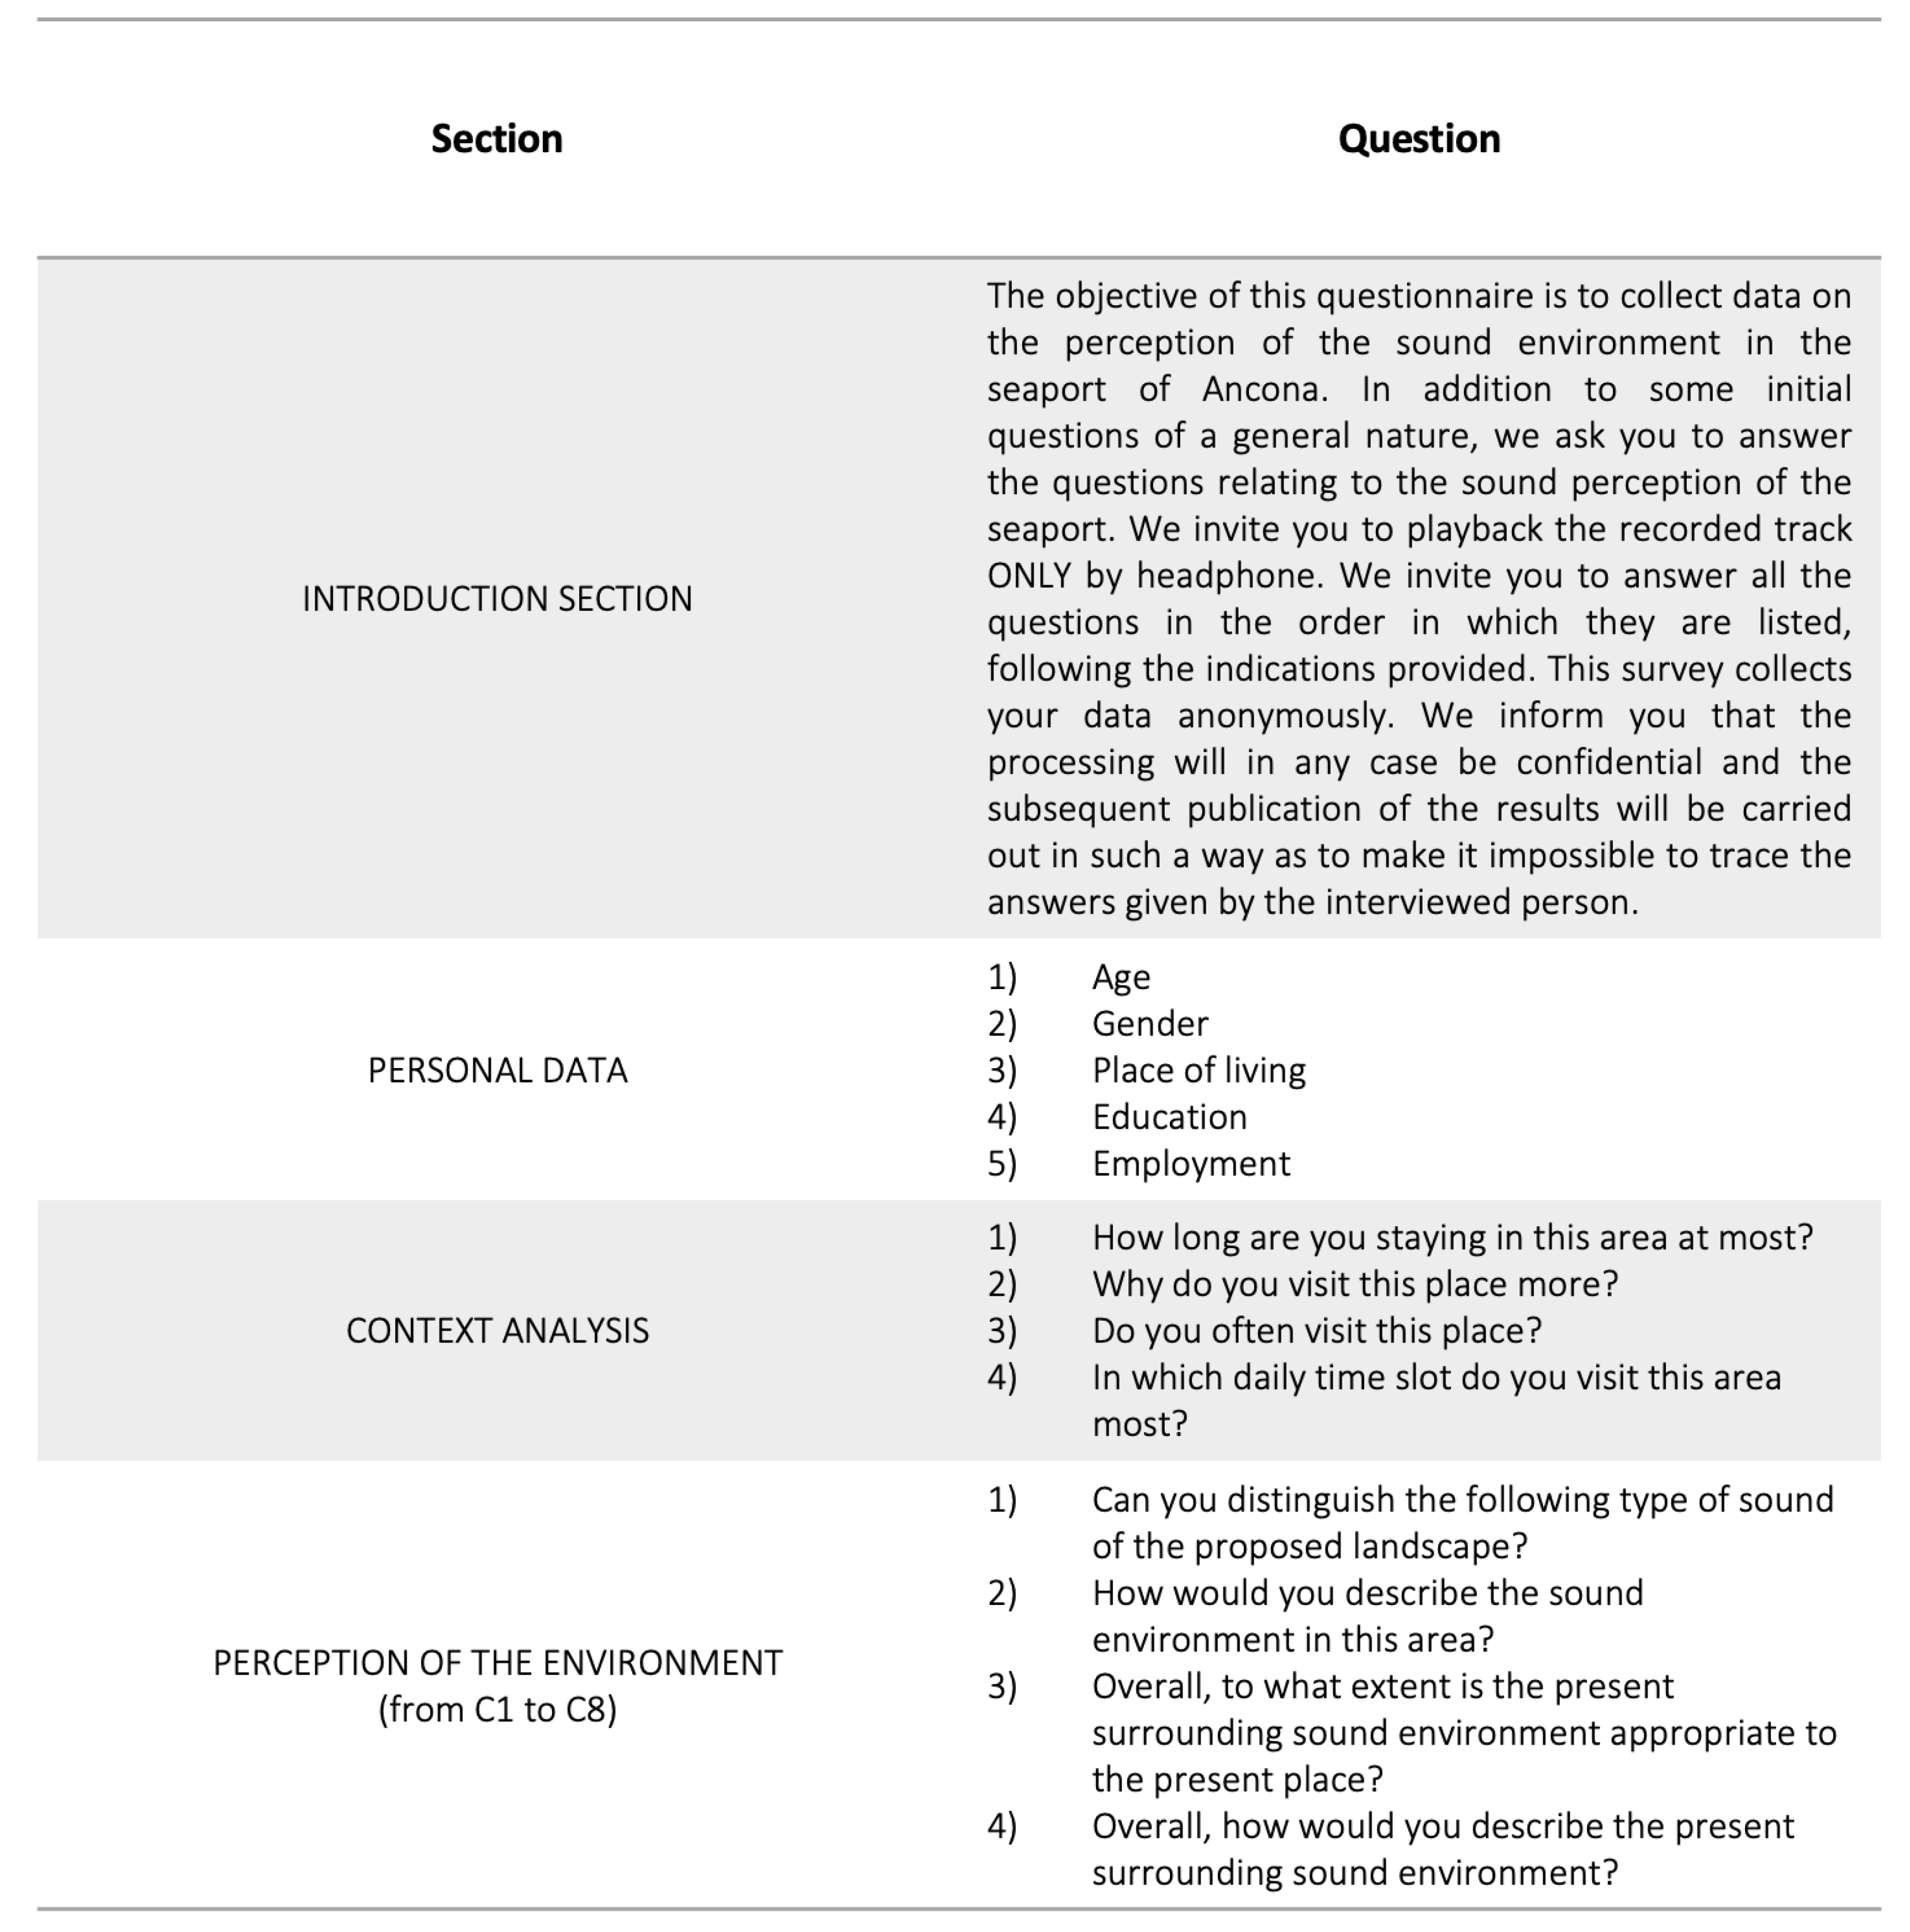
Regarding the subjective survey, an Italian translation of the questionnaire was made because English is not the local language. The standard [20] provides a questionnaire example, though it does not provide official translations in languages other than English. For this reason, in this soundscape research, the author has consulted Table 3 of [52] for the translation of the adjectives. The schematic structure of the questions is displayed in Figure 4 while the full questionnaire template in English Language is made available in Appendix A.
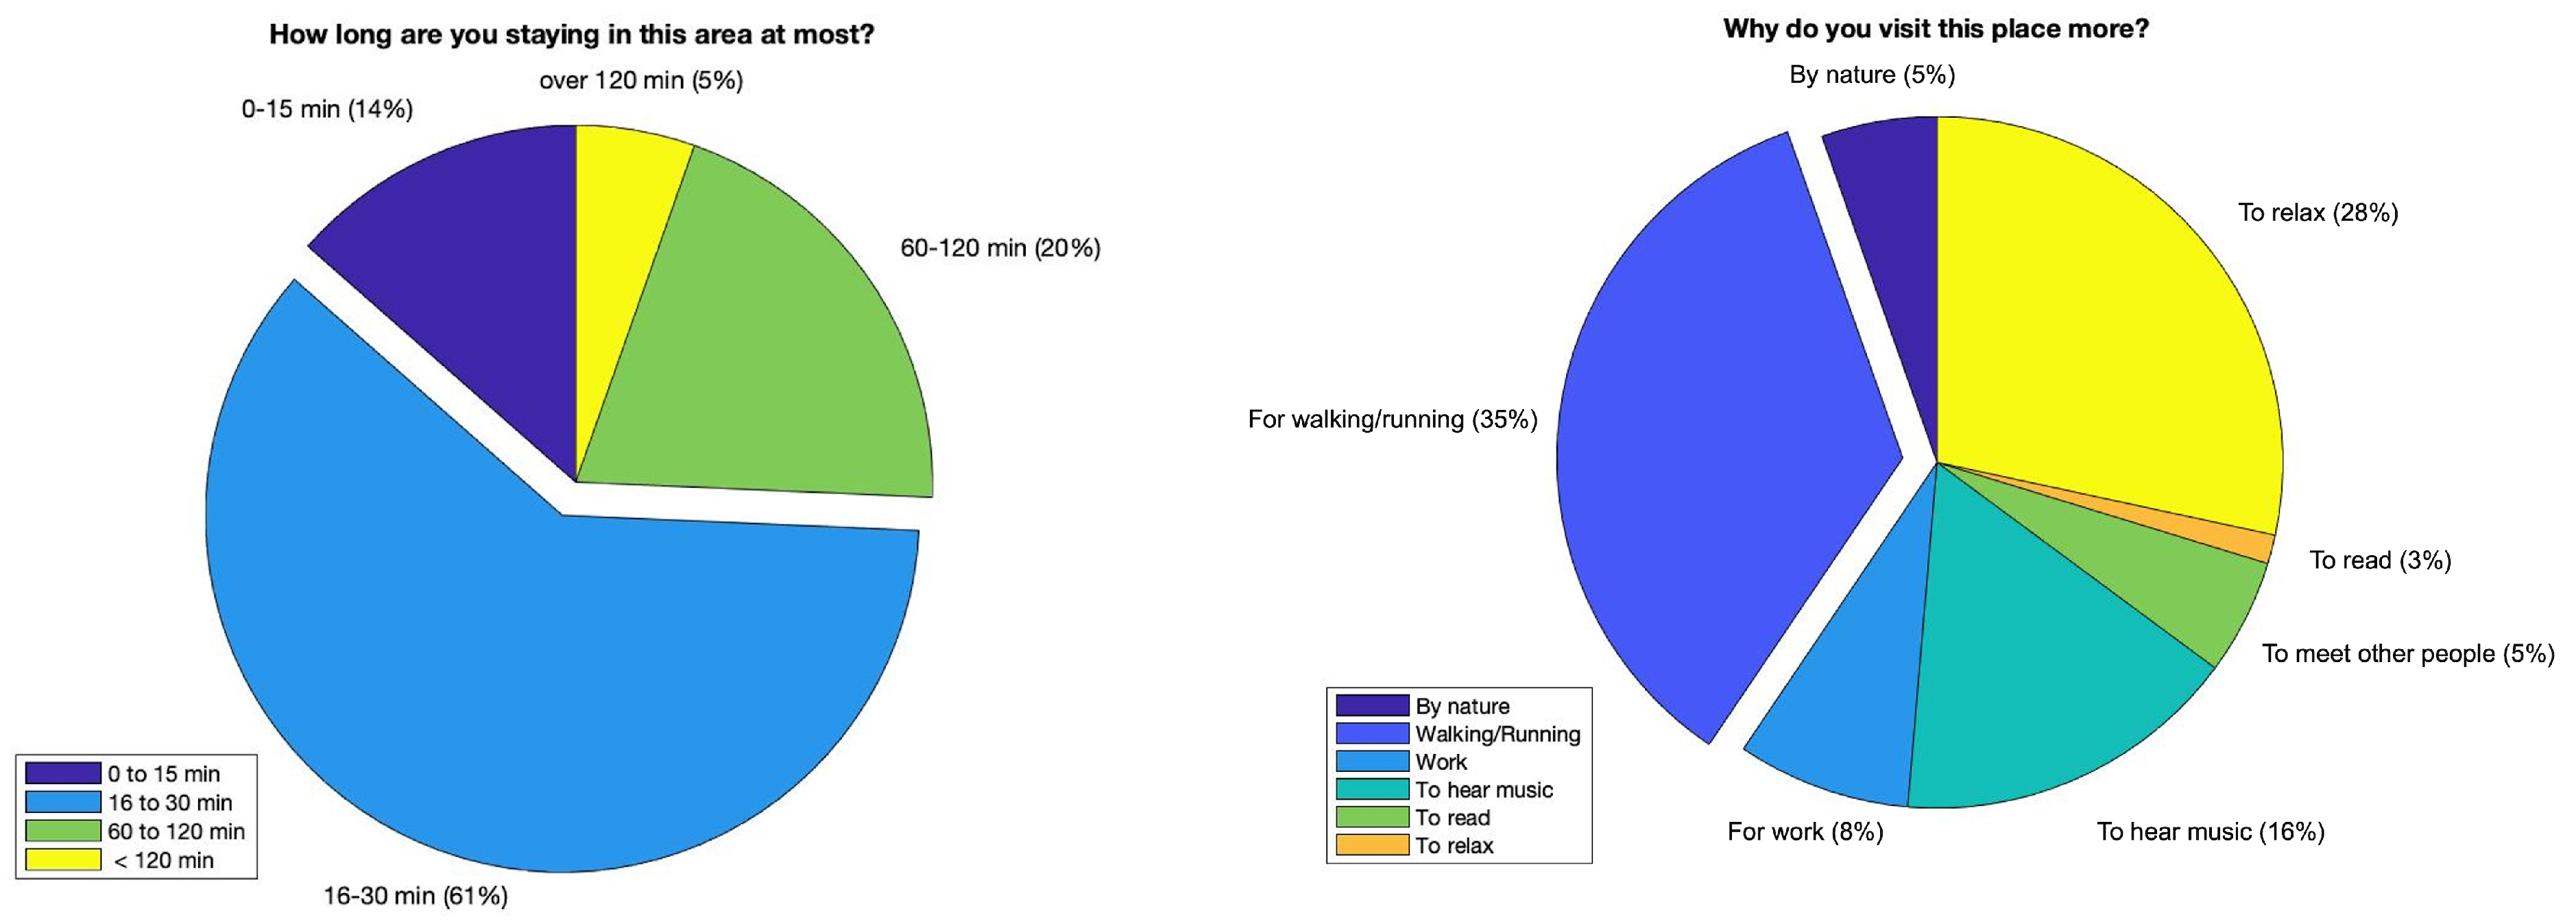
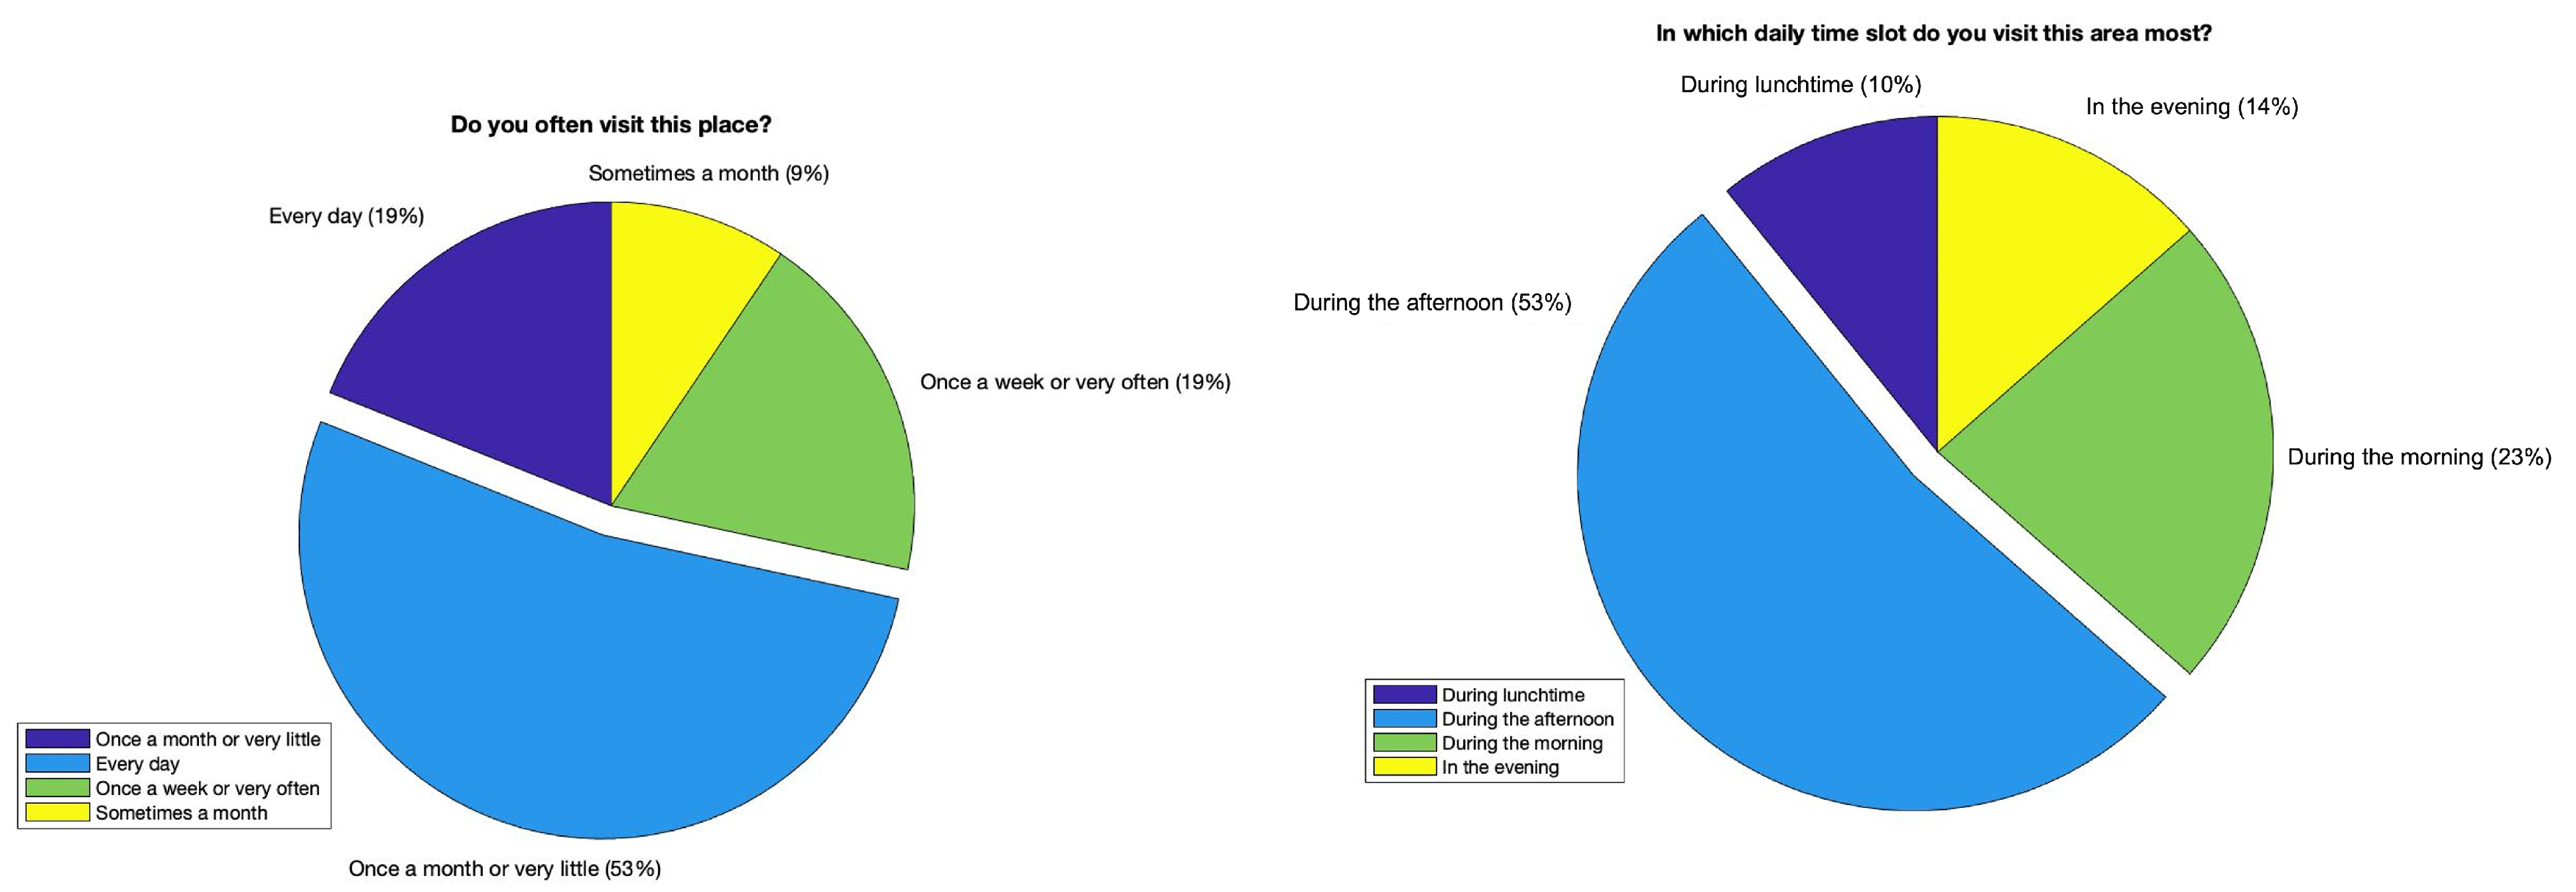
Psychoacoustic quantities were directly calculated using the binaural recordings taken in each cluster. The same binaural recordings were used in the questionnaires to obtain the subjective response of the participants. This section reports on the soundscape measure from the subjective point of view. First, the general trend of the test is reported in Figure 5.
The pie charts highlight the listeners’ attitudes by providing indications of the frequency of the experience of the place, the length of the stay, and above all on the motivation. This will be an important tool to use in dataset normalization. For each cluster, the sensation of noise, in terms of pleasantness/unpleasantness was evaluated. For the same cluster, it was also investigated how much each type of noise was considered to be in agreement with the landscape. The results of this analysis are shown in Figure 6, the trend of the types of noise for all the clusters of interest.
A total of 228 respondents completed the questionnaire. Considering the background of the participants, most of the respondents came from technical areas related to engineering and urban planning (71%). Other respondents were from a humanities and social sciences background (11%) or another field (18%). All the participants completed the questionnaire relating to the C1–C8 sites; the majority (53%) reported visiting the port every day, the minority (9%), reported irregular visits. In examining the locations C1–C8, respondents stated that a good percentage of the perceived noise was mainly related to traffic noise and natural noise. The perceived affected quality of the soundscape was that the quality was very high. From these data, it is possible to confirm that the quality of a surrounding sound environment can be good, even if it is generally full of sounds and chaotic. Table 3 shows the numerical values of the normalization of the subjective dataset.
2.4. Statistical Analysis and Mathematical Model
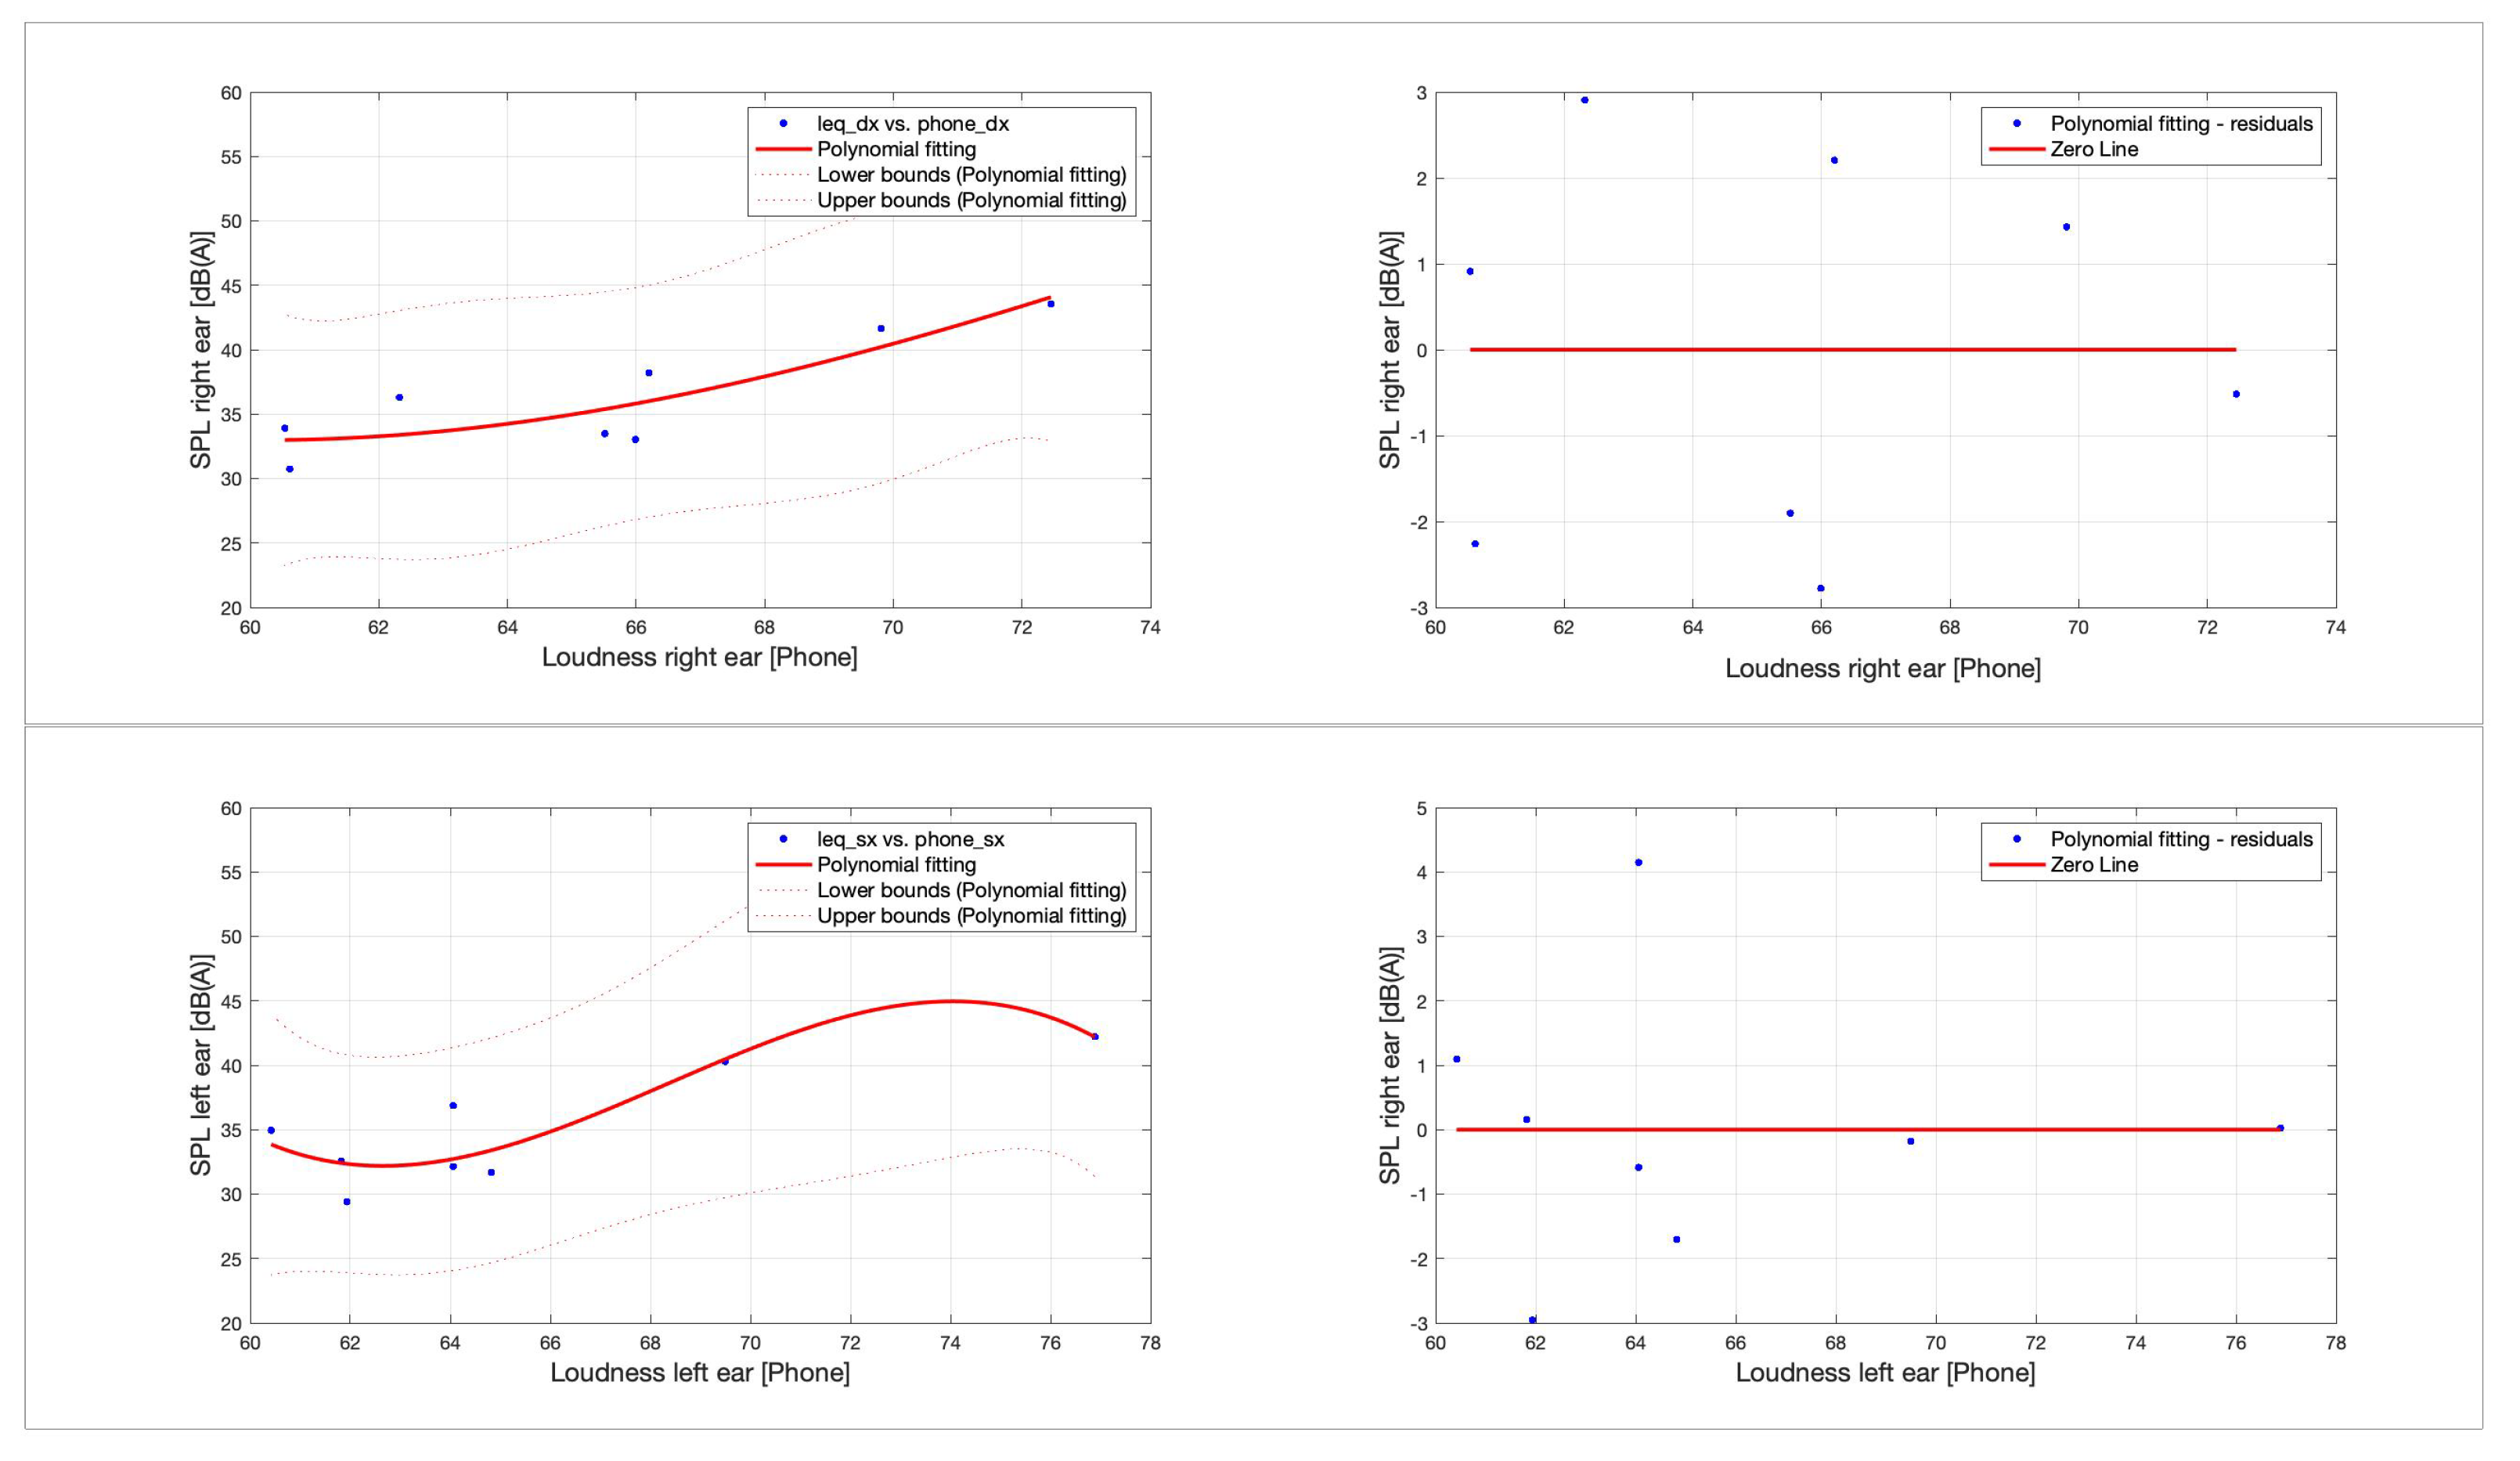
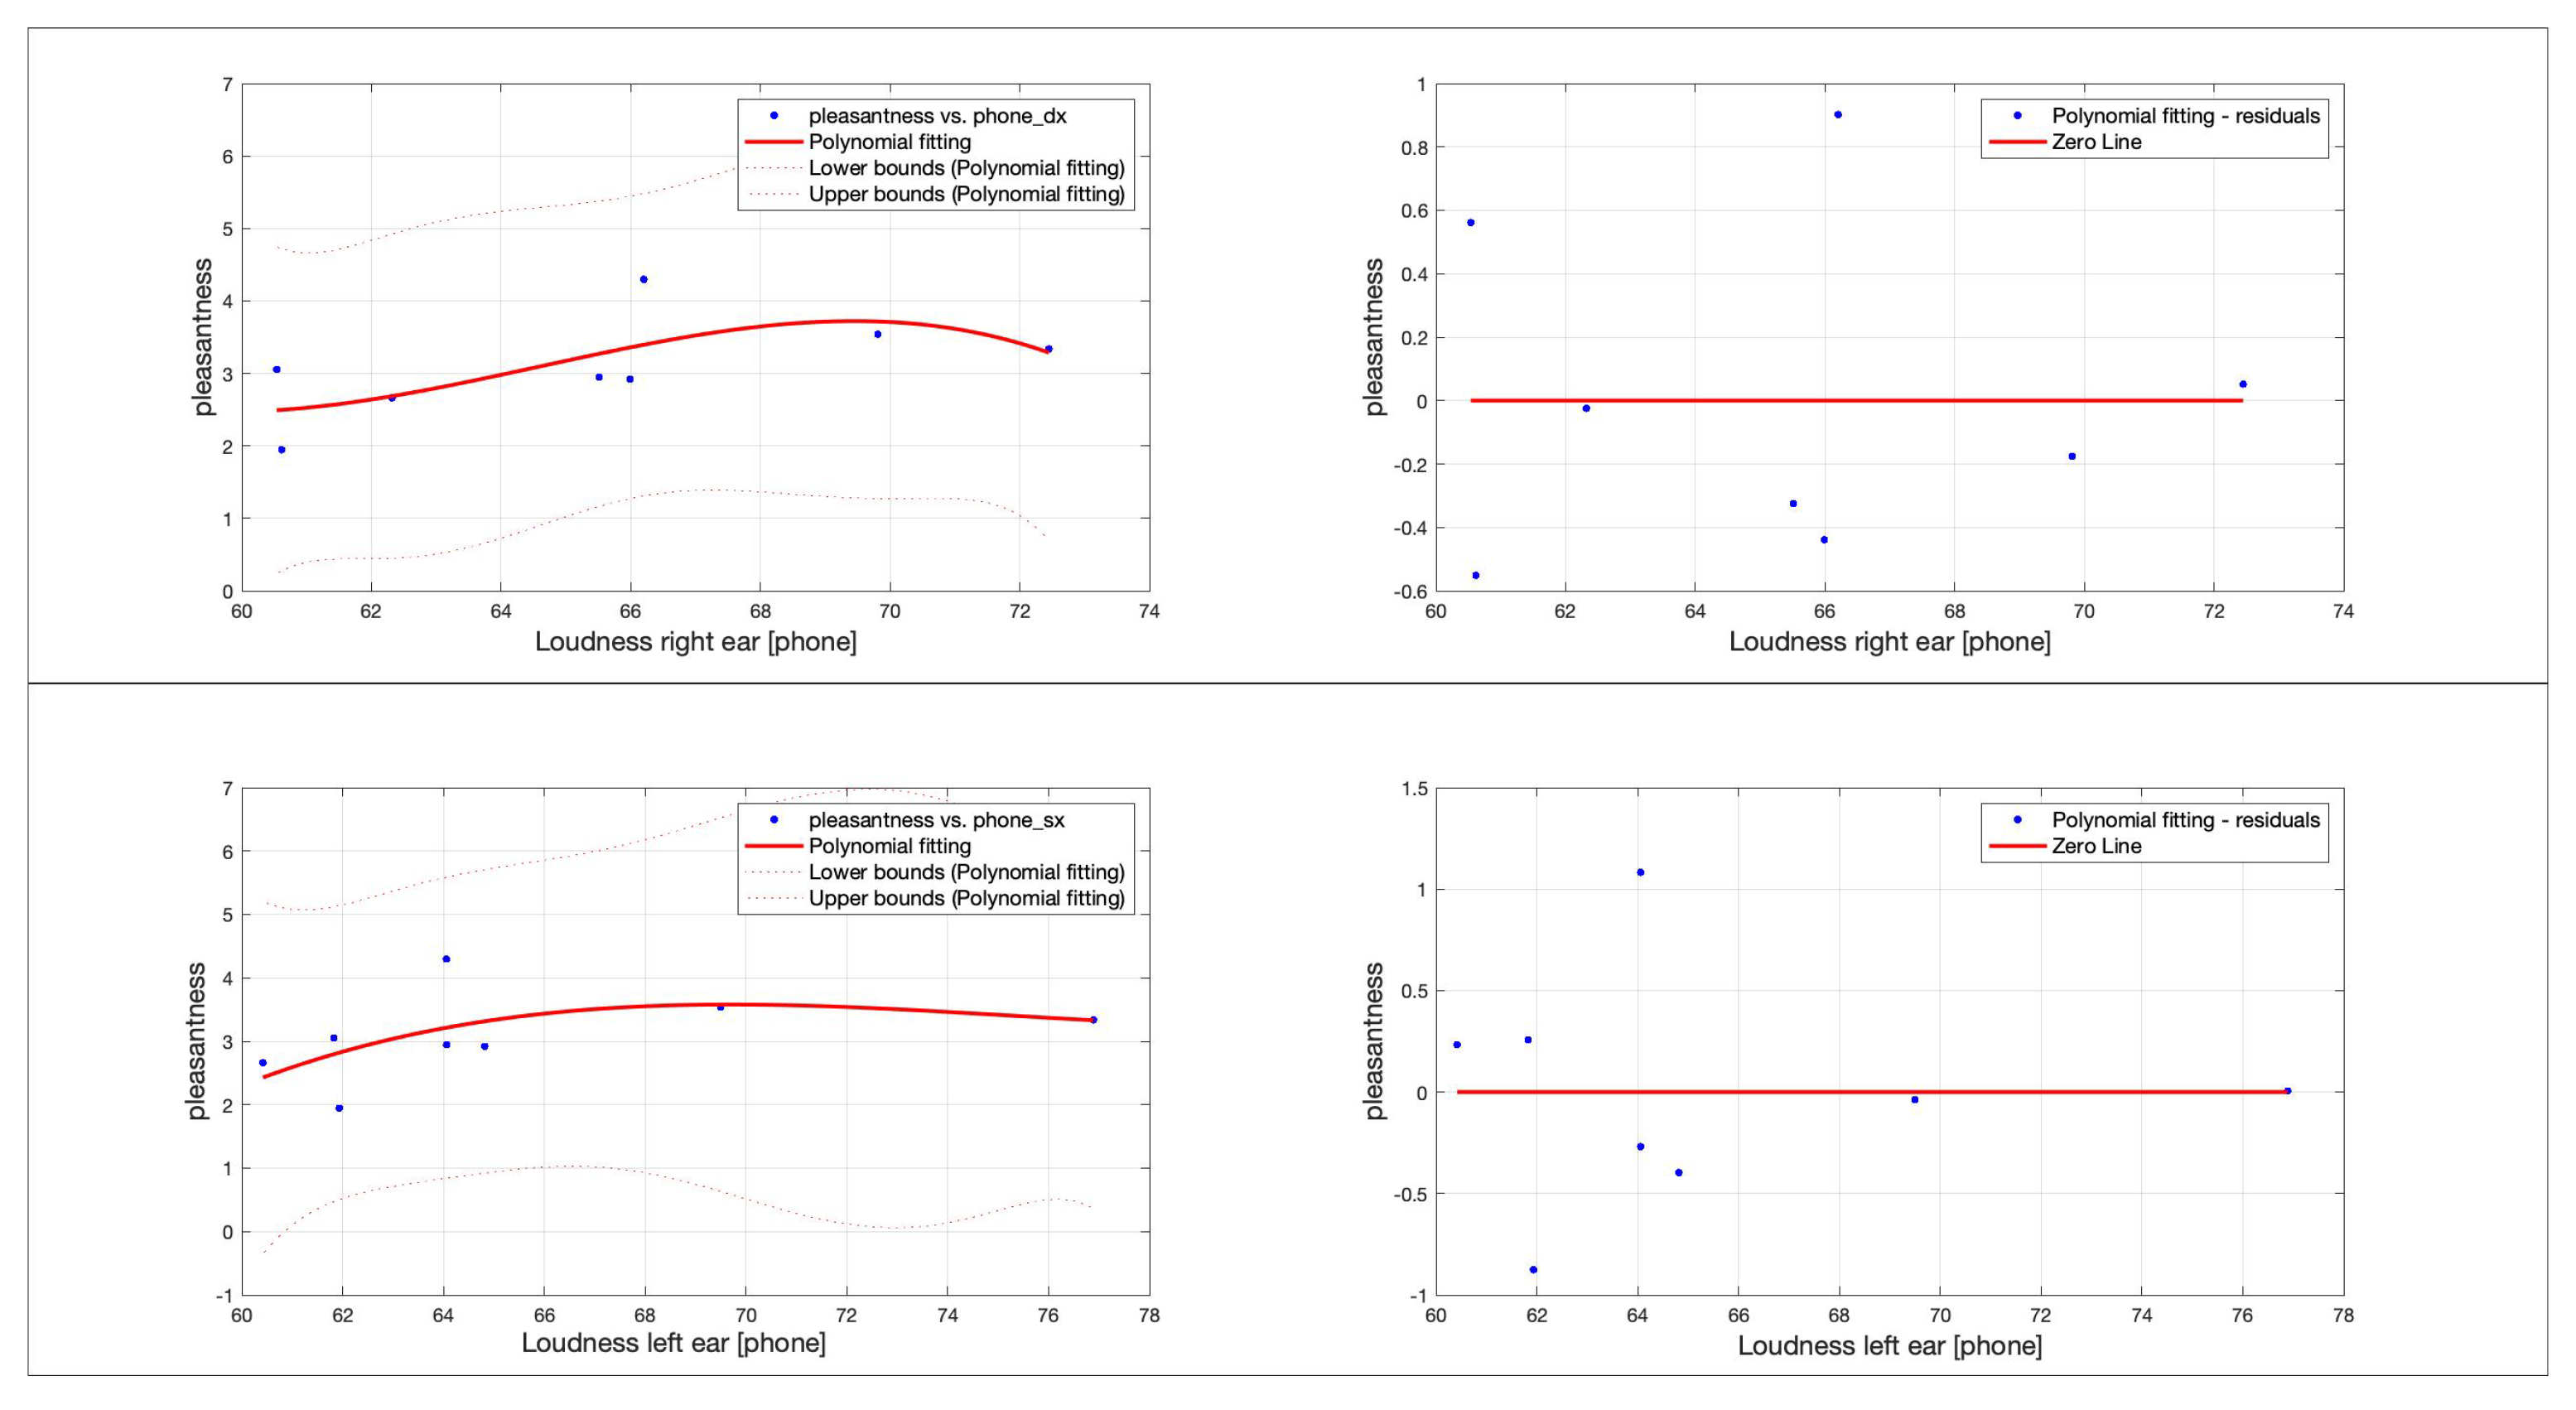
To examine the different characteristics between the sound stimuli, we conducted a cluster analysis; in particular, as clarified in the previous section, an important normalization action was carried out on the subjective dataset to discover patterns and trends. The evaluation of the perception of participants of the port-area layout started from the identification of the correlations between the traditional acoustic parameters and the psychoacoustic ones. First, it was verified that the objective metrics were not unrelated to each other, as shown in Figure 7; later, polynomial regression analysis was used to identify the most appropriate correlation between the objective and subjective measures, as shown in Figure 8.
Table 4 summarizes the results of the regression’s coefficient regarding the rank of the eight subjective scales and objective metrics.
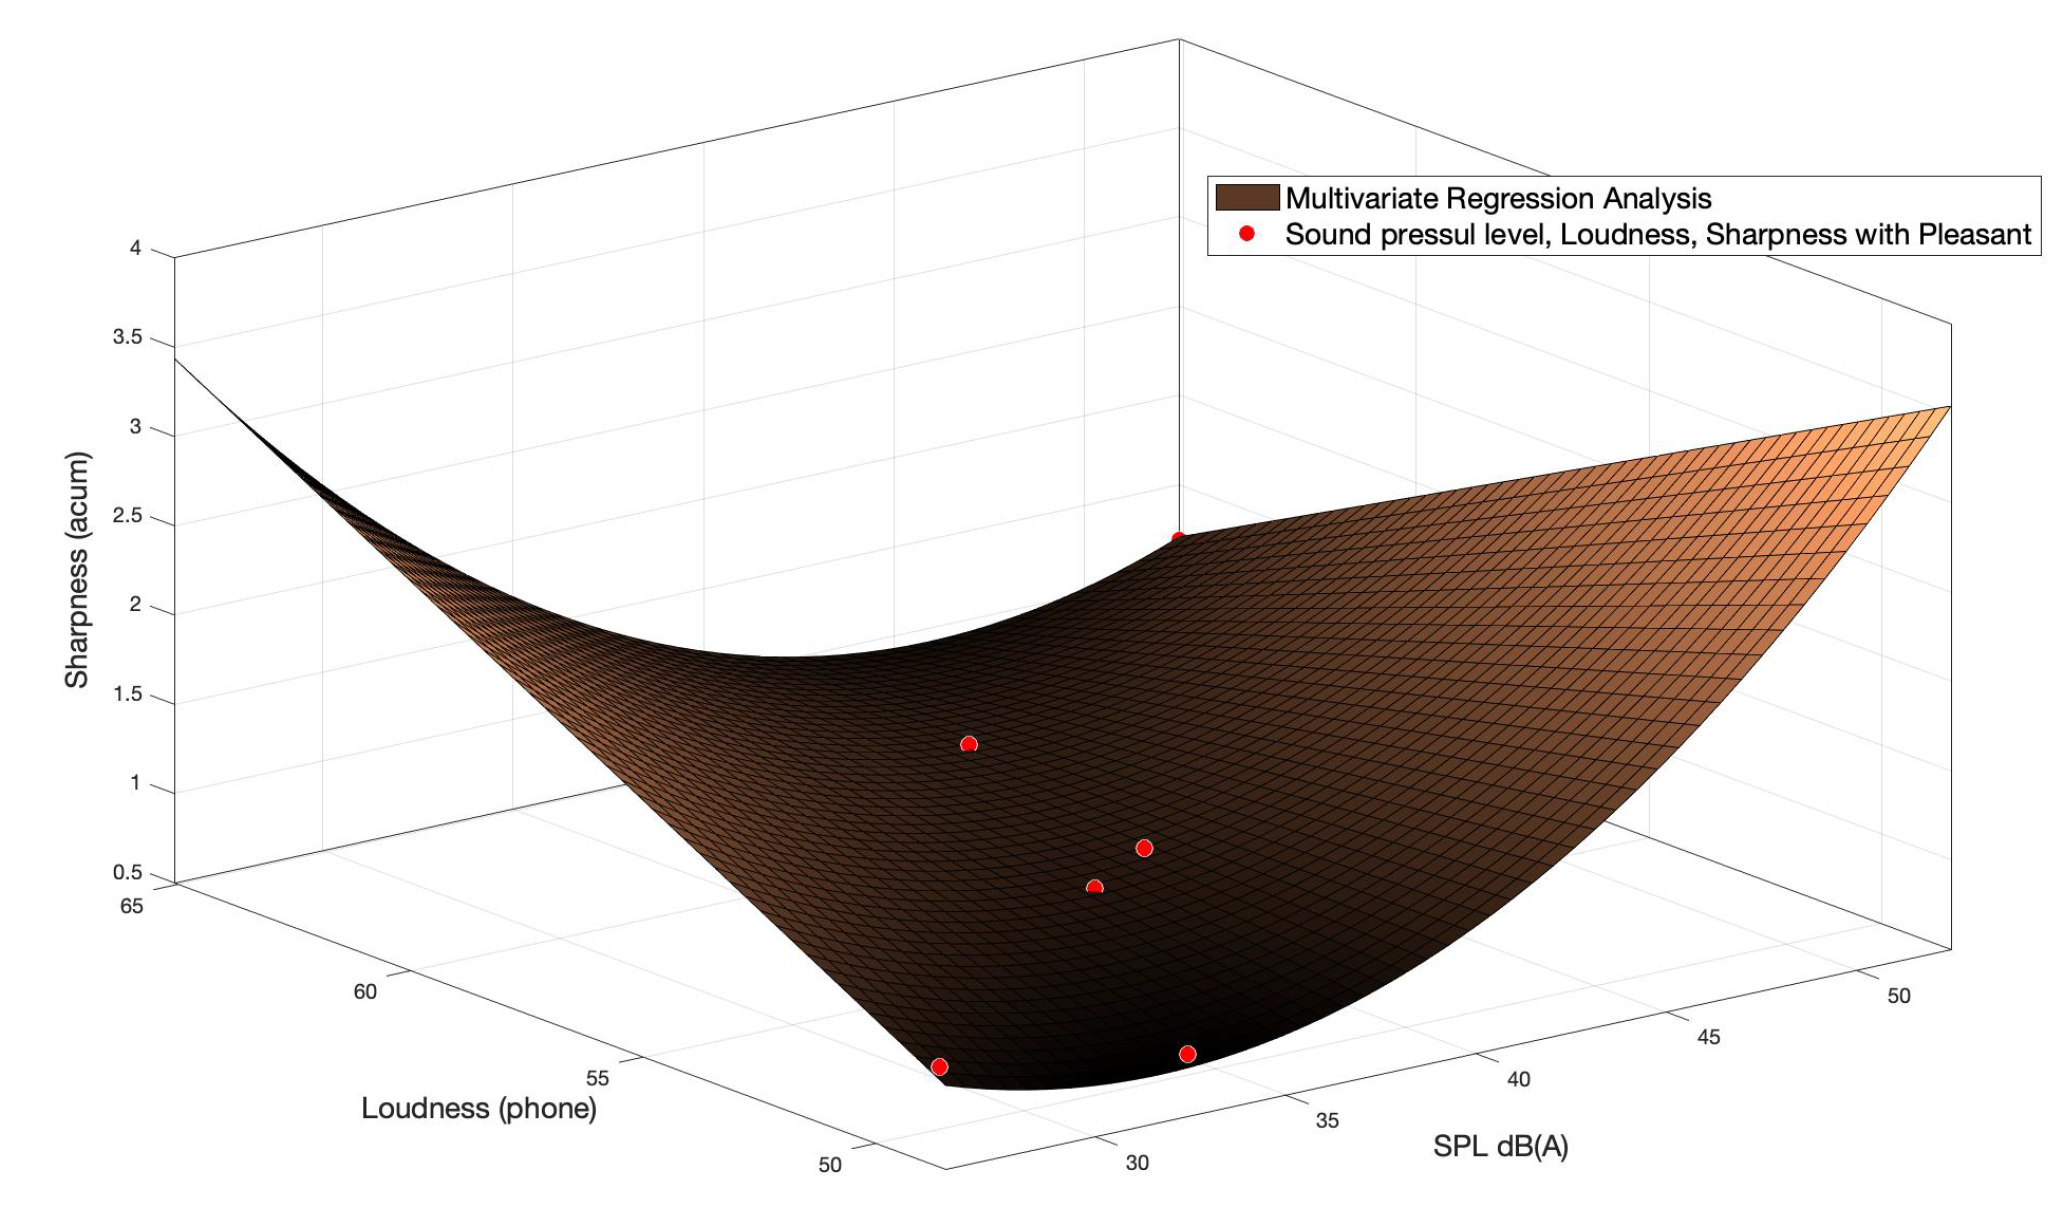
Although various sound quality indices have been proposed, no metrics exist that can be widely applied to all case studies. For this reason, this type of statistical model can be used to attempt to understand the relationship between the human and the landscape; one can assess independent relationships with multivariate regression analysis. Multivariate analysis is traditionally conceptualized as the statistical study of experiments in which multiple measurements are made on each experimental test and for which the relationship between multivariate measurements is possible [53]. In this case study, and in the study of sound quality in general, the relationships between the various characteristics of subjective sensation are critical. Subjective responses to a questionnaire must be related to various psychoacoustic measures. Thus, the regression model consists of correlating two or more variables (objective metrics) to the dependent variable (subjective metrics). All the statistical analyses were performed using the Matlab platform. A p-value minor of 0.01 was considered statistically significant. Thus, to examine the relationship between the pleasant impressions and the physical area properties of the sounds emitted by the port, we designed a custom metric. The choice of predictors was based on the first regression, and the weight was assigned in compliance with the grade of the regression’s coefficient obtained (Figure 9). To obtain relevant diagnostic information on the psychoacoustic measurement of seaport, the regression were calculated considering the average values between right and left ear. This choice was made due to the little difference in the results obtained between the right and left ear of the psychoacoustic measurements made. The sensation rating score was estimated using the following equations obtained by multiple regression analysis:
Table 5 shows the results of the multiple regression analysis.
The assessment of the soundscape is a part of sensory aesthetics research that is concerned with the pleasurableness of the sensation one receives from the environment. Since people evaluate the same environment differently and also react differently, psychoacoustic research has been extensively studied, and several standards have been written for evaluating subjective annoyance [12,13]. In psychoacoustic experiments, noise emissions are frequently assessed, in fact, noise emissions with noises from different sources at the same Leq[dB(A)] were judged according to their overall loudness [54]. With respect to sound quality evaluation, in addition to the psychoacoustic features of sound, in particular, cognitive effects may play a part. Since loudness is by far the most important component of annoyance, and the annoyance factor is the most important variable when we talk about ambient noise, quantifying the annoyance in soundscape design projects became a necessity. We think that the perceived quality of the soundscape is very much an individual subjective experience that probably relates to personal preference and the historical moment. In this way, we use objective and subjective methods in order to have a better understanding of the sound conditions in places where subjects usually conduct their daily activities. First, for the calculation of the psychoacoustic parameters in reference to our research, it is important to refer to a Zwicker-model [10]. The Zwicker noise model is used for sound categorization to determine how an acoustic environment sounds, using manually collected noise samples. More specifically, psychoacoustic annoyance (PA) can quantitatively describe annoyance ratings obtained in psychoacoustic experiments. In order to quantitatively describe the psychoacoustic annoyance from the information obtained in the port area, the method proposed by Fastl and Zwicker [55,56] was used. Parameters such as loudness (L), sharpness (S), roughness (R), and fluctuation strength (FS) were related to obtain the PA value with the following equation:
where N5 is the percentile of loudness in Sone, and describes the effects of the sharpness S:
- If S > 1.75:
- If S < 1.75:
is the modulation component where fluctuation strength and roughness are included:
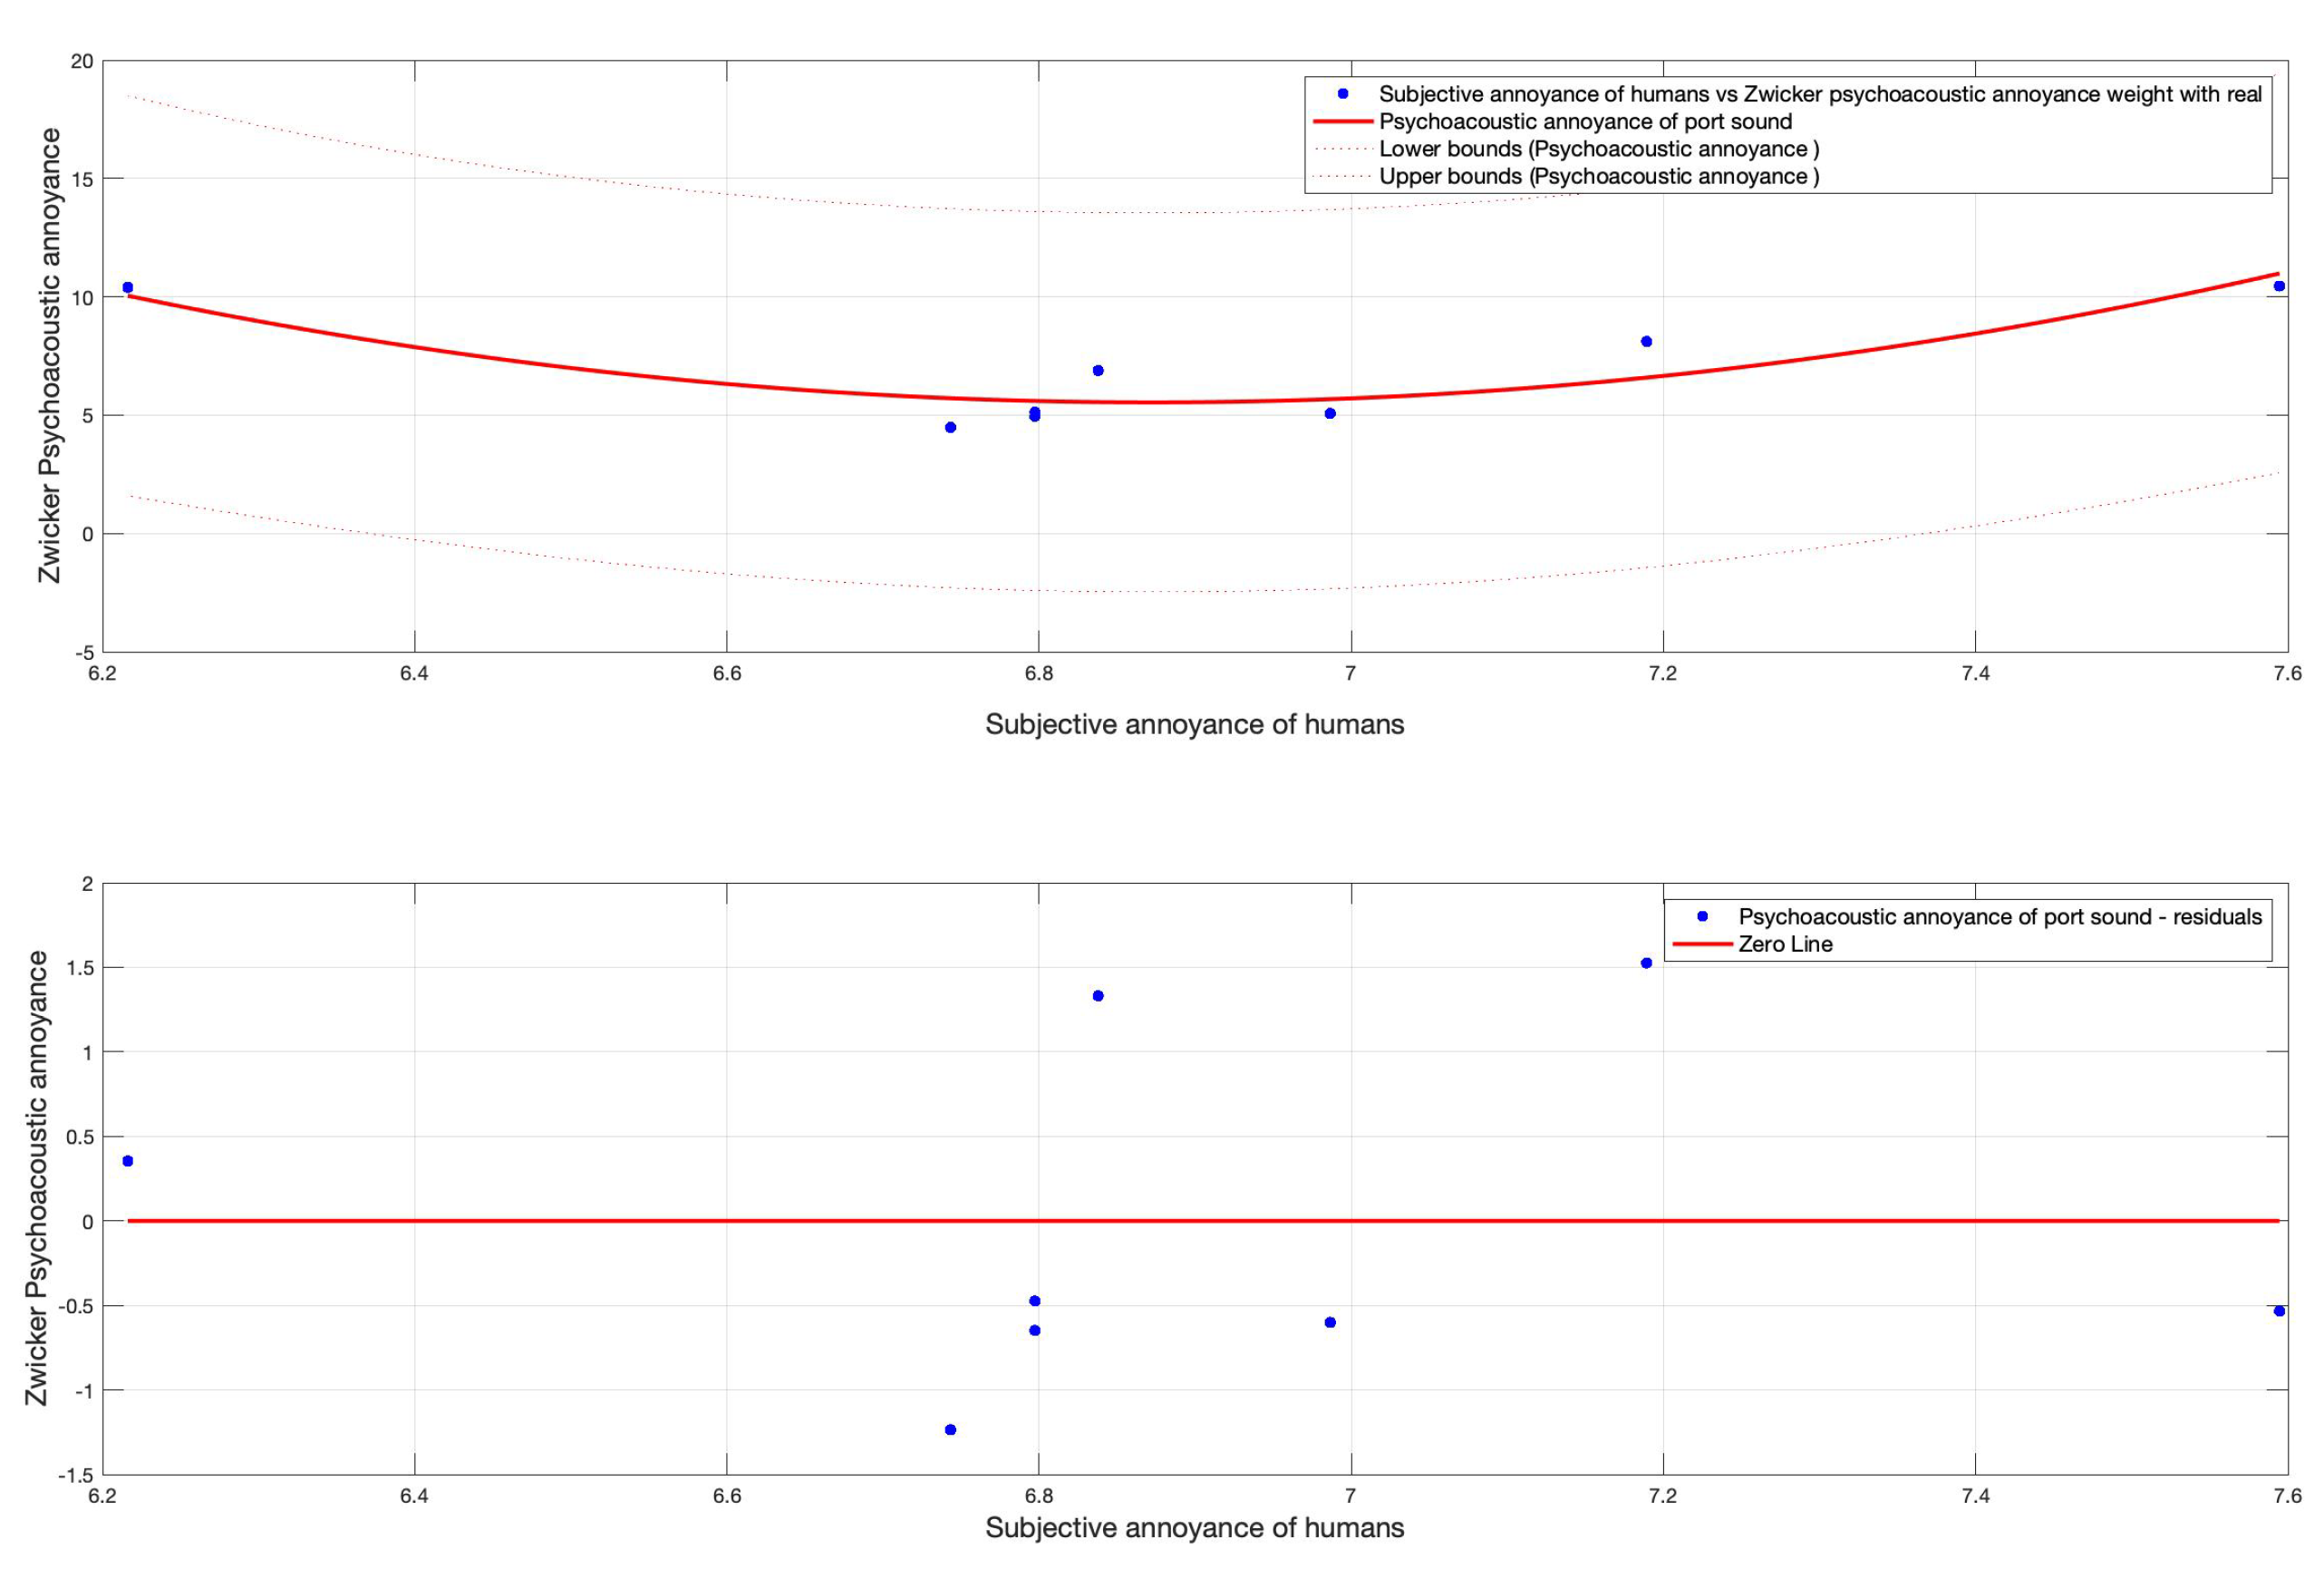
For this study, a Matlab-Code was created, which is capable of calculating the PA once the values of the objective measures have been provided as input. The experimental measurements allowed the determination of acoustic parameters such as sound pressure levels (SPL) and the main objective parameters of psychoacoustics: loudness and relative percentiles, sharpness, roughness, and fluctuation strength. The value of the measures are reported in Table 1 and Table 2. The Matlab routines computed the percentile of loudness, N5, an average fluctuation strength, and ignoring the sharpness, because it was less than 1.75, so it is not a contributing factor. Then, we calculated the , as shown in (9). To analyze the relationship between the overall physical comfort evaluation of an urban open space and the subjective evaluation of various physical indices, as well as the sound level, regression analysis was employed [57,58]. The regression model consists of correlating two or more variables (objective metrics) to the dependent variable (subjective metrics). In this case, the subjective metrics were represented by the results of subjective listening test. The model used for the case study is described in Equations (1)–(5) in our previous work [cite]. From this model, a custom metric was then developed specifically for this case study of a sound quality index (SQI) calculated for each cluster. With the same procedure as determined in the previous equation, a correlation model was proposed to identify the psychoacoustic annoyance related to port noise annoyance. The regression model is explained by the following Equation (10) and shown in Figure 10:
where is the response variable, represents the partial regression coefficients, is obtained by the listening test, and is calculated by Equation (6).
The PA model acts as a support to the sq-index model for subsequent investigations. It is, therefore, an index of sound quality that quantifies the ideal sound through the correlation between objective and subjective metrics and will also provide information on the real annoyance felt by the listener. Table 6 shows the results of the polynomial regression analysis of both perceptive annoyance and the sound quality index.
This analysis revealed that a large range of subjective impression values with a high factor load was significantly and positively associated with SPL, sharpness, loudness, and roughness. Furthermore, the results suggested that a reduction in both the SPL and the high-frequency components related to sharpness can improve the sound quality of landscape sounds. In order to understand the final reaction of the listeners, we calculated a subjective sound quality index for each cluster, using the custom equations described above. A significant number of listeners expressed a more negative opinion on the noise disturbance compared to that of the pleasantness of the sound. Despite the perception that the general acoustics were positive, the opinion on the pleasantness of the sound of the place was moderate, if not negative.
3. Discussion
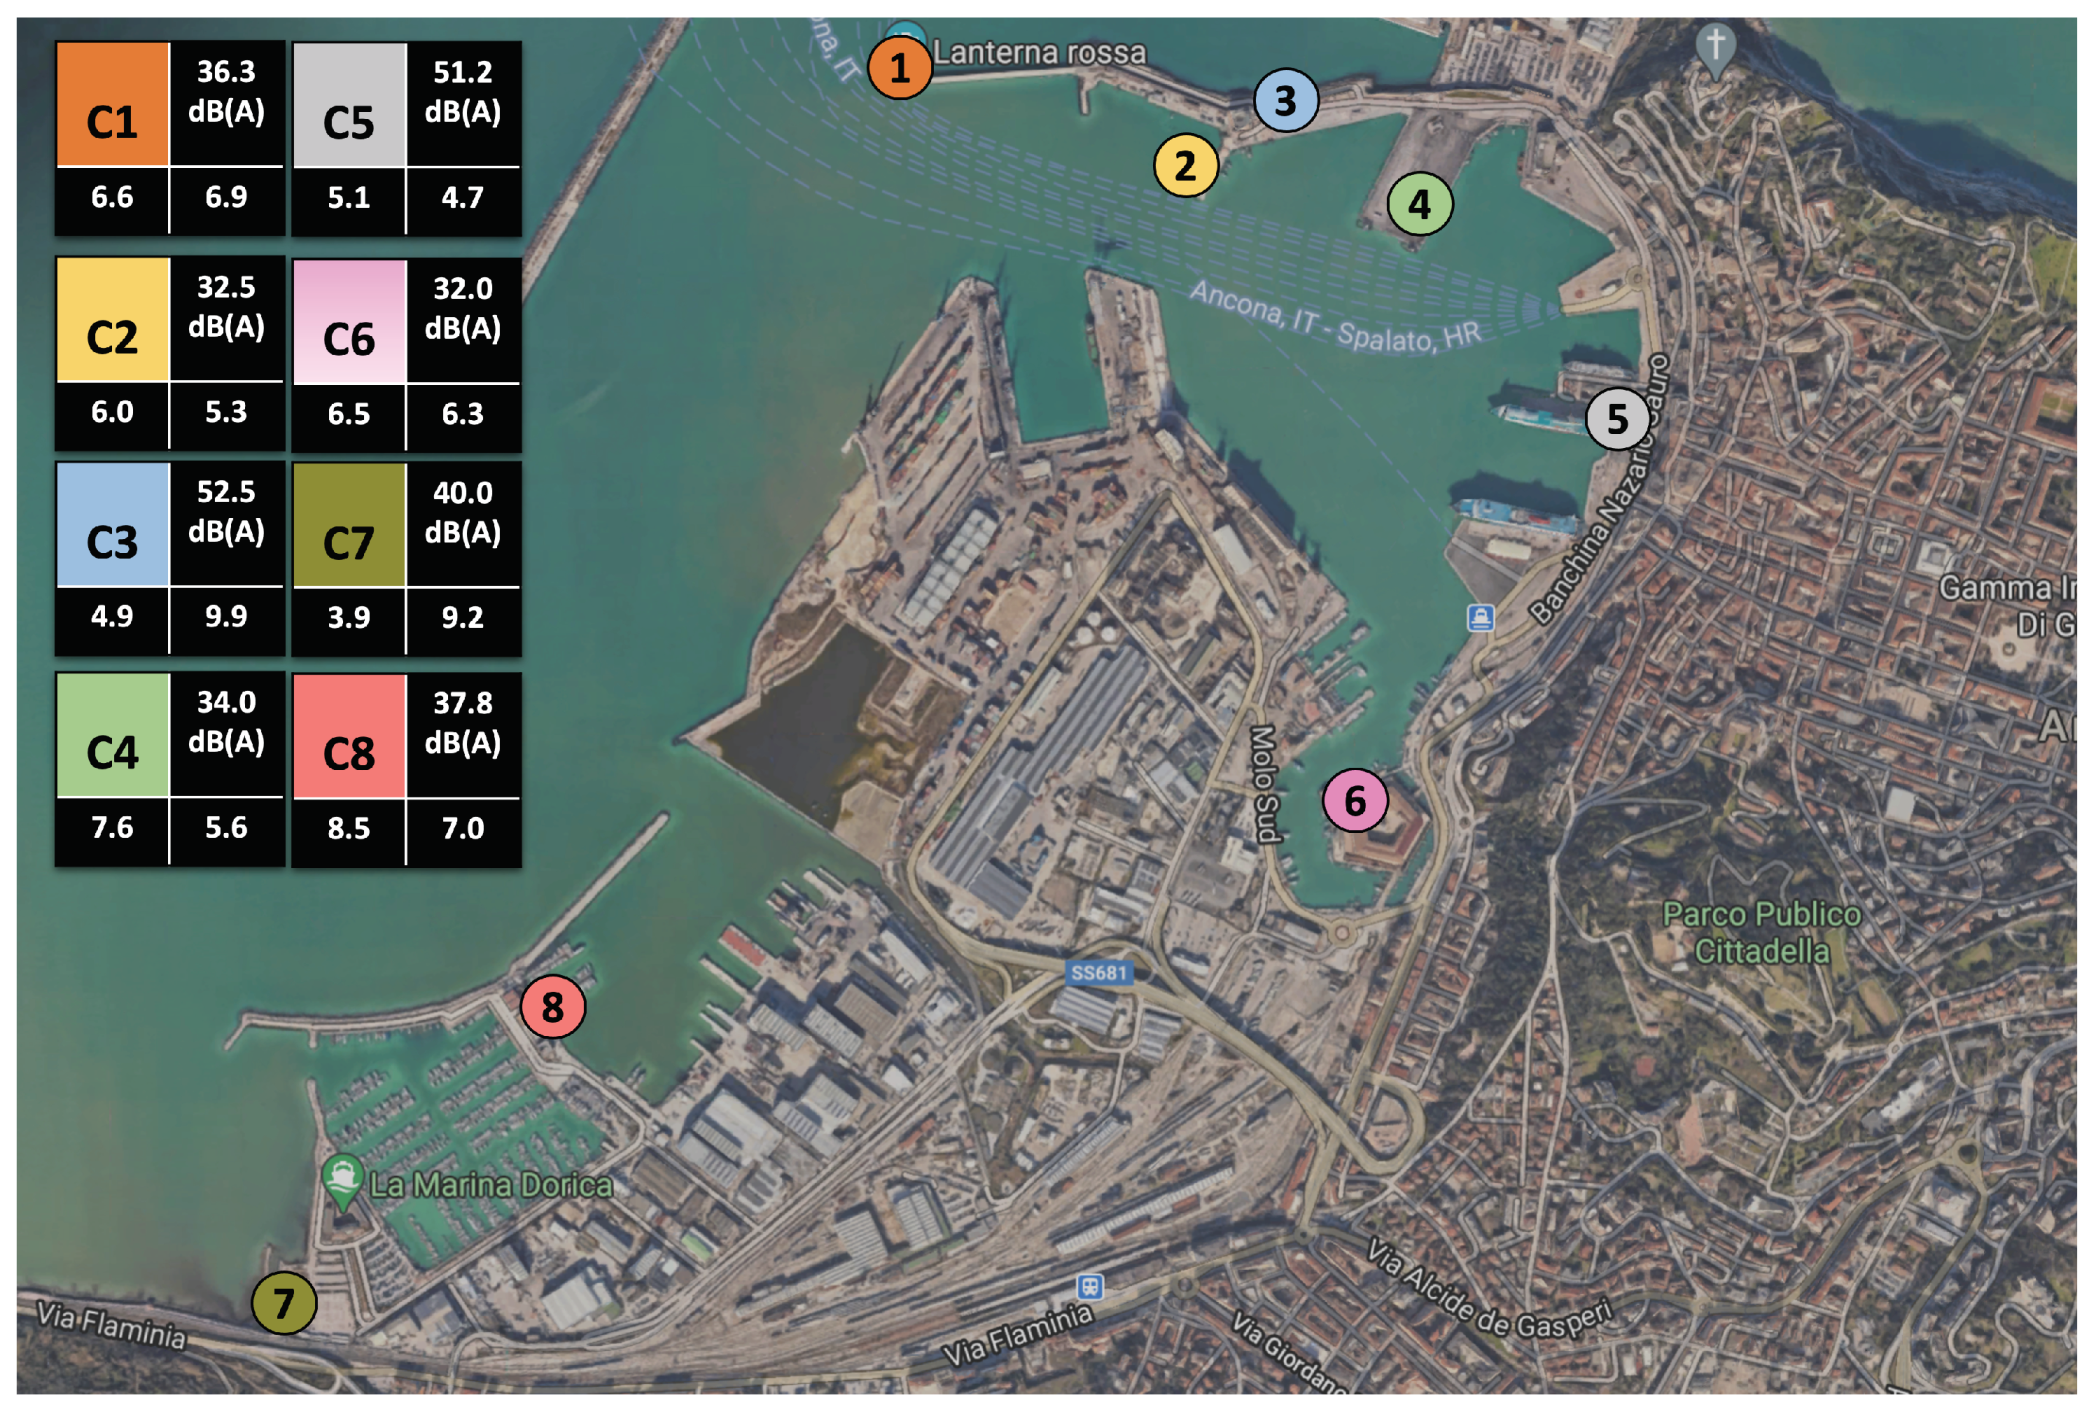
First of all, the quality of the soundscape is closely related to the perceived pleasantness and goodness of the sound environment, and these are two descriptors that highlight the importance of this study to increase the quality of urban outdoor spaces, in particular, for recreational and quiet areas, similar to some spaces in our port. Through the soundscape approach, it is possible to manipulate the human perception of sound environment, without reducing the noise emissions [6,59]. In this case, the focus of the designer must be on the sound sources and the architectural context. The analysis of the collected data highlights that the perceived soundscape quality is different from the real noise emissions of the port landscape. There are many boundary conditions that influenced the clusters, for example, the noise from boat passage, the noise from an industrial site, and the noise from traffic and construction. All this non-continuous noise increases the level of discomfort and decreases the level of pleasantness. The results of the current study suggest that the sound preference differences are at four levels. The first can be defined as a simple preference. People shared a common opinion in preferring nature sounds to artificial sounds. The second level of sound preference can be defined as a macropreference, because the subjects focus attention on one source and describe it, ignoring the other sounds. At the third level, the subject begins to reference their emotions and judges based on cultural background and long term environmental experience. At the fourth level is the difference between the age of subjects and other more significant factors. For greater clarity in support of the initial thesis, Figure 11 shows the clusterization of the port indicating the position of each cluster. For each cluster, we indicate the Leq[A], the degree of satisfaction with the site (indicated as sound quality index), and the degree of psychoacoustic annoyance perceived by the listeners.
As seen in this figure, the measured noise, in some cases, was not what the listeners perceived, in particular, in C3 and C7, where there is a large gap between the annoyance and pleasantness. As the results of this study show, C3 is a place where people can spend time without discomfort in communicating with each other and above all enjoying the sound of the landscape. The same condition could apply to C7. This study focused on the effects of landscape factors on soundscape perception. The custom equation resulting from the multivariate regression represents the mathematical instrument for the calculation of the sound quality index. The quality index was then related to the psychoacoustic annoyance index. This index was created ad hoc for the port of Ancona thanks to the subjective questionnaires. This allowed us to understand the real sound perceptions of the citizens who frequent the port. From the results obtained following this procedure, it was noted that some clusters were not valued, where people prefer not to stop. The noise of a place represents one of the most significant variables in deciding where to place a new settlement. The purpose of this study, in fact, is precisely to demonstrate that the parameters of psychoacoustics have an important weight from the point of view of environmental noise. In this regard, one should begin to evaluate the idea of integrating these parameters when operating acoustic pollution evaluations.
4. Conclusions
The objective characteristics of the soundscape can be analyzed by exploiting the combination of traditional metrics (LAeq, Lmax, and Lmin) with those of psychoacoustics (L, S, R, and FS). Furthermore, the percentiles of sound levels (L5, L10, L50, and L90) are commonly used as sound landscape psychoacoustic indicators to address the issue of human hearing sensitivity. It is an approach in which ambient noise is not reduced to an average quantity that evokes only the estimation of unpleasant sensations, but which includes noise as a precious resource, which can be used intentionally. Despite recent advances in the standardization process, there are, perhaps, many misinterpretations of its practical use, where the terms ambient noise and soundscape are heavily confused. They are not synonymous; for example, a low noise level does not necessarily imply a good sound quality. Soundscapes have been evaluated using different methods such as surveys, a sound walk, interviews, and laboratory experiments depending on the purpose of the study. The most common method is a survey using a questionnaire. Few literature studies provide comprehensive guidelines for this type of analysis. This work provides a methodology to determine the real connection between the sensation of the human being and the surrounding landscape. The choice of the port area environment is consistent with the variety of a city landscape, namely, industrial areas, nightlife areas, relaxation areas, etc. We defined a listening test suitable for the case study, and the statistical survey allowed us to discriminate the data obtained from the listening tests, in order to obtain an accurate result. Finally, we designed a custom metric to determine the sound quality of the selected clusters of the port area. Overall, the study revealed the close relationship between landscape and soundscape experience in real contexts, and that sound and functional aspects should be considered in terms of creating a better soundscape during environmental design and management processes. So, the sound level controls, noise mapping, and noise abatement represent an important tool that can be used by the planner to fight noise pollution or a bad soundscape and obtain a better environment. The method described enables collecting information on the urban environment, from both an acoustic and emotional point of view. This information could be particularly suitable in the planning phase of new attractions for the city. The method proposed could represent an enrichment of the municipality urban planning tools, all the while remaining consistent with the idea of increasing environmental sustainability and reducing energy poverty, both issues of great importance in the 21st century.
Author Contributions
Conceptualization, S.D.L.; methodology, S.D.L.; software, S.D.L.; validation, S.D.L., F.S. and V.L.; formal analysis, S.D.L., F.S. and V.L.; investigation, S.D.L., F.S. and V.L.; resources, S.D.L., F.S. and V.L.; data curation, S.D.L., F.S. and V.L.; writing—original draft preparation, S.D.L., F.S. and V.L.; writing—review and editing, S.D.L., F.S. and V.L.; visualization, S.D.L., F.S. and V.L.; supervision, S.D.L., F.S. and V.L. All authors have read and agreed to the published version of the manuscript.
Funding
This research received no external funding.
Institutional Review Board Statement
Not applicable.
Informed Consent Statement
Not applicable.
Data Availability Statement
This study did not report any data.
Acknowledgments
The authors thank the Port Authority of Ancona for granting permission to carry out measurements and experiments in the seaport.
Conflicts of Interest
The authors declare no conflict of interest.
Abbreviations
The following abbreviations are used in this manuscript:
| C1 | Cluster one |
| C2 | Cluster two |
| C3 | Cluster three |
| C4 | Cluster four |
| C5 | Cluster five |
| C6 | Cluster six |
| C7 | Cluster seven |
| C8 | Cluster eight |
| SPL | Sound pressure level |
| Leq dx | Sound pressure level measured by right ear |
| Leq sx | Sound pressure level measured by left ear |
| phone dx | Loudness level measured by right ear |
| phone sx | Loudness level measured by left ear |
| sharp dx | Sharpness level measured by right ear |
| sharp sx | Sharpness level measured by left ear |
| fs dx | Fluctuation strength level measured by right ear |
| fs sx | Fluctuation strength level measured by left ear |
| r dx | Roughness level measured by right ear |
| r sx | Roughness level measured by left ear |
| SQI | Sound quality index |
| PA | Psychoacoustic annoyance index |
| PA | Psychoacoustic annoyance index of Ancona’s seaport |
Appendix A
Figure A1.
Complete questionnaire.


References
- Murray Schafer, R. The New Soundscape; BMI Canada Limited: Don Mills, Toronto, ON, Canada, 1969. [Google Scholar]
- Jonah, B.A.; Bradley, J.S.; Dawson, N.E. Predicting individual subjective responses to traffic noise. J. Appl. Psychol. 1981, 66, 490–501. [Google Scholar] [CrossRef]
- Genuit, K. Background and Practical Examples of Sound Design. Acust.-Acta Acust. 1997, 83, 805–812. [Google Scholar]
- Zhang, M.; Kang, J. Towards the Evaluation, Description, and Creation of Soundscapes in Urban Open Spaces. Environ. Plan. Plan. Des. 2007, 34, 68–86. [Google Scholar] [CrossRef]
- Adams, M.D.; Bruce, N.S.; Davies, W.J.; Cain, R.; Jennings, P.; Carlyle, A.; Cusack, P.; Hume, K.; Plack, C. Soundwalking as a Methodology for Understanding Soundscapes; Acoustics Research Centre, University of Salford: Salford, UK, 2008; Volume 30, pp. 131–135. [Google Scholar]
- Jo, H.I.; Jeon, J.Y. Effect of the appropriateness of sound environment on urban soundscape assessment. Build. Environ. 2020, 179, 106975. [Google Scholar] [CrossRef]
- Kang, J.; Aletta, F.; Oberman, T.; Erfanian, M.; Kachlicka, M.; Lionello, M.; Mitchell, A. Towards soundscape indices. In Proceedings of the 23rd International Congress on Acoustics: Integrating 4th EAA Euroregio 2019, Aachen, Germany, 9–13 September 2019. [Google Scholar]
- Davies, W.J.; Adams, M.D.; Bruce, N.S.; Cain, R.; Carlyle, A.; Cusack, P.; Hall, D.A.; Hume, K.I.; Irwin, A.; Jennings, P.; et al. Perception of soundscapes: An interdisciplinary approach. Appl. Acoust. 2013, 74, 224–231. [Google Scholar] [CrossRef] [Green Version]
- Jennings, P.; Cain, R. A framework for improving urban soundscapes. Appl. Acoust. 2013, 74, 293–299. [Google Scholar] [CrossRef] [Green Version]
- Zwicker, E.; Fastl, H. Psychoacoustics: Facts and Models, 2nd ed.; Springer: Berlin/Heidelberg, Germany, 2006; pp. 715–724. [Google Scholar]
- Standard ISO 1996-1:2016; Acoustics—Description, Measurement and Assessment of Environmental Noise—Part 1: Basic Quantities and Assessment Procedures. International Organization for Standardization: Geneva, Switzerland, 2016.
- Standard ISO 532-1:2017; Acoustics—Methods for Calculating Loudness—Part 1: Zwicker Method. International Organization for Standardization: Geneva, Switzerland, 2017.
- Standard ISO 532-2:2017; Acoustics—Methods for Calculating Loudness—Part 2: Moore-Glasberg Method. International Organization for Standardization: Geneva, Switzerland, 2017.
- Standard ISO 12913-1:2014; Acoustics—Soundscape—Part 1: Definition and Conceptual Framework. International Organization for Standardization: Geneva, Switzerland, 2014.
- Kountouras, M.; Curcuruto, S.; Mazzocchi, E.; Sacchetti, F.; Vaccaro, L. Applicazione di Una Metodologia Soundscape Per l’ Integrazione Della Valutazione d’ Impatto Acustico; Associazione Italiana di Acustica: Ferrara, Italy, 2016. [Google Scholar]
- Gustavino, C. The Ideal Urban Soundscape: Investigating the Sound Quality of French Cities. Acta Acust. United Acust. 2006, 92, 945–951. [Google Scholar]
- Guo, J. The Assessment of Soundscape Quality in Urban Parks—A Case The Assessment of Soundscape Quality in Urban Parks—A Case Study in Penn Park. Master’s Thesis, University of Pennsylvania, Philadelphia, PA, USA, 2019. [Google Scholar]
- Brambilla, G. The potential of the soundscape approach for the protection and valorization of the rural landscape. Rivista Italiana di Acustica 2015, 39, 1–12. [Google Scholar]
- Aletta, F.; Guattari, C.; Evangelisti, L.; Asdrubali, F.; Oberman, T.; Kang, J. Exploring the compatibility of “Method A” and “Method B” data collection protocols reported in the ISO/TS 12913-2:2018 for urban soundscape via a soundwalk. Appl. Acoust. 2019, 155, 190–203. [Google Scholar] [CrossRef]
- Standard ISO/TS 12913-2:2018; Acoustics—Soundscape—Part 2: Data Collection and Reporting Requirements. International Organization for Standardization: Geneva, Switzerland, 2018.
- Mancini, S.; Mascolo, A.; Graziuso, G.; Guarnaccia, C. Soundwalk, Questionnaires and Noise Measurements in a University Campus: A Soundscape Study. Sustainability 2021, 13, 841. [Google Scholar] [CrossRef]
- Liu, J.; Kang, J.; Behm, H.; Luo, T. Effects of landscape on soundscape perception: Soundwalks in city parks. Landsc. Urban Plan. 2014, 123, 30–40. [Google Scholar] [CrossRef] [Green Version]
- Chitra, B.; Jain, M.; Chundelli, F.A. Understanding the soundscape environment of an urban park through landscape elements. Environ. Technol. Innov. 2020, 19, 100998. [Google Scholar] [CrossRef]
- Pheasant, R.; Horoshenkov, K.; Watts, G.; Barrett, B. The acoustic and visual factors influencing the construction of tranquil space in urban and rural environments tranquil spaces-quiet places? J. Acoust. Soc. Am. 2008, 123, 1446–1457. [Google Scholar] [CrossRef]
- Liu, J.; Kang, J.; Luo, T.; Behm, H. Landscape effects on soundscape experience in city parks. Sci. Total. Environ. 2013, 454–455, 474–481. [Google Scholar] [CrossRef]
- Yang, W.; Kang, J. Acoustic comfort evaluation in urban open public spaces. Appl. Acoust. 2005, 66, 211–229. [Google Scholar] [CrossRef]
- Van Renterghem, T.; Vanhecke, K.; Filipan, K.; Sun, K.; De Pessemier, T.; De Coensel, B.; Joseph, W.; Botteldooren, D. Interactive soundscape augmentation by natural sounds in a noise polluted urban park. Landsc. Urban Plan. 2020, 194, 103705. [Google Scholar] [CrossRef]
- Smith, J.W.; Pijanowski, B.C. Human and policy dimensions of soundscape ecology. Glob. Environ. Chang. 2014, 28, 63–74. [Google Scholar] [CrossRef]
- Carles, J.L.; Barrio, I.L.; de Lucio, J.V. Sound influence on landscape values. Landsc. Urban Plan. 1999, 43, 191–200. [Google Scholar] [CrossRef]
- Standard DIRECTIVE 2002/49/EC; Directive 2002/49/ec of the European Parliament and of the Council of 25 June 2002 Relating to the Assessment and Management of Environmental Noise. European Communities: Brussels, Belgium, 2002.
- Smith, S.J. Performing the (Sound)World. Environ. Plan. Soc. Space 2000, 18, 615–637. [Google Scholar] [CrossRef]
- Raimbault, M.; Dubois, D. Urban soundscapes: Experiences and knowledge. Cities 2005, 22, 339–350. [Google Scholar] [CrossRef]
- Cain, R.; Jennings, P.; Poxon, J. The development and application of the emotional dimensions of a soundscape. Appl. Acoust. 2013, 74, 232–239. [Google Scholar] [CrossRef] [Green Version]
- Payne, S.R. The production of a Perceived Restorativeness Soundscape Scale. Appl. Acoust. 2013, 74, 255–263. [Google Scholar] [CrossRef]
- Hall, D.A.; Irwin, A.; Edmondson-Jones, M.; Phillips, S.; Poxon, J.E. An exploratory evaluation of perceptual, psychoacoustic and acoustical properties of urban soundscapes. Appl. Acoust. 2013, 74, 248–254. [Google Scholar] [CrossRef]
- Axelsson, Ö.; Brown, L. Designing Soundscape for Sustainable Urban Development; City of Stockholm: Stockholm, Sweden, 2010. [Google Scholar]
- Truax, B. TBarry Blesser and Linda-Ruth Salter, Spaces Speak, Are You Listening? Experiencing Aural Architecture. Organised Sound 2007, 12, 185–186. [Google Scholar] [CrossRef]
- Legge Quadro Sull’Inquinamento Acustico. Recommendation Legge 26 Ottobre 1995, n. 447, 1995. Available online: https://www.bosettiegatti.eu/info/norme/statali/1995_0447.htm (accessed on 1 May 2022).
- Spagnolo, R. Manuale di Acustica Applicata; Collana Tesi e ricerca: Ingegneria; UTET Università: Messina, Italy, 2014. [Google Scholar]
- Zwicker, E. Procedure for calculating loudness of temporally variable sounds. J. Acoust. Soc. Am. 1977, 62, 676–682. [Google Scholar] [CrossRef]
- Standard ISO 226:2003; Acoustics—Normal Equal Loudness Level Contours. International Organization for Standardization: Geneva, Switzerland, 2003.
- Gierlich, H. The application of binaural technology. Appl. Acoust. 1992, 36, 219–243. [Google Scholar] [CrossRef]
- MÞller, H. Fundamentals of binaural technology. Appl. Acoust. 1992, 36, 171–218. [Google Scholar] [CrossRef] [Green Version]
- Gauthier, P.A.; Scullion, W.; Berry, A. Sound quality prediction based on systematic metric selection and shrinkage: Comparison of stepwise, lasso, and elastic-net algorithms and clustering preprocessing. J. Sound Vib. 2017, 400, 134–153. [Google Scholar] [CrossRef]
- Shin, S.H.; Ih, J.G.; Hashimoto, T.; Hatano, S. Sound quality evaluation of the booming sensation for passenger cars. Appl. Acoust. 2009, 70, 309–320. [Google Scholar] [CrossRef]
- Recommendation ITU-R BT.2020 (10/2015); Parameter Values for Ultra-High Definition Television Systems for Production and International Programme Exchange. International Telecommunication Union: Geneva, Switzerland; North American Broadcasters Association (NABA): Toronto, OT, Canada, 2020.
- Liu, J.; Kang, J. Soundscape design in city parks: Exploring the relationships between soundscape composition parameters and physical and psychoacoustic parameters. J. Environ. Eng. Landsc. Manag. 2015, 23, 102–112. [Google Scholar] [CrossRef] [Green Version]
- Jeon, J.Y.; Hong, J.Y.; Lee, P.J. Soundwalk approach to identify urban soundscapes individually. J. Acoust. Soc. Am. 2013, 134, 803–813. [Google Scholar] [CrossRef] [PubMed]
- Marry, S.; Defrance, J. Analysis of the perception and representation of sonic public spaces through on site survey, acoustic indicators and in-depth interviews. Appl. Acoust. 2013, 74, 282–292. [Google Scholar] [CrossRef]
- Recommendation ITU BS.1116-3 (02/2015); Methods for the Subjective Assessment of Small Impairments in Audio Systems. International Telecommunication Union: Geneva, Switzerland; North American Broadcasters Association (NABA): Toronto, OT, Canada, 2015.
- Recommendation ITU BS.1534-3 (10/2015); Methods for the Subjective Assessment of Small Impairments in Audio Systems. International Telecommunication Union: Geneva, Switzerland; North American Broadcasters Association (NABA): Toronto, OT, Canada, 2015.
- Aletta, F. Soundscape assessment: Towards a validated translation of perceptual attributes in different languages. INTER-NOISE NOISE-CON Congr. Conf. Proc. 2020, 14, 3137–3146. [Google Scholar]
- Di Loreto, S.; Serpilli, F.; Lori, V.; Squartini, S. Sound quality evaluation of kitchen hoods. Appl. Acoust. 2020, 168, 107415. [Google Scholar] [CrossRef]
- Bowman, N. The articulation index and its application to room acoustics design. J. Sound Vib. 1974, 32, 109-IN3. [Google Scholar] [CrossRef]
- Widmann, U. A psychoacoustic annoyance concept for application in sound quality. J. Acoust. Soc. Am. 1997, 101, 3078. [Google Scholar] [CrossRef]
- Lopez-Ballester, J.; Pastor-Aparicio, A.; Segura-Garcia, J.; Felici-Castell, S.; Cobos, M. Computation of Psycho-Acoustic Annoyance Using Deep Neural Networks. Appl. Sci. 2019, 15, 3136. [Google Scholar] [CrossRef] [Green Version]
- Chee, J. Pearson’s Product Moment Correlation: Sample Analysis; Technical Report; University of Hawaii at Mānoa School of Nursing: Honolulu, HI, USA, 2015. [Google Scholar]
- Howard, D.; Angus, J. Acoustics and Psychoacoustics, 5th ed.; Routledge: London, UK, 2017; pp. 1–510. [Google Scholar]
- Rehan, R.M. The phonic identity of the city urban soundscape for sustainable spaces. HBRC J. 2016, 12, 337–349. [Google Scholar] [CrossRef] [Green Version]
Figure 1.
Clustering of the seaport of Ancona.

Figure 2.
Acoustic classification: seaport area framing.

Figure 3.
Basic information of the case study sites.

Figure 4.
Contents of the questionnaire.

Figure 5.
Pie chart of general trends. Pie chart of general trends.


Figure 6.
Mean score of the perceived quality of the eight clusters.

Figure 7.
Results of polynomial regression between SPL and Loudness. Several noteworthy results were: (1) right ear = 0.84; covariance 0.57; and probability 0.001; (2) left ear = 0.84; covariance 0.56; and probability 0.001.
Figure 7.
Results of polynomial regression between SPL and Loudness. Several noteworthy results were: (1) right ear = 0.84; covariance 0.57; and probability 0.001; (2) left ear = 0.84; covariance 0.56; and probability 0.001.

Figure 8.
Results of polynomial regression between pleasantness and loudness. Several noteworthy results were: (1) right ear = 0.87; covariance 0.59; and probability 0.001; (2) left ear = 0.84; covariance 0.56; and probability 0.001.
Figure 8.
Results of polynomial regression between pleasantness and loudness. Several noteworthy results were: (1) right ear = 0.87; covariance 0.59; and probability 0.001; (2) left ear = 0.84; covariance 0.56; and probability 0.001.

Figure 9.
Results of multivariate regression between SPL, loudness, and sharpness with pleasant. Several noteworthy results were: = 0.82; Sse 0.21; Dfe 3, Rmse 0.36.
Figure 9.
Results of multivariate regression between SPL, loudness, and sharpness with pleasant. Several noteworthy results were: = 0.82; Sse 0.21; Dfe 3, Rmse 0.36.

Figure 10.
Subjective annoyance of humans vs. Zwicker psychoacoustic annoyance weighted with real perception of humans. Results of polynomial regression between PA(Zwicker method) and PA (calculated with weight resulting from the listening test). Several noteworthy results were: = 0.93; covariance 0.50; and probability 0.001.

Figure 11.
Aerial view of the port indicating: cluster name, sound pressure level (A), sound quality index of the site, and psychoacoustic annoyance of the site.
Figure 11.
Aerial view of the port indicating: cluster name, sound pressure level (A), sound quality index of the site, and psychoacoustic annoyance of the site.


Table 1.
Acoustic and Psychoacoustic parameters calculated from the binaural recording.
| Cluster | SPL (dBA) | Loudness (Phone) | Sharpness (Acum) | Fluctation Strength (Vacil) | Roughness (Asper) | |
|---|---|---|---|---|---|---|
| C1 | L | 34.9 | 52.33 | 1.11 | 0.33 | 1.17 |
| R | 37.7 | 54.98 | 1.10 | 0.41 | 1.58 | |
| C2 | L | 31.8 | 49.04 | 1.04 | 0.18 | 2.46 |
| R | 33.1 | 47.99 | 0.66 | 0.18 | 2.54 | |
| C3 | L | 53.8 | 67.50 | 1.38 | 1.10 | 1.80 |
| R | 51.2 | 62.68 | 1.01 | 0.62 | 1.42 | |
| C4 | L | 33.1 | 48.83 | 0.68 | 0.31 | 0.44 |
| R | 34.8 | 50.94 | 0.67 | 0.43 | 0.34 | |
| C5 | L | 26.0 | 49.46 | 1.11 | 0.31 | 2.96 |
| R | 26.2 | 47.81 | 1.00 | 0.25 | 2.71 | |
| C6 | L | 31.3 | 53.52 | 1.19 | 0.17 | 1.07 |
| R | 32.6 | 54.69 | 1.14 | 0.40 | 1.16 | |
| C7 | L | 39.8 | 59.09 | 1.25 | 0.67 | 1.94 |
| R | 40.0 | 59.50 | 1.13 | 0.67 | 1.76 | |
| C8 | L | 36.8 | 53.01 | 1.43 | 0.43 | 0.98 |
| R | 38.8 | 54.63 | 1.05 | 0.67 | 1.36 |
Table 2.
Loudness percentiles, in particular the N5, N50, and N90. These values provide information on the fluctuations in the soundscape.
Table 2.
Loudness percentiles, in particular the N5, N50, and N90. These values provide information on the fluctuations in the soundscape.
| Cluster | Loudness [Free 5%] (Sone) | Loudness [Free 50%] (Sone) | Loudness [Free 90%] (Sone) | |
|---|---|---|---|---|
| C1 | L | 2.670 | 2.026 | 1.723 |
| R | 3.284 | 2.617 | 2.257 | |
| C2 | L | 1.768 | 1.443 | 1.288 |
| R | 1.979 | 1.655 | 1.428 | |
| C3 | L | 2.062 | 1.692 | 1.503 |
| R | 2.374 | 1.882 | 1.673 | |
| C4 | L | 6.899 | 4.502 | 3.720 |
| R | 5.286 | 4.345 | 3.907 | |
| C5 | L | 2.467 | 0.907 | 0.684 |
| R | 2.209 | 0.845 | 0.688 | |
| C6 | L | 1.892 | 1.506 | 1.333 |
| R | 2.273 | 1.649 | 1.450 | |
| C7 | L | 4.071 | 3.059 | 2.664 |
| R | 4.007 | 3.130 | 2.677 | |
| C8 | L | 3.589 | 1.310 | 0.802 |
| R | 5.162 | 1.369 | 0.984 |
Table 3.
Mean value (mean) and standard deviation (std) of the subjective attributes related to the quality of the surrounding soundscape. Statistical significance with a 95% confidence interval of that estimation.
Table 3.
Mean value (mean) and standard deviation (std) of the subjective attributes related to the quality of the surrounding soundscape. Statistical significance with a 95% confidence interval of that estimation.
| Cluster | Sample Mean | Sample Standard Deviation | Confidence Level Value 1 − = 0.95 | Confidence Interval (Normal) | |
|---|---|---|---|---|---|
| C1 | Pleasant | 4.30 | 1.07 | 0.05 | 0.24 |
| Annoying | 3.73 | 1.15 | 0.05 | 0.26 | |
| Vibrant | 3.62 | 1.42 | 0.05 | 0.32 | |
| Calm | 4.07 | 1.08 | 0.05 | 0.25 | |
| Uneventful | 4.19 | 1.08 | 0.05 | 0.25 | |
| Monotonous | 1.39 | 0.81 | 0.05 | 0.18 | |
| Eventful | 3.58 | 1.46 | 0.05 | 0.33 | |
| Chaotic | 1.28 | 0.69 | 0.05 | 0.16 | |
| C2 | Pleasant | 3.05 | 1.26 | 0.05 | 0.29 |
| Annoying | 2.24 | 1.20 | 0.05 | 0.27 | |
| Vibrant | 3.30 | 1.30 | 0.05 | 0.30 | |
| Calm | 2.57 | 1.26 | 0.05 | 0.29 | |
| Uneventful | 2.80 | 1.17 | 0.05 | 0.27 | |
| Monotonous | 2.31 | 1.20 | 0.05 | 0.27 | |
| Eventful | 2.68 | 1.55 | 0.05 | 0.35 | |
| Chaotic | 1.85 | 1.03 | 0.05 | 0.23 | |
| C3 | Pleasant | 2.66 | 1.01 | 0.05 | 0.23 |
| Annoying | 2.49 | 1.00 | 0.05 | 0.23 | |
| Vibrant | 2.92 | 1.00 | 0.05 | 0.23 | |
| Calm | 2.78 | 1.14 | 0.05 | 0.26 | |
| Uneventful | 3.16 | 1.26 | 0.05 | 0.29 | |
| Monotonous | 2.76 | 1.32 | 0.05 | 0.30 | |
| Eventful | 2.84 | 1.28 | 0.05 | 0.29 | |
| Chaotic | 1.96 | 1.05 | 0.05 | 0.24 | |
| C4 | Pleasant | 3.34 | 1.21 | 0.05 | 0.28 |
| Annoying | 2.53 | 1.16 | 0.05 | 0.26 | |
| Vibrant | 3.32 | 1.24 | 0.05 | 0.28 | |
| Calm | 2.95 | 1.30 | 0.05 | 0.30 | |
| Uneventful | 3.01 | 1.31 | 0.05 | 0.30 | |
| Monotonous | 2.78 | 1.38 | 0.05 | 0.31 | |
| Eventful | 3.08 | 1.28 | 0.05 | 0.29 | |
| Chaotic | 2.01 | 1.08 | 0.05 | 0.25 | |
| C5 | Pleasant | 1.95 | 0.93 | 0.05 | 0.21 |
| Annoying | 2.24 | 0.93 | 0.05 | 0.21 | |
| Vibrant | 2.76 | 1.31 | 0.05 | 0.30 | |
| Calm | 1.73 | 1.01 | 0.05 | 0.23 | |
| Uneventful | 2.03 | 1.05 | 0.05 | 0.24 | |
| Monotonous | 2.23 | 1.37 | 0.05 | 0.31 | |
| Eventful | 1.93 | 1.21 | 0.05 | 0.28 | |
| Chaotic | 2.95 | 1.38 | 0.05 | 0.32 | |
| C6 | Pleasant | 2.95 | 1.32 | 0.05 | 0.30 |
| Annoying | 2.59 | 1.39 | 0.05 | 0.32 | |
| Vibrant | 2.97 | 1.35 | 0.05 | 0.31 | |
| Calm | 3.01 | 1.21 | 0.05 | 0.28 | |
| Uneventful | 3.03 | 1.23 | 0.05 | 0.28 | |
| Monotonous | 2.14 | 1.13 | 0.05 | 0.26 | |
| Eventful | 2.47 | 1.16 | 0.05 | 0.26 | |
| Chaotic | 2.22 | 1.14 | 0.05 | 0.26 | |
| C7 | Pleasant | 3.54 | 1.27 | 0.05 | 0.29 |
| Annoying | 3.34 | 1.25 | 0.05 | 0.29 | |
| Vibrant | 3.11 | 1.30 | 0.05 | 0.30 | |
| Calm | 3.51 | 1.24 | 0.05 | 0.28 | |
| Uneventful | 3.36 | 1.28 | 0.05 | 0.29 | |
| Monotonous | 2.05 | 1.07 | 0.05 | 0.24 | |
| Eventful | 3.53 | 1.17 | 0.05 | 0.27 | |
| Chaotic | 1.96 | 0.93 | 0.05 | 0.21 | |
| C8 | Pleasant | 2.92 | 1.41 | 0.05 | 0.32 |
| Annoying | 2.38 | 1.32 | 0.05 | 0.30 | |
| Vibrant | 3.03 | 1.54 | 0.05 | 0.35 | |
| Calm | 2.78 | 1.46 | 0.05 | 0.33 | |
| Uneventful | 3.04 | 1.45 | 0.05 | 0.33 | |
| Monotonous | 2.20 | 1.02 | 0.05 | 0.23 | |
| Eventful | 2.30 | 1.12 | 0.05 | 0.26 | |
| Chaotic | 2.49 | 1.36 | 0.05 | 0.31 |
Table 4.
Relationship between subjective evaluation of landscape sounds and physical metrics.
| Leq_dx | Leq_sx | Phone_dx | Phone_sx | Sharp_dx | Sharp_sx | fs_dx | fs_sx | r_dx | r_sx | |
|---|---|---|---|---|---|---|---|---|---|---|
| Pleasant | 0.75 | 0.83 | 0.87 | 0.84 | 0.81 | 0.85 | 0.44 | 0.34 | 0.49 | 0.56 |
| Annoying | 0.34 | 0.23 | 0.59 | 0.27 | 0.75 | 0.78 | 0.40 | 0.17 | 0.90 | 0.94 |
| Vibrant | 0.69 | 0.78 | 0.50 | 0.41 | 0.10 | 0.23 | 0.09 | 0.31 | 0.67 | 0.62 |
| Calm | 0.63 | 0.68 | 0.76 | 0.70 | 0.49 | 0.15 | 0.56 | 0.23 | 0.89 | 0.86 |
| Uneventful | 0.56 | 0.39 | 0.59 | 0.22 | 0.31 | −0.02 | 0.46 | 0.11 | 0.71 | 0.75 |
| Monotonous | 0.33 | 0.44 | 0.07 | 0.33 | −0.69 | −0.22 | 0.14 | 0.49 | −0.66 | −0.17 |
| Eventful | 0.75 | 0.66 | 0.78 | 0.56 | 0.21 | −0.03 | 0.49 | 0.52 | 0.73 | 0.65 |
| Chaotic | −0.52 | −0.39 | −0.39 | −0.17 | 0.14 | 0.29 | −0.06 | −0.08 | −0.36 | −0.11 |
Table 5.
Results of multiple regression analysis.
| Subjective Response | Sse | r_Square | DFE | Rmse |
|---|---|---|---|---|
| Pleasant | 0.21 | 0.82 | 3 | 0.36 |
| Eventful | 1.29 | 0.76 | 2 | 0.56 |
| Vibrant | 1.71 | 0.81 | 2 | 0.47 |
| Calm | 0.70 | 0.86 | 3 | 0.48 |
| Annoying | 0.65 | 0.80 | 3 | 0.46 |
Table 6.
Perceptive annoyance factor (PA) calculated ad hoc for Ancona’s port. Sound quality index (SQI) calculated for each cluster.
Table 6.
Perceptive annoyance factor (PA) calculated ad hoc for Ancona’s port. Sound quality index (SQI) calculated for each cluster.
| Location | PA (Port) | SQI (Sound Quality Index) |
|---|---|---|
| C1 | 6.6 | 6.9 |
| C2 | 6.0 | 5.3 |
| C3 | 4.9 | 9.9 |
| C4 | 7.6 | 5.6 |
| C5 | 5.1 | 4.7 |
| C6 | 6.5 | 6.3 |
| C7 | 3.9 | 9.2 |
| C8 | 8.5 | 7.0 |
Publisher’s Note: MDPI stays neutral with regard to jurisdictional claims in published maps and institutional affiliations. |
© 2022 by the authors. Licensee MDPI, Basel, Switzerland. This article is an open access article distributed under the terms and conditions of the Creative Commons Attribution (CC BY) license (https://creativecommons.org/licenses/by/4.0/).
Share and Cite
MDPI and ACS Style
Di Loreto, S.; Serpilli, F.; Lori, V. Soundscape Approach in the Seaport of Ancona: A Case Study. Acoustics 2022, 4, 492-516. https://doi.org/10.3390/acoustics4020031
AMA Style
Di Loreto S, Serpilli F, Lori V. Soundscape Approach in the Seaport of Ancona: A Case Study. Acoustics. 2022; 4(2):492-516. https://doi.org/10.3390/acoustics4020031
Chicago/Turabian StyleDi Loreto, Samantha, Fabio Serpilli, and Valter Lori. 2022. "Soundscape Approach in the Seaport of Ancona: A Case Study" Acoustics 4, no. 2: 492-516. https://doi.org/10.3390/acoustics4020031