

Pose-Based Gait Analysis for Diagnosis of Parkinson’s Disease
by
 , , , , and
Tee Connie
1,*,
Timilehin B. Aderinola
1,
Thian Song Ong
1,
Michael Kah Ong Goh
1,
Bayu Erfianto
2 and
Bedy Purnama
2
1
Faculty of Information Science and Technology, Multimedia University, Malacca 75450, Malaysia
2
School of Computing, Telkom University, Jawa Barat 40257, Indonesia
*
Author to whom correspondence should be addressed.
Algorithms 2022, 15(12), 474; https://doi.org/10.3390/a15120474
Submission received: 7 November 2022
/
Revised: 9 December 2022
/
Accepted: 10 December 2022
/
Published: 12 December 2022
(This article belongs to the Special Issue Artificial Intelligence Algorithms for Healthcare)
Abstract
:Parkinson’s disease (PD) is a neurodegenerative disorder that is more common in elderly people and affects motor control, flexibility, and how easily patients adapt to their walking environments. PD is progressive in nature, and if undetected and untreated, the symptoms grow worse over time. Fortunately, PD can be detected early using gait features since the loss of motor control results in gait impairment. In general, techniques for capturing gait can be categorized as computer-vision-based or sensor-based. Sensor-based techniques are mostly used in clinical gait analysis and are regarded as the gold standard for PD detection. The main limitation of using sensor-based gait capture is the associated high cost and the technical expertise required for setup. In addition, the subjects’ consciousness of worn sensors and being actively monitored may further impact their motor function. Recent advances in computer vision have enabled the tracking of body parts in videos in a markerless motion capture scenario via human pose estimation (HPE). Although markerless motion capture has been studied in comparison with gold-standard motion-capture techniques, it is yet to be evaluated in the prediction of neurological conditions such as PD. Hence, in this study, we extract PD-discriminative gait features from raw videos of subjects and demonstrate the potential of markerless motion capture for PD prediction. First, we perform HPE on the subjects using AlphaPose. Then, we extract and analyse eight features, from which five features are systematically selected, achieving up to 93% accuracy, 96% precision, and 92% recall in arbitrary views.
1. Introduction
The motor skills required to walk without difficulty in different environments are vital for good quality of life. As with gait in general, these motor skills take many years to develop. Parkinson’s disease (PD) is a neurodegenerative disorder that is more common in elderly people and affects motor control, flexibility, and adaptability [1]. PD is caused by a decline in the production of dopamine, which negatively affects patients’ speech coherence and motor control. However, as is the case with most neurodegenerative disorders, the root cause of PD is unknown [2].
PD is progressive in nature, and if undetected and untreated, symptoms grow worse over time. PD has a stage in which the symptoms required for correct diagnosis are absent or difficult to detect [3]. The main visible signs of PD are reduced movement (hypokinesia) and loss of movement (akinesia) [1]. These symptoms can be observed as reduced range of motion, tremors in the upper limbs, body rigidity, difficulty in walking, reduced step length, and slower walking speed [4]. Early prediction could aid in treatment and therapy to slow down the degenerative process. This could prevent degradation to a clinical stage, thereby improving quality of life [3].
PD affects the central nervous system by reducing its control of motor neurons. This results in the condition referred to as dysphonia, which is the inability to form words coherently. Hence, PD can be detected using voice features. However, speech features obtained in unconstrained environments are often noisy [2]. Fortunately, PD can be detected early using gait features since the loss of motor control results in gait impairment. Early signs of PD shown in gait include reduced arm swing amplitude and symmetry, reduced gait speed, reduced step length, and increased time spent in the double-support phase [5].
Predicting PD from gait requires an appropriate gait capture technique. In general, techniques for capturing gait can be categorized as vision-based or sensor-based [6]. Sensor-based techniques are mostly used in clinical gait analysis and are regarded as the gold standard for PD detection. The sensors used can be wearable, such as inertial measurement units (IMUs) [7]; or non-wearable, such as floor sensors [5]. The main limitation of using sensor-based gait capture is the associated high cost and the technical expertise required for setup. In addition, subjects’ consciousness of worn sensors and being actively monitored may further impact their motor function.
The studies focusing on PD prediction can be grouped into two main categories based on the features used: studies using non-perceivable features, and those using perceivable features. Examples of non-perceivable features are those extracted from magnetic resonance imaging (MRI) scans of the brain. Such features could be analysed by experts, or prediction could be performed using deep neural networks [8,9]. PD prediction has also been performed using brain electroencephalogram (EEG) signals [10]. The limitations of these features include the requirement for expert knowledge and the level of interpretability of results obtained.
Perceivable features for PD prediction include voice, handwriting, face, and gait. Åström and Koker [2] proposed a neural network approach to predict PD based on voice features. However, speech features obtained in unconstrained environments are often noisy. Handwriting features have also been used in PD prediction [11,12]. In recent research [13,14], the face has been shown to contain PD-related features. Of all perceivable features, gait can be obtained unobtrusively in videos, and it has also been used for PD prediction [15,16,17], including a computer-vision approach to classifying slowness of movement based on arm motion captured by a smartphone camera [18].
Recent advances in computer vision have enabled the tracking of body parts in a markerless motion capture scenario via human pose estimation (HPE) algorithms such as AlphaPose [19] and OpenPose [20]. Although markerless motion capture has been studied in comparison with gold-standard motion capture techniques [21], it is yet to be used in the prediction of neurological conditions such as PD. Hence, in this study, we extract PD-discriminative gait features from raw videos of subjects and demonstrate the potential of markerless motion capture for PD prediction.
The main contributions of this study are as follows. First, we propose eight features for the diagnosis of Parkinson’s disease from videos. We explore pose estimation for markerless motion capture and perform feature extraction from the human pose estimation time series. Then, through systematic analysis and several experiments, we propose features that can aid in PD diagnosis from arbitrary views. We note that vision-based approaches can be based only on the detection of perceivable gait impairments, most of which can also be found due to ageing or other conditions. Hence, the proposed technique could serve the purpose of screening. If gait impairment is detected, further clinical investigations may be required to determine if it is due to PD or other reasons.
2. Methodology
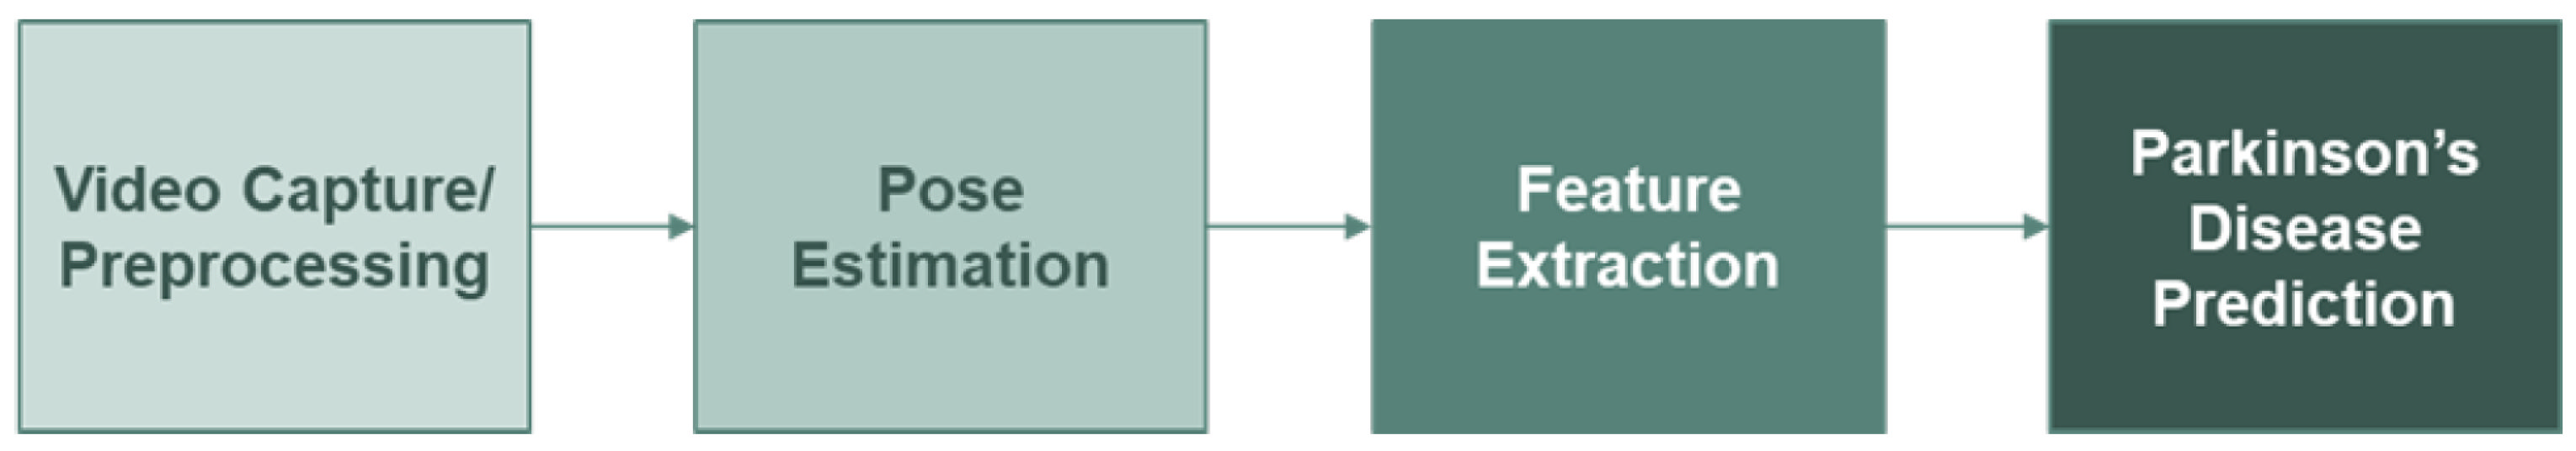
In this section, we describe the approach taken for gait capture, feature extraction, and Parkinson’s disease prediction (Figure 1).
2.1. Video Capture and Preprocessing
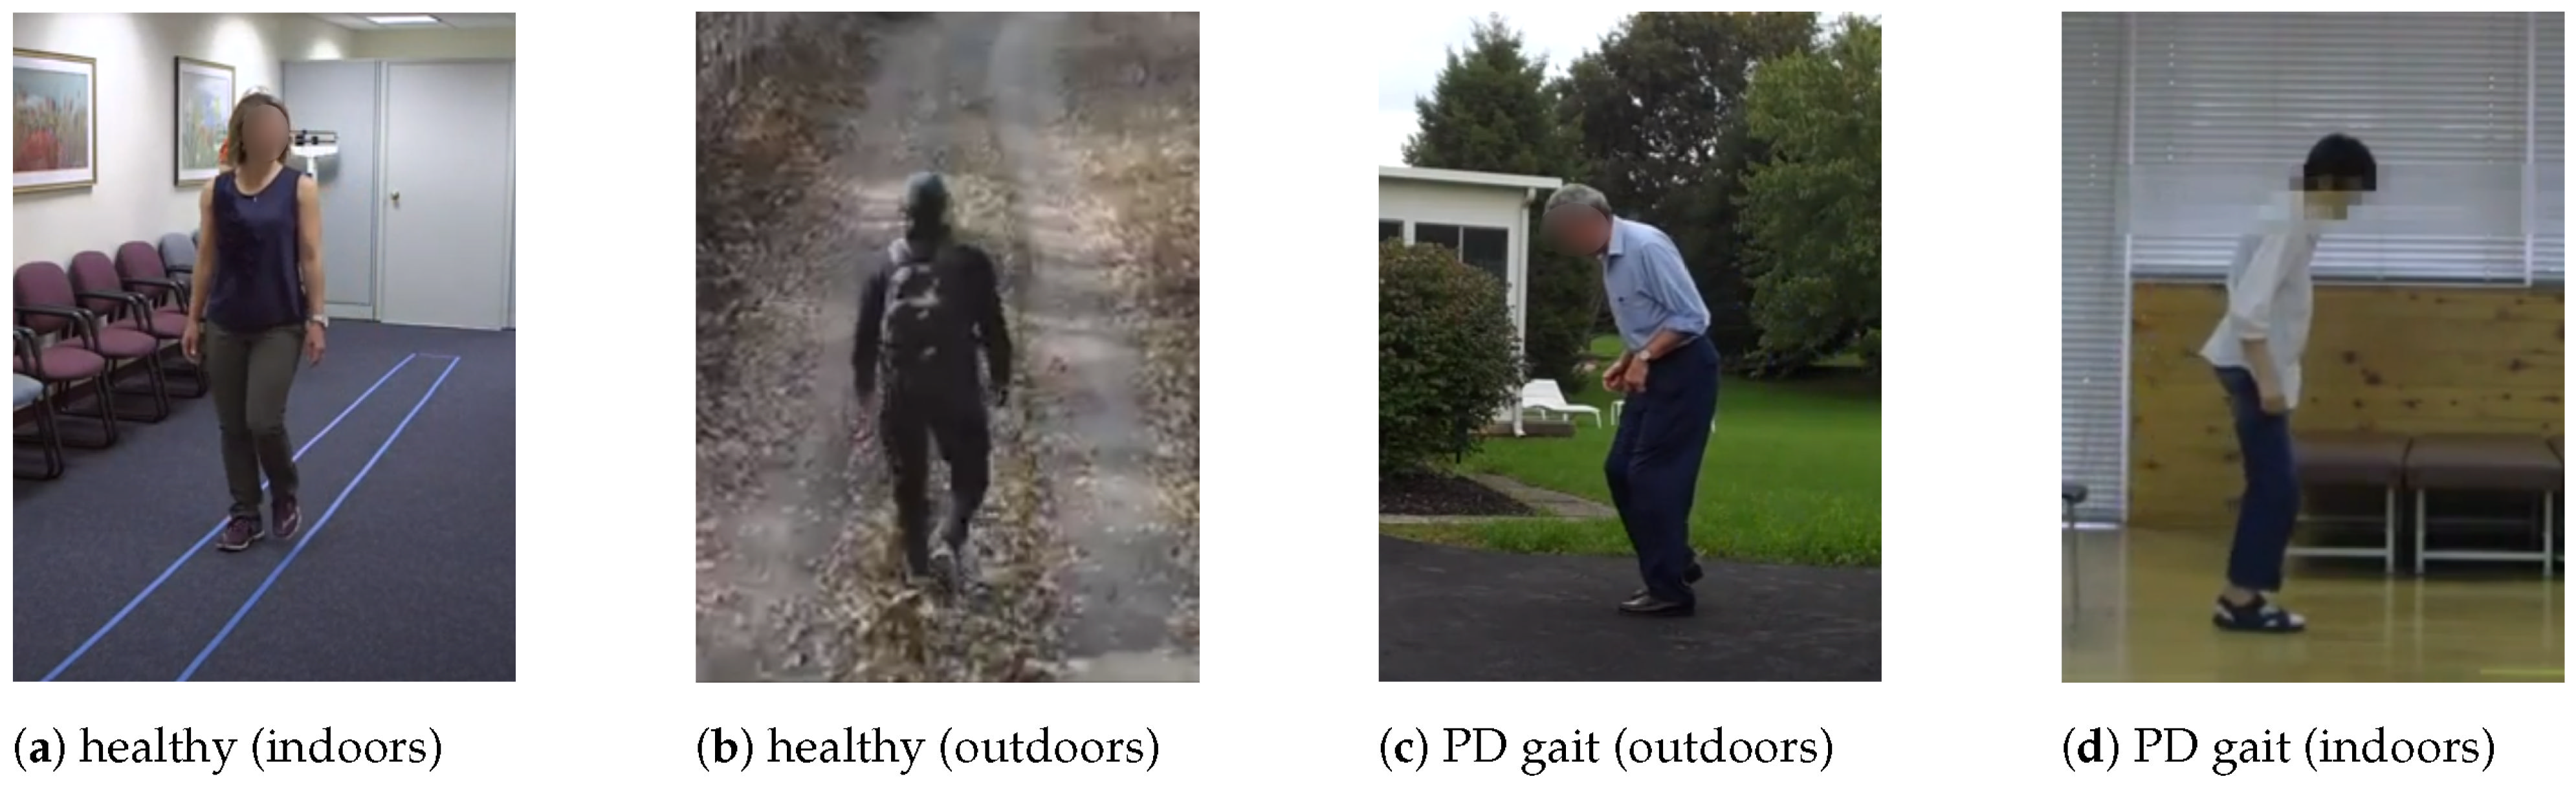
Data are obtained online from public domain videos of people walking, and each video is manually labelled with the apparent PD status (Figure 2). Due to the unavailability of public video datasets for PD prediction, most of the PD videos are obtained from public domain recordings of PD therapy sessions and subjects walking in unconstrained environments. The data collected consist of 167 subjects: 93 healthy and 74 with PD. The videos are segmented to ensure there is only one subject in each video. Videos that feature multiple subjects walking too closely are discarded.
2.2. Human Pose Estimation
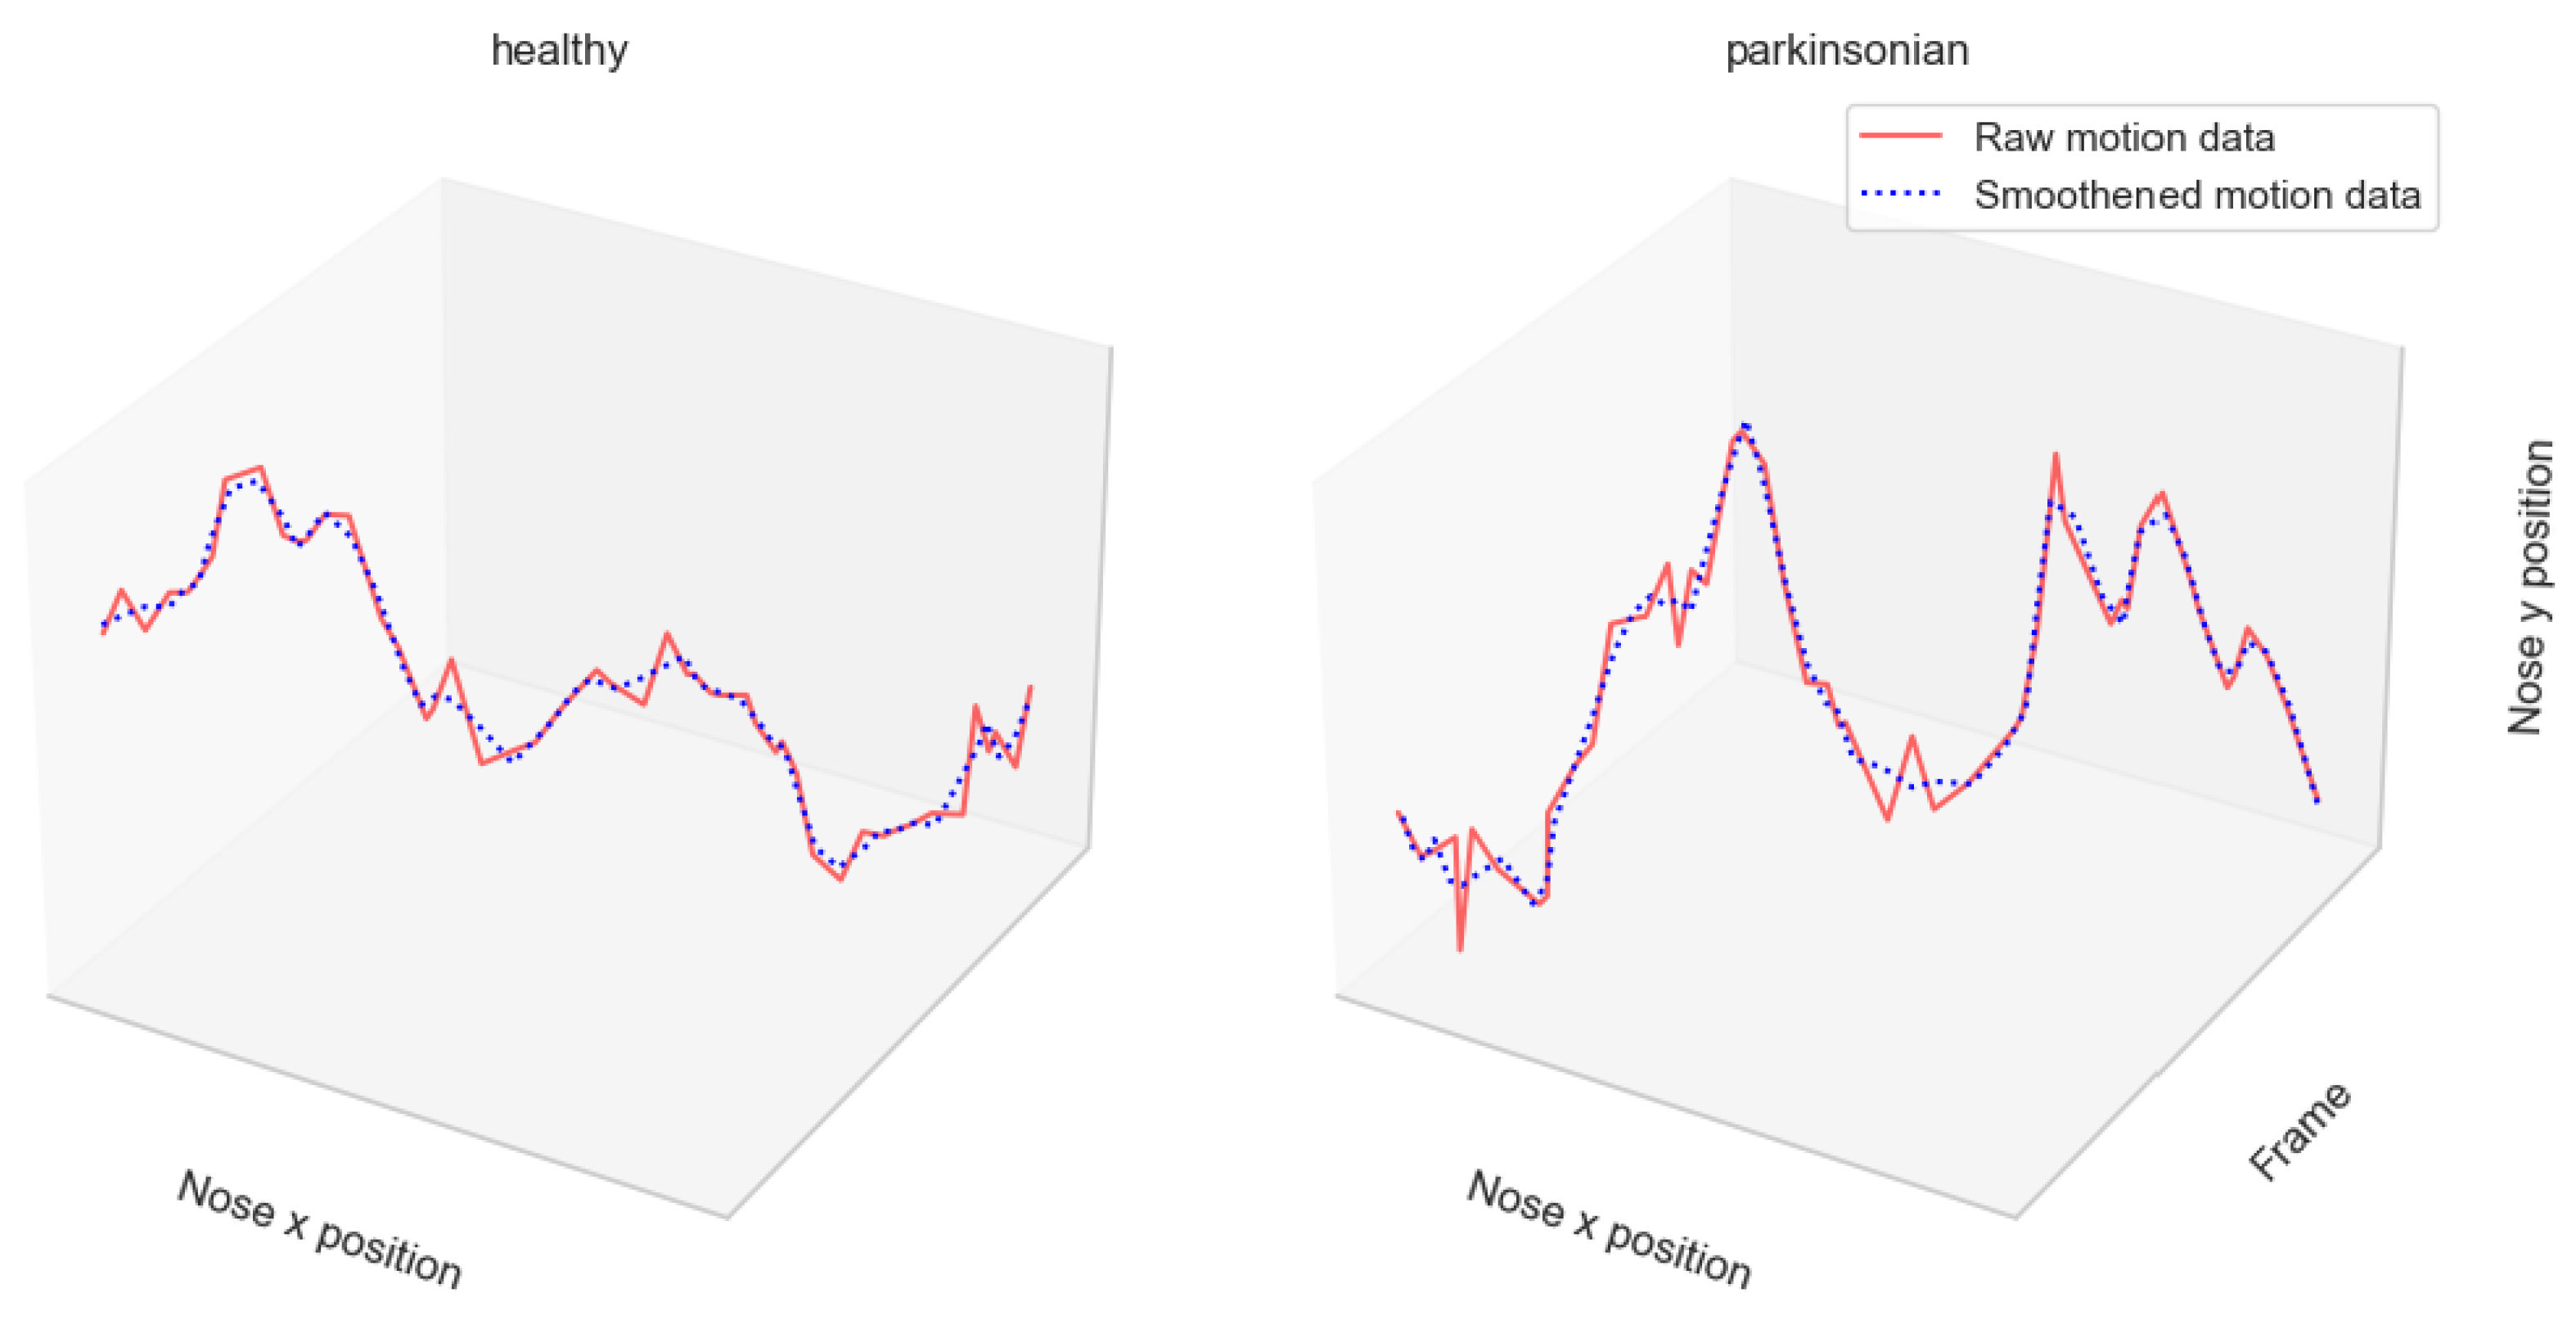
To track participants’ motor performance in videos without using physical markers, we perform human pose estimation (HPE) using AlphaPose [19]. For a walking sequence of T seconds in which we track K body keypoints in a video with frame rate f, HPE outputs a multivariate time series , where represent the 2D coordinates, and is the detection probability of the keypoint in frame t. Due to the noisy nature of HPE data, smoothing is performed using a Savgol filter with a window size of 5. The motion of two subjects is illustrated in Figure 3.
2.3. Feature Extraction
The early visible symptoms of PD include changes in posture, tremors, reduced arm swing, arm swing asymmetry, and reduction in step length and gait speed. Hence, we extract eight features from the body keypoint coordinates obtained as described in Section 2.2. If we let and be the coordinates of two adjacent keypoints i and j in frame t, the Euclidean distance between i and j can be found as:
Suppose j is a central keypoint, such as the elbow joint, with i and k as its adjacent nodes; we can form vectors from and in order to obtain the range of motion at j as:
We obtain a measure of the steadiness of a body keypoint j as the standard deviation of the moving differences of j:
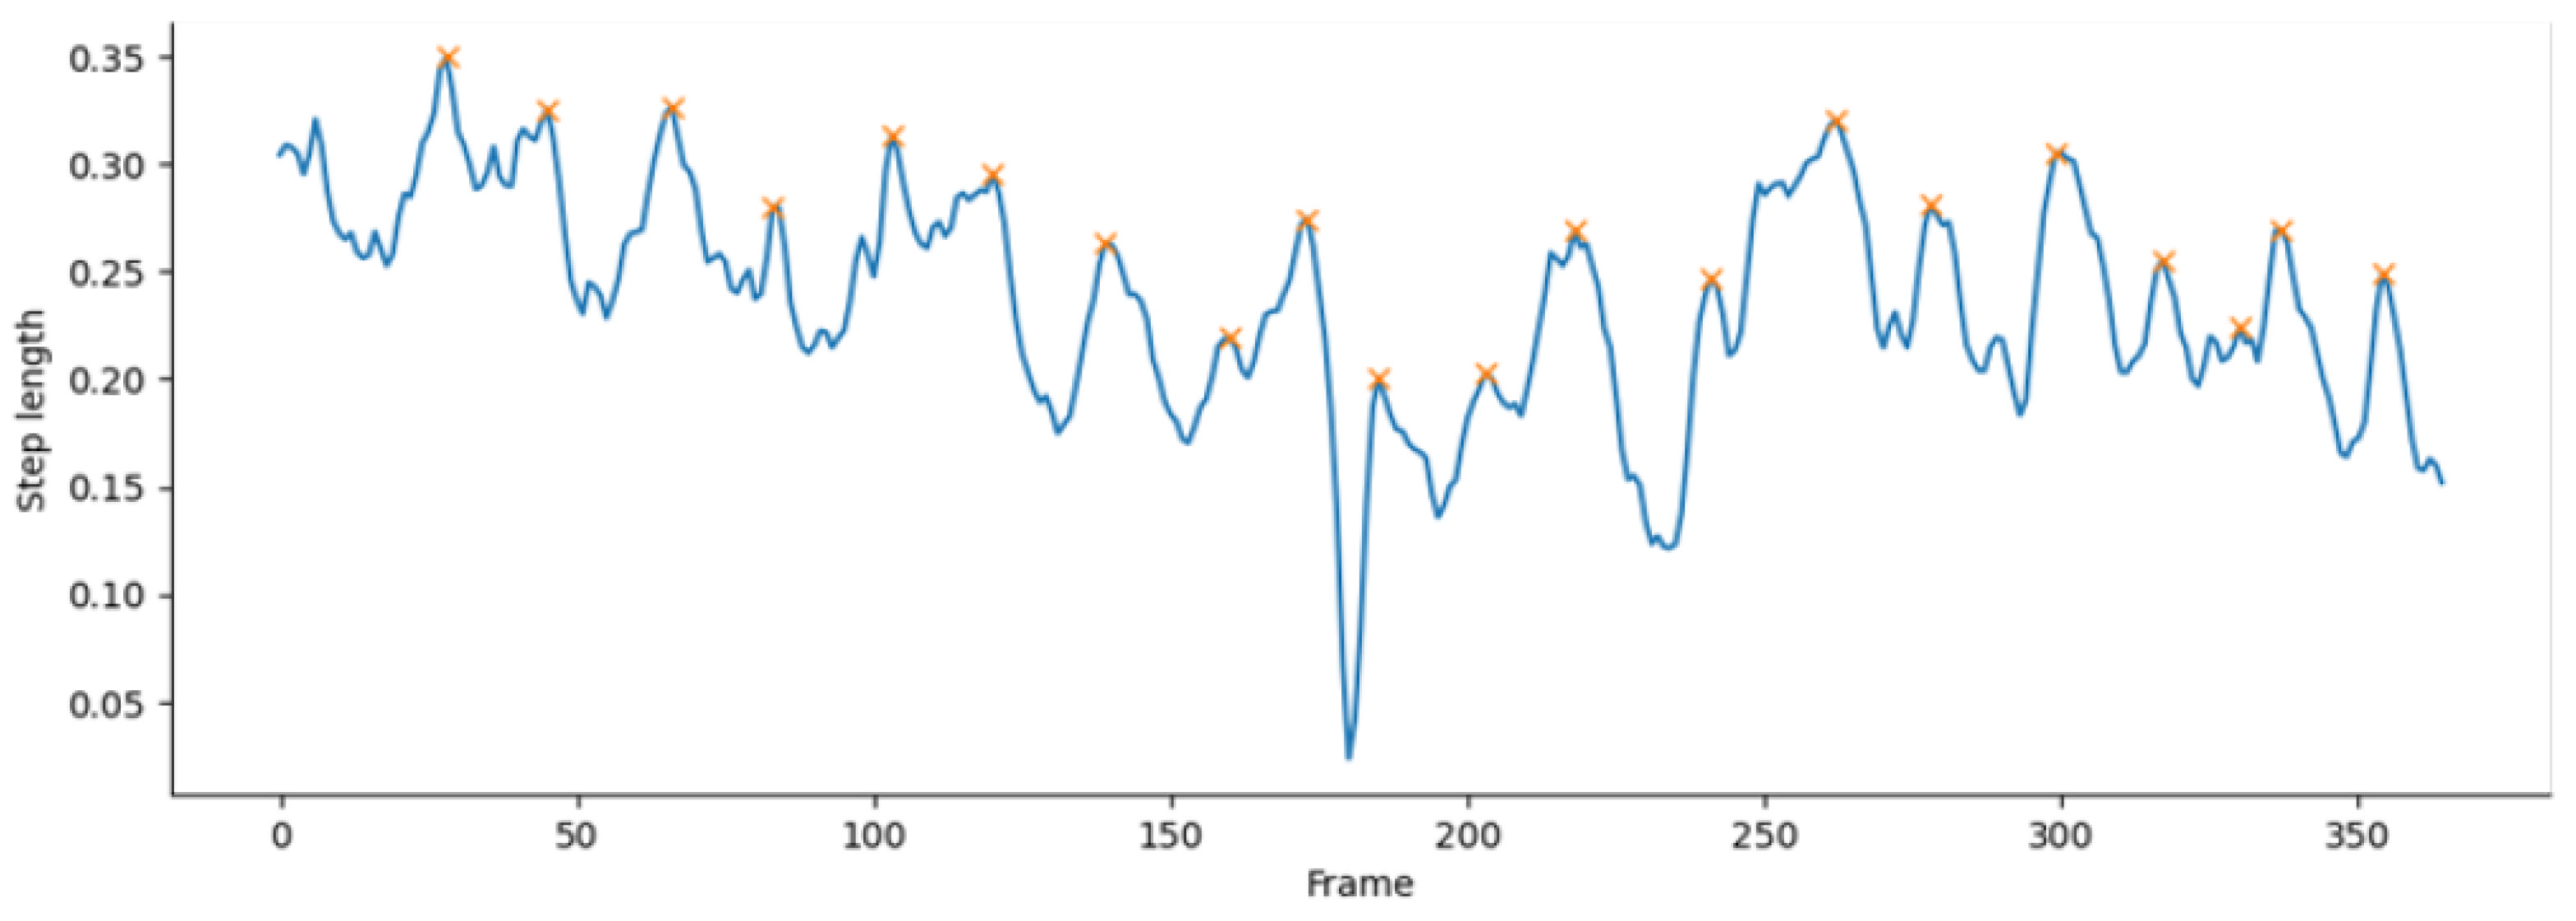
where is a vector representing the 2D positional coordinates of keypoint j in frame t, and F is the total number of frames. Hence, as shown in Table 1, subject posture, arm steadiness, arm swing, arm swing symmetry, maximum step height, mean step length, cadence (steps per minute), and gait speed (cycles per minute) are obtained from the keypoint coordinates obtained via pose estimation. As illustrated in Figure 4, the number of steps taken by the subject in the video is estimated by counting the peaks of the step length. To compute the peaks, we take the step length values per frame as a time series. We then find all local maxima by a comparison of neighbouring values.
3. Experiments and Results
3.1. Experiment Setup
Data augmentation was performed in two ways. First, we flipped the original motion time series obtained via pose estimation to simulate the backward movement of the subjects. The flipped motion time series was then appended to the original, thereby doubling the length of the time series. Then, each sequence was divided into subsequences with a uniform length of 180 frames, which is equivalent to 6 s each (assuming a frame rate of 30 frames per second) (Table 2). Classification was performed using a Random Forest classifier with 250 trees on the front view, side view, and all views. Each view was represented by a feature matrix and a label vector , where N is the number of samples and f is the number of features. Apart from accuracy, the precision, recall, and F1 score are also reported. Analysis of the features extracted in Table 1 is presented in Appendix A.
3.2. Feature Selection
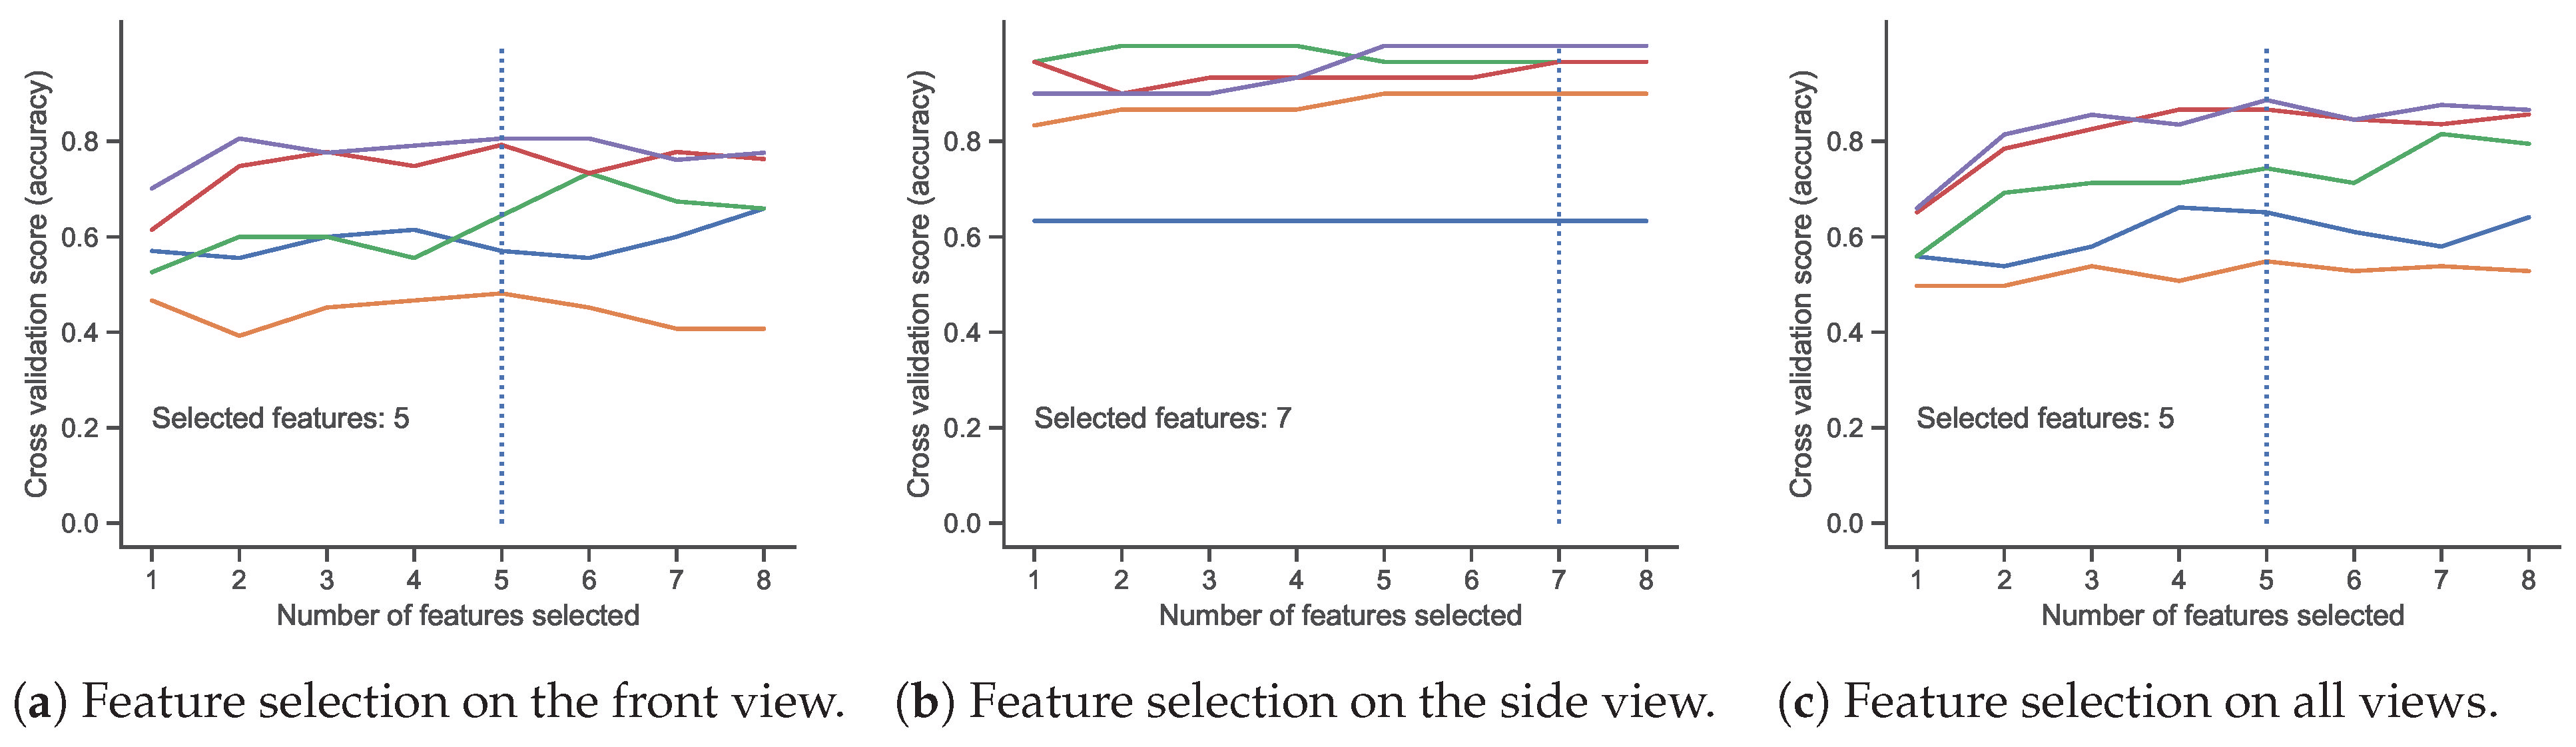
For each view, experiments were performed to select the best features based on feature importance. We use a stratified 5-fold cross-validation. In each run, the least important feature was recursively removed until the optimum number of features were selected based on cross-validation scores (Figure 5). For each view, the number of features was selected from all eight features such that there was no significant reduction in overall accuracy, thereby determining the important features for each view.
Table 3 shows the feature rankings and selection for each view. For the front view, a total of five features were selected, excluding the posture, arm swing symmetry, and cadence. This is expected, as these features are not easily obtained in the front view. On the other hand, all features except the arm swing symmetry were selected in the side view. The arm swing symmetry, which is the ratio of the swing of the left arm to the swing of the right arm, was not selected in any view. This could be because of its high correlation with the arm swing. Lastly, we found that the five features common to the front and side views were selected as important for all views, namely, arm steadiness, arm swing, step height, step length, and gait speed. Across all views, the step length and arm swing ranked highest, while posture and cadence ranked lowest among the features.
3.3. Experimental Results
This section shows the results of experiments performed to evaluate the selected features and the effect of smoothing on the pose estimation output. For each of the views, the dataset was split into a training set (75%) and a testing set (25%) and fitted on a Random Forest classifier with 250 trees. The summary of the results is shown in Table 4.
As shown in Table 4, smoothing shows no effect on the accuracy achieved in the front and side views. However, it results in a slight improvement in the accuracy and F1-scores achieved for all views. We observe that conventional filters such as the Savgol filter used in this study may not be suitable for smoothing human motion time series obtained via pose estimation, since important motion data may be distorted. In addition, using five features (arm steadiness, arm swing, step height, step length, and gait speed) on the front view yields the same results as using all features with smoothing. Similarly, excluding the arm swing symmetry feature on the side view still yields results similar to using all features with smoothing. Lastly, when all views are considered, the arm steadiness, arm swing, step height, step length, and gait speed prove sufficient for differentiating a healthy from a Parkinsonian gait.
4. Conclusions and Future Work
In this study, we proposed gait features extracted from videos using markerless motion capture techniques for PD detection. First, we performed HPE on the subjects using AlphaPose. The results of the experiments performed in this study suggest that PD can be predicted in videos using markerless motion capture with up to 93% accuracy from arbitrary views, 95% in the front view, and 97% accuracy in the side view. This is most likely because most PD-related gait features can be more easily observed in the side view of gait. Most of the extracted features show more discriminative ability in the side view, especially gait speed, step length, and arm swing. As expected, the five features common to the front and side views are selected as important for all views, namely, arm steadiness, arm swing, step height, step length, and gait speed. We propose that these five features can be used for PD prediction in arbitrary views.
Although this study has used a modest-sized self-collected dataset, the results show the potential of using markerless motion capture for the early detection of Parkinson’s disease. We note that vision-based approaches can be based only on the detection of perceivable gait impairments. Hence, further clinical investigations may be required to determine if a patient suffers from PD or gait impairment due to ageing or other conditions. Notwithstanding, the main advantage of this approach is its ease of use, potential reduction of cost, reduction of waiting times, and reduction of burden on trained clinicians. Future research will focus on investigating more features to detect different phases of Parkinson’s disease progression.
Author Contributions
Conceptualization, T.C. and M.K.O.G.; methodology, T.S.O.; software, T.B.A.; validation, B.E.; formal analysis, B.P.; data curation, T.C. and T.B.A.; writing—original draft preparation, T.B.A.; writing—review and editing, T.C., T.S.O., M.K.O.G., B.E. and B.P.; supervision, T.C.; funding acquisition, T.C. All authors have read and agreed to the published version of the manuscript.
Funding
This project is funded by a Multimedia University and Universitas Telkom Joint research grant (MMUE/210063).
Data Availability Statement
The AlphaPose body keypoints will be shared on request.
Conflicts of Interest
The authors declare no conflict of interest.
Abbreviations
The following abbreviations are used in this manuscript:
| 2D | 2-dimensional |
| PD | Parkinson’s disease |
| HPE | Human pose estimation |
Appendix A. Features Analysis
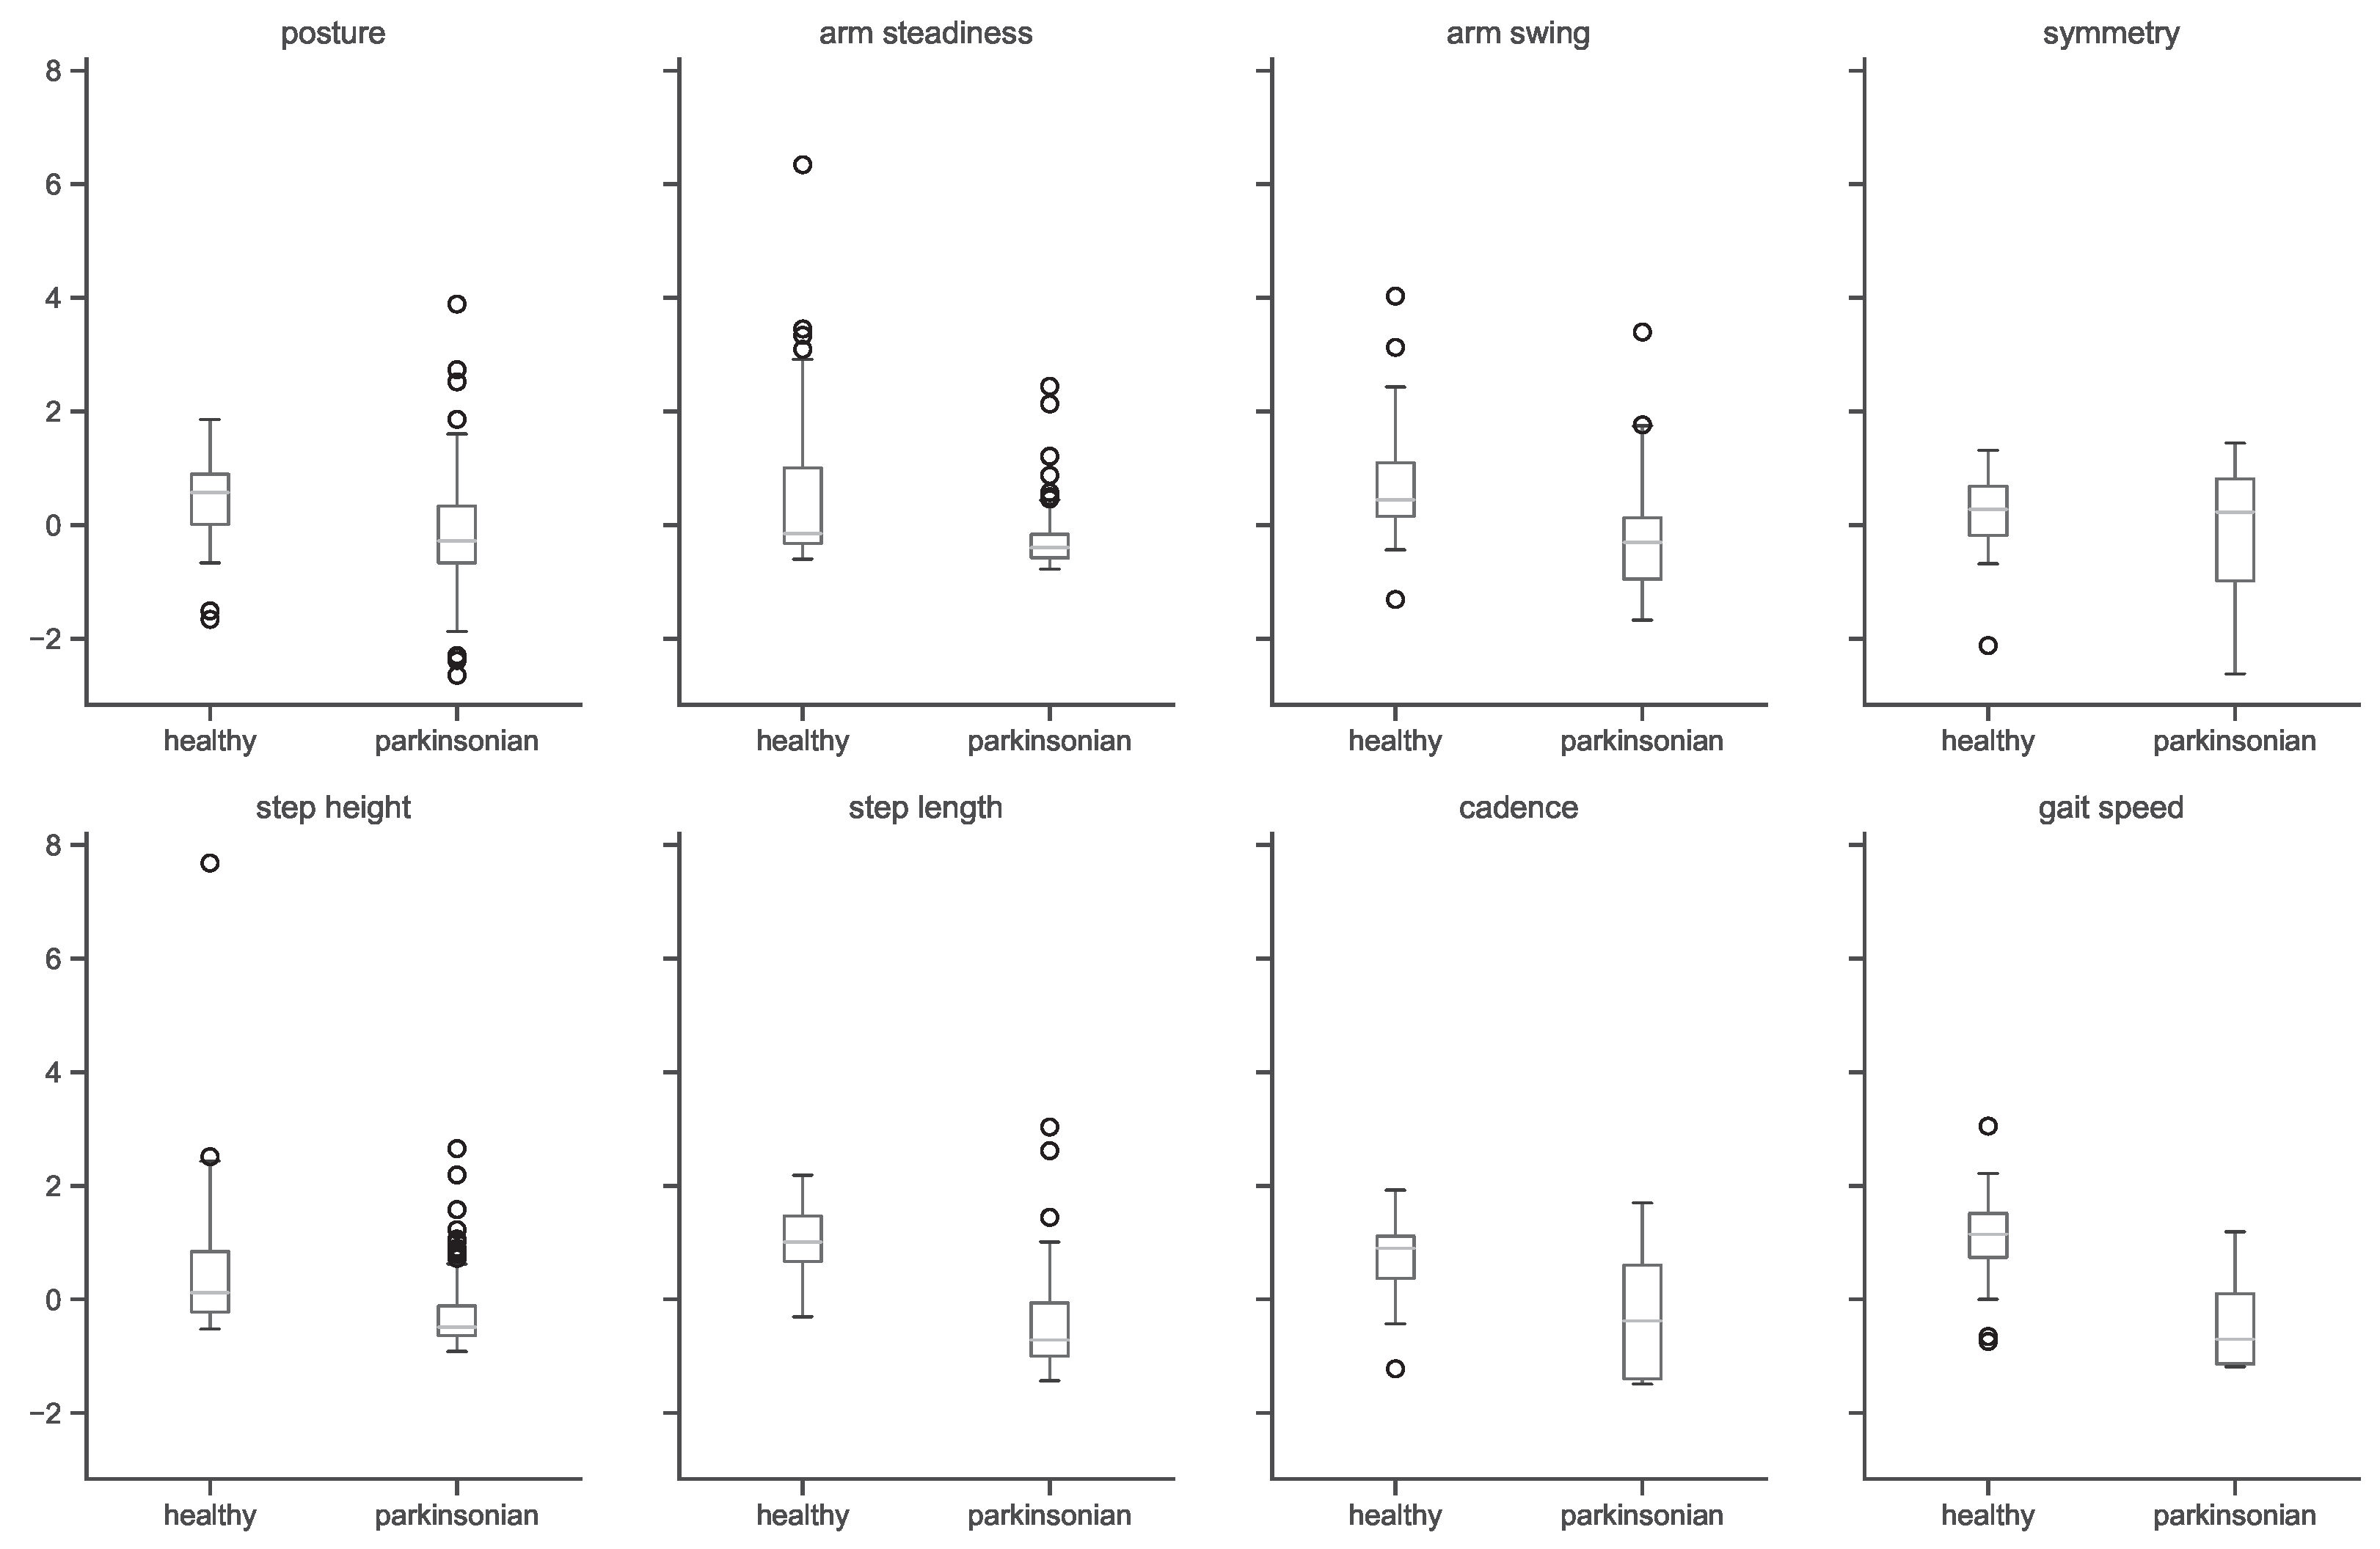
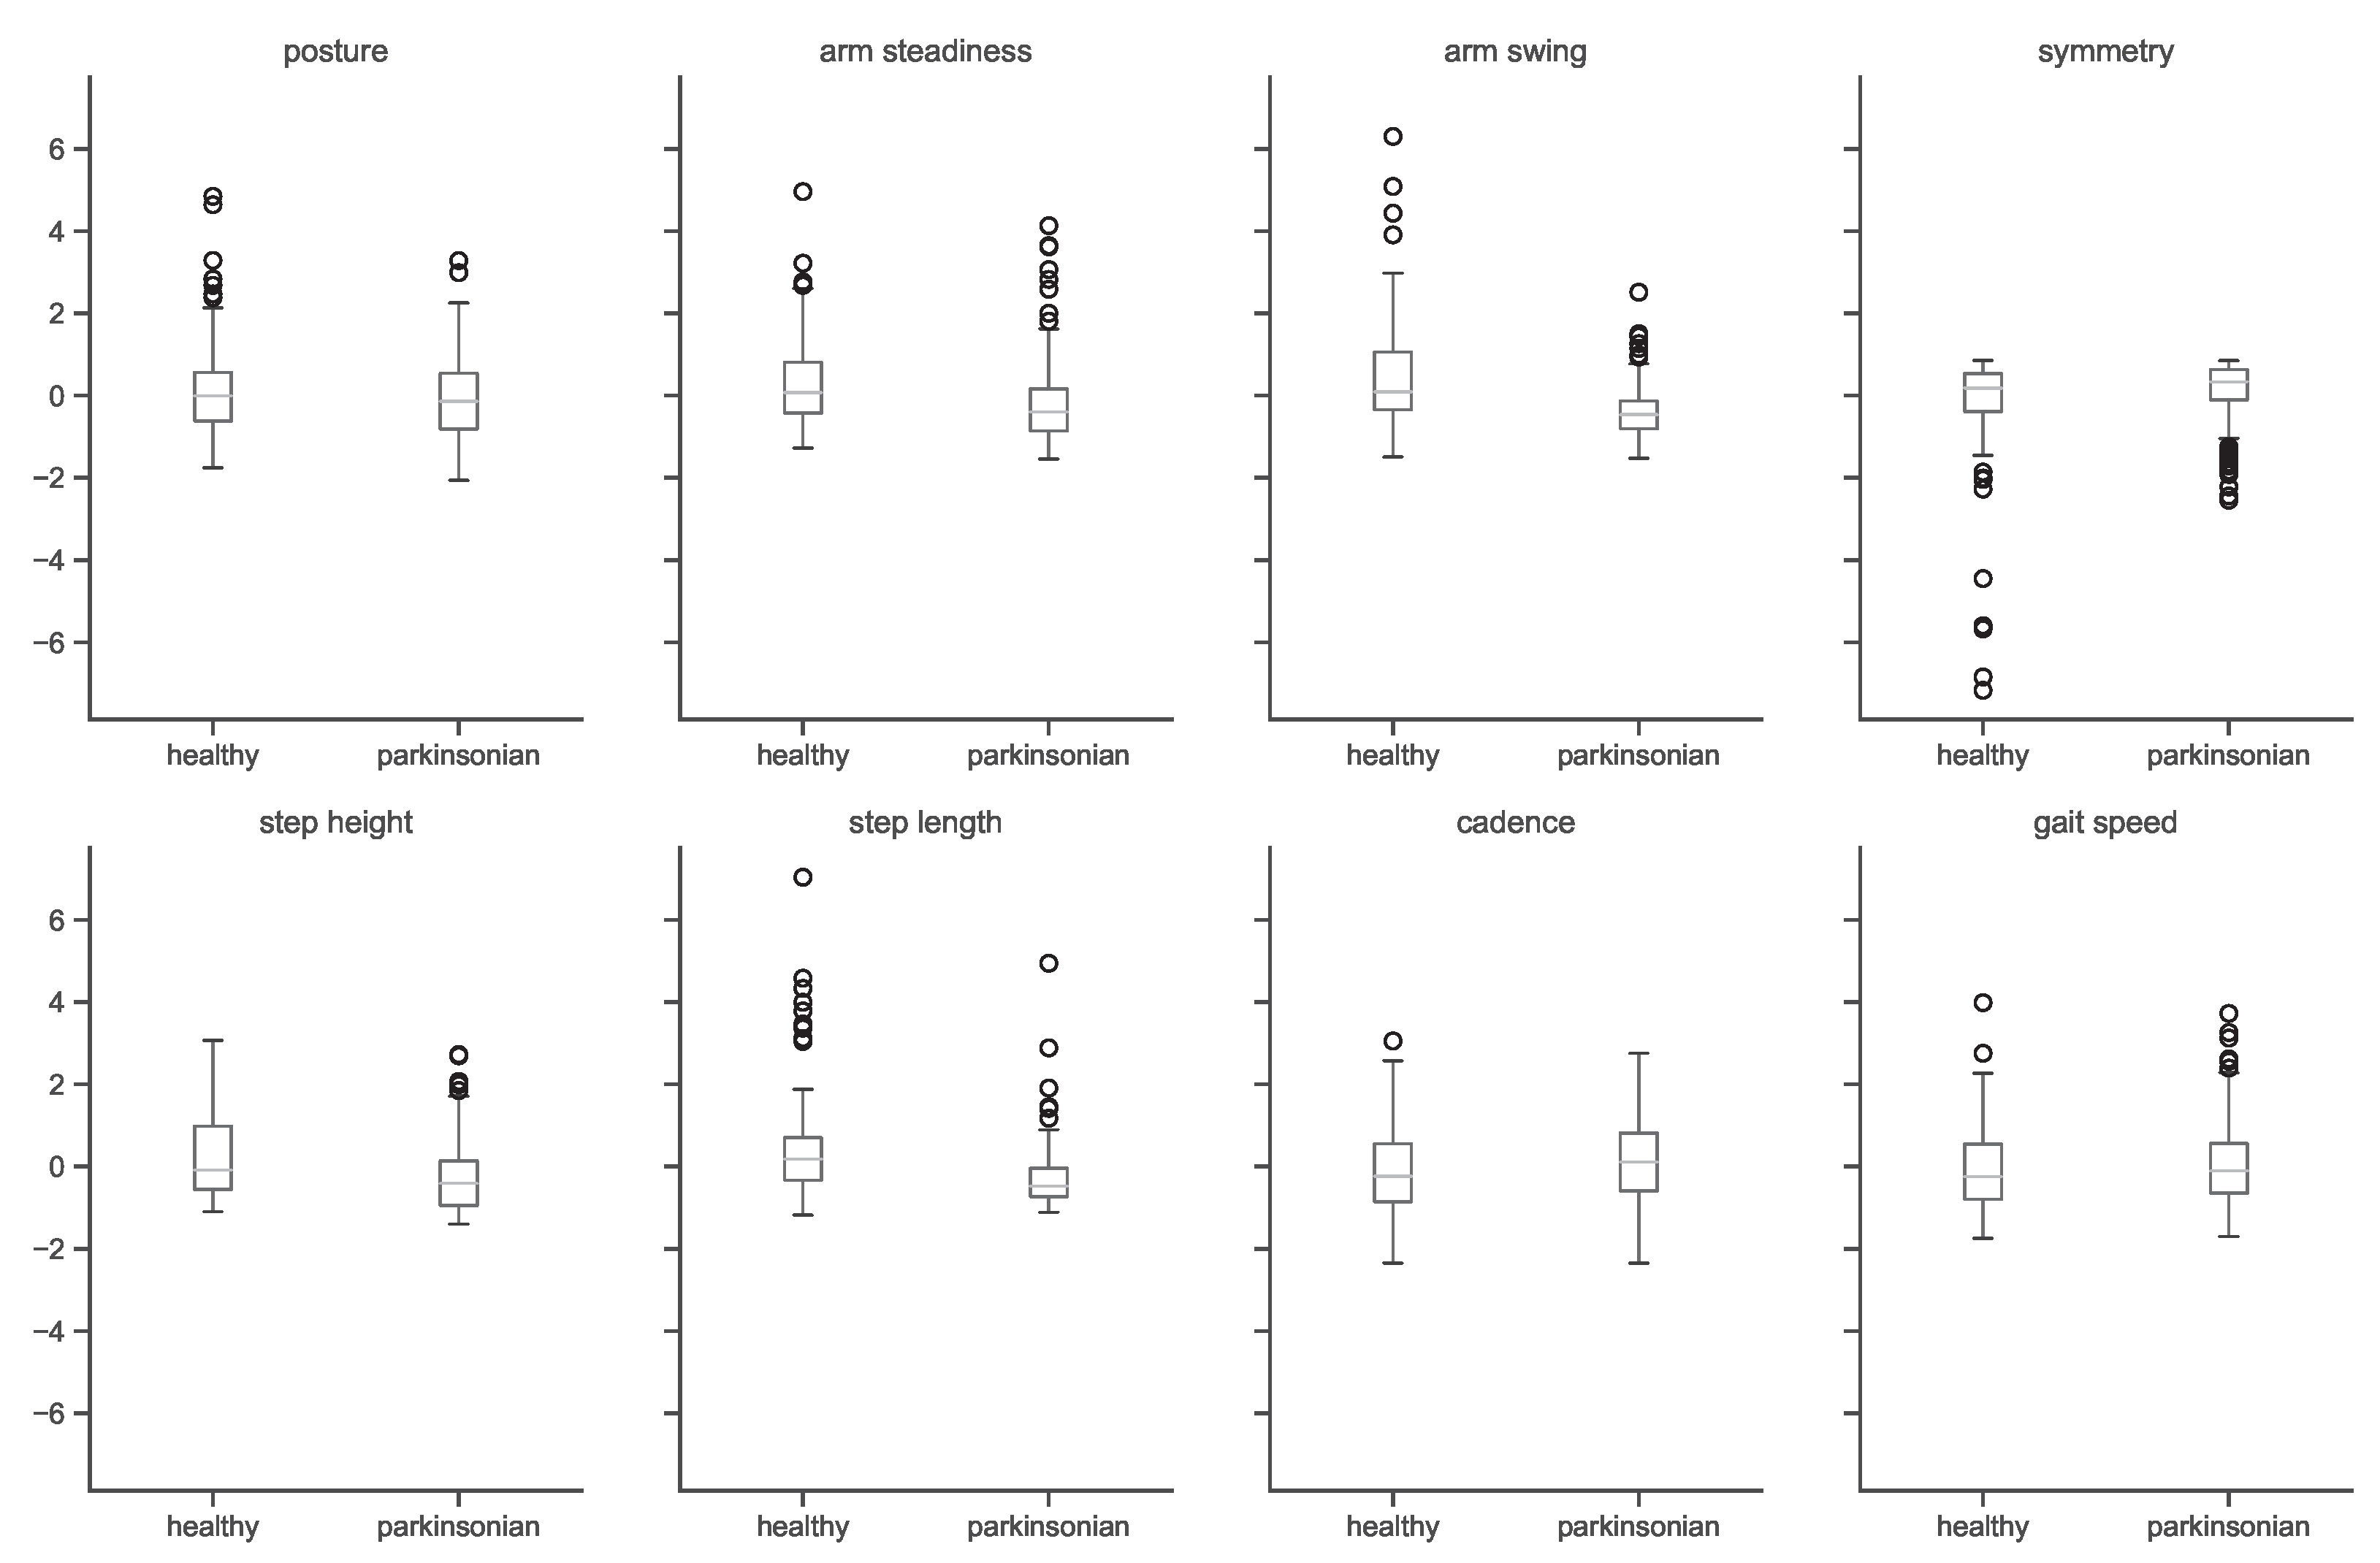
A preliminary analysis shows marked differences in the front and side views. As shown in Figure A1 and Figure A2, extracted features are more discriminative in the side view since most spatiotemporal features of gait can be more easily observed in the side view. As expected, healthy subjects seem to possess a more upright posture, as shown by the higher average distance of the nose to the feet. There is wider variation in arm steadiness of healthy subjects, most likely due to their greater arm swings. PD subject arm swings are shown to be smaller. Other features that show clear differences in the side view include the step length, cadence, and gait speed, which are greater for healthy subjects, as expected.
Figure A1.
Features analysis by class (side view).

Figure A2.
Features analysis by class (front view).

References
- Morris, M.E.; Huxham, F.; McGinley, J.; Dodd, K.; Iansek, R. The biomechanics and motor control of gait in Parkinson disease. Clin. Biomech. 2001, 16, 459–470. [Google Scholar] [CrossRef] [PubMed]
- Åström, F.; Koker, R. A parallel neural network approach to prediction of Parkinson’s Disease. Expert Syst. Appl. 2011, 38, 12470–12474. [Google Scholar] [CrossRef]
- Postuma, R.B.; Montplaisir, J. Predicting Parkinson’s disease—Why, when, and how? Park. Relat. Disord. 2009, 15, S105–S109. [Google Scholar] [CrossRef] [PubMed]
- Sadek, R.M.; Mohammed, S.A.; Abunbehan, A.R.K.; Ghattas, A.K.H.A.; Badawi, M.R.; Mortaja, M.N.; Abu-Nasser, B.S.; Abu-Naser, S.S. Parkinson’s Disease Prediction Using Artificial Neural Network. Int. J. Acad. Health Med. Res. (IJAHMR) 2019, 3, 1–8. [Google Scholar]
- di Biase, L.; Di Santo, A.; Caminiti, M.L.; De Liso, A.; Shah, S.A.; Ricci, L.; Di Lazzaro, V. Gait Analysis in Parkinson’s Disease: An Overview of the Most Accurate Markers for Diagnosis and Symptoms Monitoring. Sensors 2020, 20, 3529. [Google Scholar] [CrossRef] [PubMed]
- Aderinola, T.B.; Connie, T.; Ong, T.S.; Yau, W.C.; Teoh, A.B.J. Learning Age From Gait: A Survey. IEEE Access 2021, 9, 100352–100368. [Google Scholar] [CrossRef]
- Margiotta, N.; Avitabile, G.; Coviello, G. A wearable wireless system for gait analysis for early diagnosis of Alzheimer and Parkinson disease. In Proceedings of the 2016 5th International Conference on Electronic Devices, Systems and Applications (ICEDSA), Ras Al Khaimah, United Arab Emirates, 6–8 December 2016; pp. 1–4. [Google Scholar]
- Sivaranjini, S.; Sujatha, C.M. Deep learning based diagnosis of Parkinson’s disease using convolutional neural network. Multimed. Tools Appl. 2020, 79, 15467–15479. [Google Scholar] [CrossRef]
- Zhao, H.; Tsai, C.C.; Zhou, M.; Liu, Y.; Chen, Y.L.; Huang, F.; Lin, Y.C.; Wang, J.J. Deep learning based diagnosis of Parkinson’s Disease using diffusion magnetic resonance imaging. Brain Imaging Behav. 2022, 16, 1749–1760. [Google Scholar] [CrossRef] [PubMed]
- Oh, S.L.; Hagiwara, Y.; Raghavendra, U.; Yuvaraj, R.; Arunkumar, N.; Murugappan, M.; Acharya, U.R. A deep learning approach for Parkinson’s disease diagnosis from EEG signals. Neural Comput. Appl. 2020, 32, 10927–10933. [Google Scholar] [CrossRef]
- Aghzal, M.; Mourhir, A. Early Diagnosis of Parkinson’s Disease based on Handwritten Patterns using Deep Learning. In Proceedings of the 2020 Fourth International Conference on Intelligent Computing in Data Sciences (ICDS), Fez, Morocco, 21–23 October 2020; pp. 1–6. [Google Scholar]
- Pereira, C.R.; Weber, S.A.T.; Hook, C.; Rosa, G.H.; Papa, J.P. Deep Learning-Aided Parkinson’s Disease Diagnosis from Handwritten Dynamics. In Proceedings of the 2016 29th SIBGRAPI Conference on Graphics, Patterns and Images (SIBGRAPI), Sao Paulo, Brazil, 4–7 October 2016; pp. 340–346. [Google Scholar]
- Ali, M.R.; Myers, T.; Wagner, E.; Ratnu, H.; Dorsey, E.R.; Hoque, E. Facial expressions can detect Parkinson’s disease: Preliminary evidence from videos collected online. NPJ Digit. Med. 2021, 4, 129. [Google Scholar] [CrossRef] [PubMed]
- Bandini, A.; Orlandi, S.; Escalante, H.J.; Giovannelli, F.; Cincotta, M.; Reyes-Garcia, C.A.; Vanni, P.; Zaccara, G.; Manfredi, C. Analysis of facial expressions in parkinson’s disease through video-based automatic methods. J. Neurosci. Methods 2017, 281, 7–20. [Google Scholar] [CrossRef] [PubMed]
- Balaji, E.; Brindha, D.; Balakrishnan, R. Supervised machine learning based gait classification system for early detection and stage classification of Parkinson’s disease. Appl. Soft Comput. 2020, 94, 106494. [Google Scholar]
- Mehta, D.; Asif, U.; Hao, T.; Bilal, E.; von Cavallar, S.; Harrer, S.; Rogers, J. Towards Automated and Marker-Less Parkinson Disease Assessment: Predicting UPDRS Scores Using Sit-Stand Videos. In Proceedings of the IEEE/CVF Conference on Computer Vision and Pattern Recognition (CVPR) Workshops, Virtual, 19–25 June 2021; pp. 3841–3849. [Google Scholar]
- Ricciardi, C.; Amboni, M.; De Santis, C.; Improta, G.; Volpe, G.; Iuppariello, L.; Ricciardelli, G.; D’Addio, G.; Vitale, C.; Barone, P.; et al. Using gait analysis’ parameters to classify Parkinsonism: A data mining approach. Comput. Methods Programs Biomed. 2019, 180, 105033. [Google Scholar] [CrossRef] [PubMed]
- Williams, S.; Relton, S.D.; Fang, H.; Alty, J.; Qahwaji, R.; Graham, C.D.; Wong, D.C. Supervised classification of bradykinesia in Parkinson’s disease from smartphone videos. Artif. Intell. Med. 2020, 110, 101966. [Google Scholar] [CrossRef] [PubMed]
- Fang, H.S.; Xie, S.; Tai, Y.W.; Lu, C. RMPE: Regional Multi-person Pose Estimation. In Proceedings of the ICCV, Venice, Italy, 22–29 October 2017. [Google Scholar]
- Cao, Z.; Hidalgo Martinez, G.; Simon, T.; Wei, S.; Sheikh, Y.A. OpenPose: Realtime Multi-Person 2D Pose Estimation using Part Affinity Fields. IEEE Trans. Pattern Anal. Mach. Intell. 2021, 43, 172–186. [Google Scholar] [CrossRef] [PubMed] [Green Version]
- Nakano, N.; Sakura, T.; Ueda, K.; Omura, L.; Kimura, A.; Iino, Y.; Fukashiro, S.; Yoshioka, S. Evaluation of 3D markerless motion capture accuracy using OpenPose with multiple video cameras. Front. Sport. Act. Living 2020, 2, 50. [Google Scholar] [CrossRef] [PubMed]
Figure 1.
Overall methodology, showing the processes from video capture, human pose estimation, feature extraction, and PD prediction.
Figure 1.
Overall methodology, showing the processes from video capture, human pose estimation, feature extraction, and PD prediction.

Figure 2.
Examples of subjects in the dataset with healthy gait and PD in outdoor and indoor environments.
Figure 2.
Examples of subjects in the dataset with healthy gait and PD in outdoor and indoor environments.

Figure 3.
A 50-frame subsequence illustrating the raw and smoothened nose motion coordinates for a healthy and a Parkinsonian gait sequence. Nose X and Nose Y refer to the coordinates of the nose in the 2D plane.
Figure 3.
A 50-frame subsequence illustrating the raw and smoothened nose motion coordinates for a healthy and a Parkinsonian gait sequence. Nose X and Nose Y refer to the coordinates of the nose in the 2D plane.

Figure 4.
Estimating number of steps based on the peaks of step length. The peaks correspond to heel strikes, and counting them gives the number of steps taken by the subject in the video.
Figure 4.
Estimating number of steps based on the peaks of step length. The peaks correspond to heel strikes, and counting them gives the number of steps taken by the subject in the video.

Figure 5.
Feature selection based on 5-fold cross-validation scores. Each line represents a single run. The vertical dotted line indicates the number of features selected.
Figure 5.
Feature selection based on 5-fold cross-validation scores. Each line represents a single run. The vertical dotted line indicates the number of features selected.


Table 1.
Description of features extracted from HPE.
| Feature | Related PD Symptom | Visual Perception | Computation |
|---|---|---|---|
| posture | hunched posture | nose-to-foot distance | mean * |
| arm steadiness | arm tremors | wrist steadiness | mean * |
| arm swing | reduced arm swing | nose-to-wrist distance | mean * |
| arm swing symmetry | arm swing asymmetry | uneven arm swings | mean |
| step height | reduced step height | ankle-to-ground distance | * |
| step | reduced step length | left-to-right ankle distance | mean |
| cadence | reduced cadence | lower step frequency | (see Figure 4) |
| speed | reduced gait speed | slower movement |
Mean values are taken across F frames. * The side (left or right) closest to the camera is selected for each frame. All values are normalized with the total body height of the subject.
Table 2.
Subject distribution in the dataset.
| Total | Front View | Side View | |||
|---|---|---|---|---|---|
| Healthy | Parkinsonian | Healthy | Parkinsonian | ||
| Number of subjects | 167 | 67 | 48 | 26 | 26 |
| After augmentation | 974 | 314 | 360 | 92 | 208 |
Table 3.
Feature selection.
| Feature | Feature Ranks by View | Selected Features by View | |||||
|---|---|---|---|---|---|---|---|
| Front | Side | All | Average | Front | Side | All | |
| posture | 7 | 6 | 7 | 7 | × | ✓ | × |
| arm steadiness | 4 | 7 | 6 | 6 | ✓ | ✓ | ✓ |
| arm swing | 1 | 3 | 1 | 2 | ✓ | ✓ | ✓ |
| arm swing symmetry | 5 | 8 | 5 | 6 | × | × | × |
| step height | 3 | 4 | 3 | 3 | ✓ | ✓ | ✓ |
| step length | 2 | 2 | 2 | 2 | ✓ | ✓ | ✓ |
| cadence | 8 | 5 | 8 | 7 | × | ✓ | × |
| gait speed | 6 | 1 | 4 | 4 | ✓ | ✓ | ✓ |
| number of selected features | 5 | 7 | 5 | ||||
Table 4.
Results summary of PD prediction.
| View | Train/Test | Features | Smooth | Acc | Healthy | Parkinsonian | ||||
|---|---|---|---|---|---|---|---|---|---|---|
| Precision | Recall | F1-Score | Precision | Recall | F1-Score | |||||
| 8 | × | 95% | 0.95 | 0.95 | 0.95 | 0.95 | 0.95 | 0.95 | ||
| Front | 505/169 | 8 | ✓ | 95% | 0.95 | 0.95 | 0.95 | 0.95 | 0.95 | 0.95 |
| 5 | × | 95% | 0.95 | 0.95 | 0.95 | 0.95 | 0.95 | 0.95 | ||
| 8 | × | 97% | 1.00 | 0.92 | 0.96 | 0.96 | 1.00 | 0.98 | ||
| Side | 225/75 | 8 | ✓ | 97% | 1.00 | 0.92 | 0.96 | 0.96 | 1.00 | 0.98 |
| 7 | × | 97% | 1.00 | 0.92 | 0.96 | 0.96 | 1.00 | 0.98 | ||
| 8 | × | 92% | 0.88 | 0.92 | 0.90 | 0.94 | 0.92 | 0.93 | ||
| All | 730/244 | 8 | ✓ | 93% | 0.90 | 0.94 | 0.92 | 0.96 | 0.93 | 0.94 |
| 5 | × | 93% | 0.88 | 0.94 | 0.91 | 0.96 | 0.92 | 0.94 | ||
Publisher’s Note: MDPI stays neutral with regard to jurisdictional claims in published maps and institutional affiliations. |
© 2022 by the authors. Licensee MDPI, Basel, Switzerland. This article is an open access article distributed under the terms and conditions of the Creative Commons Attribution (CC BY) license (https://creativecommons.org/licenses/by/4.0/).
Share and Cite
MDPI and ACS Style
Connie, T.; Aderinola, T.B.; Ong, T.S.; Goh, M.K.O.; Erfianto, B.; Purnama, B. Pose-Based Gait Analysis for Diagnosis of Parkinson’s Disease. Algorithms 2022, 15, 474. https://doi.org/10.3390/a15120474
AMA Style
Connie T, Aderinola TB, Ong TS, Goh MKO, Erfianto B, Purnama B. Pose-Based Gait Analysis for Diagnosis of Parkinson’s Disease. Algorithms. 2022; 15(12):474. https://doi.org/10.3390/a15120474
Chicago/Turabian StyleConnie, Tee, Timilehin B. Aderinola, Thian Song Ong, Michael Kah Ong Goh, Bayu Erfianto, and Bedy Purnama. 2022. "Pose-Based Gait Analysis for Diagnosis of Parkinson’s Disease" Algorithms 15, no. 12: 474. https://doi.org/10.3390/a15120474
Note that from the first issue of 2016, this journal uses article numbers instead of page numbers. See further details here.