 Jamaica Briones1
 Yi Wang1*
 Juthamas Prawjaeng2Hwee Lin Wee1Angela Kairu3Stacey Orangi3Edwine Barasa3,4
 Yot Teerawattananon1,2
- 1Saw Swee Hock School of Public Health, National University of Singapore, Singapore, Singapore
- 2Health Intervention and Technology Assessment Program, Ministry of Public Health, Nonthaburi, Thailand
- 3Health Economics Research Unit, KEMRI-Wellcome Trust Research Programme Nairobi, Nairobi, Kenya
- 4Centre for Tropical Medicine and Global Health, Nuffield Department of Medicine, Medical Sciences Division, University of Oxford, Oxford, United Kingdom
Objective: To estimate the economic impact of border closure and social distancing by estimating the decline of gross domestic product (GDP) in Kenya, Singapore and Thailand.
Methods: We analysed secondary data retrospectively. To calculate impact of NPIs on GDP, the relationship between GDP and stock market index was examined using ordinary least squares (OLS). Then, autoregressive and moving averages (ARMA) model was used to examine the impact of NPI on stock market index. The change in GDP due to NPIs was derived by multiplying coefficients of OLS and ARMA models.
Results: An increase in stock market index correlated with an increase in GDP, while both social distancing and border closure negatively correlated with stock market index. Implementation of NPIs correlated with the decline in GDP. Thai border closure had a greater decline in GDP than social distancing; Kenya exhibited the same trends; Singapore had the opposite trend.
Conclusion: We quantified the magnitude of economic impact of NPIs in terms of GDP decline by linking stock market index and GDP. This approach may be applicable in other settings.
Introduction
While implementing non-pharmaceutical interventions (NPIs) for pandemic control has proven effective in reducing COVID-19 transmission, these interventions come with a high economic cost, especially those which involve movement restrictions such as social distancing and border closure [1]. According to the World Bank, global GDP dropped by 4.3% in 2020, which was largely attributed to the necessary halting of economic productivity [2]. As COVID-19 moves into an endemic status, governments will constantly have to calibrate reinstating or relaxing movement restriction measures, to attempt a balance between public health gains and economic losses [3, 4].
There is already considerable literature employing various time-series regression techniques to examine the relationship of NPIs with proxy economic indicators. One study demonstrated that high-frequency electricity market data can be used to estimate the causal, short-run impact of COVID-19 on the economy [5]. Other studies examined the effects of NPIs on stock market returns, albeit with conflicting results [1, 6–9]. Two studies reported that NPIs had a positive effect on stock market returns [7, 8], while two suggested that NPIs had a negative effect on stock market returns [6, 9]. It is worth noting that some of these studies suggest that government stimulus packages increase investor confidence, which reduces the negative economic effects of the pandemic [1, 9].
These existing studies, however, focused on stock market performance and had not directly quantified the economic losses caused by NPIs during COVID-19. Some studies which employed the human capital-based approach calculated the loss of productivity due to COVID-19, but did not consider that other economic players will adjust over time [10–12]. This study fills this gap by examining the correlation of GDP with the stock market index by using stock market index as an intermediate outcome to link effects of NPIs to GDP, using time-series regression techniques. We examined three countries with various economic development: Kenya, a lower-middle-income country; Singapore, a high-income country; Thailand, an upper-middle-income country.
This study contributes to the growing literature by providing quantitative insights into the effects of NPIs on the economy, using a novel method that can be applied in various settings. This approach can be a quick way to estimate the cost of NPIs, which can be used by policymakers to gauge the magnitude of the trade-off between economic losses and public health gains. Estimates from this paper may also be used as inputs in economic evaluations to identify optimal COVID-19 responses which can produce the greatest health and economic outcomes.
Methods
Our main objective is to determine the effect of NPIs involving movement restrictions, particularly border closure and social distancing, on the GDP in three countries: Kenya, Singapore and Thailand. However ideal, estimating the effects of NPI through GDP directly is prohibitive due to the lack of granularity of data, given that GDP data are reported every quarter. We, therefore, hypothesized that stock market index—which has high-frequency data available—can serve as an intermediate outcome to infer the effects of NPIs on GDP (Figure 1).
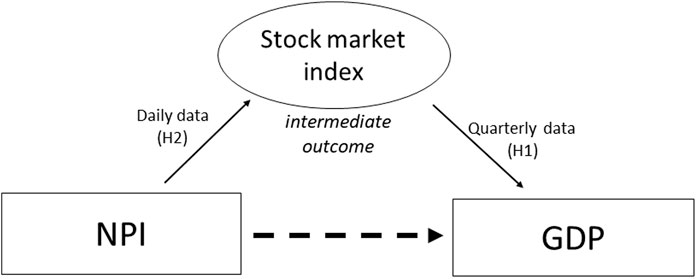
FIGURE 1. Linking NPI to GDP through stock market index (A data-driven analysis of the economic cost of Non-Pharmaceutical Interventions: A cross-country comparison of Kenya, Singapore and Thailand; Kenya, Singapore and Thailand; 2022).
Hypothesis 1 (H1). GDP and stock market indexWe hypothesized a positive association between GDP and stock market index to determine whether stock market index can be a predictor of economic activity using quarterly data. We assume that stock market indices can reflect future expected economic outcomes, as they are made up of an aggregated measure of investment performance and can serve as a sentiment indicator that may reflect on the expected economy [1, 13–15].
Hypothesis 2 (H2). Stock market index and NPI introductionUsing high-frequency stock market data indices as dependent variables, we hypothesized that border closure and social distancing have a negative direct impact and positive indirect impact on the stock market [1]. For the direct effects, border closure and social distancing could have a negative effect on the stock market by adversely affecting economic activity. On the other hand, NPIs could have a positive indirect impact by weakening the negative market reaction to the growth in COVID-19 confirmed cases, if strict government actions reduce the intensity of local outbreaks. To highlight, the focus of this study is on the direct impact, through the reduction of economic activities.This study originally intended to explore the effects of NPI on the sector-specific economy. However, given the limited publicly available data, we were only able to conduct such analysis for Thailand. Applying the same method as examining the overall GDP, we further examined the impact of NPI on sub-sector GDP to understand the validity of results using the sector-specific data. We hypothesize that industries such as tourism, transportation, consumer, construction, professional service, real estate, and finance will be affected more compared to industries such as health, agriculture, technology and electricity.
Data
Gross Domestic Product
Data for GDP were retrieved from respective government websites of the three countries. Quarterly historical values were publicly available from 2000 to 2020 for Singapore and Thailand, while data from 2009 to 2020 were publicly available for Kenya. Real GDP (i.e., inflation-adjusted) was used in the analysis. Nominal GDP was multiplied to the GDP deflator for Singapore and Kenya to calculate the real GDP. For Thailand, the GDP chain dollar value was used since the GDP deflator was not available.
Stock Market Indices
Stock market indices used were Straits Times Index (STI), the market capitalisation weighted index of the top 30 companies listed on Singapore Exchange [16]; Stock Exchange of Thailand (SET) Index, comprising the prices of all common stocks on the main board of the SET for Thailand; and Nairobi Securities Exchange (NSE) 20, the weighted index of the top 20 companies listed on NSE for Kenya. These were selected since they were considered as the major stock market indices per country.
For H1, quarterly-average value of stock index was derived using the closing value of the stock market index. We chose the closing value for standardization since the stock market fluctuates significantly within a day. Meanwhile for H2, stock market index data closing values were also used and data were collected from Nov 2019 to Nov 2020. To identify the impact of the NPIs, dummy variables were generated (i.e., values as 0 before policy announcement, and 1 from day one of policy announcement). Announcement dates were used to consider anticipatory behaviours and were verified from official government websites [17–19].
Non-Pharmaceutical Intervention
We focused on NPIs related to movement restriction, specifically border closure and social distancing based on the Oxford COVID-19 Government Response Tracker (OxCGRT) [20]. Specifically, we aimed to understand the impacts of domestic movement restriction and international movement restriction. Given the difficulty to disentangle the effects of some NPIs since they were announced around the same time, i.e., multicollinearity issue, OxCGRT policy indicators that were similar in nature and implemented at the same time were combined and represented as a binary variable (Supplementary File S1). To classify the NPIs, we defined border closure as policy announcement of international movement restrictions, while social distancing as domestic movement restrictions. For domestic movement restrictions, we combined announcement of policies of (i) school closure, (ii) work closure, or (iii) restrictions in gathering. We further assumed that introducing and relaxing the NPIs have a symmetric effect on the GDP.
Confounders
Stock market indices are not only influenced by NPIs but also by other factors that can affect investors’ confidence and pandemic perception [1]. We included confounders to reflect local COVID-19 situation, other local policies besides the social distancing and border closure, global COVID-19 conditions and global economic conditions. Confounders listed below were considered in the H2 model, details of which can be found in Supplementary Table S1.
(a) COVID-19 related variables such as the daily number of global and local COVID-19 cases were used to reflect local COVID-19 situation [21]. NPIs might also have a positive economic impact with the reduction of the global and local COVID-19 cases since studies showed the growth in COVID-19 confirmed cases may be correlated with negative stock market returns [1, 22]. The indirect impact of these two confounders was incorporated using interaction terms in the Thailand model. A positive value for the estimated interaction term reflects the weakened negative market reaction to the growth in COVID-19 confirmed cases due to the NPIs.
(b) Weekly news trend using “coronavirus” term from Google trends was used as a gauge of public sentiment and panic due to the pandemic [23, 24]. These was considered as a continuous variable using Google search volume activity for the week [25].
(c) Dow Jones Index, oil and gold prices were used to control how the local stock market reacts to the global economic status [26]. These variables served as a measure of liquidity and stability which tend to deteriorate under shocks such as pandemics [6, 23]. These confounders were considered as continuous variables and were retrieved from Yahoo Finance.
(d) Availability of fiscal stimulus package were considered since investors may react positively to economic support programs since these programs may offset the negative effects of the NPIs [1, 9]. These were considered as binary variable for each respective country [1, 9, 20].
Analytical Framework
Step 1. Estimating relationship between GDP and stock market index (H1)Ordinary least squares (OLS) method was used to determine the relationship between GDP and stock market index (Figure 2). The regression model has the following form:
where GDP refers to real GDP to adjust for inflation, and stocks refers to the mean stock market index for the lagged quarter; Q2 to Q4 are dummy variables indicating quarters within a calendar year (Q1 as an index category), and d1 indicates first difference.For both GDP and stock market index, first difference was applied, e.g.,
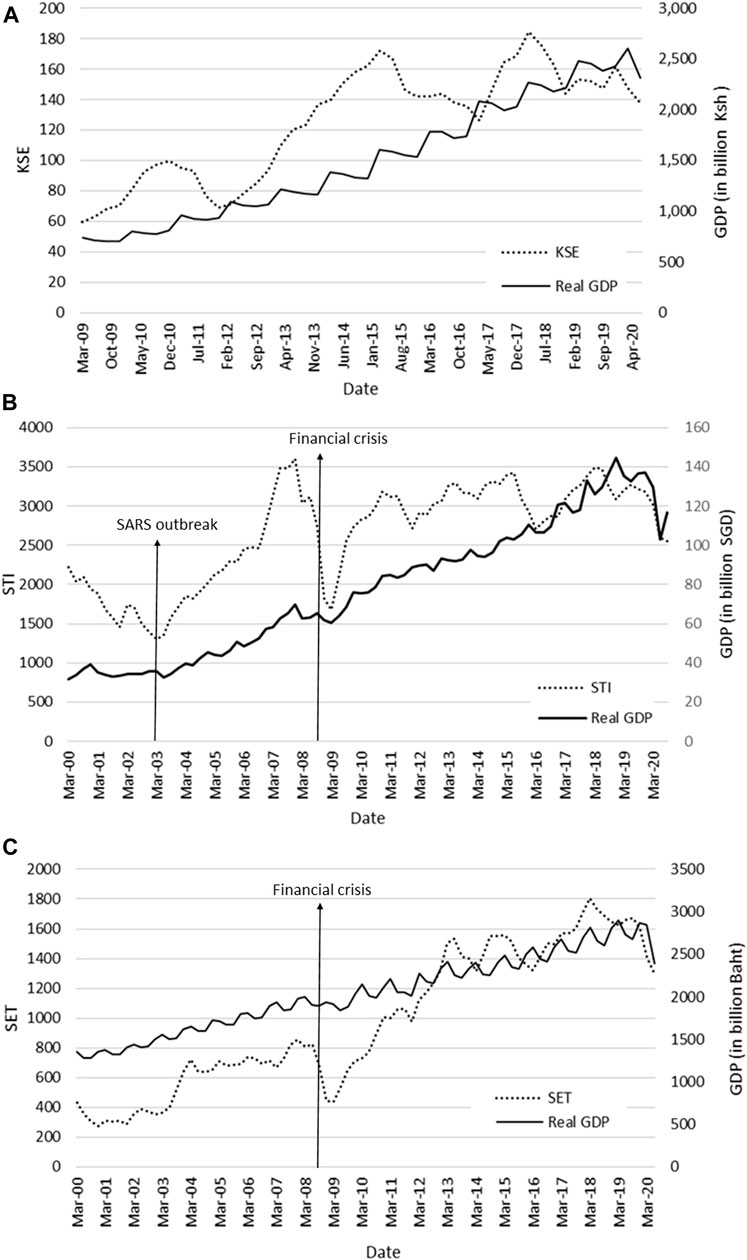
FIGURE 2. Quarterly GDP and stock market index plotted against time for Kenya (A), Singapore (B), and Thailand (C) (A data-driven analysis of the economic cost of Non-Pharmaceutical Interventions: A cross-country comparison of Kenya, Singapore and Thailand; Kenya, Singapore and Thailand; 2022).
Step 2. Estimating the relationship between NPIs and stock market index (H2)For H2, we examined the impact of social distancing and border closure on the stock market index using daily data. The analysis resembles a before and after comparison, taking also into consideration the time-series nature of the stock market index by using an Autoregressive Integrated Moving Average (ARMA) model (Eq. 2):
where
where
Step 3. Estimating the change in GDP due to NPIsThe magnitude of change to the GDP was represented through the percentage reduction to GDP after announcement of each of the NPIs. Three methods were used to calculate the impact of NPI on GDP. Results using GDP and stock market index in log-scale were presented in the main text, while the methods and results using two methods in the original scale were presented in the Supplementary File. To estimate the change in GDP due to NPIs, we estimated the correlation between real GDP and stock market index, which is
Results
An increase in stock market index correlated with an increase in GDP across the countries examined for H1. The coefficient values derived were 0.066 (95% CI: −0.0093–0.142) for Kenya, 0.126 (95% CI: 0.00926–0.243) for Singapore and 0.083 (95% CI: 0.0298–0.136) for Thailand. Although only Singapore and Thailand resulted in a significant value (p < 0.05), we observed that the magnitude of correlation increased depending on the level of economic development of the country. In terms of the time-series graph, there is a general uptrend with the GDP in relation to stock market indices for the countries explored (Figure 2).
Meanwhile, regression results of H2 models showed that both social distancing and border closure negatively correlated with stock market index (Table 1). While the effects were not all statistically significant, there is a general pattern of decreasing stock market index when the NPIs were announced. The time-series graphs show the timeline of NPI announcement along with stock market index (Figure 3). As illustrated in the figure, there was a sharp decline in stock market index when the NPIs were announced [27]. To note, border closure was not lifted in the three countries during the period of analysis. On the other hand, social distancing was only implemented for specific periods for Thailand (March—July 2020) and Kenya (March 2020—September 2020), while social distancing was not lifted in Singapore since implementation from March 2020.
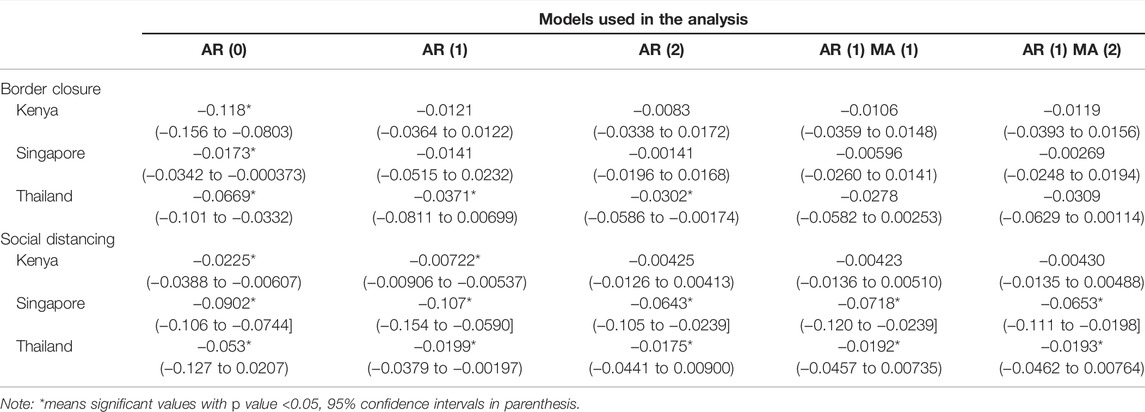
TABLE 1. Resulting coefficients for H2 model (A data-driven analysis of the economic cost of Non-Pharmaceutical Interventions: A cross-country comparison of Kenya, Singapore and Thailand, Singapore and Thailand; 2022).
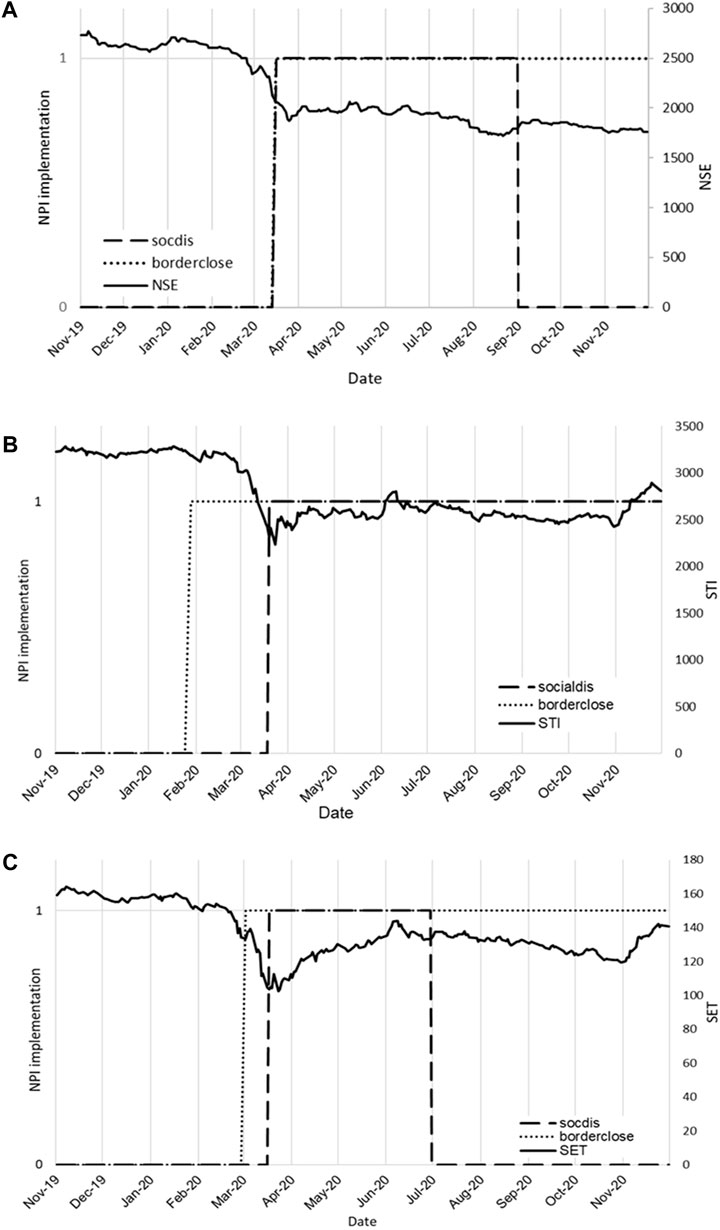
FIGURE 3. Daily stock market index plotted with timeline of NPI implementation (1: NPI present, 0: NPI absent) for Kenya (A), Singapore (B) and Thailand (C) (A data-driven analysis of the economic cost of Non-Pharmaceutical Interventions: A cross-country comparison of Kenya, Singapore and Thailand; Kenya, Singapore and Thailand; 2022).
For the final results, we observed an evident pattern of GDP decrease upon NPI announcement in the three countries examined (Table 2). In Thailand, a higher GDP decline was correlated with border closure (0.23%–0.56%), compared with social distancing (0.15%–0.44%). This pattern was similarly found in Kenya, with a higher GDP decline correlated with border closure (0.05%–0.785%), compared with social distancing (0.03%–0.15%). However in Singapore, a greater GDP decline was correlated with social distancing (0.81%–1.35%), compared with border closure (0.02%–0.22%).
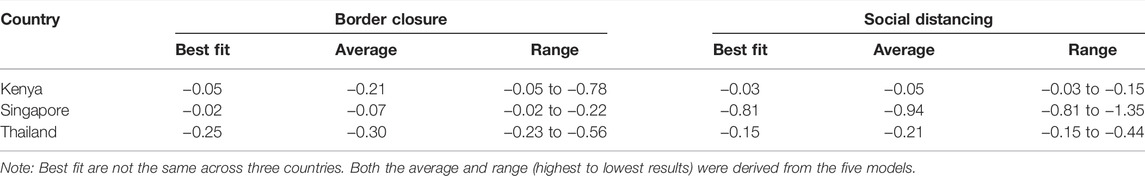
TABLE 2. Estimated GDP reduction for border closure and social distancing, in percentage (A data−driven analysis of the economic cost of Non−Pharmaceutical Interventions: A cross-country comparison of Kenya, Singapore and Thailand; Kenya, Singapore and Thailand; 2022).
For sector-specific results in Thailand, sectors such as tourism, professional services, consumer, transportation, real estate, and construction were found negatively correlated with both border closures and social distancing (Table 3). As expected, labour-intensive and domestically-oriented sectors such as construction, consumer, professional services, and real estate, as well as outward-oriented sectors such as tourism and transportation had a greater decline in GDP caused by the movement restrictions [28, 29]. On the other hand, sectors such as agricultural, technology, and health were seen unaffected by the announcement of NPIs. This may be the case since these sectors were less exposed to movement restrictions, and had outputs driven by domestic demand [29, 30].
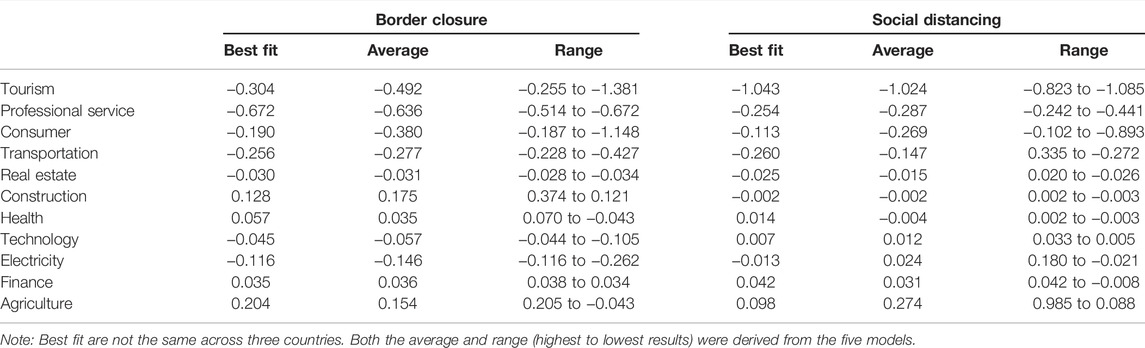
TABLE 3. Estimated Sector GDP reduction for border closure and social distancing for Thailand, in percentage (A data-driven analysis of the economic cost of Non-Pharmaceutical Interventions: A cross-country comparison of Kenya, Singapore and Thailand; Kenya, Singapore and Thailand; 2022).
Discussion
How do we balance the need to control the pandemic with the need to sustain the economy? In this paper, we addressed this policy question indirectly by estimating the economic consequences of NPIs so that policymakers may reflect on their trade-offs, particularly for countries that are pursuing a zero COVID-19 policy. Data from three countries with different cultures, socioeconomic structures, and income levels were examined. We focused on two NPI categories involving movement restrictions—internal restrictions for social distancing and external restrictions for border closure.
We observed that the two NPI strategies differ in impact depending on the country. Specifically, border closure contributed to a greater GDP decline than social distancing for both Thailand and Kenya, while the opposite was observed in Singapore. The differences may be due to the level of strictness of the NPIs depending on the country. However, most governments had implemented strict containment policies on the first year of the pandemic as a general response [31, 32]. Countries should select NPIs that have a minimal impact on the economy as a way to contextualize the implementation of NPIs based on relevant economic considerations [32, 33].
Quite striking perhaps in our results was the low GDP reduction due to NPIs for all the countries explored. In 2020, the actual GDP contraction of Singapore was 5.8%, while Thailand’s GDP fell by 6.1%, and Kenya’s stood at 0.3% [34]. However small, this is aligned with the results of a study in Denmark and Sweden, where they suggest that social distancing laws cause only small losses of economic activity during the COVID-19 pandemic, and suggest that most of the GDP contraction is due to the virus itself [27]. Further, poor compliance with the mandated policies could also contribute to the small economic impact [35].
The difference in the impact of NPI on economic cost may be explained by the unique economic landscape of the country, as well as other NPIs implemented during the pandemic. The outward-oriented economies of Thailand may be the reason why the external-induced shock had a greater effect than the internal-induced shock, due to their dependence on sectors with heavy external demands such as tourism and transportation [36]. As a global trade and business hub, we expected Singapore would follow the same trend, however, our findings showed otherwise. A possible reason is that businesses in Singapore pivoted rapidly to digitalization and introduced products and services that suited pandemic times [37, 38]. In contrast, Kenya and Thailand heavily depend on manufacturing and agriculture, which are both highly vulnerable to disruptions in supply chains, and are more difficult to digitalize [39, 40].
We provided an opportunity to demonstrate the relationship between changes in actual GDP and specific NPI as an advantage to our statistical approach. A reduced-form analysis, using regression analysis guided by economic theory, was used to examine the impact of NPI on GPD. This served as a simple framework to calculate the cost of a particular or group of NPIs that can be easily applied to other settings. While using stock market index may arguably add some noise, most macroeconomic data are only available at low frequency making it difficult to predict developments early and reliably. For our first hypothesis, we examined the correlation between GDP and stock market index to demonstrate the reliability of using stock market index as an intermediate variable. Additionally, relevant confounders were added in the second hypothesis to address biases [41].
We explored several methods and robustness analyses to understand the magnitude of the impacts of NPIs on GDP, since it is difficult to ascertain whether upper or lower bounds were estimated. It is understood that not all aspects of the economy (GDP) are reflected by stock market indices. It may be the case in Kenya, where the stock market is less developed and an underestimation may occur. On the other hand, the economy corrects itself over time and people adjust. The cost of NPIs could decrease over time, which may result in an overestimation if we consider mid-term or long-term impact. Furthermore, other factors that impact economic growth such as natural and human resources, and technological advancement were also not incorporated in the model. These factors are important to consider if a longer time horizon was considered. Recognizing the complex context, we presented our main results in a range, which gives an estimate of the magnitude of the cost of NPIs.
Limitations
One challenge was multicollinearity issues, with two NPIs being implemented almost simultaneously across the countries evaluated [7]. In general, we would expect that multicollinearity will lead to larger standard errors but would generate unbiased and consistent point estimates. For the case of Kenya, although the two NPIs start precisely at the same time, the date of relaxing the policy was different. Hence, we can still separately estimate the impacts of two NPIs on stock market index. An additional assumption required is that introducing and relaxing the NPI have a symmetric effect on GDP. Still, the proposed approach should be considered carefully depending on the implementation dates of the NPIs per country to determine the possibility of disentangling or further bundling them together. Further, we tried to address multicollinearity by combining related variables that are similar and are implemented around the same time, i.e., combining school closure, workplace closure, and restriction in gathering into domestic movement restriction [31]. While it is useful to further investigate the cost due to each policy, this is not feasible in the current study. In particular for school closure, there could be long-term cost due to a disruption of normal schooling as this may affect children’s productivity when they turning to adults.
Given the limitations of our data, our results must be viewed with caution as we acknowledge that our adjustments may not be adequate. The relationship between GDP and stock market index remains contentious and complicated, with all the exogenous variables [15]. Other important factors contribute to the GDP that are not captured with stock market index we used which can be an added reason for a low magnitude of impact for NPIs in our results. Different players and factors may move in different directions. Hence, we also explored the subsector stock market index but only for Thailand due to data availability. In terms of disruptive behaviour and economic stresses, for example, numerous players in the economic system such as households, private companies, and governments respond in various ways to NPIs [42]. Other important factors to consider are simultaneous public panic, and aversive travel behaviour [42].
Adding to the limitation of using stock market index as an intermediate variable, stock market index is more volatile in the short run than the GDP. In ideal circumstances, an indicator that can address these issues should be used, but due to the lack of granularity in GDP data, we chose stock market index instead. Furthermore, the relationship between GDP and stock market index changed in response to the current pandemic. Economic players would respond to the pandemic as people voluntarily reduce their social activities [27]. Hence, the long-term impact might be less pronounced compared to the short-run impact.
In this work, we do not claim our results are causal impact, as causal impact will require randomized control trial which is not possible for this study, or require econometric identification strategies which may not be easily replicable in another setting. Given the complicated nature of the problem, we did not attempt to incorporate these into the model as it may take years to build a model that fully captures the interaction of the various players in the economy. Our analysis is a reduce-form analysis aiming to overcome the data issue, i.e., lack of granularity of GDP data, by using stock market index as an intermediate variable. This study serves as a stepping stone towards these more complex studies.
However, it does not mean that we should not attempt to measure these, but we have to be far more cautious on how we interpret the results [43]. We aim to provide a reasonable estimate or at best, a measure of the magnitude of effect of a particular set of or all NPIs on the economy. The method can help policymakers understand the associated cost and make more informed decisions in response to a public health emergency. This work illustrates why it is prudent to constantly re-assess and re-evaluate policies to build a suitable strategy and prevent curtailment of living standards for too long.
Conclusion
This study presents a novel approach by using stock market index as a proxy for economic activity and as an intermediate outcome to link NPIs with GDP change. By employing time series regression techniques, we illustrate that NPIs correlates to GDP decline. Depending on the country, the magnitude of effect of the two NPIs examined differ accordingly. Specifically, it was observed that border closure is correlated with higher magnitude of economic downturn compared with social distancing in Thailand and Kenya, and the opposite was seen in Singapore.
To our knowledge, this is the first paper to correlate the effects of NPIs to GDP change. Future research avenues may consider re-evaluating NPI consequences at this present time when COVID-19 vaccines are already administered. Furthermore, examining economic response to NPIs in other country settings would offer insights for further analysis.
Author Contributions
JB: Methodology, data collection, analysis, writing. YW: Conceptualization, methodology, analysis, writing. JP, AK, SO, and EB: Data collection, analysis. HW: Conceptualization, methodology, writing, supervision. YT: Conceptualization, methodology, writing, supervision. All authors have agreed and approved the author’s contribution and final manuscript.
Funding
This work is jointly supported by the International Decision Support Initiative (iDSI), which aims to provide technical assistance on health intervention and technology assessment to governments in low- and middle-income countries; and Thailand’s Health Systems Research Institute (HSRI), for research collaborations on infectious diseases in Southeast Asia. The Health Intervention and Technology Assessment Program (HITAP), the Saw Swee Hock School of Public Health, National University of Singapore and the KEMRI Wellcome Trust Research Programme (KWTRP) are part of the iDSI which is funded by the Bill & Melinda Gates Foundation (OPP1202541), the UK’s Department for International Development, and the Rockefeller Foundation. HITAP is a semi-autonomous research unit in the Ministry of Public Health, Thailand, that supports evidence-informed priority-setting and decision-making for healthcare.
Author Disclaimer
The findings, interpretations and conclusions expressed in this article do not necessarily reflect the views of the funding agencies.
Conflict of Interest
The authors declare that the research was conducted in the absence of any commercial or financial relationships that could be construed as a potential conflict of interest.
Supplementary Material
The Supplementary Material for this article can be found online at: https://www.ssph-journal.org/articles/10.3389/ijph.2022.1604854/full#supplementary-material
References
1. Ashraf, BN. Economic Impact of Government Interventions during the COVID-19 Pandemic: International Evidence from Financial Markets. J Behav Exp Finance (2020) 27:100371. doi:10.1016/j.jbef.2020.100371
2. World Bank, . Global Economy to Expand by 4% in 2021; Vaccine Deployment and Investment Key to Sustaining the Recovery. [Press Release] (2021).
3. Alfano, V, and Ercolano, S. The Efficacy of Lockdown against COVID-19: A Cross-Country Panel Analysis. Appl Health Econ Health Pol (2020) 18(4):509–17. doi:10.1007/s40258-020-00596-3
4. Singh, S, Shaikh, M, Hauck, K, and Miraldo, M. Impacts of Introducing and Lifting Nonpharmaceutical Interventions on COVID-19 Daily Growth Rate and Compliance in the United States. Proc Natl Acad Sci U S A (2021) 118(12):1–9. doi:10.1073/pnas.2021359118
5. Fezzi, C, and Fanghella, V. Real-Time Estimation of the Short-Run Impact of COVID-19 on Economic Activity Using Electricity Market Data. Environ Resour Econ (Dordr) (2020) 76:1–16. doi:10.1007/s10640-020-00467-4
6. Hong, H, Bian, Z, and Lee, C-C. COVID-19 and Instability of Stock Market Performance: Evidence from the U.S. Financ Innov (2021) 7(1):12. doi:10.1186/s40854-021-00229-1
7. Narayan, PK, Phan, DHB, and Liu, G. COVID-19 Lockdowns, Stimulus Packages, Travel Bans, and Stock Returns. Finance Res Lett (2021) 38:101732. doi:10.1016/j.frl.2020.101732
8. Lee, C-C, and Chen, M-P. The Impact of COVID-19 on the Travel and Leisure Industry Returns: Some International Evidence. Tourism Econ (2020) 28(2):451–72. doi:10.1177/1354816620971981
9. Topcu, M, and Gulal, OS. The Impact of COVID-19 on Emerging Stock Markets. Finance Res Lett (2020) 36:101691. doi:10.1016/j.frl.2020.101691
10. Zhao, J, Jin, H, Li, X, Jia, J, Zhang, C, Zhao, H, et al. Disease Burden Attributable to the First Wave of COVID-19 in China and the Effect of Timing on the Cost-Effectiveness of Movement Restriction Policies. Value Health (2021) 24(5):615–24. doi:10.1016/j.jval.2020.12.009
11. Jin, H, Wang, H, Li, X, Zheng, W, Ye, S, Zhang, S, et al. Economic burden of COVID-19, China, January-March, 2020: A Cost-Of-Illness Study. Bull World Health Organ (2021) 99(2):112–24. doi:10.2471/blt.20.267112
12. Sandmann, FG, Davies, NG, Vassall, A, Edmunds, WJ, Jit, M, Sun, FY, et al. The Potential Health and Economic Value of SARS-CoV-2 Vaccination Alongside Physical Distancing in the UK: A Transmission Model-Based Future Scenario Analysis and Economic Evaluation. Lancet Infect Dis (2021) 21(7):962–74. doi:10.1016/s1473-3099(21)00079-7
13. Wagner, AF. What the Stock Market Tells Us about the post-COVID-19 World. Nat Hum Behav (2020) 4(5):440. doi:10.1038/s41562-020-0869-y
14. Liu, T, Nakajima, T, and Hamori, S. The Impact of Economic Uncertainty Caused by COVID-19 on Renewable Energy Stocks. Empir Econ (2021) 62:1–21. doi:10.1007/s00181-021-02087-3
15. Sandte, H. Stock Markets vs GDP Growth: A Complicated Mixture (2012). Available from: https://www.bnymellonam.jp/wordpress/wp-content/uploads/2012_024_e_WLBStock.pdf.
16.Straits Times Index (STI). Singapore Exchange. [Internet] (2021). Available from: https://www.sgx.com/indices/products/sti.
18. Cuadrado, C, Dunstan, J, Silva-Illanes, N, Mirelman, AJ, Nakamura, R, and Suhrcke, M. Effects of a Sugar-Sweetened Beverage Tax on Prices and Affordability of Soft Drinks in Chile: A Time Series Analysis. Soc Sci Med (2020) 245:112708. doi:10.1016/j.socscimed.2019.112708
19.Ministry of Health. COVID-19 Protocols and Guidelines. [Internet]. Kenya: Ministry of Health (2020). Available from: https://www.health.go.ke/#1621662557097-37ed30fd-e577.
20. Hale, T, Angrist, N, Goldszmidt, R, Kira, B, Petherick, A, Phillips, T, et al. A Global Panel Database of Pandemic Policies (Oxford COVID-19 Government Response Tracker). Nat Hum Behav (2021) 5:529. doi:10.1038/s41562-021-01079-8
21.Our World In Data. Coronavirus Pandemic (COVID-19. [Internet] (2020). Available from: https://ourworldindata.org/coronavirus.
22. Al-Awadhi, AM, Alsaifi, K, Al-Awadhi, A, and Alhammadi, S. Death and Contagious Infectious Diseases: Impact of the COVID-19 Virus on Stock Market Returns. J Behav Exp Finance (2020) 27:100326. doi:10.1016/j.jbef.2020.100326
23. Baig, AS, Butt, HA, Haroon, O, and Rizvi, SAR. Deaths, Panic, Lockdowns and US Equity Markets: The Case of COVID-19 Pandemic. Finance Res Lett (2021) 38:101701. doi:10.1016/j.frl.2020.101701
24.Google Trends. Coronavirus. [Internet] (2021). Available from: https://trends.google.com/trends/explore?q=Coronavirus.
25. Lyócsa, Š, Baumöhl, E, Výrost, T, and Molnár, P. Fear of the Coronavirus and the Stock Markets. Finance Res Lett (2020) 36:101735. doi:10.1016/j.frl.2020.101735
26.Yahoo Finance. World Indices. [Internet] (2020). Available from: https://finance.yahoo.com/world-indices.
27. Sheridan, A, Andersen, AL, Hansen, ET, and Johannesen, N. Social Distancing Laws Cause Only Small Losses of Economic Activity during the COVID-19 Pandemic in Scandinavia. Proc Natl Acad Sci U.S.A (2020) 117(34):20468–73. doi:10.1073/pnas.2010068117
28. Onyeaka, H, Anumudu, CK, Al-Sharify, ZT, Egele-Godswill, E, and Mbaegbu, P. COVID-19 Pandemic: A Review of the Global Lockdown and its Far-Reaching Effects. Sci Prog (2021) 104(2):368504211019854. doi:10.1177/00368504211019854
29.Ministry of Trade and Industry. Performance of the Singapore Economy in 2020. [Internet]. Ministry of Trade and Industry (2021). Available from: https://www.mti.gov.sg/-/media/MTI/Resources/Economic -Survey-of-Singapore/2020/Economic-Survey-of-Singapore-2020/FA_AES2020.pdf.
30.Voxeu. The Role of the Global Supply Chains in the COVID-19 Pandemic and beyond. [Internet] (2020). Available from: https://voxeu.org/article/role-global-supply-chains-covid-19-pandemic-and-beyond.
31. Snoeijer, BT, Burger, M, Sun, S, Dobson, RJB, and Folarin, AA. Measuring the Effect of Non-pharmaceutical Interventions (NPIs) on Mobility during the COVID-19 Pandemic Using Global Mobility Data. Npj Digit Med (2021) 4(1):81. doi:10.1038/s41746-021-00451-2
32. Chowdhury, R, Heng, K, Heng, K, Shawon, MSR, Goh, G, Okonofua, D, et al. Dynamic Interventions to Control COVID-19 Pandemic: A Multivariate Prediction Modelling Study Comparing 16 Worldwide Countries. Eur J Epidemiol (2020) 35(5):389–99. doi:10.1007/s10654-020-00649-w
33. Pincombe, M, Reese, V, and Dolan, CB. The Effectiveness of National-Level Containment and Closure Policies across Income Levels during the COVID-19 Pandemic: An Analysis of 113 Countries. Health Policy Plan (2021) 36(7):1152–62. doi:10.1093/heapol/czab054
34.The World Bank Group. GDP Growth (Annual %). [Internet] (2021). Available from: https://data.worldbank.org/indicator/NY.GDP.MKTP.KD.ZG.
35. Brand, SPC, Ojal, J, Aziza, R, Were, V, Okiro, EA, Kombe, IK, et al. COVID-19 Transmission Dynamics Underlying Epidemic Waves in Kenya. Science (2021) 374(6570):989–94. doi:10.1126/science.abk0414
36. Kaendera, S, and Leigh, L. Five Things to Know about Thailand’s Economy and COVID-19 (2021). Available from: https://www.imf.org/en/News/Articles/2021/06/21/na062121-5-things-to-know-about-thailands-economy-and-covid-19.
38. Kit, TS. Digital Transformation, Sustainability Among post-pandemic Opportunities for Singapore: Gan Kim Yong. Channel News Asia (2021).
39. O'Neill, A. Share of Economic Sectors in the GDP in Kenya 2020 (2021). Available from: https://www.statista.com/statistics/451143/share-of-economic-sectors-in-the-gdp-in-kenya/.
40. O'Neill, A. Share of Economic Sectors in the GDP in Thailand 2020 (2021). Available from: https://www.statista.com/statistics/331893/share-of-economic-sectors-in-the-gdp-in-thailand/.
41. Haug, N, Geyrhofer, L, Londei, A, Dervic, E, Desvars-Larrive, A, Loreto, V, et al. Ranking the Effectiveness of Worldwide COVID-19 Government Interventions. Nat Hum Behav (2020) 4(12):1303–12. doi:10.1038/s41562-020-01009-0
42. Schewitz, IA, Zar, H, Masekela, R, Gordon, S, Ozoh, O, Kagima, J, et al. Unintended Consequences of the COVID-19 Pandemic in Africa. J Pan Afr Thorac Soc (2020) 1:3–5. doi:10.25259/JPATS_6_2020
43. Polumbo, B. Four Unintended Consequences of the Lockdowns (2020). Available from:https://catalyst.independent.org/2020/08/25/4-unintended-consequences-of-the-lockdowns/.
Keywords: COVID-19, non-pharmaceutical interventions, border closure, social distancing, economic impact
Citation: Briones J, Wang Y, Prawjaeng J, Wee HL, Kairu A, Orangi S, Barasa E and Teerawattananon Y (2022) A Data-Driven Analysis of the Economic Cost of Non-Pharmaceutical Interventions: A Cross-Country Comparison of Kenya, Singapore, and Thailand. Int J Public Health 67:1604854. doi: 10.3389/ijph.2022.1604854
Received: 19 February 2022; Accepted: 31 May 2022;
Published: 28 June 2022.
Edited by:
Michael J. Deml, Université de Genève, SwitzerlandCopyright © 2022 Briones, Wang, Prawjaeng, Wee, Kairu, Orangi, Barasa and Teerawattananon. This is an open-access article distributed under the terms of the Creative Commons Attribution License (CC BY). The use, distribution or reproduction in other forums is permitted, provided the original author(s) and the copyright owner(s) are credited and that the original publication in this journal is cited, in accordance with accepted academic practice. No use, distribution or reproduction is permitted which does not comply with these terms.
*Correspondence: Yi Wang, ephwyi@nus.edu.sg
This Original Article is part of the IJPH Special Issue “Responses to the COVID-19 Pandemic: International Comparisons.”